in situ x-ray microscopy at high temperature and · pdf filein situ x-ray microscopy at high...
TRANSCRIPT
In Situ X-Ray Microscopy at High Temperature and Pressure B. Ménez *,1, H. Bureau2, J. Cauzid3, V. Malavergne4, A. Somogyi5,3, A. Simionovici6,3, M. Munoz7, L. Avoscan2, C. Rommevaux-Jestin1 and B. Gouget2
1Equipe Géobiosphère Actuelle et Primitive, Institut de Physique du Globe de Paris, UMR 7154, case 89,
4 place Jussieu, 75252 Paris cedex 05, France. 2Laboratoire Pierre Süe, CEA/CNRS, UMR 9956, C. E. Saclay, 91191 Gif sur Yvette cedex, France. 3European Synchrotron Radiation Facility, ID22 Beamline, BP 220, 38043 Grenoble cedex, France 4Laboratoire des Géomatériaux, Université de Marne la Vallée, 77454 Marne la Vallée, France 5Synchrotron SOLEIL, BP 48, 91192 Gif sur Yvette cedex, France 6LGIT, Université Joseph Fourier, BP 53, 38041 Grenoble cedex 9, France 7LGCA, Université Joseph Fourier, Maison des Géosciences, 1381 rue de la piscine, 38400 St Martin
d’Hères, France Synchrotron hard X-ray microprobes have the capability to perform in situ measurements in high pressure and temperature devices, including the versatile Diamond Anvil Cell. This represents a challenging analytical task with important repercussions on our understanding of fundamental processes in many fields. To illustrate these points, after developing quantification aspects inherent to X-ray microfluorescence and inherited from fluid inclusions analysis, two selected applications in experimental petrology and microbiology are presented
Keywords Synchrotron X-ray microscopy, XRF, XANES, in situ measurements, high pressure and temperature cells, elemental partitioning, microbial metabolism.
1. Introduction
Owing to their high sensitivity, non destructive character, high spatial resolution, and in situ multi-element analytical capability, third generation synchrotron light sources have been recognized, for more than a decade, as a powerful and promising analytical tool. In particular hard X-ray micro-beams have proved to be highly adapted for in situ characterization of samples in high pressure and temperature devices. Among them, the externally heated Hydrothermal Diamond Anvil Cell (HDAC, [1]) together with the pressure membrane diamond anvil cell [2] take advantage of the transparency of the anvils to a large range of electromagnetic radiation and was increasingly applied in a wide variety of applications including mineral physics, geochemistry and petrology (see [3-5] for reviewq). It comprises, in particular, the implementation of X-ray diffraction (XRD), X-ray Absorption Spectroscopy (XAS) including Extended X-ray Absorption Fine Structure (EXAFS) or X-ray Absorption Near Edge Structure (XANES) for the study of complexes in aqueous systems (e. g. [6-9]) or fluid properties (e.g. [10, 11]). Of particular interest are the X-Ray Fluorescence (XRF) techniques developed for HDAC that allow quantitative analysis of the phases involved in high pressure and temperature experiments. This was successfully applied to experiments dedicated to mineral solubility studies (i. e., carbonates and phosphates, [12-15]). As stated by [3], also of valuable relevance is the application of X-ray microscopy to the study of elemental partitioning between hydrous melts and aqueous fluids at pressures and temperatures attainable in a HDAC (up to 1000°C). This was recently done by [16] for lead partitioning between coexisting aqueous fluids (pure water or NaCl-enriched water) and hydrous silicate melts of haplogranite composition in Bassett-modified HDAC. Moreover, the possibility of in situ analysis of the phases interacting during experiments provides not only a direct access to their compositional evolution
* Corresponding author: e-mail: [email protected], Phone: +33 1 44 27 77 23
©FORMATEX 2007Modern Research and Educational Topics in Microscopy. A. Méndez-Vilas and J. Díaz (Eds.)
976
_______________________________________________________________________________________________
through elemental analysis but also information on the structure and speciation of elements in the coexisting phases. As an example, in situ XAS study of water-saturated haplorhyolitic melt in Bassett-type HDAC provides information on nickel speciation together with melt density [17]. Accordingly, the current approaches offer pertinent complementary methods to classical investigations. No doubt that in situ HDAC measurements on X-ray microprobes have important repercussions on our understanding of fundamental processes in the Earth's crust and mantle. Nevertheless, the implications of X-ray experiments at high pressure and temperature go further than the field of experimental petrology. Owing to the versatility of the HDAC, benefits can be extended to other disciplines and more specifically to the exploration of extreme environments where life can develop. Challenges posed by these extreme habitats include their remote nature, harsh conditions and inaccessibility. Therefore, methodologies for reproducing such environments together with microprobes able to characterize and quantify in situ rates of microbial activity during real time measurements are strongly requested for gaining insight into extremophile metabolism. HDAC allows to simulate extreme conditions in terms of temperature, pressure, metal concentrations and anaerobiosis. Recently, one attempt was successfully driven to explore in situ the effects of high pressure on microbial life, by associating HDAC technology with Raman spectroscopy [18] but this technology was rarely associated with X-ray measurement for such purposes [19]. Combining HDAC experiments with third generation synchrotron light sources represents however a challenging analytical task, particularly for data acquisition and quantification. Nevertheless, constant progress in fluid inclusion analysis using Synchrotron Radiation X-Ray Fluorescence (SR-XRF), allow establishing reliable procedures for quantitative analysis. In this paper, after developing the quantification aspects inherent to µXRF analyses in high temperature and pressure cells, the relevance of X-ray microscopy for in situ measurements and the versatility of the HDAC are demonstrated through two selected examples of applications in experimental petrology and microbiology.
2. Quantification
Two main calculation methods are available for XRF-based quantification. The oldest one is the fundamental parameters method, based on the relationship linking incident and fluorescence X-ray intensities with mass fractions in the irradiated sample. Its theoretical basis was first established by [20]. The second method considers photon-matter interactions as a stochastic process. In this case, radiations are expressed as trajectories S
rof probability p(S). Monte-Carlo simulations were pioneered by [21] and
further developed by [22, 23]. In both methods, the inner geometry of the sample is of critical importance as it controls incident and fluorescent X-ray attenuation, which strongly affects quantification.
A HDAC filled with a sample (solid, liquid and/or gas) is characterized by three layers of plate-parallel faces. This geometry is similar to the theoretical model used for SR-XRF quantification of fluid inclusions with both the Monte-Carlo [24] and the fundamental parameters methods [25-34]. While the discrepancy between the theoretical geometry and the real sample is high in fluid inclusion studies, the HDAC shape matches almost perfectly the infinite plane layer structure: the top and bottom layers are the HDAC windows of known composition and thicknesses and the middle layer is the sample, whose quantification is the aim in XRF experiments. Its geometry can be precisely determined after the experiments by measuring the experimental chamber. Thus, developments initially aimed at SR-XRF quantification of fluid inclusions can be adapted to HDAC with little changes in the computing code.
2.1. Theoretical statements
For SR-XRF quantification of a sample in a HDAC using the fundamental parameters method, the sample is supposed to be a homogeneous and diluted fluid/melt irradiated by a monochromatic beam in between low Z windows. These requirements permit the following simplification: the infinite plane layer model is fulfilled, secondary fluorescence is neglected, there is only one incident energy and no fluorescence is generated by the windows in the targeted elements. The list of interaction from the
Modern Research and Educational Topics in Microscopy. A. Méndez-Vilas and J. Díaz (Eds.) ©FORMATEX 2007
977
_______________________________________________________________________________________________
incoming beam to the detector is then the following: the synchrotron beam of intensity )( 0EI is
attenuated by a factor of 1WA in the front window. It is then attenuated in the sample by a factor of 1
FA down to the depth x where its volume concentration is ( ) fZC ρ. and the beam path length through the
layer of thickness dx is αsin
dx . The fluorescence cross-section of X-ray line i of element Z is 0EZi
σ . The
fluorescence X-ray are then attenuated by a factor of 2FA in the sample and 2
WA in the window on their
path to the detector, which has a solid angle of detection π4Ω and an efficiency )( iEε . The efficiency takes
into account attenuation between the sample window and the detector if the HDAC and the crystal of the detector are not placed in a vacuum chamber. The measured fluorescence intensity, ( )iZdN , of X ray line i of element Z in the slice of thickness dx at depth x in the sample chamber located at depth d in the under the sample window is obtained by multiplying all these factors:
( ) dxAAAACEIdN fWFFW
EZZEZ iii
.sin
.....4
).( 2211)(0)(
0
αρ
σεπ
Ω= (1)
Integrating equation (1) over the sample chamber thickness (h) gives the relationship between the ( )iZN intensity of the measured characteristic X-ray line (i) of element Z and its ( )ZC concentration:
( ) ∫=
Ω=
1
0
0
2211)(0)( ..
sin....
4).(
h
xWFFW
fEZZEZ dxAAAACEIN
iii αρ
σεπ
(2)
In the next section, the following parameters will be used to express ( )iZN :
0E : Energy of the incoming beam
iE : Energy of the detected characteristic X-ray line (i) of element Z
)( 0EI : Intensity of the incoming beam (photons/s)
π4Ω : Solid angle of detection (sr)
)( iEε : Detection efficiency of X-ray line (i) of element Z. 0E
Ziσ : Fluorescence cross-section of X-ray line (i) of element Z at the energy E0
0EFµ , iE
Fµ : Absorption coefficient of the sample F at energy E0 and Ei, respectively 0E
Wµ , iEWµ : Absorption coefficient of the sample windows W at energy E0 and Ei, respectively
α , β : Incident and detection angles to sample window, respectively
Fρ ,Wρ : Sample and window mass density, respectively
1d , 2d : Thickness of the first and second sample windows
1h , 2h : Thickness of fluid layer cross by the incident and fluorescence x-rays, respectively
Factors 1
WA , 1FA , 2
FA and 2WA may vary with x depending on the configuration of the experimental setup
and the HDAC type. Four different geometries can be used, depending on the relative positions of the sample, the incident beam and the fluorescence detector (Fig. 1): irradiation and fluorescence detection can be performed from the same side of the sample (Fig. 1a), from the opposite side (backward detection, Fig. 1b) or from one side at 90 ° from the irradiated side (side detection, Fig. 1c and 1d). The difficulty in quantifying the fluorescence signal is then to establish a series of equations for these factors with x as the only variable, which is done in Tab. 1. Equation (2) can also be written as )()()( ii ZZZ FNC = .
©FORMATEX 2007Modern Research and Educational Topics in Microscopy. A. Méndez-Vilas and J. Díaz (Eds.)
978
_______________________________________________________________________________________________

Using Tab.1, litteral expressions for )(ZF can be derived from its generic form
( )
Ω= ∫
=
1
0
0
2211)(0 .....
4).(/sin
h
xWFFWf
EZEZ dxAAAAEIF
iiiρσε
πα (Tab.2).
Fig. 1 Geometries used for XRF quantification in HDAC: a) irradiation and detection are performed from the same side of the HDAC. b) irradiation is done on the front side of the cell and detection from the backside. c) for HDAC with recessed diamond (e. g. [35]), irradiation and detection are performed from the front side and at 90° from incident beam through the second diamond, respectively. d) X-ray transparent gasket (e. g. [36]) allows detection through the gasket with the same geometry as c) See text for explanation of the use of geometrical parameters (d1, d2, h1, h2, x, y, α and β) in the quantification procedure.
Table 1 Attenuation factors 1WA , 1
FA , 2FA and 2
WA depending on HDAC and setup geometries.
Table 2 Expression of factor ( )iZF depending on the HDAC type and experimental geometries.
( )iZF Forward detection
−
Ω
+
+−
+ F
iEF
EF
ii
W
iEW
EW
i hEZE
dEF
EF eEIe
ρβ
µα
µρ
βµ
αµ
σεπ
αβ
µα
µ ..sinsin
)(0
..sinsin
0
0
00
1...4
).(/.sin.sinsin
Backward detection
−
Ω
−
−−
+ F
iEF
EF
ii
F
iEF
W
iEW
EW
i hEZE
hddEF
EF eEIee
ρβ
µα
µρ
βµ
ρβ
µα
µ
σεπ
αβ
µα
µ ..sinsin
)(0
..sin
.sinsin
0
0.
21
00
1...4
).(/.sin.sinsin
1WA 1
FA 2FA 2
WA Specific features
Forward detection W
EW d
eρ
αµ
.sin
0−
F
EF x
eρ
αµ
.sin
0−
F
EiF x
eρ
αµ .
sin−
W
iEW d
eρ
βµ
.sin
−
d1=d2=d h1=h2=h
Backward detection W
EW d
eρ
αµ
.1sin
0−
F
EF x
eρ
αµ
.sin
0−
( ) F
EiF xh
eρ
αµ .
sin−−
W
iEW d
eρ
βµ
.2sin−
h1=h2=h y=h-x
Recessed diamond
WEW de ρµ .1.0−
( ) F
EF xhe ρµ ..0 +−
F
EiF he ρµ .. 2− W
iEW
xhde
ρβ
µ .tan2. 1
−− −
α=β=90°
βtan21 xh
dy−
= −
X-ray transparent gasket
WEW de ρµ .1.0−
FEF xe ρµ ..0− F
EiF he ρµ .. 2− W
iEW de ρµ .2.−
α=β=90°
Modern Research and Educational Topics in Microscopy. A. Méndez-Vilas and J. Díaz (Eds.) ©FORMATEX 2007
979
_______________________________________________________________________________________________

Recessed diamond ( )
−
Ω
−
−−
−
+
10
0
1
.2
.0
.21
00
..tan
.
)(0
..tan.......
1....4
).(/
..tan
.
h
FEZE
hhhdd
W
EW
FEF
W
iEW
FEF
ii
W
iEW
FiE
FFEFW
iEW
EW
i
eEI
eeee
ρβ
µρµ
ρβ
µ
ρµρµρµµ
ρσεπ
ρβ
µρµ
X-ray transparent gasket
( )[ ] ( )
−
Ω −+ FEF
ii
FiE
FWiE
WEW hE
ZEhddE
F eEIee ρµρµρµµ σεπ
µ ..)(0
..... 10
02.
210
0 1...4
).(/.
Calibration of the measurements can finally be made by using known elemental concentrations of the starting solution
0)( tZC measured at t0. Absolute elemental concentrations tZC )( at time t can then be obtained by the following simplified relationship:
0
00
)()()(
)()()( tZ
tZtZ
tZtZtZ C
FNFN
Cii
ii=
The backward detection set-up for HDAC experiments is the most common one, whereas the forward detection is barely used mainly due to fluorescence end-station characteristics. Both geometries suffer from high scattering contribution and therefore are not optimised for fluorescence x-ray detection. A full description of error calculations associated with the quantification procedure using the forward detection is available in [25]. Using these setups, the position of the measurement in the cell does not affect the geometrical parameters as d1, d2 and h do not depend on the lateral position of the beam. On the contrary, with both the recessed diamond and X-ray transparent gaskets, h2 depends on the beam position in the sample chamber. Changing the position of the incident beam in the HDAC will thus influence the quantification. Using a recessed diamond, d2 is defined by the recess, and will therefore be constant from one measurement to the next one whereas with an X-ray transparent gasket; d2 will depend on each gasket and will have to be measured in each measurement. With a recessed diamond, the quantified part of the fluorescence signal is considered as emerging exclusively from the recess, an absorbing gasket is therefore compulsory to absorb any signal generated inside the gasket. This also means that the sample has to be in the recessed part, which is easy for fluids but more complicated for tiny solids.
From a computational point of view, the X-ray transparent gasket is the easiest geometry as the corresponding equations are the simplest (Tab. 1). However, it is probably the most difficult in terms of gasket choice: few materials, transparent to X-rays, can hold high pressures and temperatures, while being resistant to the sample, especially when fluids are involved. Beryllium and boron-epoxy gaskets are used in diffraction experiments (e. g. [37]) but cannot withstand high temperatures and may react with the fluids. Gaskets specifically designed for XRF measurements with fluid fillings are still under development.
2.2. Implications for the choice of the sample windows
In all these geometries, the sample windows, as well as the gasket for the x-ray transparent HDAC, have to be chosen to limit X-ray absorption. They will strongly act upon the range of energies that can be investigated. Indeed, attenuation coefficients are expressed as follow: ρµ ..leA −= with µ = absorption coefficient, l = length of the x-ray path and ρ = mass density of the medium. The absorption of X-rays at a given wavelength therefore directly depends on the thickness of the film, its composition and density. As an illustration, Fig. 2 presents attenuation of several materials used either for the windows (diamond, quartz, moissanite, sapphire), gaskets (beryllium), or sample medium (water). Kapton® is given for comparison. From this figure, it can be deduced that quartz, moissanite or sapphire will greatly absorb any fluorescence generated by transition elements. In turn, diamond is resistant to high temperatures, pressure and fluids, it has the lowest absorption and it presents no absorption jump in the available energy window (roughly above 1 keV using a Si(Li) solid state detector). The thickness of the window is
©FORMATEX 2007Modern Research and Educational Topics in Microscopy. A. Méndez-Vilas and J. Díaz (Eds.)
980
_______________________________________________________________________________________________
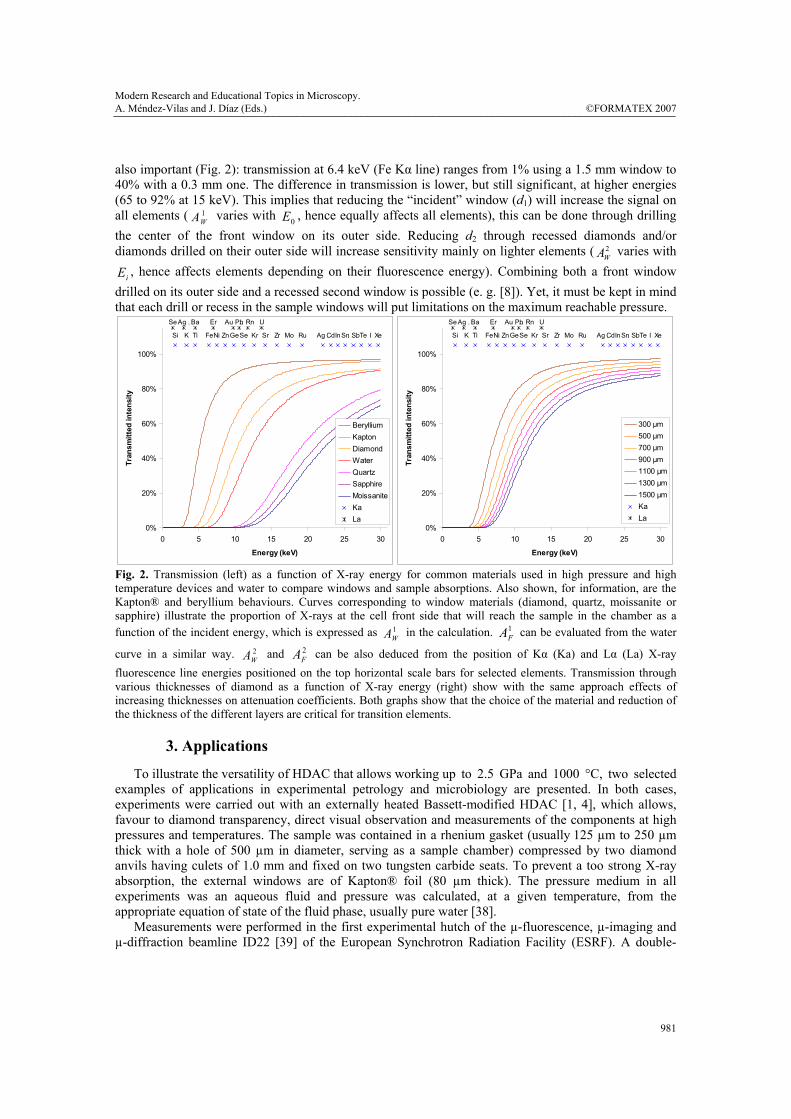
also important (Fig. 2): transmission at 6.4 keV (Fe Kα line) ranges from 1% using a 1.5 mm window to 40% with a 0.3 mm one. The difference in transmission is lower, but still significant, at higher energies (65 to 92% at 15 keV). This implies that reducing the “incident” window (d1) will increase the signal on all elements ( 1
WA varies with 0E , hence equally affects all elements), this can be done through drilling the center of the front window on its outer side. Reducing d2 through recessed diamonds and/or diamonds drilled on their outer side will increase sensitivity mainly on lighter elements ( 2
WA varies with
iE , hence affects elements depending on their fluorescence energy). Combining both a front window drilled on its outer side and a recessed second window is possible (e. g. [8]). Yet, it must be kept in mind that each drill or recess in the sample windows will put limitations on the maximum reachable pressure.
XeSi Ti FeNi ZnGeSe Kr Sr Zr Mo Ru Cd Sn. Sb. Te IInAg .K
Ag . U. RnBa Er PbAu .Se
0%
20%
40%
60%
80%
100%
0 5 10 15 20 25 30
Energy (keV)
Tran
smitt
ed in
tens
ity
300 µm500 µm700 µm900 µm1100 µm1300 µm1500 µmKaLa
InAg . I. Te. SbSnCdRuMoZrSrKrSeGeZnNiFeTiSi XeK
Se Au .PbErBa . Rn UAg .
0%
20%
40%
60%
80%
100%
0 5 10 15 20 25 30
Energy (keV)
Tran
smitt
ed in
tens
ity
BerylliumKaptonDiamondWaterQuartzSapphireMoissaniteKaLa
Fig. 2. Transmission (left) as a function of X-ray energy for common materials used in high pressure and high temperature devices and water to compare windows and sample absorptions. Also shown, for information, are the Kapton® and beryllium behaviours. Curves corresponding to window materials (diamond, quartz, moissanite or sapphire) illustrate the proportion of X-rays at the cell front side that will reach the sample in the chamber as a function of the incident energy, which is expressed as 1
WA in the calculation. 1FA can be evaluated from the water
curve in a similar way. 2WA and 2
FA can be also deduced from the position of Kα (Ka) and Lα (La) X-ray fluorescence line energies positioned on the top horizontal scale bars for selected elements. Transmission through various thicknesses of diamond as a function of X-ray energy (right) show with the same approach effects of increasing thicknesses on attenuation coefficients. Both graphs show that the choice of the material and reduction of the thickness of the different layers are critical for transition elements.
3. Applications
To illustrate the versatility of HDAC that allows working up to 2.5 GPa and 1000 °C, two selected examples of applications in experimental petrology and microbiology are presented. In both cases, experiments were carried out with an externally heated Bassett-modified HDAC [1, 4], which allows, favour to diamond transparency, direct visual observation and measurements of the components at high pressures and temperatures. The sample was contained in a rhenium gasket (usually 125 µm to 250 µm thick with a hole of 500 µm in diameter, serving as a sample chamber) compressed by two diamond anvils having culets of 1.0 mm and fixed on two tungsten carbide seats. To prevent a too strong X-ray absorption, the external windows are of Kapton® foil (80 µm thick). The pressure medium in all experiments was an aqueous fluid and pressure was calculated, at a given temperature, from the appropriate equation of state of the fluid phase, usually pure water [38].
Measurements were performed in the first experimental hutch of the µ-fluorescence, µ-imaging and µ-diffraction beamline ID22 [39] of the European Synchrotron Radiation Facility (ESRF). A double-
Modern Research and Educational Topics in Microscopy. A. Méndez-Vilas and J. Díaz (Eds.) ©FORMATEX 2007
981
_______________________________________________________________________________________________

crystal fixed-exit monochromator was used for the monochromatization of the X-ray beam, emerging from a high β-section undulator source. Either Compound Refractive Lenses (CRL), consisting of a set of 56 parabolic Al Refractive Lenses [40, 41] and combined with a pinhole (5 µm in diameter), or a crossed mirror system in the so-called Kirkpatrick-Baez (KB) geometry were used as focusing devices. The HDAC, positioned in the image plane with a high-precision XYZθ remote-controlled stage, was aligned along the X-ray path using a PIN diode detector operating in the current integration mode and located behind the cell in transmission. The incident focused beam irradiating the cell, monitored by an ionization chamber, was normal to the diamond surface. X-ray fluorescence and absorption measurements were carried out with an energy dispersive solid state Si(Li) detector (Eurisys Mesures, France) of 150 eV FWHM/Mn-Kα resolution, set at 12° to the incident beam in the horizontal polarization plane. To reduce the contribution to the signal from Compton-scattered X-rays and hence improve the fluorescence/ scattering ratio, the detector, mounted on motorized translation stages was shielded with a collimator (6 mm in diameter).
Several spectroscopic techniques can be implemented using small and brilliant synchrotron X-ray beams. Here, micro-XRF and micro-XANES were applied. XRF from a material is the result of photon excitation of sufficient energy which can eject by ionization, an electron from its inner atomic orbital. After ejection from the atom, an electron from a higher energy level orbital is transferred to the lower energy level orbital. During this transition X-rays may be emitted whose energies are characteristic of a given atom and their intensity proportional to its concentration in the specimen. XANES techniques are based on the measurement of the absorption coefficient variation by tuning the energy of the probing photons through an absorption edge (i. e. binding energy for electrons from the inner shells of an atom). The spectral features observed near the absorption edge reflect the molecular environment of a given absorbing atom (i. e., oxidation state in particular) and provide the basic mechanism for imaging with structural and chemical sensitivity.
3.1. In situ determination of elemental partitioning between hydrous silicate melt and aqueous fluids
Context: SR-XRF measurements were performed in a Basset-modified HDAC to characterize transfers of elements through high pressure “fluids” (aqueous and/or silicate hydrous melts) in the subduction factory and their influence on the petrogenesis of magma originated from subduction-related volcanism. Accordingly, these magmas exhibit geochemical fingerprints (enrichments and depletions of specific elements, specific isotopic signatures) that are not observed in other geological contexts. The contaminant agent responsible for these particular signatures may be either a silicate melt, a hydrous fluid, or a supercritical fluid [42], possibly chlorine-enriched [43]. However, such investigations should be performed in situ at pressure and temperature because of the unquenchable state of high pressure fluids. Therefore, experimental studies of fluid/melt partition coefficients of some key elements were undertaken. Because of its enrichment in subduction-related lavas, Pb was the first investigated element. The equilibrium between aqueous fluids and silicate melts before and after their complete miscibility, and the composition of different components in these phases were characterized in situ at a micrometer scale for every stage of the high pressure and temperature experiments. Material and Methods: The experimental setup comprised CRLs for focusing of monochromatized X-rays at 15 keV, with a flux of 1011 photons per second and a spatial resolution of 5 x 2 µm2 (horizontal by vertical, full width at half maximum, FWHM). A high-resolution X-ray CCD camera (Princeton Scientific Instruments, USA), set behind the cell in transmission geometry, was used to observe the sample in full field beam mode, based on phase/absorption contrast. To monitor the compositions of coexisting fluids and melts during the heating stages and also in the vicinity of the miscibility, trace element distributions and concentrations were determined in situ during experiment. Single analyses were recorded with an acquisition time of 2 to 15 min real time. 2D scans of the cell were performed using a 10 s per step integration time. Starting materials were a synthetic haplogranitic glass (SiO2 72.2 wt.%, Al2O3 11.4 wt.%, Na2O 4.17 wt.%, K2O 4.0 wt.%, ± Pb 1365 ± 100 ppm), together with one
©FORMATEX 2007Modern Research and Educational Topics in Microscopy. A. Méndez-Vilas and J. Díaz (Eds.)
982
_______________________________________________________________________________________________
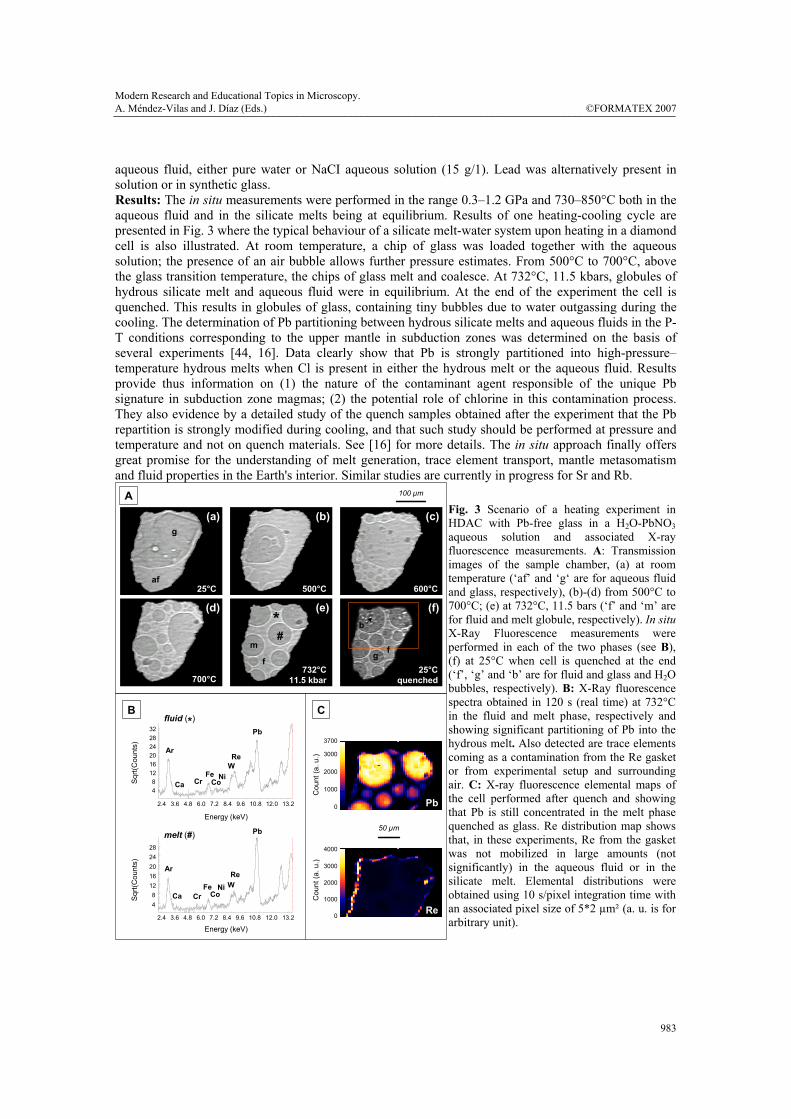
aqueous fluid, either pure water or NaCI aqueous solution (15 g/1). Lead was alternatively present in solution or in synthetic glass. Results: The in situ measurements were performed in the range 0.3–1.2 GPa and 730–850°C both in the aqueous fluid and in the silicate melts being at equilibrium. Results of one heating-cooling cycle are presented in Fig. 3 where the typical behaviour of a silicate melt-water system upon heating in a diamond cell is also illustrated. At room temperature, a chip of glass was loaded together with the aqueous solution; the presence of an air bubble allows further pressure estimates. From 500°C to 700°C, above the glass transition temperature, the chips of glass melt and coalesce. At 732°C, 11.5 kbars, globules of hydrous silicate melt and aqueous fluid were in equilibrium. At the end of the experiment the cell is quenched. This results in globules of glass, containing tiny bubbles due to water outgassing during the cooling. The determination of Pb partitioning between hydrous silicate melts and aqueous fluids in the P-T conditions corresponding to the upper mantle in subduction zones was determined on the basis of several experiments [44, 16]. Data clearly show that Pb is strongly partitioned into high-pressure–temperature hydrous melts when Cl is present in either the hydrous melt or the aqueous fluid. Results provide thus information on (1) the nature of the contaminant agent responsible of the unique Pb signature in subduction zone magmas; (2) the potential role of chlorine in this contamination process. They also evidence by a detailed study of the quench samples obtained after the experiment that the Pb repartition is strongly modified during cooling, and that such study should be performed at pressure and temperature and not on quench materials. See [16] for more details. The in situ approach finally offers great promise for the understanding of melt generation, trace element transport, mantle metasomatism and fluid properties in the Earth's interior. Similar studies are currently in progress for Sr and Rb.
50 µm
100 µm
Pb
Re
3700
3000
2000
1000
0
4000
3000
2000
1000
0
Cou
nt(a
. u.)
25°C 500°C 600°C
700°C25°C
quenched
g
af
f
m
A
B C
732°C11.5 kbar
g f
b
2.4 3.6 4.8 6.0 7.2 8.4 9.6 10.8 12.0 13.2
48
121620242832
Energy (keV)
Sqr
t(Cou
nts)
Pb
ReW
Ar
Ca CrFe
CoNi
2.4 3.6 4.8 6.0 7.2 8.4 9.6 10.8 12.0 13.2
48
1216202428
Sqrt(
Cou
nts)
Pb
ReW
Ar
Ca CrFe
CoNi
Energy (keV)
fluid (*)
melt (#)
#*
Cou
nt(a
. u.)
(a) (b)
(f)(e)
(c)
(d)
Fig. 3 Scenario of a heating experiment in HDAC with Pb-free glass in a H2O-PbNO3aqueous solution and associated X-ray fluorescence measurements. A: Transmission images of the sample chamber, (a) at room temperature (‘af’ and ‘g‘ are for aqueous fluid and glass, respectively), (b)-(d) from 500°C to 700°C; (e) at 732°C, 11.5 bars (‘f’ and ‘m’ are for fluid and melt globule, respectively). In situ X-Ray Fluorescence measurements were performed in each of the two phases (see B), (f) at 25°C when cell is quenched at the end (‘f’, ‘g’ and ‘b’ are for fluid and glass and H2O bubbles, respectively). B: X-Ray fluorescence spectra obtained in 120 s (real time) at 732°C in the fluid and melt phase, respectively and showing significant partitioning of Pb into the hydrous melt. Also detected are trace elements coming as a contamination from the Re gasket or from experimental setup and surrounding air. C: X-ray fluorescence elemental maps of the cell performed after quench and showingthat Pb is still concentrated in the melt phase quenched as glass. Re distribution map shows that, in these experiments, Re from the gasket was not mobilized in large amounts (not significantly) in the aqueous fluid or in the silicate melt. Elemental distributions were obtained using 10 s/pixel integration time with an associated pixel size of 5*2 µm² (a. u. is for arbitrary unit).
Modern Research and Educational Topics in Microscopy. A. Méndez-Vilas and J. Díaz (Eds.) ©FORMATEX 2007
983
_______________________________________________________________________________________________

3.2. In vivo monitoring of microbial metabolism at high temperature Context: Prokaryotes, particularly those thriving under extreme conditions, can gain energy from a wide panoply of redox reactions including metallic compounds. However, understanding metabolic process in vivo is hampered by the lack of direct means to monitor the redox state changes at high resolution levels. The present experiments aim at evaluating the ability of monitoring in situ hyperthermophilic mediated reactions involving metals by using non destructive hard X-ray microprobe combined with HDAC. We focused on metal-respiring microorganisms that achieve anaerobic growth by using oxyanions selenate [Se(VI)] as terminal electron acceptor for the oxidation of organic substrates or H2. Such reductions are of a dissimilative nature and support the growth of prokaryotes from physiologically and phylogenetically diverse groups [45-47]. Despite the relatively limited bacterial and archaeal species currently isolated and characterized, organisms carrying out dissimilatory selenate reduction are widespread and metabolically active in nature, and evidence is now mounting that these processes may have important environmental implications [48]. We selected the strictly anaerobic, hyperthermophilic (90°C for optimum growth temperature) archaea, Pyrobaculum arsenaticum, isolated from a hot spring at Pisciarelli Solfatara, Naples, Italy [49] This archaea, unable to grow below 60°C, metabolizes both arsenate and selenate forming respectively arsenite [As(III)] and relatively unreactive solid elemental selenium [Se(0)] as end products. Here, we followed in situ selenate-based metabolic activity of this hyperthermophilic strain at high temperature (i. e. its optimal growth temperature) in HDAC using XAS. Material and Methods: The monochromatized X-ray beam was focused with KB mirrors to a spot size of 3 µm by 2 µm (horizontal by vertical, full width at half maximum, FWHM) on the sample, with an associated flux of 1.5 x 10¹⁰ photons per second. The XANES measurements were carried out in the fluorescence detection mode. The incident energy was scanned over the selenium K-edge (~12.7 keV) by the fixed-exit double-crystal monochromator, using the silicon (111) reflection order, which provide a relative energy (E) resolution of ∆E/E~10-4. The acquisition time for complete XANES and XRF spectra were typically 15 and 10 minutes, respectively. XANES spectra were corrected by subtraction of a linear baseline and normalisation with the average counts measured after the edge. P. arsenaticum, pre-incubated overnight at 90°C under organotrophic culture conditions, were loaded under N2 atmosphere together with its growth medium doped with selenate (50 mM) into the 400-µm hole of the HDAC rhenium gasket. Data were collected at increasing temperatures between 25 and 95°C, implying an associated containment pressure of few hundreds bars. Abiotic control experiments (i. e., Se-doped growth medium without microbes) were also performed from room temperature to 170°C. These experiments provide, together with an abiotic reference state, an assessment of the photo-induced effects upon irradiation by X-rays, which may constitute a significant problem for advanced synchrotron radiation sources. XANES spectra were collected continuously at room temperature and growth temperature (up to 95°C) during several hours, allowing for the time-resolved monitoring of the chemical evolution of the medium with or without microbial activity. Total accumulation time ranged from 3 to 12 hours. Results: Results of biotic and abiotic experiments are shown in Fig. 4. When microbes are present in the cell, as shown in Fig. 4A, XANES spectra revealed a rapid evolution of the selenium speciation in the culture medium straight away upon heating whereas only minor changes were observed both at room temperature and under abiotic conditions [Fig. 4B] measured in equivalent experimental circumstances (temperature and duration). On the basis of theoretical linear combinations obtained from reference spectra of selenate and selenite species in aqueous solution [Fig. 4D], these changes can be interpreted as a progressive reduction of Se(VI) into Se(IV). After 10h of incubation, up to 80% of the soluble fraction of selenium that remains in the culture medium is Se(IV). This metabolic product differs however from those obtained by [49], mainly constituted by elemental selenium but could correspond to an intermediate metabolic product as documented for S. barnesii species [50], responsible for the selenate reduction through selenite to elemental selenium. X-ray fluorescence measurements performed alternatively during experiments [Fig. 4C], exhibited a decrease of 18% of the initial Se content (i. e., 50 mM) in the cell with
©FORMATEX 2007Modern Research and Educational Topics in Microscopy. A. Méndez-Vilas and J. Díaz (Eds.)
984
_______________________________________________________________________________________________
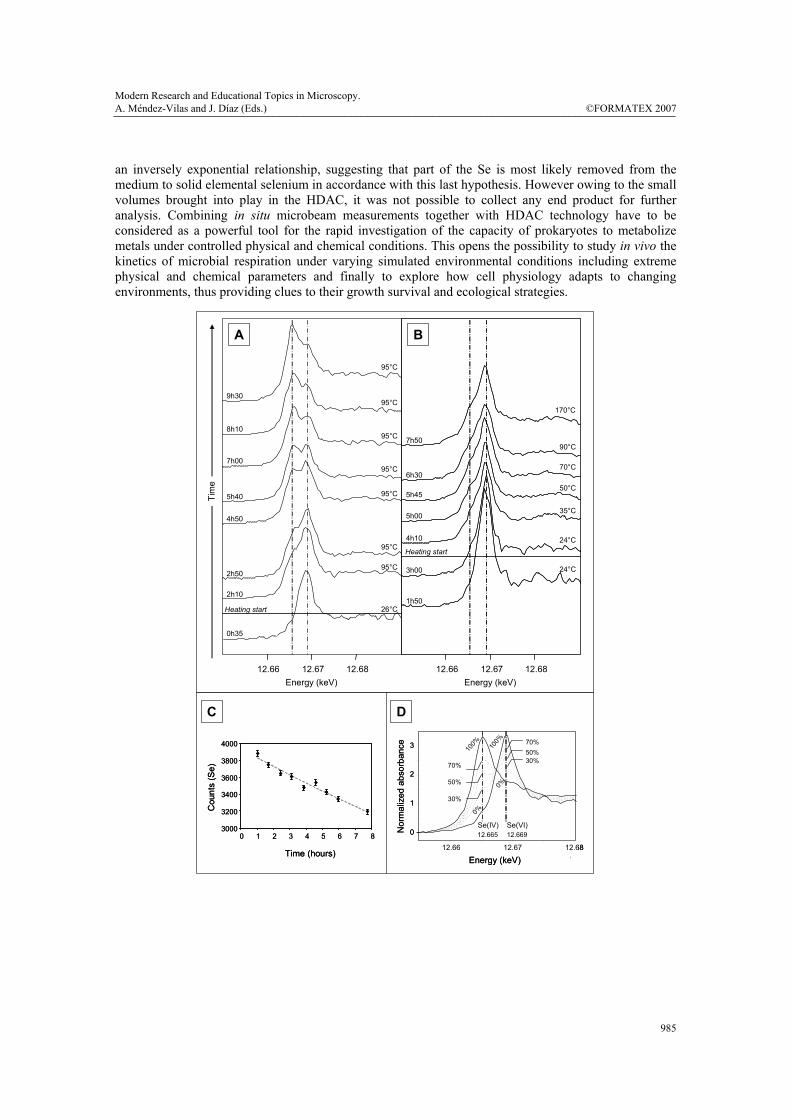
an inversely exponential relationship, suggesting that part of the Se is most likely removed from the medium to solid elemental selenium in accordance with this last hypothesis. However owing to the small volumes brought into play in the HDAC, it was not possible to collect any end product for further analysis. Combining in situ microbeam measurements together with HDAC technology have to be considered as a powerful tool for the rapid investigation of the capacity of prokaryotes to metabolize metals under controlled physical and chemical conditions. This opens the possibility to study in vivo the kinetics of microbial respiration under varying simulated environmental conditions including extreme physical and chemical parameters and finally to explore how cell physiology adapts to changing environments, thus providing clues to their growth survival and ecological strategies.
12.66 12.67 12.68
Energy (keV)
Nor
mal
ized
abso
rban
ce
1
0
2
3
Se(VI)Se(IV)12.665 12.669
0%
30%
50%
70%
100%
0%
30%50%70%
100%
12.66 12.67 12.68
Energy (keV)
Nor
mal
ized
abso
rban
ce
1
0
2
3
Se(VI)Se(IV)12.665 12.669
0%
30%
50%
70%
100%
0%
30%50%70%
100%
2h10
2h50
4h50
5h40
7h00
8h10
9h30
Tim
e
0h35
12.66 12.67 12.68Energy (keV)
12.66 12.67 12.68Energy (keV)
4h10
5h00
5h45
6h30
7h50
3h00
1h50
95°C
170°C
90°C
70°C
50°C
35°C
95°C
95°C
95°C
95°C
95°C
95°C
26°C
24°C
24°C
Heating start
Heating start
3000
3200
3400
3600
3800
4000
0 1 2 3 4 5 6 7 8
Time (hours)
Cou
nts
(Se)
3000
3200
3400
3600
3800
4000
0 1 2 3 4 5 6 7 8
Time (hours)
Cou
nts
(Se)
A
C D
B
Modern Research and Educational Topics in Microscopy. A. Méndez-Vilas and J. Díaz (Eds.) ©FORMATEX 2007
985
_______________________________________________________________________________________________

Fig. 4 Time resolved evolution of Se Kα-edge micro-XANES spectra for: (A) biotic experiment (i. e, P. arsenaticum in growth medium doped with 50 mM Se(VI)) and (B) abiotic experiment (i. e; growth medium doped with 50 mM Se(VI)). Both were performed at room and growth temperature (95°C) in HDAC. The progressive shift of the main edge for the biotic experiment is interpreted as a reduction with time of Se(VI) into Se(IV) up to 80% after 10h of incubation. Also shown are selenium respiration rates as a function of time at 90°C, estimated from Synchrotron X-Ray Fluorescence (SXRF) measurements at the Se Kα emission line (C). The decrease of selenium content exhibits an inverse relationship with time. Dashed line represents the result of an exponential fit. (D) Linear combinations obtained from reference spectra of selenate [Se(VI)] and selenite [Se(IV)] species in aqueous solution.
5. Discussion
We present here new results combining high pressures and temperatures attainable in a HDAC with in situ X-ray measurements. Thanks to the diamond transparency, the HDAC allows, together with the direct visual observation of the samples, the time-resolved X-ray microbeam characterization of concentration and speciation at the micrometer scale. Owing to its versatility, HDAC allows simulating conditions existing in inaccessible environments (i. e. deep Earth crust, upper mantle and extreme environments for life) and thus gaining insight into their functioning. In the field of experimental petrology, it provides data on Pb partitioning between aqueous fluids (pure water or NaCl-enriched water) and hydrous silicate melts of haplogranite composition [16]. These correspond to key elements for the understanding of melt generation, trace element transport, mantle metasomatism and fluid properties in the Earth's interior. In the field of microbiology, this first evidence of cell viability under X-rays, demonstrated in situ by the progressive dissimilatory reduction of metals at 95°C, offers great promise for characterizing the occurrence and kinetics of metabolic reactions under simulated environmental conditions.
Note that the in situ approach is, for these purposes, the only way to obtain such data. As an illustration, and as stated in [16], comparisons of in situ results with “post-mortem” results clearly proved that significant changes can take place during rapid quenching especially when samples are small (few hundred of microns in diameter). For Pb, the later exsolution induced by the quench in the silicate melt shows high mobility of Pb which immediately partitions into the water vapor phase during the quench. The measurement of pressure and/or temperature in HDAC sample chambers is crucial but not always accurate within the range: room pressure – 2 GPa and at high temperature (>500°C). The development of modified diamonds by ion implantation (iAnvils) adapted to a new generation of DAC (intelligent diamond anvil cells: iDAC, [51]) can contribute to solve this problem, as the diamond itself serves as the pressure and temperature sensor [52, 53]. Moreover [54] recently showed that the sensor response was found to be independent of the X-ray irradiation in the investigated energy range and thus validates the use of these sensors for precise and reliable measurements on a wide range of applications with high-energy synchrotron radiation. No influence of the sensor on the X-ray transmission properties of the anvil has been found thus allowing envisaging reliable future applications.
Quantitative SR-XRF analysis in situ in such device remains tricky and technological developments are still requested to improve detection and measurements uncertainties. It represents however a rigorous promising issue to characterize “in real time” processes occurring in the planet interiors or life under extreme conditions.
Acknowledgements We gratefully thank M. Bonnin, S. Lequien, M. Burchard, S. Kubsky, R. Huber, ID22, ID17’s staffs, I. Daniel and P. Oger (ENS, Lyon) for their assistance before or during experiment. This study was supported partly by grants from the GDR TRANSMET to BM (Contribution XXX) and the INSU French National program DyETI 2003-2005 and CEA funds to HB. This is IPGP contribution n° XXX.
©FORMATEX 2007Modern Research and Educational Topics in Microscopy. A. Méndez-Vilas and J. Díaz (Eds.)
986
_______________________________________________________________________________________________

References [1] W. A. Bassett, A. H. Shen, M. Buckum and I. M. Chou, Rev. Sc. Instr. 64, 2340 (1993). [2] J. C. Chervin, B. Canny and P. Pruzan, Rev. Sc. Instr. 66, 2595 (1995). [3] W. A. Bassett, Eur. J. Mineral. 15, 773 (2003). [4] W. A. Bassett, T. C. Wu, I. M. Chou, H. T. J. Haselton, J. Frantz, B. O. Mysen, W. L. Huang, S. K. Sharma
and D. Schiferl, in: Mineral Spectroscopy: A Tribute to Roger G. Burns, edited by M. D. Dyar, C. McCammon and M. W. Schaefer, Vol. 5 (Geochem. Soc. Spec. Publ., 1996), p. 261–272.
[5] J. Chen, Y. Wang, T. S. Duffy, G. Shen and L. P. Dobrzhinetskaya (eds.) Advances in high-pressure techniques for geophysical applications (Elsevier, The Netherlands, 2005), pp. 532.
[6] A. J. Anderson, S. Jayanetti, R. A. Mayanovic, W. A. Bassett and I. M. Chou, Am. Mineral. 87, 262 (2002). [7] R. A. Mayanovic, A. J. Anderson, W. A. Bassett and I. M. Chou, Chem. Geol. 239, 266 (2007). [8] R. A. Mayanovic, S. Jayanetti, A. J. Anderson, W. A. Bassett and I. M. Chou, J. Phys. Chem. 106, 6591
(2002). [9] R. A. Mayanovic, S. Jayanetti, A. J. Anderson, W. A. Bassett and I. M. Chou, J. Chem. Phys. 118, 719 (2003). [10] I. M. Chou, A. Sharma, R. C. Burruss, J. Shu, H.-k. Mao, R. J. Hemley, A. F. Goncharov, L. A. Stern and S.
H. Kirby, PNAS 97, 13484 (2000). [11] R. A. Mayanovic, A. J. Anderson, W. A. Bassett and I. M. Chou, Chem. Phys. Lett. 336, 212 (2001). [12] C. Sanchez-Valle, I. Daniel, I. Martinez, A. Simionovici and B. Reynard, J. Phys.: Condens. Matter 16, S1197
(2004). [13] C. Sanchez-Valle, I. Martinez, I. Daniel, P. Philippot, S. Bohic and A. Simionovici, Am. Mineral. 88, 978
(2003). [14] C. Schmidt and K. Rickers, Am. Mineral. 88, 288 (2003). [15] C. Schmidt, K. Rickers, D. H. Bilderback and R. Huang, Lithos 95, 87 (2007).[16] H. Bureau, B. Ménez, V.
Malavergne, A. Somogyi, A. Simionovici, D. Massare, H. Khodja, L. Daudin, J. P. Gallien, C. Shaw and M. Bonnin-Mosbah, High Pressure Res. 27, 1 (2007).
[17] M. Munoz, H. Bureau, V. Malavergne, B. Ménez, M. Wilke, C. Schmidt, A. Simionovici, A. Somogyi and F. Farges, Phys. Script. T115, 921 (2005).
[18] A. Sharma, J. H. Scott, G. D. Cody, M. L. Fogel, R. M. Hazen, R. J. Hemley and W. T. Huntress, Science 295, 1514 (2002).
[19] P. M. Oger, I. Daniel, A. Picard and A. Simionovici, Spectrochim. Acta. Part B 59, 1681 (2004). [20] Sherman, Spectrochim. Acta. 7, 283 (1955). [21] R. P. Gardner and A. R. Hawthorne, X-Ray Spectrometry 4, 138 (1975). [22] K. Janssens, L. Vincze, P. Van Espen and F. Adams, X-Ray Spectrom. 22, 234 (1993). [23] L. Vincze, K. Janssens, F. Adams, M. L. Rivers and K. W. Jones, Spectrochim. Acta. Part B 50, 127 (1995). [24] K. Rickers, R. Thomas and W. Heinrich, Eur. J. Mineral. 16, 23 (2004). [25] J. Cauzid, L. Philippot, A. Somogyi, B. Ménez, A. Simionovici and P. Bleuet, Chem. Geol. 227, 165 (2006). [26] J. Cauzid, P. Philippot, A. Somogyi, A. Simionovici and P. Bleuet, Anal. Chem. 76, 3988 (2004). [27] J. D. Frantz, H. K. Mao, Y. G. Zhang, Y. Wu, A. C. Thompson, J. H. Underwood, R. D. Giauque, K. W. Jones
and M. L. Rivers, Chem. Geol. 69, 235 (1988). [28] J. A. Mavrogenes, R. J. Bodnar, A. J. Anderson, S. Bajt, S. R. Sutton and M. L. Rivers, Geochim. Cosmochim.
Acta 59, 3987 (1995). [29] B. Ménez (1999) (Université Paris 7, Paris), Vol. PhD, pp. 209. [30] B. Ménez, P. Philippot, M. Bonnin-Mosbah, A. Simionovici and F. Gibert, Geochim. Cosmochim. Acta 66,
561 (2002). [31] P. Philippot, B. Ménez, P. Chevallier, F. Gibert, F. Legrand and P. Populus, Chem. Geol. 144, 121 (1998). [32] A. H. Rankin, M. H. Ramsey, B. Coles, F. Van Langevelde and C. R. Thomas, Geochim. Cosmochim. Acta
56, 67 (1992). [33] D. A. Vanko and J. A. Mavrogenes, in: Applications of microanalytical techniques to understanding
mineralizing processes - Reviews in Economic Geology, edited by M. A. McKibben and W. C. Shanks, Vol. 6 (Society of Economic Geologists, 1998), p. 251.
[34] D. A. Vanko, S. R. Sutton, M. L. Rivers and R. J. Bodnar, Chem. Geol. 109, 125 (1993). [35] W. A. Bassett, A. J. Anderson, R. A. Mayanovic and I. M. Chou, Chem. Geol. 167, 3 (2000). [36] J. P. Itié, B. Couzinet, A. C. Dhaussy, A. M. Flank, N. Jaouen, P. Lagarde and A. Polian, High Pressure Res.
26, 325 (2006). [37] J. F. Lin, J. Shu, H. K. Mao, R. J. Hemley and G. Shen, Rev. Sc. Instr. 74, 4732 (2003). [38] A. Saul and W. Wagner, J. Phys. Chem. Ref. Data 18, 1537 (1989).
Modern Research and Educational Topics in Microscopy. A. Méndez-Vilas and J. Díaz (Eds.) ©FORMATEX 2007
987
_______________________________________________________________________________________________
[39] A. Somogyi, R. Tucoulou, G. Martinez-Criado, A. Homs, J. Cauzid, P. Bleuet, S. Bohic and A. Simionovici, J. Synchrotron Rad. 12, 208 (2005).
[40] B. Lengeler, C. G. Schroer, M. Richwin, J. Tummler, M. Drakopoulos, A. Snigirev and I. Snigireva, Applied Physics Letters 74, 24 (1999).
[41] A. Snigirev, V. Kohn, I. Snigireva and B. Lengeler, Nature 384, 49 (1996). [42] H. Bureau and H. Keppler, Earth Planet. Sc. Lett. 165, 187 (1999). [43] H. Keppler, Nature 380, 237 (1996). [44] H. Bureau, B. Ménez, H. Khodja, L. Daudin, J. P. Gallien, D. Massare, C. Shaw and N. Métrich, Nucl. Instr.
Meth. B 210, 434 (2003). [45] D. R. Lovley (eds.) Environmental Microbe-Metal Interactions (ASM Press, Washington D. C., 2000), pp.
405. [46] D. K. Newman, D. Ahmann and F. M. M. Morel, Geomicrobiol. J. 15, 255 (1998). [47] J. F. Stolz and R. S. Oremland, FEMS Microbiol. Rev. 23, 615 (1999). [48] R. S. Oremland and J. F. Stolz, Science 300, 939 (2003). [49] R. Huber, M. Sacher, A. Vollman, H. Huber and D. Rose, System. Appl. Microbiol. 23, 305 (2000). [50] J. F. Stolz, D. J. Ellis, J. S. Blum, D. Ahmann, D. R. Lovley and R. S. Oremland, Int. J. Syst. Bacteriol. 49,
1177 (1999). [51] M. Burchard, A. M. Zaitsev and W. Maresh, Rev. Sc. Instr. 74, 1263 (2003). [52] H. Bureau, M. Burchard, S. Kubsky, S. Henry, C. Gondé, A. Zaitsev and J. Meijer, High Pressure Res. 26, 251
(2006). [53] A. Zaitsev, M. Burchard, J. Meijer, A. Stephan, B. Burchard, W. R. Fahrner and W. Maresh, Phys. Stat. Sol.
185, 59 (2001). [54] M. Burchard, S. Kubsky, H. Bureau, A. Somogyi, V. Malavergne, B. Ménez and M. Munoz, High Pressure
Res. 26, 235 (2006).
©FORMATEX 2007Modern Research and Educational Topics in Microscopy. A. Méndez-Vilas and J. Díaz (Eds.)
988
_______________________________________________________________________________________________