in response to its commitments under the united … · dr. bo lim, mr. yamil bonduki and other...
TRANSCRIPT

IN RESPONSE TO ITS COMMITMENTS UNDER THE UNITED NATIONSFRAMEWORK CONVENTION ON CLIMATE CHANGE.

Saint Lucia’s Initial National Communication I
ACKNOWLEDGEMENTS
Funding for the preparation of St. Lucia’s First National Communication was provided by the Global EnvironmentFacility (GEF) through the United Nations Development Programme (UNDP) and the support of both organizationsis gratefully acknowledged.
Professor Bhawan Singh undertook St. Lucia’s Inventory of Greenhouse Gases as well as the Mitigation Analysis.Professor Singh also conducted a national training workshop on Greenhouse Gas Inventory with the assistanceof Mr. Abderrahman El-Fouladi.
Mr. Brian Challenger conducted the National Communication Project Initiation Workshop and led the teamwhich undertook the National Vulnerability and Adaptation Study. He also assisted in the drafting of the Mitigationand Inventory Chapters of this document and provided invaluable advice and support throughout the preparationprocess.
Sincere thanks are due to Mr. Lyndon John, Miss Joanna Raynold and Dr. Marie-Louise Felix, consultants onthe Vulnerability and Adaptation study. Mr. John and Ms. Raynold also assisted in the drafting of the chapter onVulnerability and Adaptation. Mr. Peter Norville assisted in the preparation of the National Strategy chapter.
Dr. Bo Lim, Mr. Yamil Bonduki and other personnel of the United Nations National Communications SupportProgramme provided valuable training and support which is gratefully acknowledged.
The National Climate Change Committee and its Technical Working Group laboured with dedication to guidethe process which culminated in the preparation of this document.
Sincere thanks are due to Mr. Marcathian Alexander who worked on the layout and formatting of this document.
Finally, thanks are due to all those who undertook research, offered comments, reviewed documents, or in anyother way, assisted in the preparation of the national Communication.

Saint Lucia’s Initial National Communication II
EDITORS & CONTRIBUTORS
Editors
Bishnu Tulsie- Sustainable Development & Environment Unit, Ministry of Planning, Development, Environment& Housing
Crispin d’Auvergne- Sustainable Development & Environment Unit, Ministry of Planning, Development,Environment & Housing (Project Co-ordinator)
Devon Barrow- Project Assistant, National Communications Project
Contributors
Brian Challenger- Consultant
Bishnu Tulsie
Devon Barrow
Crispin d’Auvergne
Bhawan Singh-Consultant
Peter Norville- Consultant
Marie-Louise Felix- Department of Fisheries, Ministry of Agriculture , Forestry and Fisheries
Venantius Descartes- Meteorological Office, Ministry of Communications, Works, Transport & Public Utilities
Lyndon John- Consultant
Joanna Raynold- Consultant

Saint Lucia’s Initial National Communication III
ContentsACKNOWLEDGEMENTS ............................................................ IEDITORS & CONTRIBUTORS ...................................................II
LIST OF FIGURES . . . . . . . . . . . . . . . . . . . . . . . . . . . . . . . . . . . . . . . . . . . . . . . VILIST OF TABLES . . . . . . . . . . . . . . . . . . . . . . . . . . . . . . . . . . . . . . . . . . . . . . . . VI
PREFACE ....................................................................................VIILIST OF ABBREVIATIONS & ACRONYMS ........................ VIIIEXECUTIVE SUMMARY .......................................................... XI
BACKGROUND . . . . . . . . . . . . . . . . . . . . . . . . . . . . . . . . . . . . . . . . . . . . . . . . . XINATIONAL CIRCUMSTANCES . . . . . . . . . . . . . . . . . . . . . . . . . . . . . . . . . . . . XINATIONAL INVENTORY OF GREENHOUSE GASES . . . . . . . . . . . . . . . . . . XIICLIMATE CHANGE VULNERABILITY AND ADAPTATION . . . . . . . . . . . . XIIABATEMENT ANALYSIS . . . . . . . . . . . . . . . . . . . . . . . . . . . . . . . . . . . . . . . . . XIIGENERAL DESCRIPTION OF STEPS TAKEN . . . . . . . . . . . . . . . . . . . . . . . XIIIFINANCIAL AND TECHNOLOGICAL REQUIREMENTS . . . . . . . . . . . . . . XIII
NATIONAL CIRCUMSTANCES.................................................. 11.1 INTRODUCTION. . . . . . . . . . . . . . . . . . . . . . . . . . . . . . . . . . . . . . . . . . . . . 21.2 GEOGRAPHY . . . . . . . . . . . . . . . . . . . . . . . . . . . . . . . . . . . . . . . . . . . . . . . 21.3 GEOLOGY . . . . . . . . . . . . . . . . . . . . . . . . . . . . . . . . . . . . . . . . . . . . . . . . . . 31.4 CLIMATE . . . . . . . . . . . . . . . . . . . . . . . . . . . . . . . . . . . . . . . . . . . . . . . . . . . 31.5 CLIMATIC ELEMENTS . . . . . . . . . . . . . . . . . . . . . . . . . . . . . . . . . . . . . . . 3
1.5.1 TEMPERATURE ..................................................................................................................................... 31.5.2 RAINFALL .............................................................................................................................................. 31.5.3 WINDS .................................................................................................................................................... 51.5.4 HUMIDITY ............................................................................................................................................. 51.5.5 SUNSHINE ............................................................................................................................................. 5
1.6 HISTORY . . . . . . . . . . . . . . . . . . . . . . . . . . . . . . . . . . . . . . . . . . . . . . . . . . . 51.7 BIODIVERSITY . . . . . . . . . . . . . . . . . . . . . . . . . . . . . . . . . . . . . . . . . . . . . . 61.8 POPULATION AND DEMOGRAPHY . . . . . . . . . . . . . . . . . . . . . . . . . . . . 71.9 ECONOMY. . . . . . . . . . . . . . . . . . . . . . . . . . . . . . . . . . . . . . . . . . . . . . . . . . 91.10 ENERGY. . . . . . . . . . . . . . . . . . . . . . . . . . . . . . . . . . . . . . . . . . . . . . . . . . . 101.11 TRANSPORT . . . . . . . . . . . . . . . . . . . . . . . . . . . . . . . . . . . . . . . . . . . . . . . . 11
NATIONAL INVENTORY OF GREENHOUSE GASESFOR ST. LUCIA........................................................................ 132.1 INTRODUCTION. . . . . . . . . . . . . . . . . . . . . . . . . . . . . . . . . . . . . . . . . . . . 14

Saint Lucia’s Initial National Communication IV
2.2 ENERGY SECTOR . . . . . . . . . . . . . . . . . . . . . . . . . . . . . . . . . . . . . . . . . . 142.3 INDUSTRIAL SECTOR. . . . . . . . . . . . . . . . . . . . . . . . . . . . . . . . . . . . . . . 192.4 AGRICULTURE SECTOR . . . . . . . . . . . . . . . . . . . . . . . . . . . . . . . . . . . . . 212.5 LAND USE, LAND USE CHANGE AND FORESTRY . . . . . . . . . . . . . . 222.6 WASTE SECTOR . . . . . . . . . . . . . . . . . . . . . . . . . . . . . . . . . . . . . . . . . . . . 242.7 MEMO ITEMS . . . . . . . . . . . . . . . . . . . . . . . . . . . . . . . . . . . . . . . . . . . . . . 252.8 SOURCES OF UNCERTAINTY . . . . . . . . . . . . . . . . . . . . . . . . . . . . . . . . 252.9 SUMMARY OF EMISSIONS AND REMOVALS . . . . . . . . . . . . . . . . . . 272.10 RECOMMENDATIONS. . . . . . . . . . . . . . . . . . . . . . . . . . . . . . . . . . . . . . . 30
NATIONAL CLIMATE CHANGE MITIGATION STUDYFOR ST. LUCIA MEASURES AND POLICIES ..................... 313.1 INTRODUCTION. . . . . . . . . . . . . . . . . . . . . . . . . . . . . . . . . . . . . . . . . . . . 323.2. PRESENT PATTERNS OF ENERGY USE . . . . . . . . . . . . . . . . . . . . . . . . 323.3 SUSTAINABLE ENERGY DEVELOPMENT PLAN . . . . . . . . . . . . . . . . 343.4 SUSTAINABLE FORESTRY MANAGEMENT . . . . . . . . . . . . . . . . . . . . 383.5 AGRICULTURE . . . . . . . . . . . . . . . . . . . . . . . . . . . . . . . . . . . . . . . . . . . . . 393.6 IMPROVED WASTE MANAGEMENT . . . . . . . . . . . . . . . . . . . . . . . . . . 393.7 CONCLUSION . . . . . . . . . . . . . . . . . . . . . . . . . . . . . . . . . . . . . . . . . . . . . . 40
VULNERABILITY & ADAPTATION ASSESSMENT.............. 414.1 INTRODUCTION. . . . . . . . . . . . . . . . . . . . . . . . . . . . . . . . . . . . . . . . . . . . 424.2 CLIMATE CHANGE SCENARIOS FOR ST. LUCIA . . . . . . . . . . . . . . . 424.3 THE COASTAL ZONE AND FISHERIES SECTOR . . . . . . . . . . . . . . . . 43
4.3.1 THE COASTAL ZONE .................................................................................................................. 434.3.2 CRITICAL HABITATS OF THE COASTAL ZONE ..................................................................... 444.3.3 THE FISHERIES SECTOR ............................................................................................................ 444.3.4 FISHERIES RESOURCES OF ST. LUCIA ................................................................................... 454.3.5 POTENTIAL IMPACTS ON THE COASTAL ZONE AND THE FISHERIES SECTOR ........... 45
4.4 FORESTRY AND TERRESTRIAL RESOURCES . . . . . . . . . . . . . . . . . . 484.4.1 FOREST RESOURCES . . . . . . . . . . . . . . . . . . . . . . . . . . . . . . . . . . . . . . . 48
4.4.2 FOREST UTILIZATION ................................................................................................................ 484.4.3 SOCIO-ECONOMIC ISSUES ........................................................................................................ 484.4.4 CLIMATE CHANGE IMPACTS .................................................................................................... 484.4.5 SPECIFIC IMPACTS ON WILDLIFE HABITATS/ECOSYSTEMS ........................................... 50
4.5 FRESHWATER RESOURCES . . . . . . . . . . . . . . . . . . . . . . . . . . . . . . . . . . 514.6 HUMAN SETTLEMENTS, HUMAN HEALTH AND SERVICES . . . . . 53
4.6.1 HUMAN SETTLEMENTS ............................................................................................................. 534.6.2 HUMAN HEALTH AND HEALTH SERVICES ........................................................................... 534.6.3 POTENTIAL IMPACTS HUMAN SETTLEMENTS AND HUMAN HEALTH/SERVICES ..... 544.6.4 ANTICIPATED IMPACTS ON HOUSING AND CRITICAL INFRASTRUCTURE.................. 57
4.7 THE AGRICULTURE SECTOR . . . . . . . . . . . . . . . . . . . . . . . . . . . . . . . . 604.7.1 AGRICULTURE IN ST. LUCIA .................................................................................................... 614.7.2 EXISTING THREATS TO THE AGRICULTURE SECTOR ........................................................ 61

Saint Lucia’s Initial National Communication V
4.8 THE TOURISM SECTOR . . . . . . . . . . . . . . . . . . . . . . . . . . . . . . . . . . . . . 654.8.1 TOURISM IN ST. LUCIA .............................................................................................................. 654.8.2 POTENTIAL IMPACTS OF CLIMATE CHANGE ON THE TOURISM SECTOR .................... 66
4.9 RECOMMENDATIONS FOR ADAPTATION . . . . . . . . . . . . . . . . . . . . . 674.10 CONCLUSION . . . . . . . . . . . . . . . . . . . . . . . . . . . . . . . . . . . . . . . . . . . . . . 71
GENERAL DESCRIPTION OF STEPS TAKEN........................ 735.1 INTRODUCTION. . . . . . . . . . . . . . . . . . . . . . . . . . . . . . . . . . . . . . . . . . . . 745.2 POLICY FRAMEWORK . . . . . . . . . . . . . . . . . . . . . . . . . . . . . . . . . . . . . . 745.3 SYSTEMATIC OBSERVATION AND RESEARCH . . . . . . . . . . . . . . . . . 755.4 PUBLIC AWARENESS AND EDUCATION . . . . . . . . . . . . . . . . . . . . . . . 755.5 CAPACITY BUILDING . . . . . . . . . . . . . . . . . . . . . . . . . . . . . . . . . . . . . . . 765.6 OTHER INITIATIVES . . . . . . . . . . . . . . . . . . . . . . . . . . . . . . . . . . . . . . . . 776.1 FINANCIAL & TECHNOLOGICAL REQUIREMENTS . . . . . . . . . . . . . 79
REFERENCES ............................................................................. 82APPENDICES .............................................................................. 84

Saint Lucia’s Initial National Communication VI
LIST OF FIGURES
Figure 1.1 Map of St. Lucia showing location in Caribbean Chain. 2Figure 1.2 & 1.3 Rainfall trends for both Hewanorra and George Charles show
a slight increase from the early 1970’s to 2000. 4Figure 2.1 CO2 Emissions (Gg) by Fuel Types for St. Lucia, 1994, Reference Approach. 16Figure 2.2 CO2 Emissions (%) by sub-sector within Energy Sector,
including Total and Memo Items, 1994 18Figure 2.3 CO2 Emissions (Gg) by Sub-sector within Energy sector excluding Memo Items, 1994 18Figure 2.4 CO2 Emissions and Removals (Gg) by sectors 28Figure 2.5 Non- CO2 Emissions and Removals by Sectors 30Figure 4.1 Climate Change Impact Life Zones in Saint Lucia 49
LIST OF TABLES
Table 1.1 Forest Area by Category 6Table 1.2 Summary of Vital Statistics 8Table 1.3 Growth trend in energy consumption for the main fuels for the period 1995 to 2000. 11Table 1.4 Growth trend in the major sectors for the period 1995 to 1999. 11Table 2.1 Supply (Import) of Fuels (TOE) for St. Lucia in 1994 15Table 2.2 CO2 Emissions from Energy Sources according to
Reference and Sectoral Approaches for St. Lucia in 1994 15Table 2.3 CO2 Emissions from Energy Sources and Fuel Combustion Categories 16Table 2. 4 CO2 Emissions by Sub-sectors within the Energy Sector: 1994 (Sectoral Approach) 17Table 2.5 Non- CO2 Emissions (Gg) from Fuel Combustion in Energy Sector 19Table 2.6 NMVOC emissions (Gg) from the Industrial Sector, 1994. 20Table 2.7 SO2 emissions (Gg) from the Industrial Sector, 1994. 20Table 2.8 HFC emissions (Gg) from the Industrial Sector, 1994. 21Table 2.9 CH4 Emissions from Animal Stocks and Rice Cultivation in the Agriculture Sector 22Table 2.10 N2 O Emissions from Agricultural Soils in the Agriculture Sector 22Table 2.11 CO2 Emissions and Removals and Net/Sink (Gg) for Land Use,
Land-Use Change and Forestry Sector 23Table 2.12 Non-CO2 Emissions from the Land Use and Forestry Sector, 1994 23Table 2. 13 CH4 and N2O Emissions from the Waste Sector 24Table 2.14. CO2 Emissions and Removals by Sector 27Table 2.15 Non- CO2 Emissions and Removals by Sector (Gg) 29Table 2.16. Non- CO2 Emissions and Removals by Sector (Global Warming Potential) 30Table 3.1 Sectoral Consumption of Electricity in Saint Lucia, 1995-1999 32

Saint Lucia’s Initial National Communication VII
PREFACE
St. Lucia’s First National Communication to the Conference of Parties to the United Nations FrameworkConvention on Climate Change (UNFCCC) is the culmination of a programme of Enabling Activities undertakenby the Government of St. Lucia in fulfilment of commitments under the Convention. It has been prepared inaccordance with Guidelines laid down by the Conference of Parties (COP) in Decision 10/CP2 and according toArticles 4 and 12 of the Convention which St. Lucia ratified on 14th June 1993.
This document constitutes an output of a project (STL/97/G31) funded through the Global Environment Facility(GEF). The project has been implemented by the United Nations Development Programme (UNDP) and executedby the Government of St. Lucia through the Ministry of Planning Development, Environment & Housing.
The Government of St. Lucia is fully cognizant of the need to disseminate climate change information to relevantnational, regional and international interests. This document is therefore seen as a vehicle for enhancing awarenessand knowledge of climate change issues as they pertain to St. Lucia.

Saint Lucia’s Initial National Communication VIII
LIST OF ABBREVIATIONS & ACRONYMS
CARILEC - Caribbean Electricity utility Services Corporation
CCCDF - Canadian Climate Change Development Fund
CDM - Clean Development Mechanism
CH4 - Methane
CNG - Compressed Natural Gas
CO - Carbon Monoxide
CO2
- Carbon Dioxide
CPACC - Caribbean Planning for Adaptation to Climate Change
CREDP - Caribbean Renewable Energy Development Project
DOC - Degradable Organic Compound
DSM - Demand Side Management
EEZ - Exclusive Economic Zone
ESCO - Energy Service Companies
GCMs - General Circulation Models
GDP - Gross Domestic Product
GEF - Global Environment Facility
GHG - Greenhouse Gas
Gg - Gigagram
GOSL - Government of Saint Lucia
HFC - Haloflorocarbon
IGCI - Canadian Government Information on the Internet (CGII) / InformationGouvernementale Canadienne sur l'Internet (IGCI)
IPCC - Inter-governmental Panel on Climate Change
IPPs - Independent Power Producers
ITCZ - Inter Tropical Convergence Zone
Kt - Kilotonne
LBSMP - Land-Based Sources of Marine Pollution
LPG - Liquefied Petroleum Gas
LUCELEC - Saint Lucia Electricity Services Ltd.
LULUCF - Land Use, Land Use Change and Forestry
MACC - Mainstreaming Adaptation for Climate Change

Saint Lucia’s Initial National Communication IX
MAFF - Ministry of Agriculture, Forestry and Fisheries
MARPOL - Marine Pollution (Convention)
MCF - Methane Correction Factor
MOH - Ministry of Health
MOL - Ministry of Labour
MOP - Ministry of Planning
MPDEH - Ministry of Planning, Development, Environment and Housing
MSW - Municipal Solid Waste
MW - Megawatts
N2O - Nitrous Oxide
NBSAP - National Biodiversity Strategy and Action Plan
NCA - National Conservation Authority
NCCS - National Climate Change Strategy
NDC - National Development Corporation
NEMO - National Emergency Management Organization
NISEE - National Information Service for Earthquake Engineering (University of California, Berkeley)
NMVOC - Non-Methane Volatile Organic Compound
NOX - Nitrous Oxide
O3
- Ozone
PSIP - Public Sector Investment Programme
PV - Photovoltaic
RBDC - Rodney Bay Development Company
RSLPF - Royal St. Lucia Police Force
SIDS - Small Island Developing State(s)
SLASPA - St. Lucia Air and Seaports Authority
SLNT - St. Lucia National Trust
SO2
- Sulphur Dioxide
SPREP - South Pacific Regional Environmental Programme
SSS - Sun, Sea and Sand
SWDS - Solid Waste Disposal Site
TJ - Terajoule
TOE - Tonne of Oil Equivalent
UNCDB - United Nations Convention on Biological Diversity

Saint Lucia’s Initial National Communication X
UDC - Urban Development Corporation
UNDP - United Nations Development Programme
UNFCCC - United Nations Framework Convention on Climate Change
WASCO - Water and Sewerage Company

Saint Lucia’s Initial National Communication XI
EXECUTIVE SUMMARY
BACKGROUND
The preparation of St. Lucia’s First National Communication to UNFCCC was funded by the Global EnvironmentalFacility (GEF) through the United Nations Development Programme. The process, which commenced in June1999, was executed by the Ministry of Planning, Development, Environment & Housing and coordinated throughthe broad-based National Climate Change Committee.
The process of preparing this initial communication necessitated the involvement and participation of a widerange of stakeholders from various sectors. These were drawn from Government agencies, statutory bodies,non-governmental organizations and civil society.
Technical studies were undertaken using local and regional expertise. Wherever possible, even when non-national consultants were contracted, local capacity was strengthened in order to carry out as much of thework as possible. Key areas of focus for capacity building included:Inventory of Greenhouse Gases;Vulnerability and Adaptation Assessment;Web Site Development and Maintenance.
The National Communication is arranged as follows:
National CircumstancesNational Inventory of Greenhouse GasesGreenhouse Gas Abatement AnalysisVulnerability and Adaptation AssessmentGeneral Description of Steps TakenFinancial & Technological needs
NATIONAL CIRCUMSTANCES
St. Lucia is one of many Small Island Developing States (SIDS) located in the Caribbean Sea. It is of relativelyrecent volcanic origin with a rugged topography.
As is typical of many such States, St. Lucia is characterized, inter alia, by:Limited mineral resources;An open fragile economy highly vulnerable to external economic factors;Limited human resources;Limited financial and technical resources.
Although a small island, St. Lucia has a relatively high level of biological and ecosystem diversity. It is home tonumerous terrestrial and marine plants and animal species. Ecosystems include rainforest, coral reefs, mangalsand sea grass beds
Population centres and economic activities, including tourism, are concentrated along the coast. These are thereforehighly vulnerable to the anticipated effects of climate change such as sea-level rise.

Saint Lucia’s Initial National Communication XII
Water resources occur mainly in the form of surface streams. These are tapped for the municipal supply as wellas for agricultural purposes. During the dry season, water shortages are often experienced in many areas. Thesupply of water has been affected over the years by deforestation and there is grave concern that it may befurther negatively affected by the effects of climate change.
St. Lucia is poor in mineral resources including petroleum. Consequently, there is heavy dependence on importedfuels for electricity generation. Approximately 97 percent of the population currently has access to electricity.
The main economic activities are tourism, agriculture, services and manufacturing, in that order. Bananas constitutethe main agricultural export although production has fallen sharply over the last few years due to unfavourabledevelopments in traditional markets. This serves to underscore St. Lucia’s vulnerability to external economicfactors.
Overall, St. Lucia’s fragile natural and economic circumstances make it highly vulnerable to external events.Climate change is therefore likely to have a significant impact on the natural, social and economic environmentof the country.
NATIONAL INVENTORY OF GREENHOUSE GASES
For the Inventory of Greenhouse Gases (GHGs), 1994 is used as the reference year. Calculations were doneusing IPCC guidelines. In that year, total CO
2 emissions were calculated at 268 Gg. The energy sector was St.
Lucia’s largest source of GHGs, followed by the transport sector. Emissions were offset by absorption by sinksresulting in net 74Gg. It was recognized during the conduct of the inventory that there were significant data gapsand that IPCC values were not totally applicable to the St. Lucia context. These observations underscored theneed for capacity building in order to establish and maintain appropriate systems for data collection and analysis.
CLIMATE CHANGE VULNERABILITY AND ADAPTATION
A number of key effects have been ascribed to climate change. These include higher global temperatures; sealevel rise; more intense weather phenomena such as hurricanes and droughts and changing rainfall patterns.
The initial Vulnerability and Adaptation study carried out for St. Lucia in the context of these effects involvedthe assessment of climate change impacts on Agriculture; Coastal Resources; Forestry and Terrestrial Resources;Human Settlements; Freshwater Resources; Fisheries; Health and Tourism.
The overall conclusion of the study is that all sectors are likely to be significantly impacted by climate changewith major, mostly adverse, environmental, economic and social consequences. Of particular concern are theanticipated impacts on agricultural production, water supply, fisheries, tourism and coastal resources.
The study identifies measures for adapting to the effects of Climate Change. These include public awareness,the introduction of drought- and salt-resistant crops; development of a national water management plan, watershedprotection and relocation of critical infrastructure.
ABATEMENT ANALYSIS
St. Lucia’s greenhouse emissions originate from various sources in the energy, transportation and agriculturalsectors. The abatement analysis identified, and assessed the suitability of, a wide range of options for reducingemissions. These range from the increased exploitation of renewable sources of energy such as wind, to theintroduction of alternative- fuel vehicles. The need for demand-side management in the energy sector was alsorecognized.

Saint Lucia’s Initial National Communication XIII
The Abatement Analysis was undertaken in the context of an ongoing process to formulate a Sustainable EnergyPlan for St. Lucia. This process was initiated following St. Lucia’s announcement during the 5th Conference ofParties to the UNFCCC of its intention to become the world’s first Sustainable Energy Demonstration Country.
GENERAL DESCRIPTION OF STEPS TAKEN
St. Lucia, as a Small Island Developing State, has limited capacity to address the myriad issues to be faced as aresult of the climate change phenomenon. Notwithstanding, notable progress has been achieved in areas such aspolicy development, public awareness, systematic observation and research and capacity building.
FINANCIAL AND TECHNOLOGICAL REQUIREMENTS
The effects of climate change will have far reaching implications for all aspects of life in St. Lucia. Steps musttherefore be taken to address all relevant issues in a proactive, coordinated manner. Given St. Lucia’s limitedhuman, financial and technological resources, regional and international cooperation and support will be requiredin a number of key areas including research, capacity building, adaptation measures, sustainable energy initiativesand public awareness.

Saint Lucia’s Initial National Communication 1
National Circumstances Chapter 1
NATIONAL CIRCUMSTANCES

Saint Lucia’s Initial National Communication 2
National Circumstances Chapter 1
1.1 INTRODUCTION
St. Lucia, (13°59´ N, 61° W) is a Small Island Developing State situated approximately mid-way in the LesserAntillean Arc in the Caribbean Archipaelago. It sits on an ancient volcanic ridge connecting Martinique to thenorth and St. Vincent to the south. It has an area of 616 square kilometers and an estimated population (2000) of156,300. St. Lucia is classified as a middle-income Small Island Developing State.
1.2 GEOGRAPHY
Figure 1.1 Map of St. Lucia showing location in Caribbean Chain.
The island of Saint Lucia is 42km from north to south and 22 km from east to west and has a total area of 616square km. The island is very rugged in topography with a narrow coastal ridge, deep valleys and rugged mountainsin the central region reaching an altitude of 950 m (Mt. Gimie). The slopes are cut by numerous fast-flowingstreams. Perhaps the most spectacular landmarks are the twin Pitons (pinnacles of solid lava) rising sharply outof the sea, on the island’s west coast.

Saint Lucia’s Initial National Communication 3
National Circumstances Chapter 1
1.3 GEOLOGY
Geologically, St. Lucia is almost entirely of volcanic origin with the oldest rocks dating back to the EarlyTertiary period. These consist mainly of andesites, rhyolite and basalt. There are also limestone deposits whichoccurred while the island was submerged during the Lower Miocene period.
Volcanic activity continues in the Lesser Antillean and in St. Lucia, the fumaroles of the Sulphur Springs in theSoufriere area are located in what is known as the Qualibou Caldera. This depression, which is 6 km in diameteris believed to have been formed following the collapse of a large volcanic cone.
St. Lucia has a coastline of 158km. The island’s coastal shelf (522km2) is relatively narrow and drops offsharply on the west coast. St. Lucia has an Exclusive Economic Zone (EEZ) of approximately 4700 km2.
1.4 CLIMATE
The island of St. Lucia lies within the north-east Trade Wind belt and is normally under an easterly flow of moistwarm air. Its location in the Atlantic Ocean/ Caribbean sea means that ambient sea surface temperatures varylittle from 26.7oC at any time. The island receives an almost constant amount of surface solar radiation frommonth to month. These factors combine to give St. Lucia a climate (tropical maritime) with a fairly constant highair temperature averaging near 28 degrees Celsius, but rarely rising above 33oC or falling below 20oC.
The island’s weather is influenced by synoptic weather systems such as the Atlantic High Pressure system(Bermuda Azores), surface, mid and upper level troughs/lows, the Inter-tropical Convergence Zone, tropicalwaves and cyclones and the occasional frontal system. Mesoscale and microscale weather features also affectthe island.
1.5 CLIMATIC ELEMENTS
1.5.1 TEMPERATURE
Since St. Lucia is a small island and because of its geographic location, the air temperature is greatly determinedby the winds blowing off the surrounding oceans. There is very little variation annually in air temperatures overthe island. However, diurnal temperatures can vary by as much as 10oC. The temperatures are lowest in themonths of December through to March; and are highest around June to September. Mean maximum temperatureis about 30.1oC and mean minimum about 24.5oC. Also, St. Lucia’s mountainous nature can cause significanttemperature variation between high and low lying regions (about 2 – 5 degrees Celsius).
1.5.2 RAINFALL
The island’s annual rainfall regime can be defined by two seasons, one wet and one dry. The dry season runsfrom January to May and the wet from June to November.
The volume of rainfall in the wet season is determined mainly by the frequency and intensity of tropicaldisturbances (waves, depressions, storms, hurricanes). These disturbances account for most of the recordedrainfall in that season. Local convectional showers and other weather systems, account for most of the remainder.
In the dry season, most of the rainfall originates from mid-latitude systems (troughs, frontal troughs, jet streams)intruding into the region.

Saint Lucia’s Initial National Communication 4
National Circumstances Chapter 1
The intrusion of the dry season rain-producing systems is randomly distributed temporally, thus, the rainfall theyproduce over the island is highly variable over time. On the other hand, tropical disturbances in the wet seasontend to occur with a predictable frequency of roughly one every four days.
The orographic influence of rainfall is quite pronounced with amounts varying from about 1265 mm in therelatively flat coastal regions to about 3420 mm in the elevated interior region.
Figure 1.2 and 1.3 Rainfall trends for both Hewanorra and George Charles show a slightincrease from the early 1970’s to 2000.

Saint Lucia’s Initial National Communication 5
National Circumstances Chapter 1
1.5.3 WINDS
The island of St. Lucia lies within the northeast Trade Wind belt. Wind speeds are highest, on average, duringthe months of January to July, corresponding roughly with the dry season. Wind speeds average 15 mph duringJanuary to July and 10 mph during August to December. Higher gusts are occasionally experienced with thepassage of tropical disturbances and cyclones.
1.5.4 HUMIDITY
Daily variation in relative humidity is at a maximum during the warmer months. The lowest value ever reportedat Hewanorra was 31% in February 1998. The annual range is very small with a mean of about 77%.
1.5.5 SUNSHINE
The amount of daily sunshine received over St. Lucia is at a maximum from February to May and minimumaround September. Radiation values vary widely over the island and this is mainly due to cloud cover. Thuselevated regions with greater cloud cover receive less direct radiation than the low-lying coastal regions.
1.6 HISTORY
The earliest settlers of St. Lucia were the Ciboneys. They were an Amerindian culture who lived on the islandabout 2000 years before Columbus. The isand was next occupied by the Arawak Indians, from about 200 A.D.,for a period of about 800 years. They in turn were invaded by the aggressive Carib Indians. When the firstEuropeans arrived, they found the Caribs on the island.
There is some uncertainty as to which European actually “discovered” St. Lucia. Discovery was long attributedto Columbus (1502) but it is believed by some that Juan de la Cosa may have done so in 1499. In any event, theisland which had been known by the by the Amerindians as Iouanalao (Land of the iguana) was named SantaLucia by the Spanish.
The first European attempt at settlement occurred in 1605 when Englishmen from the ship Olive Branch, landedat what is now Vieux-Fort in the south of the island. The settlers were eventually killed or chased out by theCaribs. Another English attempt at settlement, in 1639, sufferd a similar fate. The Caribs themselves wereeventually driven out in 1663.
The French, in the meantime, had also laid claim to the island (c.1627). Over the next 200 years, England andFrance fought for ownership of the island which was to change hands fourteen times between the two countries.St. Lucia was eventually ceded to Britain in 1814, under the Treaty of Paris. Despite the ultimate British “victory’”,St. Lucia was primarily occupied by the French who occupied the island for a total of over 150 years. To this daya large percentage of the St. Lucia population speaks a French-based ‘kweyol’ as a primary or secondary language.
During the period of conflict, St. Lucia’s economy was based on plantation agriculture. Early crops includedcoffee, tobacco and indigo. By the nineteenth century, sugar had become the dominant crop and was to remain sountil the middle of the 20th century when it would be superseded by bananas. Until 1838, labour was providedby thousands of slaves imported from West Africa. Approximately 13,000 former slaves were emancipated inthat year. Following Emancipation, many slaves continued to cultivate small holdings around the island.
In the 19th century, under British rule, St. Lucia was one of the islands administered by a Governor-Generalbased in Barbados until 1885, when Grenada became the headquarters for a new Windward Islands Governmentfor Grenada, St. Lucia, St. Vincent and Tobago.

Saint Lucia’s Initial National Communication 6
National Circumstances Chapter 1
In the latter years of the 19th century and the early decades of the 20th century, St. Lucia was a major producerof charcoal and consequently, the capital and port, Castries, became an important coaling station for steamships.During World War II, a number of American military bases were established on St. Lucia, as in many otherBritish colonies in the Caribbean.
Full adult suffrage was introduced in St. Lucia in 1951. In 1958, the island became a member of the short-livedWest Indies Federation which collapsed in 1961. In 1967 the island became an Associated State with responsibilityfor internal affairs and Britain responsible for external affairs. Full independence from Britain was achieved on22nd February 1979. St. Lucia currently has a Westminster system of Government with a 17 member electedHouse of Parliament and 11 member Senate nominated by the Prime Minister, the Opposition and the Governor-General, who is the representative of the British Crown.
1.7 BIODIVERSITY
Notwithstanding its small size, St. Lucia possesses a high degree of ecosystem diversity and is home to a widerange of flora and fauna. A significant portion of the island is under forest cover, although the clearing of naturalvegetation continues for agriculture, construction and other purposes.
Table 1.1 Forest Area by Category
yrogetaC )seratceh(latoT egatnecreP
tseroFlarutaN 880,21 55
evorgnaM 553 2
tseroFburcS 4157 53
nepO&ssarGsdnaldooW 2031 6
noitatnalP 505 2
latoT 467,12 001
The biological diversity of the island of St. Lucia consists of at least 1,310 known species of flowering plants,cycads and gymnosperms belonging to 143 families. These include 105 plants of known medicinal value and241 recorded forest tree species. There are 118 fern species with the majority being found within the forestecosystem. Seven fern plant species are considered endemic to St. Lucia.
There are twenty-seven endangered plants recorded in St. Lucia, most of which are found in the coastal andlowland habitats. Of the twenty-seven plants, two species (Tetrazygia angustifolia and Myrcia leptocelda) are atimmediate risk of extinction because their limited habitat is threatened by urban development. Three speciesassociated with freshwater swamps are also at risk due to the disappearance of their habitat. They include:Pavonia paludicola, Machaerium lunatum and Montrichandia arborecens (Graveson, 1998).
There are nine (9) endemic plants in St. Lucia. One of these, “palitivye wouj” (Chrysochlamys caribaea), asmall stilt-rooted tree, grows along riverbanks in sheltered valleys where natural forest still occurs, such asalong the Roseau River, above the John Compton Dam and in the rainforest. “Lowye Canelle” (C. elongatum),“balata” (M. bidentata) and “latanye” (Coccothrinax barbadensis), are other endemic plants which are threatenedas a result of over-exploitation and extensive destruction of habitat.

Saint Lucia’s Initial National Communication 7
National Circumstances Chapter 1
There are over one-hundred-and-fifty (150) bird species, seventeen (17) reptiles, nine (9) mammals and four (4)amphibians found in the terrestrial environment of St. Lucia. The island is home to five endemic bird species:the rare St. Lucia Parrot or Jacquot (Amazona versicolor); the St. Lucia Blackfinch or “Moisson Pied–Blanc”(Melanospiza richardsoni); “Semper’s Warbler” or “Pied Blanc” (Leucopeza semper); the St. Lucia Oriole orCarouge (Icterus laudabilis); St. Lucia Pewee or gobe-mouche (Contopus oberi). The island possesses fiveendemic reptiles, one endemic sub-species, (the St. Lucia Boa Constrictor) and six regionally endemic reptiles.There is one known threatened invertebrate sub-species of the hercules beetle (Cymnastes hercules reidi) whichis confined to the montane areas.
The freshwater and mangrove wetlands of St. Lucia are relatively small but they are representative of mostwetland ecosystems. The total area of St. Lucia’s wetlands has been reduced from 320 hectares to 193 hectares,with some areas currently under considerable stress. There are five species of mangrove found in the islandnamely: red mangrove (Rhizophora mangle), white mangrove (Laguncularia racemosa), two species of blackmangrove (Avicennia germinans and A. schaurenia) and buttonwood or “paltivye” (Conocarpus erecta).
Coral reef systems along the west coast are more diverse than those on the east coast. In general, fringing reefsare located mainly along the southeast (Anse des Sables), central west (off the districts of Anse-la-Raye, Soufriereand Laborie), and northwest coasts (Choc Bay). The healthiest and most diverse reefs are found along the centralwest coast, off Soufriere. Reefs of St. Lucia are under threat from high levels of sedimentation and other land-based pollutants and, therefore, near-shore fisheries are also threatened. Natural disasters such as hurricanes andstorms have also taken a toll on St. Lucia’s reefs.
Seagrass beds are common along St. Lucia’s coast and are composed mainly of turtle grass (Thalassia testudinum),manatee grass (Syringodium filiforme) and to a lesser extent, shoal grass (Halodule wrightii) species. In general,larger and denser seagrass beds are found off the east coast, compared to the infrequent and sparsely coveredseagrass patches along the west coast.
Three species of sea turtle are known to nest in St. Lucia: the hawksbill (Eretmochelys imbricata), the greenturtle (Chelonia mydas mydas) and the leatherback (Dermochelys coriacea). The Grande Anse beach is thelargest nesting site on the island for leatherback turtles.
1.8 POPULATION AND DEMOGRAPHY
Figures obtained from the Government Statistics Department of Saint Lucia show an estimated mid year populationof 142,698 for the year 1994 representing an increase of 2781 over the figure for the previous year. The birthrate recorded for that year was 25.4 for every one thousand women between the age of 15 and 44 years. Therewas also a noticeable increase in the population growth rate of 0.73% over the 1993 to 1994 period which can beexplained by the 1% increase noticed in the birth rate between 1993 and 1994 coupled with the decrease in thedeath rate of 0.1% over the same period.
While the island is divided into eight administrative regions, for demographic purposes, it is divided into 10districts, each with a city, town major village.
Castries district, which contains the capital city of the same name, is the most populous and has the highestpopulation density. The north-western corridor of the island, which comprises Castries and the adjacent districtof Gros-Islet contains approximately 50 percent of the total population.
St. Lucia’s population is largely of African origin. The next largest is group is persons of mixed origin followedby those of East Indian descent. Other groups represented are Chinese, Portuguese, Syrian-Lebanese, Caucasianand Amerindian (Carib).

Saint Lucia’s Initial National Communication 8
National Circumstances Chapter 1
Table 1.2 Summary of Vital Statistics
srotacidnIdetceleS
2991 3991 4991 5991 6991 7991 R8991 P9991
raey-diMdetamitsEnoitalupoP
151,831 809,931 986,241 734,541 260,741 666,941 259,151 307,351
htworGnoitalupoPetaR
06.1 72.1 99.1 39.1 21.1 77.1 75.1 51.1
shtriBeviL 167,3 655,3 486,3 507,3 992,3 444,3 059,2 609,2
shtaeD 919 709 519 049 059 189 679 369
shtaeDtnafnI 48 95 14 34 55 06 84 14
shtriBllitS 06 03 44 26 75 35 93 64
etaRhtriB 1.62 5.42 4.52 5.52 4.22 0.32 4.91 9.81
etaRhtaeD 4.6 4.6 3.6 5.6 5.6 6.6 4.6 3.6
ytilatroMtnafnIetaR
0.32 0.71 1.11 6.11 7.61 4.71 3.61 3.41
larutaNfoetaResaercnI
7.91 2.81 1.91 0.91 0.61 5.61 0.31 6.21
egAnaideM 1.12 1.12 9.12 1.12 5.22 7.22 0.32 1.42
etaRytilitreFlatoT 0.3 8.2 8.2 9.2 5.2 6.2 1.2 1.2
evitcudorpeRteNetaR
4.1 3.1 3.1 3.1 2.1 2.1 0.1 0.1
ycnednepeDegAoitaR
3.67 4.27 1.17 4.96 0.86 1.66 4.46 5.26
efiLelaM0egAtaycnatcepxE
7.86 9.86 7.96 8.86 5.96 6.07 6.07 5.96
efilelameF0egAtaycnatcepxE
6.47 5.47 8.47 2.47 7.37 0.37 4.27 2.37
Source: Department of Statistics, Government of Saint Lucia
Saint Lucia’s Initial National Communication 9
National Circumstances Chapter 1
1.9 ECONOMY
Over the period 1980-99, the Saint Lucia economy underwent major structural changes, reflecting the growingimportance of the service sector. An average economic growth rate of 4.4 percent was recorded during thatperiod. After a period of relatively sluggish economic activity over the period 1993-1997, economic growthpicked up in 1998 and 1999. Growth rates of 2.9 percent and 3.1 percent were recorded respectively, followingan average growth rate of 1.3 percent over the period 1993-97. The marked improvement in economic performancewas attributed largely to:
• Continued growth (2.5 percent) in the tourism sector;
• Significant expansion in construction activity
• A marked decline in the rate of contraction in the banana industry from an average of 10.3 percent overthe period 1993-97 to 2.8 percent in 1998-99;
• A reduction in the rate of decline in the manufacturing industry from 1.6 percent to 1.1 percent over thesame comparative periods;
• Continued strong growth in the service sector.
The external debt service ratio increased from an average of 3.2 percent in1993-97 to 4.0 percent of GDP in1998-99 due to a fall in merchandise export earnings and the termination of grace periods for the repayment ofsome concessionary loans. The external debt to GDP ratio also increased from 22.8 percent to 25.4 percent overthe same corresponding period.
Amidst the positive developments, there remains considerable uncertainty over the future of marketingarrangements for the island’s bananas in the European market. These uncertainties arise from both external andinternal factors. Moreover, the observed structural shift in the economy of St. Lucia, to a more service-orientedeconomy, should help cushion the fall-out from the banana industry.
Generally, the external environment seems conducive to strong growth, as the advancement of globalizationopens up new opportunities for the island and the region. The ability of the island to take advantage of thoseopportunities will depend to a large extent on the pursuit of sound macroeconomic policies and improving theenvironment for trade and investment.
The Government of Saint Lucia recognizes that the economy must be restructured and repositioned if it is torespond to the challenges and opportunities presented by globalization and liberalization. Agriculture, tourism,education and human resource development, financial services and technology will form the core of Government’sdevelopment strategy. The Government will promote the tourism sector as the leading sector, give greaterimpetus to agricultural diversification, support the transition in the banana industry by establishing an appropriateregulatory framework and develop the international financial services and informatics sectors.
Over the period 2000-2002, the Government aims to achieve the following goals and objectives:
i. Achieving an average economic growth rate of at least 3.0 percent by the promotion of a broad-basedgrowth strategy;
ii. Increasing the level of public sector savings to a minimum of 8.0 percent of GDP, with central governmentsavings being at least 5.0 percent of GDP;
iii. Increasing the level of domestic savings, as a percentage of GDP from around 9 percent in 1999 toaround 13 percent by 2002;

Saint Lucia’s Initial National Communication 10
National Circumstances Chapter 1
iv. Achieving an investment to GDP ratio of around 26 percent;
v. Maintaining a sustainable current account deficit on the balance of payments, averaging no more than15.0 percent of GDP;
vi. Increasing the level of productivity;
vii. Reducing the level of unemployment and poverty;
viii. Protecting the environment in order to safeguard the country’s natural resource base and ensure thatdevelopment is sustainable.
The achievement of these goals and objectives will require a broad based economic and social strategy that isunderpinned by private sector investment, the continued pursuit of sound macroeconomic and trade policies,enhanced efficiency in resource mobilization, and a Public Sector Investment Programme (PSIP) that is focusedand of adequate size and composition. Government is committed to the following measures over the mediumterm, some of which are already being implemented:
i. Improving the incentives framework to stimulate private sector investment;
ii. Continuing its tax reform programme in order to optimize the structure of the tax base and improve theefficiency of tax collection;
iii. Stringent expenditure management policy;
iv. Improving the human resource base of the country;
v. Maintaining, modernizing and strategically expanding the country’s infrastructure;
vi. Improving the access of the wider population to basic social services and amenities;
vii. Implementing a poverty reduction strategy and plan;
viii. Implementing the National Environmental Action Plan;
ix. Introducing an integrated approach to national development planning;
1.10 ENERGY
The sustained growth in the economy over the past decade has resulted in an increasing demand for energy. Thisdemand is further exacerbated by rapid growth in the energy intensive tourism sector, which has replacedagriculture as the leading economic sector.
Saint Lucia relies almost exclusively on imported fossil fuels to meet it energy needs. Of the total annualconsumption of 109642.64 TOE (Tons of Oil Equivalent) in 2000, only an estimated 1 %, was met from indigenoussources, mainly in the form of firewood, charcoal and agricultural residues. As with all small, non-industrializedeconomies, the main consumption sectors are in electricity generation (28%), and transport (24%).
All electricity in Saint Lucia is generated from diesel-fired plants. Recent economic growth has resulted in asustained increase in demand of 4.3% over the past decade.

Saint Lucia’s Initial National Communication 11
National Circumstances Chapter 1
Table 1.3 Growth trend in energy consumption for the main fuels for the period 1995 to 2000.
raeY 0002 9991 8991 7991 6991 5991
)GI(enilosaG 243,177,11 567,538,11 086,827,5 990,662,11 774,931,1 715,148,9
)GI(leseiD 269,064,4 050,578,2 872,610,2 001,029,3 636,166,3 751,887,3
)sbl(GPL 243,472,41 836,456,62 441,885,71 987,868,7 270,108,31 207,867,11
)GI(enesoreK 193,301 773,411 004,27 296,07
teJ-VA 489,930,6 669,150,7 923,507 049,18 910,986,3 579,465,4
saG-vA 623,75 629,14 325,43 071,55 053,46 882,39
Table 1.4 Growth trend in the major sectors for the period 1995 to 1999.
RAEY9991 8991 7991 6991 5991
hWM % hWM % hWM % hWM % hWM %
citsemoD 194,97 8.63 936,57 0.83 716,96 5.83 366,66 7.93 866,26 4.83
laicremmoCsletoh&
826,021 9.65 816,801 6.45 842,79 8.35 815,68 4.25 386,68 5.25
lairtsudnI 172,21 7.5 046,11 9.5 782,11 2.6 068,01 6.6 796,21 8.7
gnithgilteertS 172,3 5.1 139,2 5.1 506,2 4.1 581,2 3.1 282,2 4.1
selaslatoT 166,512 001 828,891 001 757,081 001 612,561 001 033,361 001
There has been a concerted effort to promote the increased utilization of renewable energy on the island. Thishas been evident in the removal of duty and consumption tax on solar water heating units and other renewableenergy technology. Feasibility studies on solar, wind and geothermal energy potential are ongoing. To this end,a comprehensive energy plan has been developed to address issues of price stability, quality, security of supply,efficiency of consumption, generation and distribution; renewable energy use and environmental impacts; utilityregulations, clean energy technologies, and obligations under international agreements such as the UNFCCC.
1.11 TRANSPORT
The rapid growth in the transport sector in recent years is a direct result of the availability of used vehicles on themarket. Between the period 1994 and 1999, the number of registered vehicles on the island increased from21,388 to 33,563, a percentage increase of some 56.92%. As a result, there is growing congestion on the roads,resulting in unnecessarily high fuel costs, air quality concerns and increased greenhouse gas emissions from thissector. In an effort to address this problem, Government has increased investments in the Transport andCommunications Sector from EC$134 million for the previous period, to EC$155 million for the 2000 – 2002triennium. In addition, Government has offered incentives to the public transport sector to encourage its furthergrowth.

Saint Lucia’s Initial National Communication 12
National Circumstances Chapter 1

Saint Lucia’s Initial National Communication 13
National Greenhouse Gas Inventory Chapter 2
NATIONAL INVENTORY OF GREENHOUSE GASESFOR ST. LUCIA

Saint Lucia’s Initial National Communication 14
National Greenhouse Gas Inventory Chapter 2
2.1 INTRODUCTION
St. Lucia, a Non - Annex 1 Party to the United Nations Framework Convention on Climate Change (UNFCCC),undertook an Inventory of its Net Anthropogenic Emissions by Sources and Removals by Sinks of GreenhouseGases (GHG’s) not controlled by the Montreal Protocol, to the extent of its capacities and in compliance withArticles 4 and 12 of the UNFCCC. The inventory was conducted in accordance with the Inter-GovernmentalPanel on Climate Change (IPCC) Guidelines of 1996.
This Chapter provides a description of the appropriate methodologies used and an analysis and interpretation ofthe data generated on anthropogenic GHG emissions and sinks, on a sector-by-sector basis, for St. Lucia. Followingon the recommendation of the IPCC Revised (1996) Guidelines and based on the availability of most recentdata, the Reference Year chosen for the Inventory for St. Lucia is 1994.
The Inventory of the following main Greenhouse Gases (GHG’s) was conducted for St. Lucia: Carbon Dioxide(CO
2), Methane (CH
4) and Nitrous Oxide (N
2O). Indirect greenhouse gases that contribute to Tropospheric
Ozone (O3) formation, such as Non-Methane Volatile Organic Compounds (NMVOC), Carbon Monoxide (CO)
and Nitrogen Oxides (NOx) were also included in the inventory.
The IPCC Revised 1996 Guidelines for National Greenhouse Gas Inventories (Volumes 1,2 and 3) together withthe accompanying Software in Microsoft Excel were used as the basis to undertake the necessary calculations onGHG Emissions and Removals.
The GHG Inventory was done on an individual sector basis for the Energy; Industrial Processes; Agriculture;Land Use, Land Use Change and Forestry (LULUCF); and Waste Sectors. The Solvents Sector, for which theIPCC methodology is not yet available, was not done.
In accordance with the Guidelines set out by the IPCC, Carbon Dioxide emissions from International Bunkersand burning of Biomass are not included in the national totals, but are reported separately as Memo Items in theInventory.
For purposes of verification and transparency, the Inventory for St. Lucia includes the completed relevant IPCCWorksheets for all Sectors, in addition to the Summary Report Sheets, used to prepare the Inventory Report(provided as Appendices to this report).
2.2 ENERGY SECTOR
Methodology
Both the aggregate fuels supply-based top-down Reference Approach and the policy-oriented source categoriesbottom-up Sectoral Approach were used to calculate the GHG Inventory for the Energy Sector.
There is no production of primary and/or secondary fossil fuels in St. Lucia. Secondary liquid fuels includinggasoline, jet kerosene, gas oil/diesel, residual (heavy) fuel oil (bunker C) and LPG are imported for localconsumption (See Table 1).
Energy is produced through the combustion of these secondary fuels for use in the power-generating utilities,transport, agriculture/fishing, manufacturing, commercial, residential, tourism and international bunkers sectors.
Local activity data for the fuels imported and supplied were converted from tonnes of oil equivalent (toe) to anappropriate unit so as to facilitate the direct application of the IPCC Conversion Factor (TJ / kt) in order toderive the Apparent Consumption in TJ. In most cases, due to lack of country-specific data, the Default Valuesfor the Conversion, Emission and Carbon Oxidation factors as furnished by the IPCC, when available, were
Saint Lucia’s Initial National Communication 15
National Greenhouse Gas Inventory Chapter 2
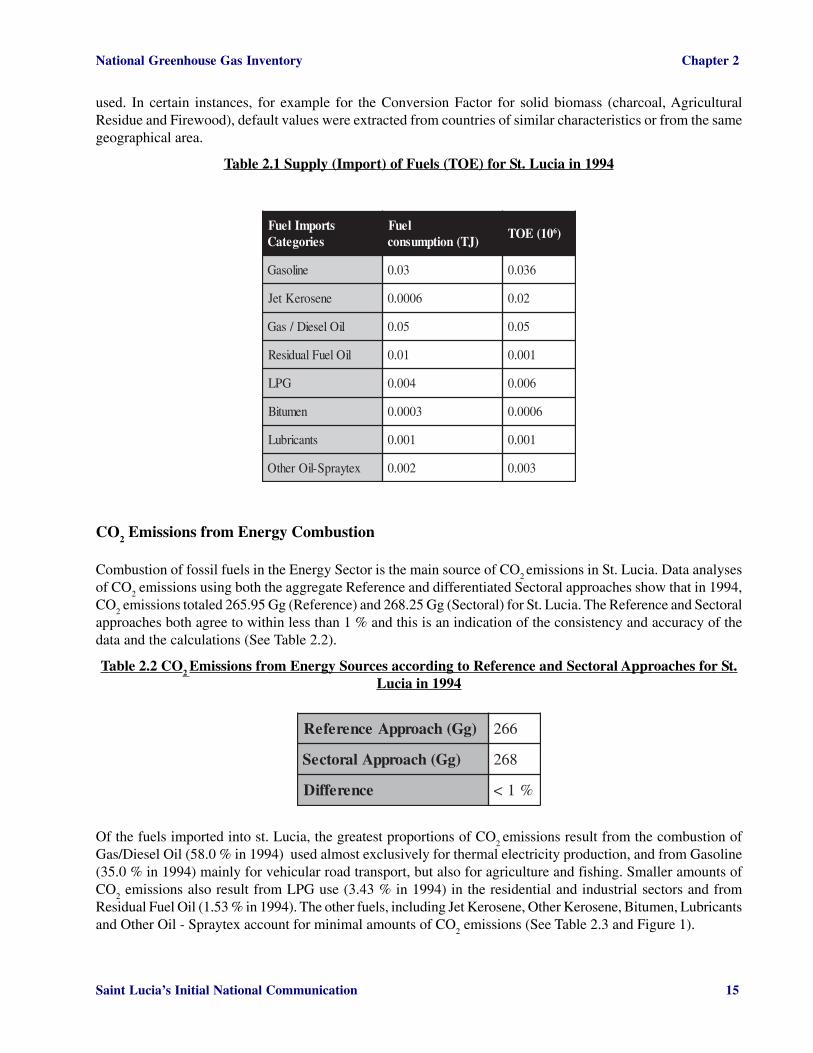
used. In certain instances, for example for the Conversion Factor for solid biomass (charcoal, AgriculturalResidue and Firewood), default values were extracted from countries of similar characteristics or from the samegeographical area.
Table 2.1 Supply (Import) of Fuels (TOE) for St. Lucia in 1994
stropmIleuFseirogetaC
leuF)JT(noitpmusnoc
01(EOT 6)
enilosaG 30.0 630.0
enesoreKteJ 6000.0 20.0
liOleseiD/saG 50.0 50.0
liOleuFlaudiseR 10.0 100.0
GPL 400.0 600.0
nemutiB 3000.0 6000.0
stnacirbuL 100.0 100.0
xetyarpS-liOrehtO 200.0 300.0
CO2 Emissions from Energy Combustion
Combustion of fossil fuels in the Energy Sector is the main source of CO2 emissions in St. Lucia. Data analyses
of CO2 emissions using both the aggregate Reference and differentiated Sectoral approaches show that in 1994,
CO2 emissions totaled 265.95 Gg (Reference) and 268.25 Gg (Sectoral) for St. Lucia. The Reference and Sectoral
approaches both agree to within less than 1 % and this is an indication of the consistency and accuracy of thedata and the calculations (See Table 2.2).
Table 2.2 CO2 Emissions from Energy Sources according to Reference and Sectoral Approaches for St.
Lucia in 1994
)gG(hcaorppAecnerefeR 662
)gG(hcaorppAlarotceS 862
ecnereffiD %1<
Of the fuels imported into st. Lucia, the greatest proportions of CO2 emissions result from the combustion of
Gas/Diesel Oil (58.0 % in 1994) used almost exclusively for thermal electricity production, and from Gasoline(35.0 % in 1994) mainly for vehicular road transport, but also for agriculture and fishing. Smaller amounts ofCO
2 emissions also result from LPG use (3.43 % in 1994) in the residential and industrial sectors and from
Residual Fuel Oil (1.53 % in 1994). The other fuels, including Jet Kerosene, Other Kerosene, Bitumen, Lubricantsand Other Oil - Spraytex account for minimal amounts of CO
2 emissions (See Table 2.3 and Figure 1).

Saint Lucia’s Initial National Communication 16
National Greenhouse Gas Inventory Chapter 2
Table 2.3 CO2 Emissions from Energy Sources and Fuel Combustion Categories
LEUF OCgG 2 %
enilosaG 25,49 53
enesoreKteJ 0 0
enesoreKrehtO 7,1 36,0
liOleseiD/saG 87,651 85
liOleuFlaudiseR 41,4 35,1
GPL 82,9 34,3
nemutiB 73,1 5,0
stnacirbuL 37,1 46,0
xetyarpS-liOrehtO 38,0 13,0
latoT 53,072 001
smetIomeM
sreknuBlanoitanretnI 97,76 4,77
ssamoiBdiloS 49,91 06,22
Figure 2.1 CO2 Emissions (Gg) by Fuel Types for St. Lucia, 1994, Reference Approach.

Saint Lucia’s Initial National Communication 17
National Greenhouse Gas Inventory Chapter 2
Within the Energy Sector, CO2 Emissions from the Energy Industries Sector totaled 121 of CO
2 Gg in 1994,
which accounts for 46 % of the total CO2 emissions. A further 104.66 Gg of CO
2, which represents 39.0 % of
total CO2 emissions in the Energy sector was produced by the Transport and Navigation Sector in 1994. Smaller
amounts of CO2 emissions were derived from the Commercial/Institutional (28.32 Gg: 11 %), Manufacturing
Industries/Construction (6.0 Gg: 2 %), and Residential (5.04 Gg: 2 %) sub-sectors in 1994 (See Table 2.4 andFigures 2.2 and 2.3).
In addition, a further 88 Gg of CO2 was emitted by International Bunkers and Biomass (See Table 2.4 and Figure
2.2).
Table 2. 4. CO2 Emissions by Sub-sectors within the Energy Sector: 1994 (Sectoral Approach)
srotceS 4991
seirtsudnIygrenE.1 121
&seirtsudnIgnirutcafunaM.2noitcurtsnoC
6
noitagivaNdna)daoR(tropsnarT.3 501
noitutitsnIlaicremmoC.4 82
laitnediseR.5 5
)eliboM(gnihsiF;yrtseroF;erutlucirgA.6 1,0
latoT.7 562
:smetIomeM.8ssamoiB/sreknuBlanoitanretnI 88

Saint Lucia’s Initial National Communication 18
National Greenhouse Gas Inventory Chapter 2
Figure 2.2 CO2 Emissions (%) by sub-sector within Energy Sector, including Total and MemoItems, 1994
Figure 2.3 CO2 Emissions (Gg) by Sub-sector within Energy sector excluding Memo Items, 1994

Saint Lucia’s Initial National Communication 19
National Greenhouse Gas Inventory Chapter 2
Non-CO2 Emissions
Non-CO2 emissions of Methane (CH
4), Nitrous Oxide (N
2O), Nitrogen Oxides (NO
x), Non-Methane Volatile
Organic Compounds (NMVOC) and Sulphur Dioxide (SO2) that derive mainly from the Transport, Energy
Industries and the Residential sectors, are relatively small, being equal to or less than 1 Gg (except for NMVOC)for the Energy sector of St. Lucia in 1994 (See Table 2.5).
However, Carbon Monoxide (CO), derived mainly from the Transportation sector is comparatively high, exceeding12 Gg in 1994. Also SO
2 emissions are estimated to be 0.607 Gg in 1994, with the highest emissions coming
from the combustion of Diesel for thermal electricity production (Table 2.5).
Table 2.5 Non- CO2 Emissions (Gg) from Fuel Combustion in Energy Sector
OC-noN 2 sesaGGHG )gG(
HC4
180,0
N2O 300,0
ONX
000,1
OC 900,21
COVMN 000,2
OS2
706.0
2.3 INDUSTRIAL SECTOR
By international standards, St. Lucia does not have a large Manufacturing or Industrial sector so that CO2
emissions from light manufacturing or heavy industries are minimal. The Food and Beverage industry and RoadPaving with Asphalt are the main emitters of GHG’s in the form of NMVOCs and there is no Cement or Limeproduction taking place. The consumption and use of halocarbons for air-conditioning and refrigeration resultsin the release of some HFCs. There are also small emissions of SO
2 from the manufacture of pumice stone.
Methodology
NMVOC emissions derive from bitumen used in road paving asphalt, the manufacture of alcoholic beverages(rum and beer) and from food production (primarily bread and cakes; alcoholic beverages; and margarine andsolid cooking fats)
HFC emissions (also reported under the Montreal Protocol) derive from the import and consumption ofhalocarbons, including leakage and disposal, in refrigeration and air-conditioning activities. SO
2 emissions are
due to the limited production of pumice stone.
All activity data are country-specific and were obtained from the Department of Statistics, Government of St.Lucia. However, all emission factors were taken as Default Values from the IPCC Workbooks.

Saint Lucia’s Initial National Communication 20
National Greenhouse Gas Inventory Chapter 2
NMVOC Emissions
For the Inventory year 1994, NMVOC emissions from Road Paving Asphalt was 1.709 Gg, while from themanufacture of Alcoholic Beverages it was 0.218 Gg and from Food Production it was 0.040 Gg (See Table2.6).
SO2 Emissions
SO2 emissions from the production of pumice Stone were very minimal (0.0000005 Gg) in St. Lucia for 1994
(See Table 2.7).
HFC Emissions
Although not obligatory under the UNFCCC Convention, Halocarbon emissions from HFC consumption andrefrigeration assembly, operation and disposal are reported for 1994 for St. Lucia. Though small, HFC emissionswere mainly due to refrigeration disposal (1.33 Gg) and halocarbon consumption (0.11 Gg) in 1994 (See Table2.8).
Table 2.6 NMVOC emissions (Gg) from the Industrial Sector, 1994.
ytivitcA )gG(snoissimECOVMN
tlahpsAgnivaPdaoR 907.1
segareveBcilohoclA 812.0
noitcudorPdooF 040.0
latoT 769.1
Table 2.7 SO2 emissions (Gg) from the Industrial Sector, 1994.
ytivitcA )gG(snoissimE2OS
enotSecimuPfonoitcudorP 5000000.0
latoT 5000000.0

Saint Lucia’s Initial National Communication 21
National Greenhouse Gas Inventory Chapter 2
Table 2.8 HFC emissions (Gg) from the Industrial Sector, 1994.
ytivitcA )gG(snoissimECFHlautcA
sessoLylbmessAnoitaregirfeR 300000.0
egakaeL-noitarepOnoitaregirfeR 300.0
lasopsiDnoitaregirfeR 33.1
rehsiugnitxEeriF 400000.0
latoT 33.1
ytivitcA )gG(snoissimECFHlaitnetoP
noitpmusnoCnobracolaH 11.0
2.4 AGRICULTURE SECTOR
The agriculture sector of St. Lucia is mainly focused on banana plantations (primarily for export markets) andon vegetable, root and citrus crops mainly for local consumption but also for export.
For the 1994 reference year, Methane (CH4) and Nitrous Oxide (N
2O) are the only perceptible greenhouse gases
emitted by the Agriculture Sector. CH4 emissions are limited to emissions from Enteric Fermentation and Manure
Management from animal stocks, and to small amounts of rice cultivation in flooded fields.
N2O Emissions derive from nitrogen-rich Histosols, fertilizer application to cultivated soils, excretion from
grazing animals, atmospheric deposition of NH3 and NO
x, and from leaching of agricultural soils.
Methodology
Activity data on animal population according to species, on rice cultivation for CH4 and on agricultural soils for
N2O are country-specific and were obtained from the Ministry of Agriculture. However, emission factors for
enteric fermentation and manure management, for rice paddies in the case of CH4, and for soil processes in the
case of N2O, were taken as default values from the IPCC Workbooks. Where this was not possible, as for
instance emission factors for poultry, this was taken from other similar country reports.
CH4 Emissions
In 1994, total annual CH4 emissions from Domestic Livestock amounted to 0.49 Gg, the great majority (91%)
coming from Enteric Fermentation (0.445 Gg), and the remainder coming from manure management (0.45 Gg)(See Table 2.9). Also, rice cultivation in flooded fields contributed an additional minute amount of 0.0008 Gg.
N2O Emissions
Given the small surface area of St. Lucia, it is not surprising that emissions of N2O from agricultural soils are
very small. Total N2O emissions in 1994 were less than 0.1 Gg and most of this came from leaching of agricultural
soils (0.05 Gg) and from the excretions of grazing animals (0.0029 Gg) (See Table 2.10).
No data on the field burning of agricultural residues was available for the Reference Year, 1994. However, basedon local expert judgment, it is believed that this activity is insignificant and that greenhouse gas emissions fromthis agricultural activity would be negligible. St. Lucia has no savannahs and this category was not applicable.

Saint Lucia’s Initial National Communication 22
National Greenhouse Gas Inventory Chapter 2
Table 2.9 CH4 Emissions from Animal Stocks and Rice Cultivation in the Agriculture Sector
ytivitcA )gG(snoissimE4HC
noitatnemreFciretnE 4.0
tnemeganaMerunaM 50.0
noitavitluCeciR 100.0
LATOT 5.0
Table 2.10 N2 O Emissions from Agricultural Soils in the Agriculture Sector
ytivitcA N2 )gG(snoissimEO
sdleiflarutlucirgAfonoitavitluC 20.0
slosotsiHfonoitavitluC 30.0
slaminAgnizarG 300.0
HNfonoitisopeDcirehpsomtA 3 ONdna x 5100.0
LATOT 550.0
2.5 LAND USE, LAND USE CHANGE AND FORESTRY
St. Lucia, being a relatively small island (616 square kilometers), forest cover is of limited extent by globalstandards. Detailed data on Land-Use and Forestry are not available However, available data sets and expertestimations (Forestry Division, Government of St. Lucia) place total forest acreage, that is anthropogenically-impacted at 61,500 hectares, consisting mainly of Other Forests (39,756 hectares) including Mangroves (307.5hectares), Moist Tropical Forests (12,444 hectares) and Seasonal Tropical Forests (8,820 hectares). The numberof Non-Forest Trees could not be accurately estimated given currently available data. However, based on localexpert judgment, changes in these acreages over the last 20 years are not expected to be very substantial.
Methodology
Activity data on Species and Areas (hectares) of forest/biomass stocks, on Annual Growth Rate (t dm/ha) offorests and other trees and savannas and on Commercial Harvest (m3) are country-specific and were obtainedfrom the Forestry Division of the Government of St. Lucia as well as to a limited extent from FAO Statisticaldata. However, Conversion and Emission factors relating to Carbon Fraction, Biomass Conversion/Expansionand Fraction of Biomass Oxidized were taken as Default values from the IPCC Workbooks. Furthermore, wherepublished data was lacking, as for instance fraction of biomass burned on-site and off-site, these were estimatedbased on data from other countries in the region.
CO2 Emissions / Removals
CO2 Emissions and Removals from the Land Use, Land-Use Change and Forestry sector derive primarily from
depletions in forest and other woody biomass stocks through logging and other activities such as charcoal

Saint Lucia’s Initial National Communication 23
National Greenhouse Gas Inventory Chapter 2
manufacture, leading to emissions of CO2; from carbon uptake due to regrowth through conversion of forests
and grasslands; from emissions from forest and grassland conversion due to burning and decay of biomass; andfrom carbon release from forest soils. In recent decades some deforestation has occurred due to the productionof fuel wood constituting emissions from off-site burning.
The data analyzed for St. Lucia for the year 1994 shows a removal of 516.06 Gg of CO2 due to growth Changes
in Forest and Other Woody Biomass Stocks. Because of the lack of reliable data, removal of CO2 due to regrowth
by the Abandonment of Managed Lands is not estimated. Based on local expert judgment, this activity has beenminimal, at least over the last 20 years, and emissions, if any, would be insignificantly small.
On the other hand, Forest and Grassland Conversions account for 68.06 Gg of CO2 emitted through burning and
decay of biomass. A further 95.89 Gg of CO2 were emitted through Carbon Release from Forest Soils.
This results in a Net Removal (Sink) of 352.11 Gg of CO2 from Land Use Change and Forestry in St. Lucia. (See
Table 2.11 and Figure 2.4).
Table 2.11. CO2 Emissions and Removals and Net/Sink (Gg) for Land Use, Land-Use Change andForestry Sector
ytivitcA slavomeR snoissimE kniS/teN
skcotSssamoiBydooWrehtOdnatseroFnisegnahC 60.615- _ _
noisrevnoCdnalssarGdnatseroF _ 60.86 _
sdnaLdeganaMfotnemnodnabAmorfekatpUnobraC _ _ _
slioStseroFmorfesaeleRnobraC 98.59
kniS/ecruoSteN _ _
latoT 60.615- 59.361 11.253-
Non-CO2 Emissions
Because of the relatively limited land area (616 km 2) trace gas emissions of Methane (CH4), Nitrous Oxide
(N2O)
and Nitrogen Oxides (NO
x) due to burning of biomass are negligible and Carbon Monoxide (CO) emissions
are the only ones of any significance being of the order of 2.6 Gg (See Table 2.12)
Table 2.12 Non-CO2 Emissions from the Land Use and Forestry Sector, 1994
SAG )gG(noissimE
HC 4 00792.0
OC 57895.2
N2O 40200.0
ON x 08370.0

Saint Lucia’s Initial National Communication 24
National Greenhouse Gas Inventory Chapter 2
2.6 WASTE SECTOR
In the Waste sector, greenhouse gas emissions are limited to Methane (CH4) from Solid Waste Disposal Sites
(SWDS) and to indirect Nitrous Oxide (N2O) emissions from Human Sewage.
Solid Waste Disposal was limited to two landfills located in the north and south of the island respectively. Alarge part of this waste is buried for decomposition. There are also small, uncontrolled open dumps scattered inthe rural areas but the volumes involved are very small and are therefore not included in the Inventory.
Methodology
Activity data pertaining to Municipal Solid Waste (MSW) disposed to SWDSs are country-specific data obtainedfrom the St. Lucia Solid Waste Management Authority. Per capita waste generation rates were determined basedupon current waste arrivals recorded at the landfill. It was assumed that the waste generation rates would havenot varied significantly between 1994 and 1998. Using waste arrivals at the landfills for 1994 may be fairlyaccurately deduced, or are at worst slightly overestimated. However, the IPCC Default values for MethaneCorrection factor, Fraction of DOC in MSW, Fraction of DOC that degrades and Fraction of Carbon Released asmethane were used for the estimation of Methane emissions from solid waste disposal systems.
CH4 Emissions
Data analyses using the above methodology provide Net Annual Methane Emissions from Solid Waste DisposalSites of 27.79 Gg in 1994 for St. Lucia (see Table 2.13).
Table 2. 13 CH4 and N2O Emissions from the Waste Sector
ytivitcA )gG(snoissimE4HC )gG(snoissimEO2N
dnaLnolasopsiDetsaWdiloS 97.72 -
egaweS - 20.0
Industrial and Domestic Wastewater Handling
Arising out of the small population of the country and the limited number of industries and commercial activities,the treatment and disposal of industrial, commercial and domestic wastewater is comparatively small and withvery limited available data. There is little or no anaerobic treatment of wastewater. Although there are smalltreatment ponds for raw sewage at Castries and at Gros-Islet, no degradable organic carbon is removed assludge. Hence, estimates of Methane emissions from Industrial and Domestic Wastewater for 1994 were notpossible and are not recorded in the Inventory.
In St. Lucia, municipal sewage is generally sent via conduits to the deep ocean. Only parts of St. Lucia, includingthe capital city of Castries and some of the suburban districts receive sewerage treatment services. This isprovided through the only sewerage treatment plant located at Rodney Bay in Gros-Islet in the north of theisland. Sewerage for an estimated 6.3 % of the total population of St. Lucia (estimated at 142,689) is treated atthe Rodney Bay Plant. Out of the remaining 93.7 % of the population, approximately 32.01% are estimated touse septic tanks and the remainder use pit latrines. This data is obtained from the 1994 population census.
Methodology
Nitrous oxide (N2O) emissions from Human Sewage were estimated from country-specific data on Population
and Per Capita Protein Consumption (kg/person/yr) as obtained from the Central Statistics Department,

Saint Lucia’s Initial National Communication 25
National Greenhouse Gas Inventory Chapter 2
Government of St. Lucia.
The IPCC Default factors for Fraction of Nitrogen in Protein and Emission of N2O were used to estimate the
emissions of N2O from Human Sewage.
N2O Emissions
Nitrous Oxide (N2O) emissions in St. Lucia were estimated to be 0.02 Gg in 1994. Thus, N
2O emissions in St.
Lucia are very low (See Table 2.13).
Other sources for this greenhouse gas are from agricultural activities such as synthetic fertilizers usage and fieldburning of crop residues. Organic amendments to soil are done on a very small scale. This is believed to beprimarily related to kitchen gardens so that N
2O emissions from these sources are considered relatively
insignificant.
2.7 MEMO ITEMS
The current IPCC methodology requires that emissions from International Bunkers and Biomass be reportedseparately in the GHG Inventory of a country.
CO2 Emissions from international bunkers
Emissions from international bunkers are limited to emissions from jet kerosene sold to aircrafts that flyinternationally and to marine international bunkers. CO
2 emissions from aviation international bunkers for the
year 1994 were calculated using the IPCC Tier 1 approach. The results are reported in Table 2.3. CO2 emissions
totaling 67.79 Gg of CO2 in 1994, included under Memo Items and not credited to St. Lucia’s emissions of CO
2,
result from the combustion of Jet Kerosene for International Aviation (60.83 Gg in 1994) and of Gasoline forInternational Marine Bunkers (6.96 Gg in 1994)
CO2 emissions from biomass fuels
In St. Lucia biomass fuels that are burned for energy are primarily firewood, charcoal and some agriculturalwaste. Table 2.3 gives total CO
2 emissions from biomass fuels (firewood, charcoal) for 1994 in Gg.
An estimated 19.94 Gg of CO2, also considered as a Memo Item, results from the combustion of Solid Biomass,
namely charcoal firewood and agricultural residue, used primarily for cooking in the residential sector (SeeTable 2.3 and Figure 2.1).
2.8 SOURCES OF UNCERTAINTY
It follows from the above that the calculations of sources and sinks of GHG’s for the different sectors, asdescribed above, necessarily incorporate various levels of uncertainty with respect to the country activity data aswell as the various conversion and emission factors.
Energy Sector
The main source of uncertainty is the partitioning of the total fuels used in the different sub-sectors. Thissomewhat limits the results of the Sectoral Approach. However, for the Reference Approach, where the totalfuels used are lumped together, there is lesser or very little uncertainty. All activity data has been sourced locallyfrom the Government of St. Lucia, which produces the annual energy balance for the island.

Saint Lucia’s Initial National Communication 26
National Greenhouse Gas Inventory Chapter 2
Another source of uncertainty in the Energy Sector, regarding activity data, is with respect to the Memo items.For International Marine Bunkers, for instance, uncertainties exist since the data was partly estimated. Also,country statistics on charcoal and firewood (Biomass) burning were estimated. As for the emission factors forthe various greenhouse gases (CO
2, CH
4, N
2O, NO
x, CO, NMVOC), the IPCC default values (mostly Tier 1)
were used in almost all instances, since country–specific measurements are not available.
Industrial sector
Greenhouse gas emissions in this sector are restricted to NMVOC in the Road Paving and Alcoholic Beveragesand Food Production industries, to SO
2 emissions from the manufacture of pumice stone, and to HFCs emission
from refrigeration and air-conditioning systems. Activity data for these were obtained primarily from theDepartment of Statistics so that uncertainties are minimal. However the NMVOC emission factors are based onthe IPCC default values, which may be somewhat unrepresentative based on the age and condition of the factories.Here again, country specific conversion factors are not available.
Agriculture Sector
Several areas of uncertainty were encountered. Government statistics and expert judgment were used to obtainestimates of some animal populations since existing data did not address all types of livestock. Additionally, nodata was available on the field burning of agricultural residues as this does not occur on any statistically significantscale, being used only in certain households as fuel. Consequently this activity was not recorded.
Land Use, Land Use Change and Forestry
There are a number of uncertainties relating to greenhouse gas emissions and removals in this sector. There wasa difficulty in assessing the fraction of the forested area which was anthropogenically impacted. In St. Lucia,selective logging is done mainly for lumber and charcoal production. As a result determining the actual areadisturbed from logging operation was somewhat difficult. There was also a lack of data on the number of non-forested trees. This category of forest represents a significant area of the island, but could not be captured dueto lack of data.
With regards to emission and conversion factors, the IPCC default values were used. Given the very generalnature of these default values, country-specific values such as annual growth rate of forests may be quite differentand this could mean significant uncertainty in the GHG emissions and removals calculations for this sector.
Data on abandonment of managed lands was not available. However, initial assessment based largely on expertjudgement indicates that this will be insignificant. Hence, it was not considered in the inventory.
Waste Sector
The methodology utilizes population statistics for urban areas and this was used in the calculation of CH4
emissions from solid waste disposal sites. Under worksheet 6-1C (Supplement) default values for MethaneCorrection Factor were used. Regarding the continued use of some illegal dump sites it was estimated that thepercentage of waste reaching the official landfill is approximately 80%-85%. The percentage error in thisapproximation may be as high as ±10%. There is also high uncertainty since the actual amount of waste depositedin disposal sites was not used because there was no data available.
In the case of N2O emissions from human sewage, the IPCC default values were used. This may not be applicable
to St. Lucia and is a source of uncertainty. Also, the per capita protein consumption value used was derived fromDepartment of Statistics “Crude Estimates of Food Availability”, and this could also be a source of uncertainty.

Saint Lucia’s Initial National Communication 27
National Greenhouse Gas Inventory Chapter 2
Furthermore, although there are both domestic and industrial sources of wastewater in St. Lucia, CH4 emissions
were not calculated because there is no anaerobic treatment of wastewater.
Summary of Uncertainties
In summary, the GHG emissions and removals for St. Lucia for the different sectors were calculated usingavailable data and expert judgment. However, it must be cautioned that there are uncertainties in these estimatesand the degree of uncertainty varies between sectors with the highest levels of certainty being in the EnergySector. Strengthening data collection capacities through technical cooperation and exchange will be an importantrequirement in enabling St Lucia to more accurately meet it’s future obligations under Articles 4 and 12 of theUNFCCC.
2.9 SUMMARY OF EMISSIONS AND REMOVALS
A Short Summary of the major Emissions by Sources and Removals by Sinks on a sector-by-sector basis for St.Lucia for the Reference year 1994 is provided in Table 2.14 and Figures 2.4 and 2.5.
Table 2.14. CO2 Emissions and Removals by Sector
seirogetaCkniSdnaecruoSsaGesuohneerG OC 2 )gG(snoissimE/ OC 2 )gG(slavomeR/
ygrenE 862 0
sessecorPlairtsudnI 0 0
erutlucirgA 0 0
yrtseroFdnaegnahCesU-dnaL 461 605-
etsaW 0 0
slavomeRdnasnoissimElanoitaNlatoT 234 605-
smetIomeM
sreknuBlanoitanretnI 86 0
0C2
ssamoiBmorfsnoissimE 02 0

Saint Lucia’s Initial National Communication 28
National Greenhouse Gas Inventory Chapter 2
Figure 2.4 CO2 Emissions and Removals (Gg) by sectors
IT IS EVIDENT THAT THE MAJOR SOURCE OF CO2 emissions is from the Energy sector (268 Gg),
which accounts for virtually all of the net CO2 emissions.
The Land Use and Forestry sector, which is also responsible for some amount of CO2 emissions, through Forest
and Grassland Conversion (68.06 Gg) and Carbon Release from Forest Soils (95.89), is a Net Sink with Netremovals amounting to 352.11 Gg. Removals of CO
2 due to Growth Changes in Forest and Other Woody
Biomass Stock equaled 516.06 Gg of CO2 and this was the major contributing factor to overall net removals (See
Table 2.14 and Figure 2.4).
Also Memo Items, namely International Aviation and Marine Bunkers (68.0 Gg CO2) and Burning of Biomass
(charcoal) (20.0 Gg CO2) account for further CO
2 emissions although not regarded as a part of the total national
GHG emissions and removals.
Non- CO2 Emissions Emissions/Removals
Comparatively smaller amounts of Non-CO2 greenhouse gases were emitted or removed in St. Lucia for the year
1994 (See Table 2.15 and Figure 2.5).
CH4 emissions, which totaled 28.67 Gg, derived mainly from Landfills in the Waste Sector (27.8Gg CH
4) and
from Enteric Fermentation and Manure Management (0.3 Gg CH4) from the Agriculture Sector (See Table 2.15
and Figure2.5).

Saint Lucia’s Initial National Communication 29
National Greenhouse Gas Inventory Chapter 2
N2O emissions on the other hand are mainly restricted to emissions from Agricultural Soils in the Agriculture
sector (0.048 Gg N2O) and from Human Sewage (0.18 Gg N
2O) in the Waste Sector (See Table 2.15 and Figure
2.5).
NOx emissions derived almost exclusively from the Energy Sector, as emissions in the Transport sub-sector (See
Table 2.15 and Figure 2.5).
Similarly CO emissions derived mainly from the Energy Sector from Transport vehicles (12.0 Gg CO) and to alesser extent from Forest Conversion (2.6 Gg CO) in the Land Use and Forestry sector (See Table 15 and Figure2.5).
NMVOC emissions derive mainly from Road-Paving Asphalt and the Food and Beverage industries in theIndustrial sector (2.11 Gg NMVOC) and from Fuel Combustion (1.96 Gg NMVOC) in the Energy sector (SeeTable 2.15 and Figure 2.5).
The only other significant GHG in St. Lucia in 1990 was SO2 (2.83 Gg), which was emitted through the combustion
of Gas/Diesel Oil, Residual Fuel Oil and Gasoline in the Energy sector (See Table 2.15 and Figure 2.5).
Finally, HFCs were emitted exclusively from the Industrial Sector (1.44 Gg HFCs) in the Refrigeration and Air-conditioning industries (See Table 15 and Figure 5).
Table 2.15 Non- CO2 Emissions and Removals by Sector (Gg)
seirogetaCkniSdnaecruoSsaGesuohneerG HC 4 N2O ON x OC COVMN OS 2 CFH s
ygrenE 1,0 300,0 1 21 2 3 0
sessecorPlairtsudnI 0 0 0 0 2 0 1
erutlucirgA 5,0 50,0 0 0 0 0 0
yrtseroFdnaegnahCesU-dnaL 3,0 200,0 1,0 3 0 0 0
etsaW 82 20,0 0 0 0 0 0
snoissimElanoitaNteN 92 70,0 1 51 4 3 1
smetIomeM
sreknuBlanoitanretnI 0 0 0 0 0 0
0C 2 ssamoiBmorfsnoissimE 0 0 0 0 0 0
Table 2.16. Non- CO2 Emissions and Removals by Sector (Global Warming Potential)
seirogetaCkniSdnaecruoSsaGesuohneerG HC 4 N2O sCFH
ygrenE 1,2 39,0 0
sessecorPlairtsudnI 0 0 0071
erutlucirgA 5,01 5,51 0
yrtseroFdnaegnahCesU-dnaL 3,6 26,0 0
etsaW 885 2.6 0
snoissimElanoitaNteN 906 7,12 0071

Saint Lucia’s Initial National Communication 30
National Greenhouse Gas Inventory Chapter 2
Figure 2.5 Non- CO2 Emissions and Removals by Sectors
2.10 RECOMMENDATIONS
Based on the experiences of the preparation of the initial GHG inventory for St. Lucia, there is a need for futureefforts to focus on training, research and data collection activities. There is the need for strengthening localcapacity to undertake future inventory compilations. Also, there is need for research in such areas as forestspecies coverage, using remote sensing and GIS tools and methods.
There is also the need to establish institutional focal points for coordinating inventory preparation and for datacollection at the sectoral level, particularly for non-energy sectors where important gaps remain in certain areas.However, the most pressing need is for obtaining local data on emission factors in the various sectors.

Saint Lucia’s Initial National Communication 31
National Climate Change Mitigation Study Chapter 3
NATIONAL CLIMATE CHANGE MITIGATION STUDYFOR ST. LUCIA MEASURES AND POLICIES

Saint Lucia’s Initial National Communication 32
National Climate Change Mitigation Study Chapter 3
3.1 INTRODUCTION
Article 2 of the UNFCCC establishes that the ultimate objective of the treaty is the “stabilization of greenhousegas concentrations … at a level that would prevent dangerous anthropogenic interference with the climatesystem”. Among the guiding principles to achieve this objective is that Parties to the Convention should “takeprecautionary measures to anticipate, prevent or minimize the causes of climate change.” At the same time theUNFCCC recognizes in its preamble that emissions of greenhouse gases from developing country parties, suchas St Lucia, will necessarily grow as these countries embark on measures to meet their social and developmentneeds. This is reinforced in Article 4.7 which recognizes that the extent to which developing country parties areable to meet their commitments under the UNFCCC will be dependent on a number of factors including thetransfer of technology, and that the “first and overriding priorities” of developing countries will be the attainmentof sustainable development.
The sources of greenhouse gases are intimately linked to economic sectors and activities. In St Lucia emissionsof greenhouse gases stem primarily from electricity generation and vehicular transportation, as well as smalleramounts originating from changes in land use, agricultural production and waste management, with sinks beingthe islands forestry and other biomass resources as well as its ocean space.
Most developed country parties to the UNFCCC have now developed climate change mitigation strategies. Inmany instances, however, developing countries are also implementing measures that, while designed primarilyfor purposes of advancing sustainable economic and social development, also contribute towards the goal ofreducing emissions of greenhouse gases. This has been the case in St Lucia where a series of measures andinitiatives have been implemented, or are planned, for promoting sustainable development which also serve toreduce emissions of greenhouse gases and to protect and enhance sinks.
3.2. PRESENT PATTERNS OF ENERGY USE
The GHG Inventory establishes the dominant share of the energy (particularly electricity) sector in contributingto St Lucia’s greenhouse gas emissions. At present the principal source of these emissions emanates from thegeneration of electric power for use in the country’s residential, tourism, industrial and commercial sectors. Forits electricity, Saint Lucia relies on an installed capacity of 66.4 megawatts (MW) derived from three diesel-powered generating plants. Table 1 below illustrates existing consumption according to the major end-users.
Table 3.1 Sectoral Consumption of Electricity in Saint Lucia, 1995-1999
RAEY9991 8991 7991 6991 5991
hWM % hWM % hwM % hWM % hWM %
esUcitsemoD 194,97 %68.63 93657 %40.83 716,96 %15.83 356,56 %47.93 866,26 %73.83
esUletoH&laicremmoC 826,021 %39.55 816801 %36.45 842,79 %08.35 815,68 %73.25 386,58 %64.25
esUlairtsudnI 172,21 %96.5 04611 %58.5 782,11 %42.6 068,01 %75.6 796,21 %77.7
gnithgiLteertS 172,3 %25.1 1392 %74.1 506,2 %44.1 581,2 %23.1 282,2 %04.1
SELASLATOT 166,512 %001 828,891 %001 757,081 %001 612,561 %001 033,361 %001

Saint Lucia’s Initial National Communication 33
National Climate Change Mitigation Study Chapter 3
Growth in the Saint Lucian economy, driven largely by growth in the tourism sector, is resulting in a 4.31%annual net increase in demand for electrical power. As a consequence official projections from LUCELEC, thenational utility responsible for electricity generation, transmission, and distribution, forecast the need for anadditional 33.3MW in generating capacity over the next 10 years if the nation is to have adequate energy to meetfuture demands.
One of the principal concerns relates to ensuring the availability of commercial energy supplies at reasonablecosts while minimizing environmental costs. This is particularly important since St Lucia, like most Caribbeanisland States, is a relatively high cost electricity producer reflecting the lack of economies of scale and theproportionately high costs imposed by the islands topographic conditions. The significance of maintainingreasonable costs of electricity production is especially critical given the need for the country to remain competitivewith other international tourism destinations, and with other industrial and agricultural producers.
In terms of availability of supplies, St Lucia like most small island developing States is presently dependent onimported fuels for the overwhelming majority of its energy supplies. This makes it important that the countryseek as far as possible to sustainably develop it’s national energy capabilities and resources if it is to aim towardsa greater measure of control over vital energy inputs into its social and economic development.
Another area of primary concern is to ensure that energy production, distribution and consumption do not contributeto environmental degradation. This is important given the country’s small size and its dependence on themaintenance of its natural resources for economic growth and development, particularly in the vital tourism andagricultural sectors.
A particular set of concerns in St Lucia relates to the growth of emissions emanating from the transport sector –the country’s second principal source of greenhouse gas emissions. Growth in this sector has been especiallyrapid, responding to an overall increase in levels of disposable income as the economy has expanded basedlargely on growth in the tourism and agricultural sectors. As the IPCC has noted in its report on technologytransfer, the transportation sector presents special challenges for climate change mitigation arising out of itsdependence on fossil fuels and the unique role that transport plays in satisfying various personal, social, economicand developmental goals. In the case of small island developing countries like St Lucia, an additional complicatingfactor is the virtually total dependence on imported technologies for satisfying commercial transportationrequirements.
Growth in St Lucia’s transport sector, and the accompanying increase in GHG emissions, while perhaps aninevitable feature of present patterns of economic development, has not however come without costs. In particularthere has been an increasing outflow of financial resources to purchase imported vehicles, fuels and other requiredinputs. Other costs include lost productivity brought about by the ever-increasing traffic congestion on St Lucia’sroad network; and increasing problems of pollution associated with disposal of waste oils, old vehicles and othercomponents.
Based on present patterns of consumption as well as projections for future population and economic growth, thefollowing energy sector baseline has been developed by the Ministry of Planning and other stakeholders in StLucia for the energy sector through to 2010.
• Current installed capacity of 66.4MW with a peak demand of 43 MW, with the average base load at26.6 MW. All installed capacity is derived from diesel-powered generators.
• Installed capacity in 2005 will be 79MW (21.3 MW additional diesel-powered generating capacity);peak demand in 2005 will be 53.6 MW.
• Installed capacity in 2010 will be 91 MW (33.3 MW additional diesel-powered generating capacity);peak demand in 2010 will be 65.6 MW.

Saint Lucia’s Initial National Communication 34
National Climate Change Mitigation Study Chapter 3
• Universal electricity coverage of the residential sector will be achieved by the year 2002. Electricityis currently available to approximately 98% of commercial and residential properties in the country.
• Current greenhouse gas emissions (GHG) from the electricity sector are 156,530 tons of Carbon.
• The projected GHG emissions from the sector in 2005 are 188,860 tons of carbon.
• The projected GHG emissions from the electricity sector in 2010 are 230,060 tons of carbon. In 1999,82,214 barrels of diesel and 338,454 barrels of gasoline were consumed in the transport sector by afleet of 33,563 vehicles. In 2010, 128 916.7 barrels of diesel and 643 130.7 barrels gasoline will beconsumed by a fleet of 60,575 vehicles (no alternative-fueled vehicles are assumed for this baselinefigure).
3.3 SUSTAINABLE ENERGY DEVELOPMENT PLAN
In response to the various concerns for development and management of the energy sector the Government of StLucia has developed a Sustainable Energy Plan in conjunction with national, regional and international partners.Goals and objectives of the Plan, which hinges on the need for sustainability:
• Reducing projected electricity demand by 5% by 2005, resulting in a peak demand in 2005 of 51 MW,which will require an installed capacity of 75MW.
• Reduce projected electricity demand by 15% in 2010, resulting in a peak demand in 2010 of 55.7MW, which will require an installed capacity of 77.4 MW.
• Deliver 5MW, or 7% of installed capacity, via renewable energy technologies by 2005.
• Deliver 17MW, or 20% of installed capacity, via renewable energy technologies by 2010.
• As a result of reductions in demand and increased use of renewable energy resources, reduce theannual consumption of diesel fuel for electricity generation to 436,579 barrels in 2005 (12% reductionfrom the baseline) and 392,823 barrels in 2010 (35 % reduction from the baseline.
• Reduction of annual GHG emissions from the electricity sector to 166,197 tons of carbon by 2005 and149,539 tons of carbon by 2010.
• Reducing the consumption of gasoline and diesel fuel in the transportation sector to 122,471 barrelsof diesel and 610 974 barrels of gasoline by 2005 (5% reduction) and 109,579 barrels of diesel and546 661 barrels of gasoline (15% reduction) by 2010. These reductions are to be achieved by acombination of measures, including the increased use of public transportation, the introduction ofhigh-efficiency vehicles, the deployment of a limited number of vehicles powered by alternative fuels,driver education and awareness to reduce fuel consumption, and improvements in road and trafficmanagement.
In order to achieve these targets a number of research, policy and regulatory initiatives will be required. In manyinstances opportunities exist for strengthening collaboration with international funding and technical assistanceagencies. Among the measures to be undertaken are:
a. Renewable Energy Resource Assessment
While considerable work has already been completed in identifying and assessing the potential for new andrenewable energy development – particularly for geothermal energy resources – there is a need for additionalassessment of these resources if they are to be commercially viable and be able to contribute towards the goals

Saint Lucia’s Initial National Communication 35
National Climate Change Mitigation Study Chapter 3
of greater sustainability of energy supply and use. In particular, additional site-specific assessments will benecessary in anticipation of locating new and renewable energy resources with the potential for commercialexploitation. In the area of wind-resource assessments, for example, both national wind mapping and site-specific monitoring activities are needed. The aim is the development of a data-base of renewable energy resourcesin St Lucia as an investment tool for enabling private and public sector investments especially with regard towind, solar, biomass, geothermal, and mini-hydro sources of new and renewable energy.
b. Assessment of Energy Efficiency and Conservation Opportunities
Based on initial assessments, present patterns of electricity usage, particularly in the residential, tourism andcommercial sectors would appear to have the potential for fairly substantial improvements in energy efficiencyand conservation. In this regard an analysis/survey of the market potential for energy efficiency measures is alsoproposed. This will review generation and consumption patterns throughout the country and in each of the keysectors. These analyses will be used in the design of appropriate energy-efficiency measures and in efforts toattract entrepreneurial initiatives focused on energy savings. One possible element of this is the encouragementof support for establishment of Energy Service Companies (ESCOs) within the private sector and possibly evenwithin the electric utility, for advancing commercially based initiatives for advancing electricity conservation.
c. Reform of the Electricity Sector
Many of the initiatives for improving the sustainability of energy use will require reform of the present institutionalstructures for electricity production and distribution in St Lucia. . A particular area of concern relates to theexisting monopoly role of the electric utility which has often historically served as a barrier to utilization ofrenewable energy. Experience internationally has demonstrated that in some instances independent powerproducers with experience in renewable energy may be better suited to develop these resources. Therefore,policies and regulations that permit and encourage Independent Power Producers (IPPs) will be developed.Scope would also appear to exist for co-generation and the Government of Saint Lucia is also desirous ofexploring financially viable options and policies that permit private sector entities to generate their own electricitywhile still maintaining continuous link to the power grid. This policy may also include a mechanism thatpermits self-generators to sell excess capacity back to the utility.
d. Capacity Building for Sustainable Energy
A number of measures will be needed to build the capacity of various stakeholders, within the electricity utilityand at a wider level, to promote the use of new and renewable energy as well as for improving energy efficiency.It is recognized that among the principal impediments to the widespread use of renewable-energy technologiesis the limited capacity of key decision makers and technicians. In addition, utility officials and engineers oftenlack the technical information necessary to select, develop and use sustainable energy options within theirsystem. The aim is therefore to establish a comprehensive energy training initiative with the purpose of increasingthe capacity to develop and utilize these systems among the utility staff and potential project developers. It isenvisaged that this effort will be conducted in cooperation with the Caribbean Electric Corporation (CARILEC)as well as with other regional and international initiatives such as the Caribbean Renewable Energy DevelopmentProject (CREDP), an ongoing regional energy project receiving support from the Global Environment Facility(GEF).
e. Public Awareness
Central to the efforts to advance promotion and use of sustainable energy will be the need to improve awarenessof the general public as to the opportunities that exist for achieving cost savings and environmental benefitsfrom greater efficiency in energy use and from switching to already commercially available technologies such as

Saint Lucia’s Initial National Communication 36
National Climate Change Mitigation Study Chapter 3
solar (and to a lesser extent wind and photovoltaics). For example effective demand side management (DSM)programs in the electricity sector require well-designed and targeted campaigns that communicate to the populationthe need for, and potential benefits from, reducing consumption. In this regard the Government of St Luciaproposes the establishment of a comprehensive and integrated public awareness program for sustainable energythat seeks to advance in a holistic manner the need for integrating sustainable energy management into energyusage throughout the various sectors of the economy.
f. Establishment of a Renewable-Energy Feasibility and Project Investment Fund
It is recognized that the initial costs of investments in renewable-energy technologies, coupled with the perceivedrisks of their use, often make it difficult for project developers to attract financing. This situation often presentsitself in the preparatory phases of the potential project (i.e., pre-feasibility and feasibility studies), but may alsoinclude project financing for well-designed, commercially viable projects. Thus, it is critical to make fundsavailable for investment in sound renewable-energy project opportunities: such funds would be targeted atcatalyzing additional resources and serving as seed capital for viable ventures. In this regard the Government ofSaint Lucia proposes to take the lead in the creation of a dedicated renewable energy fund. This fund would beaimed at providing concessionary financing for renewable energy project feasibility studies and for projectinvestment. The Government of Saint Lucia will seek funds from several institutions, including the CREDP, theWorld Bank’s Prototype Carbon Fund, and international investors and donors to catalyze this financing.
g. Promotion of Solar Energy
St. Lucia’s abundant solar energy resources offer tremendous potential for various applications particularlysolar water-heating. The country already enjoys a relatively high usage of solar water heaters spurred bytechnological improvements, the commercial availability of the systems and the removal of import duties andconsumption taxes. An additional impetus to utilization has been the decision by the Government of St Lucia inApril 2001 to allow the cost of solar water heaters to be charged against taxable income. This measure isexpected to further promote their use. Given the relatively high cost of electricity in Saint Lucia there are clearpossibilities for enhancing the use of solar water heaters in the tourism, residential and commercial sectors: adevelopment that would facilitate reductions in foreign exchange leakage, slow the growth of electrical energydemand and contribute to the goal of reducing growth in GHG emissions
Similarly solar Photovoltaic (PV) systems would appear to offer advantages for a diverse set of applications.With the price of the technology falling and improvements in efficiencies and end-uses the Government of StLucia views the increased use of PV technologies as a cost-effective alternative in several areas. The use of PVtechnology in demonstration applications such as government buildings and institutions is seen as an opportunityto introduce the nation to the demands and the potential of these units. In other instances, such as hurricaneshelters, PV offers an immediate benefit as a reliable back-up power source. If applied to hurricane shelters,many of which are located in schools or other public buildings, then the systems will offer the opportunity tointroduce these systems to school children via educational programs.
h. Establishment of Guidelines for Energy Efficient Practices in Government Buildings
The Government of St Lucia intends to take an active role as a catalyst for sustainable energy use through theestablishment of standards for energy efficient practices in government buildings. This is seen as having at leasttwo principal benefits. Firstly, given the considerable number of government offices and institutions, reducingenergy conservation in this sector can contribute to an overall national reduction in energy use. Secondly, theGovernment will serve as an example to other sectors in the economy by adopting energy efficiency practices. Itis intended to implement a variety of energy efficiency practices, including the use of energy efficient lightingand other appliances, training and implementation of energy conservation practices, and improvements in the

Saint Lucia’s Initial National Communication 37
National Climate Change Mitigation Study Chapter 3
design of new buildings so as to make them more energy efficient. Specifically it is intended to conduct anassessment of the potential for energy efficiency practices in all Government buildings. Based on this assessment,efforts will be initiated to develop standard manuals for use by government agencies describing recommendedand/or required practices for existing and new buildings and equipment
i. Improved Efficiencies in the Transport Sector
As noted earlier a significant and growing proportion of the GHG emissions produced in St Lucia is generatedby the transportation sector, in addition to having other adverse economic and environmental impacts. At presentthe vehicle fleet operates exclusively on imported gasoline and diesel fuels. Identifying alternatives to thesevehicles could significantly reduce transportation related environmental impacts as well as restricting increasesin GHG emissions. Against this background the Government of St Lucia intends to initiate efforts to put in placea demonstration fleet of alternative-fueled vehicles. Vehicles operating on alternative fuels are increasinglybecoming commercially available particularly electric-powered vehicles and electric/gasoline hybrids. In viewof the size of the island St Lucia offers an ideal location for demonstration of such vehicles, since one of thelimiting factors of such vehicles has traditionally been their range. Other alternatives such as compressednatural gas (CNG) or biofuels would also appear to offer attractive long-term solutions, but will generallyrequire more substantial and costly infrastructure.
As part of its initiative to transform the country’s energy sector the Government of St Lucia is desirous ofcooperating with international private and public sector agencies in investigating sustainable options for ademonstration fleet of alternative fueled vehicles.
It is also intended to establish regulations promoting the increased use of higher efficiency vehicles includingfor public transportation. This is consistent with the Governments aim of promoting greater use of low costpublic transport, an objective recently pursued through reductions in import duties on approved public servicevehicles. Government also intends to set standards for exhaust emissions for all vehicles, including those usedfor public transportation, in an effort to improve air quality while at the same time reduce emissions of pollutingGHG’s.
j. Development of a Portfolio of Sustainable Energy Projects
Implicit to all the initiatives for the promotion of sustainable energy development in St Lucia is the need forpreparation of a detailed integrated national Portfolio of Sustainable Energy Projects. This will guide sectorallevel action and provide a policy blueprint for advancing the objectives of the Sustainable Energy Plan. Amongthe objectives of the Portfolio will be to provide prospective investors with a clear framework for identifyingareas for investment, allow for the integration of ongoing regional and international projects such as the CaribbeanRenewable Energy Development Project (CREDP), and clearly establish institutional roles and responsibilities.
Given present national capacity constraints opportunities exist for support from appropriate regional andinternational agencies to contribute towards the development and financing of the Portfolio.
Saint Lucia’s Initial National Communication 38
National Climate Change Mitigation Study Chapter 3
3.4 SUSTAINABLE FORESTRY MANAGEMENT
St. Lucia’s forests act as a reserve for the storage of carbon in live and dead vegetation and in forest soils. Afterdiscounting CO
2 emissions due to forest and grassland conversion (68.06 Gg) and carbon release from forest
soils (95.89 Gg), 1994 net CO2 removal by regrowing forests that were anthropogenically impacted amounted
to 352 Gg, . In addition over 10 % of St. Lucia’s non-CO2 emissions originate from the land use and forestry
sector. Mitigation of net GHG emissions from forests and forest soils in St. Lucia should therefore be focused onmethods aimed at reducing emissions and enhancing carbon uptake while also contributing towards wider socio-economic and environmental protection goals and objectives.
St Lucia’s forestry resources constitutes a rich resource of terrestrial biodiversity that in addition to its importantroles as a watershed, habitat for a variety of forms of flora and fauna, and as an eco-tourism resource, is also asink for GHGs. Notwithstanding fairly extensive socio-economic pressures towards deforestation the Governmentof St Lucia has embarked on a number of measures aimed at the sustainable use and protection of this invaluableresource.
As a part of its commitments under the United Nations Convention on Biological Diversity (CBD) the Governmentof St Lucia has prepared a national Biodiversity Strategy and Action Plan (NBSAP) one of the goals of which isto provide an overall framework for the protection of forestry ecosystems in terrestrial and coastal environments.The NBSAP has been developed following an intensive period of consultations with stakeholders at community,sectoral and national levels as well as involving inputs from various regional and international agencies active inSt Lucia. Generally the NBSAP can be seen as providing an opportunity for enhancing management of theisland’s forestry resources through such measures as strengthened forestry legislation, community participationin forest management, in situ and ex situ conservation and public awareness. The Government of St Lucia hasalready officially adopted the NBSAP, paving the way for attracting local and foreign technical and financialresources towards projects aimed at achieving the CBD’s goal of an ecosystem approach to management of theislands forestry resources.
The adoption of the NBSAP follows a number of other policies and measures to achieve improved managementof the forestry sector. These center around institutional strengthening of the Forestry Department of the Ministryof Agriculture which, since the early 1980’s, has been actively involved in a number of efforts to protect theislands forests through various cooperation activities with local, regional and international partner agencies.These activities have included the mapping and delimitation of forest reserves, greater enforcement of existingforest legislation and regulations, and an extensive public awareness programme targeted at a range of stakeholders.One of the most innovative and successful thrusts has been directed towards increasing community participationin the management and sustainable use of forest resources most notably through eco-tourism activities thatactively involve local communities in maintaining and utilizing the forests for nature tourism related activitiesin an environmentally sustainable and economically productive manner.
The overall outcome of these various policies and measures has been to reduce the levels of deforestationthroughout the islands protected forests although pressures still exist for non-sustainable exploitation of theseresources most notably for agricultural and residential development.

Saint Lucia’s Initial National Communication 39
National Climate Change Mitigation Study Chapter 3
3.5 AGRICULTURE
The UNFCCC requires that the international community make efforts to stabilize GHG emissions at sustainablelevels. This presents challenges for St Lucia’s small but crucial agricultural sector, which must support anexpanding population, while adapting to expected adverse anthropogenic impacts on the sector, and while alsotaking efforts to minimize its share of the contribution to global GHG emissions.
Currently, CO2 emissions in the agriculture sector are largely due to the use of machinery for cultivation practices
such as tillage, harvest and irrigation water application. Among the options that St. Lucia may use to reduce CO2
emissions in the short to medium term are: altering tillage practices so as to reduce N2O emissions from soils;
using alternative energy sources where feasible, such as the use of solar energy for drying of crops, to limit CO2
emissions; and by improving efficiency of energy use in the agriculture sector.
In the longer term, CO2 emissions from agriculture in St. Lucia may also be reduced through the substitution of
fossil fuels by less carbon-intensive bio-fuels such as ethanol. Similarly, longer term CO2 mitigation in agriculture
can be achieved by creating and strengthening carbon sinks and through implementation of measures to promotecarbon storage in managed soils.
CH4 emissions in the agriculture sector of St. Lucia in 1994 are mainly attributable to enteric fermentation of
animals and manure management and to limited rice cultivation. Technologies that may be used to mitigate CH4
emissions from agriculture in St. Lucia include shifts in cultivation techniques (such as the use of mineral asopposed to organic fertilizers), and the development and use of hybrids.
Significantly, it is recognized that while initiatives in agriculture can contribute to the goals of the UNFCCC,these can only do so in a partial way, particularly for small, vulnerable countries like St Lucia. Estimates offuture global emissions of GHG from agriculture pale in comparison to those projected from energy use, andefforts to address reductions or enhance sinks in the agriculture sector, should be fully complimentary to widergoals for sustainable agricultural development. In St Lucia’s case this means that GHG mitigation initiatives inthe agricultural sector should be supportive of attempts to promote agricultural self-sufficiency, contribute toexport earnings, reduce food imports, and improve nutritional levels. Importantly, Non-annex 1 countries like StLucia, need to ensure that these measures are economically viable, and do not impose adverse non-sustainablelong term financial and environmental costs.
Opportunities exist for regional and international cooperation to advance technology transfer, as well as financialand technical support that will be necessary for enabling St. Lucia and other non-annex 1 parties to the UNFCCC,to adopt pathways to sustainable agricultural development that also fully incorporate GHG mitigation measures.
3.6 IMPROVED WASTE MANAGEMENT
In St Lucia the main GHG emissions from the waste sector emanate from CH4 emissions from solid waste
disposal, industrial, commercial and domestic wastewater treatment, as well as from N2O emissions from human
sewage. For 1994, the most important GHG in this sector was CH4 (1.20 Gg) from solid waste disposal sites that
accounted for over 97 % of St. Lucia’s emissions of this gas. N2O emissions (0.05 Gg) from human sewage were
small, although amounting to over 25 % of St. Lucia’s emissions.
Traditionally effective solid and liquid waste management in St Lucia has been confronted by a number ofbarriers including lack of a sanitary landfill disposal site, ever growing volumes of waste, and inadequate publicawareness of the health and environmental risks associated with improper disposal.

Saint Lucia’s Initial National Communication 40
National Climate Change Mitigation Study Chapter 3
Since the mid 1990’s St Lucia along with a number of other eastern Caribbean States has participated in a WorldBank/Global Environment Facility funded project aimed at enhancing the country’s solid waste managementcapabilities. Arising from this project, modern and efficient solid waste collection and disposal systems havebeen instituted. The two existing waste disposal sites have been upgraded from open dumps to engineeredlandfills and construction of a modern sanitary landfill for the north of the island has begun in the Deglos Valleywhile a site is currently being sought for the construction of a sanitary landfill to serve the south of the island. Inaddition to the provision of hardware and engineering solutions the project also provides resources for publicawareness and institutional strengthening
The country has also since the mid 1990’succesfully introduced measures to upgrade liquid waste collectionparticularly in the heavily populated north of the island. The net effect has been to reduce the problems ofcoastal pollution traditionally associated with improper liquid waste disposal. This will also contribute towardswider global commitments to reduce levels of GHGs arising from the waste sector.
3.7 CONCLUSION
As a Non-Annex 1 Party to the UNFCCC, St Lucia has committed itself to the ultimate objective of the treaty asdefined in Article 2 which calls for the stabilization of GHG emissions at levels that would not result in dangerousanthropogenic interference with the global climate system. At the same time as a developing country confrontingthe challenges of poverty eradication, socio-economic progress, and environmental sustainability the country’sdevelopment agenda is necessarily also focused on measures aimed at pursuing sustainable human development.
In this regard, climate change mitigation efforts in St Lucia will need to revolve around a series of inter-relatedinitiatives that encompass capacity building, technology transfer, and technical support for sustainable energydevelopment and management. The role of the international community will be particularly instrumental inproviding the technical and financial resources necessary for a successful transition to a sustainable energyfuture. This will complement the substantial efforts already being taken by St Lucia to promote sustainableenergy solutions, improve agricultural productivity, advance forestry protection, and minimize coastal and marineresource degradation resulting from non-sustainable waste management activities.
Particular opportunities for international and regional cooperation and support already exist and there is the nowthe need for implementation of the various mechanisms and modalities envisaged under the UNFCCC and theKyoto Protocol – special recognition of the needs of Non Annex 1 countries (Articles 4.8 and 4.9), transfer oftechnology, Clean Development Mechanism, Joint Implementation etc – that will be necessary for translatinginto even more meaningful measures, the important initial actions already being taken by the Government andpeople of St Lucia.
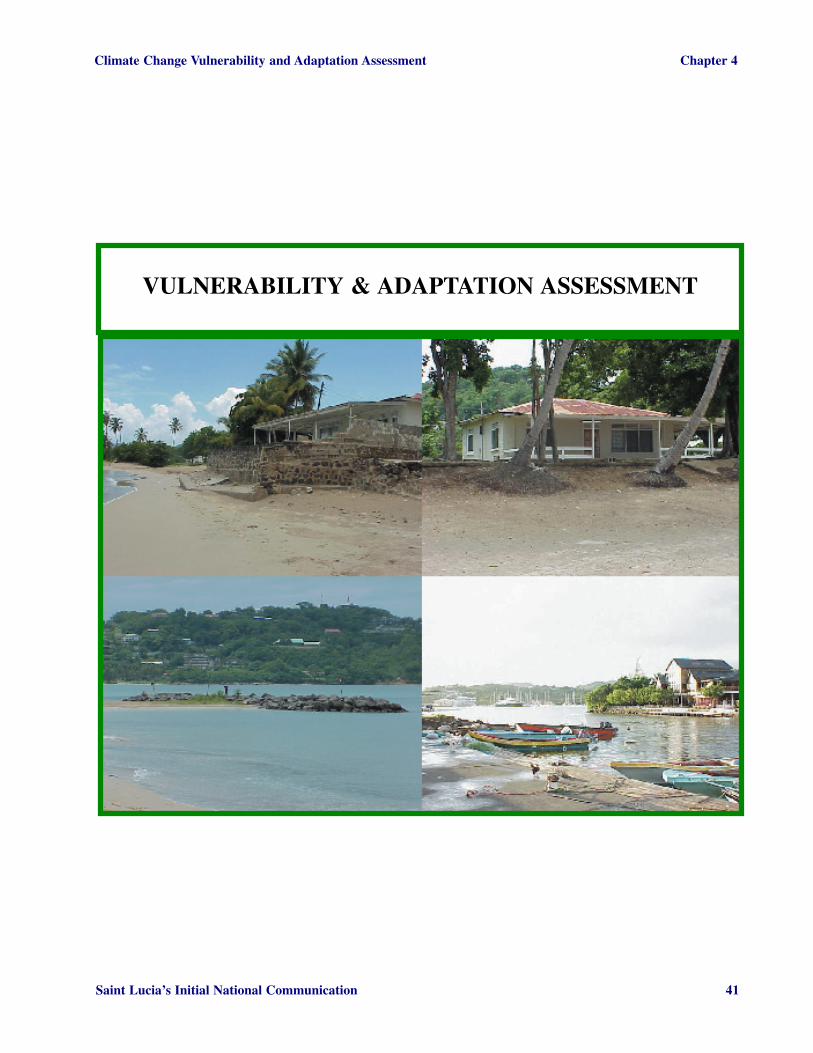
Saint Lucia’s Initial National Communication 41
Climate Change Vulnerability and Adaptation Assessment Chapter 4
VULNERABILITY & ADAPTATION ASSESSMENT

Saint Lucia’s Initial National Communication 42
Climate Change Vulnerability and Adaptation Assessment Chapter 4
4.1 INTRODUCTION
St. Lucia experiences the effects of climate variability as manifested in flooding and drought conditions, as wellas extreme weather events in the form of hurricanes and other tropical cyclonic activities. While St Lucia has nothad any direct hits from hurricanes since Hurricane Allen in 1980, the country experienced Tropical StormDebbie in 1994, with some stations recording 300 mm of rainfall in a 24-hour period. Hurricane Lenny, in 1999,also had significant impacts, primarily in the coastal environment, even though the storm remained hundreds ofmiles away from St Lucia. The question of whether recent enhanced storm activity can be attributed toanthropogenic climate change, or considered part of natural cycles of storm and climate variability, remainsinconclusive. This is however expected to be one of the impacts of climate change in the Caribbean under IPCCprojections (IPCC, 1995).
Climate change studies generally base their analysis on records with a baseline of thirty years, often using theperiod 1960 – 1990 as the baseline. The time period covered by existing meteorological data for St. Luciatherefore does not provide sufficient data for arriving at any definitive trends in terms of changes in climate orweather patterns.
The situation with respect to sea-level rise also indicates that many areas of the insular Caribbean have experiencedcoastal erosion at levels above the global average. Regionally, relative sea levels have been recorded as rising atan average of 3mm per year but with considerable variability (Hendry, in Maul 1993). The causes of suchvariability remain an area for further assessment 1 .
4.2 CLIMATE CHANGE SCENARIOS FOR ST. LUCIA
In order to assess the impacts of climate change, it is necessary to obtain a quantitative and/or qualitativerepresentation of what the changes in climate are likely to be. Given the complexities of the global climatesystem, no methods yet exist for providing watertight predictions of climate change. Instead, it is normal toutilize a number of climate scenarios selected to provide climatic projections that are plausible and which canform a scientific, comparable and transparent basis for projecting the likely impacts of changes in the Earth’sclimate.
For the temperature and rainfall climate parameters, three scenarios are utilized – high, medium and low. Thelow scenarios are estimates based on projections for GHG emissions and include the cooling influence of aerosolson the atmosphere. The medium case scenarios represent projections for global climate change without theinfluence of aerosols. The high case scenarios provide synthetic estimates.
The third and fourth scenarios are seasonal estimates for temperature and rainfall for 2050. In these cases onlyhigh and low forecasts are used.
For the sea-level rise parameter, three scenarios are used. These are for low, medium and high GHG emissionsgrowth rates to 2050 and are based on estimates from the Hadley Center in the United Kingdom. In the case ofthe tropical storm/hurricane parameter, simple synthetic estimates for increased frequency and intensity of theseevents are used as tools for sensitivity analysis.
The following six scenarios for climate change are used in the assessment:
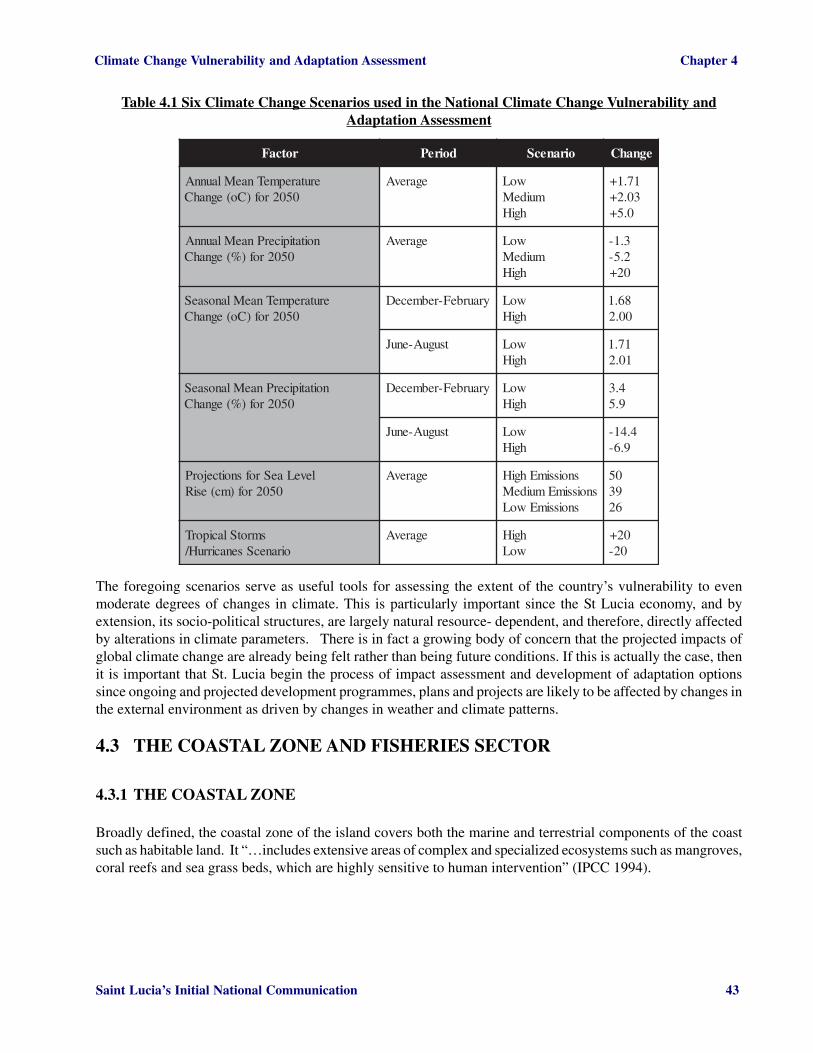
Saint Lucia’s Initial National Communication 43
Climate Change Vulnerability and Adaptation Assessment Chapter 4
Table 4.1 Six Climate Change Scenarios used in the National Climate Change Vulnerability andAdaptation Assessment
rotcaF doireP oiranecS egnahC
erutarepmeTnaeMlaunnA0502rof)Co(egnahC
egarevA woLmuideM
hgiH
17.1+30.2+
0.5+
noitatipicerPnaeMlaunnA0502rof)%(egnahC
egarevA woLmuideM
hgiH
3.1-2.5-02+
erutarepmeTnaeMlanosaeS0502rof)Co(egnahC
yraurbeF-rebmeceD woLhgiH
86.100.2
tsuguA-enuJ woLhgiH
17.110.2
noitatipicerPnaeMlanosaeS0502rof)%(egnahC
yraurbeF-rebmeceD woLhgiH
4.39.5
tsuguA-enuJ woLhgiH
4.41-9.6-
leveLaeSrofsnoitcejorP0502rof)mc(esiR
egarevA snoissimEhgiHsnoissimEmuideM
snoissimEwoL
059362
smrotSlaciporToiranecSsenacirruH/
egarevA hgiHwoL
02+02-
The foregoing scenarios serve as useful tools for assessing the extent of the country’s vulnerability to evenmoderate degrees of changes in climate. This is particularly important since the St Lucia economy, and byextension, its socio-political structures, are largely natural resource- dependent, and therefore, directly affectedby alterations in climate parameters. There is in fact a growing body of concern that the projected impacts ofglobal climate change are already being felt rather than being future conditions. If this is actually the case, thenit is important that St. Lucia begin the process of impact assessment and development of adaptation optionssince ongoing and projected development programmes, plans and projects are likely to be affected by changes inthe external environment as driven by changes in weather and climate patterns.
4.3 THE COASTAL ZONE AND FISHERIES SECTOR
4.3.1 THE COASTAL ZONE
Broadly defined, the coastal zone of the island covers both the marine and terrestrial components of the coastsuch as habitable land. It “…includes extensive areas of complex and specialized ecosystems such as mangroves,coral reefs and sea grass beds, which are highly sensitive to human intervention” (IPCC 1994).
Saint Lucia’s Initial National Communication 44
Climate Change Vulnerability and Adaptation Assessment Chapter 4
Like many other Small Island Developing States (SIDS), the coastal zone of St. Lucia is characterized by a richdiversity of ecosystems that have become interwoven into the fabric of the socio-economic existence of itspopulation. In addition to providing a livelihood, the coastal zone has been the focal point for settlement,transport and communication and has been actively modified over time to reflect the population’s changingcustoms, traditions and socio-economic aspirations.
In the context of climate change, the main environmental components of the coastal zone, which are likely to beunder threat from climate change impacts in St. Lucia are beaches, coral reefs, mangals and the diverse specieswhich occupy these coastal habitats. The degree of climate change impacts on the coastal zone will however bedetermined by the existing condition of the resource base and by the degree of stress to which it has alreadybeing subjected. These stresses include both the major non-human causes of stress such as storm surges associatedwith tropical cyclones and also the human induced stresses such as the pollution of rivers and the fouling ofcoastal areas that result in the degradation of the coastal resources. These actions produce adverse impacts onthe ecosystems on which the human populations depend and seriously reduce the ability of these ecosystems toadapt to the effects of climate change.
4.3.2 CRITICAL HABITATS OF THE COASTAL ZONE
Beaches are important to St. Lucia for several reasons. They serve as: recreational areas for both locals andvisitors, buffer zones protecting the coastal land and infrastructure from wave action; they provide sources offine aggregate for construction; fish landing sites and habitats for some types of terrestrial and marine life. Theyare also an important component of the tourism package. The island’s beaches are however being degradedthrough activities such as excessive sand mining and through development on beaches and nearshore areas.
Mangals provide important fishery and avifauna habitats but this fact has not discouraged deforestation fordevelopmental purposes. Such destruction has been due largely to the fact that many of these systems arelocated on lands under private ownership and to the fact that there is a general absence of legal demarcation ofMarine Reserves islandwide.
Coral reefs play a vital role in coastal stability and serve as fish breeding and nursery grounds, avifauna habitat,silt traps and nutrient exporters. However, coral reefs and sea grass beds (and subsequently nearshore fisheries)also face threats from nutrient loading and other types of chemical pollution resulting from land and water basedactivities, such as agriculture and fishing and tourism related activities including diving and snorkeling.
4.3.3 THE FISHERIES SECTOR
In 1999, there were approximately two thousand (2000) fishermen, two-thirds of whom were employed on afull-time basis in the industry. The main fish processing facility is the St. Lucia Fish Marketing Corporationbased in Castries. There are also three (3) other recently established operations, all privately owned and operatingin the north of the island. Most fish landing sites are located on the west coast of the island. In recent times,there has been significant investment in the construction of landing sites that are equipped with concrete landingdocks, vending stalls, cold storage facilities, fishermen’s storage cubicles and public bathrooms. Over the lastten years, approximately US$16 million has been invested in the construction of such facilities. Investmentshave also been made in training fishermen in new and more efficient methods of fishing.
In recent years there has been a steady increase in fish production. This has been attributed to a number offactors including:
Saint Lucia’s Initial National Communication 45
Climate Change Vulnerability and Adaptation Assessment Chapter 4
• An increase in the number of fishers in the industry;• An increase in the number of fish craft;• Larger fishing vessels;• More efficient fishing gear and methods.
4.3.4 FISHERIES RESOURCES OF ST. LUCIA
The coastal waters provide a habitat for many different types of fish. Shallow shelf and reef fish are foundconcentrated on fringing and patch reef systems as well as within seagrass beds and mangroves. Deep slope andbank fish are found on the island’s shelf, along its slopes and/or deep banks located in the north-west, north-eastand southern sections of the island. Coastal pelagics are captured primarily in the calm waters of the island’swest coast. Large pelagics contribute almost 70% of total fish landings and thus represent a significant componentof the island’s fishery resources. The coastal waters are home to variety of crustaceans including lobsters.Exploitation of mollusks focuses mainly on the harvesting of conch (Strombus gigas).
Some of the critical habitats (such as the coral reefs and the mangals) of the coastal zone described above areimportant fisheries ecosystems. Other important fisheries ecosystems are the seabed and the open ocean. Dueto a number of reasons including over-fishing, habitat degradation, environmental stress impacting on age ofmaturity, spawning frequency and success, fry production and survival, resistance to disease and other possiblebiological conditions, some fish species have been identified as being under threat of population collapse.
4.3.5 POTENTIAL IMPACTS ON THE COASTAL ZONE AND THE FISHERIES SECTOR
Tables 4-2 to 4-4 below summarize the potential impacts of climate change on the critical habitats of the coastalzone, on the fisheries sector and outline some of the implications of these impacts for St. Lucia.

Saint Lucia’s Initial National Communication 46
Climate Change Vulnerability and Adaptation Assessment Chapter 4
Table 4.2 Anticipated Impacts on Beaches
stcapmI snoitacilpmInoitacoL/aerA
tcapmItsetaerGfo
yalplliwytivitcacinolcyclaciporThcaebdeunitnocnielorrojama
ehtniseilaicuL.tSsanoitcurtsed.tlebenacirruh
· dnassolhcaeb,noisorehcaeBoteudnoitategevlatsaocfossol
gnitlusernoitadnunidnanoisorelaciportdnaesirlevelaesmorf
·.ytivitcacinolcyc
· .noiterccahcaeB
dnarotisivrofsehcaeblanoitaercerfossoL.esulacol
.sehcaebfolaeppacitehtseadecudeR
msiruotrojamafoytilauqehtninoitcudeR.tcudorp
dnadetcetorpnudnadesopxeenilerohSmrotstneuqesbusotelbarenluvylgnisaercni
.stneve
enozreffubehtfolavomerronoitcudeRmorferutcurtsarfnidnadnallatsaocgnitcetorp
.noitcaevaw
.erutcurtsarfnilatsaocotegamaD
rehtodnamsiruotnitnemtsevniotevitnecnisiD.tnempolevedlatsaocfosepyt
rofetagerggaeniffosecruosfossoL.noitcurtsnoc
dnasetisgnidnalhsiflacitircfonoitcurtseDeniramdnalairtserretfosepytemosrofstatibah
.efil
llamsfodoohilevilehtdnaemocnifossoL.nemrehsif
seitreporplatsaocfossolrootegamaD.kcotsgnisuohgnidulcni
otsnoitacoledisllihnossertsgnisaercnIlatsaocfo.g.enoitacoleretadommocca
.stnediser
ehtrosehcaebgnitsixefotnemecnahnE.saerahcaebwenfonoitaerc
ehtylralucitrap,tsaoctsewehTehterehwnoitcesnretsewhtron
enogrednusahepacsdnallanigirofotluserasaegnahcdipar
lanoitaercer,tnempolevedmsiruothcusseitivitcarehtodnaseitivitca
.gninimdnassa
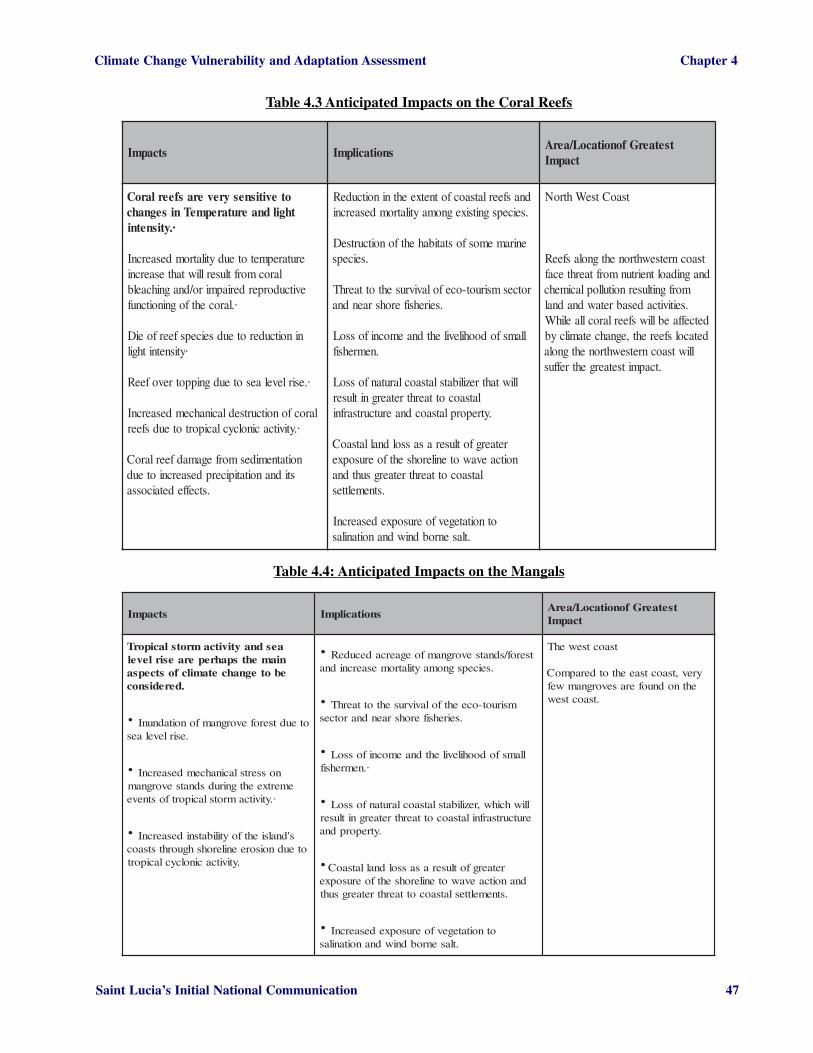
Saint Lucia’s Initial National Communication 47
Climate Change Vulnerability and Adaptation Assessment Chapter 4
Table 4.3 Anticipated Impacts on the Coral Reefs
stcapmI snoitacilpmItsetaerGfonoitacoL/aerA
tcapmI
otevitisnesyreverasfeerlaroCthgildnaerutarepmeTnisegnahc
·.ytisnetni
erutarepmetoteudytilatromdesaercnIlarocmorftluserlliwtahtesaercni
evitcudorperderiapmiro/dnagnihcaelb·.larocehtfogninoitcnuf
ninoitcuderoteudseicepsfeerfoeiD·ytisnetnithgil
·.esirlevelaesoteudgnippotrevofeeR
larocfonoitcurtsedlacinahcemdesaercnI·.ytivitcacinolcyclaciportoteudsfeer
noitatnemidesmorfegamadfeerlaroCstidnanoitatipicerpdesaercnioteud
.stceffedetaicossa
dnasfeerlatsaocfotnetxeehtninoitcudeR.seicepsgnitsixegnomaytilatromdesaercni
eniramemosfostatibahehtfonoitcurtseD.seiceps
rotcesmsiruot-ocefolavivrusehtottaerhT.seirehsiferohsraendna
llamsfodoohilevilehtdnaemocnifossoL.nemrehsif
lliwtahtrezilibatslatsaoclarutanfossoLlatsaocottaerhtretaergnitluser
.ytreporplatsaocdnaerutcurtsarfni
retaergfotluserasassoldnallatsaoCnoitcaevawotenilerohsehtfoerusopxe
latsaocottaerhtretaergsuhtdna.stnemelttes
otnoitategevfoerusopxedesaercnI.tlasenrobdniwdnanoitanilas
tsaoCtseWhtroN
tsaocnretsewhtronehtgnolasfeeRdnagnidaoltneirtunmorftaerhtecaf
morfgnitlusernoitulloplacimehc.seitivitcadesabretawdnadnal
detceffaeblliwsfeerlarocllaelihWdetacolsfeereht,egnahcetamilcyb
lliwtsaocnretsewhtronehtgnola.tcapmitsetaergehtreffus
Table 4.4: Anticipated Impacts on the Mangals
stcapmI snoitacilpmItsetaerGfonoitacoL/aerA
tcapmI
aesdnaytivitcamrotslaciporTniamehtspahreperaesirlevelebotegnahcetamilcfostcepsa
.deredisnoc
· oteudtserofevorgnamfonoitadnunI.esirlevelaes
· nossertslacinahcemdesaercnIemertxeehtgnirudsdnatsevorgnam
·.ytivitcamrotslaciportfostneve
· s'dnalsiehtfoytilibatsnidesaercnIoteudnoisoreenilerohshguorhtstsaoc
.ytivitcacinolcyclaciport
· tserof/sdnatsevorgnamfoegaercadecudeR.seicepsgnomaytilatromesaercnidna
· msiruot-oceehtfolavivrusehtottaerhT.seirehsiferohsraendnarotces
· llamsfodoohilevilehtdnaemocnifossoL·.nemrehsif
· lliwhcihw,rezilibatslatsaoclarutanfossoLerutcurtsarfnilatsaocottaerhtretaergnitluser
.ytreporpdna
· retaergfotluserasassoldnallatsaoCdnanoitcaevawotenilerohsehtfoerusopxe
.stnemeltteslatsaocottaerhtretaergsuht
· otnoitategevfoerusopxedesaercnI.tlasenrobdniwdnanoitanilas
tsaoctsewehT
yrev,tsaoctsaeehtotderapmoCehtnodnuoferasevorgnamwef
.tsaoctsew

Saint Lucia’s Initial National Communication 48
Climate Change Vulnerability and Adaptation Assessment Chapter 4
4.4 FORESTRY AND TERRESTRIAL RESOURCES
4.4.1FOREST RESOURCES
St. Lucia covers a total area of 61,500 hectares of which forest covers 23,157 hectares (16,621 rainforest, 7,515dry scrub forest, 2,666 in grass and open woodland). The Forest Reserve consists of 7,500 hectares of which6,607 hectares compose the natural forest and 263 hectares are under plantation. 1560 hectares of Crown Landsare under natural habitats. There is a 4,500-hectare parrot sanctuary (95% of which is within the GovernmentForest Reserve). Forested private lands (14,170 hectares) represent 10% of total private land.
Natural vegetation types consist of rainforest dominated by Gommier (Dacryodes excelsa) and Sloanea caribea),lower montane forest, elfin woodland or cloud forest, xerophytic forest and dry scrub woodland. There are 37main watersheds corresponding to 37 main watercourses, each of the former being at various states of utilizationand degradation.
4.4.2 FOREST UTILIZATION
Most of the timber felled on the island occurs on private lands and is used for construction and charcoal production.Non-timber forest products include Latanier (Cocothrinax barbadensis) for broom production, L’encens (Protiumattenuatum) for incense production and bamboo (Bambusa vulgaris) in the construction industry. A variety oftrees are produced to meet a range of needs such as windbreaks, agroforestry production, fencing and riverbankprotection. The interest in the islands natural forest resources has grown to include ecotourism activities astourists visit the island’s natural areas. Forest tours have increased with the opening of new trails, generating thelargest share of revenue for the Forestry Department.
4.4.3 SOCIO-ECONOMIC ISSUES
It is recognized that climate change impact will not occur in isolation but rather its effects will be influenced byother existing environmental conditions. Traditional sectors (e.g. agriculture, and manufacturing) have alreadyimposed severe environmental strains on natural ecosystems. Conservation problems are heightened by thedifficulty of differentiating climate change impacts from other stress related environmental stresses such ashabitat decline, forest fragmentation, introduction of alien species and loss in community diversity. St. Lucia hasalso suffered from the lack of an appropriate land use policy. Problems such as lack of proof of ownership; theabsence of an integrated system of planning, inadequate legislation to control land development and an inadequatecapacity to monitor development and limited ability to ensure compliance. Watershed protection and managementwas the leading concern in the establishment of Forest Reserves, while, tropical dry forest was perceived to beof relatively minor importance and is currently undergoing rapid deforestation.
4.4.4 CLIMATE CHANGE IMPACTS
The range of natural life zones occurring in St. Lucia displays a heterogeneity and rich diversity typical of thetropics. Under the climate change scenarios, particularly projections of reduced rainfall and increased temperatures,such diversity is expected to be lost as homogeneity in habitats increases. This may be expected as areas ofcurrent microclimatic conditions are lost and large-scale ecosystem shifts occur. Given the projections of reducedrainfall and increasing temperatures, drought could become a more ominous feature in the future, particularly asthe very dry forest to dry forest life zone expands.

Saint Lucia’s Initial National Communication 49
Climate Change Vulnerability and Adaptation Assessment Chapter 4
Figure 4.1 Climate Change Impact Life Zones in Saint Lucia
Table 4.6 Anticipated Impacts on Forestry and Terrestrial Resources
STCAPMI SNOITACILPMI
:rotcaFegnahCetamilC noitatipicerP
· retawfosemertxeoteudtseroffoenilceddipaR.)thguordrognidoolf.e.i(ytilibaliava
· senoztserofyrdlaciportehtniesaercnilaitnatsbuS,senoztserofniarlaciportbusfossolehthtiwdetaicossa
desaercnihtiwdenibmocllafniardesaercedoteud)evobaspameeS(.erutarepmet
· lacihpargoegehtninoitaretlarostatibahfonoitcurtseD.anuafdnaarolffostatibahehtfotnetxe
dnanoitubirtsid,ezisnoitalupopseicepsnisnoitaretlA.noitisopmoc
ylralucitrap,ytisrevidoibstidnatserofniarfossollaitnetoPdnaemocnifossoltneserperlliw,seicepscimednehcihw,seitinummocdnaslaudividniroftnemyolpme
oteuneverfosessolyltneuqesnocdnamsiruotnodnepedehtdnayrtsudnimsiruoteht,rotcesmsiruot-oceeht
.larenegniymonoce
noitcetorplarutanehteroferehtdnarevoctseroffossoLnoisoreliostsniaga
retawninoitcuderecnehdnasdehsretawfonoitadargeD.ytilauqdnaylppus
dnasegallivotnisirbedfonoitisopeddnanoitatropsnarT*smetsyseganiardfognikcolbehtotgnidaelsnwot
:rotcaFegnahCetamilC erutarepmeT
· efildliwdnanoitategevfoytilibarenluvdesaercniehT.snegohtapdnatsepfoecnedicnidesaercniehtoteud
· seriftseroffoytisnetnidnaycneuqerfdesaercnI
.*tpecxeevobasaemaS

Saint Lucia’s Initial National Communication 50
Climate Change Vulnerability and Adaptation Assessment Chapter 4
Table 4.6 Anticipated Impacts on Forestry and Terrestrial Resources (Cont’d)
STCAPMI SNOITACILPMI
:rotcaFegnahCetamilC ytivitcAcinolcyClaciporT
· lliwhcihw,sdniwgnortsybnoitategevotegamaDtatibahdnaanuaffossolnitluser
· tserofniarnierutcurtsarfnimsiruototegamaD
· noitategevfossoloteudsaeradehsretawotegamaD.revoc
oceehtybdetarenegeuneverehtnisnoitcudertnacifingiSrotcesmsiruot
larutanehteroferehtdnarevoctseroffossolemoSnoisoreliostsniaganoitcetorp
dnasekatniretawotegamad,sdehsretawfonoitadargeD.ytilauqdnaylppusretawninoitcuderecneh
ytisrevidoibtseroffossollaitnetoP
:rotcaFegnahCetamilC esiRleveLaeS
· tserofdnalnirofdetapicitnastaerhttceridoN
· gnisaercnidnanoitadnunioteudstseroflatsaocfossoLstnevemrots
· deretlamorfseicepsefildliwfossolronoitargiMstatibah
tserofdnalninoerusserpdesaercnimorfstaerhttceridnIdnaerutlucirga,tnemelttesrofdnaledivorpotsevreserottsolsidnallatsaocnehwtnempolevedfosmrofrehto
.noitadnunidnanoisore
.ytisrevidoibtseroffossollaitnetoP
4.4.5 SPECIFIC IMPACTS ON WILDLIFE HABITATS/ECOSYSTEMS
St. Lucia is home to several endemic species, many of which are habitat specialists. The degree of specializationcan create problems for species that cannot adapt to changes provoked by climate change. In coming decades, aspressure on the remaining habitats increases and they decline due to fragmentation, the impacts of climatechange is expected to exacerbate the situation. The possible impacts of climate change on forests and terrestrialecosystems can be summarized as follows:
� The faster the rate of climatic change, the higher the probability of substantial disruption of ecosystemstructure and function.
� Ecosystems will not react uniformly in response to climate change. Existing species associations willbreak up and new communities of plants and animals will take their place.
� Ecosystem response to climate change will depend largely on competition between species. In manycases, species such as pests, parasites, and opportunists will benefit.
� Ecosystems already stressed by human activities will be more vulnerable to climatic threats; however, themultiple factors affecting these ecosystems will complicate the identification of strictly climatic effects.
� Species’ adaptive abilities depend not only on genetic variability but also on dispersal and migrationcapacity. Ecosystem resilience and genetic variability being reduced through habitat fragmentation willbe aggravated by climate change.

Saint Lucia’s Initial National Communication 51
Climate Change Vulnerability and Adaptation Assessment Chapter 4
4.5 FRESHWATER RESOURCES
Access to safe and adequate supplies of freshwater is a most basic human need and is a sine qua non for sustainablenational development. St. Lucia is a volcanic island, and geologically is composed of impermeable rock whichdoes not readily permit the movement of water into underground reserves. Water reserves therefore occur assurface run-off and are located in rivers, wetlands, streams and springs.
There are thirty- seven (37) main sources of surface run-off and few groundwater sources. Where the latter dooccur, they are used primarily for irrigation. Surface water catchments are relatively small, with steep slopes onwhich run-off occurs fairly quickly, and are decreasing in volume due to over-exploitation and chemicalcontamination. They are heavily exploited for municipal and agricultural purposes.
Freshwater supplies are highly susceptible to normal climate variability such as natural disasters. During the dryseason, water levels fall drastically, while in periods of heavy rainfall, rivers quickly overflow their banks.Watercourses are also prone to siltation during heavy rainfall. Human activities currently affecting water qualityin St. Lucia’s rivers and freshwater systems include those arising from: housing, agriculture, Water abstraction,sewage disposal, solid waste disposal, tourism, fishing, river sand mining, manufacturing, river bathing andpicnicking, and river alteration.
Table 4.7 Anticipated Impacts on the Fresh Water Resources
STCAPMI SNOITACILPMI
:rotcaFegnahCetamilC esiRleveLaeS
· tlasfonoisurtniehtetatipicerpyamesirlevelaeS -wolniylralucitrap,sesnelretawhserfotniretaw
.saeralatsaocgniyl
enilas,aicuL.tSniretawdnuorgfoesuelttilsierehtelihWlaitnetopfoytilauqdnaytitnauqehtecuderlliwsnoisurtni
.retawelbatopfoecruos
sporcyortsednetfotsomlliwretawhsikcarbhtiwnoitagirrI.sliosniurdna
:rotcaFegnahCetamilC ytivitcAmrotSlaciporT
· citauqagnitsixefonoitacifidomro/dnanoitcurtseD dnaycneuqerfdesaercniehtybdesuacsmetsysoce
.noitatipicerpfoytisnetni
.ylppusretawniesaercniyraropmeT
· ffonurecafrusdesaercnimorfgnitlusernoisorelioS .sliosdesopxeno
gnivaelsriovreserdnasmad,sekatniretawotegamaD.ytilauqretawroopgnidivorproretawtuohtiwstnemelttes
· fosdoirepgnirudsmetsysrevirfonoitatliS .llafniardesaercni
esehttahterusneottsoccimonocednalaicosdesaercnI.deniatniameraseitilicaf
anuafdnaarolffoseicepsfostatibahehtfonoitadargeDfossolaotgnidael,smetsysocecitauqaehtypuccohcihw
.ytisrevidoib

Saint Lucia’s Initial National Communication 52
Climate Change Vulnerability and Adaptation Assessment Chapter 4
Table 4.7 Anticipated Impacts on the Fresh Water Resources (Cont’d)
STCAPMI SNOITACILPMI
:rotcaFegnahCetamilC noitatipicerP
:noitatipicerpdesaerceD retawnisesaercedotgnidaelthguordfosdoirepdednetxE.esurehtodnacitsemodrofylppus
· ebotylekileranoitatipicerpwolfosdoireP.sdoirepyrddednetxeybdeinapmocca
yamserotsretawniarezimixamyllamronohwsremusnoCteemotretawdetaertfonoitpmusnocesaercniotdeen
.sdeencitsemod
dnaegatsawegaruocsidotsetarretawfonoitaveleehTyrassecenrehtonaebyamnoitcudorpfoycneicifferetaerg
.noitpo
:noitatipicerpfoytisnetnI&ycneuqerfdesaercnI .ylppusretawniesaercniyraropmeT
· citauqagnitsixefonoitacifidomro/dnanoitcurtseD.smetsysoce
ro/dnasriovreserdnasmad,sekatniretawotegamaDretawtuohtiwstnemelttesgnivaelsecruosretawfonoitullop
.ytilauqretawroopgnidivorpro
· .smetsysrevirfonoitatliS esehttahterusneottsoccimonocednalaicosdesaercnI
.deniatniameraseitilicaf
· .gnidoolffoecnedicnidesaercnI
,anuafdnaarolffoseicepsfostatibahehtfonoitadargeDfossolaotgnidaelsmetsysocecitauqaehtypuccohcihw
.ytisrevidoib
· morfnoitanimatnocssorcfodoohilekilehT sesaercnisnialpdoolfotnisenirtaltipfognihcael
.gnidoolfgnirud
sporcdnakcotsevilfossoL
foytinilasehtecuderlliwswolftuoretawhserfdesaercnIsfeerlarocsa,seirehsifrofsecneuqesnochtiwsretawlatsaoc
lamronriehttroppusregnolonsdebssargaesdna.ytisrevidoib
:rotcaFegnahCetamilC erutarepmeT
· noitaripsnart-opaveevissecxefoytilibissoPsesaercnierutarepmetfolevelehthtiwdetaicossa
.oiranecsnoitatipicerphgihehtfo
.noitcudorpporcnotcapmilliwhcihw,erutsiomliosfossoL
· rehgihsaesaercniotylekilerasdnamedlapicinuM .noitpmusnocretawdesaercniotdaelserutarepmet
sretemaraplacisyhpoibehtretlayamswolflasabgnildniwD,selcycgnideerbtceffaotyltneiciffussdnaltewdnasrevirfollarevodnalavivrusgnirpsffo,ytidnuceftnerapdnagnirpsffoesaesidsahcussessertslatnemnorivneotecnatsiserseiceps
.troffegnihsifdna

Saint Lucia’s Initial National Communication 53
Climate Change Vulnerability and Adaptation Assessment Chapter 4
4.6 HUMAN SETTLEMENTS, HUMAN HEALTH AND SERVICES
4.6.1 HUMAN SETTLEMENTS
All major settlements in St. Lucia are located along the coast and typically in valleys at the mouth of rivers,which make these settlements particularly vulnerable to flooding. Approximately fifty percent (50%) of theentire population resides within the Castries/Gros-Islet corridor located along the north-western coast of theisland. Much of the capital, Castries, is built on low-lying reclaimed land making the city centre prone toflooding during periods of heavy rain. Touristic, commercial, industrial, and most agricultural development isalso concentrated in the coastal belt.
In St Lucia, the basic settlement pattern has emerged largely as a product of the island’s small size and physiography(i.e. mountainous interior and low lying coastal lands). The development of coastal areas historically representedthe most feasible option for occupation by the human population. As economic activity required, inter alia, easyaccess to shipping ports.
St. Lucia’s coastal areas are vulnerable to threats from tropical cyclonic activity and possible sea level riseresulting from tectonic and anthropogenically-induced subsidence and stress. Coupled with these physicalconstraints are a number of social and economic factors that contribute to the vulnerability equation. Theseinclude a high unemployment rate, particularly among the young; the absence of a diversified economic baseand the heavy dependence on two main economic sectors (tourism and agriculture), the latter of which is currentlyexperiencing gradual decline. Climate change will exacerbate the existing vulnerabilities, placing additionalstress on the ability of individuals, communities and the economy in general, to adequately provide for thewelfare, health and security of the population. The future of human habitation therefore depends on the sustainablemanagement of the coast, a challenge which is becoming even more daunting as island populations increase andthe associated demands on coastal resource change and increase.
4.6.2 HUMAN HEALTH AND HEALTH SERVICES
Notwithstanding budgetary, human resource and institutional restrictions, St. Lucia benefits from a relativelyhigh standard of health care as measured by the United Nations Human Development Index. Despite this, theMinistry of Health is currently undertaking a process of health sector reform geared towards strengthening thecountry’s ability to respond to the changing health care needs of the population. This initiative is aimed atidentifying innovative and sustainable responses to meet current and future demands for health care services inSt. Lucia. Areas of health care under this initiative include: community-based health care, the improvement ofexisting district health teams; health sector financing; the development and efficient distribution of health careinformation; human resource development and the establishment of a National Health Service Plan.
The primary goal of the health care system in St Lucia is to provide care at the primary, secondary and tertiarylevels. This covers health care providers in both the public and private sectors. A key element of the overallhealth care service is the surveillance system for communicable diseases which has assisted in successfullyreducing morbidity and mortality resulting from such diseases. This success has been achieved through anationwide immunization programme targeted at diseases such as polio, tuberculosis, tetanus and measles. Theseprogrammes are ongoing measures that are in keeping with national, regional and international efforts.
In St. Lucia, influenza and acute respiratory infections constitute two of the main sources of morbidity particularlyamong vulnerable population groups such as the elderly, infants and the undernourished. However, malaria anddengue are generally regarded as two of the diseases that are likely to be most affected by anthropogenic climatechange. Dengue is endemic to the Caribbean and regular outbreaks occur throughout the region, including St.

Saint Lucia’s Initial National Communication 54
Climate Change Vulnerability and Adaptation Assessment Chapter 4
Lucia. Epidemics are costly in terms of hospitalization costs, patient care, vector control efforts, national economicproductivity and human suffering. Diarrhoeal diseases represent one of the most significant reasons for individualhealth care attention. In 1998 and 1999, incidences of diarrhoeal diseases peaked at the period when droughtconditions were believed to have encouraged inadequate sanitary conditions and practices in many communities.
The principal causes of mortality in St. Lucia are associated with the transition from a rural to a service-orientedeconomy. In 1998 and 1999, the three greatest causes (i.e. broad causes) of mortality were cardiovascular,neoplasm and cerebrovascular diseases. Cardiovascular disease is the single main cause of mortality causing23.1 % and 19.3% of deaths in 1998 and 1999 respectively. This condition is likely to be exacerbated byincreased air temperatures as well as stress associated with the climate extremes such as hurricanes. Respiratoryillnesses, though representing only 6.8% and 4.3% of deaths in 1998 and 1999 respectively, are also likely to beaffected by changes in climate parameters.
4.6.3 POTENTIAL IMPACTS HUMAN SETTLEMENTS AND HUMAN HEALTH/SERVICES
In this context, human settlements refer to the entire island system which comprises the human population itselfand the components of the system that provide opportunities for a livelihood and recreation. However, sinceseparate treatment is given to those components of the system, the discussion of impacts will focus on thosecomponents of the human settlements sector such as health, housing and critical infrastructure which have notbeen addressed. Tables 7 and 8 which follow summarize the anticipated climate change induced impacts onhuman health, housing and critical infrastructure, in addition to providing an outline of some of the implicationsof these impacts.
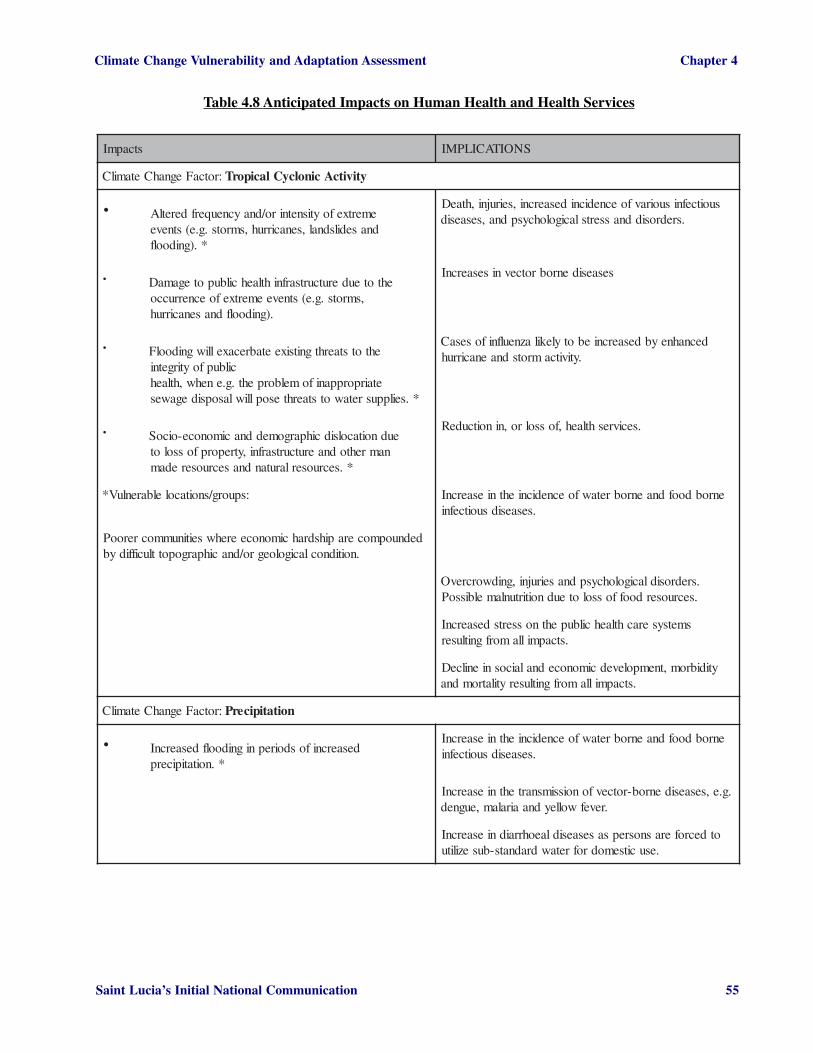
Saint Lucia’s Initial National Communication 55
Climate Change Vulnerability and Adaptation Assessment Chapter 4
Table 4.8 Anticipated Impacts on Human Health and Health Services
stcapmI SNOITACILPMI
:rotcaFegnahCetamilC ytivitcAcinolcyClaciporT
· emertxefoytisnetniro/dnaycneuqerfderetlAdnasedilsdnal,senacirruh,smrots.g.e(stneve
*.)gnidoolf
suoitcefnisuoiravfoecnedicnidesaercni,seirujni,htaeD.sredrosiddnassertslacigolohcyspdna,sesaesid
· ehtoteuderutcurtsarfnihtlaehcilbupotegamaD ,smrots.g.e(stneveemertxefoecnerrucco
.)gnidoolfdnasenacirruh
sesaesidenrobrotcevnisesaercnI
· ehtotstaerhtgnitsixeetabrecaxelliwgnidoolF cilbupfoytirgetni
etairporppanifomelborpeht.g.enehw,htlaeh*.seilppusretawotstaerhtesoplliwlasopsidegawes
decnahneybdesaercniebotylekilazneulfnifosesaC.ytivitcamrotsdnaenacirruh
· eudnoitacolsidcihpargomeddnacimonoce-oicoSnamrehtodnaerutcurtsarfni,ytreporpfossolot
*.secruoserlarutandnasecruoseredam
.secivreshtlaeh,fossolro,ninoitcudeR
:spuorg/snoitacolelbarenluV* enrobdoofdnaenrobretawfoecnedicniehtniesaercnI.sesaesidsuoitcefni
dednuopmocerapihsdrahcimonoceerehwseitinummocrerooP.noitidnoclacigoloegro/dnacihpargopottluciffidyb
.sredrosidlacigolohcyspdnaseirujni,gnidworcrevO.secruoserdooffossoloteudnoitirtunlamelbissoP
smetsyserachtlaehcilbupehtnossertsdesaercnI.stcapmillamorfgnitluser
ytidibrom,tnempolevedcimonocednalaicosnienilceD.stcapmillamorfgnitluserytilatromdna
:rotcaFegnahCetamilC noitatipicerP
· desaercnifosdoirepnignidoolfdesaercnI*.noitatipicerp
enrobdoofdnaenrobretawfoecnedicniehtniesaercnI.sesaesidsuoitcefni
.g.e,sesaesidenrob-rotcevfonoissimsnartehtniesaercnI.revefwolleydnaairalam,eugned
otdecroferasnosrepsasesaesidlaeohrraidniesaercnI.esucitsemodrofretawdradnats-busezilitu

Saint Lucia’s Initial National Communication 56
Climate Change Vulnerability and Adaptation Assessment Chapter 4
Table 4.8 Anticipated Impacts on Human Health and Health Services (Cont’d)
stcapmI SNOITACILPMI
:rotcaFegnahCetamilC )d'tnoC(noitatipicerP
· **.noitatipicerpesaercedfosdoirepnithguord/segatrohsretaW
sesaesid”hsawretaw“foecnelaverpehtfonoitacifisnetnIlanosreprofretawetauqedafoecnesbaehthtiwdetaicossa
.eneigyh
ehtfostnemliarehtodnaamhtsafoecnedicnidesaercnIcirehpsomtareirddnathguordoteudmetsysyrotaripser
.snoitidnoc
fotnemriapmi;ecruoserdoofssoloteudnoitirtunlamelbissoP.tnempoleveddnahtworgdlihc
· noitatipicerpnisegnahcoteudytivitcudorpdoofderetlA ytivitcudorplarutlucirgatceffadluochcihw,snrettap
morfgnitlusersmetsyserachtlaehcilbupehtnossertsdesaercnI.stcapmilla
:spuorg/snoitacolelbarenluV
hgihtaseitinummocnitcapmitsetaergevahotylekilerasmelborP*snosrepdnastnafni,ylredleehtsahcusspuorgelbarenluvrofdnanoitavele
.snoitidnoclacidemgnitsixemorfgnireffus
dnaytidibrom,tnempolevedcimonocednalaicosnienilceD.stcapmillamorfgnitluserytilatrom
foseilppusetauqedanihtiwstnemelttesnabrudnalaruremocnirewoL**.sepipdnatsnognidnepedsnosreprofdnaretaw
:rotcaFegnahCetamilC erutarepmeT
· ytidimuhdnaerutarepmetoteudsmetsyslacigolocedebrutsiD .sesaercni
degnahc;sesaesidenrobrotcevfoegnarlacihpargoegdesaercnIelbissop;sesaesidsuoitcefnirehtodnasnrettaplaehrraid
secruoserdoofrehtofossoldnassoldnaloteudnoitirtunlam
· erutarepmetdesaercnioteudsevawtaehfoycneuqerfretaerG *.ytidimuhdna
sahcussesaesidenrobrotcevfonoissimsnartehtniesaercnI.revefwolleydnaairalam,eugned
· *.smsinagroorcimfonoitarefilorpehtdnaerutarepmetdesaercnI

Saint Lucia’s Initial National Communication 57
Climate Change Vulnerability and Adaptation Assessment Chapter 4
Table 4.8 Anticipated Impacts on Human Health and Health Services (Cont’d)
stcapmI SNOITACILPMI
:rotcaFegnahCetamilC )d'tnoC(erutarepmeT
:spuorg/snoitacolelbarenluV -oidracyltnanimoderpsessenllidetalerfoecnedicnirehgiH.sesaesidyrotaripser
esnednignivilebotylekiltsomeraspuorgemocni-woL*,eyaR-al-esnAdnayrelCaL,ereirfuoS,dnahcraM.g.estnemelttesebotylekileraepacsdnalnabruehtmorftaehdnaytidimuherehw
.esnetnitsom
erutanputliubehtnevig,detceffatsrowebotylekilerasaeranabrUsahcussaeraniepacsdnalnabrugnidnapxeehT.tnemnorivneehtfosnosrepfosrebmundesaercnitahtsnaemtroF-xueiVdnatelsI-sorG
.seirogetacesehtnidedulcniebotylekilera
suoitcefnienrobdoofdnaenrobretawfoecnedicniehtniesaercnI.sesaesid
dnahsiffonoitanimatnocnixotoibhtiwdetaicossasmoolblaglAnoitarefilorpehtnignitlusertneuqerferomemocebdluochsifllehs
doofaes,larenegnidnaarelohcfonoissimsnartdesaercnidna.gninosiopnixotoibdnanoitanimatnoc
oteudsredrosidcigrelladnayrotaripserfoecnedicniretaerG.stnatulloprianisesaercnidecnahneetamilc
llamorfgnitlusersmetsyserachtlaehcilbupehtnossertsdesaercnI.stcapmi
dnaytidibrom,tnempolevedcimonocednalaicosnienilceD.stcapmillamorfgnitluserytilatrom
:rotcaFegnahCetamilC esiRleveLaeS
· .noitacolsidcihpargomeddnacimonoce-oicoS seirujni,gnidworcrevo;sesaesidsuoitcefnifoecnedicnidesaercnI
.sredrosidlacigolohcyspdna
· ytreporpfossol,erutcurtsarfnihtlaeh,fossolro,otegamaD .secruoserlarutandnasecruoseredamnamrehtodna
ssoldnadnalotsseccarodnalfossoloteudnoitirtunlamelbissoP.secruoserdoofrehtofo
:spuorg/snoitacolelbarenluV llamorfgnitlusersmetsyserachtlaehcilbupehtnossertsdesaercnI.stcapmi
.seitinummoclatsaoC
dnaytidibrom,tnempolevedcimonocednalaicosnienilceD.stcapmillamorfgnitluserytilatrom
4.6.4 ANTICIPATED IMPACTS ON HOUSING AND CRITICAL INFRASTRUCTURE
Current development trends indicate that the island’s population is becoming increasingly vulnerable to theimpacts of tropical cyclonic activity as over time, there has been a significant increase in the numbers of newresidential units and other structures that are being built on hillsides. This has resulted in the creation of high-density residential and other types of developments involving the excavation of steep slopes in some instancesand the removal of stabilizing vegetation. It is well known that higher densities incur greater vulnerabilities andimpacts in the event of a disaster. Because of their exposed locations, the developments on hillsides and at highelevations are particularly vulnerable to the direct effects of strong winds and landslides usually associated withthe passage of hurricanes, storms and other such activity. Climate change impacts on the built environment are
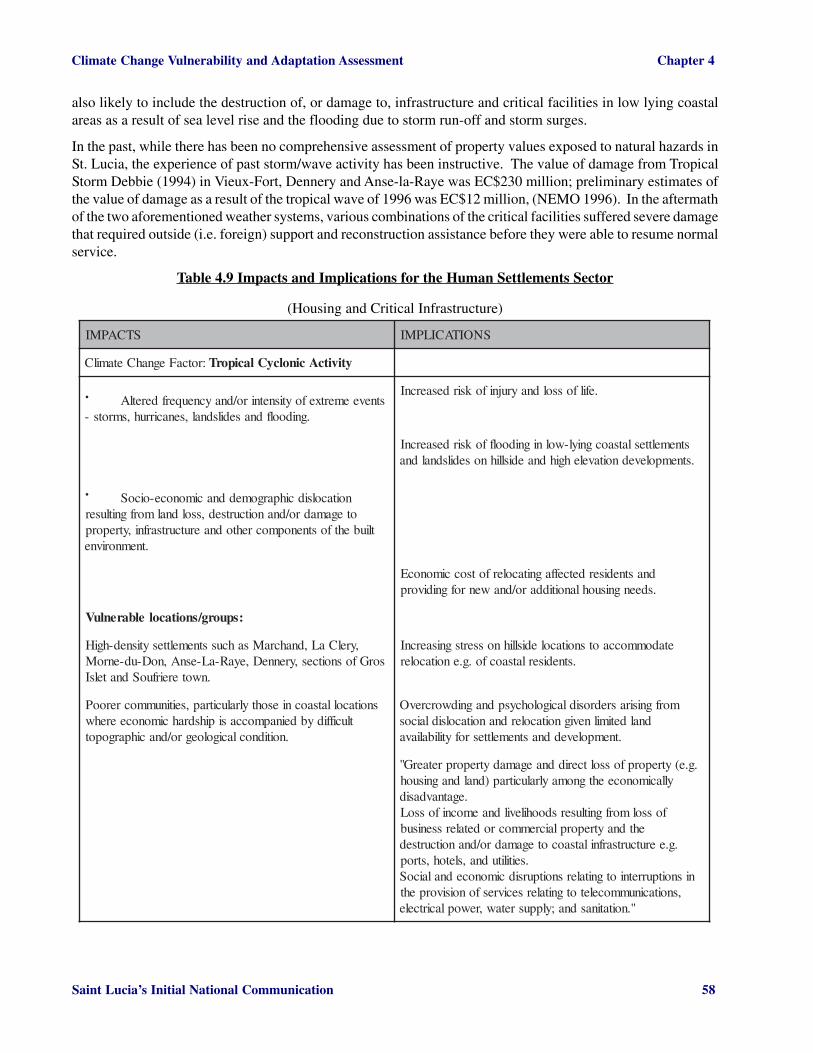
Saint Lucia’s Initial National Communication 58
Climate Change Vulnerability and Adaptation Assessment Chapter 4
also likely to include the destruction of, or damage to, infrastructure and critical facilities in low lying coastalareas as a result of sea level rise and the flooding due to storm run-off and storm surges.
In the past, while there has been no comprehensive assessment of property values exposed to natural hazards inSt. Lucia, the experience of past storm/wave activity has been instructive. The value of damage from TropicalStorm Debbie (1994) in Vieux-Fort, Dennery and Anse-la-Raye was EC$230 million; preliminary estimates ofthe value of damage as a result of the tropical wave of 1996 was EC$12 million, (NEMO 1996). In the aftermathof the two aforementioned weather systems, various combinations of the critical facilities suffered severe damagethat required outside (i.e. foreign) support and reconstruction assistance before they were able to resume normalservice.
Table 4.9 Impacts and Implications for the Human Settlements Sector
(Housing and Critical Infrastructure)
STCAPMI SNOITACILPMI
:rotcaFegnahCetamilC ytivitcAcinolcyClaciporT
· stneveemertxefoytisnetniro/dnaycneuqerfderetlA .gnidoolfdnasedilsdnal,senacirruh,smrots-
.efilfossoldnayrujnifoksirdesaercnI
stnemeltteslatsaocgniyl-wolnignidoolffoksirdesaercnI.stnempolevednoitavelehgihdnaedisllihnosedilsdnaldna
· noitacolsidcihpargomeddnacimonoce-oicoS otegamadro/dnanoitcurtsed,ssoldnalmorfgnitluser
tliubehtfostnenopmocrehtodnaerutcurtsarfni,ytreporp.tnemnorivne
dnastnediserdetceffagnitacolerfotsoccimonocE.sdeengnisuohlanoitiddaro/dnawenrofgnidivorp
:spuorg/snoitacolelbarenluV
,yrelCaL,dnahcraMsahcusstnemelttesytisned-hgiHsorGfosnoitces,yrenneD,eyaR-aL-esnA,noD-ud-enroM
.nwotereirfuoSdnatelsI
etadommoccaotsnoitacoledisllihnossertsgnisaercnI.stnediserlatsaocfo.g.enoitacoler
snoitacollatsaocniesohtylralucitrap,seitinummocrerooPtluciffidybdeinapmoccasipihsdrahcimonoceerehw
.noitidnoclacigoloegro/dnacihpargopot
morfgnisirasredrosidlacigolohcyspdnagnidworcrevOdnaldetimilnevignoitacolerdnanoitacolsidlaicos
.tnempoleveddnastnemelttesrofytilibaliava
.g.e(ytreporpfossoltceriddnaegamadytreporpretaerG"yllacimonoceehtgnomaylralucitrap)dnaldnagnisuoh
.egatnavdasidfossolmorfgnitlusersdoohilevildnaemocnifossoL
ehtdnaytreporplaicremmocrodetalerssenisub.g.eerutcurtsarfnilatsaocotegamadro/dnanoitcurtsed
.seitilitudna,sletoh,stropnisnoitpurretniotgnitalersnoitpursidcimonocednalaicoS
,snoitacinummoceletotgnitalersecivresfonoisivorpeht".noitatinasdna;ylppusretaw,rewoplacirtcele

Saint Lucia’s Initial National Communication 59
Climate Change Vulnerability and Adaptation Assessment Chapter 4
Table 4.9 Impacts and Implications for the Human Settlements Sector (Cont’d)
STCAPMI SNOITACILPMI
nisnoitpurretniotgnitalersnoitpursidcimonocednalaicoSdnanoitacude.g.eotgnitalersecivresfonoisivorpeht
.htlaeh.erutcurtsarfnilacitircnossertsdesaercnI
lanoitanretnidnalanoiger,lacolnisnoitpurretnIfonoitcurtseddnaotegamadmorfgnitlusernoitacinummoc
.erutcurtsarfnilacitircroferutcurtsarfnilacitircfonoitcurtsedrootegamaD
otevitpursidebdluowsegdirbdnasdaorlatsaocelpmaxe".seitivitcalarutlucdnalaicos,cimonocefosepytlareves
dnanoitalupoplarenegehtgnomatsernulaicosdesaercnIssolotgnitalerstcapmifotluserasa,ralucitrapnihtuoyeht
.erutcurtsarfnilacitircfonoitcurtseddnatnemyolpmefo.tnemyolpmenufoetarehtniesaercnI
dnatnempolevedcimonocednalaicosnienilceD.ytivitcudorp
gniriaperro/dnagnicalper,gnitacolerfotsoccimonocErodetacolsid,deyortsedneebsahhcihw,erutcurtsarfni
.degamad".noitacolsidlaicosdnatnemyolpmenudesaercnI
nignitluserecnarusnifotsocehtniesaercnidetapicitnAehtgnolaylralucitrap,derusninugniebseitreporperomehtdnastcapmifoytisnetniehtgnisaercniecnehtsaoc
.sretsasidlarutanretfaemityrevocerfohtgneltnegnirtserommorfgnitlusernoitcurtsnocfotsocdesaercnI
snoitalugergninnalpfotnemecrofneehtdnasedocgnidliub.egnahcetamilcfotcapmiehtgnicuderfosnaemasa
".etamilctnemtsevnillarevonotcapmievitageN
:rotcaFegnahCetamilC esiRleveLaeS
· .saeragniyl-wolfonoitadnunIesohtfonoitpecxeehthtiwevobadetatssasnoitacilpmI
.sedilsdnalotgnitaler
· noitacolsidcihpargomeddnacimonoce-oicoSro/dnanoitcurtsed,ssoldnalmorfgnitluser
rehtodnaerutcurtsarfni,ytreporpotegamad.tnemnorivnetliubehtfostnenopmoc

Saint Lucia’s Initial National Communication 60
Climate Change Vulnerability and Adaptation Assessment Chapter 4
Table 4.9 Impacts and Implications for the Human Settlements Sector (Cont’d)
STCAPMI SNOITACILPMI
:spuorg/snoitacolelbarenluV
esnA,yrenneDsahcusseitinummoclatsaocgniylwoLtelsIsorGehtdnaytiCseirtsaCfosnoitces,eyaRaL
.snwotereirfuoSdna
:rotcaFegnahCetamilC noitatipicerP
· fosdoirepnisedilsdnaldnagnidoolfdesaercnI*.noitatipicerpdesaercni
.ytivitcacinolcyclaciportrofdetacidnisasnoitacilpmI
· esaercedfosdoirepnithguord/segatrohsretaW.**noitatipicerp
stcapmitceridevahotdetcepxetonnoitatipicerpdesaerceDnideredisnocgniebstnemelttesnamuhfostnenopmocehtno
.noitcessiht
:spuorg/snoitacolelbarenluV
;gnidoolffoesacehtniseitinummoclatsaocgniyl-woL*"sedisllihnodehsilbatsestnempoleveddnastnemelttesdna
.sedilsdnalfoesacehtnisnoitavelehgihtadna
htiwstnemelttesnabrudnalaruremocnirewoL**gnidnepedsnosreprofdnaretawfoseilppusetauqedani
".sepipdnatsno
:rotcaFegnahCetamilC erutarepmeT
· oteudsevawtaehfoycneuqerfretaerG*ytidimuhdnaerutarepmetdesaercni
desaercni;tnempiuqegninoitidnocriafoesudesaercnI.stsocyticirtcelerehgih,sleuflissoffonoitpmusnoc
:spuorg/snoitacolelbarenluV nigninoitidnocriadnanoitalitnevdevorpmifotsoccimonocE.sgnidliub
nignivilebotylekiltsomeraspuorgemocni-woL*ehtmorftaehdnaytidimuherehwstnemelttesesned
.esnetnitsomebotylekilsiepacsdnalnabru
detalerrehtodnalaicremmocrofstsocgnitarepognisaercnI.stinulaitnediserrofsllibygrenedesaercnidnastnemhsilbatse
ebotylekileratroFxueiVdnaseirtsaCfosaeranabrUehtfoerutanputliubehtnevig,detceffatsrow
.erehttnempolevedfoytisnedehtdnatnemnorivne
ehtotgnitalertsochtlaehcilbupdnalanosrepdesaercnI"detavelehtiwdetaicossasessenllifoecnedicnirehgih
.erutarepmet.ytivitcudorpdnatnempolevedcimonocednalaicosnienilceD
".metsyshtlaehcilbupnossertsdesaercnI
Saint Lucia’s Initial National Communication 61
Climate Change Vulnerability and Adaptation Assessment Chapter 4
4.7 THE AGRICULTURE SECTOR
4.7.1 AGRICULTURE IN ST. LUCIA
St. Lucia is basically an agricultural economy and any significant change in climate on a global scale wouldimpact on local agriculture, and therefore affect food supply and income. Several uncertainties limit the accuracyof current climate change projections. One relates to the degree of temperature increase and its geographicdistribution. Another pertains to the concomitant changes likely to occur in precipitation patterns that determinethe water supply to crops, and to the evaporative demand imposed on crops by the warmer climate. There is afurther uncertainty regarding the physiological response of crops to enriched carbon dioxide in the atmosphere.The problem of predicting the future course of agriculture is compounded by the complexity of natural agriculturalsystems and of the socio-economic systems governing food supply and demand.
Limited land resources and the demands of a growing population have placed tremendous pressure on St. Lucia’sagricultural lands. The 1996 Census of Agriculture reported a total area on holding of 20770.5 hectares. Thisfigure reflects a decrease of 2708.8 hectares or 11.5% compared to the census of 1986 (GOSL, 1996). Thecensus reported a generally declining trend in total area dedicated to agriculture. The existing threats to thesector outlined in section 6.2 below and those posed by climate change, are expected to further reduce theavailability of land suitable to agricultural production, and reduce crop yields.
Bananas are the main agricultural export of St. Lucia. They accounted for approximately forty eight percent(48%) of the 1999 Gross Domestic Product (GDP) for the agricultural sector and 4.24 percent of the total GDP(St. Lucia Economic and Social Review 1999). St. Lucia has traditionally been the largest exporter of bananasin the Windward Islands, with the island’s share of Windward Islands banana production having risen steadilyfrom a low of 33.5 percent in 1973 to a high of 55.1 percent in 1996. Bananas are produced as a monocropmainly on small holdings (i.e. holdings below 2.02 hectares) and on a few (i.e. 7-10) large estates (holdings often or more hectares). It is the most intensively cultivated crop, utilizing the bulk of agricultural (i.e. material)inputs in that sector. Irrigation in the cultivation process is generally a practice of the large estates. Bananashould be cultivated on class I, II and III lands but due to the scarcity of such lands, a significant level of theproduction takes place on marginal lands such as steep slopes.
The livestock industry in St. Lucia has been growing in importance in the agriculture sector. The animals thathave traditionally been kept are cattle, pigs, sheep, goats, and poultry. The Ministry of Agriculture has sought todevelop the industry as part of its effort to diversify the agricultural product.
The contribution of the livestock industry has been increasing steadily over the years, from 4.98% in 1993 to6.21% in 1996. St. Lucia’s developing livestock industry does not have the flexibility built into the system foradapting to extreme climatic events (such as changing the type of stock or mix of grazing livestock, crossbreeding, relocating) due to limited financial and technological resources.
4.7.2 EXISTING THREATS TO THE AGRICULTURE SECTOR
• Development: Land clearing for residential and commercial developments and road construction.
• Pollution: use of agrochemicals, indiscriminate dumping of solid waste.
• Flooding: Lack of vegetative cover in watersheds creating flooding in low-lying areas.
• The rapid pace of globalization and international trade liberalization

Saint Lucia’s Initial National Communication 62
Climate Change Vulnerability and Adaptation Assessment Chapter 4
• Reduced capacity of the banana industry to generate sufficient levels of production, affecting foreignexchange earnings.
• The movement of labour out of agriculture.
• A reduction in prices paid to farmers for crops, especially bananas.
• Adverse impacts of natural disasters such as hurricanes, storms, landslides and flooding.
• Degradation of soils and poor yields resulting from the cultivation of crops (particularly bananas) onmarginal lands.
• The absence of proper soil and water conservation practices, particularly on steep terrain.
• Inappropriate land use: incompatibility between agricultural practices and land capability.

Saint Lucia’s Initial National Communication 63
Climate Change Vulnerability and Adaptation Assessment Chapter 4
Table 4.10 Climate Change Impacts on Agricultural Sector
STCAPMI SNOITACILPMI
:rotcaFegnahCetamilC esiRleveLaeS
· .senozlarutlucirgalatsaocfoytinilaS yortsedylekiltsomlliwretawhsikcarbhtiwnoitagirrI
.sliosniurdnasporc
· .noisurtniretawtlasoteudretawhserffossoL sdnallanigramgnikamrosdnallanigramgnitaercytinilaS
erutlucirgarofelbatiusnu
.sdnallarutlucirgafossollacisyhP
· esirlevel-aesybdecnahnestceffeegrusmrotS
otsdnallarutlucirgalatsaocgniyl-wolfoytilibitpecsuS.gnidoolf
.kcotsevilroferutsapfossoL
ehtgnitceffasecruosretawhserfotniretawtlasfonoisurtnI.noitagirrirofretawfoytilibaliava
:rotcaFegnahCetamilC ytivitcAmrotSlaciporT
· ehtdnakcotsevildnasporcfonoitcurtsedehT.sdnalmraffonoisore
stsoccimonocednalaicosdesaercnI
· efilfossolehtsiereht,levelytinummocehttAotegamadro,fonoitcurtsedehtdnaytreporpdna
.erutcurtsarfnidetaleryllarutlucirga
.erutlucirgamorfemocnidlohesuohfossoL
· ,tnalprofelbisnopserebyamytilauqretawrooPgnidulcni,smelborphtlaehnamuhdnalamina
.smsinagrocinegohtaphtiwdetaicossasesaesid
.tnemyolpmenudesaercnI
· nurecafrusdesaercnimorfgnitlusernoisorelioS.sliosdesopxenoffo
.seitreporpelbarafossoL
· fosdoirepgnirudsmetsysrevirfonoitatliS.llafniardesaercni
.noitcudorpporcninoitcudeR
· ybyltnacifingisyllaususirotceskcotsevilehTdnaegamaddaerpsediwoteudyliramirpsmrots
stnanimurllamsdnayrtluoP.slaminafohtaedehtotbmuccusyamdnaylevisnetxeeromreffus
.gnittewesnetnidnasdniwhgihfognirettab
.noitatserofeddesaercnI
.seilppusretawelbatopniesaerceD
larutlucirgamorfgnitlusernoitargimnabruotlarurdesaercnI.tnemyolpmeevitanretlagnikeessrekrow
.ytirucesdoofdesaerceD

Saint Lucia’s Initial National Communication 64
Climate Change Vulnerability and Adaptation Assessment Chapter 4
Table 4.10 Climate Change Impacts on Agricultural Sector (Cont’d)
STCAPMI SNOITACILPMI
:rotcaFegnahCetamilC noitatipicerP
:noitatipicerpdesaerceD .stnalpnossertstaehgnisuacthguorD
· ebotylekileranoitatipicerpwolfosdoireP.sdoirepyrddednetxeybdeinapmocca
.erutsiomliosfossoL
tluserasadna,ecnalabmsinagroorcimliosfonoitaretlA.selcycefilgnisaercnioteudstseplarutlucirgafoesaercni
.esaesiddnakcattatcesniotenorpsporcdenekaeW
liosfonoitaerc.g.e(erutcurtslacisyhpliosfonoitaretlA.snap
.noitcudorpporcdecudeR
lanretnidnalanretxehtobniesaercnifoegatnecrephgiH,niesaercnidna,otnoitisopsiderp;kcotsevilnisetisarap
.kcotsevilnisesaesid
elamefdnaelamrofetarevitcudorperdnaytilitrefwoL.kcotsevil
.ytilatromflacniesaercnidnagnirpsffofonoitarutametaL
OCfosnoitartnecnoccirehpsomtadesaercnI2
otylekilerastnalpegarofemosfosoitarnegortindnanobracehtretlaegarofehtfoytilauqlanoitirtundnaytilibatalapgnisaerced
.)6991CCPI(
.selcycefilgnisaercnioteudstseplarutlucirgafoesaercnI
.sessolcimonocednalaicosgnitluserhtiwnoitcurtsedporC
:noitatipicerpfoytisnetnI&ycneuqerfdesaercnI
· .sdnallarutlucirgafognidoolF
· .enihsnusfosruohdecudeR
· .noisoreliosevissecxE
· .ytilauqretawfossoL
· .sdnallarutlucirganonoitisopedtliS
· .stneirtunliosfossoL
· .erutcurtsarfnimrafotegamaD

Saint Lucia’s Initial National Communication 65
Climate Change Vulnerability and Adaptation Assessment Chapter 4
Table 4.10 Climate Change Impacts on Agricultural Sector (Cont’d)
STCAPMI SNOITACILPMI
:rotcaFegnahCetamilC erutarepmeT
.erutsiomliosfossoL · noitatipicerpdesaercedrofsaemasehtnoitacilpmI
.ecnalabmsinagroorcimliosfonoitaretlA ·
efilgnisaercnioteudstseplarutlucirgafoesaercnI·.selcyc
dnakcattatcesniotenorpsporcdenekaeW ·.esaesid
.sliosfoerutcurtslacisyhpfonoitaretlA ·
tneibmahgihoteudnegortinliosfossoL ·.serutarepmet
.ycneiciffenoitagirrifossoL ·
.thgiewydobkcotsevilfossoL ·
dnalanretxehtobniesaercnifoegatnecrephgiH ·.kcotsevilnisetisaraplanretni
nisesaesidniesaercnidnaotnoitisopsiderP ·.kcotsevil
4.8 THE TOURISM SECTOR
4.8.1 TOURISM IN ST. LUCIA
As is the case with many other Small Island Developing States (SIDS) in the Caribbean, the tourism industry inSt. Lucia is characterized by a concentration of tourism superstructure, activities and infrastructure in coastallocations and has a direct dependence on the natural environment as its primary input. Natural resources andlandscapes such as the Pitons, rainforest, Sulphur Springs, mineral baths, water falls, dive sites, beaches andhistorical sites represent the major attractions or “pull factors” for the visitor.
Since its inception in 1992, the internationally renowned St Lucia Jazz Festival has grown in prominence as oneof the premier marketing tools for the sector. It now provides a further attraction in, addition to HeritageTourism (which focuses on the marketing of attractions, sites and other products in rural communities), and Eco-tourism, which have both became increasingly important. Since the late 1970s, the tourism sector has madesignificant strides in marketing and promoting St. Lucia as a nature tourism destination. However, since tourismmarkets are growing rapidly, and active competition among tourist destinations is the norm, St. Lucia has foundit necessary to promote itself as a specialized destination catering to tourist with specific interest in eco-tourismactivity such as hiking, bird watching, camping and river bathing.
Surveys conducted by the St. Lucia Tourist Board in 1998 and 1999 revealed that, contrary to traditional beliefthat the pull factors for visitors to Caribbean islands are the “S.S.S” factors (Sea, Sun and Sand) these attractionsactually rank fourth to the natural environment, the desire for peace and quiet and cultural heritage. The numberone ranking of the natural Environment is highly significant in the present context in SIDS, the natural environmentis one of the factors which is most vulnerable to the effects of climate change.

Saint Lucia’s Initial National Communication 66
Climate Change Vulnerability and Adaptation Assessment Chapter 4
The tourism sector continues to expand, while maintaining its position as the second largest contributor to thereal Gross Domestic Product (GDP). The 1999 contribution to GDP stood at 12.9 percent, second only towholesale and retail, which topped the ranking with a contribution of 13.96 percent (Economic and SocialReview 1999). Tourism as an industry is by a wide margin the largest contributor to the island’s foreign exchangeearnings. The impact of tourism in St. Lucia manifests itself in a variety of ways, the most significant of whichis the direct and indirect contribution that the sector makes to employment. As at December 1999, tourismdirectly employed 11,766 persons on a full time basis, which accounted for approximately sixteen percent(16%) of the total labour force of 73,0001 , (The Government Statistical Department, 1999).
Tourism also provides a source of revenue through the taxes and other direct and indirect revenue that it generates.Such revenue will inevitably benefit the local population when it is spent to provide and improve public services,in for example, the education, sports and health sectors. In addition, the tourism industry provides linkages tomost other productive economic sectors such as agriculture and manufacturing. With these linkages, tourism isprobably the single largest contributor to economic activity in St. Lucia. The strong performance of the sectorduring the 1990s has contributed to the gradual transformation of the economy from a product- oriented one toone that is becoming service-oriented. The Government has therefore identified tourism, and services in general,as the leading growth sectors and the growth engines that will play the leading role in realizing the economicdevelopment vision which is aimed at strengthening, modernizing and repositioning the island’s economy.
4.8.2 POTENTIAL IMPACTS OF CLIMATE CHANGE ON THE TOURISM SECTOR
Climate change is expected to affect tourism in many ways, both directly and indirectly. It would appear thatanthropogenic climate change will have significant negative impacts on the physical environment and naturalresources which represent the inputs of the sector and consequently, equally significant negative impacts on theisland’s economy. The impacts will be reflected in the loss of beaches due to erosion; inundation due to sea levelrise, degradation of various ecosystems on which the industry relies and damage to critical superstructure andinfrastructure. These impacts have the potential to seriously destroy the tourism resource base of vulnerableSIDS like St. Lucia, making them less attractive tourism destinations.
It must be noted that while these impacts can also be caused by non-climate change related activity, it is increasinglybeing proven that climate change is likely to cause similar adverse impacts with severe repercussions for thesocio-economic and socio-cultural existence of SIDS. Tourism is so vital to the St. Lucian economy that if therewere to be any notable contraction in the industry due to loss and/or damage to physical plant, infrastructure orresources (and consequently reduced employment and revenue), the rate of national economic growth woulddecline significantly. In such circumstances, the provision of many essential services would be put at risk andvital services such as health and education, whose budgetary allocations are determined by tourism revenue,would also be jeopardized.
To gain a proper appreciation of the extent of impacts as it relates to the tourism industry, it is necessary to firstdefine the nature of the resource base on which the sector depends. The resource base in this context is the entireisland, comprising all its human and non-human, components and the associated stresses they present; and thesocio-cultural value attached to particular sections of the environment by the local population, for example, tobeaches and historical sites and landmarks such as the Pigeon Island National Park and the Maria Islands NatureReserve. Any discussion of impacts will therefore have to cover all components of that system, which wouldcomprise the various ecosystems (i.e. marine and coastal, rainforest and the fresh water ecosystems) and thevarious economic sectors that they support.
As the impacts on some of these components of the island system have already been dealt with in detail by othersections of this chapter, the focus here will be on the components of the natural and man made environment towhich the human population has attached socio-cultural value and on the tourism related infrastructure (such as

Saint Lucia’s Initial National Communication 67
Climate Change Vulnerability and Adaptation Assessment Chapter 4
hotels, restaurants, air and sea ports, roads, and telecommunication and other utilities). Table 10 below providessome specific detail on the implication of the anticipated impacts on the aforementioned components of theisland system.
Table 4.11 Anticipated Impacts on Tourism Related Infrastructure and the Environment to which thePopulation has attached Socio-cultural Value
STCAPMI SNOITACILPMI
ehteraytivitcacinolcyclaciportdnaesirlevelaeS.deredisnocebotegnahcetamilcfostcepsaniam
rootegamadmorfgnitlusersdoohilevildnaemocnifossoLehtdna;seitinema/ytreporpdetalermsiruotfossol
.g.eerutcurtsarfnilatsaocotegamadro/dnanoitcurtseddnasdaor,stnaruatser,sletoh,stropaesdnastropria
.evobadetacidnisecivresehtotdetalererutcurtsarfni
· emertxefoytisnetniro/dnaycneuqerfderetlA stneve
.gnidoolfdnasedilsdnal,senacirruh,smrots-
gniriaperro/dnagnicalper,gnitacolerfotsoccimonocErodetacolsid,deyortsedneebsahhcihw,erutcurtsarfni
.degamad
· aesoteudsaeralatsaocgniyl-wolfonoitadnunI .esirlevel
ehtnisnoitpurretniotgnitalersnoitpursidcimonocEretaw,rewoplacirtcele,snoitacinummoceletfonoisivorp
.secivresnoitatinasdna
· noitacolsidcihpargomeddnacimonoce-oicoS ro/dnanoitcurtsed,ssoldnalmorfgnitluser
rehtodnaerutcurtsarfni,ytreporpotegamadgnitluser,tnemnorivnetliubehtfostnenopmoc
.evobadetatsstcapmiehtmorf
.rotcesmsiruotehtnietamilctnemtsevninotcapmievitageN
msiruotrofecnarusnifotsocehtniesaercnidetapicitnA.seitreporpdetaler
:spuorg/snoitacolelbarenluV
ehtnodehsilbatseesohtylralucitrapseitinummoclatsaoC.tsaoctsew
lacihpargoegfossolehtmorfgnitlusernoitpursidlaicoS,sehcaeb.g.e(serutcurtslacisyhpdnasnoitacol
,skramdnal,skrap,setislacirotsihdnalacigoloeahcradnalarutlucfoerocehtetutitsnochcihw,)ctesmuesum
.noitalupopehtfoecnetsixelacirotsih
dnaseiteicostcnitsidsasmronlateicosfonwodkaerBelytsefilnisegnahccitsardhtiwdenetaerhtemocebserutluc
.semohlartsecnanodnabaotdeenehtro
4.9 RECOMMENDATIONS FOR ADAPTATION
The preceding sectoral assessments of the likely impacts of climate change associated with the scenarios utilizedpoint to the potential for far-reaching adverse impacts upon the natural and built environments, as well as onsocio-economic activities in St. Lucia. This is due to a number of factors including the natural resource dependencyof the economy (centered around tourism and agriculture), small size which means that all geographic regionsare impacted (e.g. during a drought or hurricane), and the increasing non-climate anthropogenic impacts onlimited natural resources (pollution, over-harvesting, deforestation, etc).

Saint Lucia’s Initial National Communication 68
Climate Change Vulnerability and Adaptation Assessment Chapter 4
The sectoral assessments also identify a range of interventions that are aimed at enabling sectoral and nationallevel adaptation to the challenges likely to be posed by climate change. However it is possible to categorizethese adaptation recommendations into the following broad approaches:
· Sectoral - such as improving agricultural varieties to be able to withstand projected elements of climatechange;
· Multi sectoral – such as improved watershed and coastal area management, activities with multiple benefitsacross sectors;
· Cross sectoral - such as public awareness and climate research and data collection.
Adaptation involves developing and institutionalizing various levels of capacity, as well as developing expertiseand building knowledge through research and monitoring. Similarly, actions to optimize the health andsustainability of important ecosystems sensitive to climate change – such as coral reefs and/or moist forests –will be most effective if begun early while these systems are still relatively intact. Anticipatory approaches canalso greatly reduce the need for forced ad hoc responses at a later date when loss of resources and poorlyplanned development will likely limit the range of adaptation options available (IGCI/SPREP, undated).
Select Adaptation Options for St. Lucia
COASTAL ZONERelocation and retreat of structures and activitiesRestrictions on future developmentSea-walls, levees etcReinforcing existing structures e.g. docksFlood plain management planBuilding codesMangrove habitat protection and reforestationRaising coastal bridges and roadsGuidelines and restriction of sand mining
HUMAN SETTLEMENTSInland relocationUpgrading planning legislation (building codes, EIA etc)Community based resource managementPublic awarenessUse of traditional knowledgeDevelopment of climate change databaseHazard mappingCoastal protection measures

Saint Lucia’s Initial National Communication 69
Climate Change Vulnerability and Adaptation Assessment Chapter 4
FRESHWATERReductions in line lossesAccurately reflecting costs of waterRestoration of riverbanks and wetlandsWater conservationPublic awarenessImproved management of forest resources including private forestsStrengthening data collectionDevelopment of a national water management plan
AGRICULTURE (including Bananas)Introduction of salt-tolerant speciesHydroponicsPublic awarenessIntroduction of heat and drought-tolerant cropsCrop researchUse of greenhousesProtection of forested areasFarm relocationImproved pest and disease managementRestoration of degraded landsAgricultural diversificationReduced livestock stocking rates
FORESTRYDevelopment and enforcement of land use policyLegislation and regulationsPromotion of agroforestryPreservation of watersheds including compulsory acquisitionReforestationPublic awarenessWetlands protectionUrban forestry
FISHERIESResource and ecosystem monitoringPublic awarenessStrengthening environmental legislationNew fishing technologiesEfficient processing facilitiesRegional and international cooperationDevelopment of a Fisheries Management Plan incorporating climate change

Saint Lucia’s Initial National Communication 70
Climate Change Vulnerability and Adaptation Assessment Chapter 4
TOURISMRelocation of structuresStrengthened development controlsEconomic diversificationHard and soft coastal engineering protection measuresFlood control
HEALTHPublic awarenessSurveillance and monitoringInfrastructure developmentEngineering and technological responsesMedical interventions
Consideration must be given to the high degree of uncertainty that still surrounds efforts to forecast long-termtrends in weather and climate patterns as a result of climate change. This results in conflicting messages going topolicy makers and decision makers and makes it difficult to take decisions based solely on considerations pertainingto climate change. Against this background of uncertainty, criteria for recommending adaptation actions shouldembody, as far as possible:
• Be supportive of wider non-climate development policy goals and objectives,
• Enhance knowledge of existing weather and climate patterns;
• Reduce vulnerability to existing climate variability;
• Be environmentally sustainable; and
• Be economically/financially viable
Flexibility and practicality in identifying adaptation options are particularly important in the context of smalldeveloping countries like St Lucia where limited spatial, financial and human resources exist as inbuilt constraintsto sustainable development.
Central elements for adapting to climate change are:
a) Data collection and data management.
b) Public awareness.
c) Coastal area management.
d) Integrated water resource management.
e) Land use planning and development control.
f) Capacity building.
Saint Lucia’s Initial National Communication 71
Climate Change Vulnerability and Adaptation Assessment Chapter 4
4.10 CONCLUSION
Anthropogenic climate change will clearly pose tremendous development challenges for St. Lucia. Its effectsand impacts are likely to include increases in air and sea surface temperatures, increasing variability in rainfallpatterns (more severe droughts and more severe heavy rainfall episodes), increased frequency and intensity oftropical storms and hurricanes, and increased coastal erosion and inundation brought about by rising sea levels.Opportunities for positive growth and development are likely to be severely threatened by diverse impacts to thecountry’s fragile natural resource base and consequently to its resource dependent economic sectors particularlytourism and agriculture.
The wide-ranging impacts will require a range of adaptive responses, and in most cases, Government will berequired to take a lead role in terms of creating the enabling environment for empowering appropriate action atthe personal, household, enterprise, sectoral, community and national levels. Critical in this respect will be theroles of information dissemination and awareness building. Efforts will need to be intensified to assess theextent of changes in climate and weather-related parameters particularly in the coastal environment, and forsensitive ecosystems such as watersheds and wetlands. At the same time, public awareness, both of a generaland technical nature, will need to be heightened among relevant stakeholders if they are to be able to takeappropriate actions and make realistic decisions. Government must at the same time establish a policy frameworkfor climate change adaptation that promotes actions which address existing stresses and enhance wider attemptsto achieve sustainable human development.
Sectoral assessments point to the importance of the Government of St. Lucia and other stakeholders continuingefforts to diversify the economic base of the country. This will reduce the negative effects of adverse impacts ona particular sector. However it is recognized that this has not been, and will not be, easy to achieve particularlyin a rapidly globalized economy. Nevertheless, the analyses clearly suggest the relevance, from a climate changeperspective, of continued national efforts at economic diversification.
One important factor underlying all of the efforts to respond to the challenge of climate change will be the issueof the political will to tackle such a long-term, task. Climate change will occur across time frames that farexceed the normal time horizon for political decision-making. Additionally, many of the adaptive actions identifiedinvolve taking anticipatory actions are likely to be resisted (at least initially) by important stakeholder groupsand are therefore likely to be politically sensitive. This instituion will be further aggravated by the level ofuncertainty surrounding the extent and impacts of climate change in St. Lucia. These complicating politicalrealities will require resolute leadership guided by the best available scientific and technical information.
At the same time, St. Lucia and other Caribbean and small island States must also intensify their efforts to bringto the fore at international fora, the question of adoption of measures for addressing climate change. Particularemphasis should be placed in seeking reduction, to sustainable levels, of global greenhouse gas emissions thatthreaten to destroy the ecological and social structures so essential to St. Lucia’s survival.

Saint Lucia’s Initial National Communication 72
Climate Change Vulnerability and Adaptation Assessment Chapter 4

Saint Lucia’s Initial National Communication 73
General Description of Steps Taken Chapter 5
GENERAL DESCRIPTION OF STEPS TAKEN

Saint Lucia’s Initial National Communication 74
General Description of Steps Taken Chapter 5
5.1 INTRODUCTION
The UNFCCC (Article 12.1 (b) requires that Parties to the Convention provide a general description of stepstaken in the implementation thereof. St. Lucia has undertaken a number of activities in fulfillment of its obligationsunder the Convention.
5.2 POLICY FRAMEWORK
Under the CPACC Project, St. Lucia has prepared a Climate Change Adaptation Policy as well as an AdaptationStrategy. The National Climate Change Adaptation Policy:
1. Expresses the Government of St. Lucia’s recognition of the fact that Climate Change is indeed occurringand that it has significant implications for St. Lucia;
2. States the objectives of Government’s National Climate Policy including: a) avoiding, minimising or adaptingto the negative impacts of climate change on St. Lucia’s natural, economic and social systems; and b)fostering the development and application of appropriate legal and institutional systems and managementmechanisms for planning for, and responding to, climate change;
3. States the principles which will guide the implementation of policy including stakeholder involvement,public awareness and involvement in international negotiations;
4. Identifies objectives and broad action areas under various areas/resource categories including agriculture,human health, water resources, tourism and coastal resources. These include the conduct of appropriateclimate change monitoring and data gathering programmes; formulation of a national land use plan;incorporation of climate change considerations into national health planning; conduct of an inventory ofwater resources, including ground-water and development and implementation of appropriate buildingregulations;
5. Identifies appropriate planning and management mechanisms including the establishment of appropriatelegal and administrative systems and the development of an appropriate database and information exchangenetwork;
6. Identifies key agencies; and
7. Makes appropriate provisions for monitoring and review, through the National Climate Change Committeewhich was re-established in 1999 with the sanction of Cabinet.
The National Climate Change Adaptation Strategy attempts to build on the Policy by identifying and rationalizingappropriate strategies and actions according to priority, time frame, resource needs and institutional responsibility(scope).
The Adaptation Policy identifies the Ministry of Planning as the agency with responsibility for Climate Changeactivities. As such, that Ministry is mandated to co-ordinate implementation of the NCCA. Additionally, theNational Climate Change Committee, or its successor, shall monitor the implementation of the Strategy andshall provide guidance to the Ministry of Planning and the other agencies involved in implementation of theStrategy. The Committee shall also ensure that St. Lucia fulfils its obligations under the UNFCCC, the KyotoProtocol and other related regional and international conventions and agreements.
Given the scope of the NCCA and the multiplicity of activities to be undertaken simultaneously in theimplementation thereof, there will be need for a dedicated unit within the Ministry of Planning to coordinateefforts to this end. This proposed Climate Change Unit shall be provided with appropriate professional, technicaland administrative resources to allow it to fulfil its mandate. It is recognized, however, that to a large extent,

Saint Lucia’s Initial National Communication 75
General Description of Steps Taken Chapter 5
NCCA activities are to form part of the work programmes of numerous agencies. The Climate Change Unit shalltherefore serve as the Secretariat to the Climate Change Committee, or its successor body, while co-ordinatingimplementation of the Strategy, and also implementing certain key activities falling thereunder.
5.3 SYSTEMATIC OBSERVATION AND RESEARCH
The Meteorological Office is head quartered at the Hewanorra International Airport and is the centre of St.Lucia’s climate observation system. Its functions include the systematic collection of meteorological data forthe island; providing weather-related information for aviation and shipping purposes and providing weatherforecasts to the general public. It is also the official source of information on cyclonic events during the hurricaneseason. In this regard, it is a critical component of the national emergency management system.
The Meteorological Office collects data on a number of climatic parameters including rainfall, temperature,atmospheric pressure, humidity, wind speed and direction. Records date back as far as 1973. In recent years, thework of the Office has been assisted by the installation of a tidal gauge acquired under the CPACC project. Thisgauge monitors, inter alia, air temperature, sea temperature, tidal data, wind speed and wind direction. The datacollected is also up-loaded, via satellite, to the Institute of Marine Affairs in Trinidad where it is processed.
At the regional level, a number of agencies play significant roles in systematic research and observation. Theseinclude:
The Caribbean Disaster Response Agency (CDERA);
The Caribbean Meteorological Organization; and
The Caribbean Institute of Meteorology and Hydrology (CIMH).
With respect to monitoring of coastal processes, the Department of Fisheries of the Ministry of Agriculture,Fisheries and Forestry has an ongoing programme which involves the monitoring of beach profiles. The Departmentalso undertakes work on coral reef monitoring in collaboration with non-governmental organisations.
While some systems and programmes exist for systematic research, these are limited by financial, human andtechnical constraints. The Meteorological service, for example, is in need of additional trained personnel andequipment. One area which requires particular attention is that of research and monitoring as regards terrestrialecosystems.
5.4 PUBLIC AWARENESS AND EDUCATION
Public awareness and education is recognized as being critical to the process of responding to climate change.Since, 1999, a number of activities have been undertaken to enhance knowledge and awareness in an effort tobuild support for climate change initiatives. A number of climate change articles have been published in thenational newspapers. These have highlighted developments at the national, regional and international levels.Press releases have also been carried over the electronic media.
Since 1999, stakeholders in the National Communication implementation process have been interviewed by theelectronic media. In addition, stakeholders have taken part in panel discussions and similar forums. In general,the mass media have been supportive of climate change activities and have given workshops and other events agood deal of coverage. One welcome development has been the spontaneous reporting on climate issues in themass media without waiting for information to be provided by Government sources.

Saint Lucia’s Initial National Communication 76
General Description of Steps Taken Chapter 5
In June 2000, the Government of Saint Lucia launched its official climate change web site(www.climatechange.gov.lc). The responses to this site have been favorable and it continues to be visited on aregular basis.
In 2000, the Ministry of Planning, Development, Environment and Housing undertook a climate change awarenesscampaign in secondary schools around the island. Thirteen secondary schools were visited and approximately2000 students targeted.
In July 2001 with the support of the Ministry of Planning, the Insurance Council of Saint Lucia held a climatechange awareness seminar for its members, the first in the Caribbean. Technical support was provided by theCPACC project.
A great deal of support has been obtained through stakeholder consultations and workshops. By adopting aparticipatory approach to the implementation of climate change projects, it has been possible to build stakeholderawareness, interest and involvement.
Notwithstanding the achievements to date, it is clear that there is a great deal of work to be done in the area ofpublic awareness. There is a need to deepen and widen the education and sensitization process and to targetspecific audiences in a more systematic manner. It is recognized that many St. Lucians are not knowledgeableon climate change issues and that the population as a whole will have to be convinced that the impacts thereofcould fundamentally affect their lives.
5.5 CAPACITY BUILDING
In order for St. Lucia to effectively address issues arising out of the climate change phenomenon, it must developthe necessary institutional capacity. As a Small Island Developing State, however, St. Lucia is faced withsignificant financial, technical and human resource constraints which impinge negatively on its ability to do so.Notwithstanding, some significant steps have been taken in this direction.
Under the programme of Enabling Activities, a number of nationals have received training in:
a) Inventory of Greenhouse Gases;b) Vulnerability and Adaptation Assessment; andc) Web Site Design.
The CPACC Project has also provided training, particularly in the areas of:d) Database Management and Administration;e) Data Automation; andf) Economic Valuation of Coastal Resources.
Useful expertise has been acquired through the preparation of St. Lucia’s First National Communication and itsvarious supporting studies; the development of the country’s adaptation policy and strategy under CPACC andthe development and implementation of public education and awareness activities.
Technical capacity at the national level has been enhanced in various areas. Through both the Enabling Activitiesand the CPACC Project, computers have been acquired to further the work of agencies involved in climatechange activities. CPACC has also funded the development of a digitized Coastal Resource Inventory System(CRIS) and made available appropriate Geographical Information System (GIS) software. In addition, the island’sfirst, and to date only, tidal gauge was also obtained through CPACC.
The implementation of the Programme of Enabling Activities and the CPACC Project has resulted in thedesignation of the Ministry of Planning, Development, Environment and Housing as the Focal Point for climatechange activities. It has also led to the re-invigoration and expansion of the National Climate Change Committee.

Saint Lucia’s Initial National Communication 77
General Description of Steps Taken Chapter 5
5.6 OTHER INITIATIVES
In addition to climate change-related activities, a number of initiatives have been taken at the national levelwhich are confluent with, and supportive, thereof. These include:
• Initiation of a National Land Policy formulation process;• Development and adoption of a Sustainable Energy Plan;• Institutional Review of Environmental Management; and• Preparation of a Biodiversity Strategy and Action Plan.
Saint Lucia’s Initial National Communication 78
Financial and Technological Requirement Chapter 6
FINANCIAL AND TECHNOLOGICAL REQUIREMENT

Saint Lucia’s Initial National Communication 79
Financial and Technological Requirement Chapter 6
6.1 FINANCIAL & TECHNOLOGICAL REQUIREMENTS
The effects of climate change will have far reaching implications for all aspects of life in St. Lucia. Therefore,steps must be taken to address all relevant issues in a proactive, coordinated manner. Given St. Lucia’s limitedhuman, financial and technological resources, regional and international cooperation and support will be requiredin a number of key areas.
Climate Change Education and Awareness
Meaningful action in addressing climate change can only be achieved if there is commitment based on adequateawareness, knowledge and access to information at all levels. Accordingly, it will be necessary to target relevantaudiences and to develop and implement appropriate strategies.
Goal: To achieve meaningful implementation of climate change strategies, plans and actions through theenhancement of education and awareness among target audiences.
Objectives:
• Enhance the level of knowledge and awareness among decision-makers, stakeholders and the generalpublic on climate change issues;
• Improve the flow of climate change-related information between stakeholders and to the general public;
• Influence decision-making and behaviour among relevant target groups in order to achieve desired results.
Strategies & Actions:
• Development and implementation of an integrated, coordinated and sustained climate change educationand awareness programme targeting all sectors and relevant interest groups.
• Establishment of a climate change information storage and exchange mechanism.
Incorporation of Climate Change Issues Into the Development Planning Process
The successful implementation of a holistic, integrated national climate change strategy will require, inter alia,that climate change issues and considerations be incorporated into the national planning process. Currently, St.Lucia is looking towards adopting an Integrated Development Planning (IDP) approach.
Goal: To ensure the effective implementation of climate change strategies, plans and actions through theincorporation of climate change considerations into the planning and resource allocation process.
Objectives:
• Build Institutional Capacity to analyse climate change issues;
• Strengthen data and information collection and processing capabilities within relevant institutions;
• Establish suitable institutional frameworks for programming, coordination and implementation of relevantactivities.
Actions:
• Undertake training activities in areas relating to planning and data processing;

Saint Lucia’s Initial National Communication 80
Financial and Technological Requirement Chapter 6
• Establish a national Climate Change Unit;
• Develop a national climate change framework in the context of a larger national planning framework.
Implementation of St. Lucia’s Sustainable Energy Plan (SEP)
The Government of St. Lucia has formulated and adopted a Sustainable Energy Plan. This Plan is expected toguide the development of St. Lucia’s energy sector for the next 10 years. It places strong emphasis on the use ofrenewable energy technologies as well energy conservation and efficiency. Financial and technical support willbe required in implementing many aspects of the SEP.
Aim: To promote sustainable energy development and achieve reductions in greenhouse gas emissions throughthe implementation of the SEP
Objectives:
• Achieve the reduced use of conventional powers sources;
• Increase the use of renewable energy technologies;
• Promotion and adoption of energy conservation measures
• Reduce the emission of GHGs.
Strategies & Actions:
• Build institutional capacity for energy sector planning and evaluation of RETs;
• Develop appropriate regulatory framework for the successful implementation of the SEP
• Develop and implement education and awareness programme to support SEP
• Conduct research into RET potential and energy efficiency measures
Sectoral and Resource Management Requirements
It has been recognized that a number of key issues will need to be considered as they pertain to particular sectorsor resources. The following is a list of priority areas identified at the national level.
Coastal & Marine Resources
Undertake review of existing coastal monitoring and data collection systems.
Implement integrated coastal zone management plans
Human Settlements
Develop adaptation plan for human settlements including zoning, defenses, building codes etc.
Terrestrial Resources, Terrestrial Biodiversity& Agriculture
Establish a system for improved monitoring and research of key terrestrial and agricultural processes and resources.

Saint Lucia’s Initial National Communication 81
Financial and Technological Requirement Chapter 6
Freshwater resources
Undertake inventory of freshwater resources and develop and implement a National Water Resources ManagementPlan.
Tourism
Improve/ develop a regulatory framework with emphasis on enforcement.
Regional Initiatives
St. Lucia is committed to participating in regional and international initiatives. This is exemplified by the country’sparticipation in the CPACC Project. Given the successes achieved to date by CPACC, and recognizing the needfor a regional entity to coordinate Caribbean response to climate change, St. Lucia calls for, and supports effortstowards, the establishment of a Caribbean Climate Change Centre.
National Communications Process and Follow-up Activities
Based on the experience obtained during the preparation of St. Lucia’s First National Communication to theUNFCCC, the following have been identified as areas where assistance would be required and which wouldmerit the attention and support of the Global Environmental Facility (GEF):
1. Building capacity to resolve issues regarding emissions factors and to better address Land Use, Land UseChange and Forestry (LULUCF) computations;
2. Enhancing data collection, management and processing;
3. Identification and implementation of country-specific Stage II and III adaptation measures;
4. Developing national capacity for water resource planning and management;
5. Establishing systems for enhanced exchange of information and experiences within the region, as well asbetween regions;
6. Developing and implementing integrated resource/spatial management plans;
7. Implementing energy conservation and renewable energy pilot projects;
8. Enhancing capacity for disaster planning and management;
9. Enhancing early warning systems for extreme weather events;
10. Enhancing capacity to participate in international climate change initiatives and negotiations.

Saint Lucia’s Initial National Communication 82
REFERENCES
Caribbean Conservation Association/ Island Resources Foundation 1991, St. Lucia Environmental Profile
Challenger, Brian 1997, Adaptation to Climate Change in Antigua & Barbuda. Report prepared for the Governmentof Antigua and Barbuda/ United nations Environment programme/ global environment Facility- CountryCase Study on Climate Change Impacts and Adaptation Assessments in Antigua & Barbuda (GF 2200-96-42).
Challenger, B., M. Felix, L. John, J. Raynold, 2001. St. Lucia National Climate Change Vulnerability andAdaptation Report.
d’Auvergne, C., A. James & D. Barrow 2001, St. Lucia Country Paper on National Climate Change IssuesTowards the Implementation of CPACC Component 4: Formulation of a Policy Framework for Integrated(Adaptation) Planning and Management.
Feenstra, J., I. Burton, J. B. Smith, R. S. J. Tol (Eds). 1998. Handbook on Methods for Climate Change ImpactAssessment and Adaptation Strategies. United Nations Environment Programme, Vrije UniversiteitAmsterdam, Institute for Environmental Studies.
Government of St. Lucia 1997, St. Lucia National Environmental Action Plan.
Government of St. Lucia, 2000., Medium-term Economic Strategy
Government of St Lucia, 1993, Forest Management Plan (1992 – 2002), Ministry of Agriculture, Lands, Fisheries,Cooperatives and the Canadian International Development Agency, Roche Ltee, Castries, St. Lucia.
Government of St Lucia, 1996, 1996 St. Lucia Census of Agriculture - Final Report, Ministry of Agriculture,Lands, Fisheries and Forestry, Castries, St. Lucia.
Government of St Lucia, 1999, “Saint Lucia Country Strategy Paper for the Banana Industry, AgriculturalDiversification and the Social Recovery of Rural Communities”, Castries, St. Lucia.
Government of St Lucia, 2000, St. Lucia: Economic and Social Review 1999, Castries, St. Lucia
Government of St Lucia, 2000, St. Lucia: Economic and Social Review 1999, Castries, St. Lucia.
Government of St. Lucia, 2001, St. Lucia National Climate Change Policy & Implementation Strategy
(Graveson, 1998).
Gray, C., “Regional Meteorology and Hurricanes” in “Climatic Change in the Inter Americas Seas”, G Maul(ed.), UNEO, 1993.
Hendry,M., “Sea-level Movements and Shoreline Change”, 1993, in Maul (ed), Climatic Change in the Inter-Americas Sea, UNEP, Edward Arnold, London
Houghton, J.T., L.G. Meira Filho, B. Lim, K. Tréanton, I. Mamaty, Y. Bonduki, D.J. Griggs and B.A. Callender(editors), 1996. Intergovernmental Panel on Climate Change (IPCC): Greenhouse Gas Inventory ReportingInstructions. Revised 1996 IPCC Guidelines for National Greenhouse Gas Inventories. Volumes 1, 2 and3.
IPCC (Intergovernmental Panel on Climate Change), 1994, Preparing to Meet the Coastal Challenges of the 21st
Century, (Conference Report, World Coastal Conference 1993), Ministry of Transport, Public Works andWater Management, The Hague, The Netherlands.
IPCC (Intergovernmental Panel on Climate Change) 1995, Second Assessment Report, UNEP/WMO.

Saint Lucia’s Initial National Communication 83
IPCC (Intergovernmental Panel on Climate Change), 1996, Climate Change Impacts, Adaptations and Mitigationof Climate Change: Scientific-Technical Analyses. Contribution of Working Group II to the SecondAssessment Report of the IPCC, R.T. Watson et al. (eds.), Cambridge University Press, Cambridge, UK.
Ministry of Planning Antigua & Barbuda 1997, Country Case Study on Climate Change Impacts and Adaptationin Antigua & Barbuda. Agriculture Sector Assessment. United Nations Environment Programme. GF/2200-96-43.
Ministry of Agriculture Forestry Fisheries & Environment 1998, Biodiversity Country Study Report of St. Lucia.Government of St. Lucia, United Nations Environment Programme, UNEP/GEF GF/1200-96-64.
NEMO (National Emergency Management Organization), 1996, Saint Lucia National Disaster ManagementPlan: Section 11- Draft Hazard Mitigation Plan, Castries, St. Lucia.
Purseglove, J. W., 1978, Tropical Crops Monocotyledons, Longman Group Ltd., London, England.
Singh, B.2001, St. Lucia National Greenhouse Gas Mitigation Study Report
Singh B. 2001, St. Lucia National Greenhouse Gas Inventory Report
Singh, B. and A. El Fouladi, 2000. A Simplified Step- by- Step Methodology for Calculating Greenhouse GasInventories using the IPCC Guidelines. Training Manual, 160 p (unpublished)
Stover, R.H. and Simmonds N. W., 1991, Bananas- Tropical Agricultural Series, Longman Scientific and Technical,England.

Saint Lucia’s Initial National Communication 84
APPENDICES

Country St. Lucia Inventory Year 1994Title of Inventory St.Lucia GHG InventoryContact Name Crispin d'AuvergneTitle Project CoordinatorOrganisation Sustainable Development UnitAddress Ministry of Finance snd Planning
Graheam Louisy Building, CastriesSt. Lucia
Phone (1-758) 451 8746Fax (1-758) 451 6958E-Mail [email protected] uncertainty addressed? YesRelated documents filed with IPCC All relevant Worksheets
Overview - 1

TABLE 1 SECTORAL REPORT FOR ENERGY(Sheet 1 of 3)
SECTORAL REPORT FOR NATIONAL GREENHOUSE GAS INVENTORIES(Gg)
GREENHOUSE GAS SOURCE AND SINK CATEGORIES CO2 CH4 N2O NOx CO NMVOC SO2 (1)
Total Energy 268 0.08056 0.00251 1 12.00861 2 607
A Fuel Combustion Activities (Sectoral Approach) 268 0.08056 0.00251 1 12.00861 2 607
1 Energy Industries 121 0.00494 0.00099 0 0.02472 0 0
a Public Electricity and Heat Production
b Petroleum Refining
c Manufacture of Solid Fuels and Other Energy Industries
2 Manufacturing Industries and Construction 6 0.00005 0.00002 0 0.00027 0 0
a Iron and Steel
b Non-Ferrous Metals
c Chemicals
d Pulp, Paper and Print
e Food Processing, Beverages and Tobacco
f Other (please specify)
(1) Please provide links from Worksheet 1-4 for each sector where applicable.
Overview - 2

TABLE 1 SECTORAL REPORT FOR ENERGY(Sheet 2 of 3)
SECTORAL REPORT FOR NATIONAL GREENHOUSE GAS INVENTORIES (Gg)
GREENHOUSE GAS SOURCE AND SINK CATEGORIES CO2 CH4 N2O NOx CO NMVOC SO2
3 Transport 104.65732 0.02752 0.00090 0.93572 10.84079 2.03476 0.00000
a Civil Aviation 0.00000 0.00000 0.00000 0.00000 0.00000 0.00000
b Road Transportation 103.92430 0.02752 0.00090 0.93572 10.84079 2.03476
c Railways 0.00000 0.00000 0.00000 0.00000 0.00000 0.00000
d Navigation 0.73302 0.00000 0.00000 0.00000 0.00000 0.00000
e Other (please specify) 0.00000
Pipeline Transport 0.00000
4 Other Sectors 33.47780 0.04790 0.00059 0.04585 1.14284 0.06061 0.00000
a Commercial/Institutional 28.32342 0.00265 0.00016 0.02652 0.00530 0.00133
b Residential 5.03968 0.04524 0.00043 0.01856 1.13690 0.05916
c Agriculture/Forestry/Fishing 0.11471 0.00000 0.00000 0.00077 0.00064 0.00013
5 Other (please specify) 2.97439 0.00014 0.00002 0.02298 0.00000 0.00575
B Fugitive Emissions from Fuels 0.00000 0.00000 0.00000 0.00000 0.00000 0.00000 0.00000
1 Solid Fuels 0.00000 0.00000 0.00000 0.00000 0.00000 0.00000 0.00000
a Coal Mining 0.00000
b Solid Fuel Transformation
c Other (please specify)
2 Oil and Natural Gas 0.00000 0.00000 0.00000 0.00000 0.00000 0.00000 0.00000
a Oil 0.00000 0.00000 0.00000 0.00000 0.00000
b Natural Gas 0.00000
c Venting and Flaring 0.00000
Overview - 3

TABLE 1 SECTORAL REPORT FOR ENERGY(Sheet 3 of 3)
SECTORAL REPORT FOR NATIONAL GREENHOUSE GAS INVENTORIES
(Gg)
GREENHOUSE GAS SOURCE AND SINK CATEGORIES CO2 CH4 N2O NOx CO NMVOC SO2
Memo Items (1)
International Bunkers 67.78921 0 0 0 0 0 0
Aviation 60.82695 0 0 0 0 0 0
Marine 6.96226 0 0 0 0 0 0
CO2 Emissions from Biomass 18.95604
(1) Please do not include in energy totals.
Overview - 4

TABLE 2 SECTORAL REPORT FOR INDUSTRIAL PROCESSES(Sheet 1 of 2)
SECTORAL REPORT FOR NATIONAL GREENHOUSE GAS INVENTORIES (Gg)
GREENHOUSE GAS SOURCE AND SINK CATEGORIES CO2 CH4 N2O NOx CO NMVOC SO2 HFCs PFCs SF6
P A P A P A
Total Industrial Processes 0.00000 0.00000 0 0 0 1.96207 0 0 1 0 0 0 0
A Mineral Products 0.00000 0.00000 0 0 0 1.70873 0 0 0 0 0 0 0
1 Cement Production 0.00000 0
2 Lime Production 0.00000
3 Limestone and Dolomite Use 0.00000
4 Soda Ash Production and Use 0.00000
5 Asphalt Roofing 0 0.00000
6 Road Paving with Asphalt 1.70873
7 Other (please specify) 0.00000 0.00000 0 0 0 0.00000 0 0 0 0 0 0 0
Glass Production 0.00000
Concrete Pumice Stone 0
B Chemical Industry 0.00000 0.00000 0 0 0 0.00000 0 0 0 0 0 0 0
1 Ammonia Production 0.00000 0 0.00000 0
2 Nitric Acid Production 0 0
3 Adipic Acid Production 0 0 0 0.00000
4 Carbide Production 0.00000 0.00000
5 Other (please specify) 0.00000 0 0 0.00000 0
C Metal Production 0.00000 0.00000 0 0 0 0.00000 0 0 0 0 0 0 0
1 Iron and Steel Production 0.00000 0 0 0.00000 0
2 Ferroalloys Production 0.00000
3 Aluminium Production 0.00000 0 0 0 0
4 SF6 Used in Aluminium and Magnesium Foundries 0
5 Other (please specify) 0.00000
P = Potential emissions based on Tier 1 Approach. A = Actual emissions based on Tier 2 Approach. This only applies in sectors where methods exist for both tiers.
Overview - 5
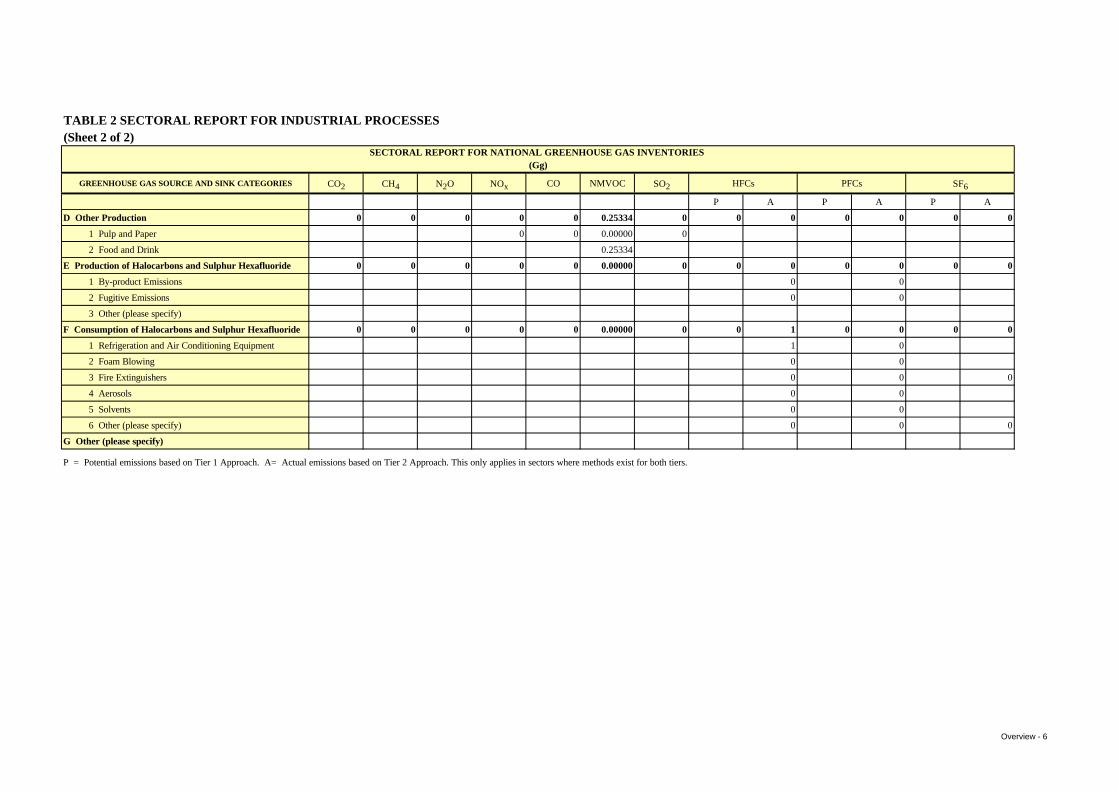
TABLE 2 SECTORAL REPORT FOR INDUSTRIAL PROCESSES(Sheet 2 of 2)
SECTORAL REPORT FOR NATIONAL GREENHOUSE GAS INVENTORIES (Gg)
GREENHOUSE GAS SOURCE AND SINK CATEGORIES CO2 CH4 N2O NOx CO NMVOC SO2 HFCs PFCs SF6
P A P A P A
D Other Production 0 0 0 0 0 0.25334 0 0 0 0 0 0 0
1 Pulp and Paper 0 0 0.00000 0
2 Food and Drink 0.25334
E Production of Halocarbons and Sulphur Hexafluoride 0 0 0 0 0 0.00000 0 0 0 0 0 0 0
1 By-product Emissions 0 0
2 Fugitive Emissions 0 0
3 Other (please specify)
F Consumption of Halocarbons and Sulphur Hexafluoride 0 0 0 0 0 0.00000 0 0 1 0 0 0 0
1 Refrigeration and Air Conditioning Equipment 1 0
2 Foam Blowing 0 0
3 Fire Extinguishers 0 0 0
4 Aerosols 0 0
5 Solvents 0 0
6 Other (please specify) 0 0 0
G Other (please specify)
P = Potential emissions based on Tier 1 Approach. A= Actual emissions based on Tier 2 Approach. This only applies in sectors where methods exist for both tiers.
Overview - 6

TABLE 3 SECTORAL REPORT FOR SOLVENT AND OTHER PRODUCT USE(Sheet 1 of 1)
SECTORAL REPORT FOR NATIONAL GREENHOUSE GAS INVENTORIES (Gg)
GREENHOUSE GAS SOURCE AND SINK CATEGORIES CO2 N2O NMVOC
Total Solvent and Other Product Use 0 0 0
A Paint Application
B Degreasing and Dry Cleaning
C Chemical Products, Manufacture and Processing
D Other (please specify)
Please account for the quantity of carbon released in the form of NMVOC in both the NMVOC and the CO2 columns.
Note: The Revised 1996 IPCC Guidelines do not provide methodologies for the calculation of emissions of N2O from solvent and
other product use. If you have reported such data, you should provide additional information (activity data and emission factors) used to make these estimates.
Overview - 7

TABLE 4 SECTORAL REPORT FOR AGRICULTURE(Sheet 1 of 2)
SECTORAL REPORT FOR NATIONAL GREENHOUSE GAS INVENTORIES (Gg)
GREENHOUSE GAS SOURCE AND SINK CATEGORIES CH4 N2O NOx CO NMVOC
Total Agriculture 0.49095 0.04777 0.00000 0.00000 0
A Enteric Fermentation 0.44497
1 Cattle 0.37057
2 Buffalo 0.00000
3 Sheep 0.00624
4 Goats 0.04857
5 Camels and Llamas 0.00000
6 Horses 0.00443
7 Mules and Asses 0.00000
8 Swine 0.01466
9 Poultry 0.00050
10 Other (please specify)
B Manure Management 0.04518 0.00000
1 Cattle 0.01063
2 Buffalo 0.00000
3 Sheep 0.00026
4 Goats 0.00214
5 Camels and Llamas 0.00000
6 Horses 0.00054
7 Mules and Asses 0.00000
8 Swine 0.02932
9 Poultry 0.00230
Overview - 8

TABLE 4 SECTORAL REPORT FOR AGRICULTURE(Sheet 2 of 2)
SECTORAL REPORT FOR NATIONAL GREENHOUSE GAS INVENTORIES (Gg)
GREENHOUSE GAS SOURCE AND SINK CATEGORIES CH4 N2O NOx CO NMVOC
B Manure Management (cont...)
10 Anaerobic 0
11 Liquid Systems 0
12 Solid Storage and Dry Lot 0
13 Other (please specify) 0
C Rice Cultivation 0.00080
1 Irrigated 0.00080
2 Rainfed 0.00000
3 Deep Water 0.00000
4 Other (please specify)
D Agricultural Soils 0
E Prescribed Burning of Savannas 0.00000 0 0 0
F Field Burning of Agricultural Residues (1) 0.00000 0 0 0
1 Cereals
2 Pulse
3 Tuber and Root
4 Sugar Cane
5 Other (please specify)
G Other (please specify)
Note: The Revised IPCC 1996 Guidelines do not provide methodologies for the calculation of CH4 emissions, and CH4 and N2O removals from agricultural soils, or
CO2 emissions from savanna burning or agricultural residues burning. If you have reported such data, you should provide additional information (activity data and
emissions factors) used to make these estimates.
(1) Sub-items of F should be linked to Worksheet 4-4 sheets 1 and 2.
Overview - 9

TABLE 5 SECTORAL REPORT FOR LAND-USE CHANGE AND FORESTRY(Sheet 1 of 1)
SECTORAL REPORT FOR NATIONAL GREENHOUSE GAS INVENTORIES (Gg)
GREENHOUSE GAS SOURCE AND SINK CATEGORIES CO2 Emissions CO2 Removals CH4 N2O NOx CO
Total Land-Use Change and Forestry (1) 0.00000 (1) -352.1047 0.29700 0.00204 0.07380 3
A Changes in Forest and Other Woody Biomass Stocks (1) 0.00000 (1) -516.0599
1 Tropical Forests
2 Temperate Forests
3 Boreal Forests
4 Grasslands/Tundra
5 Other (please specify)
B Forest and Grassland Conversion 68.06250 0.29700 0.00204 0.07380 3
1 Tropical Forests 68.06250
2 Temperate Forests 0.00000
3 Boreal Forests 0.00000
4 Grasslands/Tundra 0.00000
5 Other (please specify) 0.00000
C Abandonment of Managed Lands 0.0000
1 Tropical Forests 0.0000
2 Temperate Forests 0.0000
3 Boreal Forests 0.0000
4 Grasslands/Tundra 0.0000
5 Other (please specify) 0.0000
D CO2 Emissions and Removals from Soil (1) 95.89268 (1) 0.0000
E Other (please specify)
(1) The formula does not provide a total estimate of both CO2 emissions and CO2 removals. It estimates “net” emissions of CO2 and places a single number in either the CO2 emissions or CO2 removals column, as appropriate. Please note that for the purposes of reporting, the signs for removals are always (-) and for emissions (+).
Overview - 10

TABLE 6 SECTORAL REPORT FOR WASTE(Sheet 1 of 1)
SECTORAL REPORT FOR NATIONAL GREENHOUSE GAS INVENTORIES (Gg)
GREENHOUSE GAS SOURCE AND SINK CATEGORIES CO2(1) CH4 N2O NOx CO NMVOC
Total Waste 0.00000 27.79905 0.01794
A Solid Waste Disposal on Land 0.00000 27.79905 0.00000
1 Managed Waste Disposal on Land
2 Unmanaged Waste Disposal Sites
3 Other (please specify)
B Wastewater Handling 0.00000 0.00000 0.01794
1 Industrial Wastewater 0.00000
2 Domestic and Commercial Wastewater 0.00000 0.01794
3 Other (please specify)
C Waste Incineration
D Other (please specify)
(1) Note that CO2 from waste disposal and incineration should only be included if it stems from non-biological or inorganic waste sources.
Overview - 11

TABLE 7A SUMMARY REPORT FOR NATIONAL GREENHOUSE GAS INVENTORIES(Sheet 1 of 3)
SUMMARY REPORT FOR NATIONAL GREENHOUSE GAS INVENTORIES (Gg)
GREENHOUSE GAS SOURCE AND SINK CO2 CO2 CH4 N2O NOx CO NMVOC SO2 HFCs PFCs SF6
CATEGORIES Emissions Removals
P A P A P A
Total National Emissions and Removals 268 -352 28.66757 0.07026 1.41322 14.60736 4.07157 0.00000 0 1.33630 0 0 0 0
1 Energy 268 0 0.08056 0.00251 1.33942 12.00861 2.10949 0.00000
A Fuel Combustion (Sectoral Approach) 268 0.08056 0.00251 1.33942 12.00861 2.10949
1 Energy Industries 121 0.00494 0.00099 0.32956 0.02472 0.00824
2 Manufacturing Industries and Construction 6 0.00005 0.00002 0.00531 0.00027 0.00013
3 Transport 105 0.02752 0.00090 0.93572 10.84079 2.03476
4 Other Sectors 33 0.04790 0.00059 0.04585 1.14284 0.06061
5 Other (please specify) 3 0.00014 0.00002 0.02298 0.00000 0.00575
B Fugitive Emissions from Fuels 0 0.00000 0.00000 0.00000 0.00000 0.00000
1 Solid Fuels 0.00000
2 Oil and Natural Gas 0.00000 0.00000 0.00000 0.00000 0.00000
2 Industrial Processes 0 0 0.00000 0.00000 0.00000 0.00000 1.96207 0.00000 0 1.33630 0 0 0 0
A Mineral Products 0 0.00000 1.70873 0.00000
B Chemical Industry 0 0.00000 0.00000 0.00000 0.00000 0.00000 0.00000
C Metal Production 0 0.00000 0.00000 0.00000 0.00000 0.00000 0.00000 0 0.00000 0 0 0 0
D Other Production 0 0.00000 0.00000 0.25334 0.00000
E Production of Halocarbons and Sulphur 0 0.00000 0 0 0 0
Hexafluoride
F Consumption of Halocarbons and Sulphur 0 0.10672 0 0 0 0
Hexafluoride
G Other (please specify) 0 0.00000 0.00000 0.00000 0.00000 0.00000 0.00000 0 0
P = Potential emissions based on Tier 1 Approach. A = Actual emissions based on Tier 2 Approach.
Overview - 12

TABLE 7A SUMMARY REPORT FOR NATIONAL GREENHOUSE GAS INVENTORIES(Sheet 2 of 3)
SUMMARY REPORT FOR NATIONAL GREENHOUSE GAS INVENTORIES (Gg)
GREENHOUSE GAS SOURCE AND SINK CO2 CO2 CH4 N2O NOx CO NMVOC SO2 HFCs PFCs SF6
CATEGORIES Emissions Removals
P A P A P A
3 Solvent and Other Product Use 0.00000 0.00000 0.000000
4 Agriculture 0.49095 0.04777 0.00000 0.00000
A Enteric Fermentation 0.44497
B Manure Management 0.04518 0.00000
C Rice Cultivation 0.00080
D Agricultural Soils 0.04777
E Prescribed Burning of Savannas 0.00000 0.00000 0.00000 0.00000
F Field Burning of Agricultural Residues 0.00000 0.00000 0.00000 0.00000
G Other (please specify) 0.00000 0.00000
5 Land-Use Change & Forestry (1) 0.00000 (1) -352 0.29700 0.00204 0.07380 2.59875
A Changes in Forest and Other Woody
Biomass Stocks (1) 0.00000 (1) -516
B Forest and Grassland Conversion 68.06250 0.29700 0.00204 0.07380 2.59875
C Abandonment of Managed Lands 0
D CO2 Emissions and Removals from
Soil (1) 95.89268 (1) 0
E Other (please specify) 0.00000 0 0.00000 0.00000 0.00000 0.00000
6 Waste 27.79905 0.01794 0.00000 0.00000 0.000000 0
A Solid Waste Disposal on Land 27.79905
B Wastewater Handling 0.00000 0.01794
C Waste Incineration
D Other (please specify) 0.00000 0.00000
7 Other (please specify)
(1) The formula does not provide a total estimate of both CO2 emissions and CO2 removals. It estimates “net” emissions of CO2 and places a single number in either the CO2 emissions
or CO2 removals column, as appropriate. Please note that for the purposes of reporting, the signs for uptake are always (-) and for emissions (+).
Overview - 13
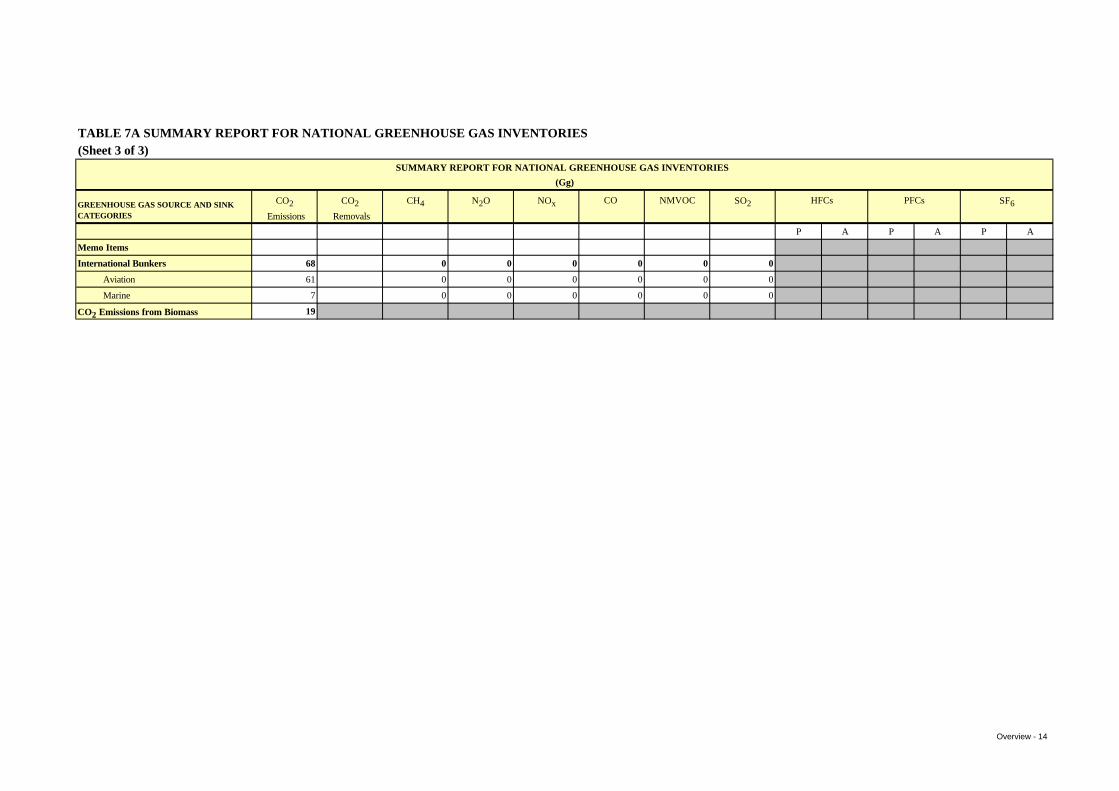
TABLE 7A SUMMARY REPORT FOR NATIONAL GREENHOUSE GAS INVENTORIES(Sheet 3 of 3)
SUMMARY REPORT FOR NATIONAL GREENHOUSE GAS INVENTORIES
(Gg)
GREENHOUSE GAS SOURCE AND SINK CO2 CO2 CH4 N2O NOx CO NMVOC SO2 HFCs PFCs SF6
CATEGORIES Emissions Removals
P A P A P A
Memo Items
International Bunkers 68 0 0 0 0 0 0
Aviation 61 0 0 0 0 0 0
Marine 7 0 0 0 0 0 0
CO2 Emissions from Biomass 19
Overview - 14
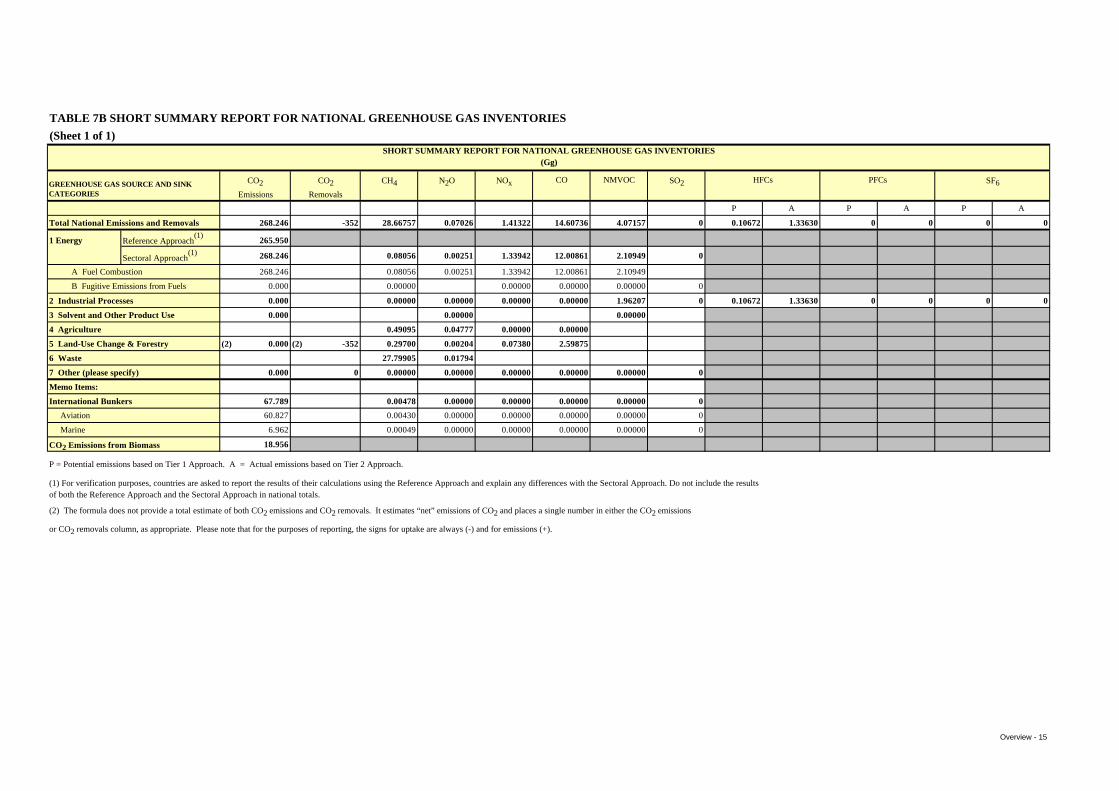
TABLE 7B SHORT SUMMARY REPORT FOR NATIONAL GREENHOUSE GAS INVENTORIES
(Sheet 1 of 1)SHORT SUMMARY REPORT FOR NATIONAL GREENHOUSE GAS INVENTORIES
(Gg)
GREENHOUSE GAS SOURCE AND SINK CO2 CO2 CH4 N2O NOx CO NMVOC SO2 HFCs PFCs SF6CATEGORIES Emissions Removals
P A P A P A
Total National Emissions and Removals 268.246 -352 28.66757 0.07026 1.41322 14.60736 4.07157 0 0.10672 1.33630 0 0 0 0
1 Energy Reference Approach(1)
265.950
Sectoral Approach(1) 268.246 0.08056 0.00251 1.33942 12.00861 2.10949 0
A Fuel Combustion 268.246 0.08056 0.00251 1.33942 12.00861 2.10949
B Fugitive Emissions from Fuels 0.000 0.00000 0.00000 0.00000 0.00000 0
2 Industrial Processes 0.000 0.00000 0.00000 0.00000 0.00000 1.96207 0 0.10672 1.33630 0 0 0 0
3 Solvent and Other Product Use 0.000 0.00000 0.00000
4 Agriculture 0.49095 0.04777 0.00000 0.00000
5 Land-Use Change & Forestry (2) 0.000 (2) -352 0.29700 0.00204 0.07380 2.59875
6 Waste 27.79905 0.01794
7 Other (please specify) 0.000 0 0.00000 0.00000 0.00000 0.00000 0.00000 0
Memo Items:
International Bunkers 67.789 0.00478 0.00000 0.00000 0.00000 0.00000 0
Aviation 60.827 0.00430 0.00000 0.00000 0.00000 0.00000 0
Marine 6.962 0.00049 0.00000 0.00000 0.00000 0.00000 0
CO2 Emissions from Biomass 18.956
P = Potential emissions based on Tier 1 Approach. A = Actual emissions based on Tier 2 Approach.
(1) For verification purposes, countries are asked to report the results of their calculations using the Reference Approach and explain any differences with the Sectoral Approach. Do not include the resultsof both the Reference Approach and the Sectoral Approach in national totals.
(2) The formula does not provide a total estimate of both CO2 emissions and CO2 removals. It estimates “net” emissions of CO2 and places a single number in either the CO2 emissions
or CO2 removals column, as appropriate. Please note that for the purposes of reporting, the signs for uptake are always (-) and for emissions (+).
Overview - 15

(Sheet 1 of 3)OVERVIEW TABLE
GREENHOUSE GAS SOURCE CO2 CH4 N2O NOx CO NMVOC SO2
AND SINK CATEGORIES
Estimate Quality Estimate Quality Estimate Quality Estimate Quality Estimate Quality Estimate Quality Estimate Quality
Total National Emissions ALL Quality ALL H ALL H ALL H ALL H ALL H ALL Hand Removals ALL Quality ALL H ALL H ALL H ALL H ALL H ALL H1 Energy
A Fuel Combustion Activities
Reference Approach ALL H
Sectoral Approach ALL H ALL H ALL H ALL H ALL H ALL H ALL H
1 Energy Industries ALL H ALL H ALL H ALL H ALL H ALL H ALL H
2 Manufacturing ALL H ALL H ALL H ALL H ALL H ALL H ALL H Industries and ALL H ALL H ALL H ALL H ALL H ALL H ALL H Construction ALL H ALL H ALL H ALL H ALL H ALL H ALL H
3 Transport ALL H ALL H ALL H ALL H ALL H ALL H ALL H
4 Other Sectors ALL H ALL H ALL H ALL H ALL H ALL H ALL H
5 Other (please specify) ALL H ALL H ALL H ALL H ALL H ALL H ALL H
B Fugitive Emissions from NE - NE - NE - NE - NE - NE - NE -Fuels
1 Solid Fuels NO - NO - NO - NO - NO - NO - NO -
2 Oil and Natural Gas NA - NA - NA - NA - NA - NA - NA -
2 Industrial Processes
A Mineral Products PART M PART M PART M PART M PART M PART M PART M
B Chemical Industry NO - NO - NO - NO - NO - NO - NO -
C Metal Production NO - NO - NO - NO - NO - NO - NO -
D Other Production PART M PART M PART M PART M PART M PART M PART M
E Production of Halocarbons NA - NA - NA - NA - NA - NA - NA -and Sulphur Hexafluoride
Overview - 16
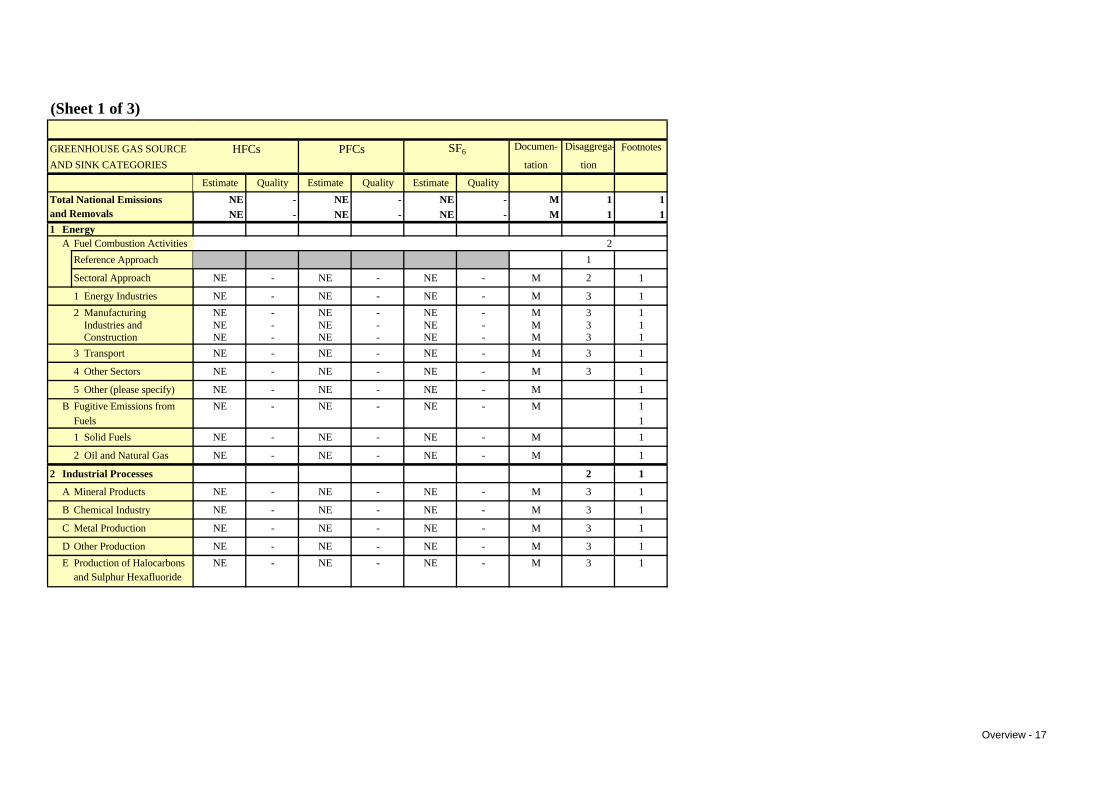
(Sheet 1 of 3)
GREENHOUSE GAS SOURCE
AND SINK CATEGORIES
Total National Emissions and Removals
1 EnergyA Fuel Combustion Activities
Reference Approach
Sectoral Approach
1 Energy Industries
2 Manufacturing Industries and Construction
3 Transport
4 Other Sectors
5 Other (please specify)
B Fugitive Emissions from Fuels
1 Solid Fuels
2 Oil and Natural Gas
2 Industrial Processes
A Mineral Products
B Chemical Industry
C Metal Production
D Other Production
E Production of Halocarbonsand Sulphur Hexafluoride
HFCs PFCs SF6Documen- Disaggrega- Footnotes
tation tion
Estimate Quality Estimate Quality Estimate Quality
NE - NE - NE - M 1 1NE - NE - NE - M 1 1
2
1
NE - NE - NE - M 2 1
NE - NE - NE - M 3 1
NE - NE - NE - M 3 1NE - NE - NE - M 3 1NE - NE - NE - M 3 1
NE - NE - NE - M 3 1
NE - NE - NE - M 3 1
NE - NE - NE - M 1
NE - NE - NE - M 11
NE - NE - NE - M 1
NE - NE - NE - M 1
2 1
NE - NE - NE - M 3 1
NE - NE - NE - M 3 1
NE - NE - NE - M 3 1
NE - NE - NE - M 3 1
NE - NE - NE - M 3 1
Overview - 17

(Sheet 2 of 3)OVERVIEW TABLE
GREENHOUSE GAS SOURCE CO2 CH4 N2O NOx CO NMVOC SO2AND SINK CATEGORIES
Estimate Quality Estimate Quality Estimate Quality Estimate Quality Estimate Quality Estimate Quality Estimate Quality
Industrial Processes (cont...)
F Consumption of Halocarbons and Sulphur Hexafluoride
Potential (1)PART M PART M PART M PART M PART M PART M PART M
Actual (2)PART M PART M PART M PART M PART M PART M PART M
G Other (please specify) NA - NA - NA - NA - NA - NA - NA -
3 Solvent and Other NE - NE - NE - NE - NE - NE - NE -Product Use
4 Agriculture PART
A Enteric Fermentation ALL H ALL H ALL H ALL H ALL H ALL H ALL H
B Manure Management PART L PART L PART L PART L PART L PART L PART L
C Rice Cultivation NO - NO - NO - NO - NO - NO - NO -
D Agricultural Soils NE - NE - NE - NE - NE - NE - NE -
E Prescribed Burning of NO - NO - NO - NO - NO - NO - NO -Savannas
F Field Burning of PART M PART M PART M PART M PART M PART M PART M
Agricultural Residues
G Other (please specify) NA - NA - NA - NA - NA - NA - NA -
5 Land-Use Change & PARTForestry
A Changes in Forest and ALL L ALL L ALL L ALL L ALL L ALL L ALL L
Other Woody BiomassStocks
B Forest and Grassland PART L PART L PART L PART L PART L PART L PART LConversion
(1) Potential emissions based on Tier 1 Approach.
(2) Actual emissions based on Tier 2 Approach.
Overview - 18

(Sheet 2 of 3)
GREENHOUSE GAS SOURCE
AND SINK CATEGORIES
Industrial Processes (cont...)
F Consumption of Halocarbons and Sulphur Hexafluoride
Potential (1)
Actual (2)
G Other (please specify)
3 Solvent and OtherProduct Use
4 Agriculture
A Enteric Fermentation
B Manure Management
C Rice Cultivation
D Agricultural Soils
E Prescribed Burning ofSavannas
F Field Burning of Agricultural Residues
G Other (please specify)
5 Land-Use Change & Forestry
A Changes in Forest and
Other Woody BiomassStocks
B Forest and Grassland Conversion
(1) Potential emissions based on Tier 1 Approach.
(2) Actual emissions based on Tier 2 Approach.
HFCs PFCs SF6 Documen- Disaggre- Footnotestation gation
Estimate Quality Estimate Quality Estimate Quality
PART M PART M PART M L 3 1
PART M PART M PART M L 3 1
NA - NA - NA - NA NA NA
NE - NE - NE - NA NA NA
L 2 1
NE - NE - NE - L 3 1
NE - NE - NE - L 3 1
NE - NE - NE - NA NA NA
Ne - Ne - Ne - NA NA NA
NE - NE - NE - NA NA NA
PART M PART M PART M L 3 1
- - -
NA - NA - NA - NA NA NA
L 2 1
NE - NE - NE - L 3 1
NE - NE - NE - L 3 1
Overview - 19
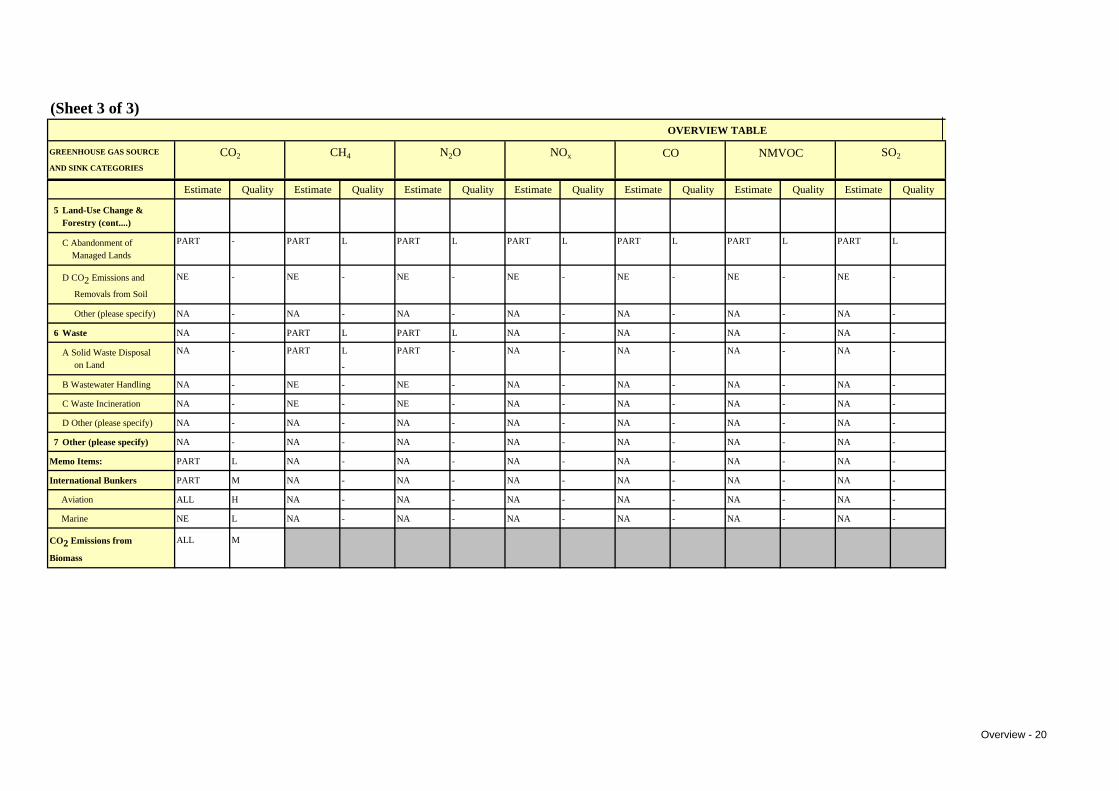
(Sheet 3 of 3)OVERVIEW TABLE
GREENHOUSE GAS SOURCE CO2 CH4 N2O NOx CO NMVOC SO2
AND SINK CATEGORIES
Estimate Quality Estimate Quality Estimate Quality Estimate Quality Estimate Quality Estimate Quality Estimate Quality
5 Land-Use Change &Forestry (cont....)
C Abandonment of PART - PART L PART L PART L PART L PART L PART L
Managed Lands
D CO2 Emissions and NE - NE - NE - NE - NE - NE - NE -
Removals from Soil
Other (please specify) NA - NA - NA - NA - NA - NA - NA -
6 Waste NA - PART L PART L NA - NA - NA - NA -
A Solid Waste Disposal NA - PART L PART - NA - NA - NA - NA -
on Land -
B Wastewater Handling NA - NE - NE - NA - NA - NA - NA -
C Waste Incineration NA - NE - NE - NA - NA - NA - NA -
D Other (please specify) NA - NA - NA - NA - NA - NA - NA -
7 Other (please specify) NA - NA - NA - NA - NA - NA - NA -
Memo Items: PART L NA - NA - NA - NA - NA - NA -
International Bunkers PART M NA - NA - NA - NA - NA - NA -
Aviation ALL H NA - NA - NA - NA - NA - NA -
Marine NE L NA - NA - NA - NA - NA - NA -
CO2 Emissions from ALL M
Biomass
Overview - 20

(Sheet 3 of 3)
GREENHOUSE GAS SOURCE
AND SINK CATEGORIES
5 Land-Use Change &Forestry (cont....)
C Abandonment of Managed Lands
D CO2 Emissions and
Removals from Soil
Other (please specify)
6 Waste
A Solid Waste Disposal on Land
B Wastewater Handling
C Waste Incineration
D Other (please specify)
7 Other (please specify)
Memo Items:
International Bunkers
Aviation
Marine
CO2 Emissions from
Biomass
HFCs PFCs SF6 Documen- Disaggre- Footnotes
tation gation
Estimate Quality Estimate Quality Estimate Quality
PART L PART L PART L 1 3 1
NE - NE - NE - 1 3 1
NA - NA - NA - 1 3 1
NA - NA - NA - 1 3 1
NA - NA - NA - 1 3 1
NA - NA - NA - 1 3 1
NA - NA - NA - 1 3 1
NA - NA - NA - 1 3 1
NA - NA - NA - 1 3 1
NA - NA - NA - 1 3 1
NA - NA - NA - 1 3 1
NA - NA - NA - 1 3 1
NA - NA - NA - 1 3 1
Overview - 21