in live cells and ex vivo tissue dissertation submitted to the...
TRANSCRIPT
HIGH AFFINITY PEPTIDE NEUROTOXIN QUANTUM DOT CONJUGATES
FOR DETECTING ENDOGENOUS TARGETS
IN LIVE CELLS AND EX VIVO TISSUE
By
Rebecca Lee Orndorff
Dissertation
Submitted to the Faculty of the
Graduate School of Vanderbilt University
in partial fulfillment of the requirements
for the degree of
DOCTOR OF PHILOSOPHY
in
Chemistry
August, 2009
Nashville, Tennessee
Approved:
Professor Sandra J. Rosenthal
Professor Michael P. Stone
Professor David W. Wright
Professor Eva M. Harth

Copyright © 2009 by Rebecca Lee Orndorff All Rights Reserved

iii
To my parents, my brother, and our dogs—past and present

ACKNOWLEDGEMENTS
I wish to express gratitude to a number of people that have aided me in some way
as I have pursued my education. My thankfulness for the opportunity to pursue this
degree is directed at my advisor, Dr. Sandra J. Rosenthal. She provided me with the
opportunity to lead my own studies and develop my independence as a scientist through
the freedom afforded me toward the design and the execution of experiments and project
development. I would also like to acknowledge Dr. Rosenthal’s research group, past and
present, who have provided insight and support. Additionally, I would like to express my
gratitude to my doctoral committee, Dr. Eva Harth, Dr. Michael Stone, and Dr. David
Wright, for guiding me and fostering my development as a researcher over the past years.
With that I would like to extend thanks to the Department of Chemistry at Vanderbilt
University for providing the opportunity to pursue my education, as well as the funding
necessary to perform the research. The National Institutes of Health are also
acknowledged for their contribution toward funding this work. I must also express my
gratitude to Dr. David Hercules and Dr. Anthony Gies for providing me the opportunity
to support their work in mass spectrometry experimentation of various polymers. A
thank you is extended to anyone that I have been remiss in mentioning.
Lastly, but most importantly, I wish to express my gratitude to my family—my
parents, my brother, and our dogs. Without their unconditional support and love, I could
not have made it this far.
iv

TABLE OF CONTENTS
Page
DEDICATION................................................................................................................... iii ACKNOWLEDGEMENTS............................................................................................... iv LIST OF TABLES........................................................................................................... viii LIST OF FIGURES ........................................................................................................... ix LIST OF SCHEMES........................................................................................................ xiv Chapter
I. INTRODUCTION .............................................................................................1
1.1: Quantum Dot Nanocrystals.....................................................................1 1.2: Quantum Dot Incorporation with Biology..............................................3 1.3: Quantum Dot Surface Modifications......................................................5 1.4: Inhibiting Ion Channels with Peptide Neurotoxins.................................6 1.5: Peptide Neurotoxin Conjugation to Quantum Dots................................9 1.6: α-Bungarotoxin Structure and Properties .............................................11 1.7: Chlorotoxin Structure and Properties ...................................................14 1.8: Dendrotoxin-1 Structure and Properties ...............................................18 1.9: Research Overview...............................................................................20 1.10: Summary...............................................................................................22
II. METHODS AND MATERIALS.....................................................................23
2.1: Introduction............................................................................................23 2.2: Neurotoxin Handling Safety Protocols ..................................................24
2.3: Quantum Dot Objective for Detection within Animal Tissue ...............24 2.4: Mouse Diaphragm Ex Vivo Tissue Preparation ....................................25 2.5: Quantum Dot Time Dependent Detection of α-Bungarotoxin ..............25 2.6: α-Bungarotoxin Binding Site Specificity Assay....................................30 2.7: α-Bungarotoxin Affinity Assay .............................................................31 2.8: Streptavidin-Quantum Dot Photobleaching Assays ..............................32 2.9: Quantum Dot Objective for Endogenous Detection in Living Cells .....33 2.10: Biotin-Streptavidin Detection of Endogenous Proteins in Live Cells ...34 2.11: Cell Culture Maintenance and Conditions.............................................36 2.12: Detection of Biotinylated Chlorotoxin in Saline ...................................36 2.13: Detection of Biotinylated Chlorotoxin in Buffers at 4°C ......................38
v

2.14: Peptide Neurotoxin Conjugation to Quantum Dots...............................39 2.15: Confirmation of Toxin and Quantum Dot Confirmation.......................41 2.16: Matrix Metalloproteinase-2 Antibody Colocalization in Cell Culture ..42 2.17: Potassium Channel Kv1.1 Antibody Colocalization in Cell Culture.....43 2.18: CTX:QD525 Conjugate Blocking Assays .............................................45 2.19: DTX-1:QD655 Conjugate Blocking Assays..........................................46 2.20: Chlorotoxin Affinity Determined By Saturation Binding Curve...........48 2.21: Dendrotoxin-1 Affinity Determined By Saturation Binding Curve ......49 2.22: Multiplexing Experimentation...............................................................49 2.23: Flow Cytometry .....................................................................................51 2.24: Confocal Microscopy.............................................................................52
III. TARGETING NICOTINIC ACETYLCHOLINE RECEPTORS ...................53
3.1: Introduction............................................................................................53 3.2: α-Bungarotoxin ......................................................................................55 3.3: α-Bungarotoxin Affinity ........................................................................56 3.4: Quantum Dot Labeling Time-Dependence in Ex Vivo Tissue..............58 3.5: Quantum Dot and Alexafluor Comparative Analyses ...........................60 3.6: Photostability in Ex Vivo Tissue ...........................................................63 3.7: Summary................................................................................................65
IV. TARGETING ENDOGENOUS TARGETS IN LIVE CANCER CELLS......68
4.1: Introduction............................................................................................68 4.2: Chlorotoxin ............................................................................................68 4.3: Dendrotoxin-1........................................................................................70 4.4: Preliminary Experiments with Chlorotoxin and Glioma Cells..............71 4.5: Biotinylated Chlorotoxin Detection by Streptavidin Quantum Dots.....71 4.6: Conditions Influencing Biotinylated Chlorotoxin Detection.................74 4.7: Neurotoxin Conjugated Quantum Dots .................................................77 4.8: Neurotoxin Nanoconjugates and Antibody Colocalization Analyses....78 4.9: Chlorotoxin Quantum Dot Conjugate Time-Dependent Blocking ........81 4.10: Dendrotoxin-1 Nanoconjugate Time-Dependent Blocking...................84 4.11: Peptide Toxin Quantum Dot Conjugate Saturation Binding Analyses..86 4.12: Quantum Dot Conjugate Multiplexing Detection in Live Cells ............89 4.13: Flow Cytometry .....................................................................................93 4.14: Summary..............................................................................................100
V. CONCLUSIONS............................................................................................102 Appendix A. COMPUTATIONS FOR MASS SPECTROMETRY ...................................117 A.1: Introduction.........................................................................................117
vi

A.2: Computation Methods.........................................................................118 A.3: Polystyrene Summary of Experimental Results .................................118 A.4: Results for Polystyrene Derivatives....................................................120 A.5: PPD-T, MP-Amide, PBO, and PBO-Amide.......................................125 A.6: Summary .............................................................................................131 REFERENCES ..........................................................................................................132
vii

LIST OF TABLES
Table Page 1.1: α-Bungarotoxin Amino Acid Sequence.................................................................12 1.2: Chlorotoxin Amino Acid Sequence.......................................................................14 1.3: Dendrotoxin-1 Amino Acid Sequence...................................................................19 2.1: Outline for Experimental Methodology.................................................................23 A.1: Calculated Atomization Values Using DFT/B3LYP/6-31G* Level
of Theory in Gaussian03 for Polystyrene ............................................................120 A.2: Polystyrene and Polystyrene Derivatives Calculated Values for
Specified Bonds ...................................................................................................121 A.3: Poly(α-methylstyrene) and Polystyrene Calculated Values for
Specified Bonds and Reactions............................................................................124 A.4: Initial Calculated Values of the Bonds Specified for Representative
PPD-T and MP-Amide Structures .......................................................................126 A.5: PBO Predicted Homolytic Cleavage Bond Energies ...........................................129
viii

LIST OF FIGURES
Figure Page 1.1: Cartoon of Quantum Dot Size-Dependent Emission...............................................2 1.2: Cartoon of General Quantum Dot Structure ............................................................4 1.3: Peptide-Mediated Quantum Dot Inhibition of Ion Channels...................................8 1.4: Conjugation Methods for Binding Neurotoxin Peptides to
Quantum Dot Conjugates.......................................................................................10 1.5: Illustration of α-Bungarotoxin Structure ...............................................................13 1.6: Illustration of Chlorotoxin Structure......................................................................15 1.7: Cell Volume Reduction .........................................................................................17 1.8: Illustration of Dendrotoxin-1 Structure .................................................................20 2.1: Representation of Biotinylated α-Bungarotoxin Labeling of
Nicotinic Acetylcholine Receptors at the Neuromuscular Junction ......................26 2.2: Aerial View of Labeling with Biotinylated α-Bungarotoxin and
Anti-β-Subunit on a Nicotinic Acetylcholine Receptor.........................................27 2.3: Representation of Streptavidin-QD655 Conjugate Detection of
Biotinylated α-Bungarotoxin in Diaphragm Tissue...............................................28 2.4: Overhead View of Two-Step Detection Methodology Utilizing the
Strong Binding Interaction Between Streptavidin and Biotin ...............................29 2.5: Depiction of Biotinylated α-Bungarotoxin Binding Inhibited by
Unconjugated α-Bungarotoxin...............................................................................30 2.6: View from Above of α-Bungarotoxin Bound to Nicotinic
Acetylcholine Receptors ........................................................................................32 2.7: Illustration of the First Step of a Two-Step Detection Protocol for
Detecting Endogenous Proteins within Cell Cultures............................................37
ix

2.8: Second Step of a Two-Step Detection Protocol Using a
Biotinylated Chlorotoxin to Facilitate Avidin-Linked Probe Labeling .................................................................................................................38
2.9: Quantum Dot Fluorescence Conjugation Analysis via Gel
Electrophoresis Techniques ...................................................................................41 2.10: Representation of Chlorotoxin Quantum Dot Conjugates Labeling
Endogenous Proteins in Live Cell Culture.............................................................43 2.11: Representation of Dendrotoxin-1 Quantum Dot Conjugates
Labeling Endogenous Proteins in Live Cell Culture .............................................44 2.12: Unconjugated Chlorotoxin Blocks Chlorotoxin Quantum Dot
Conjugates..............................................................................................................45 2.13: Dendrotoxin-1 Quantum Dot Conjugates are Blocked from
Binding by Unconjugated Dendrotoxin-1 in Live Cells ........................................47 2.14: Representation of Multiplexing Experimentation .................................................50 3.1: Representation of Muscle-Type Nicotinic Acetylcholine Receptors ....................53 3.2: Biotinylated α-Bungarotoxin Saturation Binding Curve Detected
with Streptavidin Quantum Dots at Neuromuscular Junction Synapses.................................................................................................................57
3.3: Time-Dependence Labeling of Neuromuscular Junctions.....................................59 3.4: Time-Dependence Labeling of Neuromuscular Junctions with
Biotinylated α-Bungarotoxin After Seven Day Blocking Solution Incubation ..............................................................................................................60
3.5: Streptavidin-QD655s and Streptavidin-Alexafluor555s Detection
of Biotinylated α-Bungarotoxin .............................................................................61 3.6: Pre-Treatment of Neuromuscular Junction Synapses with 100nM
α-Bungarotoxin ......................................................................................................63 3.7: Photostability of Quantum Dots Versus Alexafluor Dyes.....................................65 4.1: Preliminary Evidence of Biotinylated Chlorotoxin Effectiveness as
a Peptide Label Using Streptavidin-QD655 ..........................................................74
x

4.2: Additional Evidence that Chlorotoxin is an Effective Probe for Use in Quantum Dot Detection Studies ........................................................................77
4.3: Antibody Colocalization of Endogenous Matrix Metalloproteinase-
2 Expression in Live C6 Glioma Cells ..................................................................79 4.4: Antibody Colocalization of Endogenous Kv1.1 Expression in Live
C6 Glioma Cells.....................................................................................................80 4.5: Chlorotoxin Pre-Incubation Blocks CTX:QD525 Detection in Live
Culture—Qualitative Analysis...............................................................................82 4.6: Chlorotoxin Pre-Incubation Blocks CTX:QD525 Detection in Live
Culture—Quantitative Analysis.............................................................................83 4.7: Dendrotoxin-1 Pre-Incubation Blocks DTX-1:QD655 Detection in
Live Culture—Qualitative Analysis ......................................................................84 4.8: Dendrotoxin-1 Pre-Incubation Blocks DTX-1:QD655 Detection in
Live Culture—Quantitative Analysis ....................................................................85 4.9: Saturation Binding Curve for CTX:QD525...........................................................87 4.10: Saturation Binding Curve for DTX-1:QD655 .......................................................88 4.11: CTX:QD525 and DTX-1:QD655 Multiplexing Detection
Distinguishes Between Cancer and Non-Cancer Cells in Live Culture....................................................................................................................89
4.12: CTX:QD525 Fluorescence is Statistically Greater in the Cancer
Cell Lines Examined than in the Non-Cancer Cell Lines......................................91 4.13: DTX-1:QD655 Fluorescence is Statistically Greater in the Cancer
Cell Lines Examined than in the Non-Cancer Cell Lines......................................92 4.14: Flow Cytometry Histograms Describing CTX:QD525 Detection
within C6 Glioma Cell Populations .......................................................................93 4.15: Quantitative Flow Cytometry Data for CTX:QD525 Blocking
Assays in C6 Glioma Cells ....................................................................................94 4.16: Flow Cytometry Histograms Describing DTX-1:QD655 Detection
within C6 Glioma Cell Populations .......................................................................95 4.17: Quantitative Flow Cytometry Data for DTX-1:QD655 Detection
within C6 Glioma Cell Populations .......................................................................96
xi
4.18: Flow Cytometry Histograms Describing CTX:QD525 and DTX-
1:QD655 Dual Labeling in Multiple Cell Lines ....................................................98 4.19: Quantitative Flow Cytometry Analyses CTX:QD525 and DTX-
1:QD655 Dual Labeling in Multiple Cell Lines ....................................................99 5.1: Biotinylation of α-Bungarotoxin Enables Streptavidin Quantum
Dot Detection within Ex Vivo Tissue..................................................................104 5.2: Streptavidin Quantum Dot Detection is Blocked within Ex Vivo
Diaphragm Tissue Due to Previous Exposure to α-Bungarotoxin.......................106 5.3: Chlorotoxin Conjugated Quantum Dots Bind to Matrix
Metalloproteinase-2 within Live C6 Glioma Cells..............................................108 5.4: Dendrotoxin-1 Conjugated Quantum Dots Bind to Kv1.1
Potassium Channels in Live C6 Glioma Cells.....................................................109 5.5: Both Chlorotoxin and Dendrotoxin-1 Block Free Binding Sites
within Live C6 Glioma Cell Cultures ..................................................................110 5.6: Multiplexing Experimentation Reveals Higher Expression Levels
of Matrix Metalloproteinase-2 and Kv1.1 Potassium Channels ..........................111 5.7: Two Methodologies for Quantum Dot Detection of Endogenous
Biological Targets................................................................................................113 A.1: Calculation Diagram Representing General Methodology Utilized
for Organic Polymer Bond Energy Calculations .................................................117 A.2: Polystyrene Fragment Used to Determine Atomization Energies
for Specified Bonds..............................................................................................119 A.3: Polystyrene Derivative Fragments Used to Calculate Energies of
the Indicated Bonds..............................................................................................121 A.4: Poly(α-methylstyrene) Representative Molecule Used for DFT
Calculations..........................................................................................................122 A.5: Representation of the 1,2-Phenyl Shift Reaction Observed During
Poly(α-methylstyrene) Fragmentation .................................................................123 A.6: Monomer Reversion Reaction for Poly(α-methylstyrene)...................................123 A.7: Model Molecules for PPD-T and MP-Amide Industrial Polymers .....................126
xii

A.8: PPD-T Structures for Calculations to Determine the Cationic Influence on Fragmentation .................................................................................127
A.9: MP-Amide Structures for Calculations to Determine the Cationic
Influence on Fragmentation .................................................................................128 A.10: Representative Structure of PBO Polymer and Preferential
Fragmentation Site Illustrating Homolytic Cleavage of the Molecule ..............................................................................................................129
A.11: PBO-Amide Models for Computations to Discern the Probable
Fragmentation Sites Along the Polymer ..............................................................130
xiii

LIST OF SCHEMES
Scheme Page 2.1: Biotinylation Reaction Used for Biotinylation of Chlorotoxin .............................34 2.2: High Affinity Peptide Neurotoxin Conjugation to ITK Quantum
Dot Amino(PEG) 525s and 655s ...........................................................................40
xiv

1
CHAPTER I
INTRODUCTION
1.1: Quantum Dot Nanocrystals
Quantum dots are nanocrystals composed of semiconductors arranged in a
core/shell structure. Typical composition consists of a CdSe core, although CdTe may
also be used to produce the nanocrystals.1-3 To enhance the photoemission properties of
the material, a shell of ZnS is commonly added to the outer surface of the nanocrystal
core.4 Following shelling, various surface chemistry modifications may be performed to
make the nanocrystals suitable for their intended application.5, 6 Due to their structure
and composition, quantum dots exhibit unique photophysical properties that are not seen
with organic fluorophores, such as near 100% quantum yield.7 These unique
photophysical properties are potentially advantageous for integration of nanomaterials
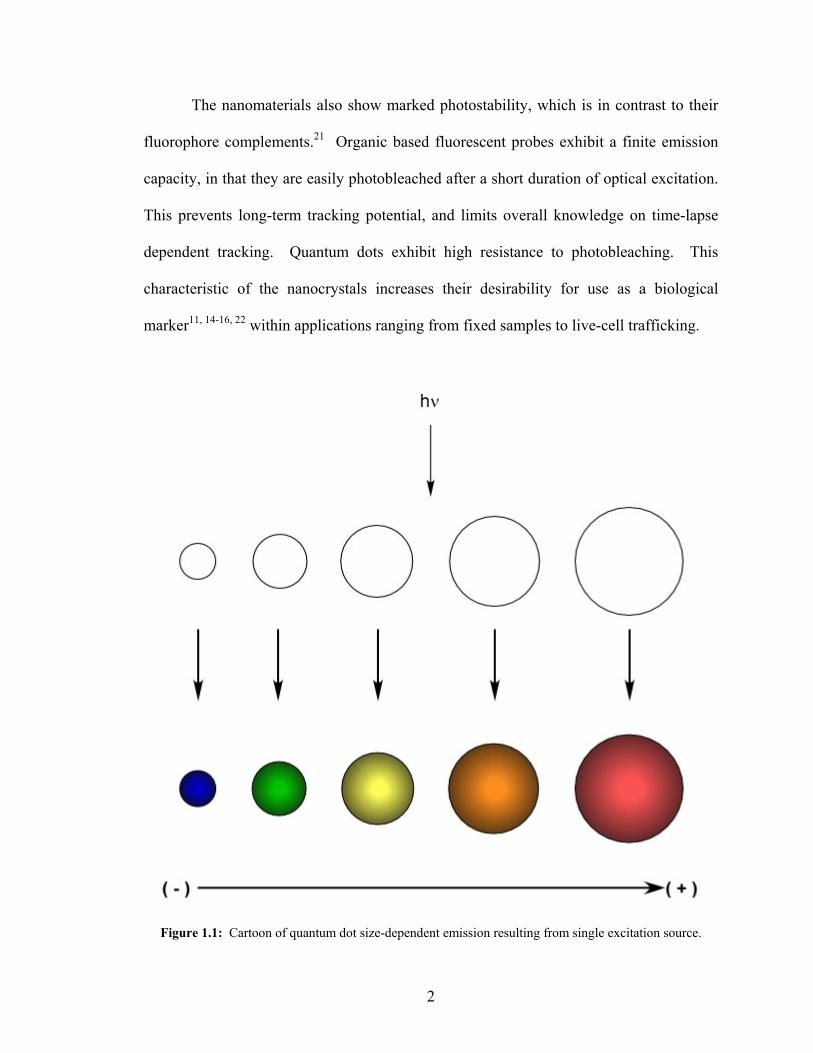
with bioscience assays.8 Quantum dots enable the possibility of multiplexing
experiments, a methodology wherein a single excitation source excites multiple
fluorescent markers and results in separate and unique emission spectra (Figure 1.1).
This quantum dot ability is due to their properties of broad excitation spectra, narrow
emission spectra, and emission spectra size and composition tunability that spans the
visible spectrum.4, 9-17 Recent evidence has supported the use of alloy nanocrystals to
produce composition-based emission spectra tunability, in addition to nanocrystal size-
based tunability.18-20 This affords the capacity to design nanoprobes with emission
properties that meet size requirements for specific applications.
The nanomaterials also show marked photostability, which is in contrast to their
fluorophore complements.21 Organic based fluorescent probes exhibit a finite emission
capacity, in that they are easily photobleached after a short duration of optical excitation.
This prevents long-term tracking potential, and limits overall knowledge on time-lapse
dependent tracking. Quantum dots exhibit high resistance to photobleaching. This
characteristic of the nanocrystals increases their desirability for use as a biological
marker11, 14-16, 22 within applications ranging from fixed samples to live-cell trafficking.
Figure 1.1: Cartoon of quantum dot size-dependent emission resulting from single excitation source.
2
1.2: Quantum Dot Incorporation with Biology
Incorporation of semiconductor nanocrystals into biological assays is facilitated
through both surface modifications and targeting ligand selection (Figure 1.2). Surface
modification becomes necessary to not only create an amphiphilic chemistry that is
compatible with the water soluble cellular environment, but also to prevent unwanted
interactions between surface ligands and cell surface proteins.23-25 Modifications enable
the quantum dots to be used as highly specific targeting fluorescent probes; whereas, their
intrinsic, water insoluble, composition would ordinarily prevent suitability within
biological assays. These modifications have varied in methodology aimed at altering the
surface for the potential application being addressed.5, 6, 8, 21, 23-26 Each modification has
presented with both advantages16 and disadvantages27 for the intended usage or for
further attachment of targeting ligands. Conjugation chemistry is greatly enhanced by the
introduction of functional groups capable of serving as highly reactive branches toward
building a high affinity fluorescent probe; however, with each additional molecule added
to the nanocrystal, the radial bulk of the material is increased accordingly, and the surface
reactivity is altered. The estimated size of quantum dot nanoconjugates is approximately
15-20 nm.28 This is greater than conventional fluorescent organic dye molecules, but
approximately equivalent in size to fluorescent proteins.28 With their increased size, the
probe may potentially lose its capacity to perform its function within the scale of the
biological system. Inclusion of a balance between surface modification and
nanoconjugate size is necessary to moderate the incorporation of quantum dot
nanotechnology into biological experimentation.
3

Figure 1.2: Cartoon of general quantum dot structure. Each layer is colored to provide emphasis for the various layers within the structure. The structure consists of a CdSe core surrounded by a ZnS shell. For biocompatibility, an amphiphilic polymer is added to the surface prior to ligand conjugation. The estimated size is approximately 15-20 nm in diameter, although this varies depending upon the probe in question.28
4
1.3: Quantum Dot Surface Modifications
Incorporation into biological experiments necessitates nanocrystal surface
modifications for biocompatibility. Without extensive surface modifications, quantum
dots will often produce high incidence of non-specific binding interactions within a
biological environment. This cumbersome property requires chemical alterations to
adapt the semiconductor materials to suit the conditions imposed upon them. A number
of modifications have been reported within the literature in an effort to reduce non-
specific binding to cell membranes. These have included alterations such as micelle
encapsulation,29 pegilation,30 selinization,31 coating in amphiphilic polymers,32, 33 and the
addition of biologically active molecules such as proteins,22, 34, 35 peptides,36-38 small
molecules,39-41 and antibodies42-45 to the surface of the quantum dots. The outcome of
these efforts has produced successful results within both cell culture labeling22, 23, 30, 46-56
and tissue labeling.57
Recent advances in probe development have generated streptavidin quantum dot
conjugates that may be even more suitable for biological applications given their
multiplexing capabilities and resistance to photobleaching.11, 14-16, 22 By adding
streptavidin to the surface of fluorescent nanocrystals, the utility of quantum dots is
greatly enhanced. Coupling of biotin and avidin, or streptavidin, yields an interaction
with femtomolar affinity and a long half-life in solution. This provides a means for
including quantum dot probes in applications that previously were not adaptable. It also
enables for quantum dots to detect biotin-tagged proteins57 and small molecules used as
ligands. This provides a platform for quantum dot integration into biological studies.
Recently, a study reported success with exploiting the femtomolar relationship between
5
streptavidin and biotin. The study demonstrated that streptavidin quantum dot conjugates
were able to label a series of biotinylated cellular targets through use of biotin ligase
biotinylation.43 Their results demonstrated the utility of biotin-streptavidin quantum dot
coupling for targeting cellular targets neuroreceptors and neurons.
Fundamental to quantum dot probe development for biological assays is ligand
selection. Ligands selected for use with quantum dots are chosen based upon a few
criteria. The first criterion governing the selection is based upon the biological assay
being performed. This dictates the target, and thus governs the ligand coupled with
quantum dots for detection. The second criterion entails ligand size. Ligand size is an
issue particularly directed at polymeric molecules, such as peptides and DNA, coupled to
quantum dots. The peptide neurotoxins chosen for these studies were selected based
upon these criteria.
1.4: Inhibiting Ion Channels with Peptide Neurotoxins
Ion channels play intricate roles in neuronal activity.58 Their roles in an array of
diseases, ranging from degenerative malformations to cancers, are emerging but remain
poorly understood due to lack of adequate high affinity ligands and probes.58-60 Peptide
neurotoxins are of experimental interest for their high target specificity, and are of
therapeutic value for their medicinal potential.61 Their high specificity for their target,
often an ion channel, enables accurate labeling without the propensity for cross-talk
between targets, as seen with many small molecule probes. They also provide the
possibility to be utilized as therapeutic agents ranging from cancer detection62 and
treatments to chronic pain alleviation.63 This therapeutic potential arises from the
6

inhibitory interaction between toxin and ion channel. The high affinity of the neurotoxins
makes them suitable for use as ligands in quantum dot fluorescence microscopy studies to
examine the behavior of their target. Until recently, organic fluorophores provided the
best opportunity to visualize a protein in its native environment. Laden with the issue of
rapid photobleaching, organic fluorophores provide a narrow window of opportunity to
examine the target and thus negate the possibility of sample archiving. Quantum dot
conjugate induction into biological research enables extended tracking technology to be
applied at the cellular, tissue, and organism levels.
Peptide-mediated quantum dot detection of neural targets has been demonstrated
to be an effective methodology for probing biological systems with high specificity.
Targeted neurotoxin approaches have been employed to selectively label proteins for
monitoring,39 detection,56, 57 and destruction.63, 64 An array of neurotoxins from various
sources ranging from animals to plants, bacteria to fungi, have been isolated and
characterized with numerous others yet to be studied.61, 64, 65 Although designed to
induce disruption of its targeting system, each toxin provides the possibility to be utilized
as a therapeutic vehicle for disease detection and destruction, and as a means to study its
target in greater depth. Typically, peptide neurotoxins inhibit ion channels by acting as
antagonists, and result in the cessation of neurotransmission propagation and loss of
channel functionality.58, 66 Because of their high specificity, peptide neurotoxins aid in
characterization and understanding of the behaviors associated with its target and
genetically modified targets without adequate ligands.56 Quantum dot application to
neural studies has the potential to be greatly enhanced by method development, which
7
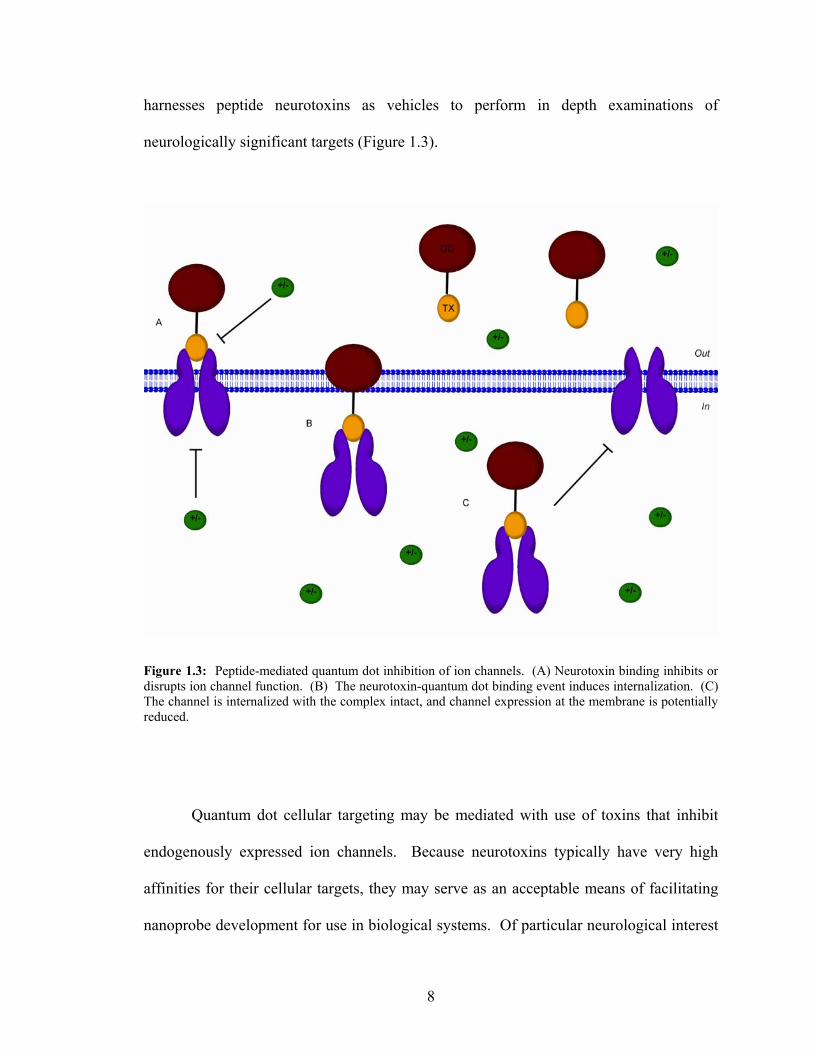
harnesses peptide neurotoxins as vehicles to perform in depth examinations of
neurologically significant targets (Figure 1.3).
Figure 1.3: Peptide-mediated quantum dot inhibition of ion channels. (A) Neurotoxin binding inhibits or disrupts ion channel function. (B) The neurotoxin-quantum dot binding event induces internalization. (C) The channel is internalized with the complex intact, and channel expression at the membrane is potentially reduced.
Quantum dot cellular targeting may be mediated with use of toxins that inhibit
endogenously expressed ion channels. Because neurotoxins typically have very high
affinities for their cellular targets, they may serve as an acceptable means of facilitating
nanoprobe development for use in biological systems. Of particular neurological interest
8
is incorporation of quantum dots into biological labeling of tissue.57, 67-70 Quantum dot
detection within tissue entails the need for high specificity to accurately label biological
targets among the complexity of a tissue environment. Additionally, quantum dot
labeling to identify disease markers in cells, such as the primary brain glial cell cancer,
glioma, is of interest for developing techniques for endogenous target detection. Glioma
cells are malignant cancer cells that infiltrate healthy brain tissue, and evade complete
surgical resection through yet fully understood mechanisms.71 To study these cells for
their mechanisms of motility through the tight brain tissue cavities, peptide toxins may be
employed to develop methods to monitor responses with quantum dots. Thorough
analysis with quantum dots may yield information that provides detail into cancer
mechanisms, and provide information regarding the cooperative nature of the toxin
targets.
1.5: Peptide Neurotoxin Conjugation to Quantum Dots
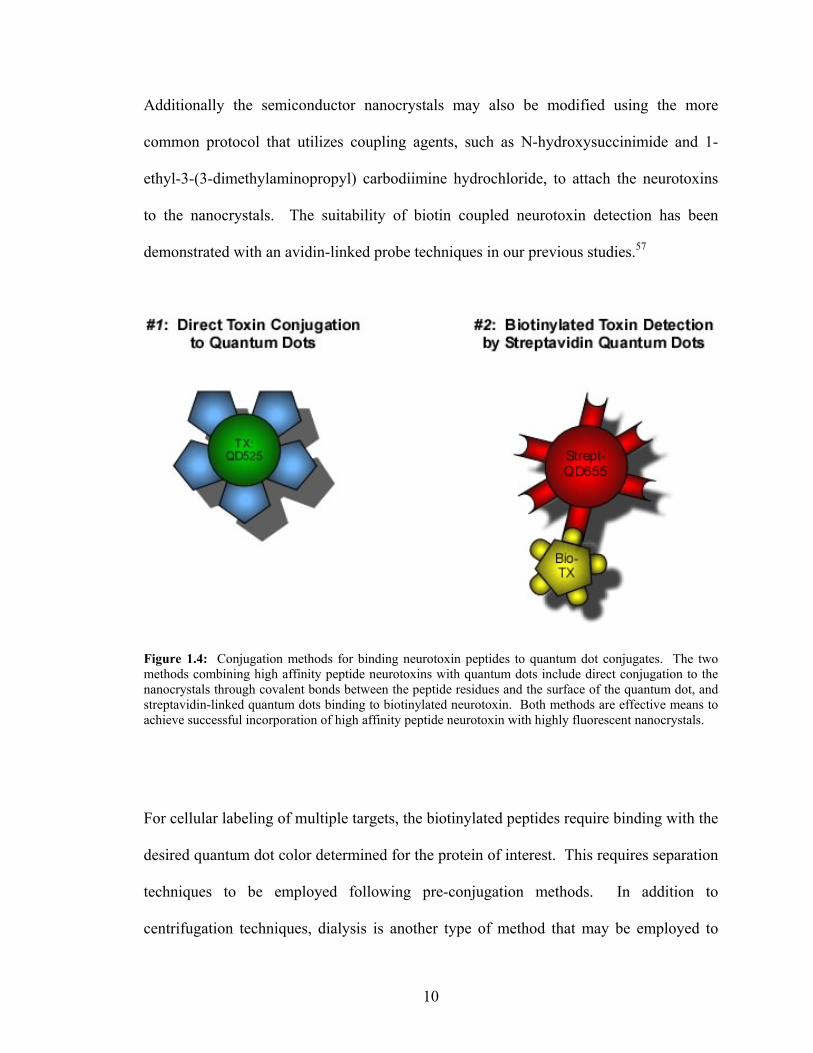
There are generally two possible approaches to peptide detection using quantum
dots: (1) direct peptide conjugation to quantum dots, and (2) peptide biotinylation
followed with avidin-linked quantum dot detection (Figure 1.4). Both methods present
with advantages and disadvantages. Direct peptide conjugation to quantum dots is
possible using coupling reagents, and requires separation of unreacted reagents from
product. It has been reported that Traut’s reagent was used to create a sulfydryl reactive
group on the peptide. Following the reaction with Traut’s reagent, the peptide was
conjugated to amine terminated pegylated iron oxide nanoparticles via a thioether
linkage.72 A similar procedure is amenable for application with quantum dots.
9
Additionally the semiconductor nanocrystals may also be modified using the more
common protocol that utilizes coupling agents, such as N-hydroxysuccinimide and 1-
ethyl-3-(3-dimethylaminopropyl) carbodiimine hydrochloride, to attach the neurotoxins
to the nanocrystals. The suitability of biotin coupled neurotoxin detection has been
demonstrated with an avidin-linked probe techniques in our previous studies.57
Figure 1.4: Conjugation methods for binding neurotoxin peptides to quantum dot conjugates. The two methods combining high affinity peptide neurotoxins with quantum dots include direct conjugation to the nanocrystals through covalent bonds between the peptide residues and the surface of the quantum dot, and streptavidin-linked quantum dots binding to biotinylated neurotoxin. Both methods are effective means to achieve successful incorporation of high affinity peptide neurotoxin with highly fluorescent nanocrystals.
For cellular labeling of multiple targets, the biotinylated peptides require binding with the
desired quantum dot color determined for the protein of interest. This requires separation
techniques to be employed following pre-conjugation methods. In addition to
centrifugation techniques, dialysis is another type of method that may be employed to
10

remove unbound small molecules from biotinylated peptide-streptavidin quantum dot
complexes.
1.6: α-Bungarotoxin Structure and Properties
α-Bungarotoxin is a high affinity peptide neurotoxin that has been used to
extensively classify nicotinic acetylcholine receptors. Isolation of the peptide from
banded krait venom resulted in elucidation of ion channel activity, and provided a model
template for ion channels.73 α-Bungarotoxin is a single peptide within a venom cocktail
that targets muscle-type nicotinic acetylcholine receptors, and results in cessation of
neural impulses at the neuromuscular junction.74-77 The α-bungarotoxin peptide binds to
the post-synaptic cleft of the neuromuscular junction. This prevents acetylcholine from
binding to the ion channel, and inhibits ion flux through the channel.78 Essentially, the
toxin binds to a gatekeeper transmembrane protein responsible for furthering neural
signal between the neuron and the muscle. The neural signal is stunted when in the
presence of α-bungarotoxin because acetylcholine is unable to bind to the receptor and
induce a conformation change in the channel that allows for exchange of ions across the
cell membrane.79, 80 The α-bungarotoxin roadblock results in a reduction of functioning
muscle-type nicotinic acetylcholine receptors, which eventually results in death, if left
untreated.
The α-bungarotoxin peptide consists of 74 amino acids (Table 1.1), which
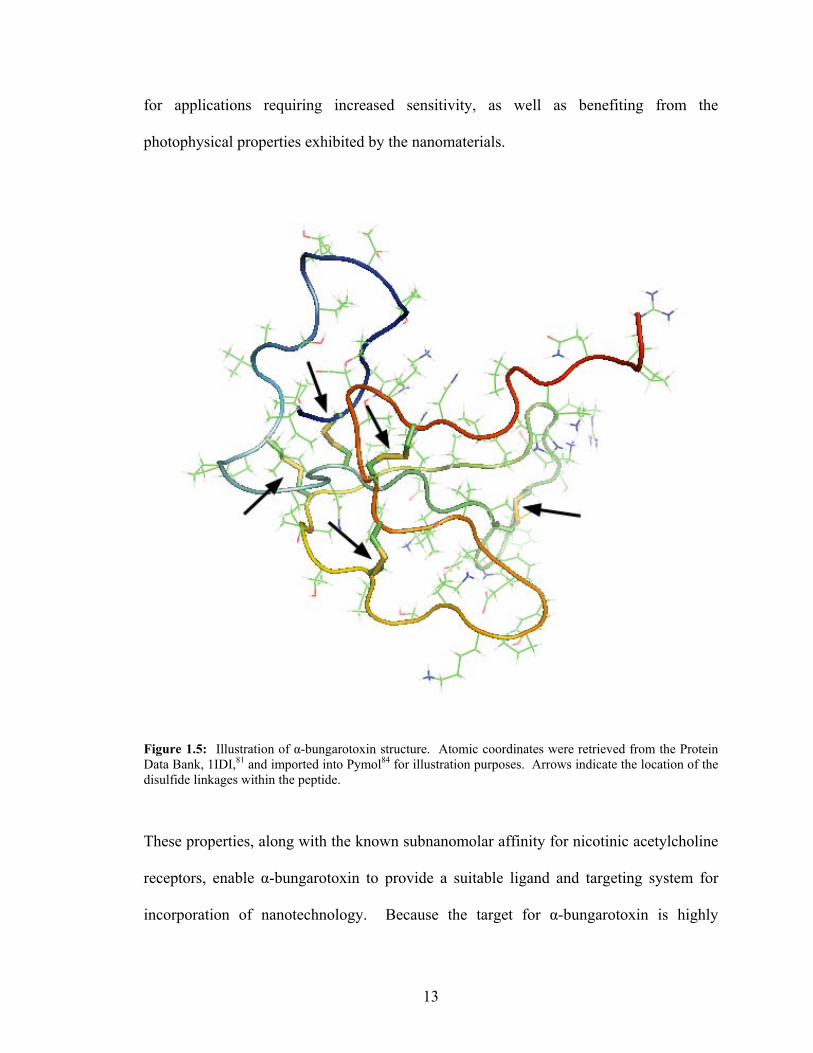
contains five disulfide bonds (Figure 1.5).81 There are a total of five disulfide bonds
throughout the protein, which aid in binding distant portions of the sequence together.
The disulfide bonds are located at 3Cys-23Cys, 16Cys-44Cys, 29Cys-33Cys, 48Cys-60Cys, and
11
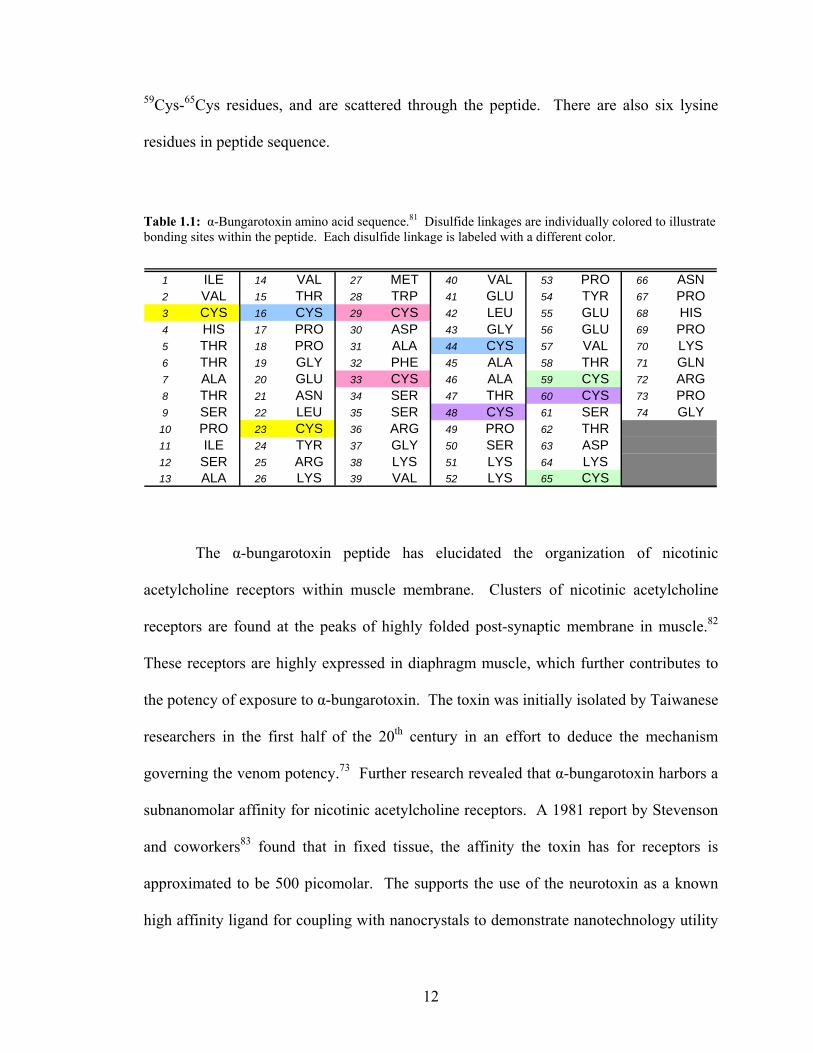
59Cys-65Cys residues, and are scattered through the peptide. There are also six lysine
residues in peptide sequence.
Table 1.1: α-Bungarotoxin amino acid sequence.81 Disulfide linkages are individually colored to illustrate bonding sites within the peptide. Each disulfide linkage is labeled with a different color.
1 ILE 14 VAL 27 MET 40 VAL 53 PRO 66 ASN2 VAL 15 THR 28 TRP 41 GLU 54 TYR 67 PRO3 CYS 16 CYS 29 CYS 42 LEU 55 GLU 68 HIS4 HIS 17 PRO 30 ASP 43 GLY 56 GLU 69 PRO5 THR 18 PRO 31 ALA 44 CYS 57 VAL 70 LYS6 THR 19 GLY 32 PHE 45 ALA 58 THR 71 GLN7 ALA 20 GLU 33 CYS 46 ALA 59 CYS 72 ARG8 THR 21 ASN 34 SER 47 THR 60 CYS 73 PRO9 SER 22 LEU 35 SER 48 CYS 61 SER 74 GLY
10 PRO 23 CYS 36 ARG 49 PRO 62 THR11 ILE 24 TYR 37 GLY 50 SER 63 ASP12 SER 25 ARG 38 LYS 51 LYS 64 LYS13 ALA 26 LYS 39 VAL 52 LYS 65 CYS
The α-bungarotoxin peptide has elucidated the organization of nicotinic
acetylcholine receptors within muscle membrane. Clusters of nicotinic acetylcholine
receptors are found at the peaks of highly folded post-synaptic membrane in muscle.82
These receptors are highly expressed in diaphragm muscle, which further contributes to
the potency of exposure to α-bungarotoxin. The toxin was initially isolated by Taiwanese
researchers in the first half of the 20th century in an effort to deduce the mechanism
governing the venom potency.73 Further research revealed that α-bungarotoxin harbors a
subnanomolar affinity for nicotinic acetylcholine receptors. A 1981 report by Stevenson
and coworkers83 found that in fixed tissue, the affinity the toxin has for receptors is
approximated to be 500 picomolar. The supports the use of the neurotoxin as a known
high affinity ligand for coupling with nanocrystals to demonstrate nanotechnology utility
12
for applications requiring increased sensitivity, as well as benefiting from the
photophysical properties exhibited by the nanomaterials.
Figure 1.5: Illustration of α-bungarotoxin structure. Atomic coordinates were retrieved from the Protein Data Bank, 1IDI,81 and imported into Pymol84 for illustration purposes. Arrows indicate the location of the disulfide linkages within the peptide.
These properties, along with the known subnanomolar affinity for nicotinic acetylcholine
receptors, enable α-bungarotoxin to provide a suitable ligand and targeting system for
incorporation of nanotechnology. Because the target for α-bungarotoxin is highly
13

expressed in diaphragm tissue, it provides a platform for furthering quantum dots within
endogenous detection within the native environment of tissue.
1.7: Chlorotoxin Structure and Properties
Insect toxins have also been shown to be capable of serving as high affinity
ligands toward fluorescent probe development.72 Recently isolated within the previous
two decades, chlorotoxin is a short chain peptide from scorpion venom that consists of 36
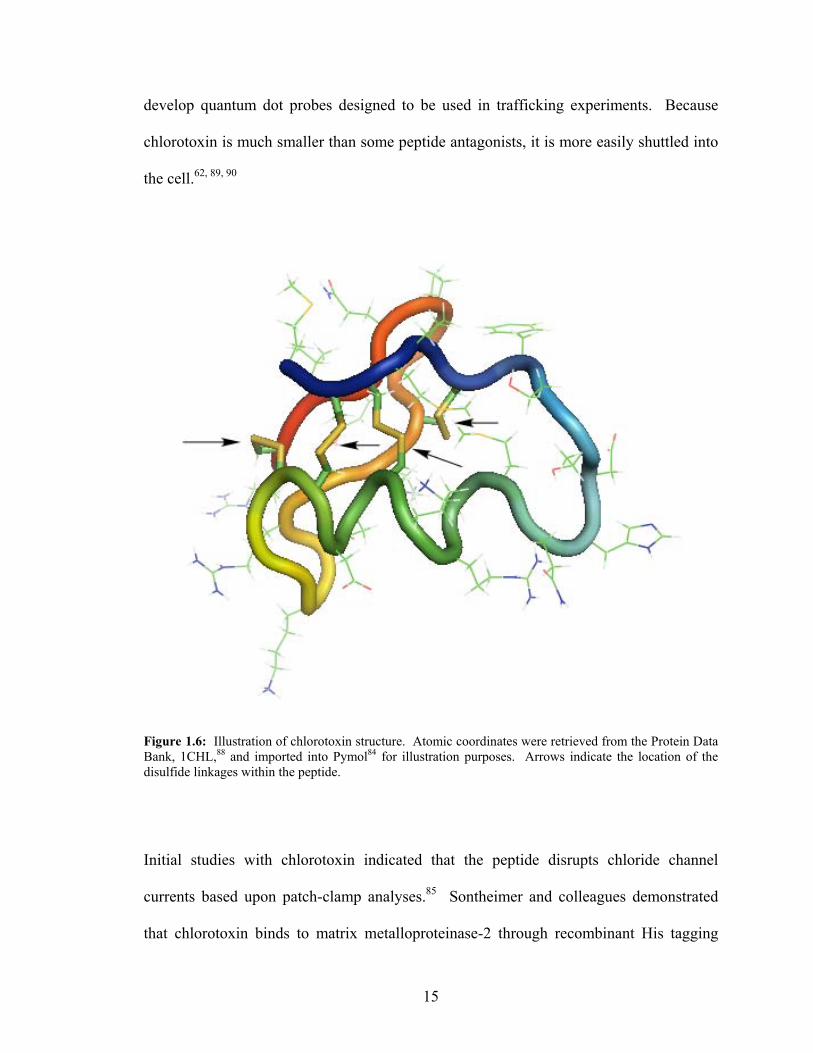
amino acids (Table 1.2).85, 86 Like α-bungarotoxin, chlorotoxin also has multiple
disulfide bonds throughout its structure, 2Cys-19Cys, 5Cys-28Cys, 16Cys-33Cys, and 20Cys-
35Cys87 (Figure 1.6).
Table 1.2: Chlorotoxin amino acid sequence.88 Disulfide linkages are individually colored to illustrate bonding sites within the peptide. Each disulfide linkage is labeled with a different color. There are a total of four disulfide linkages throughout the chlorotoxin peptide.
1 MET 13 ALA 25 ARG2 CYS 14 ARG 26 GLY3 MET 15 LYS 27 LYS4 PRO 16 CYS 28 CYS5 CYS 17 ASP 29 TYR6 PHE 18 ASP 30 GLY7 THR 19 CYS 31 PRO8 THR 20 CYS 32 GLN9 ASP 21 GLY 33 CYS
10 HIS 22 GLY 34 LEU11 GLN 23 LYS 35 CYS12 MET 24 GLY 36 ARG
Chlorotoxin harbors the interesting property of preferentially binding with cancer cells
over non-cancer cells.62, 89 This property provides the potential to utilize the neurotoxin
as a tool to further quantum dot probe development. The toxin offers the opportunity to
14
develop quantum dot probes designed to be used in trafficking experiments. Because
chlorotoxin is much smaller than some peptide antagonists, it is more easily shuttled into
the cell.62, 89, 90
Figure 1.6: Illustration of chlorotoxin structure. Atomic coordinates were retrieved from the Protein Data Bank, 1CHL,88 and imported into Pymol84 for illustration purposes. Arrows indicate the location of the disulfide linkages within the peptide.
Initial studies with chlorotoxin indicated that the peptide disrupts chloride channel
currents based upon patch-clamp analyses.85 Sontheimer and colleagues demonstrated
that chlorotoxin binds to matrix metalloproteinase-2 through recombinant His tagging
15
experimentation.89 This confirmed the chlorotoxin cellular target to be the gelatinase
enzyme. When exposed to chlorotoxin there is an observed loss of gelatinase activity,
disruption in chloride channel currents, reduction in both matrix metalloproteinase-2 and
chloride channel expressions, and internalization of chloride channels.60, 62, 89-91 Matrix
metalloproteinase-2 as the biological target for chlorotoxin was further confirmed a few
years later by Olson and co-workers in 2007.90 Confirmation was achieved using a
fluorescent dye, Cy5.5, conjugated to chlorotoxin for use in cell culture and in vivo
detection. MCF7 cells were transfected with a plasmid containing matrix
metalloproteinase-2 for expression within the host cells. Matrix metalloproteinase-2
antibody colocalization with the chlorotoxin fluorescent organic dye conjugate affirmed
that chlorotoxin interacts with matrix metalloproteinase-2.90 These studies have garnered
evidence that matrix metalloproteinase-2 is influential in glioma cell proliferation, and
raise questions regarding the nature of the chloride channel interactions with matrix
metalloproteinase-2.
An interesting property of chlorotoxin is that it is believed to severely reduce cell
motility, if not stop it entirely.91, 92 When taken in context with a glioma, which
undergoes metastasis through motility mechanisms unlike other cancers, reduction in cell
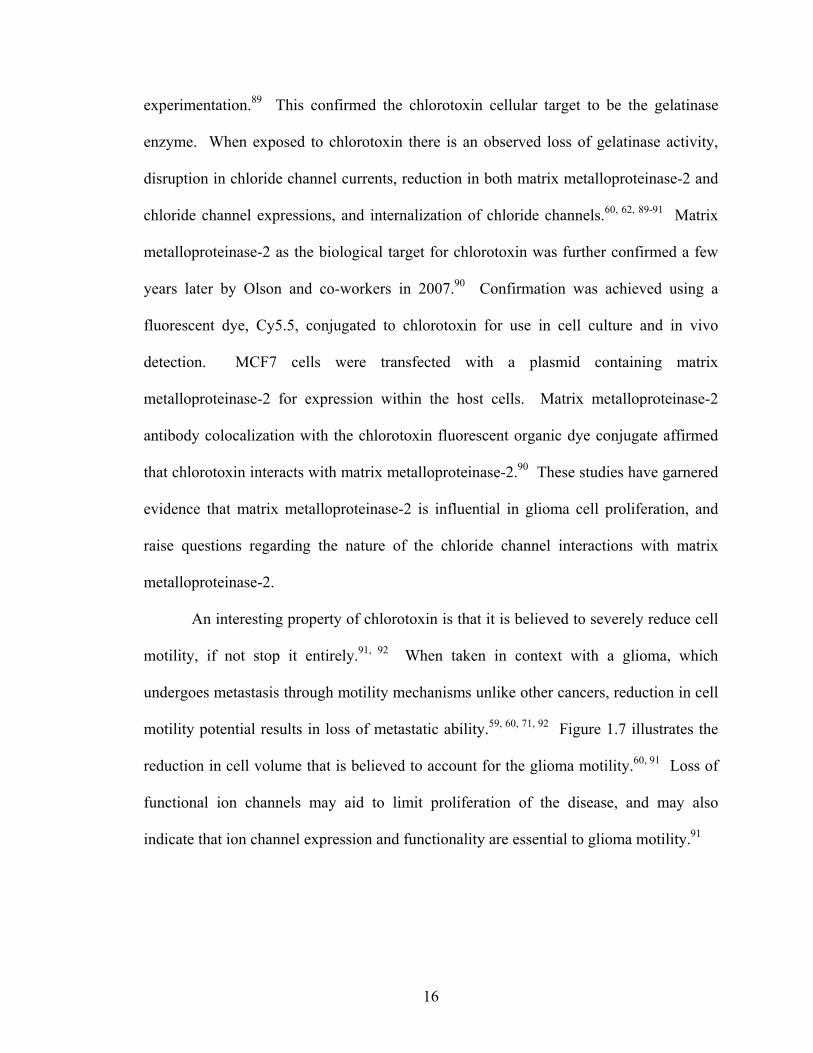
motility potential results in loss of metastatic ability.59, 60, 71, 92 Figure 1.7 illustrates the
reduction in cell volume that is believed to account for the glioma motility.60, 91 Loss of
functional ion channels may aid to limit proliferation of the disease, and may also
indicate that ion channel expression and functionality are essential to glioma motility.91
16
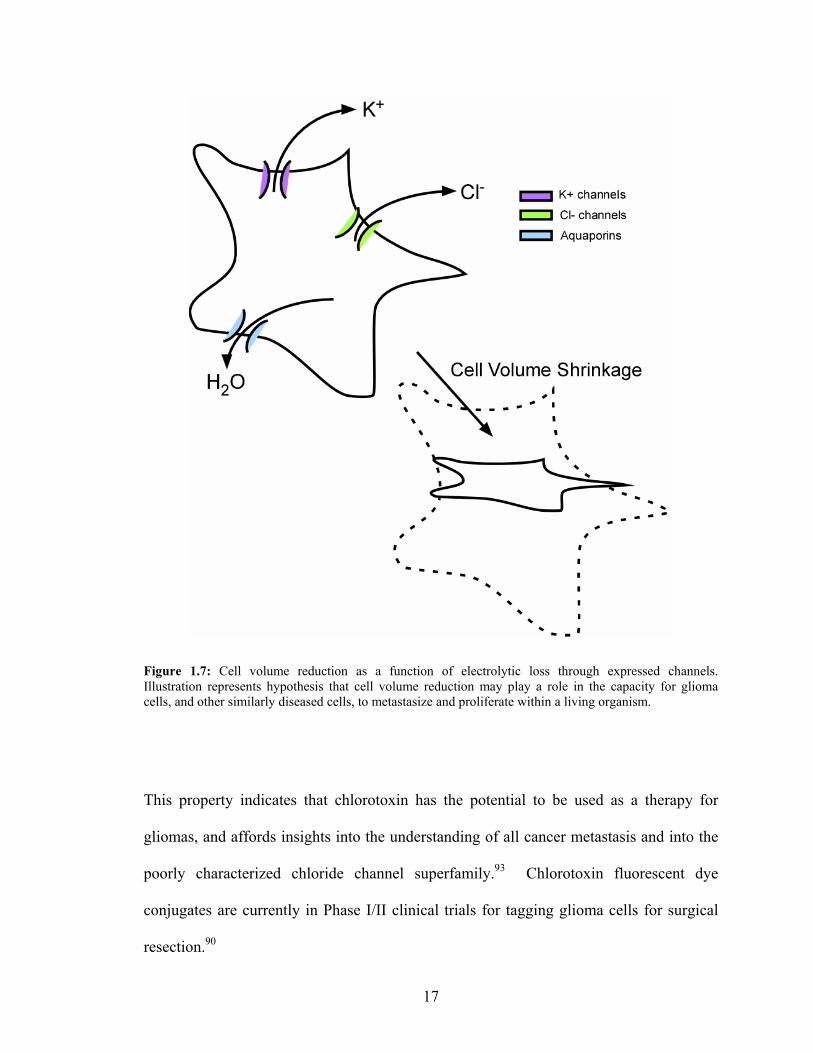
Figure 1.7: Cell volume reduction as a function of electrolytic loss through expressed channels. Illustration represents hypothesis that cell volume reduction may play a role in the capacity for glioma cells, and other similarly diseased cells, to metastasize and proliferate within a living organism.
This property indicates that chlorotoxin has the potential to be used as a therapy for
gliomas, and affords insights into the understanding of all cancer metastasis and into the
poorly characterized chloride channel superfamily.93 Chlorotoxin fluorescent dye
conjugates are currently in Phase I/II clinical trials for tagging glioma cells for surgical
resection.90
17

1.8: Dendrotoxin-1 Structure and Properties
Like α-bungarotoxin, dendrotoxins are high affinity cation channel antagonists.94
Dendrotoxins are a class of peptides isolated from the venoms of the mamba snake family,
and are approximately 7000 Da and range in size from 57-60 amino acids in length.95
The peptides mechanisms act to block various subtypes of voltage-gated potassium
channels. This is accomplished by extending the duration of the action potential, where
acetylcholine is then depleted at the neuromuscular junction. Interference with
maintenance of cell membrane potential and membrane repolarization functionalities
results in dendrotoxins having the effect of hyperexciting muscles. This causes severe
muscle contractions, which leads to convulsions and eventual death due to loss of
functioning potassium channels.96 These outcomes to dendrotoxin exposure enable the
peptides to be utilized as high affinity ligands with quantum dots in order to study the
interplay between potassium channels and other biological targets.
Venom from the Black Mamba contains a dendrotoxin peptide designated as
dendrotoxin-1.94 This isolated peptide has been used as a ligand to target potassium
channels expressed by C6 glioma cells.97 Dendrotoxin-1 contains 60 amino acids within
its chain, and has three disulfide linkages (Table 1.3). The three disulfide linkages are
located at 7Cys-53Cys, 16Cys-40Cys, and 32Cys-57Cys. Dendrotoxin-1 also contains seven
lysine residues within its 60 amino acid structure.98 The structure (Figure 1.8) is similar
to both chlorotoxin and α-bungarotoxin, in that it contains disulfide linkages that link the
ends of the peptide together to enhance a pocket-like shape for the peptide.
18
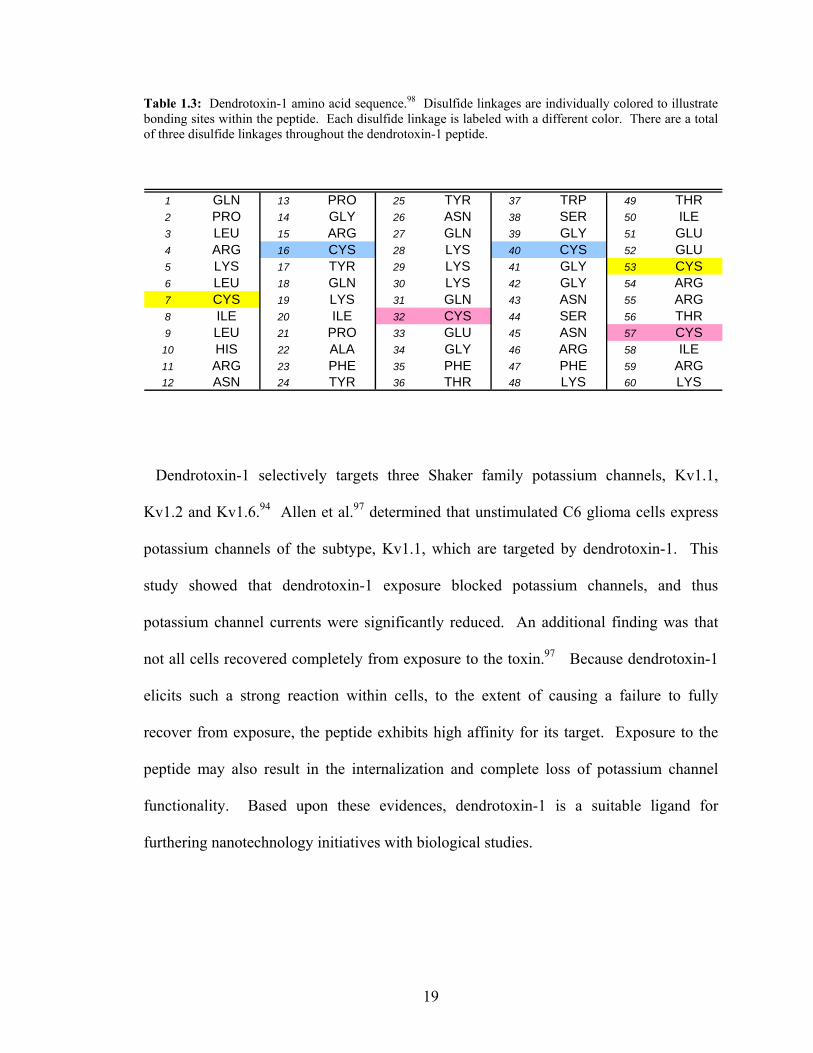
Table 1.3: Dendrotoxin-1 amino acid sequence.98 Disulfide linkages are individually colored to illustrate bonding sites within the peptide. Each disulfide linkage is labeled with a different color. There are a total of three disulfide linkages throughout the dendrotoxin-1 peptide.
1 GLN 13 PRO 25 TYR 37 TRP 49 THR2 PRO 14 GLY 26 ASN 38 SER 50 ILE3 LEU 15 ARG 27 GLN 39 GLY 51 GLU4 ARG 16 CYS 28 LYS 40 CYS 52 GLU5 LYS 17 TYR 29 LYS 41 GLY 53 CYS6 LEU 18 GLN 30 LYS 42 GLY 54 ARG7 CYS 19 LYS 31 GLN 43 ASN 55 ARG8 ILE 20 ILE 32 CYS 44 SER 56 THR9 LEU 21 PRO 33 GLU 45 ASN 57 CYS
10 HIS 22 ALA 34 GLY 46 ARG 58 ILE11 ARG 23 PHE 35 PHE 47 PHE 59 ARG12 ASN 24 TYR 36 THR 48 LYS 60 LYS
Dendrotoxin-1 selectively targets three Shaker family potassium channels, Kv1.1,
Kv1.2 and Kv1.6.94 Allen et al.97 determined that unstimulated C6 glioma cells express
potassium channels of the subtype, Kv1.1, which are targeted by dendrotoxin-1. This
study showed that dendrotoxin-1 exposure blocked potassium channels, and thus
potassium channel currents were significantly reduced. An additional finding was that
not all cells recovered completely from exposure to the toxin.97 Because dendrotoxin-1
elicits such a strong reaction within cells, to the extent of causing a failure to fully
recover from exposure, the peptide exhibits high affinity for its target. Exposure to the
peptide may also result in the internalization and complete loss of potassium channel
functionality. Based upon these evidences, dendrotoxin-1 is a suitable ligand for
furthering nanotechnology initiatives with biological studies.
19
Figure 1.8: Illustration of dendrotoxin-1 structure. Atomic coordinates were retrieved from the Protein Data Bank, 1DEM,98 and imported into Pymol84 for illustration purposes. Arrows indicate the location of the disulfide linkages within the peptide.
1.9: Research Overview
This research is focused upon furthering techniques and methodologies toward
incorporation of nanotechnology with biological studies. Specifically, the central focus
revolves around using high affinity peptide neurotoxins as ligands with fluorescent
semiconductor nanocrystals, known as quantum dots, to detect endogenously expressed
biological targets in both tissue and living cells. In these studies, three high affinity
peptide neurotoxins were used as vehicles toward successful quantum dot integration into
detection of targets within complex biological systems. It was demonstrated that two
separate methodologies were capable of combining nanotechnology with suitable ligands
to navigate sensitive detection in complex biological environments.
20
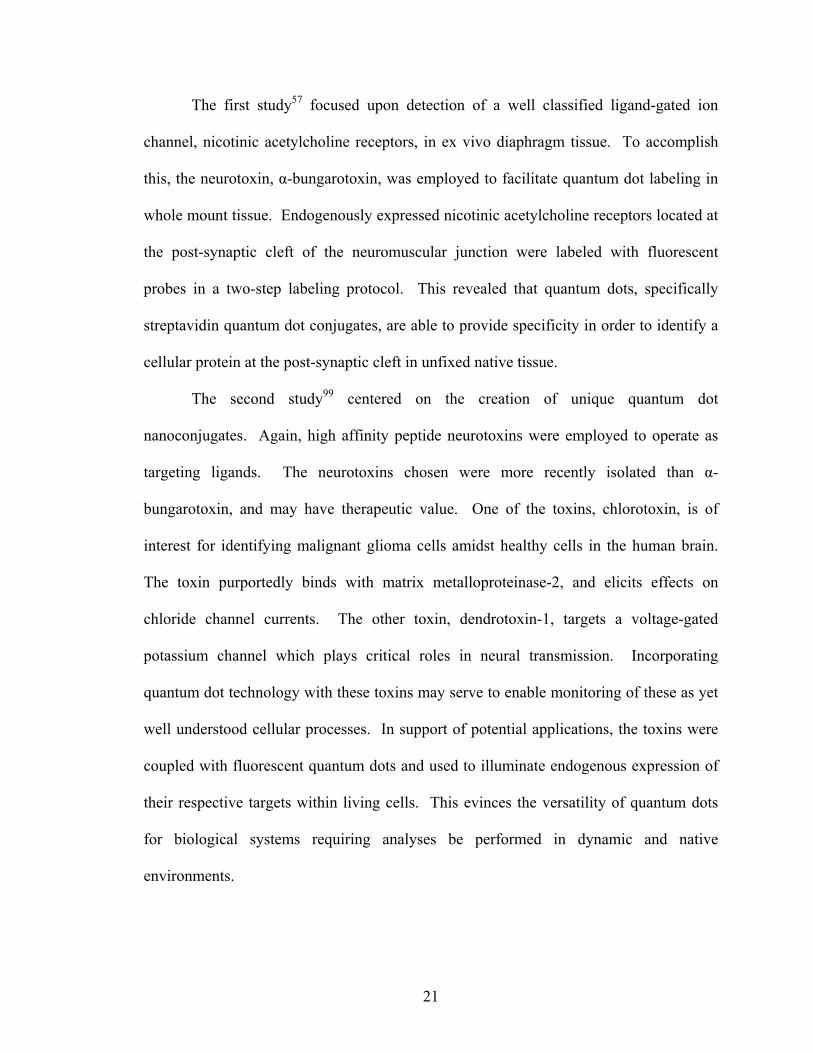
The first study57 focused upon detection of a well classified ligand-gated ion
channel, nicotinic acetylcholine receptors, in ex vivo diaphragm tissue. To accomplish
this, the neurotoxin, α-bungarotoxin, was employed to facilitate quantum dot labeling in
whole mount tissue. Endogenously expressed nicotinic acetylcholine receptors located at
the post-synaptic cleft of the neuromuscular junction were labeled with fluorescent
probes in a two-step labeling protocol. This revealed that quantum dots, specifically
streptavidin quantum dot conjugates, are able to provide specificity in order to identify a
cellular protein at the post-synaptic cleft in unfixed native tissue.
The second study99 centered on the creation of unique quantum dot
nanoconjugates. Again, high affinity peptide neurotoxins were employed to operate as
targeting ligands. The neurotoxins chosen were more recently isolated than α-
bungarotoxin, and may have therapeutic value. One of the toxins, chlorotoxin, is of
interest for identifying malignant glioma cells amidst healthy cells in the human brain.
The toxin purportedly binds with matrix metalloproteinase-2, and elicits effects on
chloride channel currents. The other toxin, dendrotoxin-1, targets a voltage-gated
potassium channel which plays critical roles in neural transmission. Incorporating
quantum dot technology with these toxins may serve to enable monitoring of these as yet
well understood cellular processes. In support of potential applications, the toxins were
coupled with fluorescent quantum dots and used to illuminate endogenous expression of
their respective targets within living cells. This evinces the versatility of quantum dots
for biological systems requiring analyses be performed in dynamic and native
environments.
21

1.10: Summary
Advances in biotechnology enable better disease detection, and potential
elimination. A major focus of biotechnological advances has been the development of
fluorescent probes to aid in monitoring specific targets in living systems. Use of highly
fluorescent quantum dot conjugates relies on ligand suitability for the desired target.
High affinity peptide neurotoxins, isolated from a variety of sources, are effective agents
for integrating technological advances with biological inquiries. Quantum dot
technology enhances biological studies through characteristics, such as enhanced
photostability, size-tunable emission, and broad excitation spectra, inherent in the
material. Development of protocols that utilize quantum dots for tagging biological,
specifically neurologically significant, targets will enable extended monitoring within
living systems. This will provide information leading to the development of better
therapeutic agents for diseases and conditions that are poorly understood.
22
CHAPTER II
METHODS AND MATERIALS
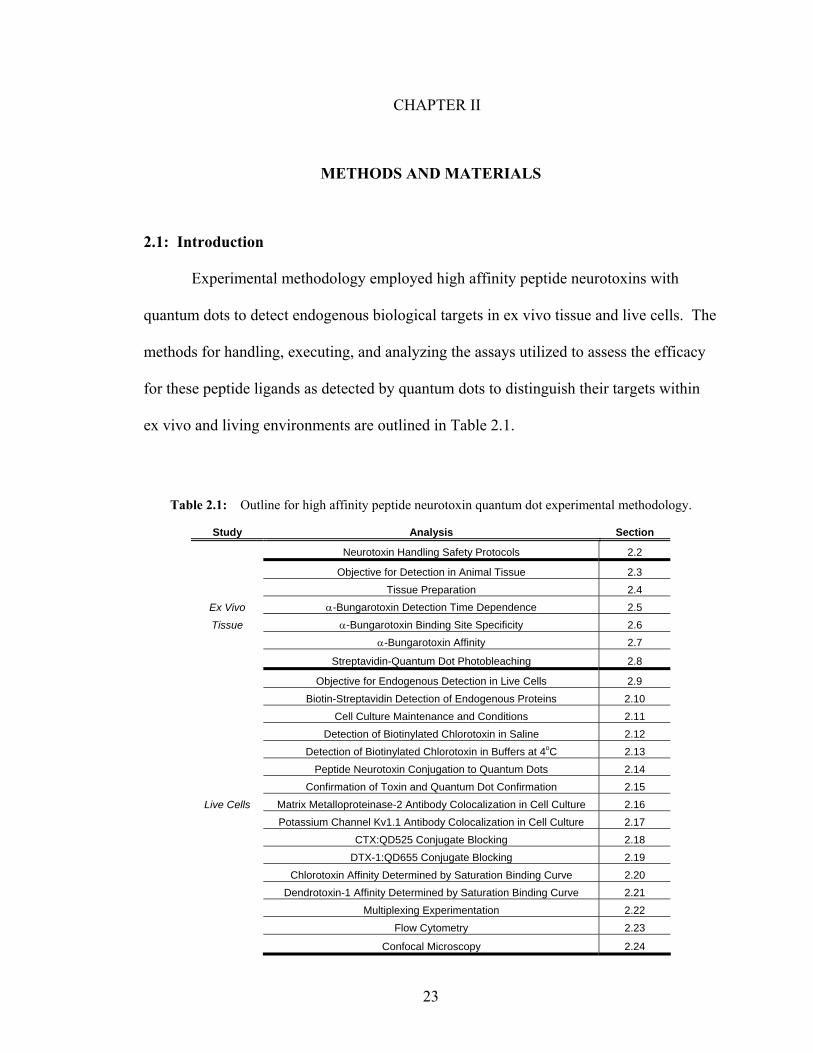
2.1: Introduction
Experimental methodology employed high affinity peptide neurotoxins with
quantum dots to detect endogenous biological targets in ex vivo tissue and live cells. The
methods for handling, executing, and analyzing the assays utilized to assess the efficacy
for these peptide ligands as detected by quantum dots to distinguish their targets within
ex vivo and living environments are outlined in Table 2.1.
Table 2.1: Outline for high affinity peptide neurotoxin quantum dot experimental methodology.
Study Analysis Section
Neurotoxin Handling Safety Protocols 2.2
Objective for Detection in Animal Tissue 2.3 Tissue Preparation 2.4
Ex Vivo α-Bungarotoxin Detection Time Dependence 2.5
Tissue α-Bungarotoxin Binding Site Specificity 2.6 α-Bungarotoxin Affinity 2.7
Streptavidin-Quantum Dot Photobleaching 2.8
Objective for Endogenous Detection in Live Cells 2.9 Biotin-Streptavidin Detection of Endogenous Proteins 2.10 Cell Culture Maintenance and Conditions 2.11 Detection of Biotinylated Chlorotoxin in Saline 2.12 Detection of Biotinylated Chlorotoxin in Buffers at 4oC 2.13 Peptide Neurotoxin Conjugation to Quantum Dots 2.14 Confirmation of Toxin and Quantum Dot Confirmation 2.15
Live Cells Matrix Metalloproteinase-2 Antibody Colocalization in Cell Culture 2.16 Potassium Channel Kv1.1 Antibody Colocalization in Cell Culture 2.17 CTX:QD525 Conjugate Blocking 2.18 DTX-1:QD655 Conjugate Blocking 2.19 Chlorotoxin Affinity Determined by Saturation Binding Curve 2.20 Dendrotoxin-1 Affinity Determined by Saturation Binding Curve 2.21 Multiplexing Experimentation 2.22 Flow Cytometry 2.23
Confocal Microscopy 2.24
23

2.2: Neurotoxin Handling Safety Protocols
High affinity peptide neurotoxins are a class of molecules that require specific
handling to be used safely. They are considered to be health hazards, and as such, must
be used with caution and careful handling. Although the peptides are isolated from
venom, and are possibly absent of the full venom effects, accidental injection or similar
mishaps may result in serious consequences. Each peptide neurotoxin is capable of
binding to a specific target within a living organism with high affinity. This interaction
results in a multitude of effects if accidentally exposed to personnel improperly.
All peptide neurotoxins were used within the guidelines of Biosafety Level-2
(BL-2) research protocols. To use the peptide neurotoxins, all proper personal protective
gear must be worn. Each neurotoxin was provided as a lyophilized powder in need of
reconstitution prior to use. Lyophilized powders were reconstituted according to
manufacturer’s instructions within a BL-2 biohood under sterile conditions. Aliquots
were stored in low volumes, and in conditions determined by the manufacturer. All
waste was collected and disposed as biowaste in compliance with Vanderbilt
Environmental Health and Safety guidelines.
2.3: Quantum Dot Objective for Detection within Animal Tissue
The objective of these experiments was to demonstrate that quantum dots are a
viable means of detecting an endogenous target within animal tissue. To accomplish this,
a ligand with known high affinity for nicotinic acetylcholine receptors was chosen for the
task. From there, a protocol for quantum dot detection of the ligand in ex vivo tissue was
developed. The protocol was able to demonstrate that the nanocrystals were capable of
24
binding to the receptor bound peptide ligand within the complex environment of
extracted mouse diaphragm. The efficacy of quantum dot detection was determined
through examination with colocalized fluorescent antibodies bound to different subunits
on the nicotinic acetylcholine receptors, analysis of photostability, and quantitation
leading to approximation of neurotoxin ligand specificity for the native receptor.
2.4: Mouse Diaphragm Ex Vivo Tissue Preparation
All experiments were performed using C57BL/6 inbred mice between 8 and 10
weeks of age and sacrificed in accordance to IACUC standards and procedure protocols.
Dissected mouse diaphragm was obtained from the Blakely Laboratory and washed in 1x
phosphate-buffered saline (PBS) solution for approximately 1 hour on ice. The tissue
was then divided into equal portions and incubated in 100mM glycine in 1xPBS (pH 7.3)
for 1 hour on ice. Overnight incubation at 4°C followed in blocking solution consisting
of 1xPBS (pH 7.3), 5% normal goat serum, 3% bovine serum albumin, 0.2% Triton X-
100, and 0.01% thimerasol. The tissue was then briefly washed in 1xPBS solution. The
tissue pieces were then exposed to the experimental conditions prescribed for the assay
being evaluated.
2.5: Quantum Dot Time Dependent Detection of α-Bungarotoxin
Following tissue preparation, mouse diaphragm sections were exposed to
biotinylated α-bungarotoxin for the experimental time intervals of 10, 60, 180, 360, or
720 minutes (Figure 2.1).
25

Figure 2.1: Representation of biotinylated α-bungarotoxin (bio-α-BTX) labeling of nicotinic acetylcholine receptors (nAchRs) at the neuromuscular junction. This step represents the first of a two-step quantum dot detection method employing avidin-linked probe affinity for biotinylated ligands.
The tissue was incubated at 4°C in blocking solution consisting of 1xPBS (pH 7.3), 5%
normal goat serum, 3% bovine serum albumin, 0.01% thimerasol, nicotinic acetylcholine
26

receptor β-subunit rat-anti-nicotinic acetylcholine receptor primary antibody (1:5000)
(Sigma, Inc.), and 10nM biotinylated α-bungarotoxin (Invitrogen, Inc.) (Figure 2.2).
Figure 2.2: Aerial view of labeling with biotinylated α-bungarotoxin and anti-β-subunit antibody on a nicotinic acetylcholine receptor. This was accomplished using ex vivo mouse diaphragm tissue that was first treated with 100mM glycine, followed by blocking solution with Triton X-100. Biotinylated high affinity peptide neurotoxin and primary antibody exposure were achieved within blocking solution at 4°C.
Mouse diaphragm tissue was also treated as a control series by exposing the pieces to the
same quantum dot detection conditions without the biotinylated α-bungarotoxin.
The tissue sections were briefly washed in 1x PBS solution. Overnight incubation
at 4°C followed with 10nM streptavidin-QD655 conjugates in blocking solution (Figure
2.3).
27

Figure 2.3: Representation of streptavidin-QD655 conjugate detection of biotinylated α-bungarotoxin bound to nicotinic acetylcholine receptors present at the neuromuscular junctions of ex vivo mouse diaphragm tissue. This corresponds to the second step of a two-step quantum dot detection strategy utilizing the femtomolar affinity for biotin exhibited by streptavidin.
28

The anti-β-subunit primary antibody was detected with Alexafluor488-rabbit-anti-rat
secondary antibody conjugate (1:5000) simultaneously with the biotinylated α-
bungarotoxin detection with streptavidin-QD655 conjugates (Figure 2.4). The procedure
was repeated in parallel with 10nM streptavidin-Alexafluor-555, swapped for
streptavidin-QD655, conjugates in blocking solution with the remaining tissue sections.
The tissue sections were then washed in 1x PBS three times for 10 minutes on ice and
mounted using AquaMount anti-photo-bleaching solution for imaging. The labeling
protocol was repeated for 10, 60, 180, and 360 minutes with tissue that was incubated in
blocking solution at 4°C for seven days.
Figure 2.4: Overhead view of two-step detection methodology utilizing the strong binding interaction between streptavidin and biotin. Representation shows biotinylated α-bungarotoxin detected by streptavidin-QD655 conjugates, along with anti-β-subunit primary antibody detected by Alexafluor488 secondary antibody, bound to nicotinic acetylcholine receptor at the neuromuscular junction of ex vivo mouse diaphragm tissue.
29
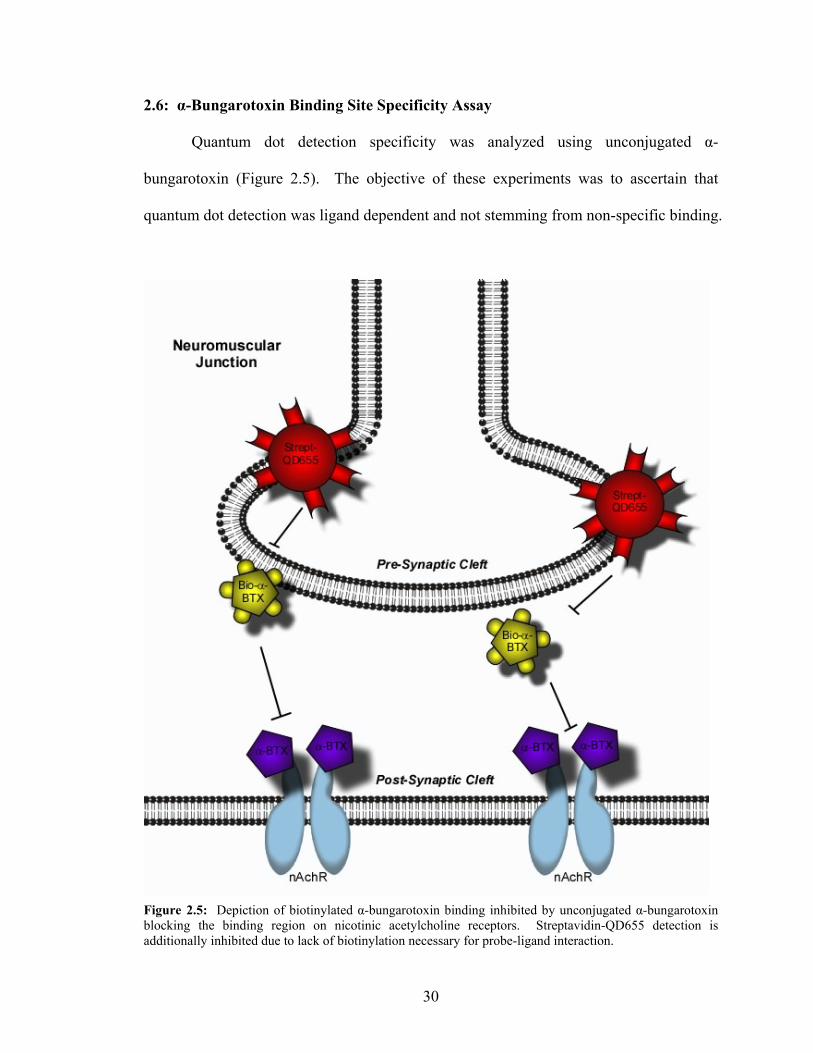
2.6: α-Bungarotoxin Binding Site Specificity Assay
Quantum dot detection specificity was analyzed using unconjugated α-
bungarotoxin (Figure 2.5). The objective of these experiments was to ascertain that
quantum dot detection was ligand dependent and not stemming from non-specific binding.
Figure 2.5: Depiction of biotinylated α-bungarotoxin binding inhibited by unconjugated α-bungarotoxin blocking the binding region on nicotinic acetylcholine receptors. Streptavidin-QD655 detection is additionally inhibited due to lack of biotinylation necessary for probe-ligand interaction.
30
Because these studies are based upon quantum dot detection of endogenous targets within
ex vivo tissue, it was of particular importance to perform these experiments. To do this,
mouse diaphragm pieces were prepared as before and additionally exposed to 100nM α-
bungarotoxin in blocking solution overnight, for approximately 12 hours, at 4°C as pre-
treatment to determine specificity. The tissue was treated as before with 10nM
biotinylated α-bungarotoxin and primary antibody (1:5000). After 12 hours of ligand
exposure, the tissue pieces were incubated with streptavidin-QD655 and streptavidin-
Alexafluor555 fluorescent probes. The primary antibody was again illuminated using
Alexafluor488 secondary antibodies (Figure 2.6). At the end of the overnight incubation
at 4°C, the tissue was washed and mounted as previously described. All tissue was
imaged using an inverted confocal microscope (Zeiss, Inc.) and analyzed using
Metamorph software (MDS, Inc.). Data was analyzed and saturation binding curves were
generated using GraphPad Prism (GraphPad Prism Software, Inc.).
2.7: α-Bungarotoxin Affinity Assay
Ligand affinity was assessed through saturation binding curve analysis.
Saturation binding curves were generated using dissected tissue, treated as previously
described. The tissue was incubated with a series of dilutions of biotinylated α-
bungarotoxin for 10 minutes at 4°C. From there, the tissue pieces were incubated
overnight in 10nM streptavidin-QD655s. After overnight incubation, the tissue was
washed three times for 10 minutes, and then mounted with AquaMount. Each
concentration was imaged at least three times with experiments run in triplicate. The
curve was generated using GraphPad Prism software (GraphPad Prism Software, Inc.).
31

Figure 2.6: View from above of α-bungarotoxin bound to nicotinic acetylcholine receptors. The unconjugated α-bungarotoxin prevents biotinylated α-bungarotoxin from binding to the receptors.
2.8: Streptavidin-Quantum Dot Photobleaching Assays
In order to examine and establish quantum dot photostability within an ex vivo
tissue environment, photobleaching experiments were performed. Mouse diaphragm
pieces were obtained and prepared as before. The tissue was then exposed to 10nM
biotinylated α-bungarotoxin for 10 minutes. Following ligand incubation for 10 minutes,
the tissue was incubated with either streptavidin-QD655 or streptavidin-Alexafluor555
conjugates overnight at 4°C. The samples were washed in 1xPBS three times for ten
minutes and mounted in MatTek dishes. The β-subunit primary antibody employed for
other experiments, and the secondary Alexafluor488 antibody fluorescence label were
incorporated with the protocol as previously described. Following sample preparations,
32

each was imaged as before on a Zeiss inverted confocal microscope. The fluorescent
conjugates were exposed to continuous excitation for approximately 30 minutes, and
images were collected as a time series. Each conjugate was also spin-cast, dropped onto
a spinning surface for solvent evaporation, and imaged using a Zeiss Axiovert 200M
widefield microscope with Metamorph. FITC was run as a standard.
2.9: Quantum Dot Objective for Endogenous Detection in Living Cells
Development of labeling methodologies using quantum dots within living cells
promotes usage for live trafficking experimentation. Because of their unique
photostability, quantum dots bridge a potentially critical step in nanotechnology
advancement within fundamental biological research. Capacity to detect ligands bound
to target proteins that are native to the cell type being studied invites possibilities for
generation of knowledge concerning complex interactions between multiple proteins.
Since nanocrystals emit narrow emission spectra based upon size and composition, they
may be used within a single system to examine multiple targets. The targets would then
be differentiated by emission color when imaged using fluorescence microscopy
techniques. This quantum dot characteristic, along with single-source excitation ability,
was demonstrated using fluorescence microscopy to perform multiplexing experiments.
Multiplexing was accomplished following synthesis of novel conjugates using two
separate high affinity peptide neurotoxins, and confirmation of binding accuracy via
fluorescence antibodies. Toxin conjugate affinities for endogenously expressed proteins
were additionally determined within living cells.
33
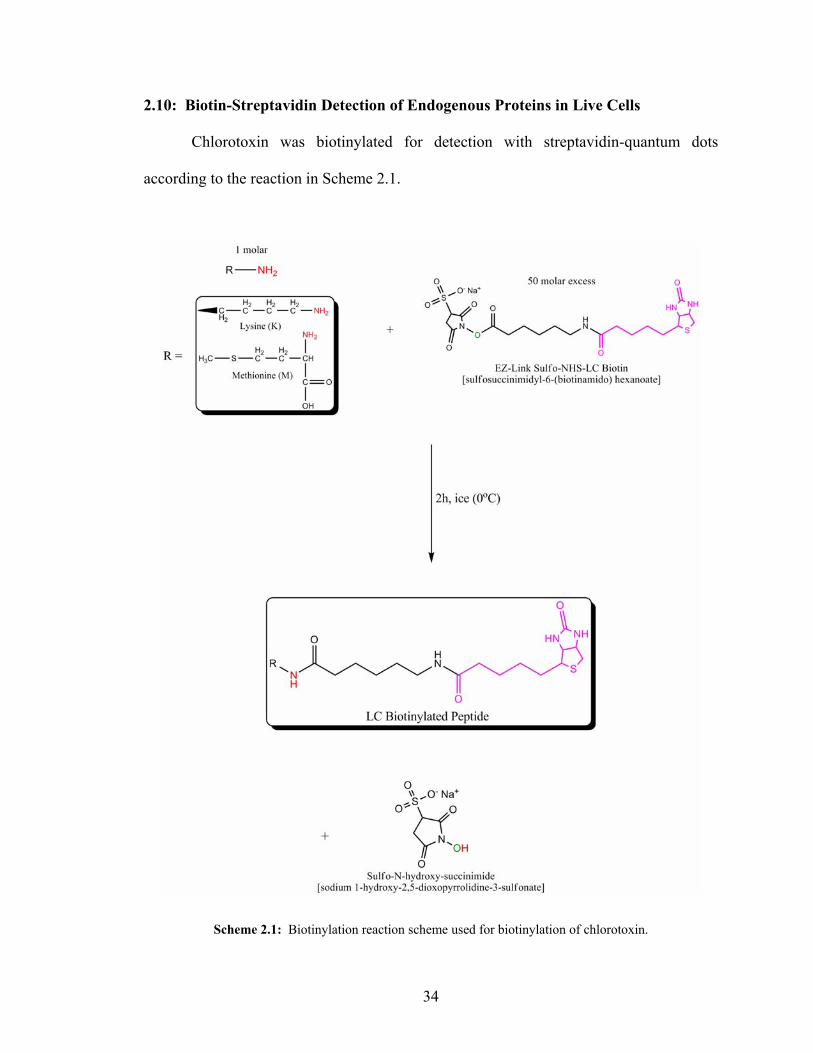
2.10: Biotin-Streptavidin Detection of Endogenous Proteins in Live Cells
Chlorotoxin was biotinylated for detection with streptavidin-quantum dots
according to the reaction in Scheme 2.1.
Scheme 2.1: Biotinylation reaction scheme used for biotinylation of chlorotoxin.
34
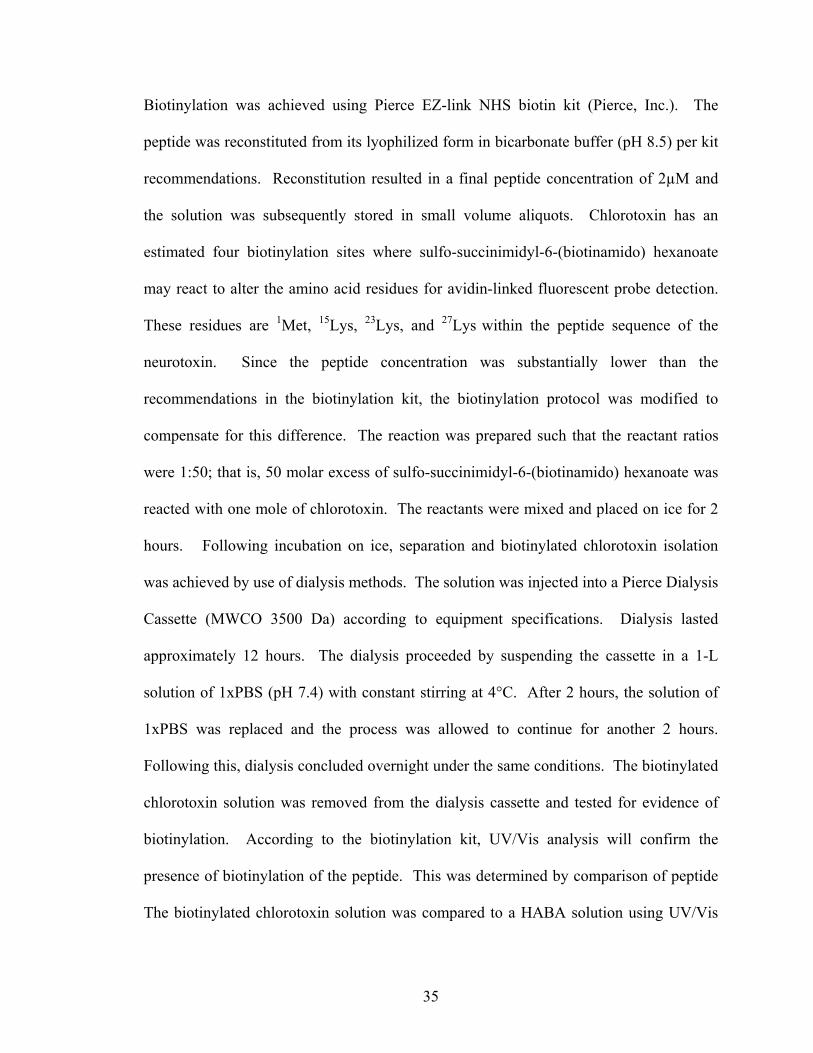
Biotinylation was achieved using Pierce EZ-link NHS biotin kit (Pierce, Inc.). The
peptide was reconstituted from its lyophilized form in bicarbonate buffer (pH 8.5) per kit
recommendations. Reconstitution resulted in a final peptide concentration of 2µM and
the solution was subsequently stored in small volume aliquots. Chlorotoxin has an
estimated four biotinylation sites where sulfo-succinimidyl-6-(biotinamido) hexanoate
may react to alter the amino acid residues for avidin-linked fluorescent probe detection.
These residues are 1Met, 15Lys, 23Lys, and 27Lys within the peptide sequence of the
neurotoxin. Since the peptide concentration was substantially lower than the
recommendations in the biotinylation kit, the biotinylation protocol was modified to
compensate for this difference. The reaction was prepared such that the reactant ratios
were 1:50; that is, 50 molar excess of sulfo-succinimidyl-6-(biotinamido) hexanoate was
reacted with one mole of chlorotoxin. The reactants were mixed and placed on ice for 2
hours. Following incubation on ice, separation and biotinylated chlorotoxin isolation
was achieved by use of dialysis methods. The solution was injected into a Pierce Dialysis
Cassette (MWCO 3500 Da) according to equipment specifications. Dialysis lasted
approximately 12 hours. The dialysis proceeded by suspending the cassette in a 1-L
solution of 1xPBS (pH 7.4) with constant stirring at 4°C. After 2 hours, the solution of
1xPBS was replaced and the process was allowed to continue for another 2 hours.
Following this, dialysis concluded overnight under the same conditions. The biotinylated
chlorotoxin solution was removed from the dialysis cassette and tested for evidence of
biotinylation. According to the biotinylation kit, UV/Vis analysis will confirm the
presence of biotinylation of the peptide. This was determined by comparison of peptide
The biotinylated chlorotoxin solution was compared to a HABA solution using UV/Vis
35
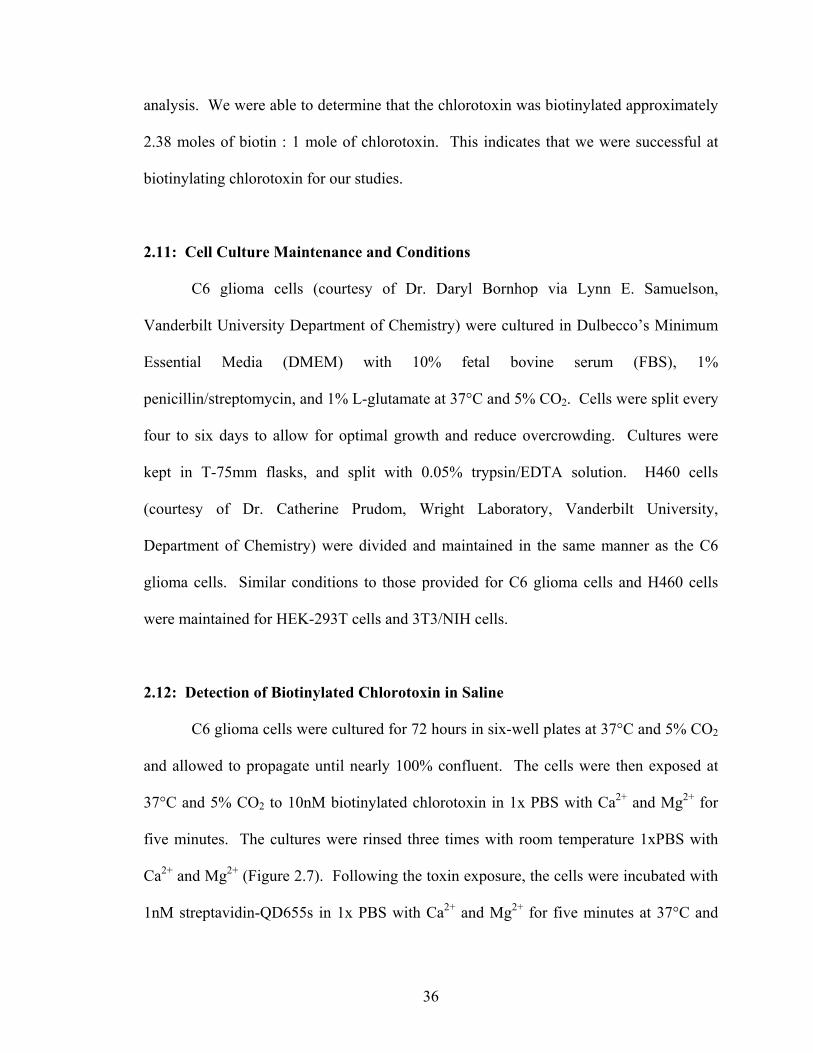
analysis. We were able to determine that the chlorotoxin was biotinylated approximately
2.38 moles of biotin : 1 mole of chlorotoxin. This indicates that we were successful at
biotinylating chlorotoxin for our studies.
2.11: Cell Culture Maintenance and Conditions
C6 glioma cells (courtesy of Dr. Daryl Bornhop via Lynn E. Samuelson,
Vanderbilt University Department of Chemistry) were cultured in Dulbecco’s Minimum
Essential Media (DMEM) with 10% fetal bovine serum (FBS), 1%
penicillin/streptomycin, and 1% L-glutamate at 37°C and 5% CO2. Cells were split every
four to six days to allow for optimal growth and reduce overcrowding. Cultures were
kept in T-75mm flasks, and split with 0.05% trypsin/EDTA solution. H460 cells
(courtesy of Dr. Catherine Prudom, Wright Laboratory, Vanderbilt University,
Department of Chemistry) were divided and maintained in the same manner as the C6
glioma cells. Similar conditions to those provided for C6 glioma cells and H460 cells
were maintained for HEK-293T cells and 3T3/NIH cells.
2.12: Detection of Biotinylated Chlorotoxin in Saline
C6 glioma cells were cultured for 72 hours in six-well plates at 37°C and 5% CO2
and allowed to propagate until nearly 100% confluent. The cells were then exposed at
37°C and 5% CO2 to 10nM biotinylated chlorotoxin in 1x PBS with Ca2+ and Mg2+ for
five minutes. The cultures were rinsed three times with room temperature 1xPBS with
Ca2+ and Mg2+ (Figure 2.7). Following the toxin exposure, the cells were incubated with
1nM streptavidin-QD655s in 1x PBS with Ca2+ and Mg2+ for five minutes at 37°C and
36
5% CO2 (Figure 2.8). Each culture was then washed with room temperature 1x PBS
with Ca2+ and Mg2+ three times, again, and imaged. Initial cell experiments were imaged
in 1xPBS with Ca2+ and Mg2+ solution.
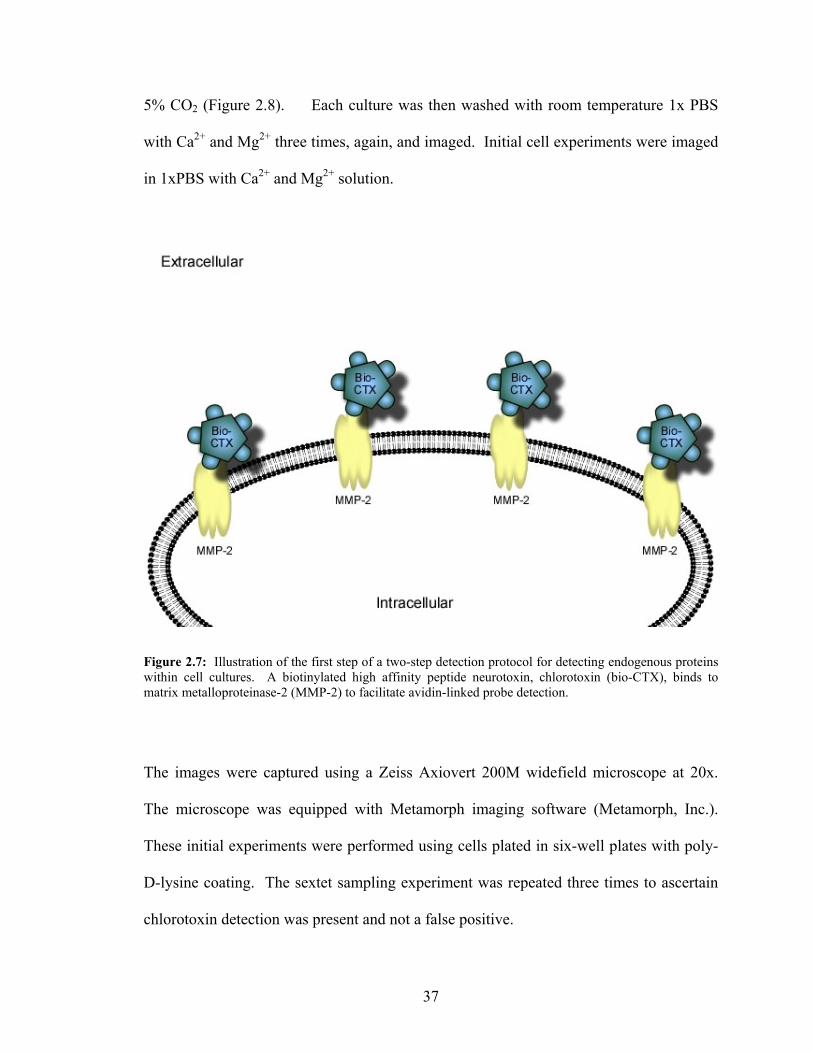
Figure 2.7: Illustration of the first step of a two-step detection protocol for detecting endogenous proteins within cell cultures. A biotinylated high affinity peptide neurotoxin, chlorotoxin (bio-CTX), binds to matrix metalloproteinase-2 (MMP-2) to facilitate avidin-linked probe detection.
The images were captured using a Zeiss Axiovert 200M widefield microscope at 20x.
The microscope was equipped with Metamorph imaging software (Metamorph, Inc.).
These initial experiments were performed using cells plated in six-well plates with poly-
D-lysine coating. The sextet sampling experiment was repeated three times to ascertain
chlorotoxin detection was present and not a false positive.
37

Figure 2.8: The second step of a two-step detection protocol using a biotinylated high affinity peptide neurotoxin, chlorotoxin (bio-CTX), to facilitate avidin-linked probe labeling. Streptavidin-QD655 probes detect biotinylated chlorotoxin bound to endogenous matrix metalloproteinase-2 (MMP-2) within cell culture.
2.13: Detection of Biotinylated Chlorotoxin in Buffers at 4°C
C6 glioma cells were cultured for 24 hours after trypsinizing and plating the cells
in poly-D-lysine coated six-well plates. The cells were treated with ice cold Kreb’s-
Ringer-HEPES (KRH) buffer before exposing the cultures to multiple buffer solutions,
including 1x KRH buffer with and without a percent bovine serum albumin (BSA),
containing the labeling agents. KRH was chosen because it contains salts and glucose,
which may aid in examining shuttling events, and to maintain cell life during the hours of
incubation at 4°C. To examine the labeling efficacy within KRH buffers, 10nM bio-CTX
and 1nM streptavidin-QD655 conjugates were added to KRH buffer, KRH with 1% BSA,
38

KRH with 2% BSA, KRH with 3% BSA. Additionally, labeling efficacy was examined
within DMEM complete culture medium with 10% FBS, 1x PBS with Ca2+ and Mg2+,
and tissue buffer with Ca2+ and Mg2+. Control experiments were also run in parallel to
determine if the methods yielded quantum dot non-specific binding interactions. The
solutions were added to the cells for two hours at 4°C with constant agitation. Following
the two hour incubation, the cells were washed 4-times in ice cold KRH buffer and
imaged. Imaging was performed with a Zeiss 200M Axiovert microscope (Zeiss, Inc.)
with Metamorph software (Metamorph, Inc.).
2.14: Peptide Neurotoxin Conjugation to Quantum Dots
Conjugation conditions were adapted from synthesis methods developed by Sun
et al.72 (Scheme 2.2). Briefly, one molar equivalent of ITK Quantum Dot amino(PEG)
525s or 655s (Invitrogen, Inc.) were reacted with 2000 molar equivalents of N-
succinimidyl iodoacetate (SIA) (Pierce, Inc.) for two hours at room temperature with
constant stirring. The chlorotoxin (Anaspec, Inc.) or dendrotoxin-1 (Sigma, Inc.) was
mixed (200 molar equivalents) with 2000 molar equivalents of Traut’s reagent (2-
iminothiolane HCl) (Pierce, Inc.) for one hour at room temperature. The quantum dot
solution was combined with the toxin solution and allowed to react for one hour at room
temperature. The conjugates were separated and concentrated using a 7000 MWCO Zeba
desalting column at 1000 x g for 2 minutes three times (Pierce, Inc.). From there, the
solution was centrifuged again in 100,000 MWCO Millipore Ultrafree-0.5 Biomax
centrifugation columns at 7500 x g for 10 minutes (Millipore, Inc.). Concentration of
each conjugate solution was determined using a CaryWin UV/Vis spectrophotometer
39
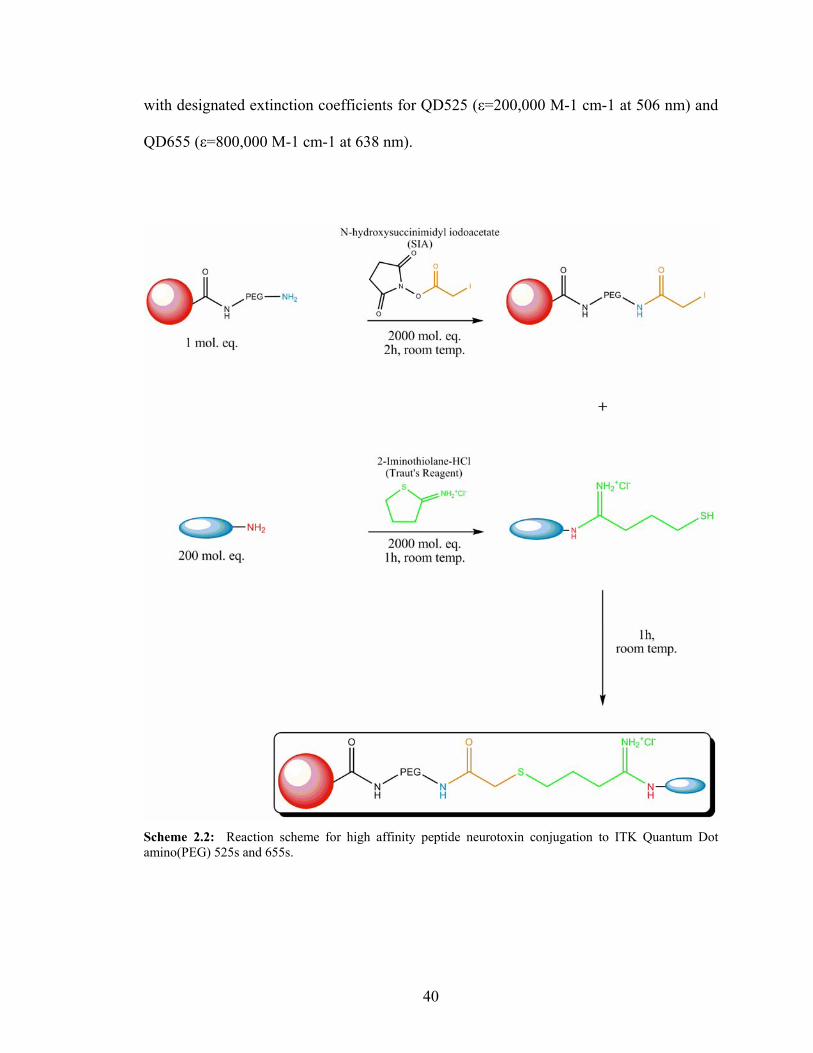
with designated extinction coefficients for QD525 (ε=200,000 M-1 cm-1 at 506 nm) and
QD655 (ε=800,000 M-1 cm-1 at 638 nm).
Scheme 2.2: Reaction scheme for high affinity peptide neurotoxin conjugation to ITK Quantum Dot amino(PEG) 525s and 655s.
40
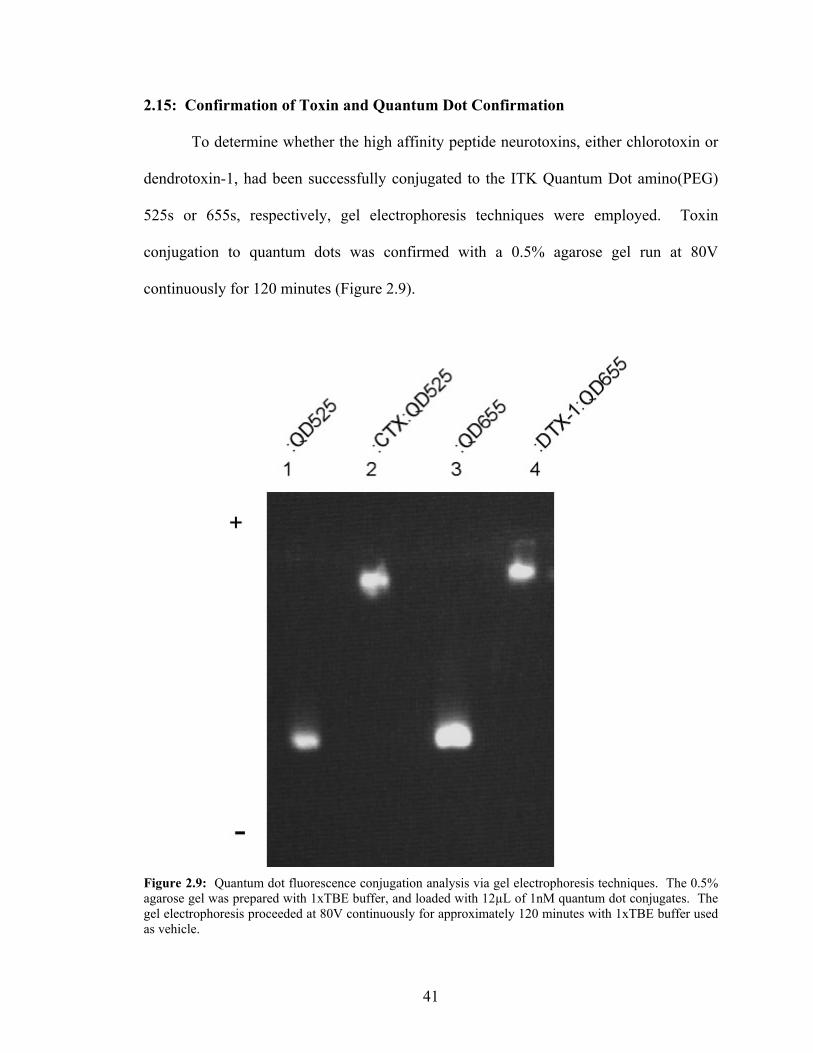
2.15: Confirmation of Toxin and Quantum Dot Confirmation To determine whether the high affinity peptide neurotoxins, either chlorotoxin or
dendrotoxin-1, had been successfully conjugated to the ITK Quantum Dot amino(PEG)
525s or 655s, respectively, gel electrophoresis techniques were employed. Toxin
conjugation to quantum dots was confirmed with a 0.5% agarose gel run at 80V
continuously for 120 minutes (Figure 2.9).
Figure 2.9: Quantum dot fluorescence conjugation analysis via gel electrophoresis techniques. The 0.5% agarose gel was prepared with 1xTBE buffer, and loaded with 12µL of 1nM quantum dot conjugates. The gel electrophoresis proceeded at 80V continuously for approximately 120 minutes with 1xTBE buffer used as vehicle.
41
The gel was made with and run in 1xTris/Borate/EDTA buffer (TBE). The conjugates
and unconjugated quantum dots were diluted 1x borate buffer (pH 8.5) to 1nM
concentrations. These aliquots were loaded into the 0.5% agarose gel in 12µL volumes,
and allowed to settle for approximately 15 minutes prior to initiating the current for
electrophoresis. Imaging utilized a Bio-Rad Chemidox XRS System with Quantity One
software (Bio-Rad, Inc.).
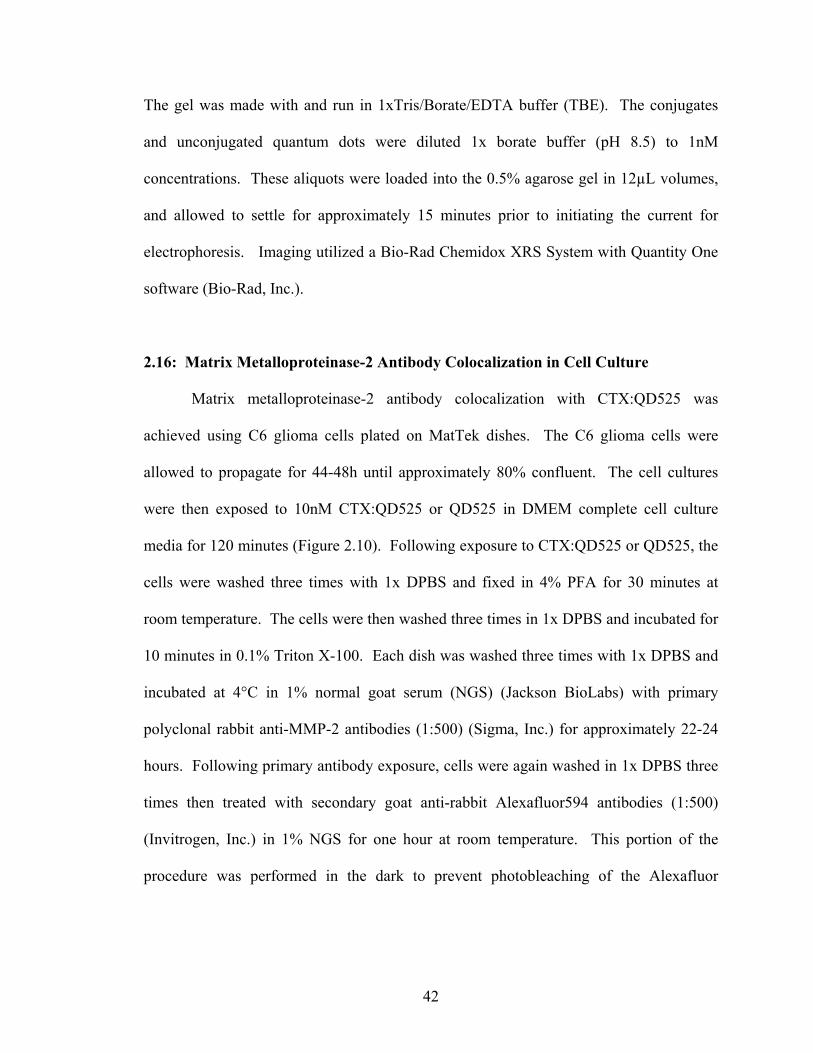
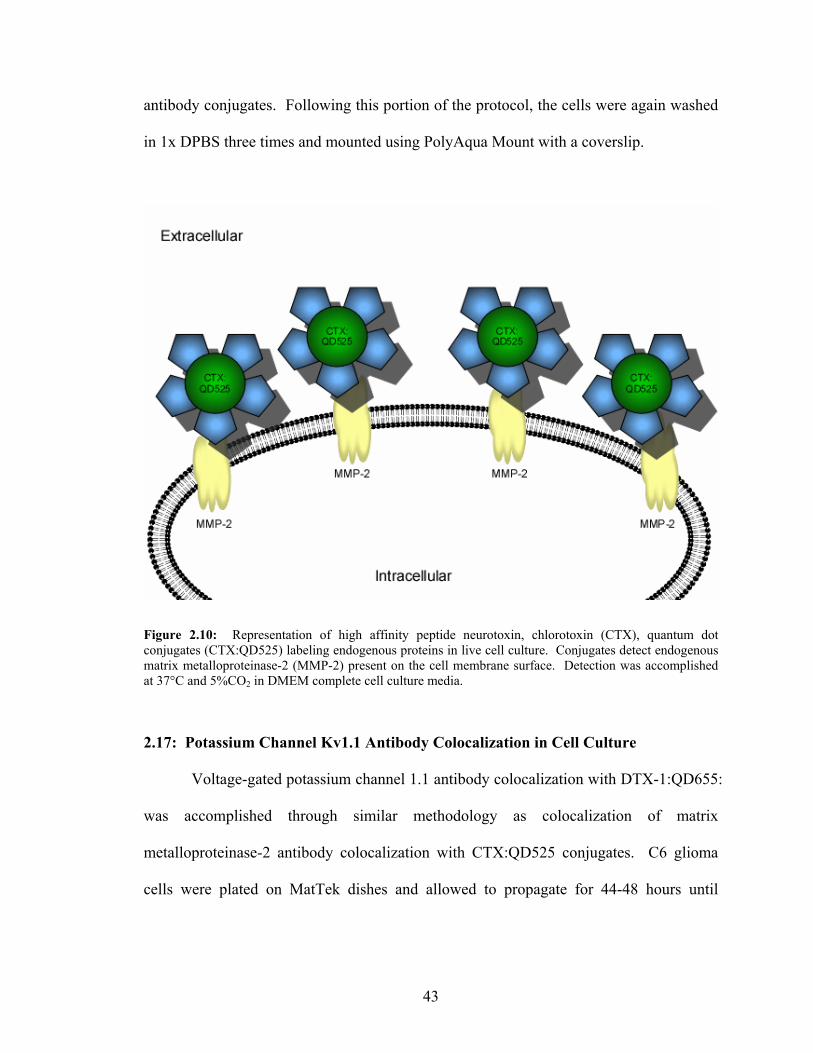
2.16: Matrix Metalloproteinase-2 Antibody Colocalization in Cell Culture
Matrix metalloproteinase-2 antibody colocalization with CTX:QD525 was
achieved using C6 glioma cells plated on MatTek dishes. The C6 glioma cells were
allowed to propagate for 44-48h until approximately 80% confluent. The cell cultures
were then exposed to 10nM CTX:QD525 or QD525 in DMEM complete cell culture
media for 120 minutes (Figure 2.10). Following exposure to CTX:QD525 or QD525, the
cells were washed three times with 1x DPBS and fixed in 4% PFA for 30 minutes at
room temperature. The cells were then washed three times in 1x DPBS and incubated for
10 minutes in 0.1% Triton X-100. Each dish was washed three times with 1x DPBS and
incubated at 4°C in 1% normal goat serum (NGS) (Jackson BioLabs) with primary
polyclonal rabbit anti-MMP-2 antibodies (1:500) (Sigma, Inc.) for approximately 22-24
hours. Following primary antibody exposure, cells were again washed in 1x DPBS three
times then treated with secondary goat anti-rabbit Alexafluor594 antibodies (1:500)
(Invitrogen, Inc.) in 1% NGS for one hour at room temperature. This portion of the
procedure was performed in the dark to prevent photobleaching of the Alexafluor
42
antibody conjugates. Following this portion of the protocol, the cells were again washed
in 1x DPBS three times and mounted using PolyAqua Mount with a coverslip.
Figure 2.10: Representation of high affinity peptide neurotoxin, chlorotoxin (CTX), quantum dot conjugates (CTX:QD525) labeling endogenous proteins in live cell culture. Conjugates detect endogenous matrix metalloproteinase-2 (MMP-2) present on the cell membrane surface. Detection was accomplished at 37°C and 5%CO2 in DMEM complete cell culture media.
2.17: Potassium Channel Kv1.1 Antibody Colocalization in Cell Culture
Voltage-gated potassium channel 1.1 antibody colocalization with DTX-1:QD655:
was accomplished through similar methodology as colocalization of matrix
metalloproteinase-2 antibody colocalization with CTX:QD525 conjugates. C6 glioma
cells were plated on MatTek dishes and allowed to propagate for 44-48 hours until
43
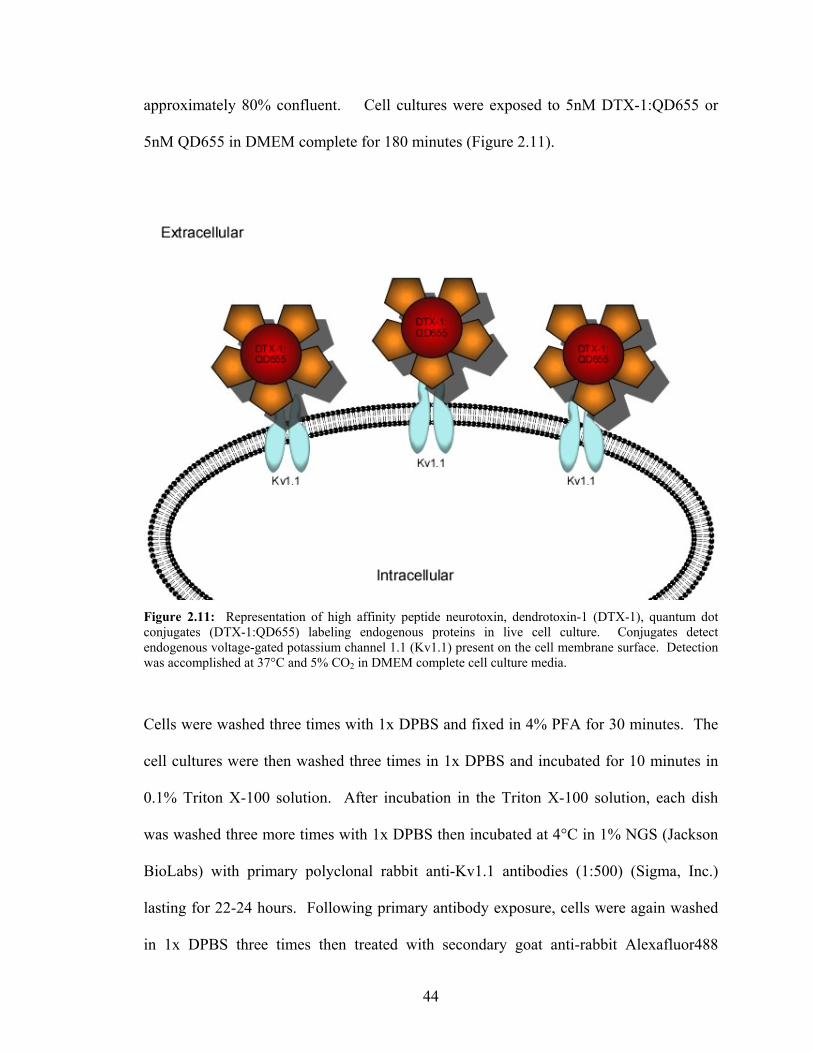
approximately 80% confluent. Cell cultures were exposed to 5nM DTX-1:QD655 or
5nM QD655 in DMEM complete for 180 minutes (Figure 2.11).
Figure 2.11: Representation of high affinity peptide neurotoxin, dendrotoxin-1 (DTX-1), quantum dot conjugates (DTX-1:QD655) labeling endogenous proteins in live cell culture. Conjugates detect endogenous voltage-gated potassium channel 1.1 (Kv1.1) present on the cell membrane surface. Detection was accomplished at 37°C and 5% CO2 in DMEM complete cell culture media.
Cells were washed three times with 1x DPBS and fixed in 4% PFA for 30 minutes. The
cell cultures were then washed three times in 1x DPBS and incubated for 10 minutes in
0.1% Triton X-100 solution. After incubation in the Triton X-100 solution, each dish
was washed three more times with 1x DPBS then incubated at 4°C in 1% NGS (Jackson
BioLabs) with primary polyclonal rabbit anti-Kv1.1 antibodies (1:500) (Sigma, Inc.)
lasting for 22-24 hours. Following primary antibody exposure, cells were again washed
in 1x DPBS three times then treated with secondary goat anti-rabbit Alexafluor488
44

antibodies (1:500) (Invitrogen, Inc.) in 1% NGS for one hour at room temperature in the
dark. The cells were then washed in 1x DPBS three times and mounted using PolyAqua
Mount with a coverslip.
2.18: CTX:QD525 Conjugate Blocking Assays
Chlorotoxin binding specificity was examined by using chlorotoxin to bind with
matrix metalloproteinase-2 in an effort to prevent the novel conjugates, CTX:QD525s,
from labeling the cells (Figure 2.12).
Figure 2.12: Unconjugated chlorotoxin blocks chlorotoxin quantum dot conjugates (CTX:QD488) from binding to matrix metalloproteinase-2 (MMP-2) expression in live cells.
45
Unconjugated chlorotoxin was used to block matrix metalloproteinase-2 in C6 glioma
cells. Glioma cells were plated on MatTek dishes and allowed to propagate for 24-36
hours until estimated 50-60% confluency. The cells were treated with 200nM
chlorotoxin in DMEM complete overnight at 37°C and 5% CO2. Following chlorotoxin
incubation, the cultures were exposed to 10nM CTX:QD525 or 10nM QD525 in DMEM
complete for time intervals of 30, 60, and 120 minutes. Cells were then washed three
times with 1x DPBS and fixed in 4% paraformaldehyde (PFA) for 30 minutes.
Afterwards, the cell cultures were washed in 1x DPBS three times, mounted with
PolyAqua Mount, and covered with coverslip.
For comparative purposes, the experiment was run in parallel without exposing
the C6 glioma cells to unconjugated chlorotoxin before exposure to the quantum dot
conjugates. This provided a time based assay of conjugate binding ability within living
cells that could be directly compared with the pre-blocked cell detection. First, C6
glioma cells were plated on MatTek dishes (MatTek Corp.) and allowed to propagate for
48 hours until approximately 80% confluent. Following propagation, cells were exposed
to 10nM CTX:QD525 or 10nM QD525 in DMEM complete for time increments of 30,
60, and 120 minutes. The cells were then washed three times with 1x DPBS and fixed in
4% paraformaldehyde (PFA) for 30 minutes. After this, the cultures were again washed
in 1x DPBS three times, mounted with PolyAqua Mount, and preserved with a coverslip.
2.19: DTX-1:QD655 Conjugate Blocking Assays
Binding to voltage-gated potassium channels, Kv1.1, by dendrotoxin-1
nanocrystal conjugates was assessed in a similar manner as the chlorotoxin conjugates.
46
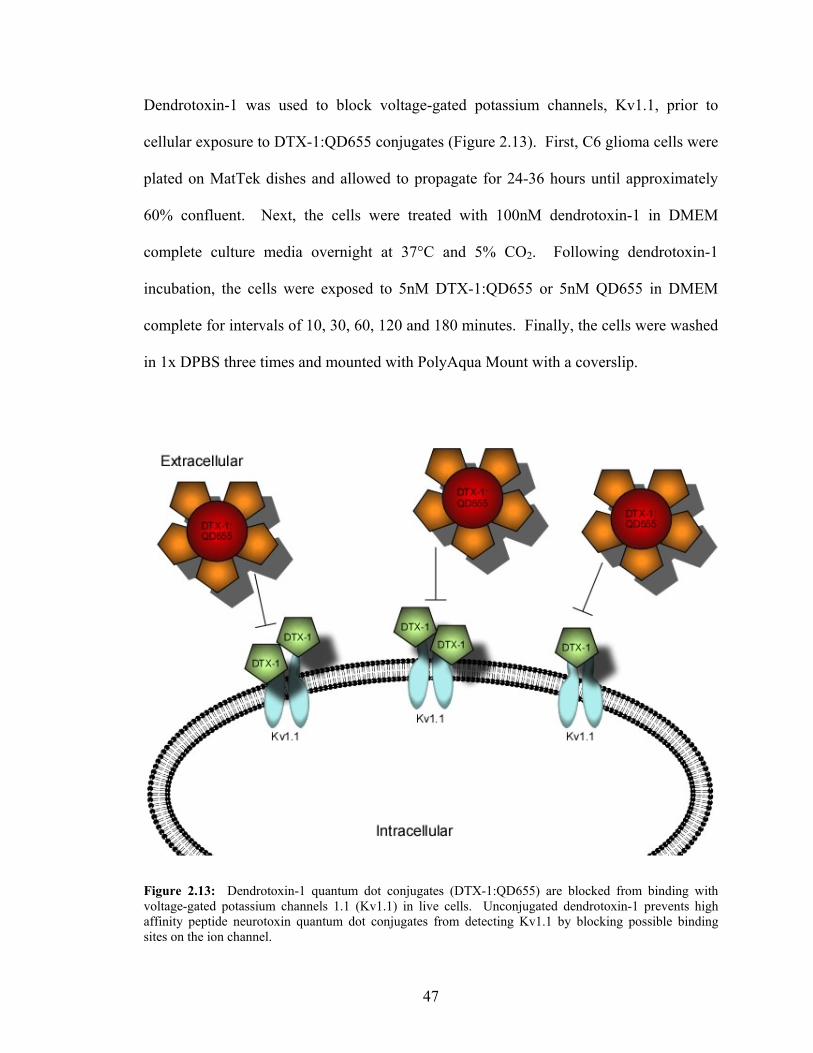
Dendrotoxin-1 was used to block voltage-gated potassium channels, Kv1.1, prior to
cellular exposure to DTX-1:QD655 conjugates (Figure 2.13). First, C6 glioma cells were
plated on MatTek dishes and allowed to propagate for 24-36 hours until approximately
60% confluent. Next, the cells were treated with 100nM dendrotoxin-1 in DMEM
complete culture media overnight at 37°C and 5% CO2. Following dendrotoxin-1
incubation, the cells were exposed to 5nM DTX-1:QD655 or 5nM QD655 in DMEM
complete for intervals of 10, 30, 60, 120 and 180 minutes. Finally, the cells were washed
in 1x DPBS three times and mounted with PolyAqua Mount with a coverslip.
Figure 2.13: Dendrotoxin-1 quantum dot conjugates (DTX-1:QD655) are blocked from binding with voltage-gated potassium channels 1.1 (Kv1.1) in live cells. Unconjugated dendrotoxin-1 prevents high affinity peptide neurotoxin quantum dot conjugates from detecting Kv1.1 by blocking possible binding sites on the ion channel.
47

Assessment of dendrotoxin-1 conjugate specificity was determined through
adequate control experiments. To determine this, C6 glioma cells were plated on MatTek
dishes and allowed to propagate for 48 hours until approximately 80% confluent.
Following propagation, the cells were exposed to 5nM DTX-1:QD655 or 5nM QD655 in
DMEM complete for 10, 30, 60, 120 and 180 minutes. The cell cultures were washed
three times with 1x DPBS and fixed in 4% PFA for 30 minutes. Each cell replicate was
then washed in 1x DPBS three times, and then mounted with PolyAqua Mount and a
coverslip. The replicates of both the pre-blocked and unaffected cells were imaged on a
Zeiss inverted confocal microscope. The images were processed using ImageJ (NIH) and
GraphPad Prism (GraphPad, Inc.) software.
2.20: Chlorotoxin Affinity Determined By Saturation Binding Curve
Chlorotoxin affinity for endogenous matrix metalloproteinase-2 in living cells
was determined through saturation binding curve analysis using quantum dot conjugates.
A CTX:QD525 saturation binding curve was generated by plating C6 glioma cells on
MatTek dishes and allowing them to propagate for 44-48 hours until approximately 80%
confluent. The cells were then treated with increasing concentrations of CTX:QD525 for
120 minutes at 37°C and 5% CO2. After treatment, the cell cultures were washed three
times in 1x DPBS and fixed in 4% PFA for approximately 30 minutes. Following fixing,
the cells were washed three times with 1x DPBS, mounted with PolyAqua Mount and
covered with a coverslip. All saturation binding curve conjugate concentrations were
repeated at least three times with each replicate imaged approximately six times. Each
replicate was imaged using inverted confocal microscopy with a Zeiss LSM 510Meta
48

microscope. The images were processed using ImageJ (NIH) and GraphPad Prism
(GraphPad, Inc.).
2.21: Dendrotoxin-1 Affinity Determined By Saturation Binding Curve
Dendrotoxin-1 affinity for endogenous voltage-gated potassium channels, Kv1.1,
in living cells was also determined through saturation binding curve analysis using
quantum dot conjugates. The DTX-1:QD655 saturation binding curve was accomplished
with standard cell culturing technique. Briefly, C6 glioma cells were plated on MatTek
dishes and allowed to propagate for 44-48 hours until approximately 80% confluent. The
cells were treated with increasing concentrations of DTX-1:QD655 for 180 minutes at
37°C and 5% CO2. As in previous experiments, the cultures were washed three times in
1x DPBS and fixed in 4% PFA for approximately 30 minutes. Following fixing, cells
were washed three times with 1x DPBS, mounted with PolyAqua Mount and covered
with a coverslip. All saturation binding curve conjugate concentrations were repeated at
least three times with each replicate imaged approximately six times. Each replicate was
imaged using inverted confocal microscopy with a Zeiss LSM 510Meta microscope. The
images were processed using ImageJ (NIH) and GraphPad Prism (GraphPad, Inc.).
2.22: Multiplexing Experimentation
Since multiplexing is a capability that quantum dots exhibit, initially C6 glioma
cells were tested using both toxin quantum dot conjugates for this purpose. The neural
cancer cells were treated as previously described for experiments performed prior; briefly,
the cells were allowed to propagate for 48 hours until approximately 60-80% confluent at
49
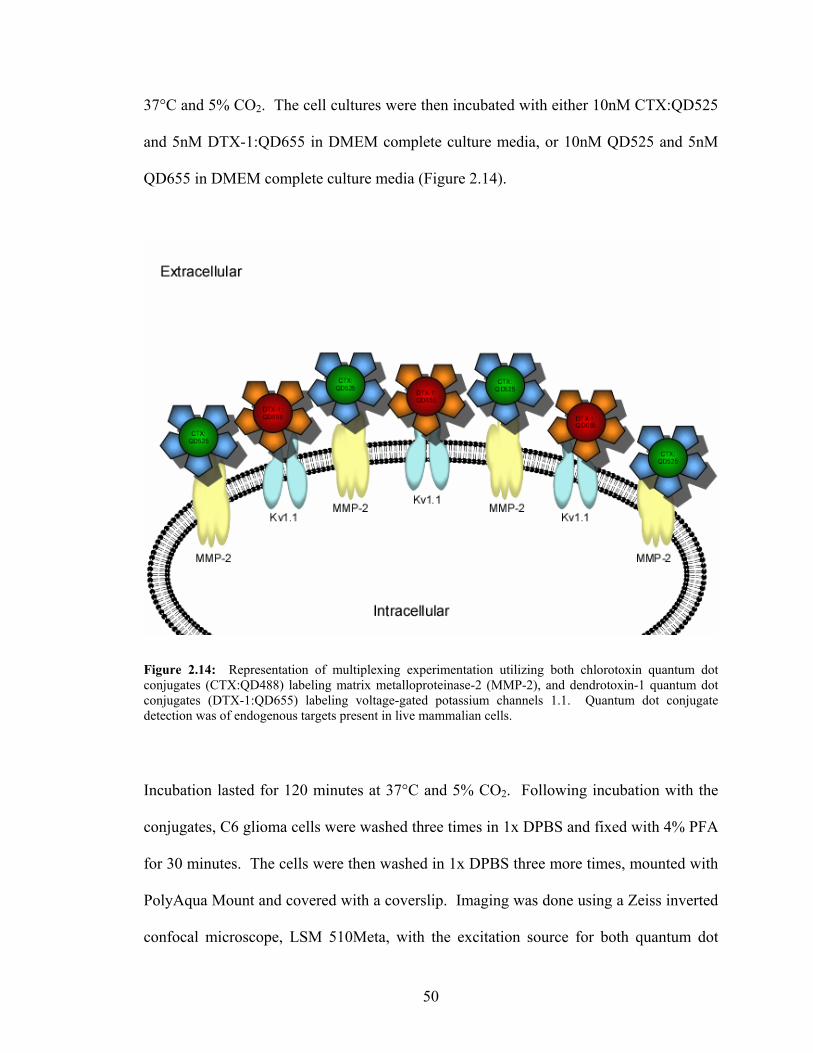
37°C and 5% CO2. The cell cultures were then incubated with either 10nM CTX:QD525
and 5nM DTX-1:QD655 in DMEM complete culture media, or 10nM QD525 and 5nM
QD655 in DMEM complete culture media (Figure 2.14).
Figure 2.14: Representation of multiplexing experimentation utilizing both chlorotoxin quantum dot conjugates (CTX:QD488) labeling matrix metalloproteinase-2 (MMP-2), and dendrotoxin-1 quantum dot conjugates (DTX-1:QD655) labeling voltage-gated potassium channels 1.1. Quantum dot conjugate detection was of endogenous targets present in live mammalian cells.
Incubation lasted for 120 minutes at 37°C and 5% CO2. Following incubation with the
conjugates, C6 glioma cells were washed three times in 1x DPBS and fixed with 4% PFA
for 30 minutes. The cells were then washed in 1x DPBS three more times, mounted with
PolyAqua Mount and covered with a coverslip. Imaging was done using a Zeiss inverted
confocal microscope, LSM 510Meta, with the excitation source for both quantum dot
50

conjugates being an Argon 488nm laser. Multiplexing comparison experiments were
done which employed three additional cell lines. A comparison was performed using a
human Lewis lung carcinoma line, H460, to examine expression levels of the toxins’
targets within another cancer cell line. Additional comparisons concerned determination
of detectable expression levels within normal cell lines, namely 3T3/NIH and HEK-293T.
All cell cultures were treated as described for C6 glioma cells for the multiplexing
experimentation protocol. The different cell lines were imaged in an identical manner as
the C6 glioma cell line. The results were quantitatively and qualitatively analyzed for
overall expression variances between cell types. Results were processed using ImageJ
(NIH) and GraphPad Prism (GraphPad, Inc.).
2.23: Flow Cytometry
Cells were seeded at approximately 300,000-350-000 cells per dish, and allowed
to propagate for 36-48 h at 37°C and 5% CO2. Cells were treated as previously described
with the toxin:QD conjugates, and allowed to incubate for 120, or 180 min. at
approximately 37°C and 5% CO2. The cells were then washed three times with 1xDPBS
without Mg2+ and Ca2+, then allowed to sit in 1xDPBS at room temperature for
approximately 20-30 min. The cells were then collected for flow cytometry
experimentation using a 5-laser BD LSRII flow cytometer. Data were analyzed using
GraphPad Prism software.
51

2.24: Confocal Microscopy
Each culture was imaged approximately five to six times with each experiment
run in triplicate. Images were processed and quantified using ImageJ (NIH) and
GraphPad Prism (GraphPad, Inc.). For CTX:QD525 antibody colocalization experiments,
blocking experiments, and concentration curve determination, CTX:QD525 was excited
using an Argon 488nm laser. For antibody colocalization, secondary-Alexafluor594 was
excited using a HeNe 543nm laser simultaneously with the Argon 488nm laser used to
excite CTX:QD525 conjugates. Similarly, DTX-1:QD655 antibody colocalization
experiments, blocking experiments, and concentration curve determination were imaged
using a HeNe 633 nm laser to illuminate DTX-1:QD655 conjugates. For antibody
colocalization, secondary-Alexafluor488 was excited using an Argon 488nm laser
simultaneously with the HeNe 633nm laser used to excite DTX-1:QD655 conjugates.
Multiplexing experiments were imaged using single-source excitation via an Argon
488nm laser to excite both CTX:QD525 and DTX-1:QD655 simultaneously.
52

CHAPTER III
TARGETING NICOTINIC ACETYLCHOLINE RECEPTORS
3.1: Introduction
Nicotinic acetylcholine receptors are a well studied class of ligand-gated ion
channels. They are members of the ionotropic receptor Cys-loop superfamily,100 and are
closely related to gamma-amino butyric acid receptors type A (GABAA) and glycine
receptors; additionally, they are distant cousins to both serotonin (5HT-3) and glutamate
(GluR) receptors. Nicotinic acetylcholine receptors are pentameric transmembrane
proteins that consist of subunits surrounding a cation pore. Subunits are classified as α(1-
10), β(1-5), δ, and γ (or ε in adult physiology), and found in both muscle tissues and
neuronal tissues (Figure 3.1).
Figure 3.1: Representation of muscle-type nicotinic acetylcholine receptors with designate subunits as viewed from above. Acetylcholine binding sites are highlighted on the α-subunits.
53
Each subunit has high sequence identity with homologous subunits that combine to form
an array of receptor subtypes throughout an organism. These receptors are further
categorized as homopentamers or heteropentamers based upon their subunit
organization.76, 78 In vertebrates, dense clusters of nicotinic acetylcholine receptors are
found in the Torpedo electric organ and in skeletal muscle, such as diaphragm tissue.74
The muscle-type nicotinic acetylcholine receptors are comprised of an α2βγδ
stoichiometry of subunits. Together, these subunits create a cation pore through which
ion flux78 occurs after acetylcholine binding.
Nicotinic acetylcholine receptors are located on the post-synaptic membrane of
the neuromuscular junction. The receptors are anchored in clusters at the peaks of the
highly folded post-synaptic membrane by rapsyn. Rapsyn is shown to secure nicotinic
acetylcholine receptors to motor endplates during synaptogenesis.82, 101, 102 The presence
of nicotinic acetylcholine receptors at motor endplates of the neuromuscular junction
bears important implications in neurological diseases, such as acquired autoimmune
myasthenia gravis. Myasthenia gravis is a degenerative neurological disease in which
nicotinic acetylcholine receptor antibodies cause loss of the endplate membrane; thereby,
significantly reducing nicotinic acetylcholine receptor and Na+ channel expression at the
post-synaptic cleft.77, 102 Without nicotinic acetylcholine receptor presence at the post-
synaptic membrane, the action potential, initiated by an agonist-induced electrochemical
gradient, is lost and neuromuscular transmission stops.
An electrochemical gradient is induced through extracellular agonist binding.75
Nicotinic acetylcholine receptors require that two neurotransmitter molecules bind to
non-equivalent binding sites on the α-subunits. Unwin and co-workers demonstrated
54
through electron microscopy that neurotransmitter binding results in a conformational
change, allowing for cation movement.80 Receptor functionality is gated by the
excitatory endogenous agonist, acetylcholine. Exogenous agonists such as (S)-(-)-
nicotine, (-)-cyticine, and (±)-epibatidine will additionally induce a receptor response.78
3.2: α-Bungarotoxin
Antibody and toxin labeling studies show that muscle-type nicotinic acetylcholine
receptors are clustered at the peaks of the highly folded post-synaptic muscle membrane.
In the disorder myasthenia gravis, nicotinic acetylcholine receptor antibodies induce a
loss of these clusters, thereby producing muscle paralysis and, if untreated, death.
Functioning nicotinic acetylcholine receptors are also lost when targeted by certain
neurotoxins, such as α-bungarotoxin. α-Bungarotoxin, a 74 amino acid peptide from the
snake Bungarus multicinctus, has subnanomolar affinity for nicotinic acetylcholine
receptors and blocks neuromuscular transmission by preventing binding at the α-subunit
interface with the δ and γ subunits.78 Another venom component, β-bungarotoxin, acts
pre-synaptically to trigger massive acetylcholine release and subsequent depletion.73 The
α-bungarotoxin peptide has been used as a high-affinity ligand to label nicotinic
acetylcholine receptors for imaging and quantitation. Fluorescent and radiolabeled α-
bungarotoxin conjugates are typically used;103-107 however, biotinylation is also an option
as binding to target receptors can be detected with an avidin-linked probe. Coupling of
biotin and avidin, or streptavidin, yields an interaction with femtomolar affinity and a
long half-life in solution. Common avidin probes include streptavidin-Alexafluor dye
conjugates. Recent advances in probe development have generated streptavidin-quantum
55
dot (streptavidin-QD) conjugates that may be even more suitable for biological
applications given their multiplexing capabilities and resistance to photobleaching.11, 14-16,
22
Although both live and fixed cells have been labeled with quantum dot conjugates,
tissue labeling with quantum dots has been limited to fixed sections22, 50, 52, 54, 55, 108-111 and
illumination tracking during surgical procedures.25, 51, 67-69, 112 Quantum dot labeling of
nicotinic acetylcholine receptors at neuromuscular junctions in mature ex vivo mouse
diaphragm is presented. The neuroreceptors were targeted with the α-bungarotoxin
conjugate, biotinylated α-bungarotoxin, and used streptavidin-QD655s to visualize the
bound biotinylated α-bungarotoxin in the whole mount tissue.
3.3: α-Bungarotoxin Affinity
To examine α-bungarotoxin affinity in ex vivo tissue, mouse diaphragm was
dissected and treated with glycine solution for one hour. The tissue was then incubated
overnight in blocking solution at 4°C. Following overnight blocking, the tissue was
treated with blocking solution containing increasing concentrations of biotinylated α-
bungarotoxin for approximately 10 minutes. Overnight incubation in blocking solution
containing streptavidin-QD655s (Invitrogen, Inc.) occurred after toxin exposure. Tissue
sections were mounted and imaged using invert confocal microscopy, LSM510 Meta
(Zeiss, Inc.). Figure 3.2 illustrates the resulting saturation binding curve using the
biotinylated α-bungarotoxin and streptavidin-QD655 labeling protocol. The observed
biotinylated α-bungarotoxin affinity, KD of approximately 200fM, indicates that α-
bungarotoxin has a much higher affinity for nicotinic acetylcholine receptors at
56
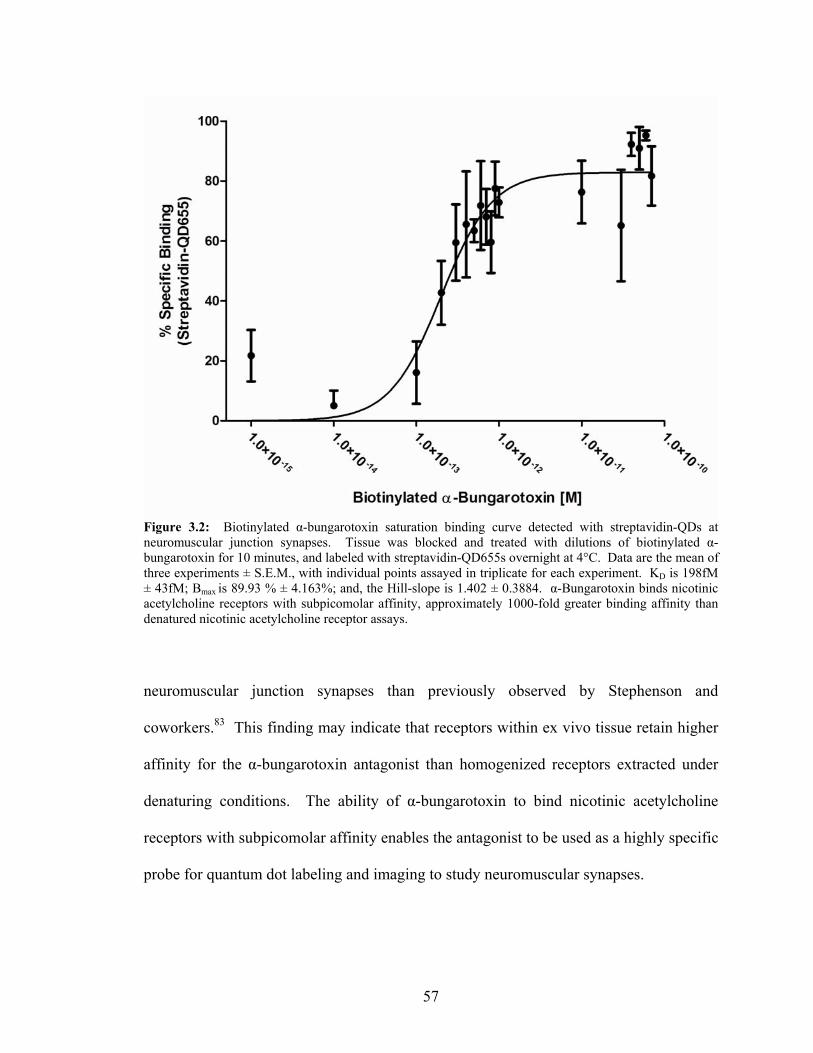
Figure 3.2: Biotinylated α-bungarotoxin saturation binding curve detected with streptavidin-QDs at neuromuscular junction synapses. Tissue was blocked and treated with dilutions of biotinylated α-bungarotoxin for 10 minutes, and labeled with streptavidin-QD655s overnight at 4°C. Data are the mean of three experiments ± S.E.M., with individual points assayed in triplicate for each experiment. KD is 198fM ± 43fM; Bmax is 89.93 % ± 4.163%; and, the Hill-slope is 1.402 ± 0.3884. α-Bungarotoxin binds nicotinic acetylcholine receptors with subpicomolar affinity, approximately 1000-fold greater binding affinity than denatured nicotinic acetylcholine receptor assays.
neuromuscular junction synapses than previously observed by Stephenson and
coworkers.83 This finding may indicate that receptors within ex vivo tissue retain higher
affinity for the α-bungarotoxin antagonist than homogenized receptors extracted under
denaturing conditions. The ability of α-bungarotoxin to bind nicotinic acetylcholine
receptors with subpicomolar affinity enables the antagonist to be used as a highly specific
probe for quantum dot labeling and imaging to study neuromuscular synapses.
57

3.4: Quantum Dot Labeling Time-Dependence in Ex Vivo Tissue
To further analyze biotinylated α-bungarotoxin and streptavidin-QD655 efficacy
as a probe for nicotinic acetylcholine receptors, we performed time-dependence
experiments with unfixed mouse diaphragms. The first experiment was to determine
whether length of biotinylated α-bungarotoxin exposure affected visualization with
streptavidin-QD655 (Figures 3.3, 3.5A). We treated the tissue as previously described,
and exposed the tissue to biotinylated α-bungarotoxin for intervals of 10, 60, 180, 360
(Figure 3.3) and 720 (Figure 3.5A) minutes. Additionally, we co-incubated the tissue
with a nicotinic acetylcholine receptor β-antibody and secondary-Alexafluor488 antibody
conjugate (Sigma, Inc.) to demonstrate probe specificity. A second experiment analyzed
whether receptor viability remained in ex vivo tissue after seven days in blocking
conditions prior to labeling with the biotinylated α-bungarotoxin and streptavidin-QD655
probe (Figure 3.4). Figure 3.3 illustrates that biotinylated α-bungarotoxin binds rapidly
in fresh ex vivo tissue where essentially full labeling was achieved at 10 minutes.
Additionally, we observed that binding was highly specific as demonstrated by
colocalization between the streptavidin-QD655 fluorescence, labeling biotinylated α-
bungarotoxin, and that of the Alexafluor488 antibody conjugate, labeling anti-nicotinic
acetylcholine receptor subunit antibodies. This further substantiates the affinity
determined in Figure 3.3 as noted by the lack of dissociation present at 720 minutes of
exposure (Figure 3.5A). We also see that binding is equivalent between Figures 2 and 3
at each α-bungarotoxin incubation time. These data suggest that the nicotinic
acetylcholine receptor remains viable over time when maintained in an ex vivo
58
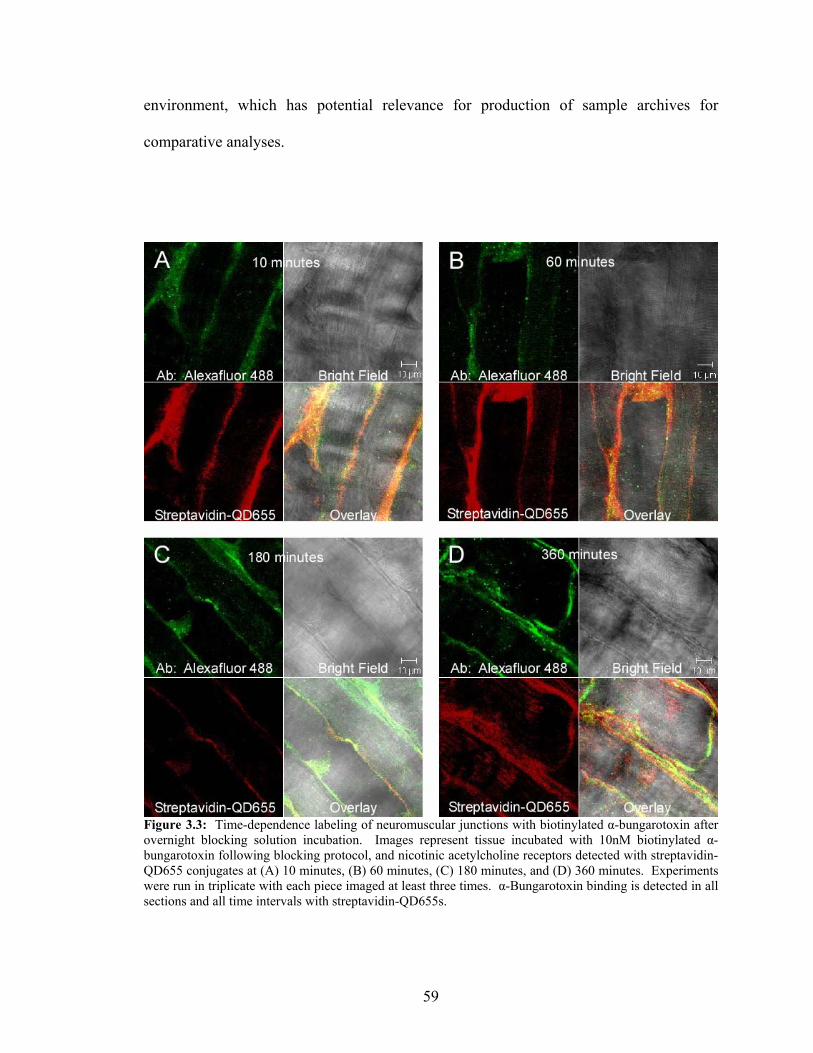
environment, which has potential relevance for production of sample archives for
comparative analyses.
Figure 3.3: Time-dependence labeling of neuromuscular junctions with biotinylated α-bungarotoxin after overnight blocking solution incubation. Images represent tissue incubated with 10nM biotinylated α-bungarotoxin following blocking protocol, and nicotinic acetylcholine receptors detected with streptavidin-QD655 conjugates at (A) 10 minutes, (B) 60 minutes, (C) 180 minutes, and (D) 360 minutes. Experiments were run in triplicate with each piece imaged at least three times. α-Bungarotoxin binding is detected in all sections and all time intervals with streptavidin-QD655s.
59
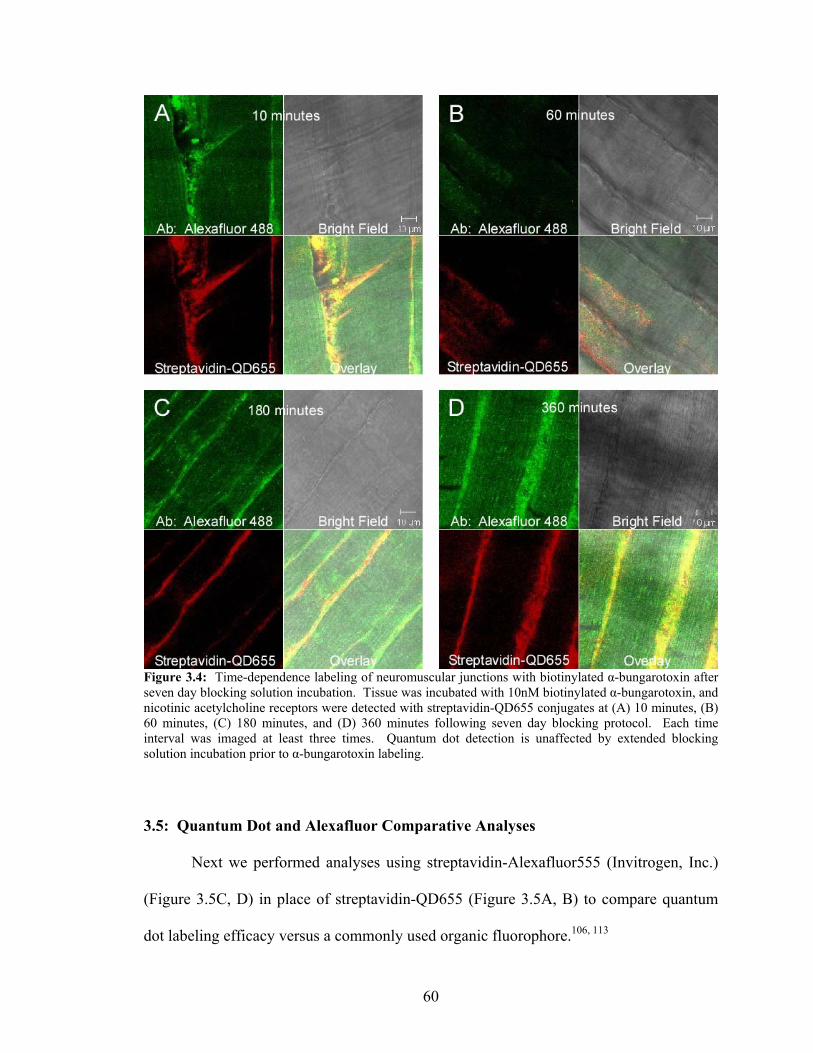
Figure 3.4: Time-dependence labeling of neuromuscular junctions with biotinylated α-bungarotoxin after seven day blocking solution incubation. Tissue was incubated with 10nM biotinylated α-bungarotoxin, and nicotinic acetylcholine receptors were detected with streptavidin-QD655 conjugates at (A) 10 minutes, (B) 60 minutes, (C) 180 minutes, and (D) 360 minutes following seven day blocking protocol. Each time interval was imaged at least three times. Quantum dot detection is unaffected by extended blocking solution incubation prior to α-bungarotoxin labeling. 3.5: Quantum Dot and Alexafluor Comparative Analyses
Next we performed analyses using streptavidin-Alexafluor555 (Invitrogen, Inc.)
(Figure 3.5C, D) in place of streptavidin-QD655 (Figure 3.5A, B) to compare quantum
dot labeling efficacy versus a commonly used organic fluorophore.106, 113
60
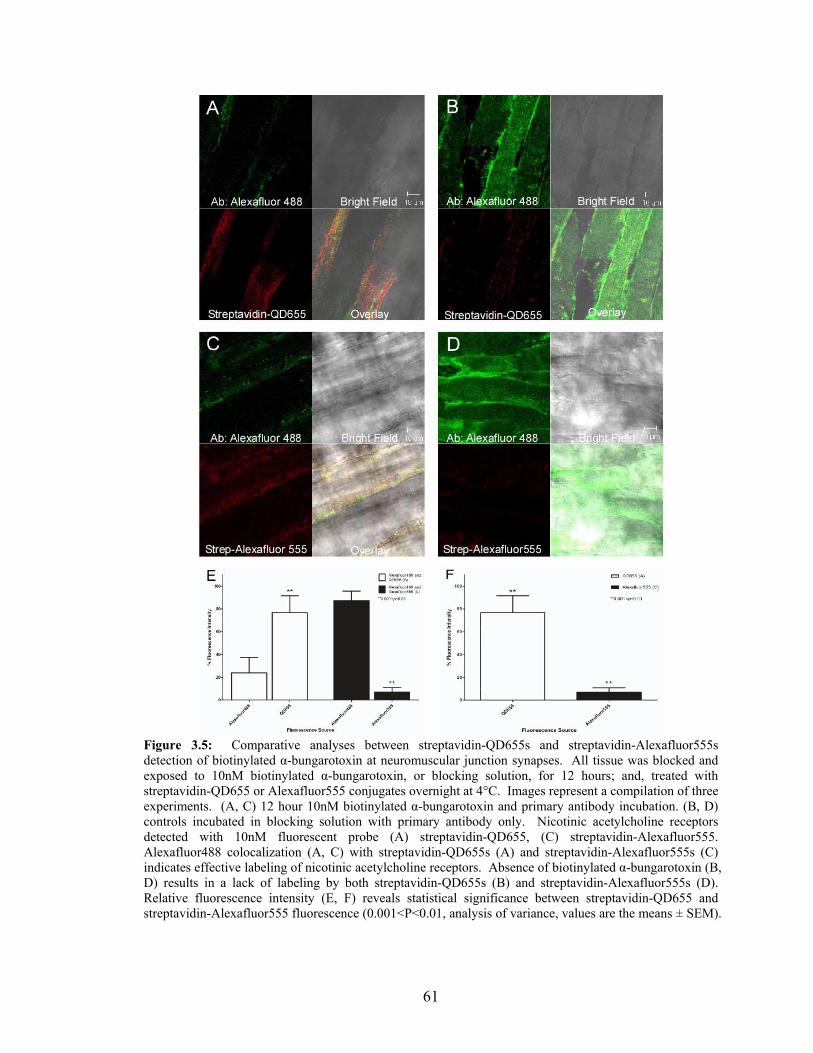
Figure 3.5: Comparative analyses between streptavidin-QD655s and streptavidin-Alexafluor555s detection of biotinylated α-bungarotoxin at neuromuscular junction synapses. All tissue was blocked and exposed to 10nM biotinylated α-bungarotoxin, or blocking solution, for 12 hours; and, treated with streptavidin-QD655 or Alexafluor555 conjugates overnight at 4°C. Images represent a compilation of three experiments. (A, C) 12 hour 10nM biotinylated α-bungarotoxin and primary antibody incubation. (B, D) controls incubated in blocking solution with primary antibody only. Nicotinic acetylcholine receptors detected with 10nM fluorescent probe (A) streptavidin-QD655, (C) streptavidin-Alexafluor555. Alexafluor488 colocalization (A, C) with streptavidin-QD655s (A) and streptavidin-Alexafluor555s (C) indicates effective labeling of nicotinic acetylcholine receptors. Absence of biotinylated α-bungarotoxin (B, D) results in a lack of labeling by both streptavidin-QD655s (B) and streptavidin-Alexafluor555s (D). Relative fluorescence intensity (E, F) reveals statistical significance between streptavidin-QD655 and streptavidin-Alexafluor555 fluorescence (0.001<P<0.01, analysis of variance, values are the means ± SEM).
61
Mouse diaphragms were exposed to biotinylated α-bungarotoxin for 720 minutes,
and then labeled overnight in either streptavidin-QD655, or streptavidin-Alexafluor555
conjugates. Although both quantum dots and Alexafluors label neuromuscular junction
synapses, imaging revealed that the quantum dots appear much brighter than their
fluorophore counterparts. Quantitative analysis of the relative intensities of streptavidin-
QD655 versus streptavidin-Alexafluor555 conjugates (Figure 3.5E, F) present
statistically significant differences in intensity between the fluorescent probes
(0.001<P<0.01, analysis of variance). The quantum dots exhibit a higher signal to noise
ratio in tissue samples than fluorescent dyes, and adequately label neural targets within an
ex vivo system. This is particularly significant in that our experiments are reported at
concentrations of biotinylated α-bungarotoxin that are ten times lower than
concentrations needed for Alexafluor labeling. To further verify the biotinylated α-
bungarotoxin and streptavidin-QD655 labeling system utility, nicotinic acetylcholine
receptor α-bungarotoxin binding sites were blocked with unconjugated α-bungarotoxin
using a concentration of α-bungarotoxin ten times in excess of the biotinylated α-
bungarotoxin used for detecting the neuromuscular junction nicotinic acetylcholine
receptors. Figure 3.6 illustrates that labeling at the α-bungarotoxin site is blocked by the
presence of α-bungarotoxin prior to introduction of the biotinylated conjugate. These
findings also indicate that biotinylated α-bungarotoxin does not displace α-bungarotoxin
within the exposure period, and that the labeling is specific to the α-bungarotoxin binding
site sequence, a 13-amino acid sequence found on the α-subunit of the nicotinic
acetylcholine receptor.104, 107, 114
62

Figure 3.6: Neuromuscular junction synapses pre-treated with 100nM α-bungarotoxin exhibit neither streptavidin-QD655, nor streptavidin-Alexafluor555 labeling after 10nM biotinylated α-bungarotoxin incubation. Tissue was incubated with 100nM α-bungarotoxin overnight, then treated with 10nM biotinylated α-bungarotoxin for 12 hours. Images are representative of three experiments. Presence of biotinylated α-bungarotoxin labeling was not detected after streptavidin-QD655 and Alexafluor555 treatment overnight. Alexafluor488 labeling at the nicotinic acetylcholine receptor β-subunit is unaffected by α-bungarotoxin pre-treatment. This indicates that both streptavidin-QD655 and streptavidin-Alexafluor555 labeling is specific to the α-bungarotoxin binding site. 3.6: Photostability in Ex Vivo Tissue
An additional assessment of the biotinylated α-bungarotoxin and streptavidin-
QD655 probe examined quantum dot photostability relative to the Alexafluor dyes.
63

Resistance to photobleaching is a known characteristic of quantum dots.53, 104, 105 Figures
3.7A1-3.7A5 demonstrate photobleaching resistance of quantum dots versus the
secondary antibody Alexafluor488 conjugate (Figures 3.7A1-3.7A5) and relative to
streptavidin-Alexafluor555s (Figures 3.7B1-3.7B5) within ex vivo tissue. The tissue was
imaged using an LSM510 Meta inverted confocal microscope (Zeiss, Inc.) and exposed
to continuous excitation for approximately 30 minutes. As time progressed, the
Alexafluor conjugates, Alexafluor488 and Alexafluor555, photobleached rapidly in ex
vivo tissue under continuous excitation. Quantum dots, however, retained their
photostability throughout continuous excitation, as illustrated in Figures 3.7A1-3.7A5.
There is significant reduction in Alexafluor488 intensity at 180 seconds and no reduction
in quantum dot intensity at the same time interval (Figure 3.7A2). After 720 seconds of
continuous fluorescence excitation in tissue, quantum dots maintain their brightness,
whereas Alexafluor488 is effectively photobleached. Figure 3.7C further supports that
quantum dots lose minimal intensity over time during repeated excitation. We measured
photobleaching resistance for both fluorophores and quantum dots relative to fluorescein
isothiocyanate (FITC) by spin-casting, a solvent evaporation technique that deposits
fluorescent probes directly onto a spinning surface, each fluorescent probe and exposing
the cast to continuous excitation on a Zeiss Axiovert 200M inverted widefield
microscope (Zeiss, Inc.) with Metamorph (MDS, Inc.) for 30 minutes. The trends in
Figure 3.7C affirm the photobleaching data obtained using the mouse diaphragms, and
suggest that quantum dots are a suitable fluorescent probe for targeting neuroreceptors in
ex vivo tissue.
64

Figure 3.7: Photostability of quantum dots versus Alexafluor dyes in tissue and by spin-casting. The samples were treated with 10nM biotinylated α-bungarotoxin and β-antibody (1:5000) for 10 minutes. Tissue samples were then incubated with secondary-Alexafluor488 antibody and either streptavidin-QD655s (A1-A5), or streptavidin-Alexafluor555s (B1-B5) overnight. Images were captured during continuous excitation of fluorescent probes using an inverted confocal microscope for 30 minutes. At approximately 180 seconds (A2, B2) there is significant photobleaching present in both Alexafluor488 and Alexafluor555, and no photobleaching present in QD655s. By 720 seconds (A5, B5), both Alexafluor dyes are photobleached, and quantum dots maintain their initial intensity. (C) Continuous excitation for 30 minutes using Zeiss Axiovert 200M widefield microscope with Metamorph imaging software of spin-cast, fluorescent probe deposition onto spinning surface for solvent evaporation, streptavidin-QD655s, streptavidin-Alexafluor555s, and secondary-Alexafluor488 antibody conjugate versus FITC. Alexafluor dyes photobleach after less than 10 minutes of continuous excitation; and, quantum dots are photostable after more than 30 minutes of continuous excitation, regardless of medium. 3.7: Summary
Saturation binding analysis revealed that α-bungarotoxin has 1000-fold higher
affinity for native nicotinic acetylcholine receptors than previously reported.83 This
65

indicates that it is a highly specific ligand that may be used in conjunction with a
recombinant α-bungarotoxin binding site to study neural targets lacking suitable high-
affinity probes.104, 107 Biotinylated α-bungarotoxin was shown to maintain high-affinity
for nicotinic acetylcholine receptors over time. α-Bungarotoxin also blocked nicotinic
acetylcholine receptor detection by biotinylated α-bungarotoxin, when exposed to muscle
tissue. Our findings additionally indicate that streptavidin-QD655s are photostable
fluorescent probes suitable for detecting nicotinic acetylcholine receptors in ex vivo
tissue using biotinylated α-bungarotoxin.
Quantum dots exhibit traits that are not seen with organic fluorophores, such as
near 100% quantum yield.7 Their incorporation into biological experiments has required
surface modification for biocompatibility. Reduction of non-specific binding to cell
membranes have included modifications such as micelle encapsulation,29 pegilation,30
selinization,31 coating in amphiphilic polymers,32, 33 and addition of biologically active
molecules such as proteins,22, 34, 35 peptides,36-38 small molecules,39-41 and antibodies42-45
to the surface of the quantum dots. Results of these surface modifications to quantum
dots have included successes in cell culture labeling.22, 23, 30, 46-56 The Ting laboratory
recently reported use of streptavidin-QD conjugates through biotin ligase biotinylation of
tagged cyan fluorescent protein and epidermal growth factor receptors in HeLa cell
cultures and α-amino-3-hydroxy-5-methyl-4-isoxazolepropionate (AMPA) receptors in
neurons.56 Their results demonstrated the utility of biotin-streptavidin quantum dot
coupling for targeting neuroreceptors and neurons. Our findings further support
biological suitability and provide evidence for quantum dot use in other tissues and
neural targets.
66

Biological applications for quantum dots include live cell-trafficking assays for
neural target studies, which require high probe specificity and photostability within
unfixed conditions. These data provide preliminary evidence demonstrating the
suitability of this approach for labeling nicotinic acetylcholine receptors in the brain
following I.C.V. injection of biotinylated α-bungarotoxin. Quantum dot labeling within
in vivo neural tissue will advance probe development, and provide real-time data of
protein interactions through nanocrystal tracking. Furthermore, our results demonstrate
ex vivo labeling efficacy of neuromuscular synapses with quantum dots.
67
CHAPTER IV
TARGETING ENDOGENOUS TARGETS IN LIVE CANCER CELLS
4.1: Introduction
Peptide-mediated quantum dot detection has been demonstrated to be an effective
methodology for probing biological systems with high specificity.57 Targeted neurotoxin
approaches have been employed to selectively label proteins for monitoring,39
detection,56, 57 and destruction.63, 64 Although designed to induce disruption of its
targeting system, each toxin provides the possibility to be utilized as a therapeutic vehicle
for disease detection and destruction, and as a means to study its target in greater depth.
Typically, peptide neurotoxins inhibit ion channels by acting as antagonists, and result in
the cessation of neurotransmission propagation and loss of channel functionality.115 The
high affinity characteristic of peptide neurotoxins enables the toxins to be used as ligands
for thorough study of their biological targets. Previous studies have demonstrated that a
well characterized ion channel may be detected with quantum dots and a high affinity
peptide neurotoxin.57
4.2: Chlorotoxin
Quantum dot cellular targeting may be mediated with use of toxins that interact
and bind to endogenously expressed cell membrane proteins and ion channels. Because
quantum dots exhibit characteristics that allow for potential multiplexing analyses,
multiple peptide toxins may be utilized toward endogenous labeling of a series of targets
simultaneously. One toxin of interest toward these applications is an insect venom toxin
68

isolated from the scorpion, Leiurus quinquestriatus, known as chlorotoxin.85 Chlorotoxin
is 36 amino acids in length with four disulfide bonds, 2Cys-19Cys, 5Cys-28Cys, 16Cys-
33Cys, and 20Cys-35Cys.87 The toxin appears to bind matrix metalloproteinase II,89, 90 an
extracellular matrix enzyme that exhibits gelatinase activity. Additionally, chlorotoxin
preferentially binds to cancer cells over non-cancer cells.62, 89 Of particular biological
interest is the primary brain glial cell cancer, glioma. Glioma cells are malignant cancer
cells that infiltrate healthy brain tissue, and evade complete surgical resection through yet
fully understood mechanisms.71 Chlorotoxin binds effectively to matrix
metalloproteinase-2 endogenously expressed by glioma cells,71, 89, 90 and exposure results
in loss of gelatinase activity, disruption in chloride channel currents, reduction in both
matrix metalloproteinase-2 and chloride channel expressions, and internalization of
chloride channels.60, 62, 89-91 In 2003, Sontheimer and colleagues determined that
chlorotoxin targets matrix metalloproteinase-2 through recombinant His tagging
methodologies coupled with analytical techniques including mass spectrometry.89 Olson
and co-workers provided further evidence in 2007 that matrix metalloproteinase-2 is the
chlorotoxin receptor by matrix metallorproteinase-2 antibody fluorescence colocalization
with chlorotoxin:Cy5.5 conjugate fluorescence in matrix metalloproteinase-2 transfected
MCF7 cells.90 These studies garner evidence that matrix metalloproteinase-2 is
influential in glioma cell proliferation, and raise questions regarding the nature of the
chloride channel interactions with matrix metalloproteinase-2. This property indicates
that chlorotoxin has the potential to be used as a therapy for gliomas, and affords insights
into the understanding of all cancer metastasis and into the poorly characterized chloride
channel superfamily.59, 93 Chlorotoxin conjugates are currently in Phase I/II clinical trials
69

for tagging glioma cells for surgical resection.90 These previous studies indicate that
chlorotoxin may be a suitable peptide for quantum dot conjugation toward use in live cell
detection of endogenous targets.
4.3: Dendrotoxin-1
A second toxin suited for quantum dot applications is a member of the
dendrotoxins, a family of high affinity cation channel antagonists. Dendrotoxins are
isolated from the venoms of the mamba snake family, and act by blocking various
subtypes of voltage-gated potassium channels. The peptides are approximately 7000 Da
and range in size from 57-60 amino acids in length.95 Their mechanism of action results
in depletion of acetylcholine at the neuromuscular junction through extension of the
action potential.94 Dendrotoxins interfere with the ability for potassium channels to
perform their primary responsibilities: (1) cell membrane potential maintenance, and (2)
cell membrane repolarization following action potential propagation. Interference with
potassium channel functions results in muscle convulsions and eventual death due to
hyperexcitability of the muscles.96 Dendrotoxin-1, a peptide isolated from the Black
Mamba, has been used to target potassium channels on C6 glioma cells. It was found by
Allen et al.97 that unstimulated C6 glioma cells express potassium channels of the subtype,
Kv1.1, which are targeted by dendrotoxin-1. Dendrotoxin-1 also targets two other
Shaker family potassium channels, Kv1.2 and Kv1.6. In the study by Allen et al.,97 only
Kv1.1 was detected to be present within the cells. Dendrotoxin-1 blockade caused
significant reduction in potassium currents, and not all cells recovered completely from
exposure.97 Significant reduction in potassium currents is indicative of impact on
70

potassium channel functionality. Loss of potassium channel functionality results in the
possibility that this channel subclass contributes to glioma metastasis through motility
mechanisms. These outcomes to dendrotoxin-1 exposure enable the peptide to be
utilized as a high affinity ligand for quantum dot studies of the intricate interplay between
potassium channels and other cellular targets.
4.4: Preliminary Experiments with Chlorotoxin and Glioma Cells
The objective of these preliminary experiments with chlorotoxin and glioma cells
was to determine the overall viability of the approach to apply quantum dots as a versatile
fluorescent probe capable of detecting ion channel disruptive neurotoxins within cell
cultures with high specificity. The aims of the preliminary chlorotoxin and glioma cell
experiments were to determine if chlorotoxin is able to be detected in C6 glioma cells by
avidin-linked quantum dots when biotinylated; and, to assess if quantum dot detection of
chlorotoxin is dependent on culture age, labeling temperature, vehicle solution, and time
of exposure to the toxin and quantum dots.
4.5: Biotinylated Chlorotoxin Detection by Streptavidin Quantum Dots
Following our previous success with biotinylated peptide neurotoxins and
streptavidin-QD655 conjugates,57 we biotinylated chlorotoxin for detection with
streptavidin-QD655s in cell culture. We estimated approximately four potential
biotinylation residues in the peptide based upon its sequence. Those are 1Met, 15Lys,
23Lys, and 27Lys of the 36 amino acids that compose the toxin.87 Peptide biotinylation
was performed using the Pierce EZ-link NHS biotin (succinimidobiotin) with chlorotoxin
71
reconstituted in bicarbonate buffer (pH 8.5). The reaction was performed based upon the
protocol provided within the kit, but modified to be effective with the low concentration
of our peptide (2µM). Briefly, the lyophilized peptide was reconstituted in bicarbonate
buffer to a concentration of 2µM. To compensate for the low concentration, the
succinimidobiotin was added to the peptide with a 50 molar excess to drive the reaction
to completion. The reaction vial was allowed to sit for 2 hours on ice, and was loaded
into the Pierce Dialysis Cassette (MWCO 3500 Da) according to equipment
specifications. We then dialyzed the solution to remove unreacted succinimidobiotin and
NHS present in the solution. The dialysis cassette was suspended in 1-L of phosphate
buffered saline (1x PBS, pH 7.4) for 2 hours two times at 4°C with constant stirring of
the PBS solution. After the second buffer change, the cassette was allowed to spin
overnight in the same conditions to finish the dialysis process. Following dialysis, the
biotinylated chlorotoxin was removed from the cassette according to manufacturer’s
instructions and prepared for analysis to assess biotinylation efficiency. The biotinylated
chlorotoxin solution was compared to a HABA solution using UV/Vis analysis. We were
able to determine that the chlorotoxin was biotinylated approximately 2.38 moles of
biotin : 1 mole of chlorotoxin. This indicates that we were successful at biotinylating
chlorotoxin for our studies.
C6 glioma cells (courtesy of and purchased by Dr. Daryl Bornhop via Lynn E.
Samuelson of Vanderbilt University from American Type Culture Collection) were
cultured in Dulbecco’s Minimum Essential Media (DMEM) with glucose and sodium
pyruvate, 1% L-glutamate, 1% penicillin/streptomycin, and 10% heat-inactivated fetal
bovine serum (FBS) at 37°C and 5% CO2. C6 glioma cells are a tumorigenic cell line
72
derived from rat gill cells that were transformed into tumor cells through N-
nitrosomethylurea induction by Benda et al. in 1968.116 Chlorotoxin has been
successfully used on C6 glioma cells for patch-clamp experiments with chloride
conductance.60, 117 Additionally, they endogenously express voltage-gated potassium
channels, Kv1.1, when unstimulated, along with other potential targets.97
Preliminary experiments with chlorotoxin have yielded results indicative that the
toxin appears to be amenable to streptavidin-linked probe detection when biotinylated.
C6 glioma cells were cultured for 72 hours in six-well plates at 37°C and 5% CO2 and
allowed to propagate until nearly 100% confluent. This was an attempt to mimic the
conditions of a tumor. We then exposed the cells at 37°C and 5% CO2 to 10nM
biotinylated chlorotoxin in 1x PBS with Ca2+ and Mg2+ for five minutes, and followed the
toxin exposure with 1nM streptavidin-QD655s in 1x PBS with Ca2+ and Mg2+ for five
minutes (Figure 4.1). We then washed the cells with room temperature 1x PBS with
Ca2+ and Mg2+ three times and imaged.
The cells exposed only to streptavidin-QD655s are without fluorescence (Figure
4.1, B1); however, cells exposed to the biotinylated chlorotoxin conjugate reveal
quantum dot fluorescence (Figure 4.1, A1). The fluorescence observed was seen
uniformly throughout the entire well, and in each well exposed to biotinylated
chlorotoxin and streptavidin-QD655s. This is significant in that the exposure time was
minimal and the cells were not cooled to impede internalization of the target. The cells
were imaged in solution and the images captured using a Zeiss Axiovert 200M widefield
microscope at 20x. It is also significant to note that non-specific binding is absent from
these cells.
73

Figure 4.1: Preliminary evidence of biotinylated chlorotoxin effectiveness as a peptide label using streptavidin-QD655. C6 glioma cells were plated and allowed to propagate in a six-well plate for 3 days. Cells were treated for five minutes at 37°C with both 10nM biotinylated chlorotoxin in 1x PBS with Ca2+ and Mg2+ (A) and 1xPBS with Ca2+ and Mg2+ (B). The biotinylated peptide was detected with 1nM streptavidin-QD655s in 1xPBS with Ca2+ and Mg2+ for five minutes at 37°C. The cells were washed with the same buffer at room temperature three times, and imaged in the buffer. Cells were imaged at 20x using a Zeiss Axiovert 200M widefield microscope with Metamorph imaging software. Quantum dot fluorescence (A1) and lack of quantum dot fluorescence (B1) indicates chlorotoxin is a high affinity probe that may be used to enable quantum dot detection for further studies. The experiment was performed in triplicate. 4.6: Conditions Influencing Biotinylated Chlorotoxin Detection
We next wanted to examine labeling with cells that were allowed to propagate for
shorter periods of time. This was to see if quantum dot detection maintained its integrity
and lack of non-specific binding with cells that had few, if any, daughter cells. It was
also to determine whether the necessary target is expressed so soon after trypsinizing the
culture, since trypsin is an enzyme that cleaves all proteins at the carboxyl side of
arginine and lysine, unless either is followed by proline. This eliminates surface
74

expression of proteins until the cells have had adequate time to recover from the trypsin
process. It is apparent that the cells have recovered the chlorotoxin target by 72 hours in
culture, as evident by the fluorescence present in Figure 4.1 (A1).
To continue our preliminary examination of quantum dot detection of chlorotoxin
using a two-step methodology, we cultured C6 glioma cells for 24 hours after
trypsinizing and plating the cells. This was accomplished by examining the cultures in a
variety of buffer solutions to optimize quantum dot detection of chlorotoxin’s cellular
target, matrix metalloproteinase-2. The cells were treated with ice cold Kreb’s-Ringer-
HEPES (KRH) buffer before exposing the cultures to multiple buffer solutions, including
1x KRH buffer with and without a percent bovine serum albumin (BSA), containing the
labeling agents. We chose KRH because it contains salts and glucose, which may aid in
examining shuttling events, and to maintain cell life during the hours of incubation at 4°C.
We added 10nM biotinylated chlorotoxin and 1nM streptavidin-QD655 conjugates to
KRH with 1% BSA, KRH with 2% BSA, KRH with 3% BSA, and DMEM complete
culture medium with 10% fetal bovine serum. Additionally, we ran parallel control
experiments to determine if our methods yielded quantum dot non-specific binding
interactions. The solutions were added to the cells for two hours at 4°C with constant
agitation. Following the two hour incubation, the cells were washed 4-times in ice cold
KRH buffer and imaged. These experiments yielded no obvious binding events, but also
demonstrated a lack of non-specific binding interactions. This indicates that the blocking
components may be hindering the streptavidin quantum dot detection of biotinylated
chlorotoxin. This supports the development of one-step probes, toxin:quantum dot
75
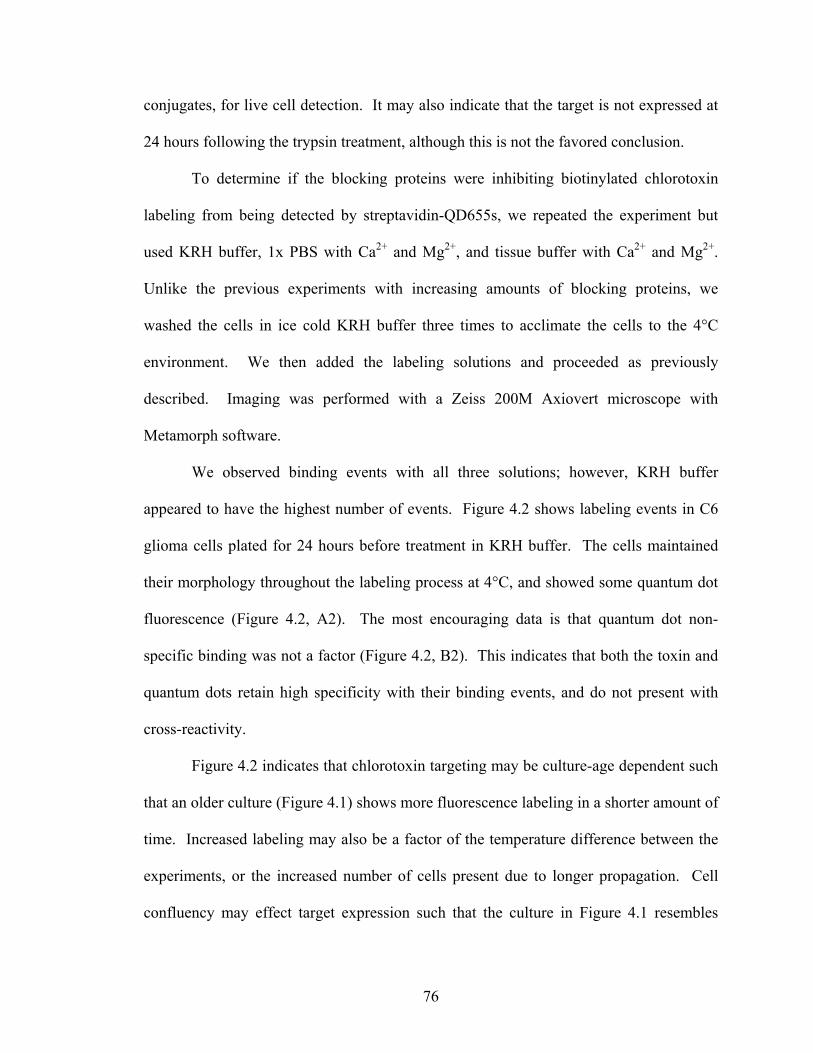
conjugates, for live cell detection. It may also indicate that the target is not expressed at
24 hours following the trypsin treatment, although this is not the favored conclusion.
To determine if the blocking proteins were inhibiting biotinylated chlorotoxin
labeling from being detected by streptavidin-QD655s, we repeated the experiment but
used KRH buffer, 1x PBS with Ca2+ and Mg2+, and tissue buffer with Ca2+ and Mg2+.
Unlike the previous experiments with increasing amounts of blocking proteins, we
washed the cells in ice cold KRH buffer three times to acclimate the cells to the 4°C
environment. We then added the labeling solutions and proceeded as previously
described. Imaging was performed with a Zeiss 200M Axiovert microscope with
Metamorph software.
We observed binding events with all three solutions; however, KRH buffer
appeared to have the highest number of events. Figure 4.2 shows labeling events in C6
glioma cells plated for 24 hours before treatment in KRH buffer. The cells maintained
their morphology throughout the labeling process at 4°C, and showed some quantum dot
fluorescence (Figure 4.2, A2). The most encouraging data is that quantum dot non-
specific binding was not a factor (Figure 4.2, B2). This indicates that both the toxin and
quantum dots retain high specificity with their binding events, and do not present with
cross-reactivity.
Figure 4.2 indicates that chlorotoxin targeting may be culture-age dependent such
that an older culture (Figure 4.1) shows more fluorescence labeling in a shorter amount of
time. Increased labeling may also be a factor of the temperature difference between the
experiments, or the increased number of cells present due to longer propagation. Cell
confluency may effect target expression such that the culture in Figure 4.1 resembles
76

tissue in its confluency. There may be a correlation between chlorotoxin target, matrix
metalloproteinase-2, expression and confluency. Further studies are needed to derive
definitive conclusions relating these results. These preliminary finding provide
additional evidence to substantiate the use and suitability of quantum dots for biological
labeling applications, and provide evidence that high affinity neurotoxin mediated
quantum dot detection may be a viable tool for disease identification and therapies.
Figure 4.2: Additional evidence that chlorotoxin is an effective probe for use in quantum dot detection studies. C6 glioma cells were plated and allowed to propagate in a six-well plate for 1 day. Before toxin exposure, cells were washed three times for 10 minutes with ice-cold KRH buffer. The cells were then treated with both 10nM biotinylated chlorotoxin and 1nM streptavidin-QD655 in KRH buffer, and 1nM streptavidin-QD655 in KRH buffer for 2 hours at 4°C with constant agitation. Imaging was performed at 20x using a Zeiss Axiovert 200M widefield microscope with Metamorph imaging software following four washes with ice-cold KRH buffer. Detection was reduced compared with cells allowed to propagate for a longer period of time, yet present. Experiments were performed in triplicate.
4.7: Neurotoxin Conjugated Quantum Dots
Quantum dot labeling utilizing high affinity peptide toxins has been demonstrated
to provide increased sensitivity for probing biological systems in their native
environment.57 Multiplexing experiments using two high affinity peptide toxins,
77

chlorotoxin and dendrotoxin-1, conjugated to quantum dots were performed. Each toxin
was conjugated directly to quantum dots, and used to visualize endogenous expression of
matrix metalloproteinase-2 and voltage-gated potassium channels, Kv1.1, in C6 glioma
cells, along with expression of these cellular targets within a series of representative cell
types.
4.8: Neurotoxin Nanoconjugates and Antibody Colocalization Analyses
Quantum dot conjugates for chlorotoxin and dendrotoxin-1 were synthesized
according to the reaction scheme in Figure 2.2 (A-C).72 The toxins were cross-linked to
both QD525 and QD655 for chlorotoxin and dendrotoxin-1, respectively, to produce
CTX:QD525 and DTX-1:QD655 for labeling. Quantum dot conjugate detection of
endogenous cellular targets was determined through antibody colocalization analyses.
Live C6 glioma cells were incubated with either 10nM CTX:QD525 or QD525, and
either 5nM DTX-1:QD655 or QD655, at 37°C and 5% CO2 for 120 and 180 minutes,
respectively. Following incubation cells were post-fixed in 4% paraformaldehyde and
permeabilized in 0.1% Triton X-100 prior to primary antibody exposure and subsequent
secondary Alexafluor conjugated antibody labeling. Figure 4.3 illustrates the
colocalization of CTX:QD525 conjugates (Figure 4.3A) with anti-matrix
metalloproteinase-2 antibodies detected with secondary-Alexa594 antibodies versus
exposure to QD525 in lieu of the toxin conjugate (Figure 4.3B). The presence of
colocalization between CTX:QD525 and secondary-Alexa594 antibodies indicates that
CTX:QD525 has labeled MMP-2 in the live cell, and demonstrates probe suitability for
the specified target.
78
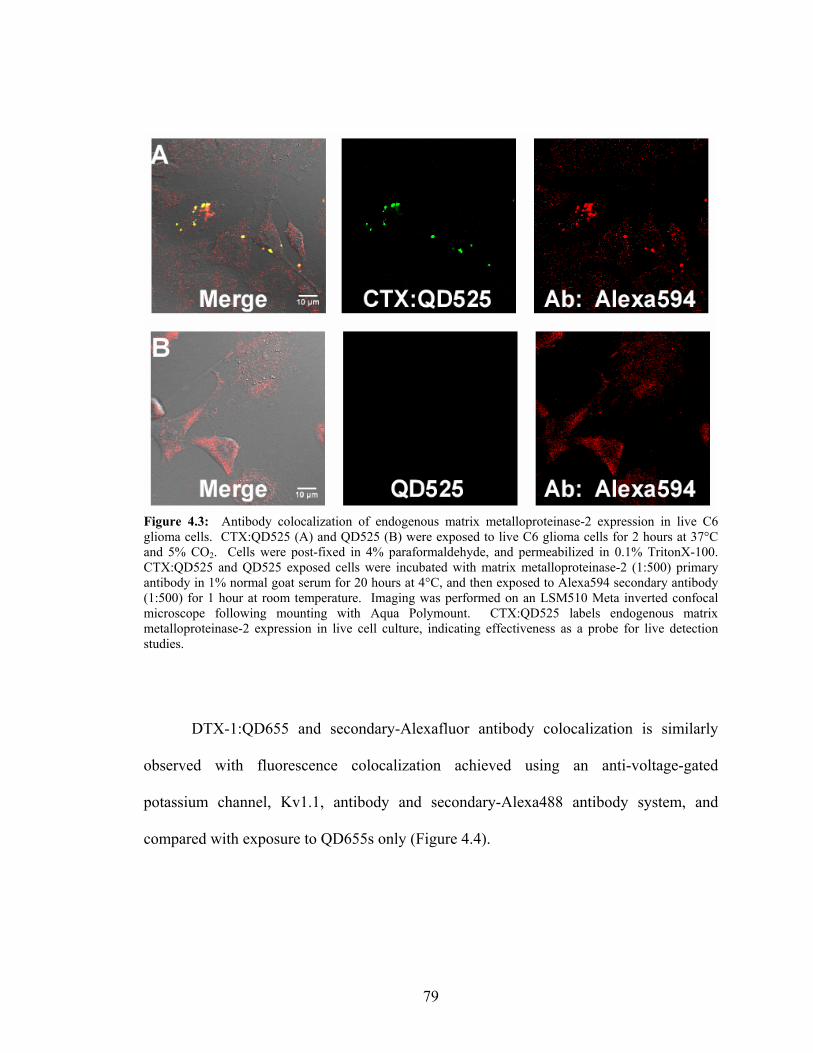
Figure 4.3: Antibody colocalization of endogenous matrix metalloproteinase-2 expression in live C6 glioma cells. CTX:QD525 (A) and QD525 (B) were exposed to live C6 glioma cells for 2 hours at 37°C and 5% CO2. Cells were post-fixed in 4% paraformaldehyde, and permeabilized in 0.1% TritonX-100. CTX:QD525 and QD525 exposed cells were incubated with matrix metalloproteinase-2 (1:500) primary antibody in 1% normal goat serum for 20 hours at 4°C, and then exposed to Alexa594 secondary antibody (1:500) for 1 hour at room temperature. Imaging was performed on an LSM510 Meta inverted confocal microscope following mounting with Aqua Polymount. CTX:QD525 labels endogenous matrix metalloproteinase-2 expression in live cell culture, indicating effectiveness as a probe for live detection studies.
DTX-1:QD655 and secondary-Alexafluor antibody colocalization is similarly
observed with fluorescence colocalization achieved using an anti-voltage-gated
potassium channel, Kv1.1, antibody and secondary-Alexa488 antibody system, and
compared with exposure to QD655s only (Figure 4.4).
79
Figure 4.4: Antibody colocalization of endogenous Kv1.1 expression in live C6 glioma cells. DTX-1:QD655 (A) and QD655 (B) were exposed to live C6 glioma cells for 3 hours at 37°C at 5% CO2. Cells were post-fixed in 4% paraformaldehyde, and permeabilized in 0.1% TritonX-100. DTX-1:QD655 and QD655 exposed cells were incubated with potassium channel, Kv1.1, (1:500) primary antibody in 1% normal goat serum for 24 hours at 4°C, and then exposed to Alexa488 secondary antibody (1:500) for 1 hour at room temperature. Imaging was performed on an LSM510 Meta inverted confocal microscope following mounting with Aqua Polymount. Potassium channel, Kv1.1, expression is effectively detected using DTX-1:QD655 in live cell culture, which indicates probe effectiveness for live detection studies of endogenously expressed targets.
Comparable to CTX:QD525, secondary-Alexa488 fluorescence colocalization with DTX-
1:QD655 emission is observed (Figure 4.4A) without the presence of QD655 non-
specific binding (Figure 4.4B). This supports DTX-1:QD655 specificity for the
potassium channel target, Kv1.1, making the conjugate a suitable probe for endogenous
potassium channel detection in living cells. Colocalization of secondary-Alexafluor
fluorescence with CTX:QD525 and DTX-1:QD655 emission enabled labeling efficacy to
be determined as specific to the cellular targets, matrix metalloproteinase-2 and voltage-
gated potassium channel, Kv1.1. Additionally, lack of secondary-Alexafluor
80
colocalization when present in the system exposed only to QD525 or QD655 further
substantiates probe specificity via CTX:QD525 and DTX-1:QD655 affinity for the
endogenous cellular targets, and supports that fluorescence is not the result of QD525 or
QD655 non-specific binding within C6 glioma cells.
4.9: Chlorotoxin Quantum Dot Conjugate Time-Dependent Blocking
Following examination utilizing antibody colocalization analyses for positive
determination of target detection, verification that CTX:QD525 binds to the specified
target was further tested through time-dependent blocking assays. C6 glioma cells were
incubated in media containing 200nM unconjugated chlorotoxin overnight. The cultures
were then treated with 10nM CTX:QD525 or QD525 for time intervals of 30, 60 and 120
minutes at 37°C and 5% CO2. Figure 4.5 illustrates representative images of effective
chlorotoxin blocking of CTX:QD525 labeling for the designated time intervals.
Comparatively, CTX:QD525 detection of matrix metalloproteinase-2 increases with time
in C6 glioma cultures left unexposed to unconjugated chlorotoxin, which further
substantiates CTX:QD525 probe specificity for the target. There is a significant increase
at 120 minutes in CTX:QD525 labeling of native matrix metalloproteinase-2 in live
culture, which was established to be the optimal incubation time for the CTX:QD525
conjugate for additional studies utilizing the probe.
81
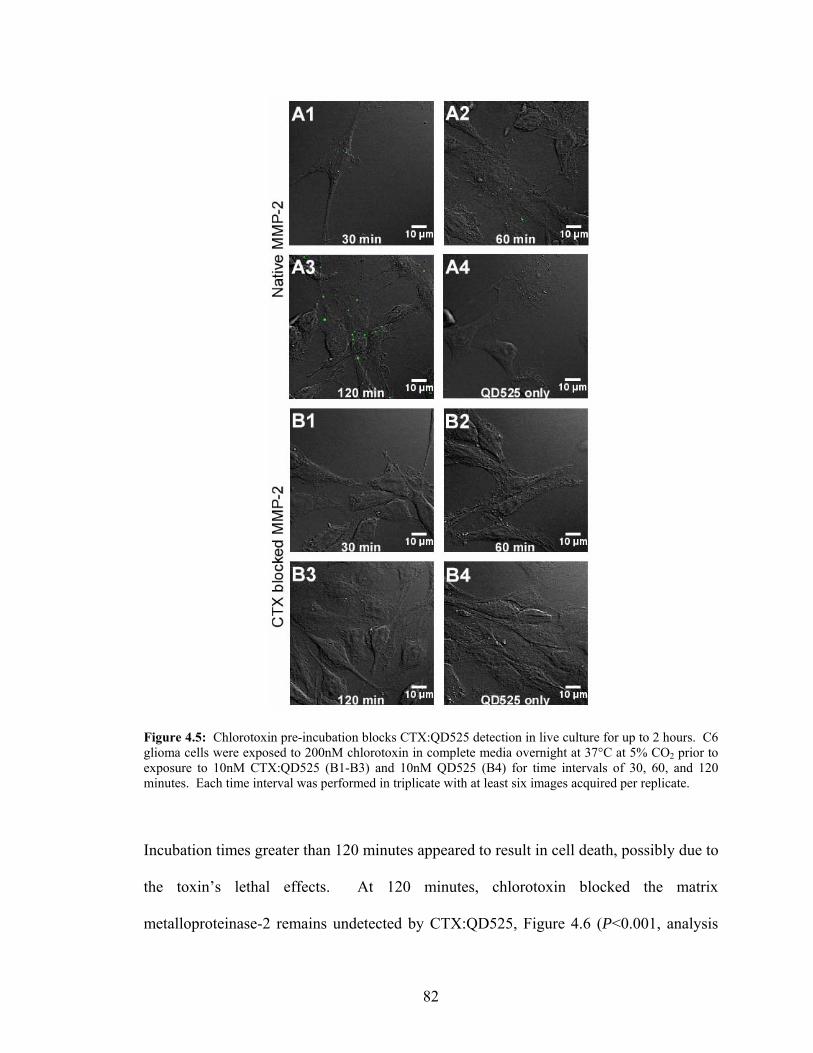
Figure 4.5: Chlorotoxin pre-incubation blocks CTX:QD525 detection in live culture for up to 2 hours. C6 glioma cells were exposed to 200nM chlorotoxin in complete media overnight at 37°C at 5% CO2 prior to exposure to 10nM CTX:QD525 (B1-B3) and 10nM QD525 (B4) for time intervals of 30, 60, and 120 minutes. Each time interval was performed in triplicate with at least six images acquired per replicate.
Incubation times greater than 120 minutes appeared to result in cell death, possibly due to
the toxin’s lethal effects. At 120 minutes, chlorotoxin blocked the matrix
metalloproteinase-2 remains undetected by CTX:QD525, Figure 4.6 (P<0.001, analysis
82

of variance, values are the means ± SEM). Quantitative analysis that CTX:QD525
detection in live culture is effectively blocked for 120 minutes, in addition to antibody
colocalization (Figure 4.3A), confirms CTX:QD525 target specificity, and concurs with
qualitative microscopic evidence.
Figure 4.6: Chlorotoxin pre-incubation blocks CTX:QD525 detection in live culture for up to 2 hours. Chlorotoxin effectively blocked CTX:QD525 endogenous detection in live culture for up to 2 hours (P<0.001, analysis of variance, values are the means ± SEM), and further indicates probe suitability for live assays. Each time interval was performed in triplicate with at least six images acquired per replicate.
83
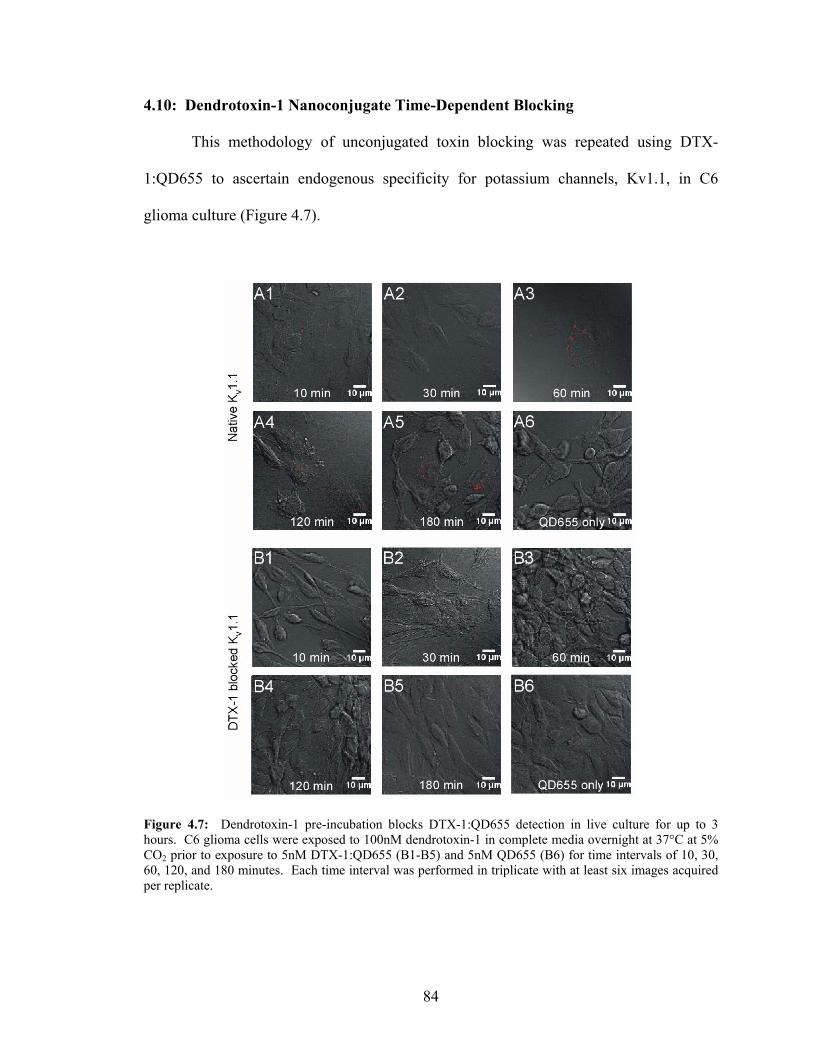
4.10: Dendrotoxin-1 Nanoconjugate Time-Dependent Blocking
This methodology of unconjugated toxin blocking was repeated using DTX-
1:QD655 to ascertain endogenous specificity for potassium channels, Kv1.1, in C6
glioma culture (Figure 4.7).
Figure 4.7: Dendrotoxin-1 pre-incubation blocks DTX-1:QD655 detection in live culture for up to 3 hours. C6 glioma cells were exposed to 100nM dendrotoxin-1 in complete media overnight at 37°C at 5% CO2 prior to exposure to 5nM DTX-1:QD655 (B1-B5) and 5nM QD655 (B6) for time intervals of 10, 30, 60, 120, and 180 minutes. Each time interval was performed in triplicate with at least six images acquired per replicate.
84

Cells were treated similarly to the chlorotoxin assays, and blocked with 100nM
unconjugated dendrotoxin-1 overnight. Following blocking with unconjugated
dendrotoxin-1, C6 glioma cells were incubated with 5nM DTX-1:QD655 for time
intervals of 10, 30, 60, 120, and 180 minutes. Subsequent comparison to native Kv1.1
potassium channels, illustrated in Figure 4.7, reveals the rapidity of DTX-1:QD655
labeling of native Kv1.1 potassium channels in live culture. Both quantitative, Figure 4.8,
and qualitative analyses, Figure 4.7, reveal that dendrotoxin-1 blocks DTX-1:QD655
detection of voltage-gated potassium channels, Kv1.1, for approximately 180 minutes.
Figure 4.8: Dendrotoxin-1 pre-incubation blocks DTX-1:QD655 detection in live culture for up to 3 hours. Dendrotoxin-1 effectively blocked DTX-1:QD655 endogenous detection in live culture for up to 3 hours (P<0.001, analysis of variance, values are the means ± SEM), and further indicates probe suitability for live assays. Each time interval was performed in triplicate with at least six images acquired per replicate.
85
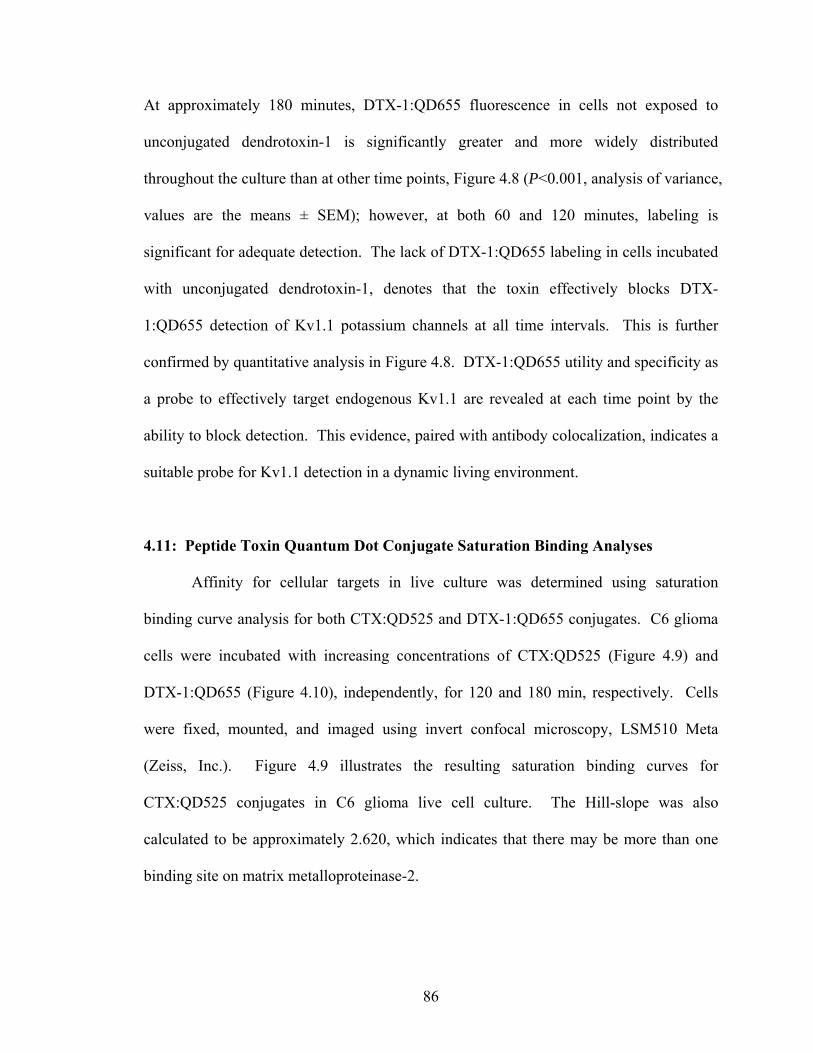
At approximately 180 minutes, DTX-1:QD655 fluorescence in cells not exposed to
unconjugated dendrotoxin-1 is significantly greater and more widely distributed
throughout the culture than at other time points, Figure 4.8 (P<0.001, analysis of variance,
values are the means ± SEM); however, at both 60 and 120 minutes, labeling is
significant for adequate detection. The lack of DTX-1:QD655 labeling in cells incubated
with unconjugated dendrotoxin-1, denotes that the toxin effectively blocks DTX-
1:QD655 detection of Kv1.1 potassium channels at all time intervals. This is further
confirmed by quantitative analysis in Figure 4.8. DTX-1:QD655 utility and specificity as
a probe to effectively target endogenous Kv1.1 are revealed at each time point by the
ability to block detection. This evidence, paired with antibody colocalization, indicates a
suitable probe for Kv1.1 detection in a dynamic living environment.
4.11: Peptide Toxin Quantum Dot Conjugate Saturation Binding Analyses
Affinity for cellular targets in live culture was determined using saturation
binding curve analysis for both CTX:QD525 and DTX-1:QD655 conjugates. C6 glioma
cells were incubated with increasing concentrations of CTX:QD525 (Figure 4.9) and
DTX-1:QD655 (Figure 4.10), independently, for 120 and 180 min, respectively. Cells
were fixed, mounted, and imaged using invert confocal microscopy, LSM510 Meta
(Zeiss, Inc.). Figure 4.9 illustrates the resulting saturation binding curves for
CTX:QD525 conjugates in C6 glioma live cell culture. The Hill-slope was also
calculated to be approximately 2.620, which indicates that there may be more than one
binding site on matrix metalloproteinase-2.
86
Figure 4.9: Saturation binding curve for CTX:QD525. Points represent experiments run in triplicate and imaged at least five times. Live C6 glioma cells were exposed to 10nM CTX:QD525 for approximately 120 minutes prior to post-fixing with 4% paraformaldehyde for imaging. Data are the mean of three experiments ± S.E.M. The CTX:QD525 saturation binding curve yielded the chlorotoxin affinity to be approximated as: KD = 164.5pM ± 8.712pM; Bmax is 93.02% ± 2.333%; and, the Hill-slope is 2.620 ± 0.3269. Toxin conjugation to quantum dots produces high affinity probes for target detection.
Saturation binding analysis for DTX-1:QD655 conjugates (Figure 4.10) also
supported the data presented in Figure 4.7 and Figure 4.8. The binding curve indicated a
KD for DTX-1:QD655 in C6 glioma live cell culture to approximately 3.7nM. Although
this is in agreement with the observed data in Figure 4.7 and Figure 4.8, the affinity was
determined to be less for the conjugate than previously reported for unconjugated DTX-
1.94 Lower affinity may be the result of the conjugation process in that the residues used
to conjugate the quantum dot to the toxin may be critical to the interaction with the
87
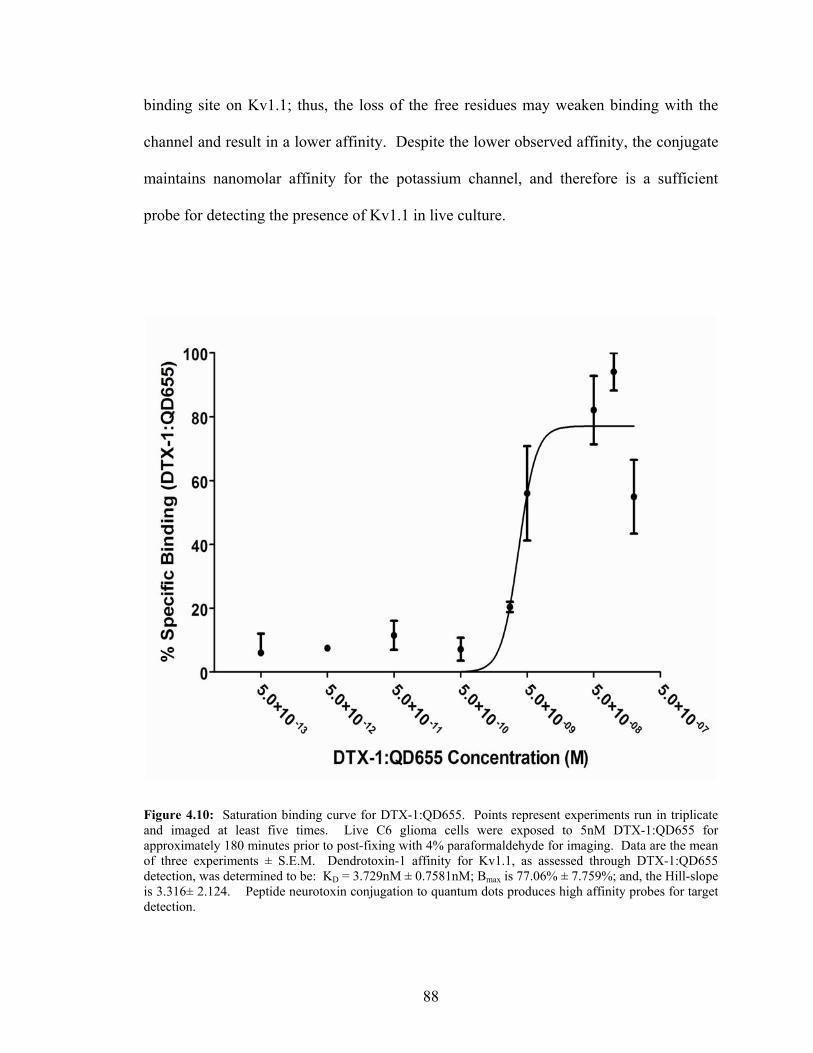
binding site on Kv1.1; thus, the loss of the free residues may weaken binding with the
channel and result in a lower affinity. Despite the lower observed affinity, the conjugate
maintains nanomolar affinity for the potassium channel, and therefore is a sufficient
probe for detecting the presence of Kv1.1 in live culture.
Figure 4.10: Saturation binding curve for DTX-1:QD655. Points represent experiments run in triplicate and imaged at least five times. Live C6 glioma cells were exposed to 5nM DTX-1:QD655 for approximately 180 minutes prior to post-fixing with 4% paraformaldehyde for imaging. Data are the mean of three experiments ± S.E.M. Dendrotoxin-1 affinity for Kv1.1, as assessed through DTX-1:QD655 detection, was determined to be: KD = 3.729nM ± 0.7581nM; Bmax is 77.06% ± 7.759%; and, the Hill-slope is 3.316± 2.124. Peptide neurotoxin conjugation to quantum dots produces high affinity probes for target detection.
88
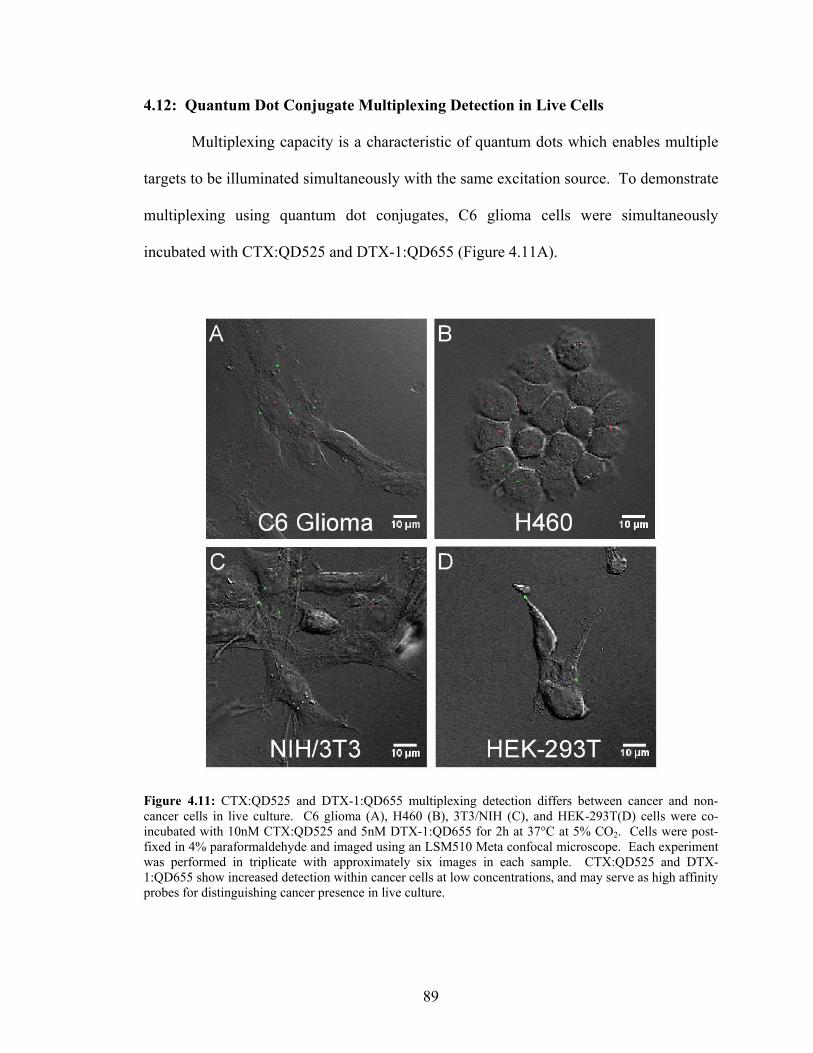
4.12: Quantum Dot Conjugate Multiplexing Detection in Live Cells
Multiplexing capacity is a characteristic of quantum dots which enables multiple
targets to be illuminated simultaneously with the same excitation source. To demonstrate
multiplexing using quantum dot conjugates, C6 glioma cells were simultaneously
incubated with CTX:QD525 and DTX-1:QD655 (Figure 4.11A).
Figure 4.11: CTX:QD525 and DTX-1:QD655 multiplexing detection differs between cancer and non-cancer cells in live culture. C6 glioma (A), H460 (B), 3T3/NIH (C), and HEK-293T(D) cells were co-incubated with 10nM CTX:QD525 and 5nM DTX-1:QD655 for 2h at 37°C at 5% CO2. Cells were post-fixed in 4% paraformaldehyde and imaged using an LSM510 Meta confocal microscope. Each experiment was performed in triplicate with approximately six images in each sample. CTX:QD525 and DTX-1:QD655 show increased detection within cancer cells at low concentrations, and may serve as high affinity probes for distinguishing cancer presence in live culture.
89

The cells were exposed to the conjugates for 120 minutes at 37°C and 5% CO2, and fixed
and mounted for imaging. Source excitation was a 488nM Argon laser in conjunction
with an inverted confocal microscope, LSM510 Meta, for image collection. Figure 4.11
reveals the multiplexing images resulting from co-incubation of CTX:QD525 and DTX-
1:QD655 in C6 glioma cells. Both CTX:QD525 and DTX-1:QD655 detection is
observed, and indicates that the toxin nanoconjugates are suitable not only for target
detection in live cells, but also are amenable to multiplexing experimentation. This trait
provides the potential to monitor multiple targets simultaneously within living systems
for in depth analyses concerning an array of cellular functions.
Chlorotoxin is reported to preferentially bind to cancer cells over non-cancer cells.
To test this, comparative multiplexing experiments were performed to ascertain the
proclivity other cell types have for both toxin:quantum dot conjugates. Collectively, two
rodent cell types, C6 glioma (Figure 4.11A) and 3t3/NIH (Figure 4.11C), and two human
cell types, H460 (Figure 4.11B) and HEK-293T (Figure 4.11D), were chosen to be
examined for endogenous expression of matrix metalloproteinase-2 and potassium
channel, Kv1.1. Each cell type couple consisted of a cancer cell line and a non-cancer
cell line for direct comparison. The cells were treated with the toxins as previously
described for the multiplexing experimentation, and imaged using the same conditions.
Figure 4.11 illustrates the results of the comparison. Quantitation reveals that the
differences between endogenous matrix metalloproteinase-2 detection are greater in C6
glioma cells and H460 cells, than in 3t3/NIH cells and HEK-293T cells (Figure 4.12).
This indicates that these cells likely express higher levels of matrix metalloproteinase-2
on their cell membranes, which is detected and visualized by CTX:QD525 fluorescence.
90
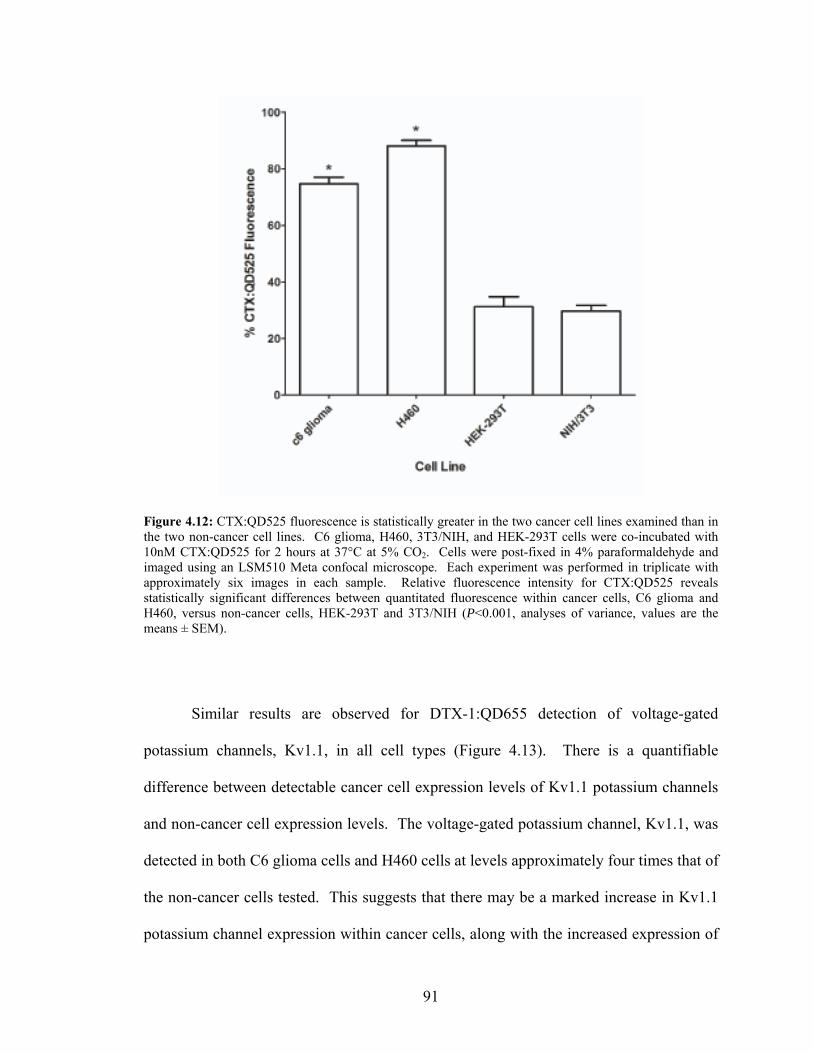
Figure 4.12: CTX:QD525 fluorescence is statistically greater in the two cancer cell lines examined than in the two non-cancer cell lines. C6 glioma, H460, 3T3/NIH, and HEK-293T cells were co-incubated with 10nM CTX:QD525 for 2 hours at 37°C at 5% CO2. Cells were post-fixed in 4% paraformaldehyde and imaged using an LSM510 Meta confocal microscope. Each experiment was performed in triplicate with approximately six images in each sample. Relative fluorescence intensity for CTX:QD525 reveals statistically significant differences between quantitated fluorescence within cancer cells, C6 glioma and H460, versus non-cancer cells, HEK-293T and 3T3/NIH (P<0.001, analyses of variance, values are the means ± SEM).
Similar results are observed for DTX-1:QD655 detection of voltage-gated
potassium channels, Kv1.1, in all cell types (Figure 4.13). There is a quantifiable
difference between detectable cancer cell expression levels of Kv1.1 potassium channels
and non-cancer cell expression levels. The voltage-gated potassium channel, Kv1.1, was
detected in both C6 glioma cells and H460 cells at levels approximately four times that of
the non-cancer cells tested. This suggests that there may be a marked increase in Kv1.1
potassium channel expression within cancer cells, along with the increased expression of
91

matrix metalloproteinase-2, that DTX-1:QD655 and CTX:QD525 detect, respectively,
within 120 minutes. These results support that CTX:QD525 and DTX-1:QD655
conjugates may serve as a highly sensitive visible spectrum labeling system capable of
distinguishing between diseased and healthy cells, and possibly tissue, for diagnostic
purposes.
Figure 4.13: DTX-1:QD655 fluorescence is statistically greater in the cancer cell lines examined than in the non-cancer cell lines. C6 glioma, H460, 3T3/NIH, and HEK-293T cells were co-incubated with 5nM DTX-1:QD525 for 2 hours at 37°C at 5% CO2. Cells were post-fixed in 4% paraformaldehyde and imaged using an LSM510 Meta confocal microscope. Each experiment was performed in triplicate with approximately six images in each sample. Relative fluorescence intensity for DTX-1:QD655 reveals statistically significant differences between quantitated fluorescence within cancer cells, C6 glioma and H460, versus non-cancer cells, HEK-293T and 3T3/NIH (P<0.001, analyses of variance, values are the means ± SEM).
92
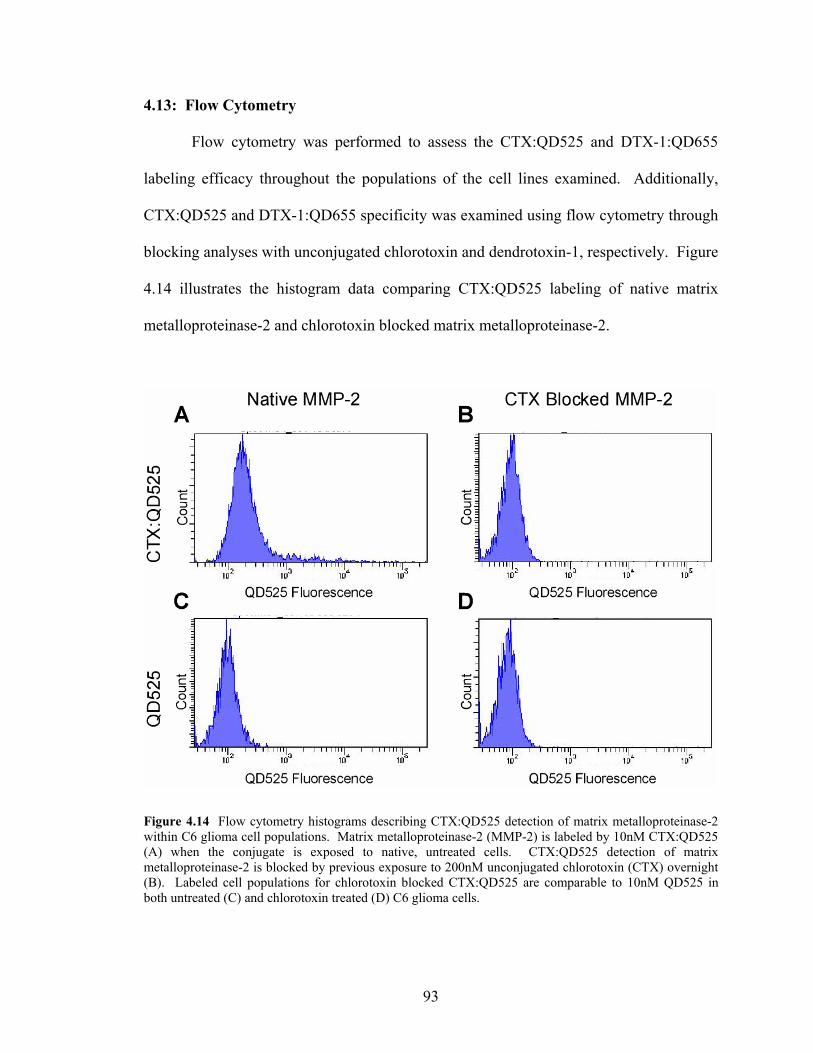
4.13: Flow Cytometry Flow cytometry was performed to assess the CTX:QD525 and DTX-1:QD655
labeling efficacy throughout the populations of the cell lines examined. Additionally,
CTX:QD525 and DTX-1:QD655 specificity was examined using flow cytometry through
blocking analyses with unconjugated chlorotoxin and dendrotoxin-1, respectively. Figure
4.14 illustrates the histogram data comparing CTX:QD525 labeling of native matrix
metalloproteinase-2 and chlorotoxin blocked matrix metalloproteinase-2.
Figure 4.14 Flow cytometry histograms describing CTX:QD525 detection of matrix metalloproteinase-2 within C6 glioma cell populations. Matrix metalloproteinase-2 (MMP-2) is labeled by 10nM CTX:QD525 (A) when the conjugate is exposed to native, untreated cells. CTX:QD525 detection of matrix metalloproteinase-2 is blocked by previous exposure to 200nM unconjugated chlorotoxin (CTX) overnight (B). Labeled cell populations for chlorotoxin blocked CTX:QD525 are comparable to 10nM QD525 in both untreated (C) and chlorotoxin treated (D) C6 glioma cells.
93
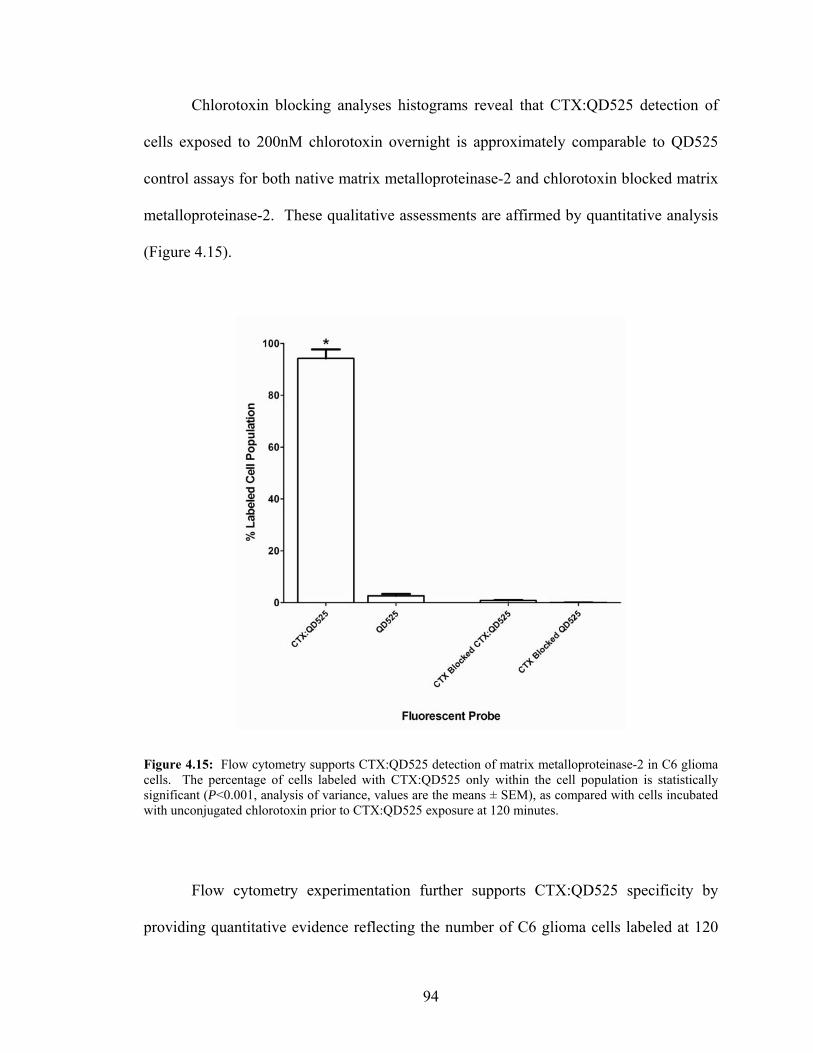
Chlorotoxin blocking analyses histograms reveal that CTX:QD525 detection of
cells exposed to 200nM chlorotoxin overnight is approximately comparable to QD525
control assays for both native matrix metalloproteinase-2 and chlorotoxin blocked matrix
metalloproteinase-2. These qualitative assessments are affirmed by quantitative analysis
(Figure 4.15).
Figure 4.15: Flow cytometry supports CTX:QD525 detection of matrix metalloproteinase-2 in C6 glioma cells. The percentage of cells labeled with CTX:QD525 only within the cell population is statistically significant (P<0.001, analysis of variance, values are the means ± SEM), as compared with cells incubated with unconjugated chlorotoxin prior to CTX:QD525 exposure at 120 minutes.
Flow cytometry experimentation further supports CTX:QD525 specificity by
providing quantitative evidence reflecting the number of C6 glioma cells labeled at 120
94

minutes, relative to cells exposed to unconjugated chlorotoxin prior to CTX:QD525
incubation. The CTX:QD525 labeled cells were present in approximately 80% of the
culture; whereas, unconjugated chlorotoxin incubation resulted in cell labeling levels
similar to the cells exposed only to QD525 (P<0.001, analysis of variance, values are the
means ± SEM).
As with CTX:QD525, DTX-1:QD655 detection was examined using flow
cytometry analyses. Figure 4.16 illustrates the histogram data highlighting DTX-
1:QD655 detection of native Kv1.1 and dendrotoxin-1 blocked Kv1.1.
Figure 4.16: Flow cytometry histograms describing DTX-1:QD655 detection of Kv1.1 within C6 glioma cell populations. Kv1.1 is labeled by 5nM DTX-1:QD655 (A) when the conjugate is exposed to native, untreated cells. DTX-1:QD655 detection of Kv1.1 is blocked by previous exposure to 100nM unconjugated DTX-1 overnight (B). Labeled cell populations for DTX-1 blocked DTX-1:QD655 are comparable to 5nM QD655 in both untreated (C) and DTX-1 treated (D) C6 glioma cells.
95
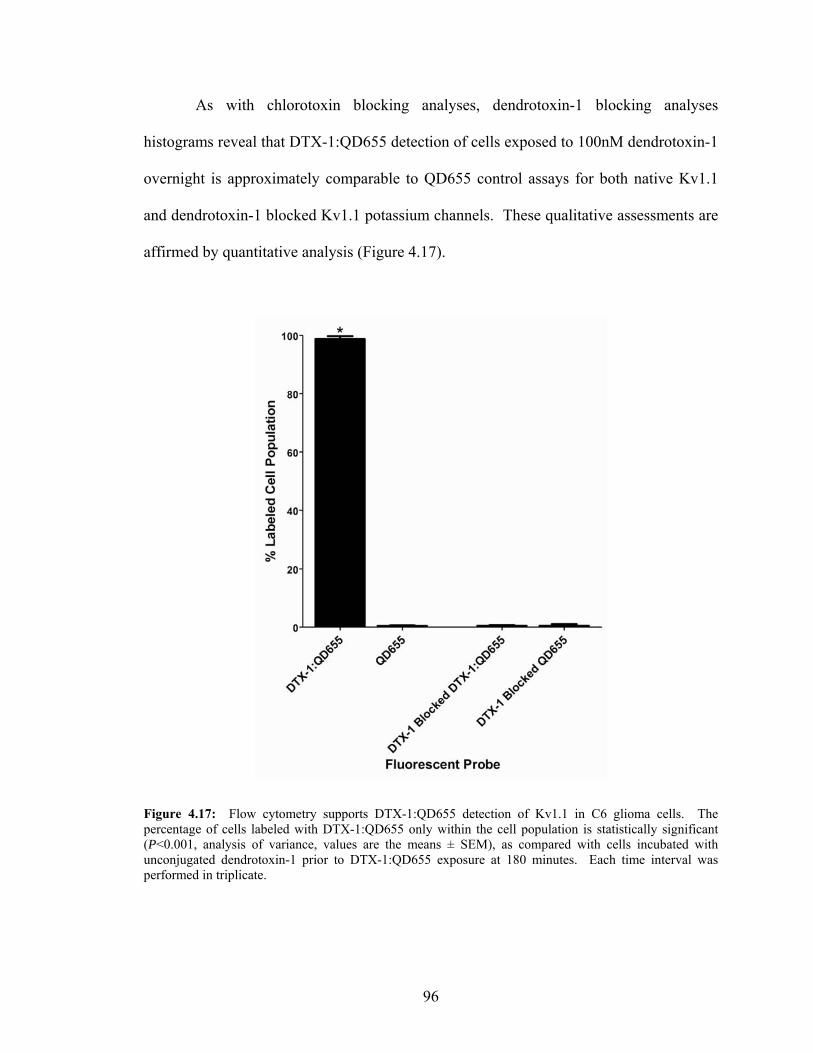
As with chlorotoxin blocking analyses, dendrotoxin-1 blocking analyses
histograms reveal that DTX-1:QD655 detection of cells exposed to 100nM dendrotoxin-1
overnight is approximately comparable to QD655 control assays for both native Kv1.1
and dendrotoxin-1 blocked Kv1.1 potassium channels. These qualitative assessments are
affirmed by quantitative analysis (Figure 4.17).
Figure 4.17: Flow cytometry supports DTX-1:QD655 detection of Kv1.1 in C6 glioma cells. The percentage of cells labeled with DTX-1:QD655 only within the cell population is statistically significant (P<0.001, analysis of variance, values are the means ± SEM), as compared with cells incubated with unconjugated dendrotoxin-1 prior to DTX-1:QD655 exposure at 180 minutes. Each time interval was performed in triplicate.
96

DTX-1:QD655 detection of Kv1.1 potassium channels is also supported by flow
cytometry experimentation. As with CTX:QD525, DTX-1:QD655 labeled cells were
present at statistically significant numbers within culture (P<0.001, analysis of variance,
values are the means ± SEM) versus the number of labeled cells previously exposed to
unconjugated dendrotoxin-1. At 180 minutes, the number of DTX-1:QD655 labeled cells
in culture was approximately <90% of the population.
To complement the multiplexing microscopy analyses, flow cytometry was
utilized to examine the cell populations labeled with CTX:QD525 and DTX-1:QD655
(Figure 4.18). C6 glioma, H460, NIH/3T3, and HEK-293T cells were incubated with
10nM CTX:QD525 and 5nM DTX-1:QD655 for 120 min. The cells were suspended in
1x DPBS without Mg2+ and Ca2+ and examined using BD 5-laser LDRII flow cytometer.
Flow cytometry quantitation of the dual labeling experimentation is illustrated in
Figure 4.19. These analyses revealed that statistically significant cell populations
(P<0.001, analysis of variance, values are the means ± SEM) of both C6 glioma cells and
H460 cells were labeled with both CTX:QD525 and DTX-1:QD655 together and
independently.
Flow cytometry analyses supports microscopy qualitative and quantitative data
for the blocking assays and the multiplexing experimentation examined. Both
chlorotoxin and dendrotoxin-1 were able to effectively block CTX:QD525 and DTX-
1:QD655, respectively, from labeling their cellular targets in C6 glioma cells.
97

Figure 4.18: Flow cytometry histograms describing CTX:QD525 and DTX-1:QD655 detection of matrix metalloproteinase-2 and Kv1.1 potassium channels, respectively, within C6 glioma (A), H640 (B), NIH/3T3 (C), and HEK-293T (D) cell populations. Both C6 glioma (A) and H460 (B) reveal labeling of matrix metalloproteinase-2 by CTX:QD525 and Kv1.1 potassium channels by DTX-1:QD655 conjugates in their cell populations. CTX:QD525 and DTX-1:QD655 detection of matrix metalloproteinase-2 and Kv1.1 potassium channels, respectively, is less in NIH/3T3 (C) and HEK-293T (D) cells. Labeling levels in NIH/3T3 (C) and HEK-293T (D) cell lines were similar to 10nM QD525 and 5nM QD655 levels in all cell lines examined. The cells were exposed to 10nM CTX:QD525 and 5nM DTX-1:QD655 for 120 min. at 37°C and 5% CO2.
Low percentages of labeled cells within the populations evince the efficacy of the
fluorescent nanocrystal probes to detect their endogenous targets in live culture.
Comparative analyses between cell lines revealed that CTX:QD525, detecting matrix
metalloproteinase-2, and DTX-1:QD655, detecting Kv1.1 potassium channels, are
present in higher percentages of the C6 glioma and H460 populations than in the
NIH/3T3 and HEK-293T populations. This may further support the utility of these
98

cellular targets, when detected by quantum dot conjugates, to be indicative of altered cell
states.
Figure 4.19: Flow cytometry analyses reveal the percentage of the cell populations labeled with both CTX:QD525 and DTX-1:QD655 together, and separately, in each cell line examined. CTX:QD525 detection of matrix metalloproteinase-2 and DTX-1:QD655 detection of Kv1.1 potassium channels in C6 glioma cells and H460 cells is statistically significant, relative to respective detection in NIH/3T3 cells and HEK-293T cells (P<0.001, analysis of variance, values are the means ± SEM), at 120 minutes. Each assay was run in triplicate.
99
4.14: Summary
Utilization of high affinity peptide neurotoxins as ligands for labeling tissue and
cellular targets for quantum dot detection has been shown to be an effective means of
visualizing proteins for qualitative and quantitative analyses. Quantum dots exhibit
unique photophysical properties, capable of near 100% quantum yield,7 and are resistant
to photobleaching typically seen by fluorophore complements. Recently, ex vivo mouse
diaphragm was successfully labeled using streptavidin quantum dot conjugates to detect
native nicotinic acetylcholine receptors with biotinylated α-bungarotoxin.57 The study
demonstrated that the nanocrystals are not only able to detect biotinylated α-bungarotoxin
on a post-synaptic membrane receptor ex vivo, but also capable of being highly sensitive
probes in conjunction with a suitable ligand. High affinity peptide toxins provide ample
means to integrate quantum dots with biological protocols to study dynamic processes in
living systems.
Direct conjugation of isolated high affinity peptide toxins to quantum dots
facilitates quantum dot detection of disease states in cells. Qualitative and quantitative
analyses revealed that CTX:QD525 and DTX-1:QD655 labeled endogenous matrix
metalloproteinase-2 and Kv1.1 potassium channels in living cells at rates of three and
four times greater, respectively, in cancer versus non-cancer cells. Dynamic detection of
disease state markers by high affinity peptide toxin conjugated quantum dots enables
increased sensitivity, and introduces the capacity for long-term tracking in live cell
culture due to quantum dot photostability. This allows for diagnostic and therapeutic
development to occur utilizing real-time cell tracking, thus providing the potential for
100
functionality evidence within a living system not observed through static, fixed
conditions.
Introduction of technological advances into biological studies enables sample
archiving, live-cell tracking techniques, and multiplexing experimentation to be more
productive. Quantum dot technology grants significant advantages over existing
fluorescent probes in that the nanocrystals are much brighter, even in whole-mount ex
vivo tissue, and are capable of detecting biologically interesting targets within living cells
and at the synapse with high specificity. Continued development of endogenous cellular
targeting utilizing neurotoxin quantum dot conjugates to detect disease state markers
expands current quantum dot applications. Furthermore, neurotoxin nanoconjugate
studies demonstrate the suitability of high affinity peptide toxins to serve as adequate
ligands for targeting a broad array of cellular proteins gauged at broadening the
understanding of the interplay between healthy and diseased cells with their
endogenously expressed proteins.
101

CHAPTER V
CONCLUSIONS
It is of technological and pharmacological interest to develop methodologies that
engage nanotechnology with the pursuit of biologically interesting objectives. Induction
of nanotechnology toward biological applications has required the development of
chemical modifications which meet the needs of the system being studied. These
modifications are necessary to enable adequate binding and system compatibility.
Importance, for biological labeling with nanomaterials, has been placed upon
determination and classification of suitable ligands for inclusion with nanotechnology
initiatives. Ligands must be of the characteristics of high target affinity, and low cross-
reactivity with other biological targets present within the system of interest. Additionally,
ligands must be amenable to chemical modifications that serve to promote probe
detection without eliciting unwanted responses from the biology. The central focus of this
research was upon the development and execution of endogenous biological target
detection using fluorescent nanocrystals, commonly known as quantum dots. To detect
endogenous targets in both ex vivo tissue and living cells, quantum dots were paired with
high affinity peptide neurotoxins. The overall advantages to developing strategies
combining the use of high affinity peptide neurotoxins with highly fluorescent
nanocrystals are numerous. Some of the advantages associated with the use of peptide
neurotoxins, isolated from the venom of various animal sources, for quantum dot ligands
include the low propensity for cross-talk between targets and high affinity for their
respective targets. These advantages were demonstrated through the research presented,
102
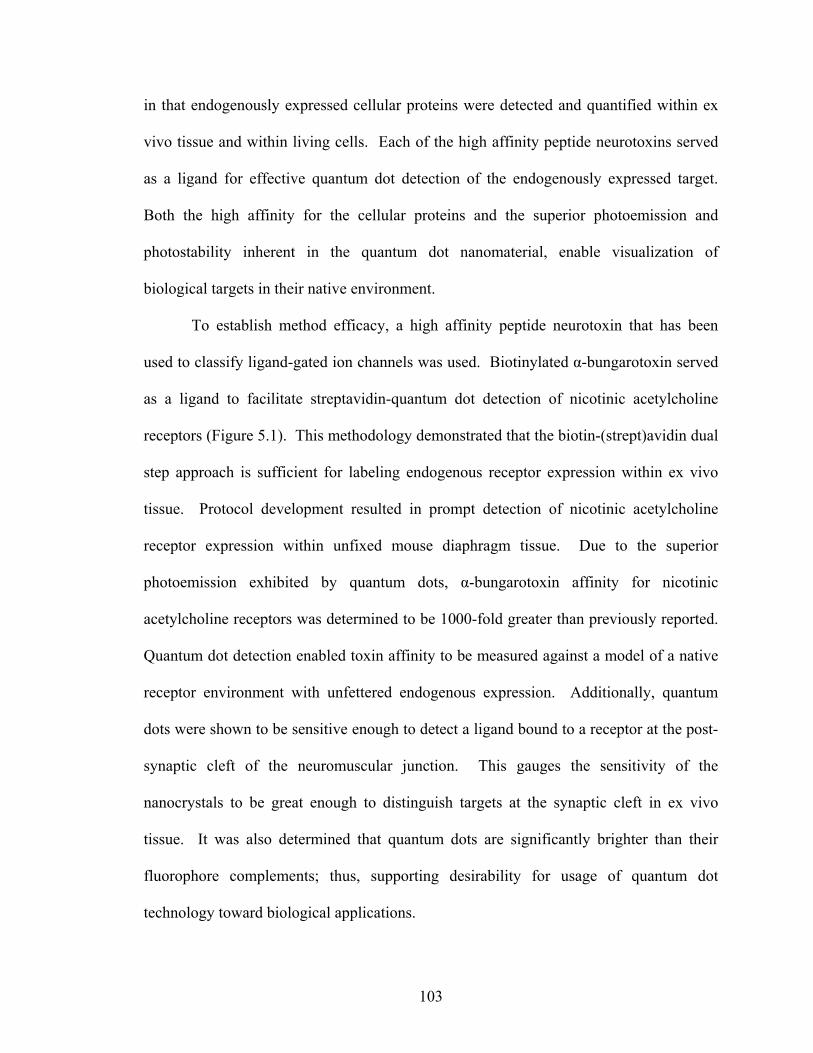
in that endogenously expressed cellular proteins were detected and quantified within ex
vivo tissue and within living cells. Each of the high affinity peptide neurotoxins served
as a ligand for effective quantum dot detection of the endogenously expressed target.
Both the high affinity for the cellular proteins and the superior photoemission and
photostability inherent in the quantum dot nanomaterial, enable visualization of
biological targets in their native environment.
To establish method efficacy, a high affinity peptide neurotoxin that has been
used to classify ligand-gated ion channels was used. Biotinylated α-bungarotoxin served
as a ligand to facilitate streptavidin-quantum dot detection of nicotinic acetylcholine
receptors (Figure 5.1). This methodology demonstrated that the biotin-(strept)avidin dual
step approach is sufficient for labeling endogenous receptor expression within ex vivo
tissue. Protocol development resulted in prompt detection of nicotinic acetylcholine
receptor expression within unfixed mouse diaphragm tissue. Due to the superior
photoemission exhibited by quantum dots, α-bungarotoxin affinity for nicotinic
acetylcholine receptors was determined to be 1000-fold greater than previously reported.
Quantum dot detection enabled toxin affinity to be measured against a model of a native
receptor environment with unfettered endogenous expression. Additionally, quantum
dots were shown to be sensitive enough to detect a ligand bound to a receptor at the post-
synaptic cleft of the neuromuscular junction. This gauges the sensitivity of the
nanocrystals to be great enough to distinguish targets at the synaptic cleft in ex vivo
tissue. It was also determined that quantum dots are significantly brighter than their
fluorophore complements; thus, supporting desirability for usage of quantum dot
technology toward biological applications.
103
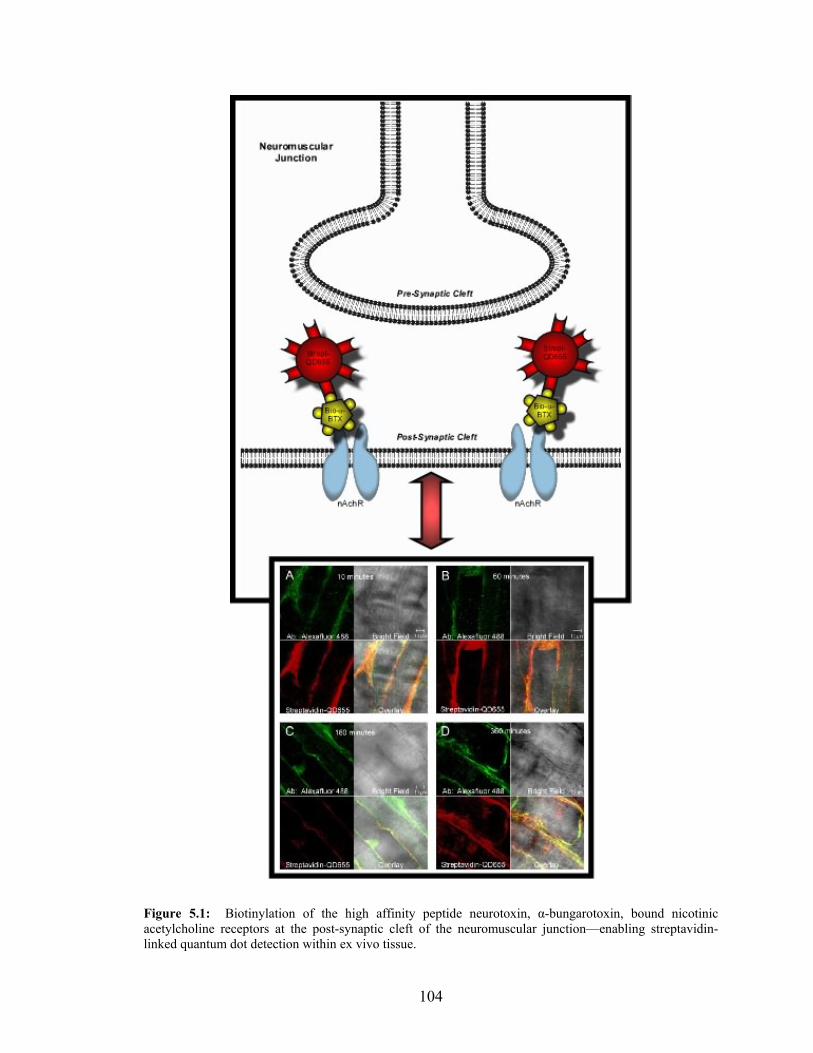
Figure 5.1: Biotinylation of the high affinity peptide neurotoxin, α-bungarotoxin, bound nicotinic acetylcholine receptors at the post-synaptic cleft of the neuromuscular junction—enabling streptavidin-linked quantum dot detection within ex vivo tissue.
104

Through binding analyses, native nicotinic acetylcholine receptors were shown to
be capable of being blocked by biotin-free α-bungarotoxin, which prevented biotinylated
α-bungarotoxin from serving as a means for streptavidin quantum dot detection.
Confocal microscopy revealed that streptavidin quantum dot fluorescence was only
present when diaphragm tissue was exposed to biotinylated α-bungarotoxin (Figure 5.2).
Quantum dot detection was determined to be specific to native nicotinic acetylcholine
receptors by analysis utilizing Alexafluor conjugated anti-β nicotinic acetylcholine
receptor subunit antibody colocalization. Saturation binding analysis served as a further
demonstration of quantum dot sensitivity by providing support toward α-bungarotoxin
being a ligand with much greater affinity for nicotinic acetylcholine receptors than
previously realized. Quantum dots were also shown to be capable of detecting
biotinylated α-bungarotoxin at a series of time points, and within both fresh and seven
day ex vivo tissue. Biotinylated α-bungarotoxin was able to label nicotinic acetylcholine
receptors for subsequent streptavidin quantum dot detection when the ex vivo tissue was
treated with blocking solution for seven days. This indicates that the protocol for usage
of high affinity peptide neurotoxins with quantum dots to detect endogenous targets
within ex vivo tissue is suitable for preserving the native expression of nicotinic
acetylcholine receptors. Potential utilization of this methodology lends itself toward the
possible incorporation of quantum dots for sample archiving. Sample archiving provides
a means of tracking a disease state, as well as documenting and monitoring arrays of
native protein interactions effected by various stimuli. These studies demonstrated that
quantum dots are potentially well suited for such applications.
105

Figure 5.2: Streptavidin quantum dot detection is blocked within ex vivo diaphragm tissue due to previous exposure to α-bungarotoxin. The unconjugated α-bungarotoxin prevents biotinylated peptide from labeling nicotinic acetylcholine receptors expressed within the tissue. Because binding capacity for biotinylated α-bungarotoxin is lost, streptavidin quantum dot fluorescence is absent. The presence of the green fluorescence indicates that nicotinic acetylcholine receptors are expressed due to anti-β-subunit antibody detection.
106
Peptide neurotoxins were coupled with quantum dots again to demonstrate
endogenous detection of multiple targets within live cells. Criteria for the neurotoxins
consisted of the peptides being chosen based upon size and cellular target. The purpose
of these studies was to demonstrate specificity in targeting cellular proteins within living
cells using multiple quantum dot probes simultaneously. Multiplexing is a characteristic
inherent in quantum dots that makes them desirable for use as biological probes. Use of
multiple high affinity neurotoxin conjugated quantum dots in live cells proved to be a
successful demonstration of this unique characteristic. It was not only able to be shown
that endogenous cellular targets could be detected simultaneously and illuminated with a
single excitation source, but also that the fluorescence could be quantified. The relative
quantified fluorescence was determined to be indicative of potential markers for the
presence of cancerous cells.
Initial studies using chlorotoxin followed the biotin-(strept)avidin dual step
labeling methodology. Chlorotoxin was biotinylated, exposed to C6 glioma cells, and
labeled with streptavidin quantum dots. Although evidence supported that this is a viable
strategy for detecting chlorotoxin’s cellular target, matrix metalloproteinase-2, it was
deduced that dual labeling approaches were not well suited for use with multiple probes.
It was determined that production of novel toxin:quantum dot conjugates was likely to be
the best strategy for achieving dual detection of two independent endogenous cellular
targets and visualization using quantum dot multiplexing properties. To achieve this,
both chlorotoxin (Figure 5.3) and dendrotoxin-1 (Figure 5.4) were coupled to quantum
dots of different emission spectra. High affinity peptide neurotoxin conjugation was
achieved using 2-iminothiolane (Traut’s reagent) and N-succinimidyl iodoacetate (SIA)
107
as cross-linking reagents with polyethylene amino terminated quantum dots. Each
neurotoxin was conjugated to a specific size dot, and thus correlated to a specific
emission color when visualized.
Figure 5.3: Chlorotoxin conjugated quantum dots (525s) bind to matrix metalloproteinase-2 (MMP-2) within live C6 glioma cells.
Both conjugates were tested, independently, within C6 glioma cells for specificity using
Alexafluor conjugated target antibodies. Each toxin:quantum dot conjugate target
detection was also shown to capable of being blocked within living cells for a period of
108
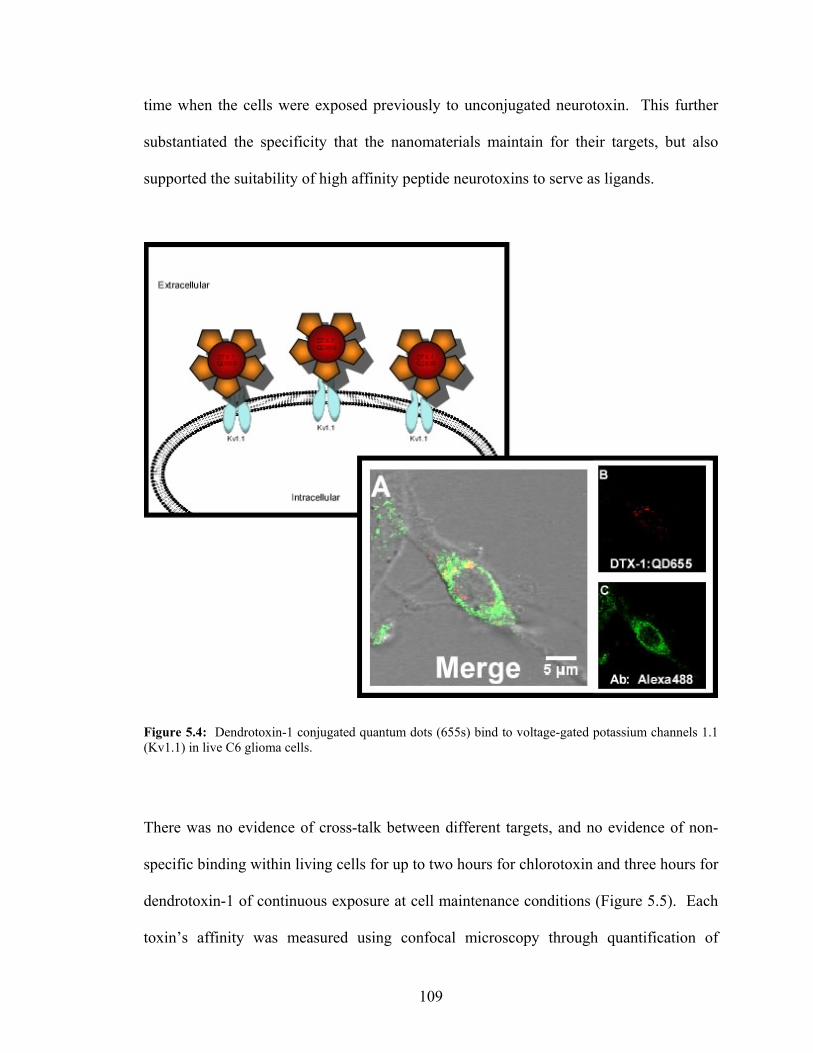
time when the cells were exposed previously to unconjugated neurotoxin. This further
substantiated the specificity that the nanomaterials maintain for their targets, but also
supported the suitability of high affinity peptide neurotoxins to serve as ligands.
Figure 5.4: Dendrotoxin-1 conjugated quantum dots (655s) bind to voltage-gated potassium channels 1.1 (Kv1.1) in live C6 glioma cells.
There was no evidence of cross-talk between different targets, and no evidence of non-
specific binding within living cells for up to two hours for chlorotoxin and three hours for
dendrotoxin-1 of continuous exposure at cell maintenance conditions (Figure 5.5). Each
toxin’s affinity was measured using confocal microscopy through quantification of
109
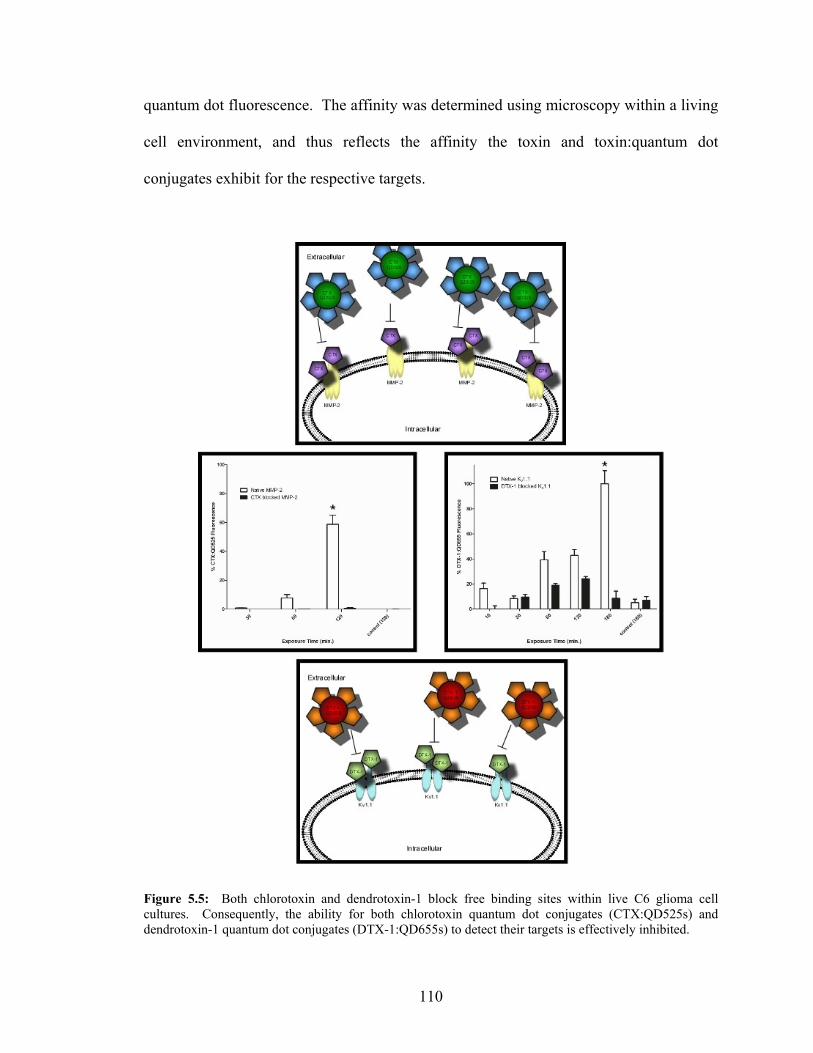
quantum dot fluorescence. The affinity was determined using microscopy within a living
cell environment, and thus reflects the affinity the toxin and toxin:quantum dot
conjugates exhibit for the respective targets.
Figure 5.5: Both chlorotoxin and dendrotoxin-1 block free binding sites within live C6 glioma cell cultures. Consequently, the ability for both chlorotoxin quantum dot conjugates (CTX:QD525s) and dendrotoxin-1 quantum dot conjugates (DTX-1:QD655s) to detect their targets is effectively inhibited.
110

To demonstrate quantum dot multiplexing, C6 glioma cells were incubated with
both chlorotoxin:quantum dot conjugates and dendrotoxin-1:quantum dot conjugates
simultaneously (Figure 5.6).
Figure 5.6: Multiplexing experimentation visually reveals that matrix metalloproteinase-2 (MMP-2) and voltage-gated potassium channels 1.1 (Kv1.1) appear to be expressed in higher concentrations within cancer cells (rat C6 glioma and human Lewis lung carcinoma, H460) than in non-cancer cells (mouse 3T3/NIH and human embryonic kidney, HEK-293T).
111
These studies revealed punctuate labeling from each toxin:quantum dot conjugate
emanating from a single excitation source. Because chlorotoxin is reported to have
increased activity associated with glioma cells, additional cell types were examined to
compare endogenous expression levels of matrix metalloproteinase-2 and Kv1.1 within
each representative cell line. The cells chosen were human and rodent cell lines. The
human lines were H460, a Lewis lung carcinoma; and, HEK-293T, human embryonic
kidney cells. The additional rodent line was a normal cell line, 3T3/NIH, which is a
mouse embryonic kidney cell line. The results indicate that both toxin:quantum dot
conjugates are sensitive enough to detect endogenous expression within cell lines other
than C6 rat glioma cells. They also indicate that endogenous expression varies between
cancerous and normal cells. Both expressions, matrix metalloproteinase-2 and Kv1.1, are
detected in statistically significant higher percentages in cancer cells than in normal cells.
This may indicate that matrix metalloproteinase-2 and Kv1.1 are potential markers that
may be detected rapidly for identification of cancer cells within culture. Further
development and analyses utilizing these toxin:quantum dot probes may serve to aid in
future methodologies to understand cancer or abnormal cell behaviors.
Advantages to incorporating high affinity peptide neurotoxins with
nanotechnology initiatives include real-time monitoring of biological targets (Figure 5.7).
Huganir and coworkers demonstrated the use of the α-bungarotoxin binding site as a
means of tagging cellular proteins that lack adequate ligands for analysis. The idea that
high affinity peptide neurotoxin binding domains may serve as ubiquitous tags for poorly
understood proteins lends itself to nanotechnology incorporation. Not only does α-
bungarotoxin serve as an adequate ligand for quantum dot detection, but also chlorotoxin
112

and dendrotoxin-1 are revealed to be suitable for quantum dot detection of endogenous
cellular proteins.
Figure 5.7: Two methodologies for quantum dot detection of endogenous biological targets. Each method has the potential to further biological understanding through high affinity detection leading to trafficking studies.
113

Quantum dot detection was achieved in live cells using three separate peptide neurotoxins,
isolated from different venom sources, conjugated to nanocrystals. Two probe
methodologies were employed that enabled quantum dot detection: (1) direct peptide
conjugation to quantum dots, and (2) streptavidin-quantum dot labeling of biotinylated
ligand. Both methodologies were amenable to quantitation in addition to qualitative
analyses. These studies provide evidence to support the universality of high affinity
peptide neurotoxins to serve as viable ligands for utilization as components of
nanomaterials.
The applications for such nanomaterials are numerous. There is significant
emphasis that has been placed upon the use natural products for research and therapeutic
purposes. Both organic products and isolated peptides possess the potential to be used to
treat a variety of conditions. When coupled with nanotechnology, they may also be used
to study biological targets in real-time. Such information provides a better understanding
of the environment that influences the protein under examination. A better understanding
affords the capacity to possibly design more efficient therapies for a multitude of
conditions. Future studies using these peptides may include in vivo monitoring and
tracking of multiple isolated peptide neurotoxins coupled to quantum dots. These data
will provide information relating the nature of the biological response to the presence of
each peptide. Disruption of cellular processes due to bound neurotoxin quantum dot
conjugates enables monitoring of both the neurotoxin blocked target and additional
targets present in the biological system being investigated. General disruption to a
biological system bestows a plethora of information regarding the balance each
component has in maintaining the functionality of the system. The photostability
114
characteristic of quantum dots enables these induced imbalances to be monitored for
extended periods of time, thus affording knowledge of the system previously unseen.
Quantum dots may also serve as a means of monitoring delivery of a therapeutic
molecule. During initial phases of development, therapeutic molecules may be attached
to quantum dots to assess delivery efficacy through fluorescence monitoring. This
methodology provides the advantage of visualizing the presence of molecules targeting
specific cell types within an array of differentiated cells in vivo. Additional studies using
quantum dots as both detection probes, as well as delivery vehicles, will further
nanotechnology toward biological purposes.
Future studies using high affinity peptide neurotoxins as ligands for nanocrystal
visualization have the potential to span a variety of disciplines. Quantum dots have been
shown to be versatile for biological labeling. Expansion of nanocrystal technology into
biological research will include monitoring in vivo. In vivo monitoring will allow
tracking of responses to stimuli in real-time, making nanotechnology a critical tool for
endeavors examining the basic principles governing a biological system. Because many
cellular proteins are without ligands, either endogenous or exogenous, that are capable of
being used for fluorescence assessment, the binding domain for peptide neurotoxins may
be genetically incorporated into the protein being studied. By creating a fusion of the
binding site of a high affinity peptide neurotoxin with a protein of interest, the cellular
target may potentially being examined using fluorescence microscopy. This was
demonstrated previously by Huganir and colleagues who fused the α-bungarotoxin
binding site to the N-terminus of glutamate receptor-2 neural protein. Their work
demonstrated the potential for using peptide binding sequences as ubiquitous regions for
115
fluorescence tagging and visualization. These studies, demonstrating the multiplicity of
quantum dots for these purposes by detecting three different high affinity peptide
neurotoxins seeking endogenous targets, reveal the suitability of applying this technology
to sensitive biological targeting schemes. Quantum dots exhibit superior photostability to
common fluorophores, thereby permitting longer monitoring capacity than their
fluorescent counterparts. The nanocrystals may provide information regarding cellular
responses and native behaviors that previous technology has failed to currently provide.
Quantum dot detection within biological systems is effectively mediated by the
use of high affinity peptide neurotoxins. Peptide neurotoxins serve as suitable ligands to
facilitate the utilization and advancement of quantum dots as probes for various
biological studies. Advancement of quantum dot technology for biology incorporation
with nanotechnology mitigates the advancement of nanotechnology toward potential uses
as weapons against disease through rapid detection and therapy delivery. These studies
have demonstrated the versatility of fluorescent semiconductor nanocrystals as detection
probes through conjugation with multiple high affinity peptide neurotoxins. These
nanoconjugates were shown to be sensitive enough to detect endogenous receptors at the
post-synaptic cleft of the neuromuscular junction in ex vivo tissue, and proteins
expressed within living cells. Further development will yield an arsenal of probes that
represent a new class of tagging devices capable of examining living biology from a
renewed perspective.
116

APPENDIX
COMPUTATIONS FOR MASS SPECTROMETRY
A.1: Introduction
Computational support was performed to examine the correlation between bond
energies and MALDI-TOF/TOF CID fragmentation patterns of organic polymers. The
general methodology entailed determining a representative monomeric portion of the
polymer to represent the large molecule. The first polymeric system examined was
polystyrene. Following polystyrene, calculations on polystyrene derivatives, poly(α-
methylstyrene), poly(t-butylstyrene), and poly-(4-methyl)-styrene, were performed.
Some additional calculations were prepared, and some performed examining poly-aramid
structures. These included polymers labeled: PBO, PBO-amide, PPD-T, and MP-amide.
The calculations followed the general methodology outlined in Figure A.1.
Figure A.1: Calculation diagram representing general methodology utilized for organic polymer bond energy calculations. All computations were performed using the Gaussian3.0 computation suite, and GaussView3.09 and GaussView4.0 for model building.
117

A.2: Computation Methods
Polystyrene models were built using GaussView3.09. Fragmentation was
simulated by homolytic bond cleavage of the parent structure. The fragments were
moved approximately 15Å apart in space. Optimization was performed using the
ONIOM feature of Gaussian03 program package.118 Optimization about the carbon
radical was performed using DFT/B3LYP119, 120/6-31G* level of theory. The remaining
portions of the fragments were optimized using DFT/B3LYP/STO-3G* level of theory.
Overall multiplicity for systems calculated with both fragments present was determined
to be of triplet character. For systems independently calculated for each fragment,
multiplicity was determined to be of doublet character. Following optimization, single-
point energy calculations were performed, assuming a single layer for the system, using
DFT/B3LYP/6-31G* level of theory. Additional calculations were performed using
DFT/B3LYP/6-31G* theory for both the triplet and doublet systems without the layering.
All computations were performed in vacuo at the ground state.
A.3: Polystyrene Summary of Experimental Results
In support of experimental results, we performed calculations using Gaussian03,
following model building in GaussView3.09. The parent structure was optimized using
DFT/B3LYP/6-31G* level of theory (Figure A.2). To simulate fragmentation, the bond
of interest was broken. We performed a series of calculation types to mimic homolytic
cleavage. The first series of calculations involved bond cleavage followed by movement
of the fragments to approximately 15Å apart, designated as Triplet (Table A.1). Each
new system was determined to have triplet multiplicity. Additionally, each fragment was
118
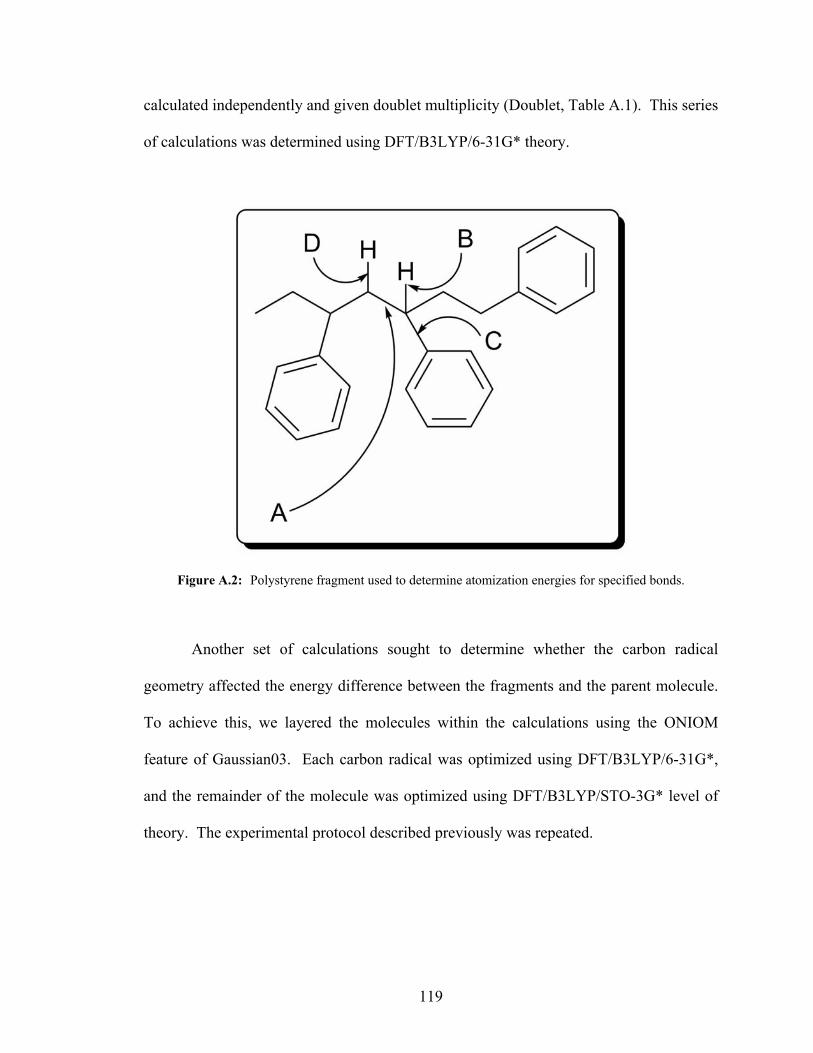
calculated independently and given doublet multiplicity (Doublet, Table A.1). This series
of calculations was determined using DFT/B3LYP/6-31G* theory.
Figure A.2: Polystyrene fragment used to determine atomization energies for specified bonds.
Another set of calculations sought to determine whether the carbon radical
geometry affected the energy difference between the fragments and the parent molecule.
To achieve this, we layered the molecules within the calculations using the ONIOM
feature of Gaussian03. Each carbon radical was optimized using DFT/B3LYP/6-31G*,
and the remainder of the molecule was optimized using DFT/B3LYP/STO-3G* level of
theory. The experimental protocol described previously was repeated.
119

Table A.1: Calculated atomization values using DFT/B3LYP/6-31G* level of theory in Gaussian03 for polystyrene. All triplet calculations were performed with the fragments approximately 15Å apart. Values are in kcal/mol.121
Calculation A B C D Doublet 71.87 91.66 96.21 103.69
ONIOM Layered Doublet 77.22 106.53 96.21 103.76 Triplet 98.97 108.30 109.55 110.46
ONIOM Layered Triplet 77.55 107.90 100.65 108.31
Overall, the values obtained from the layered experimental method were higher
than expected (Table A.1). It is possible that this is in part due to the global minimum
failing to be found on account of differences in the level of theory between the layers
used in the calculation. It is also noted that the calculations inclusive of both fragments,
and designated as triplet systems, yielded atomization values much higher than
anticipated from experimentation. This further supports the values obtained from the
doublet calculations. The doublets determined using DFT/B3LYP/6-31G* are
representative of the minimum of each fragment upon cleavage.
A.4: Results for Polystyrene Derivatives
The doublet calculation method was repeated for derivatives of polystyrene—
poly(α-methylstyrene),122 poly(t-butylstyrene) and poly(4-methylstyrene)123. The
calculations for poly(t-butylstyrene) and poly(4-methylstyrene) were performed based
upon the representative molecule in Figure A.3.
120

Figure A.3: Polystyrene derivative fragments used to calculate energies of the indicated bonds.
These calculations yielded values for the specified bonds reflected in Table A.2.
Fragmentation patterns were consistent with theoretical values, and indicated that
dominant fragmentation occurred at the carbon backbone bond (Figure A.3, bond A).
Table A.2: Polystyrene and polystyrene derivatives calculated values for specified bonds. Computations reflect density functional theory methods: B3LYP/6-31G* level of theory. All values are in kcal/mol.123
Calculation A B C D E Polystyrene 71.87 91.66 96.21 103.69 117.17 Poly(4-methylstyrene) 71.61 91.42 96.47 103.72 105.13 Poly(t-butylstyrene) 71.64 91.20 96.64 103.72 90.65
Additionally, calculated values were consistent between polystyrene derivatives. The
bond values were reflective of the fragmentation patterns observed through mass
spectrometry experimentation on the full length polymer. The largest variance between
values was observed at bond “E” where the bond reflected the loss of either H, -CH3, or t-
butyl functional groups, with the most favored loss being that of the t-butyl moiety.
121

Intuitive chemical analysis indicates that this is most likely the result of the t-butyl group,
as a tertiary carbon radical, having the capacity to stabilize the free radical to a greater
extent compared with the primary carbon and hydrogen groups. This indicates that the t-
butyl functional group is favored for fragmentation, relative to the methyl and hydrogen.
Another polystyrene derivative, poly(α-methylstyrene), was analyzed under the
similar conditions. The model molecule used for the calculations is illustrated in Figure
A.4. This model varies from the previous polymeric molecules by the presence of the
methyl group bound to the α-carbon, which additionally has a phenyl substituent.
Figure A.4: Poly(α-methylstyrene) representative molecule used for DFT calculations.
The electronic influence that the methyl group imposes upon the chain is reflected
in the values obtained from the density functional theory calculations (Table A.3). The
values indicate that the α-methyl contributes to the reduction in the bond energy. The
122

1,2-phenyl shift reaction was also examined using computational methods to predict the
relative bond stability and fragmentation probability (Figure A.5).
Figure A.5: Representation of the 1,2-phenyl shift reaction observed during poly(α-methylstyrene) fragmentation. The reaction results in the rearrangement of the phenyl substituent on the alkyl backbone, which results in the stabilization of the free radical.
The theoretical results predicted that the shift resulted in a tertiary free radical that was
more stable than the initial primary free radical. The monomer reversion reaction (Figure
A.6) was also analyzed to assess the likelihood that this reaction plays an important role
within these systems.
Figure A.6: Monomer reversion reaction for poly(α-methylstyrene). The reaction results in the formation of a tertiary free radical and an alkene species.
123
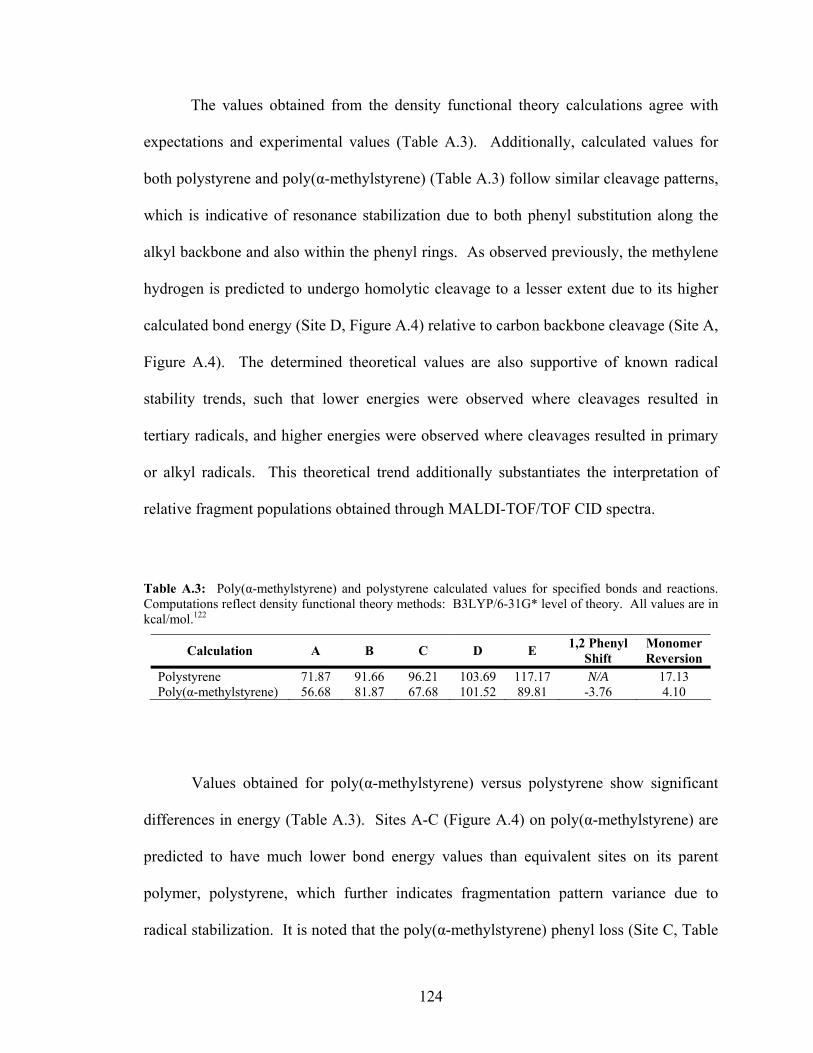
The values obtained from the density functional theory calculations agree with
expectations and experimental values (Table A.3). Additionally, calculated values for
both polystyrene and poly(α-methylstyrene) (Table A.3) follow similar cleavage patterns,
which is indicative of resonance stabilization due to both phenyl substitution along the
alkyl backbone and also within the phenyl rings. As observed previously, the methylene
hydrogen is predicted to undergo homolytic cleavage to a lesser extent due to its higher
calculated bond energy (Site D, Figure A.4) relative to carbon backbone cleavage (Site A,
Figure A.4). The determined theoretical values are also supportive of known radical
stability trends, such that lower energies were observed where cleavages resulted in
tertiary radicals, and higher energies were observed where cleavages resulted in primary
or alkyl radicals. This theoretical trend additionally substantiates the interpretation of
relative fragment populations obtained through MALDI-TOF/TOF CID spectra.
Table A.3: Poly(α-methylstyrene) and polystyrene calculated values for specified bonds and reactions. Computations reflect density functional theory methods: B3LYP/6-31G* level of theory. All values are in kcal/mol.122
Calculation A B C D E 1,2 Phenyl Shift
Monomer Reversion
Polystyrene 71.87 91.66 96.21 103.69 117.17 N/A 17.13 Poly(α-methylstyrene) 56.68 81.87 67.68 101.52 89.81 -3.76 4.10
Values obtained for poly(α-methylstyrene) versus polystyrene show significant
differences in energy (Table A.3). Sites A-C (Figure A.4) on poly(α-methylstyrene) are
predicted to have much lower bond energy values than equivalent sites on its parent
polymer, polystyrene, which further indicates fragmentation pattern variance due to
radical stabilization. It is noted that the poly(α-methylstyrene) phenyl loss (Site C, Table
124
A.3) is predicted to have a relative bond energy value approximately 29 kcal/mol less
than that bond cleavage site for polystyrene. This is attributed to the additional
stabilization for the formed radical along the alkyl backbone; the methyl substituent at
Site C aids in stabilizing the delocalized free radical formed in the fragmentation process.
Additionally, computations indicate the alkyl backbone (Site A, Table A.3) is
expected to present more fragmentation in poly(α-methylstyrene) than polystyrene.
Methyl substitutions contribute to this by allowing for tertiary radical formation either
directly through the bond cleavage process or resonance delocalization with the
neighboring phenyl ring. Based on theoretical predictions presented in Table A.3, the
methyl substitutions on poly(α-methylstyrene) add significant stability to radical
formation along sites on the polymer; thereby, allowing for site specific fragmentation
more readily than that seen with polystyrene.
A.5: PPD-T, MP-Amide, PBO, and PBO-Amide
Cation influence on fragmentation patterns was examined for various industrial
polymers. All models were built using GaussView4.0, and all computations were
executed using the Gaussian3.0 suite of programs. Calculations were performed using
density functional theory methods employing the B3LYP/6-31G* level of theory.
Because the B3LYP basis set includes only elements up to sodium, Na+ was substituted
for Ag+ within the calculations. This was agreed to be a reasonable substitution in order
to maintain consistency between molecules and previous calculations.
125

Initial calculations for PPD-T and MP-Amide did not include Na+ within the
model design. Figure A.7 provides the structures of both representative molecules for the
polymers.
Figure A.7: Model molecules for PPD-T and MP-Amide industrial polymers. Labeled arrows indicate sites examined for potential fragmentation points along the length of the molecule.
The computation results are outlined in Table A.4. The values indicate that Site B will be
the site of most frequent fragmentation because of its lower predicted atomization energy.
Table A.4: Initial calculated values of the bonds specified for representative PPD-T and MP-Amide structures. All values were obtained using DFT/B3LYP/6-31G* theory, and are in kcal/mol.
Calculation A B C D PPD-T 95.786 76.979 103.449 107.683 MP-Amide 95.275 63.143 102.420 110.204
126

Following initial calculations performed based upon these models, additional models
were built for computations focusing around the influence of Na+ on the fragmentation
potential of the chains. The models for PPD-T with Na+ are outlined in Figure A.8.
Figure A.8: PPD-T structures for calculations to determine the cationic influence on fragmentation.
These models differ through both the fragmentation sites examined, and also the
placement of Na+ associated with the amide and terminal carboxylic acid oxygen species.
These should yield results indicative of the preferred cleavage point within the polymer
backbone.
127

In relation to the MP-Amide species previously examined through computation,
models for a cation influenced homolytic cleavage were built. Figure A.9 reflects the
MP-Amide structures built for computational studies.
Figure A.9: MP-Amide structures for calculations to determine the cationic influence on fragmentation.
As with PPD-T, MP-Amide models also make use of a Na+ associating with both
hydroxyl oxygen species and amide species. The bonds examined differ from the non-
cation influenced calculations, in that only the terminal carboxylic acid group present on
the representative molecule is not under consideration for homolytic cleavage.
Further calculations relating to this class of industrial polymers were produced,
namely for the polymers coded as PBO (Figure A.10) and PBO-Amide (Figure A.11).
128
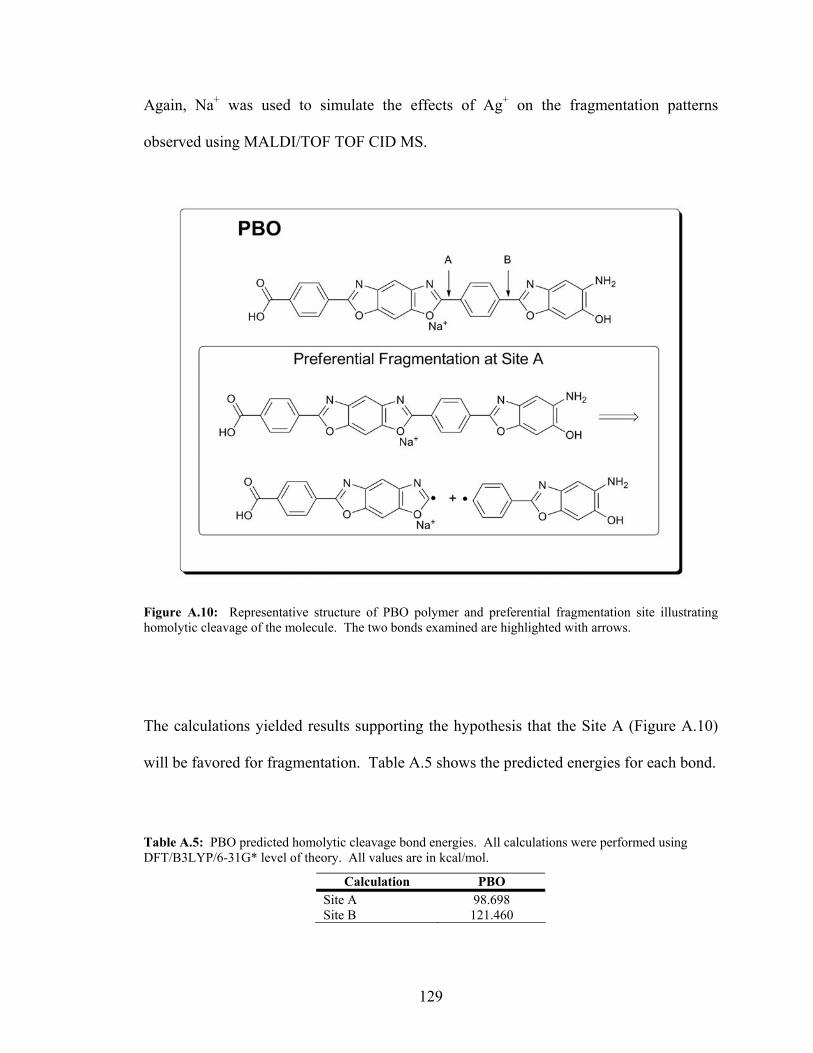
Again, Na+ was used to simulate the effects of Ag+ on the fragmentation patterns
observed using MALDI/TOF TOF CID MS.
Figure A.10: Representative structure of PBO polymer and preferential fragmentation site illustrating homolytic cleavage of the molecule. The two bonds examined are highlighted with arrows.
The calculations yielded results supporting the hypothesis that the Site A (Figure A.10)
will be favored for fragmentation. Table A.5 shows the predicted energies for each bond.
Table A.5: PBO predicted homolytic cleavage bond energies. All calculations were performed using DFT/B3LYP/6-31G* level of theory. All values are in kcal/mol.
Calculation PBO Site A 98.698 Site B 121.460
129
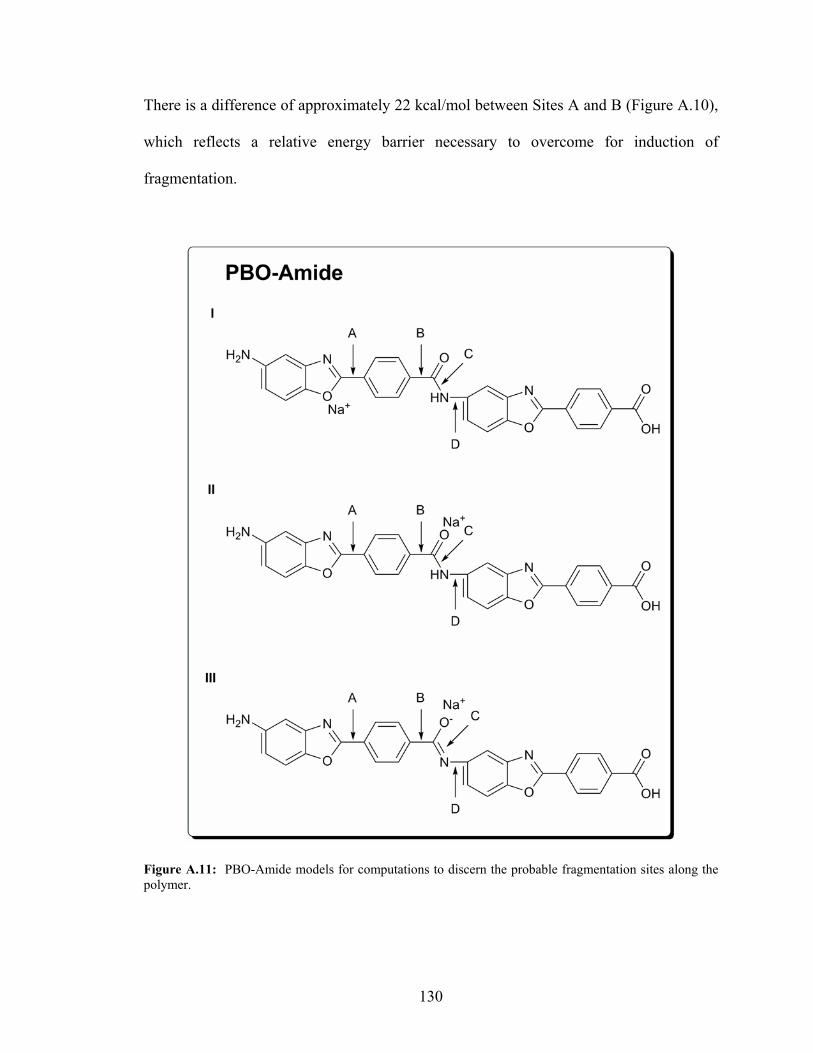
There is a difference of approximately 22 kcal/mol between Sites A and B (Figure A.10),
which reflects a relative energy barrier necessary to overcome for induction of
fragmentation.
Figure A.11: PBO-Amide models for computations to discern the probable fragmentation sites along the polymer.
130
A.6: Summary
Computational modeling for mass spectrometry has been shown to be a useful
tool toward predicting probable fragmentation patterns based upon electronic and
chemical configuration. These methods have been tested using a series of molecules,
some varying only by addition of a single functional group, and have produced results
that support mass spectrometry data. Although currently limited to the elements
addressed within the B3LYP basis set, the methodology may be further tested using other
basis set parameters that reflect and are better suited for the model being studied.
Expansion of the computational approach will provide additional support and further
integrate theoretical techniques into analytical analyses.
131
REFERENCES
(1.) Dong, C.; Qian, H.; Fang, N.; Ren, J., Study of Fluorescence Quenching and Dialysis Process of CdTe Quantum Dots, Using Ensemble Techniques and Fluorescence Correlation Spectroscopy. J. Phys. Chem. B 2006, 110, 11069-11075.
(2.) Wuister, S. F.; Donega, C. d. M.; Meijerink, A., Luminescence Temperature Antiquenching of Water-Soluble CdTe Quantum Dots: Role of the Solvent. J. Am. Chem. Soc. 2004, 126, 10397-10402.
(3.) Wolcott, A.; Gerion, D.; Visconte, M.; Sun, J.; Schwartzberg, A.; Chen, S.; Zhang, J. Z., Silica-Coated CdTe Quantum Dots Functionalized with Thiols for Bioconjugation to IgG Proteins. J. Phys. Chem. B 2006, 110, (11), 5779-5789.
(4.) Dabbousi, B. O., Rodriguez-Viejo, Mikulec, F. V., Heine, J. R., Mattoussi, H., Ober, R., Jensen K. F., and Bawendi, M. G., ZnS Core-Shell Quantum Dots: Synthesis and Optical and Structural Characterization of a Size Series of Highly Luminescent Materials. J. Phys. Chem. B 1997, 101, 9463-9475.
(5.) Smith, A. M.; Ruan, G.; Rhyner, M. n.; Nie, S., Engineering Luminescent Quantum Dots for In Vivo Molecular and Cellular Imaging. Annals of Biomedical Engineering 2006, 34, (1), 3-14.
(6.) Smith, A. M.; Gao, X.; Nie, S., Quantum Dot Nanocrystals for In Vivo Molecular and Cellular Imaging. Photochemistry and Photobiology 2004, 80, 377-385.
(7.) McBride, J., Treadway, J., Feldman, L. C., Pennycook, S. J., Rosenthal, S. J., Structural basis for near unity quantum yield core/shell nanostructures. Nano Letters 2006, 6, (7), 1496-1501.
(8.) Fu, A.; Gu, W.; Larabell, C.; Alivisatos, A. P., Semiconductor nanocrystals for biological imaging. Current Opinion in Neurobiology 2005, 15, 568-575.
(9.) Alivisatos, A. P., Perspectives on the physical chemistry of semiconductor nanocrystals. J. Phys. Chem. 1996, 100, 13226-13239.
132
(10.) Schmelz, O., Mews, A., Basché, T., Herrmann, A., and Müllen, K., Supramolecular complexes from CdSe nanocrystals and organic fluorophores. Langmuir 2001, 17, (2861-2865).
(11.) Peng, Z. A., and Peng, X., Formation of high-quality CdTe, CdSe, and CdS nanocrystals using CdO as precursor. J. Am. Chem. Soc. 2001, 123, 183-184.
(12.) Hines, M. A., and Guyot-Sinnest, P., Synthesis and characterization of strongly luminescing ZnS-capped CdSe nanocrystals. J. Phys. Chem. 1996, 100, 468-471.
(13.) Peng X., S., M. C., Kadavanich, A. V., and Alivisatos, A. P., Epitaxial growth of highly luminescent CdSe/CdS core/shell nanocrystals with photostability and electronic accessibility. J. Am. Chem. Soc. 1997, 119, 7019-7029.
(14.) Michalet, X., Pinaud, F., Lacoste, T. D., Dahan, M., Bruchez, M. P., Alivisatos, A. P., and Weiss, S., Properties of fluorescent semiconductor nanocrystals and their application to biological labeling. Single Mol. 2001, 2, 261-276.
(15.) Bruchez, M., Moronne, M., Gin, P., Weiss, S., and Alivisatos, A. P., Semiconductor nanocrystals as fluorescent biological labels. Science 1998, 281, 2013-2016.
(16.) Chan, W. C. W., and Nie, S., Quantum dot bioconjugates for ultrasensitive nonisotopic detection. Science 1998, 281, 2016-2018.
(17.) Klarreich, E., Biologists join the dots. Nature 2001, 413, 450-452.
(18.) Swafford, L. A.; Weigand, L. A.; Bowers, M. J., III; McVride, J. R.; Rapaport, J. L.; Watt, T. L.; Dixit, S. K.; Feldman, L. C.; Rosenthal, S. J., Homogeneously Alloyed CdSxSe1-x Nanocrystals: Synthesis, Characterization, and Composition/Size-Dependent Band Gap. JACS 2006, 128, (32), 12299-12306.
(19.) Xie, R.; Kolb, U.; Li, J.; Basche, T.; Mews, A., Syntesis and Characterization of Highly Luminescent CdSe-Cor CdS/Zn0.5Cd0.5S/ZnS Multishell Nanocrystals. JACS 2005, 127, (20), 7480-7488.
133
(20.) Garrett, M. D.; Dukes, A. D., III; McBride, J. R.; Smith, N. J.; Pennycook, S. J.; Rosenthal, S. J., Band Edge Recombination in CdSe, CdS, and CdSxSe1-x Alloy Nanocrystals Observed by Ultrafast Fluorescence Upconversion: The Effect of Surface Trap States. J. Phys. Chem. C 2008, 112, (33), 12736-12746.
(21.) Medintz, I. L.; Uyeda, H. T.; Goldman, E. R.; Mattoussi, H., Quantum dot bioconjugates for imaging, labeling and sensing. Nature Materials 2005, 4, 435-446.
(22.) Wu, X., Liu, H., Liu, J., Haley, K. N., Treadway, J. A., Larson, J. P., Ge, N., Peale, F., Bruchez, M., P., Immunofluorescent labeling of cancer marker Her2 and other cellular targets with semiconductor quantum dots. Nat. Biotech. 2002, 21, 41-46.
(23.) Sukhanova, A.; Devy, J.; Venteo, L.; Kaplan, H.; Artemyev, M.; Oleinikov, V.; Klinov, D.; Pluot, M.; Cohen, J. H. M.; Nabiev, I., Biocompatible fluorescent nanocrystals for immunolabeling of membrane proteins and cells. Analytical Biochemistry 2004, 324, 60-67.
(24.) Tolumasu, F.; Dvorak, J., Development and application of quantum dots for immunocytochemistry of human erythrocytes. Journal of Microscopy 2003, 211, 256-261.
(25.) Larson, D. R.; Zipfel, W. R.; Williams, R. M.; Clark, S. W.; Bruchez, M. P.; Wise, F. W.; Webb, W. W., Water-Soluble Quantum Dots for Multiphoton Fluorescence Imaging In Vivo. Science 2003, 300, 1434-1436.
(26.) Ness, J. M.; Akhtar, R. S.; Latham, C. B.; Roth, K. A., Combined Tyramide Signal Amplification and Quantum Dots for Sensitive and Photostable Immunofluorescence Detection. The Journal of Histochemistry and Cytochemistry 2003, 51, (8), 981-987.
(27.) Breus, V. V.; Heyes, C. D.; Nienhaus, G. U., Quenching of CdSe-ZnS-Shell Quantum Dot Luminescence by Water-Soluble Thiolated Ligands. J. Phys. Chem. C 2007, 111, 18589-18594.
(28.) http://www.invitrogen.com
134

(29.) Dubertret, B., Skourides, P., Norris, D. J., Noireaux, V., Brivanlou, A. H., and Libchaber, A., In vivo imaging of quantum dots encapsulated in phospholipid micelles. Science 2002, 298, 1759-1762.
(30.) Bentzen, E. L.; Tomlinson, I. D.; Mason, J.; Gresch, P.; Warnement, M. R.; Wright, D.; Sanders-Bush, E.; Blakely, R.; Rosenthal, S. J., Surface Modification To Reduce Nonspecific Binding of Quantum Dots in Live Cell Assays. Bioconjugate Chem 2005, 16, (6), 1488-1494.
(31.) Gerion, D., Pinaud, F., Williams, S. C., Parak, W. J., Weiss, S., Alivisatos, A. P., Synthesis and properties of biocompatible water-soluble silica-coated CdSe/ZnS semiconductor quantum dots. J. Phys. Chem. B 2001, 105, (37), 8861-8871.
(32.) Gao, X. H., Cui, Y. Y., Levenson, R. M., Chung, L. W. K., Nie, S. M., In vivo cancer targeting and imaging with semiconductor quantum dots. Nature Biotechnology 2004, 22, (8), 969-976.
(33.) Jovin, T. M., Quantum dots finally come of age. Nature Biotechnology 2003, 21, (1), 32-33.
(34.) Chun-Yang, Z., Yi-Xuan, G., Hui, M., Cheng-Cai, A., Die-Yan, C., Trichosanthin induced calcium-dependent generation of reactive oxygen species in human choriocarcinoma cells. Analyst 2000, 125, (9), 1539-1542.
(35.) Minet, O.; Dressler, C.; Beuthan, J., Heat STress Induced Redistribution of Fluorescent Quantum Dots in Breast Tumor Cells. Journal of Fluorescence 2004, 14, (3), 241-247.
(36.) Tomlinson, I. D., Mason, J. N., Blakely, R. D., Rosenthal, S. J., Peptide-conjugated quantum dots - Imaging the angiotensin type 1 receptor in living cells. In Methods Mol. Bio., ed.; Rosenthal, S. J., Wright, D. W., HUMANA PRESS INC: 2005; 51-60.
(37.) Lidke, D. S., Nagy, P., Heintzmann, R., Arndt-Jovin, D. J., Post, J. N., Grecco, H. E., Jares-Erijman, E.A., Jovin, T.M., Quantum dot ligands provide new insights into erbB/HER receptor-mediated signal transduction. Nature Biotechnology 2004, 22, (2), 198-203.
135
(38.) Åkerman, M. E., Chan, W. C. W., Laakkonen, P., Bhatia, S. N., and Ruoslahti, E., Nanocrystal targeting in vivo. Proc. Natl. Acad. Sci. U.S.A. 2002, 99, 12617-12621.
(39.) Gussin, H. A., Tomlinson, I. D., Little, D. M., Warnement, M. R., Qian, H., Rosenthal, S. J., Pepperberg, D. R., Binding of Muscimol-Conjugated Quantum Dots to GABAC Receptors. J. Am. Chem. Soc. 2006, 128, (49), 15701-15713.
(40.) Rosenthal, S. J., Tomlinson, A., Adkins, E. M., Schroeter, S., Adams, S., Swafford, L., McBride, J., Wang, Y. Q., DeFelice, L. J., Blakely, R. D., Targeting cell surface receptors with ligand-conjugated nanocrystals. J. Am. Chem. Soc. 2002, 124, (17), 4586-4594.
(41.) Tomlinson, I. D., Mason, J. N., Blakely, R. D., Rosenthal, S. J., High affinity inhibitors of the dopamine transporter (DAT): Novel biotinylated ligands for conjugation to quantum dots. Bioorg. & Med. Chem. Lett. 2006, 16, (17), 4664-4667.
(42.) Ballou, B., Lagerholm, B. C., Ernst, L. A., Bruchez, M. P., and Waggoner, A. S., Noninvasive imaging of quantum dots in mice. Bioconjugate Chem 2004, 15, 79-86.
(43.) Dahan, M., Levi, S., Luccardini, C., Rostaing, P., Riveau, B., Triller, A., Diffusion dynamics of glycine receptors revealed by single-quantum dot tracking. Science 2003, 302, (5644), 442-445.
(44.) Goldman, E. R., Clapp, A. R., Anderson, G. P., Uyeda, H. T., Mauro, J. M., Medintz, I. L., Mattoussi, H., Multiplexed toxin analysis using four colors of quantum dot fluororeagents. Anal. Chem. 2004, 76, (3), 684-688.
(45.) Mason, J. N., Farmer, H., Tomlinson, I. D., Schwartz, J. W., Savchenko, V., DeFelice, L. J., Rosenthal, S. J., Blakely, R. D., Novel fluorescence-based approaches for the study of biogenic amine transporter localization, activity, and regulation. J. Neurosci. Meth. 2005, 143, (1), 3-25.
(46.) Osaki, F., Kanamori, T., Sando, S., Sera, T., Aoyama, Y., A Quantum Dot Conjugated Sugar Ball and Its Cellular Uptake. On the Size Effects of Endocytosis in the Subviral Region. J. Am. Chem. Soc. 2004, 126, (21), 6520-6521.
136
(47.) Parak, W. J., Boudreau, R., Le Gros, M., Gerion, D., Zanchet, D., Micheel, C. M., Williams, S. C., Alivisatos, A. P., Larabell, C., Cell Motility and Metastatic Potential Studies Based on Quantum Dot Imaging of Phagokinetic Tracks. Adv. Mater. 2002, 14, (12), 882-885.
(48.) Gomez, N., Winter, J. O., Shieh, F., Saunders, A. E., Korgel, B. A., Schmidt, C. E., Challenges in quantum dot-neuron active interfacing. Talanta 2005, 67, 462-471.
(49.) Hanaki, K., Momo, A., Oku, T., Komoto, A., Mainosono, S., Yanaguchi, Y., Yamamoto, K., Semiconductor quantum dot/albumin complex is a long-life and highly photostable endosome marker. Biochem. and Biophys. Res. Comm. 2003, 302, 496-501.
(50.) Hoshino, A., Hanaki, K., Suzuki, K., Yamamoto, K., Applications of T-lymphoma labeled with fluorescent quantum dots to cell tracing markers in mouse body. Biochem. and Biophys. Res. Comm. 2004, 314, 46-53.
(51.) Voura, E. B., Haiswal, J. K., Mattoussi, H., Simon, S. M., Tracking metastatic tumor cell extravasation with quantum dot nanocrystals and fluorescnece emission-scanning microscopy. Nature Medicine 2004, 10, (9), 993-998.
(52.) Estrada, C. R.; Salanga, M.; Bielenberg, D. R.; Harrell, W. B.; Zurakowski, D.; Zhu, X.; Palmer, M. R.; Freeman, M. R.; Adam, R. M., Behavioral Profiling of Human Transitional Cell Carcinoma Ex vivo. Cancer Research 2006, 66, (6), 3078-3086.
(53.) Clarke, S. J.; Hollmann, C. A.; Zhang, Z.; Suffern, D.; Bradforth, S. E.; Dimitrijevic, N. M.; Minarik, W. G.; Nadeau, J. L., Photophysics of dopamine-modified quantum dots and effects on biological systems. Nature Materials 2006, 5, 409-417.
(54.) Chu, T. C.; Shieh, F.; Lavery, L. A.; Levy, M.; Richards-Kortum, R.; Korgel, B. A.; Ellington, A. D., Labeling tumor cells with fluorescent nanocrystal-aptamer bioconjugates. Biosensors and Bioelectronics 2006, 21, 1859-1866.
(55.) Giepmans, B. N. G.; Deerinck, T. J.; Smarr, B. L.; Jones, Y. Z.; Ellisman, M. H., Correlated light and electron microscopic imaging of multiple endogenous proteins using Quantum dots. Nature Methods 2005, 2, (10), 743-749.
137
(56.) Howarth, M., Takao, K., Hayashi, Y., Ting, A. Y., Targeting quantum dots to surface proteins in living cells with biotin ligase. PNAS 2005, 102, (21), 7583-7588.
(57.) Orndorff, R. L.; Warnement, M. R.; Mason, J. N.; Blakely, R. D.; Rosenthal, S. J., Quantum Dot Ex Vivo Labeling of Neuromuscular Synapses. Nano Letters 2008, 8, (3), 780-785.
(58.) Goldin, A. L., Ion Channel Disorders. Neurobiology of Disease 2007, 12, 135-148.
(59.) Puljak, L.; Kilic, G., Emerging roles of chloride channels in human diseases. Biochimica et Biophysica Acta 2006, 1762, 404-413.
(60.) McFerrin, M. B.; Sontheimer, H., A role for ion channels in glioma cell invasion. Neuron Glia Biology 2006, 2, 39-49.
(61.) Mouhat, S.; Jouirou, B.; Mosbah, A.; De Waard, M.; Sabatier, J.-M., Diversity of folds in animal toxins acting on ion channels. Biochem. J. 2004, 378, 717-76.
(62.) Soroceanu, L.; Gillespie, Y.; Khazaeli, M. B.; Sontheimer, H., Use of Chlorotoxin for Targeting of Primary Brain Tumors. Cancer Research 1998, 58, 4871-4879.
(63.) Wiley, R. G.; Lappi, D. A., Targeted toxins in pain. Advanced Drug Delivery Reviews 2003, 55, (8), 1043-1054.
(64.) Wiley, R. G., Neural lesioning with ribosome-inactivating proteins: suicide transport and immunolesioning. Trends in Neurosciences 1992, 15, (8), 285-290.
(65.) Granier, C.; Novotny, J.; Gontecilla-Camps, J.-C.; Fourquet, P.; El Ayeb, M.; Bahraoui, E., The Antigenic Structure of a Scorpion Toxin. Molecular Immunology 1989, 26, (6), 503-513.
(66.) Cleland, J. C.; Griggs, R. C., Channelopathies of the Nervous System. Neurobiology of Disease 2007, 31, 319-332.
138

(67.) Kim, S.; Lim, Y. T.; Soltesz, E. G.; De Grand, A. M.; Lee, J.; Nakayama, A.; Anthony;, P. J.; Mihaljevic, T.; Laurence, R. G.; Dor, D. M.; Cohn, L. H.; Bawendi, M. G.; Frangioni, J. V., Near-infrared fluorescent type II quantum dots for sentinel lymph node mapping. Nature Biotechnology 2004, 22, (1), 93-97.
(68.) Soltesz, E. G., Kim, S., Laurence, R. G., DeGrand, A. M., Parungo, C. P., Dor, D. M., Cohn, L. H., Bawendi, M. G., Frangioni, J. V., Mihaljevic, T., Intraoperative sentinel lymph node mapping of the lung using near-infrared fluorescent quantum dots. Annals of Thoracic Surgery 2005, 79, (1), 269-277.
(69.) Soltesz, E. G., MD, MPH;; Kim, S., PhD;; Kim, S.-W., PhD;; Laurence, R. G., BS;; De Grand, A. M., BS;; Parungo, C. P., MD;; Cohn, L. H., MD;; Bawendi, M. G., PhD;; Frangioni, J. V., MD, PhD, Sentinel Lymph Node Mapping of the Gastointestinal Tract by Using Invisible Light. Annals of Surgical Oncology 2006, 13, (3), 386-396.
(70.) Turchin, I. V.; Balalaeva, I. V.; Vasil'ev, R. B.; Zlomanov, V. P.; Plehanov, V. I.; Orlova, A. G.; Zagaynova, E. V.; Kamensky, V. A.; Kleshnin, M. S.; Shirmanova, M. V.; Dorofeev, S. G.; Dirin, D. N., Imaging of QDs-labeled tumors in small animals by fluorescence diffuse tomography. Laser Phys. Lett. 2006, 3, (4), 208-211.
(71.) Persson, A. I.; Fan, Q.; Phillips, J. J.; Weiss, W. A., Glioma. Neurobiology of Disease 2007, 39, 433-444.
(72.) Sun, C.; Veiseh, O.; Gunn, J.; Fang, C.; Hansen, S.; Lee, D.; Sze, R.; Ellenbogen, R. G.; Olson, J.; Zhang, M., In Vivo MRI Detection of Gliomas by Chlorotoxin-Conjugated Superparamagnetic Nanoprobes. Small 2008, 4, (3), 372-379.
(73.) Chang, C. C., Looking Back on the Discovery of α-Bungarotoxin. J. Biomed. Sci 1999, 6, 368-375.
(74.) Connolly, J. G., Structure-Function Relationships in Nicotinic Acetylcholine Receptors. Comp. Biochem. Physiol. 1989, 93A, (1), 221-231.
(75.) Fairchough, R. H.; Josephs, R.; Richman, D. P., Imaging Ligand Binding Sites on the Torpedo Acetylcholine Receptor. Annals of the New York Academy of Sciences 1993, 681, 113-125.
139
(76.) Gotti, C.; Clementi, F., Neuronal nicotinic receptors: from structure to pathology. Progress in Neurobiology 2004, 74, 363-396.
(77.) Lindstrom, J. M., Nicotinic Acetylcholine Receptors of Muscles and Nerves: Comparison of Their Structures, Functional Roles, and Vulnerability to Pathology. Annals of the New York Academy of Sciences 2003, 998, 41-52.
(78.) Arias, H. R., Localization of agonist and competitive antagonist binding sites on nicotinic acetylcholine receptors. Neurochemistry International 2000, 36, 595-645.
(79.) Unwin, N., Nicotinic Acetylcholine Receptor at 9 Α Resolution. J. Mol. Biol. 1993, 229, 1101-1124.
(80.) Unwin, N., Acetylcholine receptor channel imaged in the open state. Nature 1995, 373, 37-43.
(81.) Zeng, H.; Moss, L.; Grant, M. A.; Hawrot, E., The solution structure of the complex formed between α-bungarotoxin and an 18-mer cognate peptide derived from the α1 subunit of the nicotinic acetylcholine receptor from Torpedo californica. J. Biol. Chem. 2001, 276, 22930-22940.
(82.) Gautam, M.; Noakes, P. G.; Mudd, J.; Michol, M.; Chu, G. C.; Sanes, J. R.; Merlie, J. P., Failure of postsynaptic specialization to develop at neuromuscular junctions of rapsyn-deficient mice. Nature 1995, 377, 232-236.
(83.) Stephenson, F. A.; Harrison, R.; Lunt, G. G., The Isolation and Characterisation of the Nicotinic Acetylcholine Receptor from Human Skeletal Muscle. European Journal of Biochemistry, FEBS 1981, 115, 91-97.
(84.) Delano, W. L. The PyMOL Molecular Graphics System, De Lano Scientific, LLC.: 1998-2009.
(85.) DeBin, J. A.; Maggio, J. E.; Strichartz, G. R., Purification and characterization of chlorotoxin, a chloride channel ligand from the venom of the scorpion. American Journal of Physiology 1993, 264, (Cell Physiology 33), C361-C369.
140

(86.) Goudet, C.; Chi, C.-W.; Tytgat, J., An overview of toxins and genes from the venom of the Asian scorpion Buthus martensi Karsch. Toxicon 2002, 40, 1239-1258.
(87.) Lippens, G.; Najib, J.; Wodak, S. J.; Tartar, A., NMR Sequential Assignments and Solution Structure of Chlorotoxin, a Small Scorpion Toxin That Blocks Chloride Channels. Biochemistry 1995, 34, (1), 13-21.
(88.) Lippens, G.; Najib, J.; Wodak, S. J.; Tartar, A., NMR sequential assignments and solution structure of chlorotoxin, a small scorpion toxin that blocks chloride channels. Biochemistry 1995, 34, 13-21.
(89.) Deshane, J.; Garner, C. C.; Sontheimer, H., Chlorotoxin Inhibits Glioma Cell Invasion via Matrix Metalloproteinase-2. The Journal of Biological Chemistry 2003, 278, (6), 4135-4144.
(90.) Veiseh, M.; Gabikian, P.; Bahrami, S.-B.; Veiseh, O.; Zhang, M.; Hackman, R. C.; Ravanpay, A. C.; Stroud, M. R.; Kusuma, Y.; Hansen, S. J.; Kwok, D.; Munoz, N. M.; Sze, R. W.; Grady, W. M.; Greenberg, N. M.; Ellenbogen, R. G.; Olson, J. M., Tumor Paint: A Chlorotoxin:Cy5.5 Bioconjugate for Intraoperative Visualization of Cancer Foci. Cancer Research 2007, 67, (14), 6882-6888.
(91.) Rousaire-Dubois, B.; Milandri, J. B.; Bostsel, S.; Dubois, J. M., Control of cell prolilferation by cell volume alterations in rat C6 glioma cells. European Journal of Physiology 2000, 440, 881-888.
(92.) Soroceanu, L.; Manning, T. J., Jr.; Sontheimer, H., Modulation of Glioma Cell Migration and Invasion Using Cl- and K+ Ion Channel Blockers. the Journal of Neuroscience 1999, 19, (14), 5942-5954.
(93.) Suzuki, M.; Morita, T.; Iwamoto, T., Diversity of Cl- Channels. Cellular and Molecular Life Sciences 2006, 63, 12-24.
(94.) Bidard, J.-N.; Mourre, C.; Gandlofo, G.; Schweitz, H.; Widmann, C.; Gottesmann, C.; Lazdunski, M., Analogies and differences in the mode of action and properties of binding sites (localization and mutual interactions) of two K+ channel toxins, MCD peptide and dendrotoxin I. Brain Research 1989, 495, 45-57.
141
(95.) Wang, F. C.; Bell, N.; Reid, P.; Smith, L. A.; McIntosh, P.; Robertson, B.; Dolly, J. O., Identification of residues in dendrotoxin K responsible for its discrimination between neuronal K+ channels containing Kv1.1 and 1.2 α subunits. European Journal of Biochemistry 1999, 263, 222-229.
(96.) Gasparini, S.; Danse, J.-M.; Lecoq, A.; Pinkasfeld, S.; Zinn-Justin, S.; Young, L. C.; Medeiros, C. C. L. d.; Rowan, W. G.; Harvey, A. L.; Menez, A., Delineation of the Functional Site of α-Dendrotoxin. The Journal of Biological Chemistry 1998, 273, (39), 25393-25403.
(97.) Allen, M. L.; Koh, D.-S.; Tempel, B. L., Cyclic AMP regulates potassium channel expression in C6 glioma by destabilizing Kv1.1 mRNA. Proceedings of the National Academy of Sciences USA 1998, 95, 7693-7698.
(98.) Lancelin, J. M.; Foray, M. F.; Poncin, M.; Hollecker, M.; Manon, D., Proteinase inhibitor homologues as potassium channel blockers. Nat. Struct. Biol. 1994, 1, 246-250.
(99.) Orndorff, R. L.; Rosenthal, S. J., Neurotoxin Quantum Dot Conjugates Detect Endogenous Targets in Live Cancer Cells. Accepted to Nano Letters, 2009.
(100.) Sine, S. M.; Engel, A. G., Recent advances in Cys-loop receptor structure and function. Nature 2006, 440, (23), 448-455.
(101.) Flucher, R. F.; Daniels, M. P., Distribution of Na+ Channels and Ankyrin in Neuromuscular Junctions Is Complementary to That of Acetylcholine Receptors and the 43 kd Protein. Neuron 1989, 3, 163-175.
(102.) Ruff, R. L., Neurophysiology of the Neuromuscular Junction: Overview. Annals of the New York Academy of Sciences 2003, 998, 1-10.
(103.) Clark, P. B. S.; Schwartz, R. D.; Paul, S. M.; Pert, C. B.; Pert, A., Nicotinic binding in rat brain: autoradiographic comparison of [3H]acetylcholine, [3H]nicotine and [125I] α-bungarotoxin. Journal of Neuroscience 1985, 5, 1307-1315.
(104.) Bogdanov, Y.; Michels, G.; Armstrong-Gold, C.; Haydon, P. G.; Lindstrom, J.; Pangalos, M.; Moss, S. J., Synaptic GABAA receptors are directly recruited from their extrasynaptic counterparts. The EMBO Journal 2006, 25, (18), 4381-4389.
142

(105.) Gottschalk, A.; Schafer, W. R., Visualization of integral and peripheral cell surface proteins in live Caenorhabditis elegans. Journal of Neuroscience Methods 2006, 154, 68-79.
(106.) Ferguson, S. M.; Bazalakova, M.; Savchenko, V.; Tapia, J. C.; Wright, J.; Blakely, R. D., Lethal impairment of cholinergic neurotransmission in hemicholinium-3-sensitive choline transporter knockout mice. PNAS 2004, 101, (23), 8732-8767.
(107.) Sekine-Aizawa, Y.; Huganir, R. L., Imaging of receptor trafficking by using α-bungarotoxin-binding-site-tagged-receptors. Proc. Natl. Acad. Sci. U.S.A. 2004, 101, (49), 17114-17119.
(108.) Fountaine, T. J., Wincovitch, S. M., Geho, D. H., Gargield, S. H., Pittaluga, S., Multispectral imaging of clinically relevant cellular targets in tonsil and lymphoid tissue using semiconductor quantum dots. Modern Pathology 2006, 19, 1181-1191.
(109.) Tholouli, E., Hoyland, J. A., Di Vizio, D., O'Connell, F., MacDermott, S. A., Twomey, D., Levenson, R., Liu Yin, J. A., Golub, T. R., Loda, M., Byers, R., Imaging of multiple mRNA targets using quantum dot based in situ hybridization and spectral deconvolution in clinical biopsies. Biochem. and Biophys. Res. Comm. 2006, 348, 628-636.
(110.) Chan, P., Yuen, T., Ruf, F., Gonzalez-Maeso, J., Sealfon, S. C., Method for multiplex cellular detection of mRNAs using quantum dot fluorescent in situ hybridization. Nuc. Acids Res. 2005, 33, (18), e161-e169.
(111.) Ferrara, D. E.; Weiss, D.; Carnell, P. H.; Vito, R. P.; Vega, D.; Gao, X.; Nie, S.; Taylor, W. R., Quantitative 3D fluorescence technique for the analysis of en face preparations of arterial walls using quantum dot nanocrystals and two-photon excitation laser scanning microscopy. Am j. Physiol Regulatory Integrative Comp Physiol 2006, 290, 114-123.
(112.) Levene, M. J., Dombeck, D. A., Kasischke, K. A., Molloy, R. P., Webb, W. W., In Vivo Multiphoton Microscopy of Deep Brain Tissue. J. Neurophysiol. 2004, 91, 1908-1912.
(113.) Misgeld, T.; Burgess, R. W.; Lewis, R. M.; Cunningham, J. M.; Lechtman, J. W.; Sanes, J. R., Roles of neurotransmitter in Synapse Formation:
143

Development of Neuromuscular Junctions Lacking Choline Acetyltransferase. Neuron 2002, 36, 635-648.
(114.) Harel, M.; Kasher, R.; Nicolas, A.; Guss, J. M.; Balass, M.; Fridkin, M.; Smit, A. B.; Brejc, K.; Sixma, T. K.; Katchalski-Katzir, E.; Sussman, J. L.; Fuchs, S., The Binding Site of Acetylcholine Receptor as Visualized in the X-Ray Structure of a Complex between α-Bungarotoxin and a Mimotope Peptide. Neuron 2001, 32, (2), 265-275.
(115.) McCann, C. M.; Bracamontes, J.; Steinbach, J. H.; Sanes, J. R., The cholinergic antagonist α-bungarotoxin also binds and blocks a subset of GABA receptors. PNAS 2006, 103, (13), 5149-5154.
(116.) Benda, P.; Lightbody, J.; Sato, G.; Levine, L.; Sweet, W., Differentiated rat glial cell strain in tissue culture. Science 1968, 161, (839), 370-371.
(117.) Ullrich, N.; Bordey, A.; Gillespie, G. Y.; Sontheimer, H., Expression of Voltage-Activated Chloride Currents in Acute Slices of Human Gliomas. Neuroscience 1998, 83, (4), 1161-1173.
(118.) Frisch, M. J.; Trucks, G. W.; Schlegel, H. B.; Scuseria, G. E.; Robb, M. A.; Cheeseman, J. R.; Montgomery, J. A., Jr.; Vreven, T.; Kudin, K. N.; Burant, J. C.; Millam, J. M.; Iyengar, S. S.; Tomasi, J.; Barone, V.; Mennucci, B.; Cossi, M.; Scalmani, G.; Rega, N.; Petersson, G. A.; Nakatsuji, H.; Hada, M.; Ehara, M.; Toyota, K.; Fukuda, R.; Hasegawa, J.; Ishida, M.; Nakajima, T.; Honda, Y.; Kitao, O.; Nakai, H.; Klene, M.; Li, X.; Knox, J. E.; Hratchian, H. P.; Cross, J. B.; Bakken, V.; Adamo, C.; Jaramillo, J.; Gomperts, R.; Stratmann, R. E.; Yazyen, O.; Austin, A. J.; Cammi, R.; Pomelli, C.; Ochterski, J. W.; Ayala, P. Y.; Morokuma, K.; Voth, G. A.; Salvador, P.; Dannenberg, J. J.; Zakrzewski, V. G.; Dapprich, S.; Daniels, A. D.; Strain, M. C.; Farkas, O.; Malick, D. K.; Rabuck, A. D.; Raghavachari, K.; Foresman, J. B.; Ortiz, J. V.; Cui, Q.; Baboul, A. G.; Clifford, S.; Cioslowski, J.; Stefanov, B. B.; Liu, G.; Liashenko, A.; Piskorz, P.; Komaromi, I.; Martin, R. L.; Fox, D. J.; Keith, T.; Al-Laham, M. A.; Peng, C. Y.; Nanayakkara, A.; Challacombe, M.; Gill, P. M. W.; Johnson, B.; Chen, W.; Wong, M. W.; Gonzalez, C.; Pople, J. A. Gaussian 03, Revision D.01, Gaussian, Inc.: Wallingford, CT, 2004.
(119.) Lee, C. T., Yang, W. T., Parr, R. G., Development of the Colle-Salvetti Correlation-Energy Formula into a Functional of the Electron-Density. Phys. Rev. B 1988, 37, (2), 785-789.
144

145
(120.) Becke, A. D., Density-Functional Exchange-Energy Approximation with Correct Asymptotic-Behavior. Phys. Rev. A 1988, 38, (6), 3098-3100.
(121.) Gies, A. P.; Vergne, M. J.; Orndorff, R. L.; Hercules, D. M., MALDI-TOF/TOF CID Study of Polystyrene Fragmentation Reactions. Macromolecules 2007, 40, (21), 7493-7505.
(122.) Gies, A. P.; Ellison, S. T.; Vergne, M. J.; Orndorff, R. L.; Hercules, D. M., MALDI-TOF/TOF CID of poly(α-methylstyrene) fragmentation reactions. Anal. Bioanal. Chem. 2008, 392, 627-642.
(123.) Gies, A. P.; Vergne, M. J.; Orndorff, R. L.; Hercules, D. M., MALDI-TOF/TOF CID study of 4-alkyl-substituted polystyrene fragmentation reactions. Anal. Bioanal. Chem. 2008, 392, 609-626.