in-depth survey report - centers for disease control … survey report dust-control technology for...
TRANSCRIPT
In-Depth Survey Report
DUST-CONTROL TECHNOLOGY FOR ASPHALT-
PAVEMENT MILLING Controlled-site testing at State
Highway 47, Bonduel, Wisconsin
Conducted with assistance from the Silica/Milling-Machines Partnership,
affiliated with and coordinated through The National Asphalt Pavement Association (NAPA)
Duane R. Hammond, M.S., P.E. Leo Michael Blade, M.S., C.I.H.
Stanley A. Shulman, Ph.D. Jeanne Zimmer Andrew B. Cecala
Gerald J. Joy, C.I.H., C.S.P. Li-Ming Lo, Ph.D.
Gregory J. Chekan, B.S., MinE
Division of Applied Research and Technology
Engineering and Physical Hazards Branch
EPHB Report No. 282-18a
December 2011
DEPARTMENT OF HEALTH AND HUMAN SERVICES
Centers for Disease Control and Prevention National Institute for Occupational Safety and Health
EPHB Report No. 282-18a
Page ii
Site Surveyed: State Highway 47, Bonduel, Wisconsin
NAICS Code: 237310 (Highway, Street, and Bridge Construction)
Survey Dates: August 9 -18, 2010
Surveys Conducted By: Duane Hammond, NIOSH/DART
Leo Michael Blade, NIOSH/DART
Stanley A. Shulman, NIOSH/DART
Jeanne Zimmer, NIOSH/OMSHR
Andrew Cecala, NIOSH/OMSHR
Gerald, Joy, NIOSH/OMSHR
Li Ming Lo, NIOSH/DART
Gregory Chekan, NIOSH/OMSHR
Employer Representatives Contacted
Tony Bodway (Chairman), Payne and Dolan
R. Gary Fore, National Asphalt Pavement Association (NAPA)
Donald Elisburg, NAPA consultant
Emmett Russell, International Union of Operating Engineers (IUOE)

EPHB Report No. 282-18a
Page iii
Disclaimer
The findings and conclusions in this report are those of the authors and do not necessarily represent the views of NIOSH. Mention of any company or product does not constitute endorsement by NIOSH. In addition, citations to websites external to
NIOSH do not constitute NIOSH endorsement of the sponsoring organizations or their programs or products. Furthermore, NIOSH is not responsible for the content
of these websites. All Web addresses referenced in this document were accessible as of the publication date.
Acknowledgments
The authors thank the members of the Silica/Milling-Machines Partnership,
especially the National Asphalt Pavement Association, the participating manufacturers including the manufacturers of the milling machines tested during
this field study, Partnership Chair Tony Bodway and his company, Payne and Dolan, Northeast Asphalt, the Association of Equipment Manufacturers (AEM), the International Union of Operating Engineers (IOUE), and the Laborers’ International
Union of North America (LIUNA), for their efforts on behalf of this study and for their assistance in arranging and conducting this field study.

EPHB Report No. 282-18a
Page iv
Table of Contents
Disclaimer ........................................................................................ iii
Acknowledgments ............................................................................. iii
Abstract ............................................................................................ v
Introduction ...................................................................................... 1
Background for Control Technology Studies ........................................ 1
Background for this Study ................................................................ 1
Previous Silica/Milling Machines Studies ............................................. 2
Occupational Exposure Limits and Health Effects ................................. 4
Occupational Exposure to Crystalline Silica ......................................... 5
Methodology...................................................................................... 6
Water flow and pressure ................................................................... 7
Depth and width of cut, wind speed and direction, temperature, vehicle
speed ............................................................................................. 7
Respirable-dust and crystalline-silica air-sampling measurements ......... 8
Bulk-material sampling and analysis for crystalline-silica ...................... 9
Experimental design and methodology ............................................... 9
Control Technology .......................................................................... 10
Description of tested dust-emission control configurations .................. 10
Results ........................................................................................... 14
Bulk-material samples analyzed for crystalline silica .......................... 16
Estimated crystalline-silica content of airborne respirable dust ............ 16
Conclusions and Recommendations .................................................... 18
References ...................................................................................... 19
Appendixes ..................................................................................... 22
Appendix A ................................................................................... 22
Appendix B ................................................................................... 25
EPHB Report No. 282-18a
Page v
Abstract
In 2010, NIOSH researchers and the Silica/Milling-Machines Partnership coordinated by the National Asphalt Pavement Association (NAPA), evaluated
dust emission-control systems for five pavement-milling machines on State Highway 47 south of Bonduel, Wisconsin. To suppress dust, water spray
controls were installed on all five milling machines and a local exhaust ventilation control was installed on one machine. The tests consisted of
numerous, replicate short-term milling trials (nominally about 6 minutes each in duration). During a trial, a test milling machine removed
approximately 3 inches of depth of the asphalt surface while operating either its existing production water-spray system (the “baseline configuration”), or
one of its modified test emission-control configurations. During the trials,
respirable-dust concentrations were measured at ten selected locations around each mill using continuous real-time data-logging dust monitors.
The results from six key monitoring locations (from among the ten) together are considered to best represent dust-emission rates, because they surround
the low-to-the-ground dust-generating areas of the machine where the modified emission controls are located. Trial-mean concentrations from
these “lower-six” locations were averaged together to obtain a single lower-six-location average for that trial. The average lower-six result for the
baseline dust-control configuration in a set was compared with that for each of the modified test configurations in that set. Dust-emission reductions
were computed for each test configuration versus the baseline in that set. Average reductions across all sets for that machine were computed, along
with their statistical confidence intervals.
For the lower six sampling locations, statistically significant reduction in mean respirable dust concentrations of 81% and 69% occurred during
testing of configurations D21 and D3 which were local exhaust ventilation configurations at medium and low fan speeds of approximately 1500 actual
cubic feet per minute (acfm) and 1000 acfm of air. The reductions in mean respirable dust concentrations at the lower-six sampling locations were not
statistically significant for any of the evaluated water spray configurations.
For the operator bridge sampling location, statistically significant reductions in mean respirable dust concentrations of 77%, 65%, 59%, and 44% were
measured during testing of configurations D21, D3, E23, and E22, respectively. No other evaluated configurations resulted in statistically
significant reductions at the operator bridge. Based on the results from this and previous studies, the NIOSH researchers recommend additional testing
of the wet drum design and optimization of local exhaust ventilation systems as the primary control method for reducing respirable crystalline silica during
asphalt pavement milling.

Page 1
Introduction
Background for Control Technology Studies
The National Institute for Occupational Safety and Health (NIOSH), Centers for Disease Control and Prevention (CDC) is the primary Federal agency engaged in occupational safety and health research. Located in the Department of Health and
Human Services, it was established by the Occupational Safety and Health Act of 1970. This legislation mandated NIOSH to conduct a number of research and
education programs separate from the standard setting and enforcement functions carried out by the Occupational Safety and Health Administration (OSHA) in the Department of Labor. An important area of NIOSH research deals with methods for
controlling occupational exposure to potential chemical and physical hazards. The Engineering and Physical Hazards Branch (EPHB) of the Division of Applied
Research and Technology has been given the lead within NIOSH to study the engineering aspects of health hazard prevention and control.
Since 1976, EPHB has conducted a number of assessments of health hazard control technology on the basis of industry, common industrial process, or specific control
techniques. Examples of these completed studies include the foundry industry; various chemical manufacturing or processing operations; spray painting; and the recirculation of exhaust air. The objective of each of these studies has been to
document and evaluate effective control techniques for potential health hazards in the industry or process of interest, and to create a more general awareness of the
need for or availability of an effective system of hazard control measures.
These studies involve a number of steps or phases. Initially, a series of walk-
through surveys is conducted to select plants or processes with effective and potentially transferable control concept techniques. Next, in-depth surveys are
conducted to determine both the control parameters and the effectiveness of these controls. The reports from these in-depth surveys are then used as a basis for preparing technical reports and journal articles on effective hazard control
measures. Ultimately, the information from these research activities builds the data base of publicly available information on hazard control techniques for use by
health professionals who are responsible for preventing occupational illness and injury.
Background for this Study
NIOSH is conducting a research study of the effectiveness of dust-emission control
measures during asphalt pavement-milling operations. The initial aim of this project is to determine if the dust emission-control systems installed on new pavement-milling machines and operated according to the manufacturers’
recommendations are adequate to control worker exposures to respirable dust, especially that containing crystalline silica, a long-recognized occupational
respiratory hazard. Chronic over-exposures to such dust may result in silicosis, a chronic progressive lung disease that eventually may be disabling or even fatal, and an increased risk of lung cancer [NIOSH 2002]. The long term goal of this project

Page 2
is to adequately control worker exposures to respirable dust and crystalline silica by providing data to support the development of a set of best practice guidelines for
the equipment if the engineering controls are adequate, or to develop a set of recommendations to improve the performance of controls if they are not adequate.
Many construction tasks have been associated with overexposure to crystalline silica [Rappaport et al. 2003]. Among these tasks are tuck pointing, concrete
sawing, concrete grinding, and abrasive blasting [NIOSH 2000; Thorpe et al. 1999; Akbar-Kanzadeh and Brillhart 2002; Glindmeyer and Hammad 1988]. Road milling
has also been shown to result in overexposures to respirable crystalline silica [Linch 2002; Rappaport et al. 2003; Valiante et al. 2004]. However, all three of those road-milling studies are limited because they do not provide enough information
about the operating parameters and engineering controls present on the milling machines to determine if the overexposures were due to a lack of effective controls
or poor work practices. This study is helping to fill that knowledge gap.
A variety of machinery and work practices are employed in asphalt pavement
recycling, including cold-planers, heater planers, cold-millers, and heater-scarifiers [Public Works 1995]. Cold-milling, which uses a toothed, rotating drum to grind
and remove the pavement to be recycled, is primarily used to remove surface deterioration on both petroleum-asphalt aggregate and Portland-cement concrete road surfaces [Public Works 1995]. The milling machines used in cold-milling are
the focus of this investigation.
This field research evaluated and compared the performance of several milling machines’ existing and modified prototype systems for the control of emissions of respirable dust. Numerous short-term milling trials were conducted at a closed,
controlled test site, using each dust emission-control system, and respirable-dust concentrations in the air surrounding the test mills were measured and compared.
This study is facilitated by the Silica/Milling-Machines Partnership, which is affiliated with and coordinated through the National Asphalt Pavement Association (NAPA).
The partnership includes NAPA itself, the Association of Equipment Manufacturers, the manufacturers of almost all pavement-milling machines sold in the U.S., numerous construction contractors, employee representatives, NIOSH, and other
interested parties.
Previous Silica/Milling Machines Studies
NIOSH researchers collaborated with the Silica/Milling-Machines Partnership to conduct field research on respirable-dust and crystalline-silica exposures and
exposure controls from 2003 through 2008. With the assistance of the Partnership in identifying pavement-milling job sites appropriate for study and in arranging for the field work, NIOSH researchers completed a pilot field survey [Echt et al. 2004],
four in-depth field surveys from 2004 to 2006 [Echt et al. 2007; Blade et al. 2009a; Blade et al. 2009b; Blade et al. 2009c], and a large study of four milling machines
in 2008 [Blade et al. 2011]. However, the road-milling job evaluated during the
Page 3
pilot study was not considered representative of typical jobs. It was a “full-depth removal” job, which is relatively uncommon, and therefore the subsequent field
surveys evaluated so-called “mill-and-fill” jobs, which are perhaps the most common. Therefore, the data developed from the pilot survey is not judged to be
appropriate for inclusion among the overall study findings.
The following conclusions are based on the research conducted on controls from
five different manufacturers from 2003 to 2008:
(1) During the first four studies, NIOSH researchers collected personal breathing zone samples by hanging personal sampling pumps and sampling media on operators and ground crew from multiple manufacturers of cold-milling machines
with water-flow dust suppression controls operated at normal and maximum water flow rates. When using water-flow dust suppression, personal breathing zone
sampling results for respirable crystalline silica varied dramatically by manufacturer, by study site, and within study site. Between 2004 and 2006, 56 personal breathing zone samples of respirable crystalline silica exposures were
collected at four different highway sites from four different milling machines. Three of the 12 personal breathing zone samples from the 2004 study in Wisconsin were
below the limit of detection and the remaining nine ranged from 0.04 to 0.17 milligrams (mg) of respirable crystalline silica per cubic meter (m3) of air [Echt et al. 2007]. Five of the 12 personal breathing zone samples from the 2006 study in
Minnesota were below the limit of detection while the remaining 7 samples ranged from 0.02 to 0.06 mg/m3 [Blade et al. 2006a]. All 22 personal breathing zone
samples from the 2006 testing in South Dakota were below the limit of detection [Blade et al. 2009b]. The 10 personal breathing zone samples from the 2006 study in New York ranged from 0.016 to 0.36 mg/m3 [Blade et al. 2009c].
(2) In addition to evaluating worker exposures using personal breathing zone
sampling, controls were evaluated by measuring the reduction in respirable dust in area samples mounted to the cold-milling machines of five manufacturers. Between 2003 and 2008, testing of water-spray dust suppression controls indicated
that raising the water flow rate of the milling-machine water-spray systems from the “normal” rate to the maximum rate did not consistently reduce respirable dust
concentrations by an appreciable and statistically significant amount. The data revealed appreciable reductions in some cases but not in others.
(3) The local exhaust ventilation control tested in 2008 resulted in the largest reduction in respirable dust concentrations of approximately 60% when compared
to the baseline respirable dust concentration on the same machine [Blade et al. 2011].
After the 2008 testing at the Marquette, MI airport runway [Blade et al. 2011], the Silica/Milling-Machines Partnership members decided to conduct another large study in 2010 to further optimize controls to reduce emissions of respirable dust
and crystalline silica. The 2010 study included participation from five major

Page 4
manufacturers representing the majority of the U.S. market share for asphalt pavement milling and the results are summarized in this report.
Occupational Exposure Limits and Health Effects
As a guide to the evaluation of the hazards posed by workplace exposures, NIOSH investigators use mandatory and recommended OELs when evaluating chemical, physical, and biological agents in the workplace. Generally, OELs suggest levels of
exposure to which most workers may be exposed up to 10 hours per day, 40 hours per week for a working lifetime without experiencing adverse health effects. It is,
however, important to note that not all workers will be protected from adverse health effects even though their exposures are maintained below these levels. A
small percentage may experience adverse health effects because of individual susceptibility, a pre-existing medical condition, and/or hypersensitivity (allergy). In addition, some hazardous substances may act in combination with other workplace
exposures, the general environment, or with medications or personal habits of the worker to produce health effects even if the occupational exposures are controlled
at the level set by the exposure limit. Combined effects are often not considered in the OEL. Also, some substances are absorbed by direct contact with the skin and mucous membranes, and thus can increase the overall exposure. Finally, OELs may
change over the years as new information on the toxic effects of an agent become available.
Most OELs are expressed as a TWA exposure. A TWA exposure refers to the average airborne concentration of a substance during a normal 8- to 10-hour
workday. Some substances have recommended STEL or ceiling values which are intended to supplement the TWA where there are recognized toxic effects from
higher exposures over the short-term.
In the U.S., OELs have been established by Federal agencies, professional
organizations, state and local governments, and other entities. The U.S. Department of Labor OSHA Permissible Exposure Limits (PELs) [29 CFR 1910.1000] are occupational exposure limits that are legally enforceable in covered workplaces
under the Occupational Safety and Health Act. NIOSH recommendations are based on a critical review of the scientific and technical information available on the
prevalence of health effects, the existence of safety and health risks, and the adequacy of methods to identify and control hazards [NIOSH 1992]. They have
been developed using a weight of evidence approach and formal peer review process. Other OELs that are commonly used and cited in the U.S. include the Threshold Limit Values (TLVs®) recommended by American Conference of
Governmental Industrial Hygienists (ACGIH®), a professional organization [ACGIH® 2010]. ACGIH® TLVs® are considered voluntary guidelines for use by industrial
hygienists and others trained in this discipline “to assist in the control of health hazards.” Workplace Environmental Exposure Limits (WEELs) are recommended OELs developed by the American Industrial Hygiene Association (AIHA), another
professional organization. WEELs have been established for some chemicals “when no other legal or authoritative limits exist.” [AIHA 2007].

Page 5
OSHA requires an employer to furnish employees a place of employment that is free from recognized hazards that are causing or are likely to cause death or
serious physical harm [Occupational Safety and Health Act of 1970, Public Law 91–596, sec. 5(a)(1)]. Thus, employers are required to comply with OSHA PELs. Some
hazardous agents do not have PELs, however, and for others, the PELs do not reflect the most current health-based information. Thus, NIOSH investigators encourage employers to consider the other OELs in making risk assessment and
risk management decisions to best protect the health of their employees. NIOSH investigators also encourage the use of the traditional hierarchy of controls
approach to eliminating or minimizing identified workplace hazards. This includes, in preferential order, the use of: (1) substitution or elimination of the hazardous agent, (2) engineering controls (e.g., local exhaust ventilation, process enclosure,
dilution ventilation) (3) administrative controls (e.g., limiting time of exposure, employee training, work practice changes, medical surveillance), and (4) personal
protective equipment (e.g., respiratory protection, gloves, eye protection, hearing protection).
Occupational Exposure to Crystalline Silica
Silicosis is an occupational respiratory disease caused by inhaling respirable
crystalline-silica dust. Silicosis is irreversible, often progressive (even after exposure has ceased), and potentially fatal. Because no effective treatment exists
for silicosis, prevention through exposure control is essential. Exposure to respirable crystalline silica dust occurs in many occupations, including construction. Crystalline silica refers to a group of minerals composed of chemical compounds
containing the elements silicon and oxygen; a crystalline structure is one in which the molecules are arranged in a repeating three-dimensional pattern [Bureau of
Mines 1992]. The three major forms of crystalline silica are quartz, cristobalite, and tridymite; quartz is the most common form [Bureau of Mines 1992]. Respirable refers to that portion of airborne crystalline silica that is capable of entering the
gas-exchange regions of the lungs if inhaled; this includes particles with aerodynamic diameters less than approximately 10 micrometers (μm) [NIOSH
2002].
When proper practices are not followed or controls are inadequate or not
maintained, respirable crystalline silica exposures can exceed the NIOSH Recommended Exposure Limit (REL), the OSHA PEL, or the ACGIH® TLV® [NIOSH
2002; 29 CFR 1910.1000 and 29 CFR 1926.55; ACGIH® 2009]. The NIOSH REL is 0.05 mg/m3, for a full-workshift time-weighted average exposure, for up to a 10-hour workday during a 40-hour workweek. This level is intended to minimize
exposed workers’ risks of developing silicosis, lung cancer, and other adverse health effects.
The OSHA general-industry PEL for airborne respirable dust containing 1% or more crystalline silica is expressed as an equation. For quartz, the following equation
applies [29 CFR 1910.1000]:

Page 6
10 mg/m3 Respirable PEL =
% Silica + 2
If, for example, the dust contains no crystalline silica, the PEL for an 8-hour time-weighted average exposure is 5 mg/m3; if the dust is 100% crystalline silica, the PEL is 0.1 mg/m3. For cristobalite and tridymite, the PELs are each one half the
value obtained with the above equation [29 CFR 1910.1000]. When more than one of these three forms of crystalline silica are present, the additive mixture formula in
29 CFR 1900.1000 must be applied to the individually determined PELs.
In contrast to the general-industry PEL, the construction-industry PEL for airborne
respirable dust which contains crystalline silica is based upon measurements made with impinger sampling and particle counting, and is expressed in millions of
particles per cubic foot (mppcf) of air in accordance with the following formula [29 CFR 1926.55]:
250 mppcf Respirable PEL =
% Silica + 5
The “Mineral Dusts” table in 29 CFR 1926.55 specifies the above equation to
determine the PEL for 8-hour time-weighted average exposures to quartz. No limits are specified in the table for other forms of crystalline silica such as cristobalite or tridymite. Since the PELs were adopted, impinger sampling and
particle-counting methodology has been rendered obsolete by respirable size-selective sampling and gravimetric analysis such as that used to determine
compliance with the general-industry PEL for silica, and the latter is the only methodology currently available to OSHA compliance personnel [OSHA 2008]. To allow for comparison of gravimetric results reported in mg/m3 with the mppcf PEL in
29 CFR 1926.55, OSHA has further specified that a conversion factor of 0.1 mg/m3 per 1 mppcf should be applied to the results of gravimetric respirable-dust samples
[OSHA 2008].
The ACGIH® TLV® for airborne respirable crystalline silica, including both quartz and
cristobalite, is 0.025 mg/m3 for an 8-hour time-weighted average exposure [ACGIH® 2009].
Methodology
Performance testing of the prototype dust-emission controls was conducted in August 2010 for five manufacturers’ milling machines on a closed road, State Highway 47, Bonduel, Wisconsin. Each manufacturer modified a large, new or late-
model milling machine to allow testing of multiple dust-suppression and emission-control systems on a single machine. The emission-controls systems tested
included a “baseline” or existing production configuration and at least one and as many as six modified, prototype “test” configurations, depending on the milling machine manufacturer.
Page 7
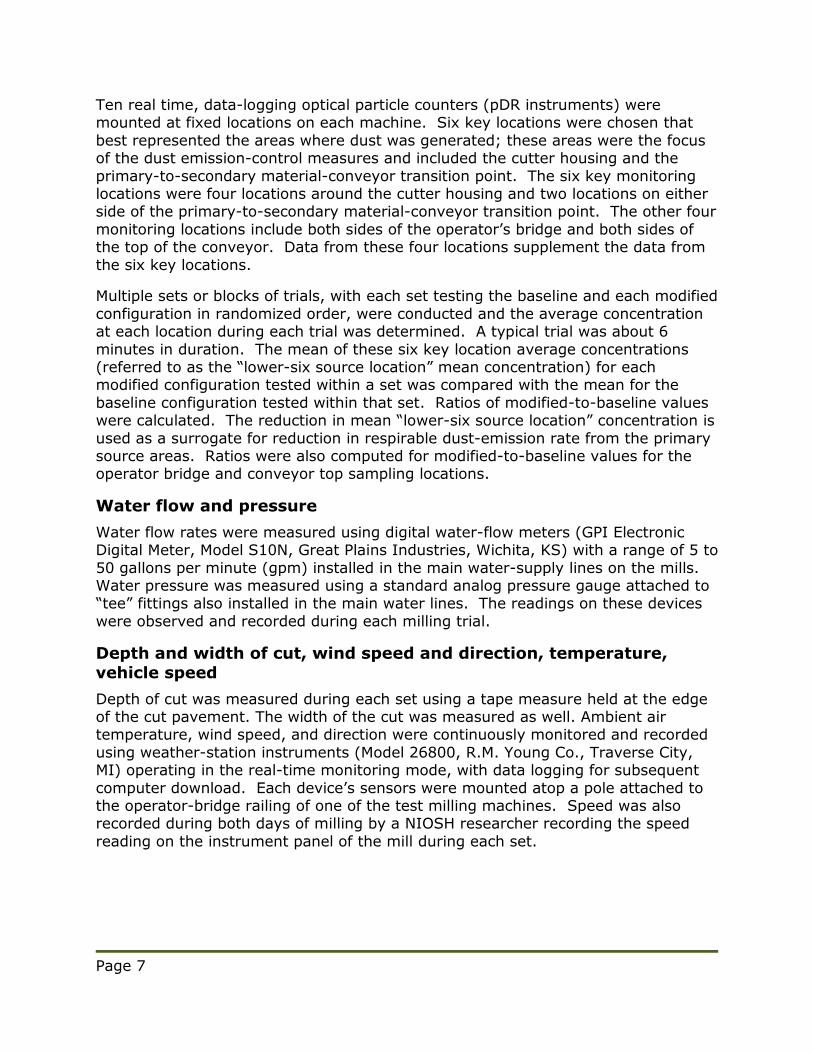
Ten real time, data-logging optical particle counters (pDR instruments) were mounted at fixed locations on each machine. Six key locations were chosen that
best represented the areas where dust was generated; these areas were the focus of the dust emission-control measures and included the cutter housing and the
primary-to-secondary material-conveyor transition point. The six key monitoring locations were four locations around the cutter housing and two locations on either side of the primary-to-secondary material-conveyor transition point. The other four
monitoring locations include both sides of the operator’s bridge and both sides of the top of the conveyor. Data from these four locations supplement the data from
the six key locations.
Multiple sets or blocks of trials, with each set testing the baseline and each modified
configuration in randomized order, were conducted and the average concentration at each location during each trial was determined. A typical trial was about 6
minutes in duration. The mean of these six key location average concentrations (referred to as the “lower-six source location” mean concentration) for each modified configuration tested within a set was compared with the mean for the
baseline configuration tested within that set. Ratios of modified-to-baseline values were calculated. The reduction in mean “lower-six source location” concentration is
used as a surrogate for reduction in respirable dust-emission rate from the primary source areas. Ratios were also computed for modified-to-baseline values for the operator bridge and conveyor top sampling locations.
Water flow and pressure
Water flow rates were measured using digital water-flow meters (GPI Electronic Digital Meter, Model S10N, Great Plains Industries, Wichita, KS) with a range of 5 to
50 gallons per minute (gpm) installed in the main water-supply lines on the mills. Water pressure was measured using a standard analog pressure gauge attached to “tee” fittings also installed in the main water lines. The readings on these devices
were observed and recorded during each milling trial.
Depth and width of cut, wind speed and direction, temperature,
vehicle speed
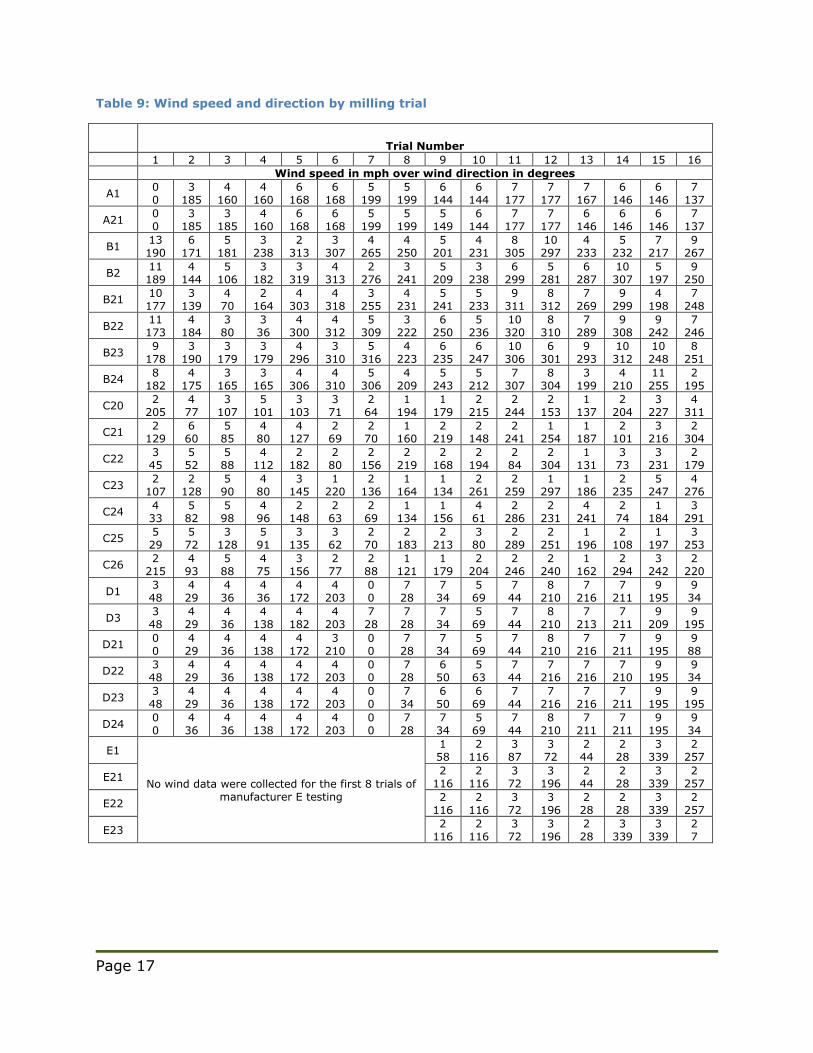
Depth of cut was measured during each set using a tape measure held at the edge of the cut pavement. The width of the cut was measured as well. Ambient air temperature, wind speed, and direction were continuously monitored and recorded
using weather-station instruments (Model 26800, R.M. Young Co., Traverse City, MI) operating in the real-time monitoring mode, with data logging for subsequent
computer download. Each device’s sensors were mounted atop a pole attached to the operator-bridge railing of one of the test milling machines. Speed was also recorded during both days of milling by a NIOSH researcher recording the speed
reading on the instrument panel of the mill during each set.

Page 8
Respirable-dust and crystalline-silica air-sampling measurements
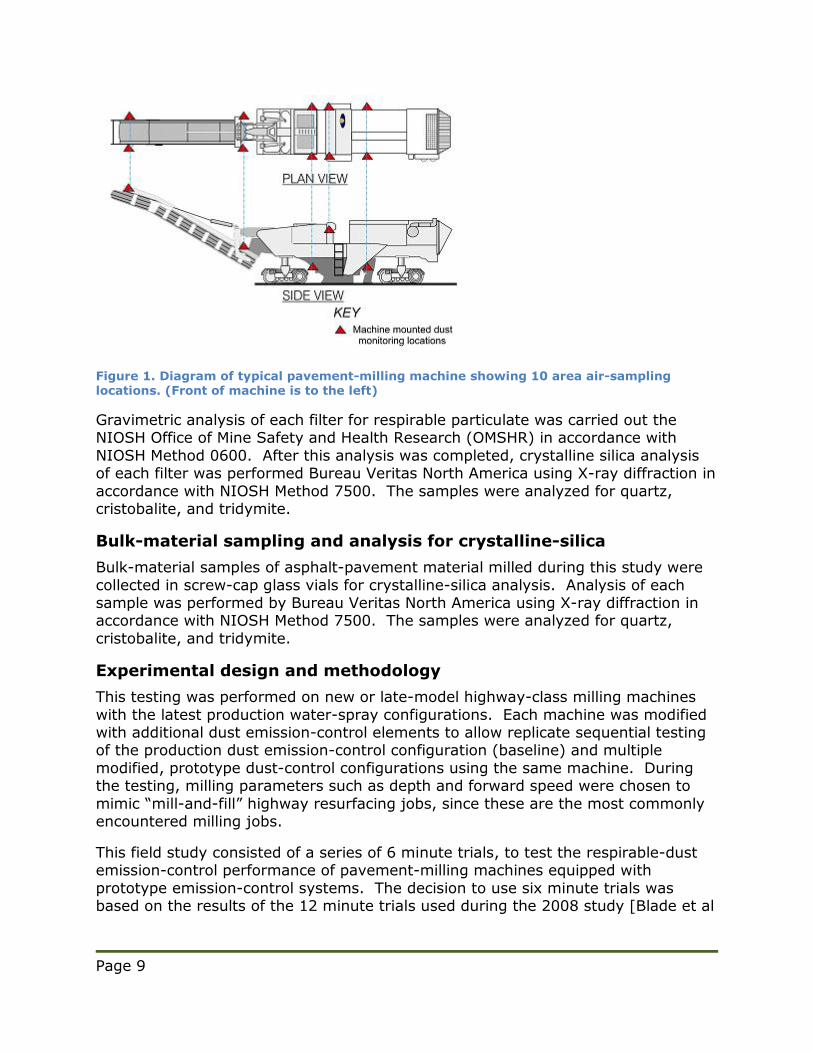
During all milling trials, area air samples for respirable dust and crystalline silica were collected at ten locations on the milling machine, using an array of instruments mounted on a metal frame at each location. The locations were on the
railings on both sides of the operator’s platform, near the front and the rear of the cutter-drum housing on both sides of the mill, on both sides near the transition
from the primary conveyor to the secondary conveyor, and on both sides at the top of the secondary-conveyor boom near the discharge of the secondary conveyor into the trucks. These locations are shown in Figure 1. The sampling instruments in
each array included a light-scattering aerosol photometer (pDR, Model 1000, MIE, Inc., Bedford, MA) operated in the passive-sampling, real-time monitoring mode,
with data logging at 10-second-intervals for subsequent computer download.
Also included in each sampling array at each of the ten sampling locations were two
air-sampling assemblies for the collection of time-integrated respirable-dust samples. Each sampler assembly consisted of a battery-operated sampling pump
(Escort Elf Pump, Mine Safety Appliances Company, Pittsburgh, PA) connected through flexible tubing to a sampling head consisting of a standard 10-mm, nylon, respirable size-selective cyclone followed by a pre-weighed, 37-mm diameter, 5
micron (µm) pore-size polyvinyl chloride filter supported by a backup pad in a two-piece filter cassette sealed with a cellulose shrink band, in accordance with NIOSH
Methods 0600 and 7500 [NIOSH 1994]. Each sampling pump drew air at a nominal air-flow rate of 1.7 liters per minute (L/min) through the cyclone and filter assembly. Actual air-flow rates were measured before and after each day of
testing, and flow rates adjusted to the nominal rate as needed. The primary purpose of these area samples was to measure the time-integrated respirable-dust
concentration and the quartz content of the respirable dust for each sampling location for each entire day. The mean of the resulting two respirable-dust concentrations was used to establish the corrected mean for all respirable-dust
concentration measurements on that day from the pDR instrument at that location. This allowed a correction factor to be determined that was then applied to each
respirable-dust concentration measurement from that instrument on that day. The secondary purpose of these samples is to determine the crystalline-silica content of the airborne respirable dust at each location for each full day.
Page 9
Figure 1. Diagram of typical pavement-milling machine showing 10 area air-sampling locations. (Front of machine is to the left)
Gravimetric analysis of each filter for respirable particulate was carried out the NIOSH Office of Mine Safety and Health Research (OMSHR) in accordance with
NIOSH Method 0600. After this analysis was completed, crystalline silica analysis of each filter was performed Bureau Veritas North America using X-ray diffraction in
accordance with NIOSH Method 7500. The samples were analyzed for quartz, cristobalite, and tridymite.
Bulk-material sampling and analysis for crystalline-silica
Bulk-material samples of asphalt-pavement material milled during this study were
collected in screw-cap glass vials for crystalline-silica analysis. Analysis of each sample was performed by Bureau Veritas North America using X-ray diffraction in accordance with NIOSH Method 7500. The samples were analyzed for quartz,
cristobalite, and tridymite.
Experimental design and methodology
This testing was performed on new or late-model highway-class milling machines
with the latest production water-spray configurations. Each machine was modified with additional dust emission-control elements to allow replicate sequential testing of the production dust emission-control configuration (baseline) and multiple
modified, prototype dust-control configurations using the same machine. During the testing, milling parameters such as depth and forward speed were chosen to
mimic “mill-and-fill” highway resurfacing jobs, since these are the most commonly encountered milling jobs.
This field study consisted of a series of 6 minute trials, to test the respirable-dust emission-control performance of pavement-milling machines equipped with
prototype emission-control systems. The decision to use six minute trials was based on the results of the 12 minute trials used during the 2008 study [Blade et al

Page 10
2011]. Analysis of the results from the 2008 study indicated that when the ratio (test configuration /baseline) for a 12-minute trial was small (less than 0.4), there
was a similarly small ratio for the first six minutes of that trial.
During each trial, one of the emission-control systems was operated while the machine milled a section of asphalt pavement, and respirable-dust concentrations were measured at ten locations (described above in the measurement methods
description) around the machine being tested. Five milling machines were evaluated from Manufacturers A, B, C, D and E during the study which was
conducted in August of 2010. Tests conducted with a given machine were grouped into sets, each of which included one trial to evaluate each configuration, conducted in randomized order within the set.
Control Technology
Description of tested dust-emission control configurations
All production milling machines are equipped with water-spray systems to cool the cutting teeth and suppress dust, and most of the modified test configurations involved additional spray nozzles and/or variations in water pressures and flows.
Manufacturer D also tested a prototype local exhaust-ventilation system to produce negative static pressure in the cutter housing and the discharge area from the
housing to the primary conveyor. The mill from Manufacturer A was tested with the mill’s existing, baseline configuration and one modified test configuration. The mills from Manufacturers B and D were each tested with the mill’s baseline configuration
plus five modified configurations. The mill from Manufacturer C was tested with the mill’s baseline configuration plus six modified configurations. The mill from
Manufacturer E was tested with the mill’s baseline configuration plus three modified configurations. Tables 1 through 5 summarizes each manufacturer’s modified test
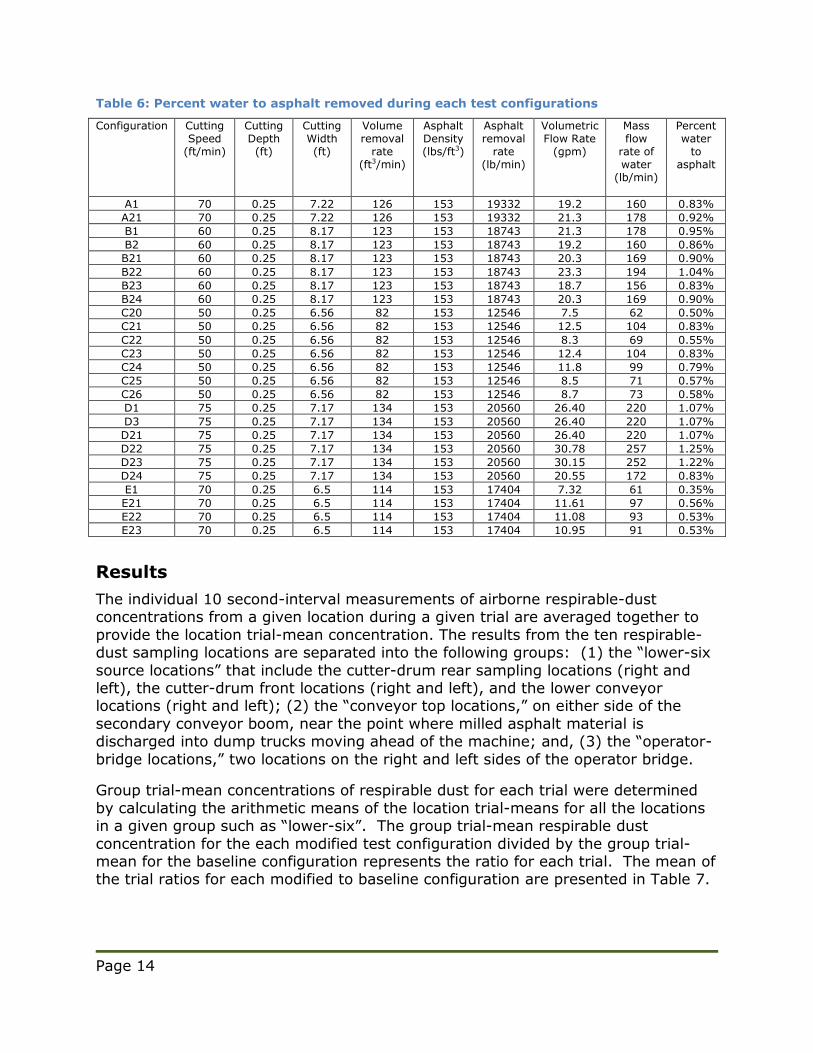
configurations and how they differed from their standard-production, or baseline, configurations. Table 6 summarizes cutting speed, depth, width, removal rate, water flow rate, and percent water to asphalt removed by weight during each
configuration for all five evaluated milling machines.

Page 11
Table 1: Manufacturer A spray configurations
Location Number of Nozzles
Nozzle Model Spray Type
Spray Angle
Flow per Nozzle
Total Flow
Configuration A1 (Baseline configuration)
Drum Housing
Primary Transition
Secondary Transition
20
2 2
UniJet* PU-11003-SS
UniJet TPU-11003-SS
UniJet TPU-11003-SS
flat
flat
flat
123° @ 200 psi
123° @ 200 psi
123° @ 200 psi
0.91 GPM @ 362 PSI
0.91 GPM @ 362 PSI
0.91 GPM @
362 PSI
18.2 GPM @ 362 PSI
1.82 GPM @ 362 PSI
1.82 GPM @
362 PSI
Configuration A21
Drum Housing
Primary
Transition
Secondary Transition
10 2
2
UniJet TG-SS-10SQ
UniJet TG-SS-
14W
UniJet TG-SS-
14W
square
wide
angle
cone wide angle cone
66° @ 20 PSI
120° @
10 PSI
120° @ 10 PSI
1.5 GPM @ 23 PSI
2 GPM @ 23
PSI
2 GPM @ 23
PSI
15 GPM @ 23 PSI
4 GPM @ 23
PSI
4 GPM @ 23
PSI
*Spraying Systems Co. manufacturers UniJet model nozzles
Table 2: Manufacturer B spray configurations
Location # of Sprays
Nozzle Model*
Spray Type
Spray Angle
Flow per Nozzle
System status for each configuration
B1 B2 B21 B22 B23 B24
Rear Drum Housing
Front
Drum
Housing
*Primary Transition
Primary
Conveyor
(middle)
Primary Conveyor (upper)
Primary
Conveyor (top)
11 5
2 4
2 1
QHA-10SQ
QHA-10
QHA-14W
QHA-10SQ
1/4GGA-14W
QHA-
14W
square
solid
cone
solid cone
square
wide angle cone
solid
cone
67° @ 20 psi
67° @
20 psi
120° @ 10 PSI
67° @ 20 psi
120° @ 10 PSI
120°
@ 10 PSI
1.5 GPM @ 23 psi
1.5 GPM
@ 23 psi
2 GPM @ 24 PSI
1.5 GPM @ 23 psi
2 GPM @ 23 PSI
2 GPM
@ 24 PSI
On
On
On -
- -
On -
On -
On -
On -
On -
On
On
On -
On
On
On
On
On -
- -
On
On
On -
On -
On
On
*The two nozzles at the primary transition were replaced for every B1 (baseline configuration) test with two model QHA-10 solid cone nozzles with a spray angle of 67° @ 20 psi and a flow per nozzle of 1.5 GPM @ 23 psi.
**Spraying Systems Co. manufacturers QHA and GGA model number nozzles.

Page 12
Table 3: Manufacturer C spray configurations
Location # of Sprays
Nozzle Model*
Spray Type
Spray Angle
Flow per
Nozzle
System status for each configuration
C20 C21 C22 C23 C24 C25 C26
Drum Housing A
Drum
Housing B
Primary Conveyor
Primary
Transition
Secondary
Transition
18
33
2 2
4
QVVA-6503
QVVA-
6503
1/4LN-14
QVVA-50015
QVVA-
50015
flat
flat
cone
flat
flat
72° @ 80 psi
72° @
80 psi
88° @ 80 psi
58° @ 80 psi
58° @
80 psi
0.42 gpm @ 80 psi 0.42
gpm @ 80 psi 0.30
gpm @ 80 psi 0.21
gpm @
80 psi 0.21
gpm @ 80 psi
On -
- -
-
-
On
On
On
On
On -
- -
On
-
On
On
On
On
-
On
-
On
On
On -
-
On
On
On -
On -
On
*Spraying Systems Co. manufactures all QVVA and LN model number nozzles
Table 4: Manufacturer D spray configurations
Location # of Sprays
Nozzle Model*
Spray Type
Spray Angle
Flow per Nozzle
System status for each configuration
D1 D3 D21 D22 D23 D24
Drum Housing A
Drum
Housing B
Primary
Transition A
Primary
Transition B
Secondary Transition A
Secondary
Transition B
12
12
2
2
1 1
TG-SS10W
TG-
SS10W
1/8GG2.
8W
1/8GG2.
8W
1/8GG2.8W
1/8GG2.
8W
full cone
full
cone
full
cone
full
cone
full cone
full
cone
103° @ 80 PSI
103° @ 80 PSI
102° @ 80 PSI
102° @ 80 PSI
102° @ 80 PSI
102° @ 80 PSI
2.2 gpm @ 60 psi
2.4 gpm @ 75 psi
0.66 gpm @ 70 psi
0.45 gpm @ 30 psi
0.66 gpm @ 70 psi
0.45 gpm @ 30 psi
On -
-
-
- -
On -
-
-
- -
On -
-
-
- -
-
On
On
-
On -
-
On
-
On
-
On
-
On
-
On
-
On
LEV low setting
LEV
medium setting
1000 ACFM
1500 ACFM
- -
On -
-
On
- -
- -
- -
*Spraying Systems Co. manufactured all nozzle model numbers listed in this table

Page 13
Table 5: Manufacturer E spray configurations
Location Number of Nozzles
Nozzle Model*
Spray Type Spray Angle Flow per Nozzle Total Flow
Configuration E1 (baseline configuration)
Drum Housing
Transition
Primary Conveyor
Secondary
Conveyor
12
4 4 4
QVVA-8008
30 HCX8 Grey
(Hypro) 30-
05F80LB (Hypro) 30 HCX8
Grey (Hypro)
Flat Fan
Hollow Cone
Flat Fan
Hollow Cone
80° @ 40 psi
80° @ 40 psi
80° @ 40
psi
80° @ 40
psi
0.84 GPM @ 45 PSI
0.156 GPM @ 55 PSI
0.46 GPM @ 35
PSI
0.34 GPM @ 10
PSI
10 GPM @ 45 PSI
0.62 GPM @ 55 PSI
1.84 GPM @ 35 PSI
1.36 GPM
@ 10 PSI
Configuration E21
Wet Drum
Transition
Primary Conveyor
Secondary Conveyor
-
4 4
4
-
30 HCX8 Grey
(Hypro) 30-
05F80LB
(Hypro) 30 HCX8
Grey (Hypro)
Wet Drum
Hollow Cone
Flat Fan
Hollow Cone
-
80° @ 40 psi
80° @ 40
psi
80° @ 40
psi
7.9 GPM @ 70
PSI
0.149 GPM @ 50 PSI
0.43 GPM @ 30
PSI
0.34 GPM @ 10
PSI
7.9 GPM @
70 PSI
0.596 GPM @ 50 PSI
1.72 GPM @ 30 PSI
1.36 GPM @ 10 PSI
Configuration E22
Wet Drum
Primary
Conveyor
Secondary Conveyor
-
4
4
-
30-
05F80LB (Hypro)
30 HCX8 Grey
(Hypro)
Wet Drum
Flat Fan
Hollow Cone
-
80° @ 40
psi
80° @ 40 psi
8 GPM @ 70 PSI
0.43 GPM @ 30
PSI
0.34 GPM @ 10 PSI
8 GPM @ 70 PSI
1.72 GPM @ 30 PSI
1.36 GPM @ 10 PSI
Configuration E23
Wet Drum
- - Wet Drum
- 10.95 GPM @ 70 PSI
10.95 GPM @ 70 PSI
*Spraying Systems Co. manufactured all nozzle model numbers listed in this table
Page 14
Table 6: Percent water to asphalt removed during each test configurations
Configuration Cutting Speed
(ft/min)
Cutting Depth (ft)
Cutting Width (ft)
Volume removal
rate (ft3/min)
Asphalt Density (lbs/ft3)
Asphalt removal
rate (lb/min)
Volumetric Flow Rate
(gpm)
Mass flow
rate of water
(lb/min)
Percent water
to asphalt
A1 70 0.25 7.22 126 153 19332 19.2 160 0.83%
A21 70 0.25 7.22 126 153 19332 21.3 178 0.92%
B1 60 0.25 8.17 123 153 18743 21.3 178 0.95%
B2 60 0.25 8.17 123 153 18743 19.2 160 0.86%
B21 60 0.25 8.17 123 153 18743 20.3 169 0.90%
B22 60 0.25 8.17 123 153 18743 23.3 194 1.04%
B23 60 0.25 8.17 123 153 18743 18.7 156 0.83%
B24 60 0.25 8.17 123 153 18743 20.3 169 0.90%
C20 50 0.25 6.56 82 153 12546 7.5 62 0.50%
C21 50 0.25 6.56 82 153 12546 12.5 104 0.83%
C22 50 0.25 6.56 82 153 12546 8.3 69 0.55%
C23 50 0.25 6.56 82 153 12546 12.4 104 0.83%
C24 50 0.25 6.56 82 153 12546 11.8 99 0.79%
C25 50 0.25 6.56 82 153 12546 8.5 71 0.57%
C26 50 0.25 6.56 82 153 12546 8.7 73 0.58%
D1 75 0.25 7.17 134 153 20560 26.40 220 1.07%
D3 75 0.25 7.17 134 153 20560 26.40 220 1.07%
D21 75 0.25 7.17 134 153 20560 26.40 220 1.07%
D22 75 0.25 7.17 134 153 20560 30.78 257 1.25%
D23 75 0.25 7.17 134 153 20560 30.15 252 1.22%
D24 75 0.25 7.17 134 153 20560 20.55 172 0.83%
E1 70 0.25 6.5 114 153 17404 7.32 61 0.35%
E21 70 0.25 6.5 114 153 17404 11.61 97 0.56%
E22 70 0.25 6.5 114 153 17404 11.08 93 0.53%
E23 70 0.25 6.5 114 153 17404 10.95 91 0.53%
Results
The individual 10 second-interval measurements of airborne respirable-dust concentrations from a given location during a given trial are averaged together to
provide the location trial-mean concentration. The results from the ten respirable-dust sampling locations are separated into the following groups: (1) the “lower-six
source locations” that include the cutter-drum rear sampling locations (right and left), the cutter-drum front locations (right and left), and the lower conveyor locations (right and left); (2) the “conveyor top locations,” on either side of the
secondary conveyor boom, near the point where milled asphalt material is discharged into dump trucks moving ahead of the machine; and, (3) the “operator-
bridge locations,” two locations on the right and left sides of the operator bridge.
Group trial-mean concentrations of respirable dust for each trial were determined
by calculating the arithmetic means of the location trial-means for all the locations in a given group such as “lower-six”. The group trial-mean respirable dust
concentration for the each modified test configuration divided by the group trial-mean for the baseline configuration represents the ratio for each trial. The mean of the trial ratios for each modified to baseline configuration are presented in Table 7.

Page 15
The group trial-mean respirable dust concentrations (mg/m3) for each individual trial are presented in Tables A1 through A5 of Appendix A.
Table 7: Group mean ratios of respirable dust concentrations for modified to baseline configurations, and lower and upper 95% confidence limits for the true ratio.
Lower6
Lower 95%CL
Upper 95%CL
Operator bridge
Lower 95%CL
Upper 95%CL
Conveyor top
Lower 95%CL
Upper 95%CL
A21/A1 1.56 1.14 1.95 0.95 0.66 1.14 1.39 0.93 1.59
B2/B1 1.07 0.61 1.58 1.05 0.56 1.46 1.15 0.63 1.68
B21/B1 1.05 0.59 1.54 0.90 0.48 1.25 0.85 0.47 1.26
B22/B1 1.10 0.63 1.62 0.93 0.54 1.40 1.07 0.51 1.36
B23/B1 1.35 0.77 2.01 1.36 0.75 1.93 1.31 0.62 1.67
B24/B1 1.50 0.84 2.17 1.46 0.78 2.01 1.73 0.96 2.58
C21/C20 1.02 0.66 1.43 1.00 0.62 1.34 0.73 0.46 1.00
C22/C20 0.95 0.63 1.36 0.98 0.60 1.29 0.98 0.60 1.31
C23/C20 0.92 0.61 1.31 0.95 0.58 1.26 0.79 0.46 1.00
C24/C20 1.03 0.66 1.43 0.92 0.56 1.22 0.84 0.47 1.02
C25/C20 1.19 0.76 1.65 0.89 0.56 1.21 0.81 0.41 0.89
C26/C20 1.05 0.69 1.49 0.97 0.63 1.36 0.82 0.52 1.12
D3/D1 0.31 0.20 0.47 0.35 0.20 0.49 2.86 1.64 3.91
D21/D1 0.19 0.10 0.25 0.23 0.12 0.30 1.84 0.90 2.14
D22/D1 0.87 0.53 1.26 1.28 0.58 1.43 1.06 0.57 1.35
D23/D1 0.93 0.58 1.38 1.02 0.56 1.36 0.98 0.57 1.36
D24/D1 0.97 0.61 1.45 1.15 0.61 1.49 1.05 0.57 1.36
E21/E1 0.98 0.57 1.64 0.99 0.51 1.57 0.88 0.38 1.08
E22/E1 0.72 0.42 1.20 0.56 0.29 0.90 1.27 0.51 1.50
E23/E1 0.68 0.39 1.11 0.41 0.22 0.67 1.29* 0.42 1.22 *Mean ratios are not always in between the lower and upper limits because the confidence limits are based on transformation of the data to the natural log scale; also, the “mean ratio” will differ depending on how the “mean” is calculated.
For the lower-six sampling locations, the local exhaust ventilation control resulted in the largest control to baseline reduction (reduction =1 – mean ratio, from Table
7) in mean respirable dust concentrations of any evaluated control configuration tested across all machines. The largest mean reduction in mean respirable dust
concentrations was 81% when comparing configuration D21 to configuration D1. Configuration D21 used a local exhaust ventilation control at a medium fan speed exhausting approximately 1500 acfm of air to capture dust and the baseline D1
configuration used water to cool the cutting teeth without any additional controls to suppress dust. The second largest reduction in respirable dust for the lower-six
sampling location was 69% and was measured during testing of configuration D3 compared to the D1 baseline configuration. The D3 configuration was the same local exhaust ventilation control as D21 operated at a low fan speed exhausting
approximately 1000 acfm of air. The reductions for the D21 and D3 compared to the baseline D1 were statistically significant and showed less variability in individual
respirable dust concentrations than all other evaluated configurations. The reductions in respirable dust concentrations at the lower-six sampling locations
were not statistically significant for any of the evaluated water spray configurations.

Page 16
For the operator bridge sampling location, the largest control to baseline reductions (reduction =1 – mean ratio, from Table 7) in mean respirable dust concentrations
of 77%, 65%, and 59% were statistically significant and occurred from the medium (D21) and low (D3) fan speed local exhaust ventilation configurations and the E23
wet drum configuration when compared to their baseline configurations, respectively. No other evaluated configurations resulted in statistically significant reductions at the operator bridge with the exception of the E22 configuration, which
yielded a reduction of 44% when compared to the baseline E1 configuration.
The highest increase in mean respirable dust concentrations of any control to baseline configurations were 286% (D3/D1) and 184% (D21/D1) configurations at the conveyor top sampling locations. The local exhaust ventilation configurations
exhausted air at the top of the secondary conveyor at the location where the asphalt is transferred into the back of a truck away from any worker locations.
Bulk-material samples analyzed for crystalline silica
Five bulk-material samples of asphalt-pavement material milled during this study
were collected for crystalline-silica analysis. These bulk-material samples contained 8.6%, 7.6%, 4.8%, 4.3%, and 1.8% quartz. All crystalline silica detected in the
bulk-material samples was quartz; the samples were scanned for cristobalite and tridymite at the primary diffraction angle and none was detected. The established instrument limit of detection was 0.5% for each of the crystalline forms, quartz,
cristobalite, and tridymite.
Estimated crystalline-silica content of airborne respirable dust
Table 8 summarizes the mean crystalline-silica percentages measured in respirable
dust samples by machine manufacturer. No tridymite was detected in any of the samples. All results for each manufacturer are included, and for each crystalline-silica sample-mass result reported as “less than the LOD” – indicating a non-
detectable (ND) concentration of crystalline silica – an estimated concentration was substituted using the method of Hornung and Reed [1990]. This method suggests
using an estimated sample mass equal to the LOD divided by the square root of 2 (LOD/√2). These criteria also state that that if the number of results reported as ND exceeds 50% of the total within a group of samples, then it is best not to
compute averages for that group.
Table 8: Mean crystalline-silica percentages in respirable dust
Manufacturer % Quartz*
% Cristobalite**
% Crystalline
Silica
Number of samples with
Quartz
Number of samples with
Cristobalite
number of samples
A 2.3% 0% 2.3% 17 0 20
B 2.5% 0.1% 2.6% 53 6 60
C 2.5% 0.3% 2.8% 45 16 59
D 2.1% 0.1% 2.2% 33 8 40
E 2.5% 0.1% 2.6% 34 6 40 *The mean % quartz was calculated using the method of Hornung and Reed [1990] **The mean % cristobalite was calculated using zero for each “ND” result instead of Hornung and Reed
Page 17
Table 9: Wind speed and direction by milling trial
Trial Number
1 2 3 4 5 6 7 8 9 10 11 12 13 14 15 16
Wind speed in mph over wind direction in degrees
A1 0 0
3 185
4 160
4 160
6 168
6 168
5 199
5 199
6 144
6 144
7 177
7 177
7 167
6 146
6 146
7 137
A21 0 0
3 185
3 185
4 160
6 168
6 168
5 199
5 199
5 149
6 144
7 177
7 177
6 146
6 146
6 146
7 137
B1 13 190
6 171
5 181
3 238
2 313
3 307
4 265
4 250
5 201
4 231
8 305
10 297
4 233
5 232
7 217
9 267
B2 11 189
4 144
5 106
3 182
3 319
4 313
2 276
3 241
5 209
3 238
6 299
5 281
6 287
10 307
5 197
9 250
B21 10 177
3 139
4 70
2 164
4 303
4 318
3 255
4 231
5 241
5 233
9 311
8 312
7 269
9 299
4 198
7 248
B22 11 173
4 184
3 80
3 36
4 300
4 312
5 309
3 222
6 250
5 236
10 320
8 310
7 289
9 308
9 242
7 246
B23 9
178 3
190 3
179 3
179 4
296 3
310 5
316 4
223 6
235 6
247 10 306
6 301
9 293
10 312
10 248
8 251
B24 8
182 4
175 3
165 3
165 4
306 4
310 5
306 4
209 5
243 5
212 7
307 8
304 3
199 4
210 11 255
2 195
C20 2
205 4 77
3 107
5 101
3 103
3 71
2 64
1 194
1 179
2 215
2 244
2 153
1 137
2 204
3 227
4 311
C21 2
129 6 60
5 85
4 80
4 127
2 69
2 70
1 160
2 219
2 148
2 241
1 254
1 187
2 101
3 216
2 304
C22 3 45
5 52
5 88
4 112
2 182
2 80
2 156
2 219
2 168
2 194
2 84
2 304
1 131
3 73
3 231
2 179
C23 2
107 2
128 5 90
4 80
3 145
1 220
2 136
1 164
1 134
2 261
2 259
1 297
1 186
2 235
5 247
4 276
C24 4 33
5 82
5 98
4 96
2 148
2 63
2 69
1 134
1 156
4 61
2 286
2 231
4 241
2 74
1 184
3 291
C25 5 29
5 72
3 128
5 91
3 135
3 62
2 70
2 183
2 213
3 80
2 289
2 251
1 196
2 108
1 197
3 253
C26 2
215 4 93
5 88
4 75
3 156
2 77
2 88
1 121
1 179
2 204
2 246
2 240
1 162
2 294
3 242
2 220
D1 3 48
4 29
4 36
4 36
4 172
4 203
0 0
7 28
7 34
5 69
7 44
8 210
7 216
7 211
9 195
9 34
D3 3 48
4 29
4 36
4 138
4 182
4 203
7 28
7 28
7 34
5 69
7 44
8 210
7 213
7 211
9 209
9 195
D21 0 0
4 29
4 36
4 138
4 172
3 210
0 0
7 28
7 34
5 69
7 44
8 210
7 216
7 211
9 195
9 88
D22 3 48
4 29
4 36
4 138
4 172
4 203
0 0
7 28
6 50
5 63
7 44
7 216
7 216
7 210
9 195
9 34
D23 3 48
4 29
4 36
4 138
4 172
4 203
0 0
7 34
6 50
6 69
7 44
7 216
7 216
7 211
9 195
9 195
D24 0 0
4 36
4 36
4 138
4 172
4 203
0 0
7 28
7 34
5 69
7 44
8 210
7 211
7 211
9 195
9 34
E1
No wind data were collected for the first 8 trials of manufacturer E testing
1 58
2 116
3 87
3 72
2 44
2 28
3 339
2 257
E21 2
116 2
116 3 72
3 196
2 44
2 28
3 339
2 257
E22 2
116 2
116 3 72
3 196
2 28
2 28
3 339
2 257
E23 2
116 2
116 3 72
3 196
2 28
3 339
3 339
2 7

Page 18
Conclusions and Recommendations
A total of 18 water spray and two local exhaust ventilation control configurations were tested among five milling-machine manufacturers during the August 2010 testing. Only two of the 18 water spray configurations showed statistically
significant reductions in respirable dust concentrations compared to the baseline (E1) on the same machine. These were the E22 and E23 configurations which
resulted in mean reductions of 44% and 59%, respectively. The test results for the B1 water spray configuration did not result in any statistically significant reductions in respirable dust concentrations during this study even though the same B1
configuration yielded an estimated, statistically significant 55% reduction in respirable-dust concentrations at the lower-six locations compared to those for the
baseline configuration on the same mill during similar testing in Marquette, Michigan in 2008 [Blade et al. 2011].
Local exhaust ventilation controls resulted in larger reductions in respirable dust concentrations than any evaluated water spray control during both the 2008 and
2010 studies. Local exhaust ventilation controls resulted in reductions of about 60% during the 2008 testing, and 81% and 69% during the 2010 testing. Based on the results from this and previous studies, the NIOSH researchers recommend
optimization of local exhaust ventilation systems as the primary control method for reducing respirable crystalline silica during asphalt pavement milling. Additional
testing of the wet drum design is also recommended.
When designing a local exhaust ventilation system, designers should consider the
level of enclosure, the hood design, and the airflow capacity. The ideal approach is to maximize the level of enclosure to isolate and contain the release of dust.
Equipment manufacturers are strongly encouraged to identify and incorporate the maximum feasible level of enclosure in their engineering control designs. During the current evaluation of the local exhaust ventilation system, higher airflow
settings resulted in rocks being sucked into the local exhaust ventilation system. When designing hoods to transition between the duct and point of capture, larger
dimensions of the openings can slow capture velocity to prevent rocks from being drawn into the duct while maintaining the designed flow rate. Based on this evaluation, manufacturers should consider starting at approximately 1500 acfm and
higher for ventilation designs which will depend on the level of enclosure.
Once manufacturers have developed the local exhaust ventilation designs, these systems should be tested and optimized for capture efficiency in a factory/laboratory setting using smoke and tracer gas. Following the smoke and
tracer gas testing, field testing using respirable dust measurements should be conducted to verify field performance.

Page 19
References
ACGIH® [2010]. 2010 TLVs® and BEIs®: threshold limit values for chemical substances and physical agents and biological exposure indices. Cincinnati, OH: American Conference of Governmental Industrial Hygienists.
AIHA [2007]. 2007 Emergency Response Planning Guidelines (ERPG) & Workplace Environmental Exposure Levels (WEEL) Handbook. Fairfax, VA: American Industrial
Hygiene Association.
Akbar-Khanzadeh F, Brillhart RL [2002]. Respirable crystalline silica dust exposure during concrete finishing (grinding) using hand-held grinders in the construction
industry. Ann Occup Hyg 46(3):341–346.
Blade LM, Shulman SA, Colinet J, Chekan G, Garcia A [2009a]. In depth field
evaluation: dust-control technology for asphalt pavement milling, at U.S Highway 2 resurfacing project, Wilton, Minnesota, June 20 through 22, 2006. Cincinnati, OH:
U.S. Department of Health and Human Services, Public Health Service, Centers for Disease Control and Prevention, National Institute for Occupational Safety and Health. Report No. EPHB 282-15a.
Blade LM, Garcia A, Shulman SA, Colinet J, Chekan G [2009b]. In depth field evaluation: dust-control technology for asphalt pavement milling, at South Dakota
Highway 79 resurfacing project, Buffalo Gap, South Dakota, August 15 through 17, 2006. Cincinnati, OH: U.S. Department of Health and Human Services, Public Health Service, Centers for Disease Control and Prevention, National Institute for
Occupational Safety and Health. Report No. EPHB 282-14a.
Blade LM, Shulman SA, Garcia A, Marlow DA [2009c]. In depth field evaluation:
dust-control technology for asphalt pavement milling, at New York State Thruway (Interstate Highway 90) resurfacing project, Hamburg, New York, September 25 and 26, 2006. Cincinnati, OH: U.S. Department of Health and Human Services,
Public Health Service, Centers for Disease Control and Prevention, National Institute for Occupational Safety and Health. Report No. EPHB 282-16a.
Blade LM, Shulman SA, Cecala A, Chekan G, Zimmer J, Garcia A, Lo LM, Calahan J [2011]. Field Research Study: Dust Control Technology for Asphalt Pavement Milling Controlled-site testing at the site of the former Marquette County Airport,
Marquette, Michigan June and September 2008. Cincinnati, OH: U.S. Department of Health and Human Services, Public Health Service, Centers for Disease Control
and Prevention, National Institute for Occupational Safety and Health. Report No. EPHB 282-17a.
Bureau of Mines [1992]. Crystalline silica primer. Washington, DC: U.S. Department
of the Interior, Bureau of Mines, Branch of Industrial Minerals, Special Publication.

Page 20
CFR [2003]. 29 CFR 1926.55. Occupational Safety and Health Administration: gases, vapors, fumes, dusts, and mists.
CFR [2001]. 29 CFR 1910.1000. Code of Federal Regulations. Washington, DC: U.S. Government Printing Office, Office of the Federal Register.
Echt A, Shulman S, Colinet J, Goodman G [2004]. Results of a pilot study of dust control technology for asphalt milling, at Payne & Dolan, Inc., U.S. route 12 project, Wisconsin, October 7 through 9, 2003. Cincinnati, OH: U.S. Department of Health
and Human Services, Public Health Service, Centers for Disease Control and Prevention, National Institute for Occupational Safety and Health. Report No. EPHB
282-11b.
Echt A, Garcia A, Shulman S, Colinet J, Cecala A, Carlo RV, Zimmer J [2007]. In depth survey of dust control technology for asphalt milling, at Northeast Asphalt,
Inc., state routes 22 and 64 projects, Wisconsin, July 13 through 15, 2004. Cincinnati, OH: U.S. Department of Health and Human Services, Public Health
Service, Centers for Disease Control and Prevention, National Institute for Occupational Safety and Health. Report No. EPHB 282-12a.
Glindmeyer HW, Hammad YY [1988]. Contributing factors to sandblasters' silicosis:
inadequate respiratory protection equipment and standards. J Occup Med 30(12):917–921.
Hornung R, Reed L [1990]. Estimation of average concentration in the presence of nondetectable values. Appl Occup Environ Hyg 5(1):46–51.
Linch KD [2002]. Respirable concrete dust – silicosis hazard in the construction industry. Appl Occup Environ Hyg 17(3):209–221.
NIOSH [1992]. Recommendations for occupational safety and health: compendium
of policy documents and statements. Cincinnati, OH: U.S. Department of Health and Human Services, Public Health Service, Centers for Disease Control and
Prevention, National Institute for Occupational Safety and Health, DHHS (NIOSH) Publication No. 92-100.
NIOSH [1994]. NIOSH manual of analytical methods. 4th rev. ed., Eller PM, ed.
Cincinnati, OH: U.S. Department of Health and Human Services, Public Health Service, Centers for Disease Control and Prevention, National Institute for
Occupational Safety and Health. DHHS (NIOSH) Publication No. 94-113.
NIOSH [2000]. Respirable crystalline silica exposures during tuck pointing. Cincinnati, OH: U.S. Department of Health and Human Services, Public Health
Service, Centers for Disease Control and Prevention, National Institute for Occupational Safety and Health. DHHS (NIOSH) Publication No. 2000-113.

Page 21
NIOSH [2002]. NIOSH hazard review: health effects of occupational exposure to respirable crystalline silica. Cincinnati, OH: U.S. Department of Health and Human
Services, Centers for Disease Control and Prevention, National Institute for Occupational Safety and Health. DHHS (NIOSH) Publication No. 2002-129.
OSHA [2008]. Directive number CPL 03-00-007: National Emphasis Program – Crystalline silica. Effective date January 24, 2008. [http://www.osha.gov/OshDoc/Directive_pdf/CPL_03-00-007.pdf accessed on April
1, 2009]
Public Works [1995]. Pavement recycling. Public Works 126: April 15, 1995.
Rappaport SM, Goldberg M, Susi P, Herrick RF [2003]. Excessive exposure to silica in the U.S. construction industry. Ann Occup Hyg 47(2):111–122.
Thorpe A, Ritchie AS, Gibson MJ, Brown RC [1999]. Measurements of the
effectiveness of dust control on cut-off saws used in the construction industry. Ann Occup Hyg 43(7):443–456.
Valiante DJ, Schill DP, Rosenman KD, Socie E [2004]. Highway repair: a new silicosis threat. Am J Public Health 94(5):876–880.

Page 22
Appendixes
Appendix A
Table A1: Manufacturer A mean respirable dust concentrations (mg/m3)
A1 A21
Trial Low
er
6
Opera
tor
Are
a
Conveyor
To
p
Low
er
6
Opera
tor
Are
a
Conveyor
To
p
1 2.65 1.78 1.24 3.28 1.55 1.66 2 2.07 1.28 2.21 3.24 1.30 2.47 3 2.26 1.23 0.72 3.11 2.28 2.38 4 1.82 1.30 2.22 2.19 1.15 1.11 5 1.47 1.51 0.57 1.54 0.88 1.06 6 0.89 1.34 0.67 1.53 0.59 0.60 7 1.26 1.46 0.39 1.39 0.59 0.54 8 0.96 0.87 0.40 1.63 0.94 0.90 9 0.97 0.50 0.38 1.90 0.76 1.01 10 0.74 0.49 0.53 1.64 0.49 0.57 11 1.03 0.69 0.80 1.19 0.52 0.59 12 0.37 0.41 0.42 0.96 0.34 0.34 13 0.56 0.57 0.46 0.97 0.61 0.32 14 0.76 0.75 0.40 0.86 0.38 0.50 15 0.61 0.70 0.39 0.63 0.58 0.26 16 0.98 0.81 0.47 2.13 1.29 0.79
Table A2: Manufacturer B mean respirable dust concentrations (mg/m3)
B1 B2 B21 B22 B23 B24
Trial Lo
wer
6
Op
erat
or
Are
a
Conv
eyo
r T
op
Lo
wer
6
Op
erat
or
Are
a
Conv
eyo
r T
op
Lo
wer
6
Op
erat
or
Are
a
Conv
eyo
r T
op
Lo
wer
6
Op
erat
or
Are
a
Conv
eyo
r T
op
Lo
wer
6
Op
erat
or
Are
a
Conv
eyo
r T
op
Lo
wer
6
Op
erat
or
Are
a
Conv
eyo
r T
op
1 1.76 1.02 0.33 1.75 0.94 0.44 4.73 0.98 0.29 3.90 1.00 1.51 4.31 1.27 0.91 3.79 1.56 1.28
2 2.92 1.10 0.40 2.30 0.98 0.50 1.45 0.57 0.22 4.44 1.88 0.41 6.85 2.10 0.52 4.89 1.49 1.11
3 3.24 2.12 0.14 3.06 1.68 0.16 4.50 1.16 1.84 5.53 1.20 2.95 5.66 2.25 2.72 8.96 5.23 4.63
4 6.63 3.63 2.40 6.81 3.77 3.53 7.17 2.08 3.71 6.31 2.58 2.63 5.07 2.56 2.79 4.33 2.61 2.64
5 3.53 1.27 1.77 4.16 1.28 2.34 2.92 0.88 1.49 2.69 1.52 2.10 3.94 1.53 2.40 6.10 2.33 2.74
6 4.07 1.38 2.15 3.48 1.52 2.37 3.48 1.98 2.71 3.08 1.44 3.01 5.12 2.52 3.23 3.40 2.33 2.76
7 3.14 0.77 1.64 2.73 0.84 1.85 3.01 0.98 2.52 6.57 1.21 2.36 4.37 2.25 2.96 3.85 1.67 2.32
8 2.96 1.18 1.17 3.45 1.03 0.84 2.36 1.69 1.36 3.31 1.36 1.17 3.88 2.87 2.07 5.10 2.23 2.08
9 1.86 1.14 0.63 3.14 1.28 1.47 2.36 0.55 0.27 2.59 0.84 0.76 3.48 2.02 1.96 2.40 1.54 1.67
10 1.41 1.58 0.84 2.72 0.99 1.34 3.32 0.98 1.27 1.61 0.65 0.68 1.24 0.94 0.92 1.32 0.48 0.59
11 0.46 0.11 0.22 0.84 0.20 0.41 0.45 0.10 0.10 0.62 0.08 0.14 1.08 0.13 0.31 1.44 0.33 0.74
12 1.39 0.42 1.10 1.69 0.87 1.44 1.12 0.28 0.75 0.93 0.37 0.84 2.31 0.72 1.74 0.90 0.18 0.69
13 3.07 0.74 2.09 2.00 1.20 1.57 1.39 1.64 1.84 1.33 0.87 0.97 2.03 0.69 0.67 7.55 1.56 5.22
14 2.86 1.41 2.10 1.37 0.34 0.59 1.09 0.99 0.98 0.88 1.05 0.68 1.36 0.72 0.43 3.32 1.24 2.06
15 2.61 0.52 1.55 2.68 0.61 0.99 2.23 0.50 0.44 1.60 0.45 0.15 1.48 0.52 0.16 1.37 0.37 0.24
16 3.55 1.30 1.98 1.48 0.31 0.43 2.33 0.36 0.60 1.61 0.49 0.17 2.50 0.83 0.46 3.76 1.12 2.57
Page 23
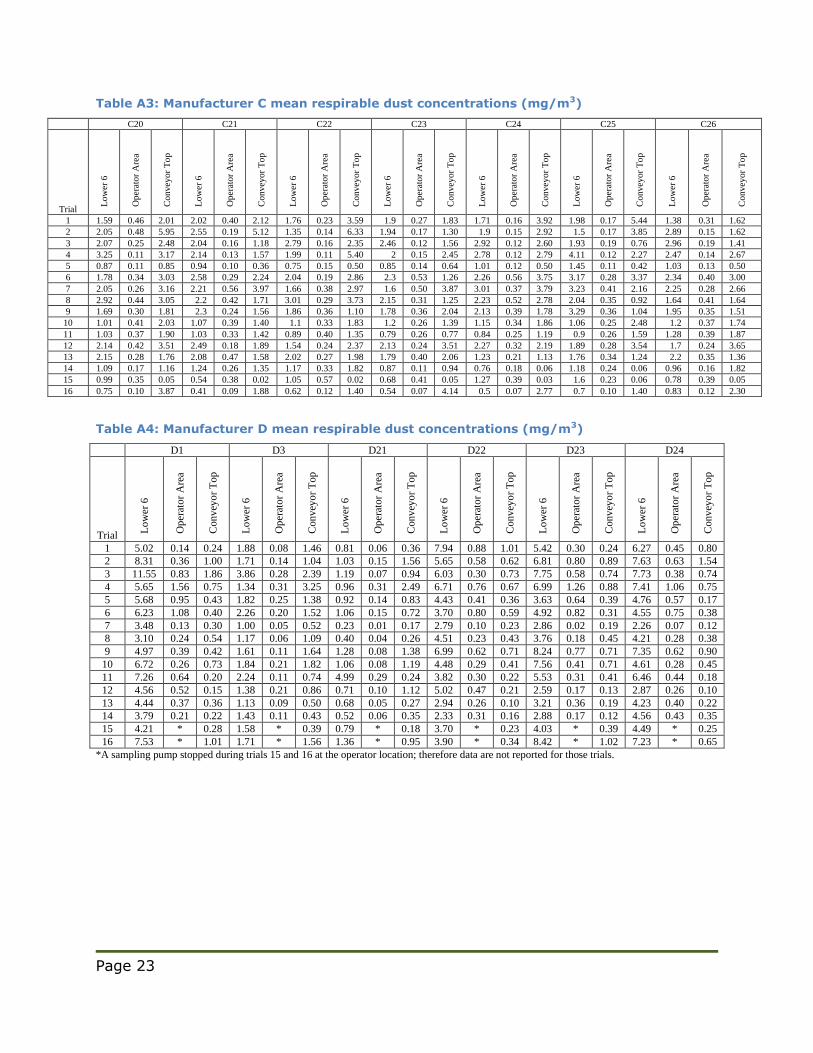
Table A3: Manufacturer C mean respirable dust concentrations (mg/m3)
C20 C21 C22 C23 C24 C25 C26
Trial
Low
er 6
Oper
ator
Are
a
Convey
or
To
p
Low
er 6
Oper
ator
Are
a
Convey
or
To
p
Low
er 6
Oper
ator
Are
a
Convey
or
To
p
Low
er 6
Oper
ator
Are
a
Convey
or
To
p
Low
er 6
Oper
ator
Are
a
Convey
or
To
p
Low
er 6
Oper
ator
Are
a
Convey
or
To
p
Low
er 6
Oper
ator
Are
a
Convey
or
To
p
1 1.59 0.46 2.01 2.02 0.40 2.12 1.76 0.23 3.59 1.9 0.27 1.83 1.71 0.16 3.92 1.98 0.17 5.44 1.38 0.31 1.62
2 2.05 0.48 5.95 2.55 0.19 5.12 1.35 0.14 6.33 1.94 0.17 1.30 1.9 0.15 2.92 1.5 0.17 3.85 2.89 0.15 1.62
3 2.07 0.25 2.48 2.04 0.16 1.18 2.79 0.16 2.35 2.46 0.12 1.56 2.92 0.12 2.60 1.93 0.19 0.76 2.96 0.19 1.41
4 3.25 0.11 3.17 2.14 0.13 1.57 1.99 0.11 5.40 2 0.15 2.45 2.78 0.12 2.79 4.11 0.12 2.27 2.47 0.14 2.67
5 0.87 0.11 0.85 0.94 0.10 0.36 0.75 0.15 0.50 0.85 0.14 0.64 1.01 0.12 0.50 1.45 0.11 0.42 1.03 0.13 0.50
6 1.78 0.34 3.03 2.58 0.29 2.24 2.04 0.19 2.86 2.3 0.53 1.26 2.26 0.56 3.75 3.17 0.28 3.37 2.34 0.40 3.00
7 2.05 0.26 3.16 2.21 0.56 3.97 1.66 0.38 2.97 1.6 0.50 3.87 3.01 0.37 3.79 3.23 0.41 2.16 2.25 0.28 2.66
8 2.92 0.44 3.05 2.2 0.42 1.71 3.01 0.29 3.73 2.15 0.31 1.25 2.23 0.52 2.78 2.04 0.35 0.92 1.64 0.41 1.64
9 1.69 0.30 1.81 2.3 0.24 1.56 1.86 0.36 1.10 1.78 0.36 2.04 2.13 0.39 1.78 3.29 0.36 1.04 1.95 0.35 1.51
10 1.01 0.41 2.03 1.07 0.39 1.40 1.1 0.33 1.83 1.2 0.26 1.39 1.15 0.34 1.86 1.06 0.25 2.48 1.2 0.37 1.74
11 1.03 0.37 1.90 1.03 0.33 1.42 0.89 0.40 1.35 0.79 0.26 0.77 0.84 0.25 1.19 0.9 0.26 1.59 1.28 0.39 1.87
12 2.14 0.42 3.51 2.49 0.18 1.89 1.54 0.24 2.37 2.13 0.24 3.51 2.27 0.32 2.19 1.89 0.28 3.54 1.7 0.24 3.65
13 2.15 0.28 1.76 2.08 0.47 1.58 2.02 0.27 1.98 1.79 0.40 2.06 1.23 0.21 1.13 1.76 0.34 1.24 2.2 0.35 1.36
14 1.09 0.17 1.16 1.24 0.26 1.35 1.17 0.33 1.82 0.87 0.11 0.94 0.76 0.18 0.06 1.18 0.24 0.06 0.96 0.16 1.82
15 0.99 0.35 0.05 0.54 0.38 0.02 1.05 0.57 0.02 0.68 0.41 0.05 1.27 0.39 0.03 1.6 0.23 0.06 0.78 0.39 0.05
16 0.75 0.10 3.87 0.41 0.09 1.88 0.62 0.12 1.40 0.54 0.07 4.14 0.5 0.07 2.77 0.7 0.10 1.40 0.83 0.12 2.30
Table A4: Manufacturer D mean respirable dust concentrations (mg/m3)
D1 D3 D21 D22 D23 D24
Trial
Lo
wer
6
Op
erat
or
Are
a
Conv
eyo
r T
op
Lo
wer
6
Op
erat
or
Are
a
Conv
eyo
r T
op
Lo
wer
6
Op
erat
or
Are
a
Conv
eyo
r T
op
Lo
wer
6
Op
erat
or
Are
a
Conv
eyo
r T
op
Lo
wer
6
Op
erat
or
Are
a
Conv
eyo
r T
op
Lo
wer
6
Op
erat
or
Are
a
Conv
eyo
r T
op
1 5.02 0.14 0.24 1.88 0.08 1.46 0.81 0.06 0.36 7.94 0.88 1.01 5.42 0.30 0.24 6.27 0.45 0.80
2 8.31 0.36 1.00 1.71 0.14 1.04 1.03 0.15 1.56 5.65 0.58 0.62 6.81 0.80 0.89 7.63 0.63 1.54
3 11.55 0.83 1.86 3.86 0.28 2.39 1.19 0.07 0.94 6.03 0.30 0.73 7.75 0.58 0.74 7.73 0.38 0.74
4 5.65 1.56 0.75 1.34 0.31 3.25 0.96 0.31 2.49 6.71 0.76 0.67 6.99 1.26 0.88 7.41 1.06 0.75
5 5.68 0.95 0.43 1.82 0.25 1.38 0.92 0.14 0.83 4.43 0.41 0.36 3.63 0.64 0.39 4.76 0.57 0.17
6 6.23 1.08 0.40 2.26 0.20 1.52 1.06 0.15 0.72 3.70 0.80 0.59 4.92 0.82 0.31 4.55 0.75 0.38
7 3.48 0.13 0.30 1.00 0.05 0.52 0.23 0.01 0.17 2.79 0.10 0.23 2.86 0.02 0.19 2.26 0.07 0.12
8 3.10 0.24 0.54 1.17 0.06 1.09 0.40 0.04 0.26 4.51 0.23 0.43 3.76 0.18 0.45 4.21 0.28 0.38
9 4.97 0.39 0.42 1.61 0.11 1.64 1.28 0.08 1.38 6.99 0.62 0.71 8.24 0.77 0.71 7.35 0.62 0.90
10 6.72 0.26 0.73 1.84 0.21 1.82 1.06 0.08 1.19 4.48 0.29 0.41 7.56 0.41 0.71 4.61 0.28 0.45
11 7.26 0.64 0.20 2.24 0.11 0.74 4.99 0.29 0.24 3.82 0.30 0.22 5.53 0.31 0.41 6.46 0.44 0.18
12 4.56 0.52 0.15 1.38 0.21 0.86 0.71 0.10 1.12 5.02 0.47 0.21 2.59 0.17 0.13 2.87 0.26 0.10
13 4.44 0.37 0.36 1.13 0.09 0.50 0.68 0.05 0.27 2.94 0.26 0.10 3.21 0.36 0.19 4.23 0.40 0.22
14 3.79 0.21 0.22 1.43 0.11 0.43 0.52 0.06 0.35 2.33 0.31 0.16 2.88 0.17 0.12 4.56 0.43 0.35
15 4.21 * 0.28 1.58 * 0.39 0.79 * 0.18 3.70 * 0.23 4.03 * 0.39 4.49 * 0.25
16 7.53 * 1.01 1.71 * 1.56 1.36 * 0.95 3.90 * 0.34 8.42 * 1.02 7.23 * 0.65
*A sampling pump stopped during trials 15 and 16 at the operator location; therefore data are not reported for those trials.
Page 24
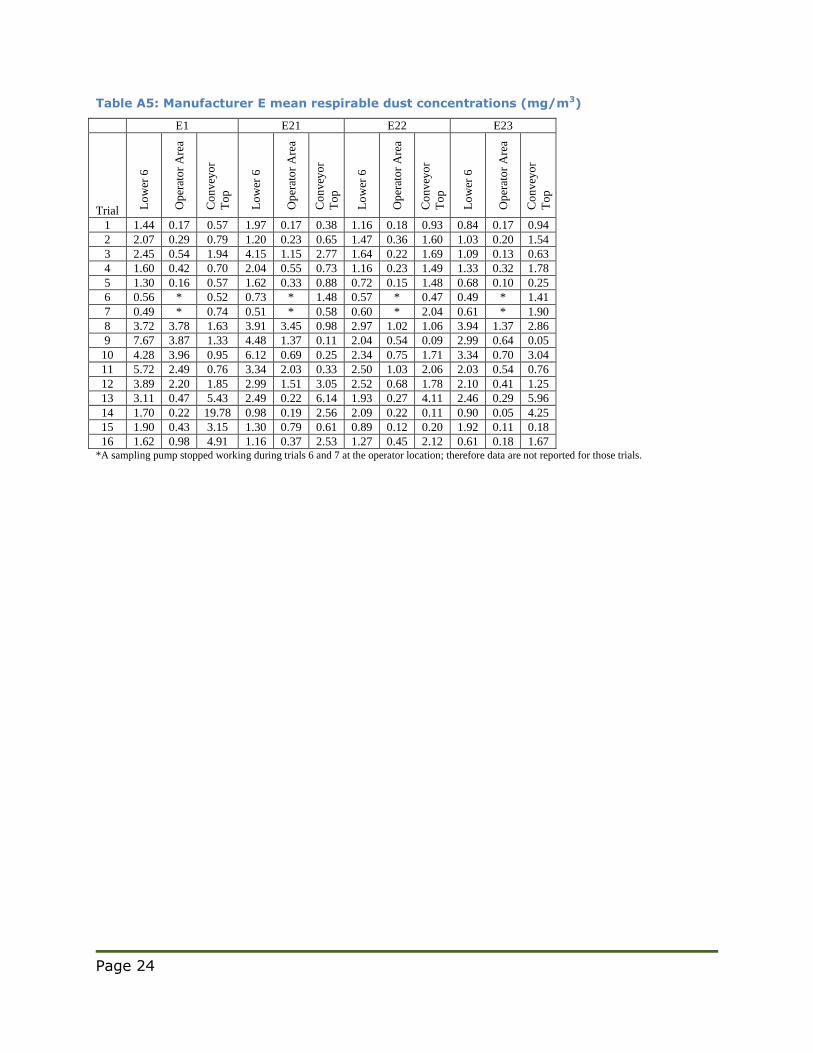
Table A5: Manufacturer E mean respirable dust concentrations (mg/m3)
E1 E21 E22 E23
Trial Lo
wer
6
Op
erat
or
Are
a
Co
nv
eyo
r
To
p
Lo
wer
6
Op
erat
or
Are
a
Co
nv
eyo
r
To
p
Lo
wer
6
Op
erat
or
Are
a
Co
nv
eyo
r
To
p
Lo
wer
6
Op
erat
or
Are
a
Co
nv
eyo
r
To
p
1 1.44 0.17 0.57 1.97 0.17 0.38 1.16 0.18 0.93 0.84 0.17 0.94
2 2.07 0.29 0.79 1.20 0.23 0.65 1.47 0.36 1.60 1.03 0.20 1.54
3 2.45 0.54 1.94 4.15 1.15 2.77 1.64 0.22 1.69 1.09 0.13 0.63
4 1.60 0.42 0.70 2.04 0.55 0.73 1.16 0.23 1.49 1.33 0.32 1.78
5 1.30 0.16 0.57 1.62 0.33 0.88 0.72 0.15 1.48 0.68 0.10 0.25
6 0.56 * 0.52 0.73 * 1.48 0.57 * 0.47 0.49 * 1.41
7 0.49 * 0.74 0.51 * 0.58 0.60 * 2.04 0.61 * 1.90
8 3.72 3.78 1.63 3.91 3.45 0.98 2.97 1.02 1.06 3.94 1.37 2.86
9 7.67 3.87 1.33 4.48 1.37 0.11 2.04 0.54 0.09 2.99 0.64 0.05
10 4.28 3.96 0.95 6.12 0.69 0.25 2.34 0.75 1.71 3.34 0.70 3.04
11 5.72 2.49 0.76 3.34 2.03 0.33 2.50 1.03 2.06 2.03 0.54 0.76
12 3.89 2.20 1.85 2.99 1.51 3.05 2.52 0.68 1.78 2.10 0.41 1.25
13 3.11 0.47 5.43 2.49 0.22 6.14 1.93 0.27 4.11 2.46 0.29 5.96
14 1.70 0.22 19.78 0.98 0.19 2.56 2.09 0.22 0.11 0.90 0.05 4.25
15 1.90 0.43 3.15 1.30 0.79 0.61 0.89 0.12 0.20 1.92 0.11 0.18
16 1.62 0.98 4.91 1.16 0.37 2.53 1.27 0.45 2.12 0.61 0.18 1.67 *A sampling pump stopped working during trials 6 and 7 at the operator location; therefore data are not reported for those trials.

Page 25
Appendix B (Statistical Appendix)
Examination of the data indicates that manufacturer D had the highest baseline respirable dust concentrations compared to the other four manufacturers. Manufacturer D also had the largest reductions in respirable dust concentrations
using the local exhaust ventilation control. Further statistical analysis was performed to determine whether the large reductions measured for manufacturer D
were due to the higher baseline respirable dust concentrations.
The minimum baseline lower six respirable dust concentration for manufacturer D was 3.1 mg/m3. There were seven sets each for manufacturers B and E for which
the baseline lower six average exceeded 3.1 mg/m3 as shown in Table B1. For Manufacturer D, the most effective configuration had a mean ratio of 0.19 relative
to the baseline respirable dust concentration, compared to 0.55 for manufacturer E’s most effective configuration and 0.85 for manufacturer B’s most effective configuration. In addition, if manufacturer D baseline measurements are limited to
the range 3.1-5 mg/m3 (seven measurements), the ratio of D21 to baseline is 0.16. Therefore, there is no evidence that the presence of relatively high baseline
respirable dust measurements were the reason for the larger reductions in respirable dust concentrations.
Table B1: Comparison of reductions at higher baseline respirable dust levels
Manufacturer Number of
samples
Baseline values mg/m3
Mean ratio to baseline for most
effective configuration
average (min, max)
D, all data 16 5.78 (3.1,11.6) 0.19
D , 3.1mg/m3<baseline mean<5mg/m3 7 4.1 (3.1,4.97) 0.16
B, baseline mean>3.1mg/m3 7 3.9 (3.1,6.63) 0.85
E 6 4.7 (3.1,7.7) 0.55
There is also interest in comparing the reductions by dividing the lower-six locations
into two groups: the two sampling locations near the transition between the primary and secondary conveyor versus the four locations surrounding the drum housing. In Table B2 below the averages for the baseline are shown for these two
groups. The values in Table B2 show the large difference between the two baseline means for manufacturer D: 14.8 mg/m3 for the conveyor transition average
respirable dust concentration versus 1.3 mg/m3 for the drum housing average respirable dust concentration. Higher respirable dust concentration at the conveyor transition locations contributed to the higher lower-six average baseline respirable
dust concentrations measured for manufacturer D. However, the ratios of the best configurations to baseline do not change sufficiently to alter any conclusions. Only
D21 (and D3) have average ratios less than 0.5 and D21’s ratio differs very little between conveyor and drum housing within the lower-six. Also manufacturer D has
the lowest average at the four drum housing sample locations (1.3 mg/m3), again

Page 26
supporting the idea that small ratios associated with D21 and D3 are independent of baseline dust concentration levels.
Table B2: Baseline lower-six average by conveyor transition and drum housing grouping
Manufacturer Average
Conveyor Transition,
mg/m3
Average
Drum Housing mg/m3
Conveyor
data: ratio to
baseline for
best configuration
Drum
Housing data:
ratio to
baseline for best
configuration
Average
ratio of best configuration
for
combined data
A 0.8 1.4 1.1(A2) 1.7(A2) 1.6(A21)
B 1.8 3.4 1.3(B21) 0.9(B21) 1.1(B21)
C 2.1 1.6 0.8(C22) 0.8(C23) 0.9(C23),
1.0(C22)
D 14.8 1.3 0.2(D21) 0.2(D21) 0.2(D21)
E 1.4 3.4 1.3(E23) 0.6(E23) 0.7 (E23)

Delivering on the Nation’s promise:
Safety and health at work for all people
through research and prevention.
To receive NIOSH documents or other information about
occupational safety and health topics, contact NIOSH at
1-800-CDC-INFO (1-800-232-4636)
TTY: 1-888-232-6348
E-mail: [email protected]
or visit the NIOSH Web site at www.cdc.gov/niosh
For a monthly update on news at NIOSH, subscribe to NIOSH eNews by visiting www.cdc.gov/niosh/eNews
SAFER ● HEALTHIER ● PEOPLE