in accessing the attached base prospectus supplement … accessing the attached base prospectus...
TRANSCRIPT

192819-3-22-v2.0 70-40619915
IMPORTANT NOTICE
In accessing the attached base prospectus supplement (the "Supplement") you agree to be bound by
the following terms and conditions.
The information contained in the Supplement may be addressed to and/or targeted at persons who are
residents of particular countries only as specified in the Base Prospectus (as defined in the Supplement)
and is not intended for use, and should not be relied upon, by any person outside those countries. Prior
to relying on the information contained in the Supplement, you must ascertain from the Base
Prospectus whether or not you are an intended addressee of, and eligible to view, the information
contained therein.
The Supplement and the Base Prospectus do not constitute, and may not be used in connection with, an
offer to sell or the solicitation of an offer to buy securities in the United States or any other jurisdiction in
which such offer, solicitation or sale would be unlawful prior to registration, exemption from registration
or qualification under the securities law of any such jurisdiction.
The securities described in the Supplement and the Base Prospectus have not been and will not be
registered under the United States Securities Act of 1933, as amended (the "Securities Act"), or with any
securities regulatory authority of any state or other jurisdiction of the united states and may include notes
in bearer form that are subject to U.S. tax law requirements. Subject to certain exceptions, such securities
may not be offered, sold or delivered within the United States or to, or for the account or benefit of, U.S.
persons (as defined in Regulation S under the Securities Act ("Regulation S")). The securities described
in the Supplement and the Base Prospectus will only be offered in offshore transactions to non-U.S.
persons in reliance upon Regulation S.
For a more complete description of restrictions on offers and sales of the securities described in the
Supplement and the Base Prospectus, see pages ii to vii and the section "Subscription and Sale" in the
Base Prospectus.

192819-3-22-v2.0 - 2- 70-40619915
VIKTIG INFORMATION
När du tar del av detta tillägg till grundprospekt ("Tilläggsprospektet") godtar du att bli bunden av
följande villkor.
Informationen i detta Tilläggsprospekt kan vara adresserad till och/eller riktad till personer som bor i
särskilda länder som endast anges i Grundprospektet (såsom definierat i Tilläggsprospektet) och är inte
avsedd för användning och ska inte förlitas på av någon person utanför de länderna. Innan du förlitar
dig på innehållet i detta Tilläggsprospekt måste du säkerställa genom Grundprospektet att du är en
avsedd adressat av, och behörig att ta del av, informationen däri.
Tilläggsprospektet och Grundprospektet utgör inte, och får inte användas i samband med, ett erbjudande
att sälja eller en inbjudan att köpa värdepapper i USA eller i någon annan jurisdiktion i vilken ett sådant
erbjudande, inbjudan eller försäljning skulle vara olagligt utan registrering, ett undantag från registrering
eller kvalificering enligt annan bestämmelse under värdepapperslagarna i en sådan jurisdiktion.
De värdepapper som beskrivs i Tilläggsprospektet och i Grundprospektet har inte, och kommer inte, att
registreras i enlighet med U.S. Securities Act of 1933, såsom den har ändrats ("Securities Act"), eller vid
någon regulatorisk myndighet för värdepapper i någon stat eller annan jurisdiktion av de förenta staterna
och kan inkludera fysiska värdepapper som är föremål för krav enligt amerikansk skattelagstiftning. Med
förbehåll för vissa undantag, får värdepapperen inte erbjudas eller säljas direkt eller indirekt inom USA
eller till, för, eller till förmån för, U.S. Persons (såsom begreppet definieras i Regulation S i Securities Act
("Regulation S")). De värdepapper som beskrivs i Tilläggsprospektet och Grundprospektet kommer
endast erbjudas i offshore-transaktioner till personer som inte är U.S. Persons i enlighet med Regulation
S.
För en mer komplett beskrivning av restriktionerna för erbjudanden och försäljning av värdepapperen
som beskrivs i Tilläggsprospektet och Grundprospektet, se sidorna ii till vii och avsnittet "Teckning och
Försäljning" i Grundprospektet.

192819-3-22-v2.0 - 3- 70-40619915
SUPPLEMENT NO. 2 DATED 7 MARCH 2016 TO THE BASE PROSPECTUS
DATED 18 DECEMBER 2015
NORDEA BANK AB (PUBL) (Incorporated with limited liability in the Kingdom of Sweden)
NORDEA BANK FINLAND PLC (Incorporated with limited liability in the Republic of Finland)
€15,000,000,000
Structured Note Programme
This supplement no. 2 (the "Supplement") is supplemental to, and must be read in conjunction with, the
base prospectus dated 18 December 2015 and the base prospectus supplement dated 5 February 2016 (the
"Base Prospectus") prepared by Nordea Bank AB (publ) ("NBAB") and Nordea Bank Finland Plc
("NBF" and together with NBAB, the "Issuers") with respect to their €15,000,000,000 Structured Note
Programme (the "Programme") and constitutes a supplement for the purposes of Article 16 of Directive
2003/71/EC, as amended (the Prospectus Directive). Terms defined in the Base Prospectus have the same
meaning when used in this Supplement.
This Supplement has been approved by the Central Bank of Ireland (the "Central Bank"), as competent
authority under the Prospectus Directive. The Central Bank only approves this Supplement as meeting the
requirements imposed under Irish and European law pursuant to the Prospectus Directive.
The Issuers accept responsibility for the information contained in this Supplement. To the best of the
knowledge of the Issuers (having taken all reasonable care to ensure that such is the case) the information
contained in this Supplement is in accordance with the facts and does not omit anything likely to affect
the import of such information.
To the extent that there is any inconsistency between (a) any statements in or incorporated by reference
into this Supplement and (b) any statement in or incorporated by reference into the Base Prospectus, the
statements in this Supplement will prevail.
Save as disclosed in this Supplement, no other significant new factor, material mistake or inaccuracy
relating to information included in the Base Prospectus has arisen or been noted since the publication of
the Base Prospectus.
An investor which has agreed, prior to the date of publication of this Supplement, to purchase or
subscribe for Notes issued under the Programme may withdraw its acceptance before the end of the
working day 9 March 2016 in accordance with the Prospectus Directive.
This Supplement is drawn up in the English language. In case there is any discrepancy between the
English text and the Swedish text, the English text stands approved for the purposes of approval under the
Prospectus (Directive 2003/71/EC) Regulations 2005.
192819-3-22-v2.0 - 4- 70-40619915
AMENDMENTS TO THE BASE PROSPECTUS
With effect from the date of this Supplement, the information appearing in the Base Prospectus shall be
amended and/or supplemented in the manner described below.
NBAB ANNUAL REPORT 2015
On 16 February 2016, NBAB published its annual report for the year ending 31 December 2015 (the
"NBAB Annual Report 2015"). The NBAB Annual Report 2015 contains audited consolidated and
individual financial statements. By virtue of this Supplement, the audited consolidated income statement,
statement of comprehensive income, the balance sheet, the statement of changes in equity, the cash flow
statement, NBAB's audited individual income statement and balance sheet and the related notes of the
NBAB Annual Report 2015 are set out in Annex 1 hereto, and such annex forms part of this Supplement
and the Base Prospectus.
NBF ANNUAL REPORT 2015
On 26 February 2016, NBF published its annual report for the year ending 31 December 2015 (the "NBF
Annual Report 2015"). The NBF Annual Report 2015 contains audited consolidated and individual
financial statements of NBF. By virtue of this Supplement, the audited consolidated income statement,
statement of comprehensive income, the balance sheet, the statement of changes in equity, the cash flow
statement, NBF's audited individual income statement and balance sheet and the related notes of the NBF
Annual Report 2015 are set out in Annex 2 hereto, and such annex forms part of this Supplement and the
Base Prospectus.
VISA INC.'S PROPOSED ACQUISITION OF VISA EUROPE LTD.
Visa Inc. and Visa Europe Ltd. have announced an agreement for Visa Inc. to acquire Visa Europe Ltd.
The consideration includes EUR 16.5 billion, EUR 11.5 billion in cash and EUR 5 billion in preferred
stock convertible into Visa Inc. class A common stock, and a possible additional earn-out of maximum
EUR 4.7 billion payable no earlier than on the fourth anniversary of the closing of the transaction. The
transaction is subject to regulatory approvals and is expected to be closed in the second quarter 2016.
NBAB is a shareholder and member in Visa Europe Ltd. and expects to recognise a gain following the
closing of the transaction. The pre-tax gain is expected to be within the range EUR 90 million to EUR
130 million in cash, with an additional possible gain on preferred stock amounting to aroung 25 per cent.
of the cash portion. In addition NBAB will receive proceeds stemming from divested operations, in which
NBAB has claims that are not possible to quantify.
GENERAL INFORMATION
The third paragraph of the "General Information" section on page 641 of the Base Prospectus is deleted
and replaced by the following:
"3. Since 31 December 2015 the date to which the latest audited financial statements of each Issuer
were prepared, there has been no material adverse change in the prospects of NBAB, NBF or the
Nordea Group."
The fourth paragraph of the "General Information" section on page 641 of the Base Prospectus is
deleted and replaced by the following:
"4. Since 31 December 2015 the date to which the latest financial statements of each Issuer were
prepared, there has been no significant change in the financial or trading position of NBAB,
NBF or the Nordea Group."
UPDATE OF THE SUMMARY OF THE PROGRAMME
The Summary of the Programme in English and Swedish included in the Base Prospectus is updated in
Appendix 1 to this Supplement.

192819-3-22-v2.0 - 5- 70-40619915
SELECTED FINANCIAL INFORMATION
The Selected Financial Information sections relating to NBAB and NBF on pages 602-614 of the Base
Prospectus are deleted in their entirety and replaced with the updated Selected Financial Information in
Appendix 2 to this Supplement.

192819-3-22-v2.0 - 6- 70-40619915
TILLÄGGSPROSPEKT NR. 2 DATERAT 7 MARS 2016 TILL GRUNDPROSPEKTET
DATERAT 16 DECEMBER 2015
NORDEA BANK AB (PUBL) (Registrerat aktiebolag i Konungariket Sverige)
NORDEA BANK FINLAND PLC (Registrerat bolag i Republiken Finland med begränsat ansvar för aktieägarna)
€15 000 000 000
Program för Strukturerade Lån
Detta Tilläggsprospekt nr. 2 ("Tilläggsprospektet") är ett tillägg till, och måste läsas tillsammans med,
grundprospektet daterat den 18 december 2015 och tilläggsprospektet daterat 5 februari 2016
("Grundprospektet") utfärdat av Nordea Bank AB (publ) ("NBAB") och Nordea Bank Finland Plc
("NBF" och tillsammans med NBAB, "Emittenterna") för deras €15 000 000 000 Program för
Strukturerade Lån ("Programmet") och utgör ett tillägg i enlighet med Artikel 16 i direktiv 2003/71/EG,
såsom ändrat ("Prospektdirektivet"). Definierade termer i Grundprospektet har samma betydelse när de
används i detta Tilläggsprospekt.
Detta Tilläggsprospekt har godkänts av Irlands centralbank (En: Central Bank of Ireland)
("Centralbanken"), som behörig myndighet enligt Prospektdirektivet. Centralbanken godkänner endast
att Tilläggsprospektet uppfyller de krav som ställs enligt irländsk och europeisk lagstiftning i enlighet
med Prospektdirektivet.
Emittenterna är ansvariga för informationen i detta Tilläggsprospekt. Såvitt Emittenterna (som har
iakttagit all vederbörlig omsorg för att säkerställa att så är fallet) känner till, är informationen i detta
Tilläggsprospekt korrekt och utelämnar inte något som sannolikt skulle påverka innebörden av
information.
I den utsträckning det föreligger diskrepans mellan (a) information i, eller som är införlivad genom
hänvisning i, detta Tilläggsprospekt och (b) information i, eller som är införlivad genom hänvisning i,
Grundprospektet, ska informationen i detta Tilläggsprospekt äga företräde.
Förutom såsom informeras om i Tilläggsprospektet, har ingen annan betydelsefull ny omständighet,
väsentligt misstag eller felaktighet som relaterar till information i Grundprospektet uppstått eller noterats
sedan datumet för publicerandet av Grundprospektet.
En investerare som innan datumet för publicering av detta Tilläggsprospekt har gjort en anmälan om eller
på annat sätt samtyckt till köp eller teckning av Lån som omfattas av Programmet har rätt att återkalla sin
anmälan eller sitt samtycke till köp eller teckning innan slutet av arbetsdagen den 9 mars 2016, i enlighet
med Prospektdirektivet.
Detta Tilläggsprospekt är författat på engelska. För det fall att det finns någon diskrepans mellan den
engelska texten och den svenska texten, är det den engelska texten som är godkänd i enlighet med
förfarandet för godkännande under Prospectus (Directive 2003/71/EG) Regulations 2005.
192819-3-22-v2.0 - 7- 70-40619915
ÄNDRINGAR I GRUNDPROSPEKTET
Med effekt från datumet för detta Tilläggsprospekt, ska information i Grundprospektet ändras och/eller
kompletteras såsom beskrivs nedan.
NBAB ÅRSREDOVISNING 2015
Den 16 februari 2016 publicerade NBAB sin årsredovisning för året som slutade den 31 december 2015
("NBAB Årsredovisning 2015"). NBAB Årsredovisning 2015 innehåller reviderade konsoliderade och
individuella finansiella rapporter. Genom detta Tilläggsprospekt anges den reviderade konsoliderade
resultatrapporten, rapporten över totalresultat, balansräkningen, rapport över förändringar i eget kapital,
kassaflödesanalysen, NBAB:s individuella reviderade resultatrapport och balansräkning och de därtill
relaterade noterna i NBAB Årsredovisning 2015 i Annex 1 härtill, och denna utgör del av detta
Tilläggsprospekt och Grundprospektet.
NBF ÅRSREDOVISNING 2015
Den 26 februari 2016 publicerade NBF sin årsredovisning för året som slutade den 31 december 2015
("NBF Årsredovisning 2015"). NBF Årsredovisning 2015 innehåller reviderade konsoliderade och
individuella finansiella rapporter för NBF. Genom detta Tilläggsprospekt anges den reviderade
konsoliderade resultatrapporten, rapporten över totalresultat, balansräkningen, rapport över förändringar i
eget kapital, kassaflödesanalysen, NBF:s individuella reviderade resultatrapport och balansräkning och de
därtill relaterade noterna i NBF Årsredovisning 2015 i Annex 2 härtill, och denna utgör del av detta
Tilläggsprospekt och Grundprospektet.
TILLTÄNKT FÖRVÄRV AV VISA INC AV VISA EUROPE LTD
Visa Inc. och Visa Europe Ltd har tillkännagett att Visa Inc. avser att förvärva Visa Europe Ltd.
Köpeskillingen uppgår till 16,5 miljarder euro, av vilket 11,5 miljarder euro ska erläggas kontant och 5
miljarder euro i preferensaktier som kan omvandlas till stamaktier av serie A i Visa Inc. Därutöver kan en
tilläggsköpeskilling uppgående till 4,7 miljarder euro utgå, dock tidigast fyra kalenderår efter att
transaktionen stängt. Konkurrensanmälningar avseende förvärvet behöver göras och affären förväntas
slutföras under det andra kvartalet av 2016. NBAB är för närvarande aktieägare i Visa Europe Ltd. och
förväntas göra en vinst på försäljningen av aktierna i Visa Europe Ltd. Innan skatt förväntas vinsten vara
mellan 90-130 miljoner euro i kontanter, med en möjlig ytterligare vinst om ca 25 % av detta belopp
genom de preferensaktier man erhåller. Därutöver kommer NBAB att få ta del av intäkter från avyttringar
av affärsenheter gentemot vilka NBAB har fordringar som inte går att kvantifiera.
ALLMÄN INFORMATION
Den tredje punkten i avsnittet "Allmän Information" på sidan 641 i Grundprospektet raderas och ersätts
av följande:
"3. Sedan den 31 december 2015, vilket är det datum per vilket den senaste årsredovisningen för
respektive Emittent upprättades, har det inte inträffat någon väsentlig negativ förändring i
framtidsutsikterna för NBAB, NBF eller Nordeakoncernen."
Den fjärde punkten i avsnittet "Allmän Information" på sidan 641 i Grundprospektet raderas och ersätts
av följande:
"4. Sedan den 31 december 2015, vilket är det datum per vilket den senaste årsredovisningen för
respektive Emittent upprättades, har det inte inträffat någon väsentlig förändring av handels- eller
finansiella positionen för NBAB, NBF eller Nordeakoncernen."
UPPDATERING AV SAMMANFATTNINGEN AV PROGRAMMET
Sammanfattningen av Programmet på engelska och svenska i Grundprospektet är uppdaterad i Bilaga 1
till detta Tilläggsprospekt.

192819-3-22-v2.0 - 8- 70-40619915
UTVALD FINANSIELL INFORMATION
Avsnittet "Selected Financial Information" för NBAB och NBF på sidorna 602-614 i Grundprospektet
raderas i sin helhet och ersätts med den uppdaterade Selected Financial Information i Bilaga 2 till detta
Tilläggsprospekt.
192819-3-22-v2.0 - 9- 70-40619915
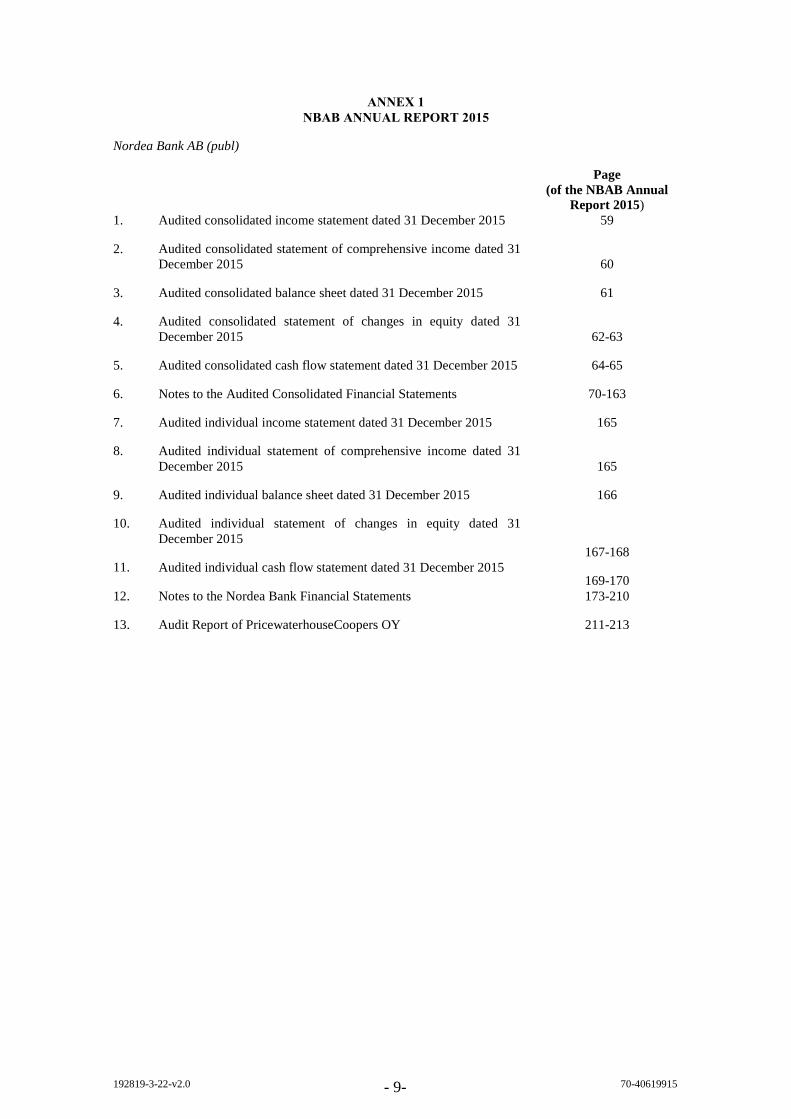
ANNEX 1
NBAB ANNUAL REPORT 2015
Nordea Bank AB (publ)
Page
(of the NBAB Annual
Report 2015)
1. Audited consolidated income statement dated 31 December 2015 59
2. Audited consolidated statement of comprehensive income dated 31
December 2015 60
3. Audited consolidated balance sheet dated 31 December 2015 61
4. Audited consolidated statement of changes in equity dated 31
December 2015 62-63
5. Audited consolidated cash flow statement dated 31 December 2015 64-65
6. Notes to the Audited Consolidated Financial Statements 70-163
7. Audited individual income statement dated 31 December 2015 165
8. Audited individual statement of comprehensive income dated 31
December 2015 165
9. Audited individual balance sheet dated 31 December 2015 166
10. Audited individual statement of changes in equity dated 31
December 2015 167-168
11. Audited individual cash flow statement dated 31 December 2015 169-170
12. Notes to the Nordea Bank Financial Statements 173-210
13. Audit Report of PricewaterhouseCoopers OY 211-213

Financial statements – Nordea Group
Nordea Annual Report 2015 59
EURm Note 2015 20141
Operating income
Interest income 8,549 9,995
Interest expense –3,439 –4,513
Net interest income G3 5,110 5,482
Fee and commission income 4,035 3,799
Fee and commission expense –1,010 –957
Net fee and commission income G4 3,025 2,842
Net result from items at fair value G5 1,703 1,425
Profit from associated undertakings accounted for under the equity method G18 39 18
Other operating income G6 263 474
Total operating income 10,140 10,241
Operating expenses
General administrative expenses:
Staff costs G7 –3,263 –3,159
Other expenses G8 –1,485 –1,656
Depreciation, amortisation and impairment charges of tangibleand intangible assets G9 –209 –585
Total operating expenses –4,957 –5,400
Profit before loan losses 5,183 4,841
Net loan losses G10 –479 –534
Operating profit 4,704 4,307
Income tax expense G11 –1,042 –950
Net profit for the year from continuing operations 3,662 3,357
Net profit for the year from discontinued operations, after tax G41 — –25
Net profit for the year 3,662 3,332
Attributable to:
Shareholders of Nordea Bank AB (publ) 3,662 3,332
Non-controlling interests — —
Total 3,662 3,332
1) During 2015 the scope of discontinued operations has changed and the IT-operations earlier classified as discontinued operations were reclassified to continuing operations which affected 2014.
Basic earnings per share, EUR – Total operations G12 0.91 0.83
Diluted earnings per share, EUR – Total operations G12 0.91 0.83
Basic earnings per share, EUR – Continuing operations G12 0.91 0.84
Diluted earnings per share, EUR – Continuing operations G12 0.91 0.84
Income statement, Group

Nordea Group – Financial statements
Nordea Annual Report 201560
Statement of comprehensive income, Group
EURm 2015 2014
Net profit for the year 3,662 3,332
Items that may be reclassified subsequently to the income statement
Currency translation differences during the year –544 –1,039
Hedging of net investments in foreign operations:
Valuation gains/losses during the year 308 435
Tax on valuation gains/losses during the year –68 –96
Available for sale investments1
Valuation gains/losses during the year –94 41
Tax on valuation gains/losses during the year 23 –8
Transferred to the income statement during the year –66 –1
Tax on transfers to the income statement during the year 14 0
Cash flow hedges:
Valuation gains/losses during the year 611 480
Tax on valuation gains/losses during the year –145 –105
Transferred to the income statement during the year –527 –449
Tax on transfers to the income statement during the year 126 98
Items that may not be reclassified subsequently to the income statement
Defined benefit plans:
Remeasurement of defined benefit plans during the year 483 –518
Tax on remeasurement of defined benefit plans during the year –108 120
Other comprehensive income, net of tax2 13 –1,042
Total comprehensive income 3,675 2,290
Attributable to:
Shareholders of Nordea Bank AB (publ) 3,675 2,290
Non-controlling interests — —
Total 3,675 2,290
1) Valuation gains/losses related to hedged risks under fair value hedge accounting are accounted for directly in the income statement.2) For 2014 EUR –12m is related to discontinued operations.

Financial statements – Nordea Group
Nordea Annual Report 2015 61
Balance sheet, Group
EURm Note 31 Dec 2015 31 Dec 2014
Assets
Cash and balances with central banks 35,500 31,067
Loans to central banks G13 13,224 6,958
Loans to credit institutions G13 10,959 12,217
Loans to the public G13 340,920 348,085
Interest-bearing securities G14 88,176 87,110
Financial instruments pledged as collateral G15 8,341 12,151
Shares G16 40,745 39,749
Derivatives G17 80,741 105,119
Fair value changes of the hedged items in portfolio hedge of interest rate risk 151 256
Investments in associated undertakings G18 515 487
Intangible assets G19 3,208 2,908
Properties and equipment 557 509
Investment properties G21 3,165 3,227
Deferred tax assets G11 76 130
Current tax assets 87 132
Retirement benefit assets G31 377 42
Other assets G22 18,600 17,581
Prepaid expenses and accrued income G23 1,526 1,614
Total assets 646,868 669,342
Liabilities
Deposits by credit institutions G24 44,209 56,322
Deposits and borrowings from the public G25 193,342 197,254
Liabilities to policyholders G26 55,491 51,843
Debt securities in issue G27 201,937 194,274
Derivatives G17 79,505 97,340
Fair value changes of the hedged items in portfolio hedge of interest rate risk 2,594 3,418
Current tax liabilities 225 368
Other liabilities G28 25,756 26,973
Accrued expenses and prepaid income G29 1,805 1,943
Deferred tax liabilities G11 1,028 983
Provisions G30 415 305
Retirement benefit liabilities G31 329 540
Subordinated liabilities G32 9,200 7,942
Total liabilities 615,836 639,505
Equity
Non-controlling interests 1 2
Share capital 4,050 4,050
Share premium reserve 1,080 1,080
Other reserves –1,188 –1,201
Retained earnings 27,089 25,906
Total equity 31,032 29,837
Total liabilities and equity 646,868 669,342
Assets pledged as security for own liabilities G33 184,795 163,041
Other assets pledged G34 9,038 11,265
Contingent liabilities G35 22,569 22,017
Commitments G36 74,663 75,935
Nordea Group – Financial statements
Nordea Annual Report 201562
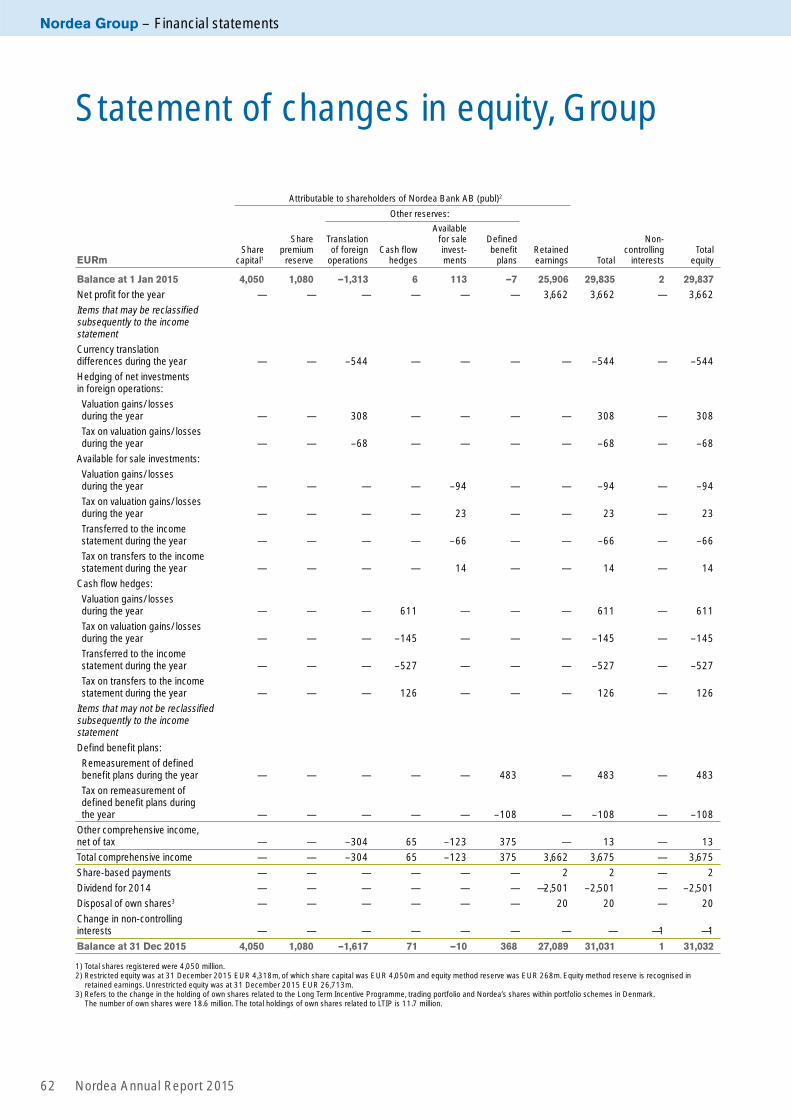
Statement of changes in equity, Group
Attributable to shareholders of Nordea Bank AB (publ)2
Other reserves:
EURmShare
capital1
Share premium
reserve
Translation of foreign
operationsCash flow
hedges
Availablefor sale invest-ments
Defined benefit
plansRetained earnings Total
Non-controlling
interestsTotal
equity
Balance at 1 Jan 2015 4,050 1,080 —1,313 6 113 —7 25,906 29,835 2 29,837
Net profit for the year — — — — — — 3,662 3,662 — 3,662
Items that may be reclassified subsequently to the income statement
Currency translation differences during the year — — –544 — — — — –544 — –544
Hedging of net investments in foreign operations:
Valuation gains/losses during the year — — 308 — — — — 308 — 308
Tax on valuation gains/losses during the year — — –68 — — — — –68 — –68
Available for sale investments:
Valuation gains/losses during the year — — — — –94 — — –94 — –94
Tax on valuation gains/losses during the year — — — — 23 — — 23 — 23
Transferred to the income statement during the year — — — — –66 — — –66 — –66
Tax on transfers to the income statement during the year — — — — 14 — — 14 — 14
Cash flow hedges:
Valuation gains/losses during the year — — — 611 — — — 611 — 611
Tax on valuation gains/losses during the year — — — –145 — — — –145 — –145
Transferred to the income statement during the year — — — –527 — — — –527 — –527
Tax on transfers to the income statement during the year — — — 126 — — — 126 — 126
Items that may not be reclassi fied subsequently to the income statement
Defind benefit plans:
Remeasurement of defined benefit plans during the year — — — — — 483 — 483 — 483
Tax on remeasurement of defined benefit plans during the year — — — — — –108 — –108 — –108
Other comprehensive income, net of tax — — –304 65 –123 375 — 13 — 13
Total comprehensive income — — –304 65 –123 375 3,662 3,675 — 3,675
Share-based payments — — — — — — 2 2 — 2
Dividend for 2014 — — — — — — —2,501 –2,501 — –2,501
Disposal of own shares3 — — — — — — 20 20 — 20
Change in non-controlling interests — — — — — — — — —1 —1
Balance at 31 Dec 2015 4,050 1,080 –1,617 71 —10 368 27,089 31,031 1 31,032
1) Total shares registered were 4,050 million.2) Restricted equity was at 31 December 2015 EUR 4,318m, of which share capital was EUR 4,050m and equity method reserve was EUR 268m. Equity method reserve is recognised in
retained earnings. Unrestricted equity was at 31 December 2015 EUR 26,713m.3) Refers to the change in the holding of own shares related to the Long Term Incentive Programme, trading portfolio and Nordea’s shares within portfolio schemes in Denmark.
The number of own shares were 18.6 million. The total holdings of own shares related to LTIP is 11.7 million.

Financial statements – Nordea Group
Nordea Annual Report 2015 63
Attributable to shareholders of Nordea Bank AB (publ)2
Other reserves:
EURmShare
capital1
Share premium
reserve
Translation of foreign
operationsCash flow
hedges
Availablefor sale invest-ments
Defined benefit
plansRetained earnings Total
Non-controlling
interestsTotal
equity
Balance at 1 Jan 2014 4,050 1,080 –613 –18 81 391 24,236 29,207 2 29,209
Net profit for the year — — — — — — 3,332 3,332 — 3,332
Items that may be reclassified subsequently to the income statement
Currency translation differences during the year — — –1,039 — — — — –1,039 — –1,039
Hedging of net investments in foreign operations:
Valuation gains/losses during the year — — 435 — — — — 435 — 435
Tax on valuation gains/losses during the year — — –96 — — — — –96 — –96
Available for sale investments:
Valuation gains/losses during the year — — — — 41 — — 41 — 41
Tax on valuation gains/losses during the year — — — — –8 — — –8 — –8
Transferred to the income statement during the year — — — — –1 — — –1 — –1
Tax on transfers to the income statement during the year — — — — 0 — — 0 — 0
Cash flow hedges:
Valuation gains/losses during the year — — — 480 — — — 480 — 480
Tax on valuation gains/losses during the year — — — –105 — — — –105 — –105
Transferred to the income statement during the year — — — –449 — — — –449 — –449
Tax on transfers to the income statement during the year — — — 98 — — — 98 — 98
Items that may not be reclassi fied subsequently to the income statement
Defind benefit plans:
Remeasurement of defined benefit plans during the year — — — — — –518 — –518 — –518
Tax on remeasurement of defined benefit plans during the year — — — — — 120 — 120 — 120
Other comprehensive income, net of tax — — –700 24 32 –398 — –1,042 — –1,042
Total comprehensive income — — –700 24 32 –398 3,332 2,290 — 2,290
Share-based payments — — — — — — 16 16 — 16
Dividend for 2013 — — — — — — –1,734 –1,734 — –1,734
Disposal of own shares3 — — — — — — 56 56 — 56
Balance at 31 Dec 2014 4,050 1,080 –1,313 6 113 –7 25,906 29,835 2 29,837
1) Total shares registered were 4,050 million.2) Restricted equity was at 31 December 2014 EUR 4,296m, of which share capital was EUR 4,050m and equity method reserve was EUR 246m. Equity method reserve is recognised in
retained earnings. Unrestricted equity was at 31 December 2014 EUR 25,539m.3) Refers to the change in the holding of own shares related to the Long Term Incentive Programme, trading portfolio and Nordea’s shares within portfolio schemes in Denmark.
The number of own shares were 23.0 million. The total holdings of own shares related to LTIP is 15.9 million.
Dividends per shareSee Statement of changes in equity for the parent company, page 168.

Nordea Group – Financial statements
Nordea Annual Report 201564
Cash flow statement, Group – Total operationsEURm 2015 2014
Operating activities
Operating profit 4,704 4,307
Profit for the year from discontinued operations, after tax — –25
Adjustment for items not included in cash flow 2,824 8,140
Income taxes paid –1,056 –966
Cash flow from operating activities before changes in operating assets and liabilities 6,472 11,456
Changes in operating assets
Change in loans to central banks –10,002 1,853
Change in loans to credit institutions 1,171 –1,050
Change in loans to the public 5,173 –17,359
Change in interest-bearing securities –831 –3,785
Change in financial assets pledged as collateral 3,812 –2,609
Change in shares –937 –7,196
Change in derivatives, net 4,453 155
Change in investment properties 38 169
Change in other assets –1,402 –6,843
Changes in operating liabilities
Change in deposits by credit institutions –13,495 –4,398
Change in deposits and borrowings from the public –4,272 568
Change in liabilities to policyholders 2,361 –765
Change in debt securities in issue 4,374 13,040
Change in other liabilities 3,281 5,940
Cash flow from operating activities 196 –10,824
Investing activities
Sale of business operations 175 481
Acquisition of associated undertakings 0 –8
Sale of associated undertakings 10 480
Acquisition of property and equipment –162 –197
Sale of property and equipment 27 14
Acquisition of intangible assets –467 –343
Sale of intangible assets 9 —
Net divestments in debt securities, held to maturity –139 2,822
Purchase/sale of other financial fixed assets 25 5
Cash flow from investing activities –522 3,254
Financing activities
Issued subordinated liabilities 2,159 1,106
Amortised subordinated liabilities –1,424 –468
Divestment/repurchase of own shares including change in trading portfolio 20 56
Dividend paid –2,501 –1,734
Cash flow from financing activities –1,746 –1,040
Cash flow for the year –2,072 –8,610
Cash and cash equivalents at the beginning of year 39,683 45,670
Translation difference 2,589 2,623
Cash and cash equivalents at the end of year 40,200 39,683
Change –2,072 –8,610

Financial statements – Nordea Group
Nordea Annual Report 2015 65
Comments on the cash flow statementThe cash flow statement shows inflows and outflows of cash and cash equivalents during the year for total opera-tions. Nordea’s cash flow has been prepared in accordance with the indirect method, whereby operating profit is adjusted for effects of non-cash transactions such as depreciation and loan losses. The cash flows are classified by operating, investing and financing activities.
Operating activitiesOperating activities are the principal revenue-producing activities and cash flows are mainly derived from the operating profit for the year with adjustment for items not included in cash flow and income taxes paid. Adjustment for items not included in cash flow includes:
EURm 2015 2014
Depreciation 189 237
Impairment charges 20 350
Loan losses 543 620
Unrealised gains/losses 1,401 –457
Capital gains/losses (net) –197 –391
Change in accruals and provisions 143 –788
Translation differences 811 1,070
Change in bonus potential to policyholders, Life 236 918
Change in technical reserves, Life 1,053 3,839
Change in fair value of hedged items, assets/liabilities (net) –753 1,749
Other –622 993
Total 2,824 8,140
Changes in operating assets and liabilities consist of assets and liabilities that are part of normal business activities, such as loans, deposits and debt securities in issue. Changes in derivatives are reported net.
Cash flow from operating activities includes interest payments received and interest expenses paid with the following amounts:
EURm 2015 2014
Interest payments received 8,810 10,319
Interest expenses paid –3,473 –4,698
Investing activitiesInvesting activities include acquisitions and disposals of non-current assets, like property and equipment, intangible and financial assets.
Financing activitiesFinancing activities are activities that result in changes in equity and subordinated liabilities, such as new issues of shares, dividends and issued/amortised subordinated liabilities.
Cash and cash equivalentsThe following items are included in Cash and cash equivalents:
EURm 31 Dec
2015 31 Dec
2014
Cash and balances with central banks 35,500 31,067
Loans to central banks, payable on demand 2,684 6,454
Loans to credit institutions, payable on demand 2,016 2,162
Total 40,200 39,683
Cash comprises legal tender and bank notes in foreign currencies. Balances with central banks consist of deposits in accounts with central banks and postal giro systems under government authority, where the following condi-tions are fulfilled;– the central bank or the postal giro system is domiciled
in the country where the institution is established– the balance on the account is readily available at any time.
Loans to credit institutions, payable on demand include liquid assets not represented by bonds or other interest-bearing securities. Loans to central banks, payable on demand includes instruments where Nordea has the right to resell immediately.
Discontinued operationsThe cash flow statements include cash flow attributable to total operations i.e. both continuing and discontinued operations. In 2014 the discontinued operations consisted of Nordea s Polish operations, for more information see Note G1 and Note G41. The cash flows related to the dis-continued operations, excluding the cash flows at the clos-ing of the transaction, consisted of net cash flows from operating activities of EUR –379m, net cash flow from investing activities of EUR –14m and net cash flows from financing activities of EUR 1m. There are no cash flows from discontinued operations 2015.

Nordea Group – Financial statements
Nordea Annual Report 201566
Quarterly development, Group
EURm Q4 2015 Q3 2015 Q2 2015 Q1 2015 Q4 20141 Q3 20141 Q2 20141 Q1 20141 2015 20141
Net interest income 1,241 1,272 1,309 1,288 1,356 1,396 1,368 1,362 5,110 5,482
Net fee and commission income 768 717 783 757 763 667 708 704 3,025 2,842
Net result from items at fair value 436 222 401 644 367 291 356 411 1,703 1,425
Profit from associated undertakings accounted for under the equity method 3 18 8 10 –1 7 3 9 39 18
Other operating income 197 24 22 20 33 398 25 18 263 474
Total operating income 2,645 2,253 2,523 2,719 2,518 2,759 2,460 2,504 10,140 10,241
General administrative expenses:
Staff costs –956 –756 –772 –779 –760 –731 –910 –758 –3,263 –3,159
Other expenses –455 –303 –363 –364 –418 –380 –428 –430 –1,485 –1,656
Depreciation, amortisation and impairment charges of tangible and intangible assets –65 –49 –50 –45 –54 –410 –65 –56 –209 –585
Total operating expenses –1,476 –1,108 –1,185 –1,188 –1,232 –1,521 –1,403 –1,244 –4,957 –5,400
Profit before loan losses 1,169 1,145 1,338 1,531 1,286 1,238 1,057 1,260 5,183 4,841
Net loan losses –142 –112 –103 –122 –129 –112 –135 –158 –479 –534
Operating profit 1,027 1,033 1,235 1,409 1,157 1,126 922 1,102 4,704 4,307
Income tax expense –179 –253 –283 –327 –280 –188 –216 –266 –1,042 –950
Net profit for the period from continuing operations 848 780 952 1,082 877 938 706 836 3,662 3,357
Net profit for the period from discontinued operations, after tax — — — — — 0 –20 –5 — –25
Net profit for the year 848 780 952 1,082 877 938 686 831 3,662 3,332
1) During 2015 the scope of discontinued operations has changed and the IT-operations earlier classified as discontinued operations were reclassified to continuing operations which affected 2014.
Diluted earnings per share (DEPS), EUR – Total operations 0.21 0.19 0.24 0.27 0.22 0.23 0.17 0.21 0.91 0.83
DEPS, rolling 12 months up to period end, EUR – Total operations 0.91 0.92 0.95 0.89 0.83 0.80 0.76 0.78 0.91 0.83

Financial statements – Nordea Group
Nordea Annual Report 2015 67
5 year overview, Group
Income statement
EURm 2015 20142 2013 2012 20111
Net interest income 5,110 5,482 5,525 5,563 5,456
Net fee and commission income 3,025 2,842 2,642 2,468 2,395
Net result from items at fair value 1,703 1,425 1,539 1,774 1,517
Profit from associated undertakings accounted for under the equity method 39 18 79 93 42
Other operating income 263 474 106 100 91
Total operating income 10,140 10,241 9,891 9,998 9,501
General administrative expenses:
Staff costs –3,263 –3,159 –2,978 –2,989 –3,113
Other expenses –1,485 –1,656 –1,835 –1,808 –1,914
Depreciation, amortisation and impairment charges of tangible and intangible assets –209 –585 –227 –267 –192
Total operating expenses –4,957 –5,400 –5,040 –5,064 –5,219
Profit before loan losses 5,183 4,841 4,851 4,934 4,282
Net loan losses –479 –534 –735 –895 –735
Operating profit 4,704 4,307 4,116 4,039 3,547
Income tax expense –1,042 –950 –1,009 –970 –913
Net profit for the year from continuing operations 3,662 3,357 3,107 3,069 2,634
Net profit for the year from discontinued operations, after tax — –25 9 57 —
Net profit for the year 3,662 3,332 3,116 3,126 2,634
Balance sheet
EURm31 Dec
201531 Dec
201431 Dec
201331 Dec
201231 Dec
2011
Cash and balances with central banks 35,500 31,067 33,529 36,060 3,765
Loans to central banks and credit institutions 24,183 19,175 22,512 18,574 51,865
Loans to the public 340,920 348,085 342,451 346,251 337,203
Interest-bearing securities and pledged instruments 96,517 99,261 96,889 94,596 92,923
Derivatives 80,741 105,119 70,992 118,789 171,943
Other assets 69,007 66,635 55,166 53,908 43,432
Assets held for sale — — 8,895 — —
Total assets 646,868 669,342 630,434 668,178 701,131
Deposits by credit institutions 44,209 56,322 59,090 55,426 55,316
Deposits and borrowings from the public 193,342 197,254 200,743 200,678 190,092
Liabilities to policyholders 55,491 51,843 47,226 45,320 40,715
Debt securities in issue 201,937 194,274 185,602 183,908 178,028
Derivatives 79,505 97,340 65,924 114,203 167,390
Subordinated liabilities 9,200 7,942 6,545 7,797 6,503
Other liabilities 32,152 34,530 31,897 32,841 37,442
Liabilities held for sale — — 4,198 — —
Equity 31,032 29,837 29,209 28,005 25,645
Total liabilities and equity 646,868 669,342 630,434 668,178 701,131
1) The comparative figures for 2011 have not been restated in relation to discontinued operations (Nordea´s Polish operations), see Note G41 for more information.2) During 2015 the scope of discontinued operations has changed and the IT-operations earlier classified as discontinued operations were reclassified to continuing operations which affected 2014.
Nordea Group – Financial statements
Nordea Annual Report 201568
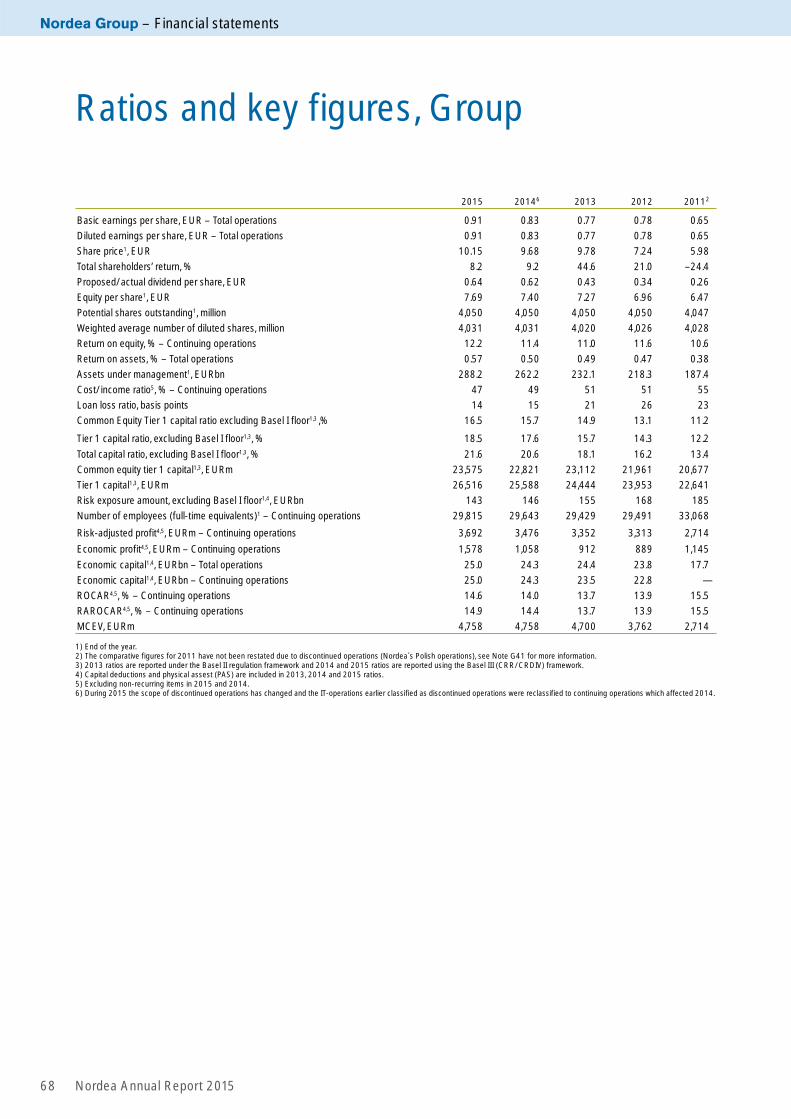
2015 20146 2013 2012 20112
Basic earnings per share, EUR – Total operations 0.91 0.83 0.77 0.78 0.65
Diluted earnings per share, EUR – Total operations 0.91 0.83 0.77 0.78 0.65
Share price1, EUR 10.15 9.68 9.78 7.24 5.98
Total shareholders’ return, % 8.2 9.2 44.6 21.0 –24.4
Proposed/actual dividend per share, EUR 0.64 0.62 0.43 0.34 0.26
Equity per share1, EUR 7.69 7.40 7.27 6.96 6.47
Potential shares outstanding1, million 4,050 4,050 4,050 4,050 4,047
Weighted average number of diluted shares, million 4,031 4,031 4,020 4,026 4,028
Return on equity, % – Continuing operations 12.2 11.4 11.0 11.6 10.6
Return on assets, % – Total operations 0.57 0.50 0.49 0.47 0.38
Assets under management1, EURbn 288.2 262.2 232.1 218.3 187.4
Cost/income ratio5, % – Continuing operations 47 49 51 51 55
Loan loss ratio, basis points 14 15 21 26 23
Common Equity Tier 1 capital ratio excluding Basel I floor1,3 ,% 16.5 15.7 14.9 13.1 11.2
Tier 1 capital ratio, excluding Basel I floor1,3, % 18.5 17.6 15.7 14.3 12.2
Total capital ratio, excluding Basel I floor1,3, % 21.6 20.6 18.1 16.2 13.4
Common equity tier 1 capital1,3, EURm 23,575 22,821 23,112 21,961 20,677
Tier 1 capital1,3, EURm 26,516 25,588 24,444 23,953 22,641
Risk exposure amount, excluding Basel I floor1,4, EURbn 143 146 155 168 185
Number of employees (full-time equivalents)1 – Continuing operations 29,815 29,643 29,429 29,491 33,068
Risk-adjusted profit4,5, EURm – Continuing operations 3,692 3,476 3,352 3,313 2,714
Economic profit4,5, EURm – Continuing operations 1,578 1,058 912 889 1,145
Economic capital1,4, EURbn – Total operations 25.0 24.3 24.4 23.8 17.7
Economic capital1,4, EURbn – Continuing operations 25.0 24.3 23.5 22.8 —
ROCAR4,5, % – Continuing operations 14.6 14.0 13.7 13.9 15.5
RAROCAR4,5, % – Continuing operations 14.9 14.4 13.7 13.9 15.5
MCEV, EURm 4,758 4,758 4,700 3,762 2,714
1) End of the year.2) The comparative figures for 2011 have not been restated due to discontinued operations (Nordea´s Polish operations), see Note G41 for more information.3) 2013 ratios are reported under the Basel II regulation framework and 2014 and 2015 ratios are reported using the Basel III (CRR/CRDIV) framework.4) Capital deductions and physical assest (PAS) are included in 2013, 2014 and 2015 ratios. 5) Excluding non-recurring items in 2015 and 2014.6) During 2015 the scope of discontinued operations has changed and the IT-operations earlier classified as discontinued operations were reclassified to continuing operations which affected 2014.
Ratios and key figures, Group

Financial statements – Nordea Group
Nordea Annual Report 2015 69
Allowances in relation to impaired loans Allowances for individually assessed impaired loans divided by individually assessed impaired loans before allowances.
Basic earnings per share Net profit for the year divided by the weighted aver-age number of outstanding shares, non-controlling interests excluded.
Cost of equity (%) Required return by investors on the Nordea share, meas-ured as the long risk free euro rate plus required average risk premium to invest in equities multiplied by Beta, which reflects the Nordea share’s volatility and correlation with market volatility.
Cost of equity in EUR is defined as Cost of equity (%) times Economic capi-tal. The Cost of equity is set by manage-ment once a year as a parameter to man-age risk appetite and investment level.
Cost/income ratio Total operating expenses divided by total operating income.
Diluted earnings per share Net profit for the year divided by the weighted average number of outstanding shares after full dilution, non-controlling inter-ests excluded.
Economic capital (EC) Internal esti-mate of required capital and measures the capital required to cover unexpected losses in the course of its business with a certain probability. EC uses advanced internal models to provide a consistent measurement for Credit Risk, Market Risk, Operational Risk and Life Insurance Risk arising from activities in Nordea’s various business areas.
The aggregation of risks across the group gives rise to diversification effects resulting from the differences in risk drivers and the improbability that unexpected losses occur simultaneously.
Economic profit Deducting Cost of equity from Risk-adjusted profit.
Equity per share Equity as shown on the balance sheet after full dilution and non-controlling interests excluded divided by the number of shares after full dilution.
Expected losses Normalised loss level of the individual loan exposure over a busi-ness cycle as well as various portfolios.
Impairment rate, gross Individually assessed impaired loans before allow-ances divided by total loans before allowances.
Impairment rate, net Individually assessed impaired loans after allowances divided by total loans before allowances.
Loan loss ratio Net loan losses (annual-ised) divided by closing balance of loans to the public (lending).
MCEV (Market Consistent Embedded Value) Estimate of the value a share-holder would put on a portfolio of in-force life and pension business based on objective market return. No franchise value or other additional value is included in MCEV.
Non-performing, not impaired Past due loans, not impaired due to future cash flows (included in Loans, not impaired).
Own funds Own funds include the sum of the Tier 1 capital and the supplemen-tary capital consisting of subordinated loans, after deduction of the carrying amount of the shares in wholly owned insurance companies and the potential deduction for expected shortfall.
Price to Book Nordea’s stock market value relative to its book value of total equity.
RAROCAR, (Risk-adjusted return on capital at risk), Risk-adjusted profit rela-tive to Economic capital.
Return on equity Net profit for the year excluding non-controlling interests as a percentage of average equity for the year. Average equity including net profit for the year and dividend until paid, non-controlling interests excluded.
Return on assets Net profit for the year as a percentage of total assets at end of the year.
Risk-adjusted profit Total income minus total operating expenses, minus Expected losses and standard tax (24% 2015). In addition, Risk-adjusted profit excludes major non-recurring items.
Risk exposure amount Total assets and off-balance-sheet items valued on the basis of the credit and market risks, as well as operational risks of the Group’s undertakings, in accordance with regu-lations governing capital adequacy, excluding assets in insurance compa-nies, carrying amount of shares which have been deducted from the capital base and intangible assets.
ROCAR, % (Return on capital at risk) is defined as Net profit in percentage of Economic Capital. For Business areas it is defined as Operating profit after stand-ard tax in percentage of Economic capital.
Tier 1 capital Proportion of the capital base, which includes consolidated shareholders’ equity excluding invest-ments in insurance companies, pro-posed dividend, deferred tax assets, intangible assets in the banking opera-tions. Shortfall is deducted with 100% in CET1 – the negative difference between expected losses and provi-sions. Subsequent to the approval of the supervisory authorities, Tier 1 capi-tal also includes qualified forms of sub-ordinated loans (Tier 1 capital contribu-tions and hybrid capital loans).
The Common equity Tier 1 capital constitutes the Tier 1 capital excluding hybrid capital loans.
Tier 1 capital ratio Tier 1 capital as a percentage of risk exposure amount. The Common equity Tier 1 capital ratio is cal-culated as Common equity Tier 1 capital as a percentage of risk exposure amount.
Total allowance rate Total allowances divided by total loans before allowances.
Total allowances in relation to impaired loans (provisioning ratio) Total allowances divided by impaired loans before allowances.
Total capital ratio Own funds as a percentage of risk exposure amount.
Total shareholders return (TSR) Total shareholders return measured as growth in the value of a shareholding during the year, assuming the divi-dends are reinvested at the time of the payment to purchase additional shares.
Business definitions

Nordea Group – Accounting policies
Nordea Annual Report 201570
Content for Note G1
1. Basis for presentation . . . . . . . . . . . . . . . . . . . . . . . . . . . . . . . . . . . . . . . . . . . 70
2. Changed accounting policies . . . . . . . . . . . . . . . . . . . . . . . . . . . . . . . . . 70
3. Changes in IFRSs not yet applied. . . . . . . . . . . . . . . . . . . . . . . . . . . 70
4. Critical judgements and estimation uncertainty . . . . . . . 72
5. Principles of consolidation . . . . . . . . . . . . . . . . . . . . . . . . . . . . . . . . . . . . . .74
6. Recognition of operating income and impairment . . . . . . . . . . . . . . . . . . . . . . . . . . . . . . . . . . . . . . . . . . . . . . . . . . . . . . . . . . . 75
7. Income recognition life insurance . . . . . . . . . . . . . . . . . . . . . . . . . . . 77
8. Recognition and derecognition of financial instruments on the balance sheet. . . . . . . . . . . . . . . . . . . . . . . . . . . 78
9. Translation of assets and liabilities denominated in foreign currencies . . . . . . . . . . . . . . . . . . . . . . . . . 78
10. Hedge accounting . . . . . . . . . . . . . . . . . . . . . . . . . . . . . . . . . . . . . . . . . . . . . . . . 78
11. Determination of fair value of financial instruments . . . . . . . . . . . . . . . . . . . . . . . . . . . . . . . . . . . . . . . . . . . . . . . . . . . . . . . . . . 79
12. Cash and balances with central banks . . . . . . . . . . . . . . . . . . . . 80
13. Financial instruments . . . . . . . . . . . . . . . . . . . . . . . . . . . . . . . . . . . . . . . . . . . . 80
14. Loans to the public/credit institutions . . . . . . . . . . . . . . . . . . . . . 83
15. Leasing. . . . . . . . . . . . . . . . . . . . . . . . . . . . . . . . . . . . . . . . . . . . . . . . . . . . . . . . . . . . . . . . 84
16. Intangible assets. . . . . . . . . . . . . . . . . . . . . . . . . . . . . . . . . . . . . . . . . . . . . . . . . . . 84
17. Properties and equipment . . . . . . . . . . . . . . . . . . . . . . . . . . . . . . . . . . . . . 85
18. Investment properties . . . . . . . . . . . . . . . . . . . . . . . . . . . . . . . . . . . . . . . . . . . 85
19. Liabilities to policyholders. . . . . . . . . . . . . . . . . . . . . . . . . . . . . . . . . . . . . . 86
20. Taxes . . . . . . . . . . . . . . . . . . . . . . . . . . . . . . . . . . . . . . . . . . . . . . . . . . . . . . . . . . . . . . . . . . . 87
21. Earnings per share. . . . . . . . . . . . . . . . . . . . . . . . . . . . . . . . . . . . . . . . . . . . . . . . 87
22. Employee benefits . . . . . . . . . . . . . . . . . . . . . . . . . . . . . . . . . . . . . . . . . . . . . . . . 87
23. Equity . . . . . . . . . . . . . . . . . . . . . . . . . . . . . . . . . . . . . . . . . . . . . . . . . . . . . . . . . . . . . . . . . . 88
24. Financial guarantee contracts and credit commitments . . . . . . . . . . . . . . . . . . . . . . . . . . . . . . . . . . . . . . . . . . . . . . 88
25. Share-based payment . . . . . . . . . . . . . . . . . . . . . . . . . . . . . . . . . . . . . . . . . . . 89
26. Related party transactions. . . . . . . . . . . . . . . . . . . . . . . . . . . . . . . . . . . . . 89
27. Exchange rates. . . . . . . . . . . . . . . . . . . . . . . . . . . . . . . . . . . . . . . . . . . . . . . . . . . . . 89
1. Basis for presentationNordea’s consolidated financial statements are prepared in accordance with International Financial Reporting Stand-ards (IFRS) as endorsed by the EU Commission. In addi-tion, certain complementary rules in the Swedish Annual Accounts Act for Credit Institutions and Securities Com-panies (1995:1559), the accounting regulations of the Swedish Financial Supervisory Authority (FFFS 2008:25 including amendments) and the Supplementary Account-ing Rules for Groups (RFR 1) from the Swedish Financial Reporting Board have been applied.
The disclosures, required in the standards, recommen-dations and legislation above, have been included in the notes, the Risk, Liquidity and Capital management section or in other parts of the “Financial statements”.
On 4 February 2016 the Board of Directors approved the financial statements, subject to final approval of the Annual General Meeting on 17 March 2016.
2. Changed accounting policies The accounting policies, basis for calculations and presen-tation are, in all material aspects, unchanged in compari-son with the 2014 Annual Report. The new accounting requirements implemented during 2015 and their effects on Nordea’s financial statements are described below.
The following new and amended standards and inter-pretations were implemented 1 January 2015 but have not had any significant impact on the financial statements of Nordea:• Amendments to IAS 19: “Defined Benefit Plans:
Employee Contributions”• “Annual Improvements to IFRSs, 2010–2012 Cycle”• “Annual Improvements to IFRSs, 2011–2013 Cycle” • IFRIC 21 “Levies”
The Swedish Financial Reporting Board has amended the accounting recommendation for groups by issuing “RFR 1 Supplementary Accounting Rules for Groups – January 2015”. These changes were implemented by Nordea 1 Jan-uary 2015 but have not had any significant impact on Nordea s financial statements.
3. Changes in IFRSs not yet applied IFRS 9 ”Financial instruments”IASB has completed the new standard for financial instru-ments, IFRS 9 “Financial instruments”. IFRS 9 covers clas-sification and measurement, impairment and general hedging and replaces the current requirements covering these areas in IAS 39. IFRS 9 is effective as from annual periods beginning on or after 1 January 2018. Earlier appli-cation is permitted, but IFRS 9 is not yet endorsed by the EU-commission. Nordea does not currently intend to early adopt the standard.
The changes in classification and measurement are not expected to have a significant impact on Nordea’s income statement or balance sheet as the mixed measurement model will be maintained, and as there will still be a measurement category similar to the current Available For Sale (AFS) category in IAS 39. Significant reclassifications between fair value and amortised cost or impact on the capital adequacy and large exposures are not expected in the period of initial application, but this is naturally dependent on the financial instruments on Nordea’s balance sheet at transition.
The impairment requirements in IFRS 9 are based on an expected loss model as opposed to the current incurred loss model in IAS 39. In general, it is expected that the new requirements will increase loan loss provisions, decrease equity and have a negative impact on capital adequacy, but no impact on large exposures, in the period of initial application. IFRS 9 requires all assets measured at amor-tised cost and fair value through other comprehensive income, as well as guarantees and loan commitments, to be included in the impairment test. Currently Nordea does not calculate collective provisions for off balance sheet exposures or the AFS portfolio.
The assets to test for impairment will be divided into three groups depending on the stage of credit deteriora-tion. Stage 1 includes assets where there has been no sig-nificant deterioration in credit risk, stage 2 includes assets where there has been a significant deterioration and stage
G1 Accounting policies

Accounting policies – Nordea Group
Nordea Annual Report 2015 71
3 includes assets that have been individually assessed to be impaired. In stage 1, the provisions should equal the 12 month expected loss. In stage 2 and 3, the provisions should equal the lifetime expected losses.
Nordea’s current model for calculating collective provi-sions defines a loss event as a deterioration in rating/scor-ing, but it is not expected that the loss event in the current model will equal the trigger event for moving items from stage 1 to stage 2 under IFRS 9. Currently Nordea does not, in addition, hold any provisions for assets where there has been no deterioration in credit risk.
For assets where there has been a significant deteriora-tion in credit risk, Nordea currently holds provisions based on the losses estimated to occur during the period between the date when the loss event occurred and the date when the loss event is identified on an individual basis, the so called “Emergence period”, while IFRS 9 will require provi-sions equal to the lifetime expected loss. This means total provisions will increase when IFRS 9 is implemented.
The main change to the general hedging requirements is that the standard aligns hedge accounting more closely with the risk management activities. As Nordea generally uses macro (portfolio) hedge accounting Nordea’s assess-ment is that the new requirements will not have any signifi-cant impact on Nordea’s financial statements, capital ade-quacy, or large exposures in the period of initial application.
Nordea has not yet finalised the impact assessment of the implementation of IFRS 9.
IFRS 15 “Revenue from Contracts with Customers”The IASB has published the new standard, IFRS 15 “Reve-nue from Contracts with Customers”. The new standard outlines a single comprehensive model of accounting for revenue arising from contracts with customers and super-sedes current revenue recognition standards and interpre-tations within IFRS, such as IAS 18 “Revenue”. The new standard is effective for annual periods beginning on or after 1 January 2018, with earlier application permitted. The EU-commission is expected to endorse the standard during the second quarter 2016. Nordea does not currently intend to early adopt the standard. The standard does not apply to financial instruments, insurance contracts or lease con-tracts. Nordea has not finalised the investigation of the impact on the financial statements but the current assess-ment is that the new standard will not have any significant impact on Nordea’s financial statements, capital adequacy, or large exposures in the period of initial application.
Amendments to IFRS 11 “Accounting for Acquisitions of Interests in Joint Operations”The IASB has issued amendments to IFRS 11 “Joint Arrangements”, which add new guidance on how to account for the acquisition of an interest in a joint opera-tion that constitutes a business. The amendments are effective for annual periods beginning on or after 1 Janu-ary 2016. Earlier application is permitted. The amend-ments are endorsed by the EU-commission. Nordea does not currently intend to early adopt the amendments. As Nordea does not have any joint venture the assessment is that the amendments will not have any effects on Nordea’s financial statements, capital adequacy or large exposures in the period of initial application.
Amendments to IFRS 10 and IAS 28 “Sale or Contribution of Assets between an Investor and its Associate or Joint Venture”The IASB has amended the requirements in IFRS 10 and IAS 28 regarding sales and contribution of assets between an investor and its associate or joint venture due to incon-sistent treatment of gains and losses of such transactions in those standards. The IASB has thereafter proposed to defer indefinitely the effective date and permit earlier application. The amendments are not yet endorsed by the EU-commission. Nordea does not currently intend to early adopt the amendments. The new requirements are not expected to have any effect on Nordea’s financial state-ments, capital adequacy, or large exposures in the period of initial application as the new requirements are in line with Nordea’s current accounting policies.
Amendments to IAS 1 “Disclosure initiative” The IASB has amended IAS 1 as a result of the IASB’s dis-closure initiative. The amendments in IAS 1 regards mate-riality, disaggregation and subtotals, note structure, dis-closures of accounting policies and presentation of items of OCI arising from equity accounted investments. The amendments are effective for annual periods beginning on or after 1 January 2016. Earlier application is permitted. The amendments are endorced by the EU-commission. Nordea does not intend to early adopt the amendments. The new requirements are not expected to have any effect on Nordea’s financial statements, capital adequacy, or large exposures in the period of initial application.
IFRS 16 “ Leases”The IASB has published the new standard, IFRS 16 “Leases”. The new standard changes the accounting requirements for lessees. All leases (except for short term and small ticket leases) should be accounted for on the balance sheet of the lessee as a right to use the asset and a corresponding liability, and the lease payments should be recognised as amortisation and interest expense. The accounting requirements for lessors are unchanged. Additional disclosures are also required. The new stand-ard is effective for annual periods beginning on or after 1 January 2019 and earlier application is permitted. The amendments are not yet endorsed by the EU-commission. Nordea does not currently intend to early adopt the amendments. Nordea’s current assessment is that the new standard will change the accounting of property leases which mainly affects Nordea’s balance sheet.
Other changes in IFRSThe IASB has published the following new or amended standards that are assessed to have no impact on Nordea’s financial statement, capital adequacy or large exposures in the period of initial application:• Amendments to IFRS 10, IFRS 12 and IAS 28:
“Investment Entities: Applying the Consolidation Exception“
• Amendments to IAS 16 and IAS 38: ”Clarification of Acceptable Methods of Depreciation and Amortisation”
• Amendment to IAS 12 “Recognition of Deferred Tax Assets for Unrealised Losses”
• “Annual Improvements to IFRSs, 2012–2014 Cycle”
G1 Accounting policies
Nordea Group – Accounting policies
Nordea Annual Report 201572
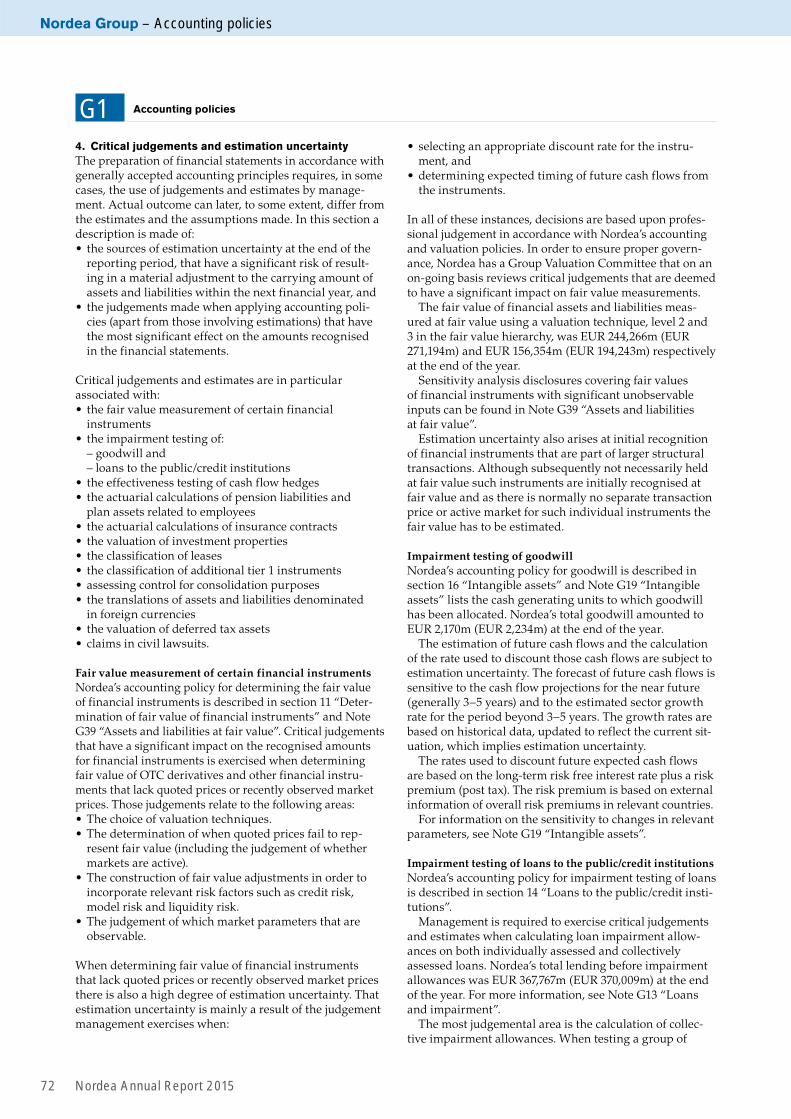
4. Critical judgements and estimation uncertaintyThe preparation of financial statements in accordance with generally accepted accounting principles requires, in some cases, the use of judgements and estimates by manage-ment. Actual outcome can later, to some extent, differ from the estimates and the assumptions made. In this section a description is made of:• the sources of estimation uncertainty at the end of the
reporting period, that have a significant risk of result-ing in a material adjustment to the carrying amount of assets and liabilities within the next financial year, and
• the judgements made when applying accounting poli-cies (apart from those involving estimations) that have the most significant effect on the amounts recognised in the financial statements.
Critical judgements and estimates are in particular associated with:• the fair value measurement of certain financial
instruments• the impairment testing of: – goodwill and – loans to the public/credit institutions• the effectiveness testing of cash flow hedges• the actuarial calculations of pension liabilities and
plan assets related to employees• the actuarial calculations of insurance contracts• the valuation of investment properties• the classification of leases• the classification of additional tier 1 instruments • assessing control for consolidation purposes• the translations of assets and liabilities denominated
in foreign currencies• the valuation of deferred tax assets• claims in civil lawsuits.
Fair value measurement of certain financial instrumentsNordea’s accounting policy for determining the fair value of financial instruments is described in section 11 “Deter-mination of fair value of financial instruments” and Note G39 “Assets and liabilities at fair value”. Critical judgements that have a significant impact on the recognised amounts for financial instruments is exercised when determining fair value of OTC derivatives and other financial instru-ments that lack quoted prices or recently observed market prices. Those judgements relate to the following areas:• The choice of valuation techniques.• The determination of when quoted prices fail to rep-
resent fair value (including the judgement of whether markets are active).
• The construction of fair value adjustments in order to incorporate relevant risk factors such as credit risk, model risk and liquidity risk.
• The judgement of which market parameters that are observable.
When determining fair value of financial instruments that lack quoted prices or recently observed market prices there is also a high degree of estimation uncertainty. That estimation uncertainty is mainly a result of the judgement management exercises when:
• selecting an appropriate discount rate for the instru-ment, and
• determining expected timing of future cash flows from the instruments.
In all of these instances, decisions are based upon profes-sional judgement in accordance with Nordea’s accounting and valuation policies. In order to ensure proper govern-ance, Nordea has a Group Valuation Committee that on an on-going basis reviews critical judgements that are deemed to have a significant impact on fair value measurements.
The fair value of financial assets and liabilities meas-ured at fair value using a valuation technique, level 2 and 3 in the fair value hierarchy, was EUR 244,266m (EUR 271,194m) and EUR 156,354m (EUR 194,243m) respectively at the end of the year.
Sensitivity analysis disclosures covering fair values of financial instruments with significant unobservable inputs can be found in Note G39 “Assets and liabilities at fair value”.
Estimation uncertainty also arises at initial recognition of financial instruments that are part of larger structural transactions. Although subsequently not necessarily held at fair value such instruments are initially recognised at fair value and as there is normally no separate transaction price or active market for such individual instruments the fair value has to be estimated.
Impairment testing of goodwillNordea’s accounting policy for goodwill is described in section 16 “Intangible assets” and Note G19 “Intangible assets” lists the cash generating units to which goodwill has been allocated. Nordea’s total goodwill amounted to EUR 2,170m (EUR 2,234m) at the end of the year.
The estimation of future cash flows and the calculation of the rate used to discount those cash flows are subject to estimation uncertainty. The forecast of future cash flows is sensitive to the cash flow projections for the near future (generally 3–5 years) and to the estimated sector growth rate for the period beyond 3–5 years. The growth rates are based on historical data, updated to reflect the current sit-uation, which implies estimation uncertainty.
The rates used to discount future expected cash flows are based on the long-term risk free interest rate plus a risk premium (post tax). The risk premium is based on external information of overall risk premiums in relevant countries.
For information on the sensitivity to changes in relevant parameters, see Note G19 “Intangible assets”.
Impairment testing of loans to the public/credit institutionsNordea’s accounting policy for impairment testing of loans is described in section 14 “Loans to the public/credit insti-tutions”.
Management is required to exercise critical judgements and estimates when calculating loan impairment allow-ances on both individually assessed and collectively assessed loans. Nordea’s total lending before impairment allowances was EUR 367,767m (EUR 370,009m) at the end of the year. For more information, see Note G13 “Loans and impairment”.
The most judgemental area is the calculation of collec-tive impairment allowances. When testing a group of
G1 Accounting policies

Accounting policies – Nordea Group
Nordea Annual Report 2015 73
loans collectively for impairment, judgement has to be exercised when identifying the events and/or the observa-ble data that indicate that losses have been incurred in the group of loans. Nordea monitors its portfolio through rat-ing migrations and a loss event is an event resulting in a negative rating migration. Assessing the net present value of the cash flows generated by the customers in the group of loans also includes estimation uncertainty. This includes the use of historical data on probability of default and loss given default supplemented by acquired experi-ence when adjusting the assumptions based on historical data to reflect the current situation.
Effectiveness testing of cash flow hedgesNordea’s accounting policies for cash flow hedges are described in section 10 “Hedge accounting”.
One important judgement in connection to cash flow hedge accounting is the choice of method used for effec-tiveness testing.
Where Nordea applies cash flow hedge accounting the hedging instruments used are predominantly cross cur-rency interest rate swaps, which are always held at fair value. The currency component is designated as a cash flow hedge of currency risk and the interest component as a fair value hedge of interest rate risk. The hypothetical derivative method is used when measuring the effective-ness of these cash flow hedges, meaning that the change in a perfect hypothetical swap is used as proxy for the present value of the cumulative change in expected future cash flows on the hedged transaction (the currency component). Critical judgement has to be exercised when defining the characteristics of the perfect hypothetical swap.
Actuarial calculations of pension liabilities and plan assets related to employeesNordea’s accounting policy for post-employment benefits is described in section 22 “Employee benefits”.
The defined benefit obligation for major pension plans is calculated by external actuaries using demographic assumptions based on the current population. As a basis for these calculations a number of actuarial and financial parameters are used.
The estimation of the discount rate is subject to uncer-tainty around whether corporate bond markets are deep enough, of high quality and also in connection to the extrapolation of yield curves to relevant maturities. In Sweden, Norway and Denmark the discount rate is deter-mined with reference to covered bonds and in Finland with reference to corporate bonds. Other parameters, like assumptions about salary increases and inflation, are based on the expected long-term development of these parameters and also subject to estimation uncertainty. The main parameters used at year-end are disclosed in Note G31 “Retirement benefit obligations” together with a description of the sensitivity to changes in assumptions. The defined benefit obligation was EUR 3,271m (EUR 3,727m) at the end of the year.
Actuarial calculations of insurance contractsNordea’s accounting policy for insurance contracts is described in section 19 “Liabilities to policyholders”.
A valuation of insurance liabilities includes estimations
and assumptions, both financial and actuarial. One of the important financial assumptions is the interest rate used for discounting future cash flows. Important actuarial assumptions are those on mortality and disability, which affect the size and timing of the future cash flows. The financial and actuarial assumptions are, to a large extent, stipulated in local legislation and therefore not under Nor-dea’s discretion. Also assumptions about future adminis-trative and tax expenses have an impact on the calculation of policyholder liabilities.
The insurance liability was EUR 35,945m (EUR 35,103m) at the end of the year. The carrying amount’s sensitivity to different assumptions is disclosed in Note G26 “Liabilities to policyholders”.
Valuation of investment propertiesNordea’s accounting policies for investment properties are described in section 18 “Investment properties”.
Investment properties are measured at fair value. As there normally are no active markets for investment prop-erties, the fair values are estimated based on discounted cash flow models. These models are based on assumptions on future rents, vacancy levels, operating and mainte-nance costs, yield requirements and interest rates.
The carrying amounts of investment properties were EUR 3,165m (EUR 3,227m) at the end of the year. See Note G21 “Investment properties” for more information on amounts and parameters used in these models.
Classification of leasesNordea’s accounting policies for leases are described in section 15 “Leasing”.
Critical judgement has to be exercised when classifying lease contracts. A lease is classified as a finance lease if it transfers substantially all the risks and rewards related to ownership. A lease is classified as an operating lease if it does not transfer substantially all the risks and rewards related to ownership.
The central district properties in Finland, Norway and Sweden that Nordea has divested are leased back. The duration of the lease agreements was initially 3–25 years with renewal options. The lease agreements include no transfers of ownerships of the assets by the end of the lease term, nor any economic benefit from appreciation in value of the leased properties. In addition, the lease term is not for the major part of the assets’ economic life. As a result, Nordea has classified these leases as operating leases. This judgement is a critical judgement that has a significant impact on the carrying amounts in the finan-cial statement. The carrying amount of these properties at the time of disposal was EUR 1.5bn.
More information on lease contracts can be found in Note G20 “Leasing”.
Classification of additional tier 1 instrumentsNordea has issued perpetual subordinated instruments where the interest payments to the holders are at the discre-tion of Nordea and non-accumulating. These instruments also include a requirement for Nordea to pay interest if the instruments are no longer allowed to be included in tier 1 capital. If there is a requirement to pay interest based on the occurrence or non-occurrence of an uncertain future event
G1 Accounting policies

Nordea Group – Accounting policies
Nordea Annual Report 201574
that is beyond the control of both the issuer and the holder of the instrument, the instrument shall be classified as a financial liability. The inclusion of the subordinated loan in tier 1 capital is decided by the regulators and is thus beyond the control of Nordea and the holders of the instrument. Nordea classifies the instruments as financial liabilities.
Assessing control for consolidation purposesOne decisive variable when assessing if Nordea controls another entity is whether Nordea is exposed to variability in returns from the investment. For structured entities where voting rights are not the dominant factor when deter-mining control, critical judgement has to be exercised when defining when Nordea is exposed to significant variability in returns. Nordea’s critical judgement is that Nordea is normally exposed to variability in returns when Nordea receives more than 30% of the return produced by the struc-tured entity. This is only relevant for structured entities where Nordea also is the investment manager and thus have influence over the return produced by the structured entity.
Another judgement relating to control is whether Nordea acts as an agent or as a principal. For unit linked and other contracts where the policyholder/depositor decides both the amount and which assets to invest in, Nordea is con-sidered to act as an agent and thus does not have control.
Translation of assets and liabilities denominated in foreign currenciesNordea’s accounting policies covering the translation of assets and liabilities denominated in foreign currencies is described in section 9 “Translation of assets and liabilities denominated in foreign currencies”.
When reporting consolidated financial statements, the parent company Nordea Bank AB (publ) has been assessed to have two functional currencies, SEK and EUR, based on the different activities. The functional currency of the nor-mal banking operations is SEK and the functional cur-rency of the entity holding equity, shares in group under-takings and the funding of those shares is EUR. It is Nordea’s assessment that one legal entity can consist of different entities with different functional currencies.
Valuation of deferred tax assetsNordea’s accounting policy for the recognition of deferred tax assets is described in section 20 “Taxes” and Note G11 “Taxes”.
The valuation of deferred tax assets is influenced by management’s assessment of Nordea’s future profitability and sufficiency of future taxable profits and future rever-sals of existing taxable temporary differences. These assessments are updated and reviewed at each balance sheet date, and are, if necessary, revised to reflect the current situation.
The carrying amount of deferred tax assets was EUR 76m (EUR 130m) at the end of the year.
Claims in civil lawsuitsWithin the framework of the normal business operations, Nordea faces a number of claims in civil lawsuits and dis-putes, most of which involve relatively limited amounts. Presently, none of the current disputes are considered likely to have any significant adverse effect on Nordea
or its financial position. See also Note G30 “Provisions” and Note G35 “Contingent liabilities”.
5. Principles of consolidationConsolidated entitiesThe consolidated financial statements include the accounts of the parent company Nordea Bank AB (publ), and those entities that the parent company controls. Control exists when Nordea is exposed to variability in returns from its investments in another entity and has the ability to affect those returns through its power over the other entity. Control is generally achieved when the parent company owns, directly or indirectly through group undertakings, more than 50 per cent of the voting rights. For entities where voting rights does not decide control, see section “Structured entities” below.
All group undertakings are consolidated using the acquisition method, except for the forming of Nordea in 1997–98 when the holding in Nordea Bank Finland Plc was consolidated using the pooling method. Under the acqui-sition method, the acquisition is regarded as a transaction whereby the parent company indirectly acquires the group undertaking’s assets and assumes its liabilities and contin-gent liabilities. The group’s acquisition cost is established in a purchase price allocation analysis. In such analysis, the cost of the business combination is the aggregate of the fair values, at the date of exchange, of assets given, lia-bilities incurred or assumed and equity instruments issued by the acquirer, in exchange for the identifiable net assets acquired. Costs directly attributable to the business combination are expensed.
As at the acquisition date Nordea recognises the identi-fiable assets acquired and the liabilities assumed at their acquisition date fair values.
For each business combination Nordea measures the non-controlling interest in the acquired business either at fair value or at their proportionate share of the acquired identifiable net assets.
When the aggregate of the consideration transferred in a business combination and the amount recognised for non-controlling interest exceeds the net fair value of the identifi-able assets, liabilities and contingent liabilities, the excess is reported as goodwill. If the difference is negative, such dif-ference is recognised immediately in the income statement.
Equity and net income attributable to non-controlling interests are separately disclosed on the balance sheet, income statement and statement of comprehensive income.
Intra-group transactions and balances between the con-solidated group undertakings are eliminated.
The group undertakings are included in the consoli-dated accounts as from the date on which control is trans-ferred to Nordea and are no longer consolidated as from the date on which control ceases.
In the consolidation process the reporting from the group undertakings is adjusted to ensure consistency with the IFRS principles applied by Nordea.
Note P20 “Investments in group undertakings” lists the major group undertakings in the Nordea Group.
Investments in associated undertakingsThe equity method of accounting is used for associated undertakings where the share of voting rights is between
G1 Accounting policies

Accounting policies – Nordea Group
Nordea Annual Report 2015 75
20 and 50 per cent and/or where Nordea has significant influence. Significant influence is the power to participate in the financial and operating decisions of the investee but is not control over those policies. Investments within Nor-dea’s investment activities, which are classified as a ven-ture capital organisation within Nordea, are measured at fair value in accordance with the rules set out in IAS 28 and IAS 39. Further information on the equity method is disclosed in section 6 “Recognition of operating income and impairment”.
Profits from companies accounted for under the equity method are reported post-taxes in the income statement. Consequently, the tax expense related to these profits is not included in the income tax expense for Nordea.
Nordea does generally not have any sales or contribu-tion of assets to or from associated undertakings. Other transactions between Nordea and its associates are not eliminated.
Note G18 “Investments in associated undertakings” lists the major associated undertakings in the Nordea Group.
Structured entitiesA structured entity is an entity created to accomplish a narrow and well defined objective where voting rights are not the dominant factor in determining control. Often legal arrangements impose strict limits on the decision making powers of the management over the on-going activities of a structured entity. The same consolidation requirements apply to these entities, but as voting rights do not decide whether control exists, other factors are used to determine control.
Power can exist due to agreements or other types of influence over a structured entity. Nordea normally has power over entities sponsored or established by Nordea. Nordea has created a number of structured entities to allow clients to invest in assets invested in by the struc-tured entity. Some structured entities invest in tradable financial instruments, such as shares and bonds (mutual funds). Structured entities can also invest in structured credit products or acquire assets from customers of Nor-dea, although only one such structured entity currently exists. Nordea is generally the investment manager and has sole discretion about investments and other adminis-trative decisions and thus has power over these entities.
Typically, Nordea will receive service and commission fees in connection with the creation of the structured entity, or because it acts as investment manager, custodian or in some other function. Such income is normally not significant enough to expose Nordea to variability in returns and will thus not trigger consolidation. In some structured entities Nordea has also supplied substantial parts of the funding in the form of fund units, loans or credit commitments. In these structured entities Nordea is exposed to variability in returns and as the power over these entities affects the return, these structured entities are consolidated. Nordea normally considers a share of more than 30% of the return produced by a structured entity to give rise to variability and thus give control. Vari-ability is measured as the sum of fees received and revalu-ation of assets held. For unit linked and other contracts where the policyholder/depositor decide both the amount
and which assets to invest in, Nordea is considered to act as an agent and does thus not have control.
Further information about consolidated and unconsoli-dated structured entities is disclosed in note G47 “Inter-ests in structured entities”.
Currency translation of foreign entitiesThe consolidated financial statements are prepared in euro (EUR), the presentation currency of the parent company Nordea Bank AB (publ). The current method is used when translating the financial statements of foreign entities into EUR from their functional currency. The assets and liabili-ties of foreign entities have been translated at the closing rates, while items in the income statement and statement of comprehensive income are translated at the average exchange rate for the year. The average exchange rates are calculated based on daily exchange rates divided by the number of banking days in the period. Translation differ-ences are accounted for in other comprehensive income and are accumulated in the translation reserve in equity.
Goodwill and fair value adjustments arising from the acquisition of group undertakings are treated as items in the same functional currency as the cash generating unit to which they belong and are also translated at the closing rate.
Information on the most important exchange rates is disclosed in the separate section 27 “Exchange rates”.
6. Recognition of operating income and impairmentNet interest incomeInterest income and expense are calculated and recognised based on the effective interest rate method or, if considered appropriate, based on a method that results in an interest income or interest expense that is a reasonable approxima-tion of using the effective interest rate method as basis for the calculation. The effective interest includes fees consid-ered to be an integral part of the effective interest rate of a financial instrument (generally fees received as compensa-tion for risk). The effective interest rate equals the rate that discounts the contractual future cash flows to the carrying amount of the financial asset or financial liability.
Interest income and expenses from financial instru-ments are, with the exceptions described below, classified as “Net interest income”.
Interest income and interest expense related to all bal-ance sheet items held at fair value in Markets and Nordea Life & Pensions are classified as “Net result from items at fair value” in the income statement. Also the interest on the net funding of the operations in Markets is recognised on this line.
The interest component in FX swaps, and the interest paid and received in interest rate swaps plus changes in accrued interest, is classified as “Net result from items at fair value”, apart for derivatives used for hedging, includ-ing economical hedges of Nordea’s funding, where such components are classified as “Net interest income”.
Net fee and commission incomeNordea earns commission income from different services provided to its customers. The recognition of commission income depends on the purpose for which the fees are received. Fees are either recognised as revenue when ser-vices are provided or in connection to the execution of a
G1 Accounting policies

Nordea Group – Accounting policies
Nordea Annual Report 201576
significant act. Fees received in connection to performed services are recognised as income in the period these ser-vices are provided. A loan syndication fee received as pay-ment for arranging a loan, as well as other fees received as payments for certain acts, are recognised as revenue when the act has been completed, i.e. when the syndication has been finalised.
Commission expenses are normally transaction based and recognised in the period when the services are received.
Income from issued financial guarantees and expenses from bought financial guarantees, including fees paid to state guarantees, are amortised over the duration of the instruments and classified as “Fee and commission income” and “Fee and commission expense” respectively.
Net result from items at fair valueRealised and unrealised gains and losses on financial instruments measured at fair value through profit or loss are recognised in the item “Net result from items at fair value”.
Realised and unrealised gains and losses derive from:• Shares/participations and other share-related
instruments• Interest-bearing securities and other interest-related
instruments• Other financial instruments, including credit derivatives
as well as commodity instruments/derivatives• Foreign exchange gains/losses• Investment properties, which include realised and unre-
alised income, for instance revaluation gains and losses. This line also includes realised results from disposals as well as the running property yield stemming from the holding of investment properties.
Interest income and interest expense related to all balance sheet items held at fair value in Markets and Nordea Life & Pensions are classified as “Net result from items at fair value” in the income statement. Also the interest on the net funding of the operations in Markets is recognised on this line.
Also the ineffective portion of cash flow hedges and net investment hedges as well as recycled gains and losses on financial instruments classified into the category Available for sale are recognised in “Net result from items at fair value”.
This item also includes realised gains and losses from financial instruments measured at amortised cost, such as interest compensation received and realised gains/losses on buy-backs of issued own debt.
“Net result from items at fair value” includes also losses from counterparty risk on instruments classified into the category Financial assets at fair value through profit or loss as well as impairment on instruments classified into the category Available for sale. However, the fair value adjust-ments of credit risk on loans granted in accordance with the Danish mortgage finance law (see section 13 “Financial instruments” and Note G39 “Assets and liabilities at fair value”) are reported under “Net loan losses”. Impairment losses from instruments within other categories are recog-nised in the items ”Net loan losses” or “Impairment of securities held as financial non-current assets” (see also
the sub-sections ”Net loan losses” and “Impairment of securities held as financial non-current assets” below).
Dividends received are recognised in the income state-ment as “Net result from items at fair value” and classified as “Shares/participations and other share-related instru-ments” in the note. Income is recognised in the period in which the right to receive payment is established.
The income recognition and descriptions of the lines relating to life insurance are described in section 7 “Income recognition life insurance” below.
Profit from companies accounted for under the equity methodThe profit from companies accounted for under the equity method is defined as the post-acquisition change in Nor-dea’s share of net assets in the associated undertakings. Nordea’s share of items accounted for in other comprehen-sive income in the associated undertakings is accounted for in other comprehensive income in Nordea. Profits from companies accounted for under the equity method are, as stated in section 5 “Principles of consolidation”, reported in the income statement post-taxes. Consequently the tax expense related to these profits is excluded from the income tax expense for Nordea.
Fair values are, at acquisition, allocated to the associated undertaking’s identifiable assets, liabilities and contingent liabilities. Any difference between Nordea’s share of the fair values of the acquired identifiable net assets and the purchase price is goodwill or negative goodwill. Goodwill is included in the carrying amount of the associated undertaking. Subsequently the investment in the associ-ated undertaking increases/decreases with Nordea’s share of the post-acquisition change in net assets in the associ-ated undertaking and decreases through received divi-dends and impairment. An impairment charge can be reversed in a subsequent period.
The change in Nordea’s share of the net assets is gener-ally based on monthly reporting from the associated undertakings. For some associated undertakings not indi-vidually significant the change in Nordea’s share of the net assets is based on the external reporting of the associated undertakings and affects the financial statements of Nor-dea in the period in which the information is available. The reporting from the associated undertakings is, if applica-ble, adjusted to comply with Nordea’s accounting policies.
Other operating incomeNet gains from divestments of shares in group undertak-ings and associated undertakings and net gains on sale of tangible assets as well as other operating income, not related to any other income line, are generally recognised when it is probable that the benefits associated with the transaction will flow to Nordea and if the significant risks and rewards have been transferred to the buyer (generally when the transactions are finalised).
Net loan lossesImpairment losses from financial assets classified into the category Loans and receivables (see section 13 “Financial instruments”), in the items “Loans to central banks”, “Loans to credit institutions” and “Loans to the public” on the balance sheet, are reported as ”Net loan losses”
G1 Accounting policies

Accounting policies – Nordea Group
Nordea Annual Report 2015 77
together with losses from financial guarantees. Also the fair value adjustments of credit risk on loans granted in accordance with the Danish mortgage finance law (see section 13 “Financial instruments” and Note G39 “Assets and liabilities at fair value”) are reported under “Net loan losses”. Losses are reported net of any collateral and other credit enhancements. Nordea’s accounting policies for the calculation of impairment losses on loans can be found in section 14 “Loans to the public/credit institutions”.
Counterparty losses on instruments classified into the category Financial assets at fair value through profit or loss, including credit derivatives but excluding loans held at fair value as described above, as well as impairment on finan-cial assets classified into the category Available for sale are reported under “Net result from items at fair value”.
Impairment of securities held as financial non-current assetsImpairment on investments in interest-bearings securities, classified into the categories Loans and receivables or Held to maturity, and on investments in associated undertakings are classified as “Impairment of securities held as financial non-current assets” in the income statement. The policies covering impairment of financial assets classified into the categories Loans and receivables and Held to maturity are disclosed in section 13 “Financial instruments” and section 14 “Loans to the public/credit institutions”.
If observable indicators (loss events) indicate that an associated undertaking is impaired, an impairment test is performed to assess whether there is objective evidence of impairment. The carrying amount of the investment in the associate is compared with the recoverable amount (higher of value in use and fair value less cost to sell) and the carrying amount is written down to the recoverable amount if required.
Impairment losses are reversed if the recoverable amount increases. The carrying amount is then increased to the recoverable amount, but cannot exceed the carrying amount that would have been determined had no impair-ment loss been recognised.
7. Income recognition life insurance Premiums received, and repayments to policyholders, related to the saving part of the life insurance contracts are reported as increases or decreases of liabilities to policy-holders. See further information in section 19 “Liabilities to policyholders”.
The total income from life insurance mainly consists of the following components:• Cost result• Insurance risk result• Risk and performance margin• Investment return on additional capital in life insurance
The result from these components is, except for the cost result and the risk and performance margin relating to Unit Linked and Investment contracts, included in “Net result from items at fair value”.
The cost result is the result of expense loading from pol-icyholders and is included in the item “Fee and commis-sion income”, together with the risk and performance margin relating to Unit Linked and Investment contracts.
The related expenses are included in the items “Fee and commission expense” and “Operating expenses”. The pol-icyholder’s part of a positive or negative cost result (profit sharing) is included in the note line “Change in technical provisions, Life insurance” within Note G5 “Net result from items at fair value”.
The insurance risk result consists of income from indi-vidual risk products and from unbundled life insurance contracts as well as Health and personal accident insur-ance. The risk premiums are amortised over the coverage period as the provisions are reduced when insurance risk is released. A large part of the unbundled risk result from traditional life insurance is subject to profit sharing, which means that the policyholders receive a part of a net income or a net deficit. The risk income and the risk expenses are presented gross on the lines “Insurance risk income, Life insurance” and “Insurance risk expense, Life insurance” in Note G5 “Net result from items at fair value”. The policy-holder’s part of the result is included in the line “Change in technical provisions, Life insurance” in the note.
Gains and losses derived from investments in Nordea Life & Pensions are split on the relevant lines in Note G5 “Net result from items at fair value” as for any other invest-ment in Nordea. The lines include investment return on assets held to cover liabilities to policyholders and return on the additional capital allocated to Nordea Life & Pensions (Shareholders capital in the Nordea Life & Pensions group).
The note line “Change in technical provisions, Life insurance” in Note G5 “Net result from items at fair value” includes: • Investment returns on assets held to cover liabilities
to policyholders (including liabilities from tradition-al life insurance, unit linked insurance and investment contracts), individually transferred to policyholders’ accounts according to the contracts.
• Additional bonus (discretionary participation feature) to policyholders concerning traditional life insurance con-tracts or any other transfers to the policyholders to cov-er a periodical deficit between the investment result and any agreed minimum benefit to the policyholders.
• Risk and performance margin regarding traditional life insurance products according to local allocation rules in each Nordea Life & Pensions unit and according to con-tracts with policyholders. The recognition of a risk and performance margin in the income statement is mainly conditional on a positive result for traditional life insur-ance contracts. Risk and performance margins not possi-ble to recognise in the current period due to poor invest-ment results can, in some countries, partly or wholly be deferred to years with higher returns.
• The policyholders’ part of the cost- and risk result regarding traditional life insurance contracts or unit linked contracts.
The note line “Change in collective bonus potential, Life insurance” in Note G5 “Net result from items at fair value” relates only to traditional life insurance contracts. The line includes policyholders’ share of investment returns not yet individualised. The line includes also additional bonus (dis-cretionary participation feature) and amounts needed to cover a periodical deficit between the investment result and any minimum benefits to the policyholders.
G1 Accounting policies

Nordea Group – Accounting policies
Nordea Annual Report 201578
8. Recognition and derecognition of financial instruments on the balance sheetDerivative instruments, quoted securities and foreign exchange spot transactions are recognised on and derecognised (reclassified to the items “Other assets” or ”Other liabilities” on the balance sheet between trade date and settlement date) from the balance sheet on the trade date. Other financial instruments are recognised on the balance sheet on settlement date.
Financial assets, other than those for which trade date accounting is applied, are derecognised from the balance sheet when the contractual rights to the cash flows from the financial asset expire or are transferred to another party. The rights to the cash flows normally expire or are transferred when the counterpart has performed by e.g. repaying a loan to Nordea, i.e. on settlement date.
In some cases, Nordea enters into transactions where it transfers assets that are recognised on the balance sheet, but retains either all or a portion of risks and rewards from the transferred assets. If all or substantially all risks and rewards are retained, the transferred assets are not derecog-nised from the balance sheet. If Nordea’s counterpart can sell or repledge the transferred assets, the assets are reclas-sified to the item “Financial instruments pledged as collat-eral” on the balance sheet. Transfers of assets with retention of all or substantially all risks and rewards include e.g. secu-rities lending agreements and repurchase agreements.
Financial liabilities are derecognised from the balance sheet when the liability is extinguished. Normally this occurs when Nordea performs, for example when Nordea repays a deposit to the counterpart, i.e. on settlement date. Financial liabilities under trade date accounting are gener-ally reclassified to “Other liabilities” on the balance sheet on trade date.
For further information, see sections “Securities bor-rowing and lending agreements” and “Repurchase and reverse repurchase agreements” within section 13 “Finan-cial instruments”, as well as Note G42 “Transferred assets and obtained collaterals”.
9. Translation of assets and liabilities denominated in foreign currenciesThe functional currency of each entity (subsidiary or branch) is decided based upon the primary economic envi-ronment in which the entity operates. The parent company Nordea Bank AB (publ) uses two functional currencies (in addition to the functional currencies of the branches), SEK and EUR for reporting in consolidated accounts, based on the different activities in the underlying business.
Foreign currency is defined as any currency other than the functional currency of the entity. Foreign currency transactions are recorded at the exchange rate on the date of the transaction. Monetary assets and liabilities denomi-nated in foreign currencies are translated at the exchange rate on the balance sheet date.
Exchange differences arising on the settlement of trans-actions at rates different from those at the date of the transaction, and unrealised translation differences on unsettled foreign currency monetary assets and liabilities, are recognised in the income statement in the item “Net result from items at fair value”.
Translation differences on financial instruments that are
designated hedging instruments in a hedge of a net investment in a group undertaking are recognised in other comprehensive income, to the extent the hedge is effective. This is performed in order to offset the translation differ-ences affecting other comprehensive income when consol-idating the group undertaking into Nordea. Any ineffec-tiveness is recognised in the income statement in the item “Net result from items at fair value”.
10. Hedge accountingNordea applies the EU carve out version of IAS 39 for port-folio hedges of both assets and liabilities. The EU carve out macro hedging enables a group of derivatives (or propor-tions thereof) to be viewed in combination and be desig-nated as the hedging instrument. It also removes some of the limitations in fair value hedge accounting relating to hedging core deposits and under-hedging strategies.
Nordea uses hedge accounting in order to have a sym-metrical accounting treatment of the changes in fair value of the hedged item and changes in fair value of the hedg-ing instruments as well as to hedge the exposure to varia-bility in future cash flows and the exposure to net invest-ments in foreign operations.
There are three forms of hedge accounting:• Fair value hedge accounting• Cash flow hedge accounting• Hedges of net investments
Fair value hedge accountingFair value hedge accounting is used when derivatives are hedging changes in fair value of a recognised asset or lia-bility attributable to a specific risk. The risk of changes in fair value of assets and liabilities in Nordea’s financial statements originates mainly from loans, securities and deposits with a fixed interest rate, causing interest rate risk. Changes in fair value from derivatives as well as changes in fair value of the hedged item attributable to the risks being hedged are recognised separately in the income statement in the item “Net result from items at fair value”. Given an effective hedge, the two changes in fair value will more or less balance, meaning the net result is close to zero. The changes in fair value of the hedged item attributable to the risks hedged with the derivative instru-ment are reflected in an adjustment to the carrying amount of the hedged item, which is also recognised in the income statement. The fair value change of the hedged items held at amortised cost in a portfolio hedge of interest rate risks is reported separately from the portfolio in the item “Fair value changes of the hedged items in portfolio hedge of interest rate risk” on the balance sheet.
Fair value hedge accounting in Nordea is performed mainly on a portfolio basis. Any ineffectiveness is recog-nised in the income statement under the item “Net result from items at fair value”.
Hedged itemsA hedged item in a fair value hedge can be a recognised single asset or liability, an unrecognised firm commit-ment, or a portion thereof. The hedged item can also be a group of assets, liabilities or firm commitments with simi-lar risk characteristics. Hedged items in Nordea consist of
G1 Accounting policies

Accounting policies – Nordea Group
Nordea Annual Report 2015 79
both individual assets or liabilities and portfolios of assets and/or liabilities.
Hedging instrumentsThe hedging instruments used in Nordea are predomi-nantly interest rate swaps and cross currency interest rate swaps, which are always held at fair value. Cash instru-ments are only used as hedging instruments when hedg-ing currency risk.
Cash flow hedge accountingCash flow hedge accounting can be used for the hedging of exposure to variations in future interest payments on instruments with variable interest rates and for the hedg-ing of currency exposures. The portion of the gain or loss on the hedging instrument, that is determined to be an effective hedge, is recognised in other comprehensive income and accumulated in the cash flow hedge reserve in equity. The ineffective portion of the gain or loss on the hedging instrument is recycled to the item “Net result from items at fair value” in the income statement.
Gains or losses on hedging instruments recognised in the cash flow hedge reserve in equity through other com-prehensive income are recycled and recognised in the income statement in the same period as the hedged item affects profit or loss, normally in the period that interest income or interest expense is recognised.
Hedged itemsA hedged item in a cash flow hedge can be highly probable floating interest rate cash flows from recognised assets or liabilities or from future assets or liabilities. Nordea uses cash flow hedges when hedging currency risk in future payments of interest and principal in foreign currency.
Hedging instrumentsThe hedging instruments used in Nordea are predomi-nantly cross currency interest rate swaps, which are always held at fair value, where the currency component is desig-nated as a cash flow hedge of currency risk and the interest component as a fair value hedge of interest rate risk.
Hedges of net investmentsSee separate section 9 “Translation of assets and liabilities denominated in foreign currencies”.
Hedge effectivenessThe application of hedge accounting requires the hedge to be highly effective. A hedge is regarded as highly effective if at inception and throughout its life it can be expected that changes in fair value of the hedged item as regards the hedged risk can be essentially offset by changes in fair value of the hedging instrument. The result should be within a range of 80–125 per cent. When assessing hedge effectiveness retrospectively Nordea measures the fair value of the hedging instruments and compares the change in fair value of the hedging instrument to the change in fair value of the hedged item. The effectiveness measurement is made on a cumulative basis. The hypothetical derivative method is used when measuring the effectiveness of cash flow hedges, meaning that the change in a perfect hypo-thetical swap is used as proxy for the present value of the
cumulative change in expected future cash flows from the hedged transaction (the currency component).
If the hedge relationship does not fulfil the require-ments, hedge accounting is terminated. For fair value hedges the hedging instrument is reclassified to a trading derivative and the change in the fair value of the hedged item, up to the point when the hedge relationship is termi-nated, is amortised to the income statement on a straight-line basis over the remaining maturity of the hedged item.
In cash flow hedges, changes in the unrealised value of the hedging instrument will prospectively from the last time it was proven effective be accounted for in the income statement. The cumulative gain or loss on the hedging instrument that has been recognised in the cash flow hedge reserve in equity through other comprehensive income from the period when the hedge was effective is reclassified from equity to “Net result from items at fair value” in the income statement if the expected transaction no longer is expected to occur. If the expected transaction no longer is highly probable, but is still expected to occur, the cumulative gain or loss on the hedging instrument that has been recognised in other comprehensive income from the period when the hedge was effective remains in other comprehensive income until the transaction occurs or is no longer expected to occur.
11. Determination of fair value of financial instrumentsFinancial assets and liabilities classified into the categories Financial assets/liabilities at fair value through profit or loss (including derivative instruments) are recorded at fair value on the balance sheet with changes in fair value rec-ognised in the income statement in the item “Net result from items at fair value”.
Fair value is defined as the price that at the measure-ment date would be received to sell an asset or paid to transfer a liability in an orderly transaction between mar-ket participants under current market conditions in the principal market for the asset or liability or, in the absence of a principal market, in the most advantageous market for the asset or liability.
The existence of published price quotations in an active market is the best evidence of fair value and when they exist they are used to measure financial assets and finan-cial liabilities. An active market for the asset or liability is a market in which transactions for the asset or liability occur with sufficient frequency and volume to provide pricing information on an on-going basis. The absolute level for liquidity and volume required for a market to be considered active vary with the instrument classes. For some classes low price volatility is seen, also for those instruments within the class where the trade frequency is high. For instruments in such a class the liquidity require-ments are lower and, correspondingly, the age limit for the prices used for establishing fair value is higher.
If markets are active or non-active is assessed regularly. The trade frequency and volume are monitored daily.
Nordea is predominantly using published price quota-tions to establish fair value for items disclosed under the following balance sheet items:• Interest-bearing securities• Shares (listed)• Derivatives (listed)
G1 Accounting policies

Nordea Group – Accounting policies
Nordea Annual Report 201580
• Debt securities in issue (issued mortgage bonds in Nordea Kredit Realkreditaktieselskab)
If quoted prices for a financial instrument fail to represent actual and regularly occurring market transactions or if quoted prices are not available, fair value is established by using an appropriate valuation technique. The adequacy of the valuation technique, including an assessment of whether to use quoted prices or theoretical prices, is moni-tored on a regular basis.
Valuation techniques can range from simple discounted cash flow analysis to complex option pricing models. Valu-ation models are designed to apply observable market prices and rates as input whenever possible, but can also make use of unobservable model parameters. The ade-quacy of the valuation model is assessed by measuring its capability to hit market prices. This is done by comparison of calculated prices to relevant benchmark data, e.g. quoted prices from exchanges, the counterparty s valua-tions, price data from consensus services etc.
Nordea is predominantly using valuation techniques to establish fair value for items disclosed under the following balance sheet items:• Loans to the public (mortgage loans in Nordea Kredit
Realkreditaktieselskab)• Interest-bearing securities (when quoted prices in an
active market are not available)• Shares (when quoted prices in an active market are not
available)• Derivatives (OTC-derivatives)
For financial instruments, where fair value is estimated by a valuation technique, it is investigated whether the varia-bles used in the valuation model are predominantly based on data from observable markets. By data from observable markets, Nordea considers data that can be collected from generally available external sources and where this data is judged to represent realistic market prices. If non-observa-ble data has a significant impact on the valuation, the instrument cannot be recognised initially at the fair value estimated by the valuation technique and any upfront gains are thereby deferred and amortised through the income statement over the contractual life of the instrument. The deferred upfront gains are subsequently released to income if the non-observable data becomes observable.
Note G39 “Assets and liabilities at fair value” provides a breakdown of fair values of financial instruments meas-ured on the basis of:• quoted prices in active markets for the same instrument
(level 1), • valuation technique using observable data (level 2), and • valuation technique using non-observable data (level 3).
The valuation models applied by Nordea are consistent with accepted economic methodologies for pricing finan-cial instruments and incorporate the factors that market participants consider when setting a price.
New valuation models are subject to approval by a Model Risk Management Committee and all models are reviewed on a regular basis.
For further information, see Note G39 “Assets and lia-bilities at fair value”.
12. Cash and balances with central banksCash comprises legal tender and bank notes in foreign currencies. Balances with central banks consist of deposits in accounts with central banks and postal giro systems under government authority, where the following condi-tions are fulfilled:• The central bank or the postal giro system is domiciled
in the country where the institutions is established• The balance is readily available at any time
13. Financial instrumentsClassification of financial instrumentsEach financial instrument has been classified into one of the following categories:
Financial assets:• Financial assets at fair value through profit or loss: – Held for trading – Designated at fair value through profit or loss
(fair value option)• Loans and receivables• Held to maturity• Available for sale
Financial liabilities:• Financial liabilities at fair value through profit or loss: – Held for trading – Designated at fair value through profit or loss
(fair value option)• Other financial liabilities
All financial assets and liabilities are initially measured at fair value. The classification of financial instruments into different categories forms the basis for how each instru-ment is subsequently measured on the balance sheet and how changes in its value are recognised. In Note G38“Classification of financial instruments” the classifica-tion of the financial instruments on Nordea’s balance sheet into different categories is presented.
Financial assets and financial liabilities at fair value through profit or lossFinancial assets and financial liabilities at fair value through profit or loss are measured at fair value, excluding transaction costs. All changes in fair values are recognised directly in the income statement in the item “Net result from items at fair value”.
The category consists of two sub-categories; Held for trading and Designated at fair value through profit or loss (fair value option).
The sub-category Held for trading mainly contains deriv-ative instruments that are held for trading purposes, inter-est-bearing securities and shares within Markets and Treas-ury. It also contains trading liabilities such as short-selling positions and lending in reverse repurchase agreements.
The major parts of the financial assets/liabilities classi-fied into the category Designated at fair value through profit or loss are mortgage loans and related issued bonds in the Danish subsidiary Nordea Kredit Realkreditaktie-selskab and interest-bearing securities, shares and invest-ment contracts in Nordea Life & Pensions.
Assets and liabilities in Nordea Kredit Realkreditaktie-selskab are classified into the category Designated at fair
G1 Accounting policies

Accounting policies – Nordea Group
Nordea Annual Report 2015 81
value through profit or loss to eliminate or significantly reduce an accounting mismatch. When Nordea grants mortgage loans to customers in accordance with the Danish mortgage finance law Nordea at the same time issues bonds with matching terms, so called “match funding”. The cus-tomers can repay the loans either through repayments of the principal or by purchasing the issued bonds and return them to Nordea as a settlement of the loan. The bonds play an important part in the Danish money market and Nordea consequently buys and sells own bonds in the market. If the loans and bonds were measured at amortised cost such buy-backs of bonds would give rise to an accounting mis-match as any gains or losses would have to be recognised immediately in the income statement. If such bonds are subsequently sold in the market any premium or discount would be amortised over the expected maturity, which would also create an accounting mismatch. To avoid such an accounting mismatch Nordea measures both the loans and bonds at fair value through profit or loss.
Interest-bearing securities, shares and investment con-tracts (defined in section 19 “Liabilities to policyholders”) in Nordea Life & Pensions are generally also classified into the category Designated at fair value through profit or loss to eliminate or significantly reduce an accounting mismatch. The investment contracts (unit-linked) classi-fied as “Liabilities to policyholders” on the balance sheet are managed at fair value and consequently classified into the category Designated at fair value through profit or loss. This applies also to assets held under insurance con-tracts (defined in section 19 “Liabilities to policyholders”), which are classified into the category Designated at fair value through profit or loss to reduce an accounting mis-match with the liabilities to policyholders that are gener-ally measured at current value.
Also assets held under so called “pooled schemes”, which is a product similar to unit-linked insurance, are classified into the category Designated at fair value through profit or loss to avoid an accounting mismatch with the related deposits that are managed at fair value and consequently also classified into the category Desig-nated at fair value through profit or loss.
Nordea also applies the fair value option on certain financial assets and financial liabilities related to Markets. The classification stems from that Markets is managing and measuring its financial assets and liabilities at fair value. Consequently, the majority of financial assets and financial liabilities in Markets are classified into the cate-gories Financial assets/Financial liabilities at fair value through profit or loss.
Loans and receivablesLoans and receivables are non-derivative financial assets, with fixed or determinable payments, that are not quoted in an active market. These assets and their impairment are further described in the separate section 14 “Loans to the public/credit institutions”.
Held to maturityFinancial assets that Nordea has chosen to classify into the category Held to maturity are non-derivative financial assets with fixed or determinable payments and fixed maturity that Nordea has the positive intent and ability to
hold to maturity. Financial assets classified into the cate-gory Held to maturity are initially recognised on the bal-ance sheet at the acquisition price, including transaction costs. Subsequent to initial recognition, the instruments within this category are measured at amortised cost. In an amortised cost measurement, the difference between acquisition cost and redemption value is amortised in the income statement over the remaining term using the effec-tive interest rate method.
If more than an insignificant amount of the Held to maturity portfolio is sold or transferred the Held to matu-rity category is tainted, except for if the sale or transfer either occur close to maturity, after substantially all of the original principal is already collected, or due to an isolated non-recurring event beyond the control of Nordea.
Nordea assesses at each reporting date whether there is any objective evidence that the asset is impaired. If there is such evidence, an impairment loss is recorded. The loss is calculated as the difference between the carrying amount and the present value of estimated future cash flows and is recognised as “Impairment of securities held as financial non-current assets” in the income statement. See section 14 “Loans to the public/credit institutions” for more information on the identification and measurement of objective evidence of impairment, which is applicable also for interest-bearings securities classified into the cate-gory Held to maturity.
Available for saleFinancial instruments classified into the category Availa-ble for sale are measured at fair value. Changes in fair val-ues, except for interest, foreign exchange effects and impairment losses, are recognised in the fair value reserve in equity through other comprehensive income. Interest is recognised in the item “Interest income” and foreign exchange effects and impairment losses in the item “Net result from items at fair value” in the income statement.
When an instrument classified into the category Availa-ble for sale is disposed of, the fair value changes that pre-viously have been accumulated in the fair value reserve (related to Available for sale investments) in other compre-hensive income are removed from equity and recognised in the income statement in the item “Net result from items at fair value”.
Financial assets classified into the category Available for sale are assessed in order to determine any need for impairment losses. If there is objective evidence of impair-ment, the accumulated loss that has been recognised in other comprehensive income is removed from equity and recognised as “Net result from items at fair value” in the income statement. The amount of the accumulated loss that is recycled from equity is the difference between the asset’s acquisition cost and current fair value. For equity investments a prolonged or significant decline in the fair value, compared to the acquisition cost, is considered to be objective evidence of impairment. Objective evidence of impairment for a debt instrument is rather connected to a loss event, such as an issuer’s financial difficulty.
Other financial liabilitiesFinancial liabilities, other than those classified into the category Financial liabilities at fair value through profit or
G1 Accounting policies

Nordea Group – Accounting policies
Nordea Annual Report 201582
loss, are measured at amortised cost. Interest on Other financial liabilities is recognised in the item “Interest expense” in the income statement.
Hybrid (combined) financial instrumentsHybrid (combined) financial instruments are contracts containing a host contract and an embedded derivative instrument. Such combinations arise predominantly from the issuance of structured debt instruments, such as issued index-linked bonds.
Index-linked bonds issued by Group Treasury are con-sidered to be part of the funding activities. The zero cou-pon bond, is measured at amortised cost. The embedded derivatives in those instruments are separated from the host contract and accounted for as stand-alone derivatives at fair value, if the economic characteristics and risks of the embedded derivative are not closely related to the eco-nomic characteristics and risks of the host contract, and the embedded derivative meets the definition of a deriva-tive instrument. Changes in fair values, of the embedded derivatives, are recognised in the income statement in the item “Net result from items at fair value”.
Index-linked bonds issued by Markets as part of the trading portfolio are classified into the category Held for trading, and the entire combined instrument, host con-tract together with the embedded derivative, is measured at fair value through profit or loss. Changes in fair values are recognised in the income statement in the item “Net result from items at fair value”. From a presentation per-spective the host contract is on the balance sheet pre-sented as “Debt securities in issue” and the embedded derivative as “Derivatives”.
Securities borrowing and lending agreementsGenerally, securities borrowing and securities lending transactions are entered into on a collateralised basis. Unless the risks and rewards of ownership are transferred, the securities are not recognised on or derecognised from the balance sheet. In the cases where the counterpart is entitled to resell or repledge the securities, the securities are reclassified to the balance sheet item “Financial instru-ments pledged as collateral”.
Securities in securities lending transactions are also disclosed in the item “Assets pledged as security for own liabilities”.
Cash collateral advanced (securities borrowing) to the counterparts is recognised on the balance sheet as “Loans to central banks”, “Loans to credit institutions” or as “Loans to the public”. Cash collateral received (securities lending) from the counterparts is recognised on the bal-ance sheet as “Deposits by credit institutions” or as “Deposits and borrowings from the public”.
Repurchase and reverse repurchase agreementsSecurities delivered under repurchase agreements and securities received under reverse repurchase agreements are not derecognised from or recognised on the balance sheet. In the cases where the counterpart has the right to resell or repledge the securities, the securities are reclassi-fied to the balance sheet line “Financial instruments pledged as collateral”.
Securities delivered under repurchase agreements are
also disclosed in the item “Assets pledged as security for own liabilities”.
Cash received under repurchase agreements is recog-nised on the balance sheet as “Deposits by credit institu-tions” or as “Deposits and borrowings from the public”. Cash delivered under reverse repurchase agreements is recognised on the balance sheet as “Loans to central banks”, “Loans to credit institutions” or as “Loans to the public”.
Additionally, the sale of securities received in reverse repurchase agreements trigger the recognition of a trading liability (short sale).
DerivativesAll derivatives are recognised on the balance sheet and measured at fair value. Derivatives with total positive fair values, including any accrued interest, are recognised as assets in the item “Derivatives” on the asset side. Deriva-tives with total negative fair values, including any accrued interest, are recognised as liabilities in the item “Deriva-tives” on the liability side.
Realised and unrealised gains and losses from deriva-tives are recognised in the income statement in the item “Net result from items at fair value”.
Offsetting of financial assets and liabilitiesNordea offsets financial assets and liabilities on the bal-ance sheet if there is a legal right to offset, in the ordinary course of business and in case of bankruptcy, and if the intent is to settle the items net or realise the asset and set-tle the liability simultaneously. This is generally achieved through the central counterparty clearing houses that Nordea has agreements with.
Exchanged traded derivatives are generally accounted for as settled on a daily basis when cash is paid or received and the instrument is reset to market terms. Derivative assets and liabilities against central counterparty clearing houses are, as mentioned above, generally set off on the balance sheet, but net cash collateral received or paid is generally accounted for separately as cash collateral paid (asset) or received (liability), which is also the case for cash collateral paid or received in bilateral OTC derivative transactions. Cash collateral paid or received in bilateral OTC derivative transactions are consequently not offset against the fair value of the derivatives.
Issued debt and equity instrumentsA financial instrument issued by Nordea is either classi-fied as a financial liability or equity. Issued financial instruments are classified as a financial liability if the con-tractual arrangement results in Nordea having a present obligation to either deliver cash or another financial asset, or a variable number of equity instruments to the holder of the instrument. If this is not the case, the instrument is generally an equity instrument and classified as equity, net of transaction costs. Where issued financial instru-ments contain both liability and equity components, these are accounted for separately.
14. Loans to the public/credit institutionsFinancial instruments classified as “Loans to the public/credit institutions” (including loans to central banks) on
G1 Accounting policies

Accounting policies – Nordea Group
Nordea Annual Report 2015 83
the balance sheet and into the category Loans and receiva-bles are measured at amortised cost (see also the separate section 8 “Recognition and derecognition of financial instruments on the balance sheet” as well as Note G38 ”Classification of financial instruments”).
Nordea monitors loans as described in the separate sec-tion on Risk, Liquidity and Capital management. Loans attached to individual customers or groups of customers are identified as impaired if the impairment tests indicate an objective evidence of impairment.
Also interest-bearings securities classified into the cate-gories Loans and receivables and Held to maturity are held at amortised cost and the description below is valid also for the identification and measurement of impairment on these assets. Possible impairment losses on interest-bearing securities classified into the categories Loans and receivables and Held to maturity are recognised as “Impairment of securities held as non-current financial assets” in the income statement.
Impairment test of individually assessed loansNordea tests all loans for impairment on an individual basis. The purpose of the impairment tests is to find out if the loans have become impaired. As a first step in the identification process for impaired loans, Nordea monitors whether there are indicators of impairment (loss event) and whether these loss events represent objective evidence of impairment. More information on the identification of loss events can be found in the Risk, Liquidity and Capital management section.
Loans that are not individually impaired will be trans-ferred to a group of loans with similar risk characteristics for a collective impairment test.
Impairment test of collectively assessed loansLoans not impaired on an individual basis are collectively tested for impairment.
These loans are grouped on the basis of similar credit risk characteristics that are indicative of the debtors´ abil-ity to pay all amounts due according to the contractual terms. Nordea monitors its portfolio through rating migra-tions, the credit decision and annual review process sup-plemented by quarterly risk reviews. Through these pro-cesses Nordea identifies loss events indicating incurred losses in a group. A loss event is an event resulting in a deterioration of the expected future cash flows. Only loss events incurred up to the reporting date are included when performing the assessment of the group.
The objective for the group assessment process is to evaluate if there is a need to make a provision due to the fact that a loss event has occurred, which has not yet been identified on an individual basis. This period between the date when the loss event occurred and the date when it is identified on an individual basis is called “Emergence period”. The impairment remains related to the group of loans until the losses have been identified on an individ-ual basis. The identification of the loss is made through a default of the engagement or by other indicators.
For corporate customers and bank counterparts, Nordea uses the existing rating system as a basis when assessing the credit risk. Nordea uses historical data on probability of default to estimate the risk for a default in a rating class.
These loans are rated and grouped mostly based on type of industry and/or sensitivity to certain macro parameters, e.g. dependency to oil prices etc.
Personal customers and small corporate customers are monitored through scoring models. These are based mostly on historical data, as default rates and loss rates given a default, and experienced judgement performed by management. Rating and scoring models are described in more detail in the separate section on Risk, Liquidity and Capital management.
Impairment lossIf the carrying amount of the loans is higher than the sum of the net present value of estimated cash flows (dis-counted with the original effective interest rate), including the fair value of the collaterals and other credit enhance-ments, the difference is the impairment loss.
For significant loans that have been individually identi-fied as impaired the measurement of the impairment loss is made on an individual basis.
For insignificant loans that have been individually iden-tified as impaired and for loans not identified as impaired on an individual basis the measurement of the impairment loss is measured using a portfolio based expectation of the future cash flows.
If the impairment loss is not regarded as final, the impairment loss is accounted for on an allowance account representing the accumulated impairment losses. Changes in the credit risk and accumulated impairment losses are accounted for as changes in the allowance account and as ”Net loan losses” in the income statement (see also section 6 “Recognition of operating income and impairment”).
If the impairment loss is regarded as final, it is reported as a realised loss and the value of the loan and the related allowance for impairment loss are derecognised. An impairment loss is regarded as final when the obligor is filed for bankruptcy and the administrator has declared the economic outcome of the bankruptcy procedure, or when Nordea forgives its claims either through a legal based or voluntary reconstruction or when Nordea, for other rea-sons, deem it unlikely that the claim will be recovered.
Discount rateThe discount rate used to measure impairment is the orig-inal effective interest rate for loans attached to an individ-ual customer or, if applicable, to a group of loans. If con-sidered appropriate, the discount rate can be based on a method that results in an impairment that is a reasonable approximation of using the effective interest rate method as basis for the calculation.
Restructured loansIn this context a restructured loan is defined as a loan where Nordea has granted concessions to the obligor due to its deteriorated financial situation and where this con-cession has resulted in an impairment loss for Nordea. After a reconstruction the loan is normally regarded as not impaired if it performs according to the new conditions. Concessions made in reconstructions are regarded as loan losses unless Nordea retains the possibility to regain the loan losses incurred. In the event of a recovery the pay-ment is reported as a recovery of loan losses.
G1 Accounting policies
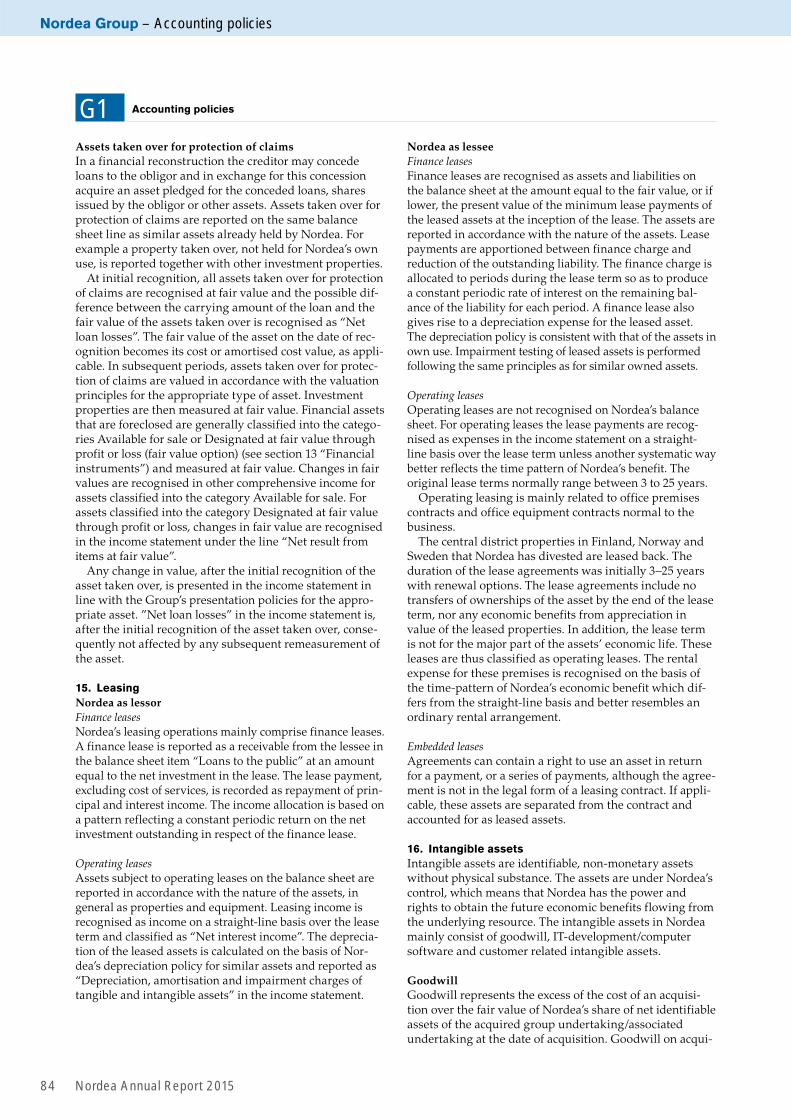
Nordea Group – Accounting policies
Nordea Annual Report 201584
Assets taken over for protection of claimsIn a financial reconstruction the creditor may concede loans to the obligor and in exchange for this concession acquire an asset pledged for the conceded loans, shares issued by the obligor or other assets. Assets taken over for protection of claims are reported on the same balance sheet line as similar assets already held by Nordea. For example a property taken over, not held for Nordea’s own use, is reported together with other investment properties.
At initial recognition, all assets taken over for protection of claims are recognised at fair value and the possible dif-ference between the carrying amount of the loan and the fair value of the assets taken over is recognised as “Net loan losses”. The fair value of the asset on the date of rec-ognition becomes its cost or amortised cost value, as appli-cable. In subsequent periods, assets taken over for protec-tion of claims are valued in accordance with the valuation principles for the appropriate type of asset. Investment properties are then measured at fair value. Financial assets that are foreclosed are generally classified into the catego-ries Available for sale or Designated at fair value through profit or loss (fair value option) (see section 13 “Financial instruments”) and measured at fair value. Changes in fair values are recognised in other comprehensive income for assets classified into the category Available for sale. For assets classified into the category Designated at fair value through profit or loss, changes in fair value are recognised in the income statement under the line “Net result from items at fair value”.
Any change in value, after the initial recognition of the asset taken over, is presented in the income statement in line with the Group’s presentation policies for the appro-priate asset. ”Net loan losses” in the income statement is, after the initial recognition of the asset taken over, conse-quently not affected by any subsequent remeasurement of the asset.
15. LeasingNordea as lessorFinance leasesNordea’s leasing operations mainly comprise finance leases. A finance lease is reported as a receivable from the lessee in the balance sheet item “Loans to the public” at an amount equal to the net investment in the lease. The lease payment, excluding cost of services, is recorded as repayment of prin-cipal and interest income. The income allocation is based on a pattern reflecting a constant periodic return on the net investment outstanding in respect of the finance lease.
Operating leasesAssets subject to operating leases on the balance sheet are reported in accordance with the nature of the assets, in general as properties and equipment. Leasing income is recognised as income on a straight-line basis over the lease term and classified as “Net interest income”. The deprecia-tion of the leased assets is calculated on the basis of Nor-dea’s depreciation policy for similar assets and reported as “Depreciation, amortisation and impairment charges of tangible and intangible assets” in the income statement.
Nordea as lesseeFinance leasesFinance leases are recognised as assets and liabilities on the balance sheet at the amount equal to the fair value, or if lower, the present value of the minimum lease payments of the leased assets at the inception of the lease. The assets are reported in accordance with the nature of the assets. Lease payments are apportioned between finance charge and reduction of the outstanding liability. The finance charge is allocated to periods during the lease term so as to produce a constant periodic rate of interest on the remaining bal-ance of the liability for each period. A finance lease also gives rise to a depreciation expense for the leased asset. The depreciation policy is consistent with that of the assets in own use. Impairment testing of leased assets is performed following the same principles as for similar owned assets.
Operating leasesOperating leases are not recognised on Nordea’s balance sheet. For operating leases the lease payments are recog-nised as expenses in the income statement on a straight-line basis over the lease term unless another systematic way better reflects the time pattern of Nordea’s benefit. The original lease terms normally range between 3 to 25 years.
Operating leasing is mainly related to office premises contracts and office equipment contracts normal to the business.
The central district properties in Finland, Norway and Sweden that Nordea has divested are leased back. The duration of the lease agreements was initially 3–25 years with renewal options. The lease agreements include no transfers of ownerships of the asset by the end of the lease term, nor any economic benefits from appreciation in value of the leased properties. In addition, the lease term is not for the major part of the assets’ economic life. These leases are thus classified as operating leases. The rental expense for these premises is recognised on the basis of the time-pattern of Nordea’s economic benefit which dif-fers from the straight-line basis and better resembles an ordinary rental arrangement.
Embedded leasesAgreements can contain a right to use an asset in return for a payment, or a series of payments, although the agree-ment is not in the legal form of a leasing contract. If appli-cable, these assets are separated from the contract and accounted for as leased assets.
16. Intangible assetsIntangible assets are identifiable, non-monetary assets without physical substance. The assets are under Nordea’s control, which means that Nordea has the power and rights to obtain the future economic benefits flowing from the underlying resource. The intangible assets in Nordea mainly consist of goodwill, IT-development/computer software and customer related intangible assets.
GoodwillGoodwill represents the excess of the cost of an acquisi-tion over the fair value of Nordea’s share of net identifiable assets of the acquired group undertaking/associated undertaking at the date of acquisition. Goodwill on acqui-
G1 Accounting policies

Accounting policies – Nordea Group
Nordea Annual Report 2015 85
sition of group undertakings is included in “Intangible assets”. Goodwill on acquisitions of associates is not rec-ognised as a separate asset, but included in “Investments in associated undertakings”. Goodwill is tested annually for impairment or more frequently if events or changes in circumstances indicate that it might be impaired. Good-will is carried at cost less accumulated impairment losses. Impairment losses on goodwill cannot be reversed in sub-sequent periods. Goodwill related to associated undertak-ings is not tested for impairment separately, but included in the total carrying amount of the associated undertak-ings. The policies covering impairment testing of associ-ated undertakings is disclosed in section 6 “Recognition of operating income and impairment”.
IT-development/Computer softwareCosts associated with maintaining computer software programs are expensed as incurred. Costs directly associ-ated with major software development investments, with the ability to generate future economic benefits, are recog-nised as intangible assets. These costs include software development staff costs and overhead expenditures directly attributable to preparing the asset for use. Computer soft-ware includes also acquired software licenses not related to the function of a tangible asset.
Amortisation is calculated on a straight-line basis over the useful life of the software, generally a period of 3 to 10 years.
Customer related intangible assetsIn business combinations a portion of the purchase price is normally allocated to a customer related intangible asset, if the asset is identifiable and under Nordea’s control. An intangible asset is identifiable if it arises from contractual or legal rights, or could be separated from the entity and sold, transferred, licenced, rented or exchanged. The asset is amortised over its useful life, generally over 10 years.
Impairment Goodwill and IT-development not yet taken into use is not amortised but tested for impairment annually irrespective of any indications of impairment. Impairment testing is also performed more frequently if required due to any indication of impairment. The impairment charge is calcu-lated as the difference between the carrying amount and the recoverable amount.
At each balance sheet date, all intangible assets with definite useful lives, including IT-development taken into use, are reviewed for indications of impairment. If such indications exist, an analysis is performed to assess whether the carrying amount of the intangible asset is fully recoverable.
The recoverable amount is the higher of fair value less costs to sell and the value in use of the asset or the cash-generating unit, which is defined as the smallest identifia-ble group of assets that generates largely independent cash flows in relation to other assets. For goodwill and IT-development not yet taken into use, the cash generating units are defined as the operating segments. The value in use is the present value of the cash flows expected to be realised from the asset or the cash-generating unit. The cash flows are assessed based on the asset or cash-gener-ating unit in its current condition and discounted at a rate
based on the long-term risk free interest rate plus a risk premium (post tax). If the recoverable amount is less than the carrying amount, an impairment loss is recognised. See Note G19 “Intangible assets” for more information on the impairment testing.
17. Properties and equipmentProperties and equipment includes own-used properties, leasehold improvements, IT equipment, furniture and other equipment. Items of properties and equipment are measured at cost less accumulated depreciation and accu-mulated impairment losses. The cost of an item of proper-ties and equipment comprise its purchase price, as well as any directly attributable costs of bringing the asset to the working condition for its intended use. When parts of an item of property and equipment have different useful lives, they are accounted for as separate items.
Properties and equipment is depreciated on a straight-line basis over the estimated useful life of the assets. The estimates of the useful life of different assets are reassessed on a yearly basis. Below follows the current estimates:
Buildings 30–75 yearsEquipment 3–5 yearsLeasehold improvements Changes within buildings the
shorter of 10 years and the remaining leasing term. New construction the shorter of the principles used for owned buildings and the remaining leasing term. Fixtures installed in leased properties are depre-ciated over the shorter of 10–20 years and the remaining leas-ing term.
At each balance sheet date, Nordea assesses whether there is any indication that an item of property and equipment may be impaired. If any such indication exists, the recov-erable amount of the asset is estimated and any impair-ment loss is recognised.
Impairment losses are reversed if the recoverable amount increases. The carrying amount is then increased to the recoverable amount, but cannot exceed the carrying amount that would have been determined had no impair-ment loss been recognised.
18. Investment propertiesInvestment properties are primarily properties held to earn rent and/or capital appreciation. The majority of the properties in Nordea are attributable to Nordea Life & Pensions. Nordea applies the fair value model for subse-quent measurement of investment properties. The best evidence of a fair value is normally given by quoted prices in an active market for similar properties in the same loca-tion and condition. As these prices are rarely available dis-counted cash flow projection models based on reliable estimates of future cash flows are also used.
Net rental income, gains and losses as well as fair value adjustments are recognised directly in the income state-ment as “Net result from items at fair value”.
G1 Accounting policies

Nordea Group – Accounting policies
Nordea Annual Report 201586
19. Liabilities to policyholdersLiabilities to policyholders include obligations according to insurance contracts and investment contracts with poli-cyholders.
An insurance contract is defined as “a contract under which one party (the insurer) accepts significant insurance risks from another party (the policyholder) by agreeing to compensate the policyholder if a specified uncertain future event (the insured event) adversely affects the poli-cyholder”.
Investment contracts are contracts with policyholders that have the legal form of insurance contracts but where the insurance risk transfer has been assessed to be insig-nificant.
The insurance risk is generally calculated as the risk sum payable as a percentage of the reserve behind the contract at the beginning of the contract period. It is Nor-dea’s assessment that a risk percentage of five or higher is a significant insurance risk.
The contracts can be divided into the following classes:• Insurance contracts: – Traditional life insurance contracts with and without
discretionary participation feature – Unit-Linked contracts with significant insurance risk – Health and personal accident • Investment contracts: – Investment contracts with discretionary participation
feature – Investment contracts without discretionary participa-
tion feature
Insurance contracts The measurement principles under local GAAP have been maintained consequently resulting in a non-uniform accounting policies method on consolidation.
Traditional life insurance provisions represent consoli-dated provisions for all the companies in Nordea Life & Pensions, including companies in Sweden, Norway, Fin-land, Denmark, Poland, Luxembourg, Isle of Man, Estonia and Lithuania.
In Denmark, Sweden and Finland the measurements are prepared by calculating the present value of future bene-fits, to which the policyholders are entitled. The calcula-tion includes assumptions about market consistent dis-counting rates as well as expenses and life risk. The discount rate is based on the liabilities’ current term. In Denmark, the provision, in addition, includes bonus potential on paid policies and on future premiums.
In Norway the provisions are mainly calculated on the basis of a prospective method. The discount rate used is equal to the original tariff rates adjusted for assumptions about expenses and risk.
The accounting policy for each company is based on the local structure of the business and is closely related to sol-vency rules and national regulation concerning profit sharing and other requirements about collective bonus potential.
Unit-Linked contracts represent life insurance provi-sions relating to Unit-Linked policies written either with or without an investment guarantee. Unit-Linked con-tracts classified as insurance contracts include the same insurance risk elements as traditional insurance contracts.
These contracts are mainly recognised and measured at fair value on the basis of: • the fair value of the assets linked to the Unit-Linked
contracts, and• the estimated present value of the insurance risk which
is calculated in the same way as traditional insurance contracts considering the impact on every risk element included in the cash flows.
Health and personal accident provisions include premium reserves and claims outstanding. This item is recognised and measured on deferred basis in the same way as gen-eral insurance contracts.
Investment contracts Investment contracts are contracts with policyholders, which do not transfer sufficient insurance risk to be classi-fied as insurance contracts.
However, investment contracts with discretionary par-ticipation features are, in line with IFRS 4, accounted for as insurance contracts using local accounting principles. Nordea Life & Pension has only a small number of these contracts.
Investment contracts without discretionary participation features are recognised and measured at fair value in accordance with IAS 39 “Financial Instruments: Recogni-tion and Measurement”, equal to fair value of the assets linked to these contracts. These assets are classified into the category Designated at fair value through profit or loss to eliminate or significantly reduce an accounting mismatch.
Discretionary participating features (DPF)Some traditional life insurance contracts and investment contracts include a contractual right for the policyholder to receive significant benefits in addition to guaranteed ben-efits. Nordea has discretion to pay these additional bene-fits as bonus on risk result, expense result and interest rate. These DPF-contracts (Collective bonus potential) are classified as liabilities on the balance sheet.
Collective bonus potential includes amounts allocated but not attributed to the policyholders. In Finland, collec-tive bonus potential includes the policyholder’s part of the total unrealised investment gains and bonus potential on paid policies and future premiums (the difference between retrospective and market consistent prospective measure-ment principles of the insurance contracts). In Norway, collective bonus potential includes the policyholder’s part of both the total unrealised investment gains and addi-tional reserves. In Sweden and Denmark, the main valua-tion principle is fair value (insurance contracts). The poli-cyholder’s part of both realised and unrealised investment gains is therefore included on the balance sheet represent-ing either “Change in technical provisions, Life insurance” and/or “Change in collective bonus potentials, Life insur-ance”, depending on whether the investment result is allo-cated or not. Both the mentioned lines are included on the balance sheet line “Liabilities to policyholders”.
Liability adequacy testThe adequacy of insurance provisions is assessed at each reporting date to ensure that the carrying amount of the liabilities is higher than the best estimate of future cash
G1 Accounting policies
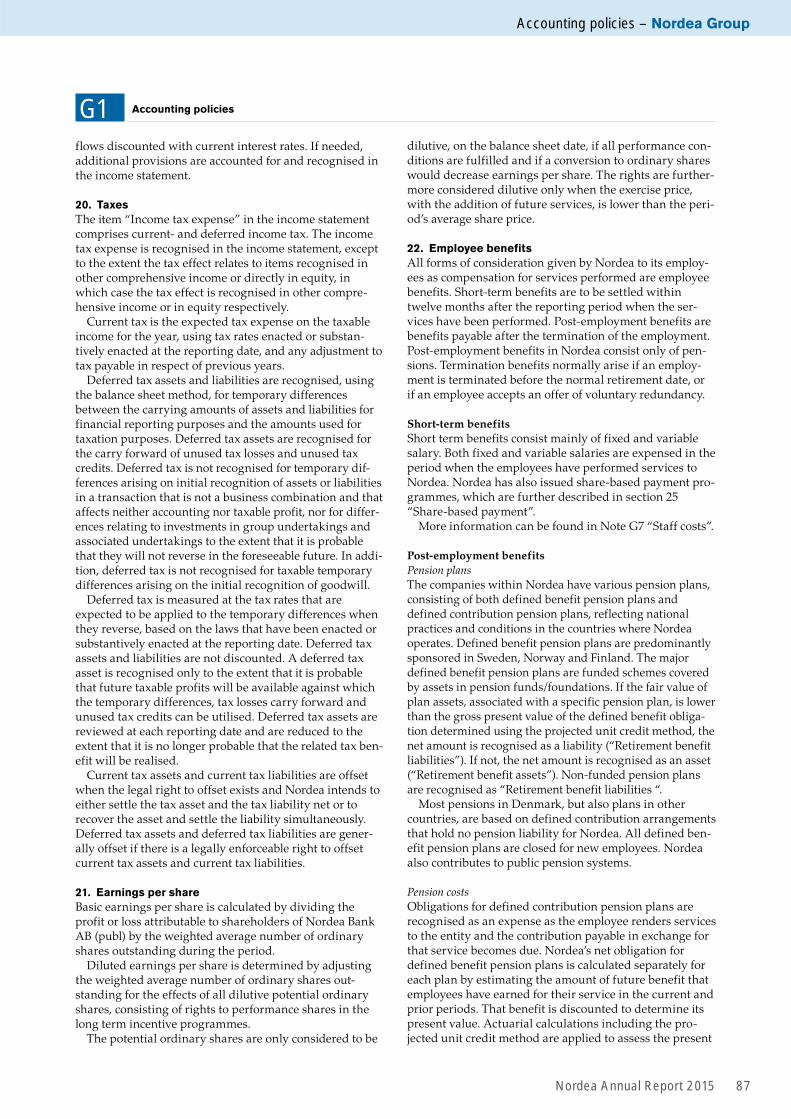
Accounting policies – Nordea Group
Nordea Annual Report 2015 87
flows discounted with current interest rates. If needed, additional provisions are accounted for and recognised in the income statement.
20. TaxesThe item “Income tax expense” in the income statement comprises current- and deferred income tax. The income tax expense is recognised in the income statement, except to the extent the tax effect relates to items recognised in other comprehensive income or directly in equity, in which case the tax effect is recognised in other compre-hensive income or in equity respectively.
Current tax is the expected tax expense on the taxable income for the year, using tax rates enacted or substan-tively enacted at the reporting date, and any adjustment to tax payable in respect of previous years.
Deferred tax assets and liabilities are recognised, using the balance sheet method, for temporary differences between the carrying amounts of assets and liabilities for financial reporting purposes and the amounts used for taxation purposes. Deferred tax assets are recognised for the carry forward of unused tax losses and unused tax credits. Deferred tax is not recognised for temporary dif-ferences arising on initial recognition of assets or liabilities in a transaction that is not a business combination and that affects neither accounting nor taxable profit, nor for differ-ences relating to investments in group undertakings and associated undertakings to the extent that it is probable that they will not reverse in the foreseeable future. In addi-tion, deferred tax is not recognised for taxable temporary differences arising on the initial recognition of goodwill.
Deferred tax is measured at the tax rates that are expected to be applied to the temporary differences when they reverse, based on the laws that have been enacted or substantively enacted at the reporting date. Deferred tax assets and liabilities are not discounted. A deferred tax asset is recognised only to the extent that it is probable that future taxable profits will be available against which the temporary differences, tax losses carry forward and unused tax credits can be utilised. Deferred tax assets are reviewed at each reporting date and are reduced to the extent that it is no longer probable that the related tax ben-efit will be realised.
Current tax assets and current tax liabilities are offset when the legal right to offset exists and Nordea intends to either settle the tax asset and the tax liability net or to recover the asset and settle the liability simultaneously. Deferred tax assets and deferred tax liabilities are gener-ally offset if there is a legally enforceable right to offset current tax assets and current tax liabilities.
21. Earnings per shareBasic earnings per share is calculated by dividing the profit or loss attributable to shareholders of Nordea Bank AB (publ) by the weighted average number of ordinary shares outstanding during the period.
Diluted earnings per share is determined by adjusting the weighted average number of ordinary shares out-standing for the effects of all dilutive potential ordinary shares, consisting of rights to performance shares in the long term incentive programmes.
The potential ordinary shares are only considered to be
G1 Accounting policies
dilutive, on the balance sheet date, if all performance con-ditions are fulfilled and if a conversion to ordinary shares would decrease earnings per share. The rights are further-more considered dilutive only when the exercise price, with the addition of future services, is lower than the peri-od’s average share price.
22. Employee benefitsAll forms of consideration given by Nordea to its employ-ees as compensation for services performed are employee benefits. Short-term benefits are to be settled within twelve months after the reporting period when the ser-vices have been performed. Post-employment benefits are benefits payable after the termination of the employment. Post-employment benefits in Nordea consist only of pen-sions. Termination benefits normally arise if an employ-ment is terminated before the normal retirement date, or if an employee accepts an offer of voluntary redundancy.
Short-term benefitsShort term benefits consist mainly of fixed and variable salary. Both fixed and variable salaries are expensed in the period when the employees have performed services to Nordea. Nordea has also issued share-based payment pro-grammes, which are further described in section 25 “Share-based payment”.
More information can be found in Note G7 “Staff costs”.
Post-employment benefitsPension plansThe companies within Nordea have various pension plans, consisting of both defined benefit pension plans and defined contribution pension plans, reflecting national practices and conditions in the countries where Nordea operates. Defined benefit pension plans are predominantly sponsored in Sweden, Norway and Finland. The major defined benefit pension plans are funded schemes covered by assets in pension funds/foundations. If the fair value of plan assets, associated with a specific pension plan, is lower than the gross present value of the defined benefit obliga-tion determined using the projected unit credit method, the net amount is recognised as a liability (“Retirement benefit liabilities”). If not, the net amount is recognised as an asset (“Retirement benefit assets”). Non-funded pension plans are recognised as “Retirement benefit liabilities “.
Most pensions in Denmark, but also plans in other countries, are based on defined contribution arrangements that hold no pension liability for Nordea. All defined ben-efit pension plans are closed for new employees. Nordea also contributes to public pension systems.
Pension costsObligations for defined contribution pension plans are recognised as an expense as the employee renders services to the entity and the contribution payable in exchange for that service becomes due. Nordea’s net obligation for defined benefit pension plans is calculated separately for each plan by estimating the amount of future benefit that employees have earned for their service in the current and prior periods. That benefit is discounted to determine its present value. Actuarial calculations including the pro-jected unit credit method are applied to assess the present
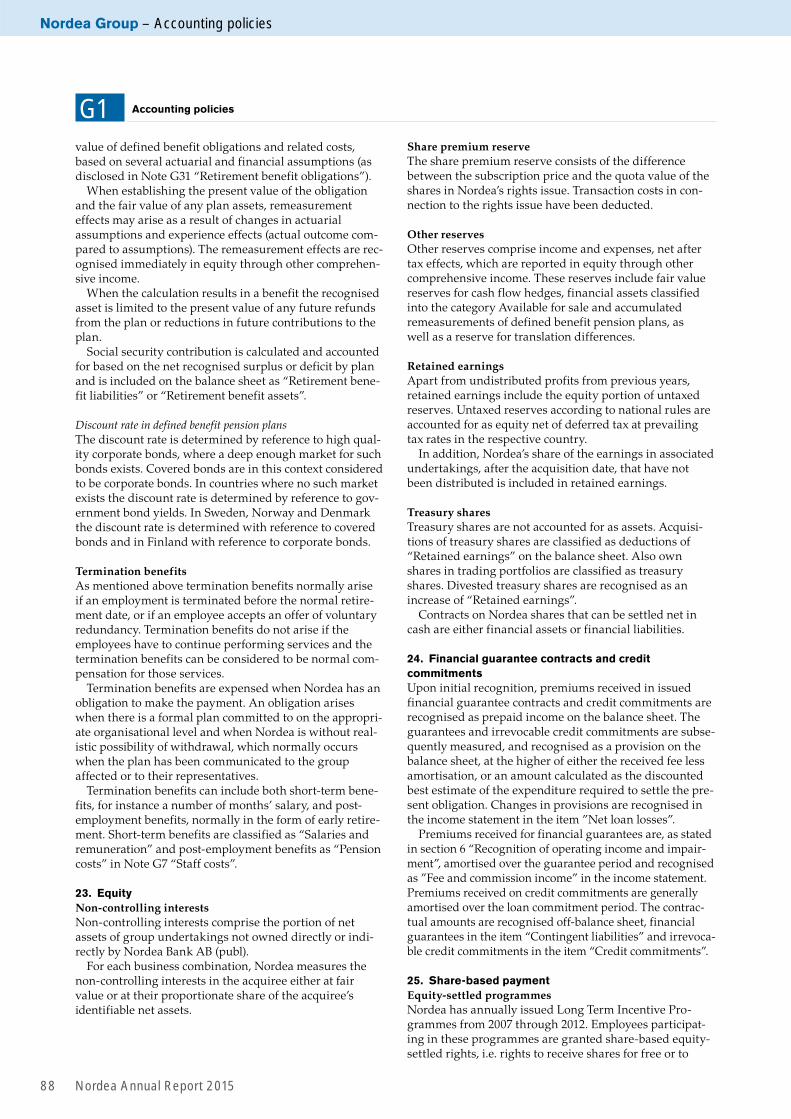
Nordea Group – Accounting policies
Nordea Annual Report 201588
value of defined benefit obligations and related costs, based on several actuarial and financial assumptions (as disclosed in Note G31 “Retirement benefit obligations”).
When establishing the present value of the obligation and the fair value of any plan assets, remeasurement effects may arise as a result of changes in actuarial assumptions and experience effects (actual outcome com-pared to assumptions). The remeasurement effects are rec-ognised immediately in equity through other comprehen-sive income.
When the calculation results in a benefit the recognised asset is limited to the present value of any future refunds from the plan or reductions in future contributions to the plan.
Social security contribution is calculated and accounted for based on the net recognised surplus or deficit by plan and is included on the balance sheet as “Retirement bene-fit liabilities” or “Retirement benefit assets”.
Discount rate in defined benefit pension plansThe discount rate is determined by reference to high qual-ity corporate bonds, where a deep enough market for such bonds exists. Covered bonds are in this context considered to be corporate bonds. In countries where no such market exists the discount rate is determined by reference to gov-ernment bond yields. In Sweden, Norway and Denmark the discount rate is determined with reference to covered bonds and in Finland with reference to corporate bonds.
Termination benefitsAs mentioned above termination benefits normally arise if an employment is terminated before the normal retire-ment date, or if an employee accepts an offer of voluntary redundancy. Termination benefits do not arise if the employees have to continue performing services and the termination benefits can be considered to be normal com-pensation for those services.
Termination benefits are expensed when Nordea has an obligation to make the payment. An obligation arises when there is a formal plan committed to on the appropri-ate organisational level and when Nordea is without real-istic possibility of withdrawal, which normally occurs when the plan has been communicated to the group affected or to their representatives.
Termination benefits can include both short-term bene-fits, for instance a number of months’ salary, and post-employment benefits, normally in the form of early retire-ment. Short-term benefits are classified as “Salaries and remuneration” and post-employment benefits as “Pension costs” in Note G7 “Staff costs”.
23. EquityNon-controlling interestsNon-controlling interests comprise the portion of net assets of group undertakings not owned directly or indi-rectly by Nordea Bank AB (publ).
For each business combination, Nordea measures the non-controlling interests in the acquiree either at fair value or at their proportionate share of the acquiree’s identifiable net assets.
G1 Accounting policies
Share premium reserveThe share premium reserve consists of the difference between the subscription price and the quota value of the shares in Nordea’s rights issue. Transaction costs in con-nection to the rights issue have been deducted.
Other reservesOther reserves comprise income and expenses, net after tax effects, which are reported in equity through other comprehensive income. These reserves include fair value reserves for cash flow hedges, financial assets classified into the category Available for sale and accumulated remeasurements of defined benefit pension plans, as well as a reserve for translation differences.
Retained earningsApart from undistributed profits from previous years, retained earnings include the equity portion of untaxed reserves. Untaxed reserves according to national rules are accounted for as equity net of deferred tax at prevailing tax rates in the respective country.
In addition, Nordea’s share of the earnings in associated undertakings, after the acquisition date, that have not been distributed is included in retained earnings.
Treasury sharesTreasury shares are not accounted for as assets. Acquisi-tions of treasury shares are classified as deductions of “Retained earnings” on the balance sheet. Also own shares in trading portfolios are classified as treasury shares. Divested treasury shares are recognised as an increase of “Retained earnings”.
Contracts on Nordea shares that can be settled net in cash are either financial assets or financial liabilities.
24. Financial guarantee contracts and credit commitmentsUpon initial recognition, premiums received in issued financial guarantee contracts and credit commitments are recognised as prepaid income on the balance sheet. The guarantees and irrevocable credit commitments are subse-quently measured, and recognised as a provision on the balance sheet, at the higher of either the received fee less amortisation, or an amount calculated as the discounted best estimate of the expenditure required to settle the pre-sent obligation. Changes in provisions are recognised in the income statement in the item ”Net loan losses”.
Premiums received for financial guarantees are, as stated in section 6 “Recognition of operating income and impair-ment”, amortised over the guarantee period and recognised as ”Fee and commission income” in the income statement. Premiums received on credit commitments are generally amortised over the loan commitment period. The contrac-tual amounts are recognised off-balance sheet, financial guarantees in the item “Contingent liabilities” and irrevoca-ble credit commitments in the item “Credit commitments”.
25. Share-based paymentEquity-settled programmesNordea has annually issued Long Term Incentive Pro-grammes from 2007 through 2012. Employees participat-ing in these programmes are granted share-based equity-settled rights, i.e. rights to receive shares for free or to

Accounting policies – Nordea Group
Nordea Annual Report 2015 89
G1 Accounting policies
acquire shares in Nordea at a significant discount com-pared to the share price at grant date. The value of such rights is expensed. The expense is based on the estimated fair value of each right at grant date. The total fair value of these rights is determined based on the group’s estimate of the number of rights that will eventually vest, which is reassessed at each reporting date. The fair value is expensed on a straight-line basis over the vesting period. The vesting period is the period that the employees have to remain in service in Nordea in order for their rights to vest. Market performance conditions in Performance Share II are reflected as a probability adjustment to the initial estimate of fair value at grant date. There is no adjustment (true-up) for differences between estimated and actual vesting due to market conditions.
Social security costs are also allocated over the vesting period, in accordance with statement UFR 7 issued by the Swedish Financial Reporting Board: “IFRS 2 and social security contributions for listed enterprises”. The provi-sion for social security costs is reassessed on each report-ing date to ensure that the provision is based on the rights’ fair value at the reporting date.
For more information see Note G7 “Staff costs”.
Cash-settled programmesNordea has to defer payment of variable salaries under Nordic FSA’s regulations and general guidelines, as is also the case with the Executive Incentive Programme (EIP). The deferred amounts are to some extent indexed using Nordea’s TSR (Total Shareholders’ Return) and these “programmes” are cash-settled share-based programmes. These programmes are fully vested when the payments of variable salaries are initially deferred and the fair value of the obligation is remeasured on a continuous basis. The remeasurements are, together with the related social charges, recognised in the income statement in the item “Net result from items at fair value”.
For more information see Note G7 “Staff costs”.
26. Related party transactionsNordea defines related parties as:• Shareholders with significant influence• Group undertakings• Associated undertakings• Key management personnel• Other related parties
All transactions with related parties are made on an arm’s length basis,apart from loans granted to employees, see Note G7 “Staff costs”.
Shareholders with significant influenceShareholders with significant influence are shareholders that have the power to participate in the financial and operating decisions of Nordea but do not control those policies.
Group undertakingsFor the definition of group undertakings see section 5 “Principles of consolidation”. Further information on the undertakings included in the Nordea Group is found in Note P20 “Investments in group undertakings”.
Group internal transactions between legal entities are performed according to arm’s length principles in con-formity with OECD requirements on transfer pricing.
These transactions are eliminated in the consolidated accounts.
Associated undertakingsFor the definition of Associated undertakings see section 5 “Principles of consolidation”.
Further information on the associated undertakings included in the Nordea Group is found in Note G18 “Investments in associated undertakings”.
Key management personnelKey management personnel includes the following positions:• The Board of Directors• The Chief Executive Officer (CEO)• The Group Executive Management (GEM)
For information about compensation, pensions and other transactions with key management personnel, see Note G7 “Staff costs”.
Other related partiesOther related parties comprise close family members to individuals in key management personnel. Other related parties also include companies significantly influenced by key management personnel in Nordea Group as well as companies significantly influenced by close family mem-bers to these key management personnel. Other related parties also include Nordea’s pension foundations.
Information concerning transactions between Nordea and other related parties is found in Note G45 “Related-party transactions”.
27. Exchange rates
EUR 1 = SEKJan–Dec
2015Jan–Dec
2014
Income statement (average) 9.3537 9.1012
Balance sheet (at end of year) 9.1895 9.3930
EUR 1 = DKK
Income statement (average) 7.4587 7.4548
Balance sheet (at end of year) 7.4626 7.4453
EUR 1 = NOK
Income statement (average) 8.9434 8.3597
Balance sheet (at end of year) 9.6030 9.0420
EUR 1 = PLN
Income statement (average) 4.1826 4.1859
Balance sheet (at end of year) 4.2639 4.2732
EUR 1 = RUB
Income statement (average) 67.9657 50.9996
Balance sheet (at end of year) 80.6736 72.3370

Nordea Group – Notes to the income statement
Nordea Annual Report 201590
G2 Segment reporting
Operating segments Measurement of Operating segments’ performanceThe measurement principles and allocation between operating segments follow the information reported to the Chief Operat-ing Decision Maker (CODM), as required by IFRS 8. In Nordea the CODM has been defined as Group Executive Management. The main differences compared to the section “Business area results” in this report are that the information for CODM is pre-pared using plan exchange rates and to that different allocation principles between operating segments have been applied.
Basis of segmentationFinancial results are presented for the three main business areas Retail Banking, Wholesale Banking and Wealth Man-agement, with further breakdown on operating segments, and for the operating segment Group Corporate Centre. Other operating segments below the quantitative thresholds in IFRS 8 are included in Other operating segments. Group functions and eliminations as well as the result that is not fully allocated to any of the operating segments, are shown separately as reconciling items.
There have not been any changes to the basis of segmenta-tion compared with the Annual Report 2014.
Reportable Operating segmentsRetail Banking conducts a full service banking operation and offers a wide range of products. It is Nordea’s largest customer area and serves household customers and corporate customers in the Nordic markets (Retail Banking Nordic) as well as the Bal-tic countries (Retail Banking Baltic). Wholesale Banking pro-vides banking and other financial solutions to large Nordic and international corporate, institutional and public companies. The
division Corporate & Institutional Banking is a customer ori-ented organisation serving the largest globally operating corpo-rates. This division is also responsible for Nordea’s customers within the financial sector, and offers single products such as funds and equity products as well as consulting services within asset allocation and fund sales. The division Shipping, Offshore & Oil Services is responsible for Nordea’s customers within the shipping, offshore and oil services industries and provides tailor made solutions and syndicated loan transactions. Nordea Bank Russia offers a full range of bank services to corporate and pri-vate customers in Russia. Capital Markets unallocated includes the result in Capital Markets which is not allocated to the main business areas. Wealth management provides high quality investment, savings and risk management products. It also man-ages customers’ assets and gives financial advice to affluent and high net worth individuals as well as to institutional investors. The division Private Banking provides wealth planning, full-scale investment advice, credit, and estate planning services to wealthy individuals, businesses and their owners, trusts and foundations. The division Asset Management is responsible for all actively managed investment products including internally managed investment funds and mandates as well as selected externally managed funds, and for serving the institutional asset management customers. Life & Pensions serves Nordea’s Retail Private Banking and corporate customers with a full range of pension, endowment and risk products as well as tai-lor-made advice for bank distribution. Life & Pensions unallo-cated includes the result in Life & Pensions which is not allo-cated to the main business areas. Group Corporate Centre’s main objective is to manage the Group’s funding and to sup-port the management and control of the Nordea Group. The main income in Group Corporate Centre originates from Group Treasury & ALM.
Income statement 2015, EURmRetail
BankingWholesale
BankingWealth
Management
Group Corporate
Centre
Other Operating segments
Total operating segments
Recon-ciliation Total Group
Net interest income 3,526 1,034 123 390 9 5,082 28 5,110
Net fee and commission income 1,622 565 1,439 –15 –1 3,610 –585 3,025
Net result from items at fair value 446 825 352 86 0 1,709 –6 1,703
Profit from associated undertakings accounted for under the equity method 12 0 0 0 27 39 0 39
Other income 33 3 14 17 177 244 19 263
Total operating income 5,639 2,427 1,928 478 212 10,684 –544 10,140
– of which internal transactions1 –1,263 –308 13 1,577 –19 0
Staff costs –1,432 –637 –514 –271 –5 –2,859 –404 –3,263
Other expenses –1,254 –217 –277 7 –28 –1,769 284 –1,485
Depreciation, amortisation and impairment charges of tangible and intangible assets –79 –19 –9 –46 –2 –155 –54 –209
Total operating expenses –2,765 –873 –800 –310 –35 –4,783 –174 –4,957
Profit before loan losses 2,874 1,554 1,128 168 177 5,901 –718 5,183
Net loan losses –318 –159 –1 0 0 –478 –1 –479
Operating profit 2,556 1,395 1,127 168 177 5,423 –719 4,704
Income tax expense –617 –352 –248 –93 –39 –1,349 307 –1,042
Net profit for the year 1,939 1,043 879 75 138 4,074 –412 3,662
Balance sheet 31 Dec 2015, EURbn
Loans to the public2 228 60 11 — — 299 42 341
Deposits and borrowings from the public2 110 45 13 — — 168 25 193

Notes to the income statement – Nordea Group
Nordea Annual Report 2015 91
Break-down of Retail Banking
Retail Banking Nordic1 Retail Banking Baltic2 Retail Banking Other3 Total Retail Banking
Income statement, EURm 2015 2014 2015 2014 2015 2014 2015 2014
Net interest income 3,461 3,719 148 143 –83 –76 3,526 3,786
Net fee and commission income 1,654 1,561 30 25 –62 –27 1,622 1,559
Net result from items at fair value 429 393 14 3 3 –3 446 393
Profit from associated undertakings accounted for under the equity method 7 6 0 0 5 4 12 10
Other income 11 1 2 3 20 22 33 26
Total operating income 5,562 5,680 194 174 –117 –80 5,639 5,774
– of which internal transactions –1,111 –1,283 –28 –41 –124 –156 –1,263 –1,480
Staff costs –919 –942 –26 –25 –487 –484 –1,432 –1,451
Other expenses –1,725 –1,856 –61 –61 532 523 –1,254 –1,394
Depreciation, amortisation and impairment charges of tangible and intangible assets –43 –42 –1 –1 –35 –59 –79 –102
Total operating expenses –2,687 –2,840 –88 –87 10 –20 –2,765 –2,947
Profit before loan losses 2,875 2,840 106 87 –107 –100 2,874 2,827
Net loan losses –293 –356 –16 –63 –9 –12 –318 –431
Operating profit 2,582 2,484 90 24 –116 –112 2,556 2,396
Income tax expense –621 –616 –21 –16 25 23 –617 –609
Net profit for the year 1,961 1,868 69 8 –91 –89 1,939 1,787
Balance sheet, EURbn
Loans to the public 220 216 8 8 — — 228 224
Deposits and borrowings from the public 106 104 4 4 — — 110 108
1) Retail Banking Nordic includes banking operations in Denmark, Finland, Norway and Sweden.2) Retail Banking Baltic includes banking operations in Estonia, Latvia and Lithuania. 3) Retail Banking Other includes the support areas Development & Projects, Distribution, Segments, Products and IT.
Income statement 2014, EURmRetail
BankingWholesale
BankingWealth
Management
Group Corporate
Centre
Other Operating segments
Total operating segments
Recon-ciliation Total Group
Net interest income 3,786 1,076 141 290 –29 5,264 218 5,482
Net fee and commission income 1,559 623 1,148 –14 0 3,316 –474 2,842
Net result from items at fair value 393 675 362 102 0 1,532 –107 1,425
Profit from associated undertakings accounted for under the equity method 10 0 — 0 3 13 5 18
Other income 26 3 15 20 0 64 410 474
Total operating income 5,774 2,377 1,666 398 –26 10,189 52 10,241
– of which internal transactions1 –1,480 –209 16 1,740 –67 0
Staff costs –1,451 –616 –488 –230 –7 –2,792 –367 –3,159
Other expenses –1,394 –199 –285 –42 –1 –1,921 265 –1,656
Depreciation, amortisation and impairment charges of tangible and intangible assets –102 –22 –10 –36 — –170 –415 –585
Total operating expenses –2,947 –837 –783 –308 –8 –4,883 –517 –5,400
Profit before loan losses 2,827 1,540 883 90 –34 5,306 –465 4,841
Net loan losses –431 –93 –3 — — –527 –7 –534
Operating profit 2,396 1,447 880 90 –34 4,779 –472 4,307
Income tax expense –609 –345 –194 –46 11 –1,183 233 –950
Net profit for the year 1,787 1,102 686 44 –23 3,596 –239 3,357
Balance sheet 31 Dec 2014, EURbn
Loans to the public2 224 58 9 — — 291 57 348
Deposits and borrowings from the public2 108 39 11 — — 158 39 197
1) IFRS 8 requires information on revenues from transactions between operating segments. Nordea has defined inter-segment revenues as internal interest income and expense related to the funding of the operating segments by the internal bank in Group Corporate Centre.
2) The volumes are only disclosed separate for operating segments if separately reported to the Chief Operating Decision Maker.
G2 Segment reporting, cont.

Nordea Group – Notes to the income statement
Nordea Annual Report 201592
Break-down of Wholesale Banking
Corporate & Institutional
Banking
Shipping, Offshore
& Oil ServicesNordea Bank
RussiaCapital Markets
unallocatedWholesale
Banking Other1Total Wholesale
Banking
Income statement, EURm 2015 2014 2015 2014 2015 2014 2015 2014 2015 2014 2015 2014
Net interest income 610 674 290 265 228 213 –5 –1 –89 –75 1,034 1,076
Net fee and commission income 511 562 61 68 12 14 –67 –62 48 41 565 623
Net result from items at fair value 307 260 40 33 13 –1 425 346 40 37 825 675
Other income 0 0 0 0 1 0 2 3 0 0 3 3
Total operating income 1,428 1,496 391 366 254 226 355 286 –1 3 2,427 2,377
– of which internal transactions –136 –139 –67 –63 –82 –30 65 101 –88 –78 –308 –209
Staff costs –38 –38 –19 –20 –46 –45 –471 –446 –63 –67 –637 –616
Other expenses –377 –382 –38 –42 –21 –22 232 256 –13 –9 –217 –199
Depreciation, amortisation and impair-ment charges of tangible and intangi-ble assets 0 0 0 0 –9 –5 –7 –15 –3 –2 –19 –22
Total operating expenses –415 –420 –57 –62 –76 –72 –246 –205 –79 –78 –873 –837
Profit before loan losses 1,013 1,076 334 304 178 154 109 81 –80 –75 1,554 1,540
Net loan losses –144 –120 –5 38 –23 –11 0 0 13 0 –159 –93
Operating profit 869 956 329 342 155 143 109 81 –67 –75 1,395 1,447
Income tax expense –228 –242 –75 –67 –41 –36 –26 –20 18 20 –352 –345
Net profit for the year 641 714 254 275 114 107 83 61 –49 –55 1,043 1,102
Balance sheet, EURbn
Loans to the public 40 39 13 12 7 7 — — — — 60 58
Deposits and borrowings from the public 39 34 5 4 1 1 — — — — 45 39
1) Wholesale Banking Other includes the area International Units and the support areas Transaction Products, Segment CIB and IT.
G2 Segment reporting, cont.
Break-down of Wealth Management
Private Banking Asset ManagementLife & Pensions
unallocatedWealth Management
Other1Total WealthManagement
Income statement, EURm 2015 2014 2015 2014 2015 2014 2015 2014 2015 2014
Net interest income 122 140 1 1 0 0 0 0 123 141
Net fee and commission income 631 544 761 572 337 269 –290 –237 1,439 1,148
Net result from items at fair value 104 88 2 5 246 269 0 0 352 362
Other income 8 5 4 2 9 9 –7 –1 14 15
Total operating income 865 777 768 580 592 547 –297 –238 1,928 1,666
– of which internal transactions 13 12 0 0 0 0 0 4 13 16
Staff costs –180 –171 –135 –120 –118 –122 –81 –75 –514 –488
Other expenses –223 –227 –101 –101 –60 –61 107 104 –277 –285
Depreciation, amortisation and impairment –4 –4 0 –1 –3 –3 –2 –2 –9 –10
Total operating expenses –407 –402 –236 –222 –181 –186 24 27 –800 –783
Profit before loan losses 458 375 532 358 411 361 –273 –211 1,128 883
Net loan losses –1 –3 0 0 0 0 0 0 –1 –3
Operating profit 457 372 532 358 411 361 –273 –211 1,127 880
Income tax expense –101 –82 –117 –79 –90 –79 60 46 –248 –194
Net profit for the year 356 290 415 279 321 282 –213 –165 879 686
Balance sheet, EURbn
Loans to the public 11 9 — — — — — — 11 9
Deposits and borrowings from the public 13 11 — — — — — — 13 11
1) Wealth Management Other includes the area Savings and support areas, such as IT.
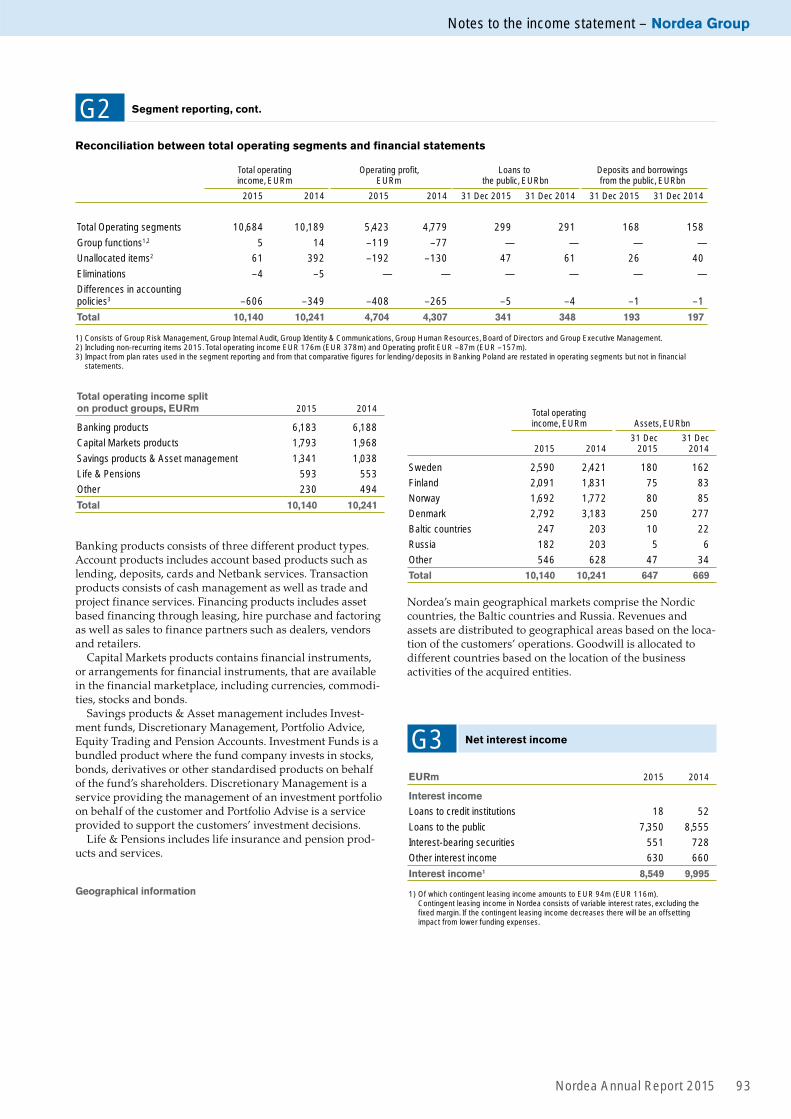
Notes to the income statement – Nordea Group
Nordea Annual Report 2015 93
G2 Segment reporting, cont.
Reconciliation between total operating segments and financial statements
Total operatingincome, EURm
Operating profit, EURm
Loans to the public, EURbn
Deposits and borrowings from the public, EURbn
2015 2014 2015 2014 31 Dec 2015 31 Dec 2014 31 Dec 2015 31 Dec 2014
Total Operating segments 10,684 10,189 5,423 4,779 299 291 168 158
Group functions1,2 5 14 –119 –77 — — — —
Unallocated items2 61 392 –192 –130 47 61 26 40
Eliminations –4 –5 — — — — — —
Differences in accounting policies3 –606 –349 –408 –265 –5 –4 –1 –1
Total 10,140 10,241 4,704 4,307 341 348 193 197
1) Consists of Group Risk Management, Group Internal Audit, Group Identity & Communications, Group Human Resources, Board of Directors and Group Executive Management. 2) Including non-recurring items 2015. Total operating income EUR 176m (EUR 378m) and Operating profit EUR –87m (EUR –157m).3) Impact from plan rates used in the segment reporting and from that comparative figures for lending/deposits in Banking Poland are restated in operating segments but not in financial
statements.
G3 Net interest income
EURm 2015 2014
Interest income
Loans to credit institutions 18 52
Loans to the public 7,350 8,555
Interest-bearing securities 551 728
Other interest income 630 660
Interest income1 8,549 9,995
1) Of which contingent leasing income amounts to EUR 94m (EUR 116m). Contingent leasing income in Nordea consists of variable interest rates, excluding the fixed margin. If the contingent leasing income decreases there will be an offsetting impact from lower funding expenses.
Total operating income split on product groups, EURm 2015 2014
Banking products 6,183 6,188
Capital Markets products 1,793 1,968
Savings products & Asset management 1,341 1,038
Life & Pensions 593 553
Other 230 494
Total 10,140 10,241
Banking products consists of three different product types. Account products includes account based products such as lending, deposits, cards and Netbank services. Transaction products consists of cash management as well as trade and project finance services. Financing products includes asset based financing through leasing, hire purchase and factoring as well as sales to finance partners such as dealers, vendors and retailers.
Capital Markets products contains financial instruments, or arrangements for financial instruments, that are available in the financial marketplace, including currencies, commodi-ties, stocks and bonds.
Savings products & Asset management includes Invest-ment funds, Discretionary Management, Portfolio Advice, Equity Trading and Pension Accounts. Investment Funds is a bundled product where the fund company invests in stocks, bonds, derivatives or other standardised products on behalf of the fund’s shareholders. Discretionary Management is a service providing the management of an investment portfolio on behalf of the customer and Portfolio Advise is a service provided to support the customers’ investment decisions.
Life & Pensions includes life insurance and pension prod-ucts and services.
Geographical information
Total operating income, EURm Assets, EURbn
2015 201431 Dec
201531 Dec
2014
Sweden 2,590 2,421 180 162
Finland 2,091 1,831 75 83
Norway 1,692 1,772 80 85
Denmark 2,792 3,183 250 277
Baltic countries 247 203 10 22
Russia 182 203 5 6
Other 546 628 47 34
Total 10,140 10,241 647 669
Nordea’s main geographical markets comprise the Nordic countries, the Baltic countries and Russia. Revenues and assets are distributed to geographical areas based on the loca-tion of the customers’ operations. Goodwill is allocated to different countries based on the location of the business activities of the acquired entities.

Nordea Group – Notes to the income statement
Nordea Annual Report 201594
EURm 2015 2014
Interest expense
Deposits by credit institutions –90 –103
Deposits and borrowings from the public –652 –1,145
Debt securities in issue –3,175 –3,545
Subordinated liabilities –362 –331
Other interest expenses1 840 611
Interest expense –3,439 –4,513
Net interest income 5,110 5,482
1) The net interest income from derivatives, measured at fair value, related to Nordea´s fund-ing. This can have both a positive and negative impact on other interest expense, for fur-ther information see Note G1.
Interest income from financial instruments not measured at fair value through profit or loss amounts to EUR 6,551m (EUR 7,725m). Interest expenses from financial instruments not measured at fair value through profit or loss amounts to EUR –3,213m (EUR –3,925m).
Interest on impaired loans amounted to an insignificant portion of interest income.
G4 Net fee and commission income
EURm 2015 2014
Asset management commissions 1,496 1,188
Life insurance 373 367
Brokerage, securities issues and corporate finance 274 281
Custody and issuers services 121 129
Deposits 31 39
Total savings and investments 2,295 2,004
Payments 408 406
Cards 523 529
Total payments and cards 931 935
Lending 505 541
Guarantees and documentary payments 182 181
Total lending related commissions 687 722
Other commission income 122 138
Fee and commission income 4,035 3,799
Savings and investments –344 –363
Payments –102 –85
Cards –252 –253
State guarantee fees –147 –132
Other commission expenses –165 –124
Fee and commission expense –1,010 –957
Net fee and commission income 3,025 2,842
Fee income, not included in determining the effective interest rate, from financial assets and liabilities not measured at fair value through profit or loss amounts to EUR 507m (EUR 557m).
Fee income, not included in determining the effective inter-est rate, from fiduciary activities that result in the holding or investing of assets on behalf of customers amounts to EUR 2,144m (EUR 1,837m). The corresponding amounts for fee expenses is EUR –74m (EUR –96m).
G5 Net result from items at fair value
EURm 2015 2014
Equity related instruments 271 431
Interest related instruments and foreign exchange gains/losses 1,135 323
Other financial instruments(including credit and commodities) 56 409
Investment properties –4 –10
Life insurance1 245 272
Total 1,703 1,425
1) Internal transactions not eliminated against other lines in the Note. The line Life insurance consequently provides the true impact from the Life insurance operations.
Break-down of life insurance, EURm 2015 2014
Equity related instruments 1,417 2,398
Interest related instruments and foreign exchange gains/losses –148 2,232
Other financial instruments – 0
Investment properties 150 255
Change in technical provisions –1,053 –3,834
Change in collective bonus potential –169 –871
Insurance risk income 213 212
Insurance risk expense –165 –120
Total 245 272
Net result from categories of financial instruments 2 , EURm 2015 2014
Available for sale assets, realised 66 1
Financial instruments designated at fair value through profit or loss –31 184
Financial instruments held for trading3 656 1,522
Financial instruments under fair value hedge accounting –5 33
– of which net result on hedging instruments –605 1,248
– of which net result on hedged items 600 –1,215
Financial assets measured at amortised cost4 58 49
Financial liabilities measured at amortised cost –30 –28
Foreign exchange gains/losses excluding currency hedges 751 –588
Other –7 –20
Financial risk income, net Life insurance1 197 180
Insurance risk income, net Life insurance 48 92
Total 1,703 1,425
1) Premium income amounts to EUR 2,500m (EUR 2,270m).2) The figures disclosed for Life (financial risk income and insurance risk income) are dis-
closed on gross basis, i.e. before eliminations of intra-group transactions.3) Of which amortised deferred day one profits amounts to EUR 11m (EUR 11m).4) Of which EUR 58m (EUR 49m) related to instruments classified into the category “Loans
and receivables” and EUR 0m (EUR 0m) related to instruments classified into the category “Held to maturity”.
G6 Other operating income
EURm 2015 2014
Divestment of shares1 182 378
Income from real estate 3 9
Sale of tangible assets 13 12
Other 65 75
Total 263 474
1) Gain from divestment of Nordea’s merchant acquiring business to Nets of EUR 176m in 2015. Gain from divestment of Nets Holding A/S amounts to EUR 378m in 2014.
G3 Net interest income, cont.
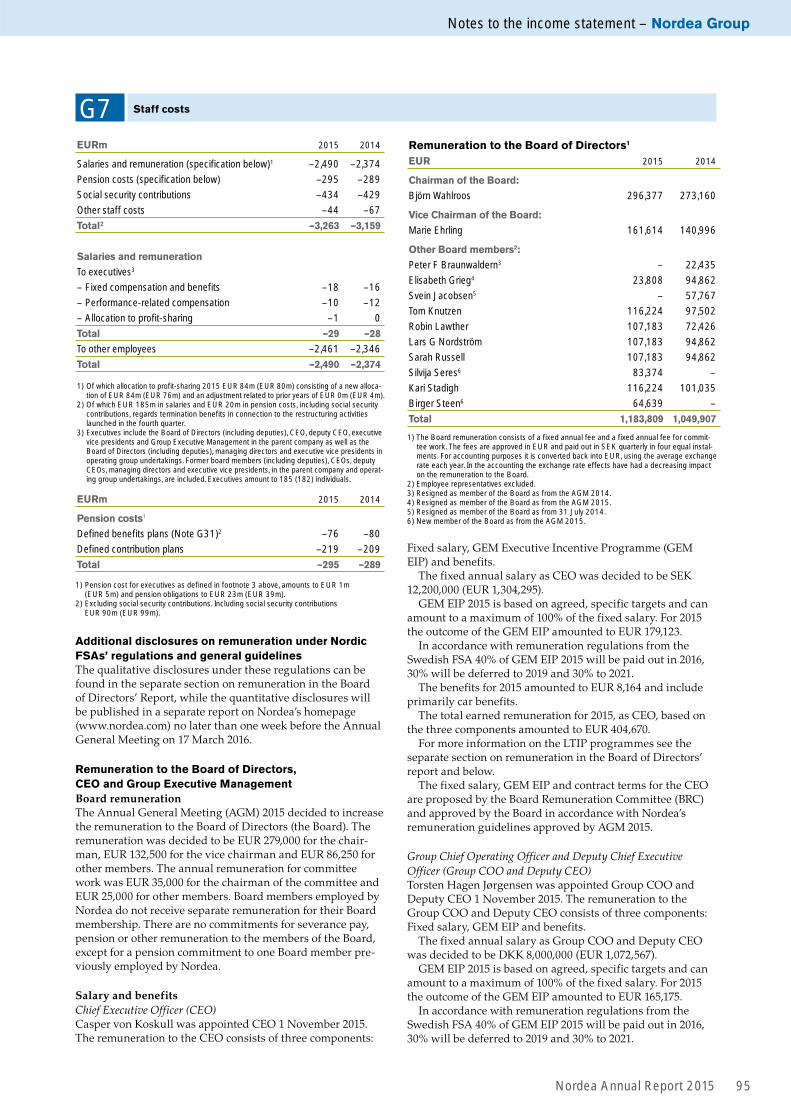
Notes to the income statement – Nordea Group
Nordea Annual Report 2015 95
1) Of which allocation to profit-sharing 2015 EUR 84m (EUR 80m) consisting of a new alloca-tion of EUR 84m (EUR 76m) and an adjustment related to prior years of EUR 0m (EUR 4m).
2) Of which EUR 185m in salaries and EUR 20m in pension costs, including social security contributions, regards termination benefits in connection to the restructuring activities launched in the fourth quarter.
3) Executives include the Board of Directors (including deputies), CEO, deputy CEO, executive vice presidents and Group Executive Management in the parent company as well as the Board of Directors (including deputies), managing directors and exe cutive vice presidents in operating group undertakings. Former board members (including deputies), CEOs, deputy CEOs, managing directors and executive vice presidents, in the parent company and operat-ing group undertakings, are included. Executives amount to 185 (182) individuals.
EURm 2015 2014
Pension costs1
Defined benefits plans (Note G31)2 –76 –80
Defined contribution plans –219 –209
Total –295 –289
1) Pension cost for executives as defined in footnote 3 above, amounts to EUR 1m (EUR 5m) and pension obligations to EUR 23m (EUR 39m).
2) Excluding social security contributions. Including social security contributions EUR 90m (EUR 99m).
Additional disclosures on remuneration under Nordic FSAs’ regulations and general guidelinesThe qualitative disclosures under these regulations can be found in the separate section on remuneration in the Board of Directors’ Report, while the quantitative disclosures will be published in a separate report on Nordea’s homepage (www.nordea.com) no later than one week before the Annual General Meeting on 17 March 2016.
EURm 2015 2014
Salaries and remuneration (specification below)1 –2,490 –2,374
Pension costs (specification below) –295 –289
Social security contributions –434 –429
Other staff costs –44 –67
Total 2 –3,263 –3,159
Salaries and remuneration
To executives3
– Fixed compensation and benefits –18 –16
– Performance-related compensation –10 –12
– Allocation to profit-sharing –1 0
Total –29 –28
To other employees –2,461 –2,346
Total –2,490 –2,374
G7 Staff costs
Fixed salary, GEM Executive Incentive Programme (GEM EIP) and benefits.
The fixed annual salary as CEO was decided to be SEK 12,200,000 (EUR 1,304,295).
GEM EIP 2015 is based on agreed, specific targets and can amount to a maximum of 100% of the fixed salary. For 2015 the outcome of the GEM EIP amounted to EUR 179,123.
In accordance with remuneration regulations from the Swedish FSA 40% of GEM EIP 2015 will be paid out in 2016, 30% will be deferred to 2019 and 30% to 2021.
The benefits for 2015 amounted to EUR 8,164 and include primarily car benefits.
The total earned remuneration for 2015, as CEO, based on the three components amounted to EUR 404,670.
For more information on the LTIP programmes see the separate section on remuneration in the Board of Directors’ report and below.
The fixed salary, GEM EIP and contract terms for the CEO are proposed by the Board Remuneration Committee (BRC) and approved by the Board in accordance with Nordea’s remuneration guidelines approved by AGM 2015.
Group Chief Operating Officer and Deputy Chief Executive Officer (Group COO and Deputy CEO) Torsten Hagen Jørgensen was appointed Group COO and Deputy CEO 1 November 2015. The remuneration to the Group COO and Deputy CEO consists of three components: Fixed salary, GEM EIP and benefits.
The fixed annual salary as Group COO and Deputy CEO was decided to be DKK 8,000,000 (EUR 1,072,567).
GEM EIP 2015 is based on agreed, specific targets and can amount to a maximum of 100% of the fixed salary. For 2015 the outcome of the GEM EIP amounted to EUR 165,175.
In accordance with remuneration regulations from the Swedish FSA 40% of GEM EIP 2015 will be paid out in 2016, 30% will be deferred to 2019 and 30% to 2021.
Remuneration to the Board of Directors, CEO and Group Executive Management Board remunerationThe Annual General Meeting (AGM) 2015 decided to increase the remuneration to the Board of Directors (the Board). The remuneration was decided to be EUR 279,000 for the chair-man, EUR 132,500 for the vice chairman and EUR 86,250 for other members. The annual remuneration for committee work was EUR 35,000 for the chairman of the committee and EUR 25,000 for other members. Board members employed by Nordea do not receive separate remuneration for their Board membership. There are no commitments for severance pay, pension or other remuneration to the members of the Board, except for a pension commitment to one Board member pre-viously employed by Nordea.
Salary and benefitsChief Executive Officer (CEO)Casper von Koskull was appointed CEO 1 November 2015. The remuneration to the CEO consists of three components:
Remuneration to the Board of Directors1
EUR 2015 2014
Chairman of the Board:
Björn Wahlroos 296,377 273,160
Vice Chairman of the Board:
Marie Ehrling 161,614 140,996
Other Board members2:
Peter F Braunwaldern3 – 22,435
Elisabeth Grieg4 23,808 94,862
Svein Jacobsen5 – 57,767
Tom Knutzen 116,224 97,502
Robin Lawther 107,183 72,426
Lars G Nordström 107,183 94,862
Sarah Russell 107,183 94,862
Silvija Seres6 83,374 –
Kari Stadigh 116,224 101,035
Birger Steen6 64,639 –
Total 1,183,809 1,049,907
1) The Board remuneration consists of a fixed annual fee and a fixed annual fee for commit-tee work. The fees are approved in EUR and paid out in SEK quarterly in four equal instal-ments. For accounting purposes it is converted back into EUR, using the average exchange rate each year. In the accounting the exchange rate effects have had a decreasing impact on the remuneration to the Board.
2) Employee representatives excluded.3) Resigned as member of the Board as from the AGM 2014.4) Resigned as member of the Board as from the AGM 2015.5) Resigned as member of the Board as from 31 July 2014.6) New member of the Board as from the AGM 2015.

Nordea Group – Notes to the income statement
Nordea Annual Report 201596
G7 Staff costs, cont.
1) The fixed salary is paid in local currencies and converted to EUR based on the average exchange rate each year. The fixed salary includes also holiday pay and car allowance. The fixed salaries and benefits 2014 have been restated and holiday pay and car allow-ance is, if applicable, classified as fixed salary in the above table while they were classified as Benefits in the Annual Report 2014. Benefits are included at taxable values.
2) The CEO and members of GEM were until 2012 offered a Variable Salary Part (VSP) and a share based Long Term Incentive Programme (LTIP). Instead of these two programmes the Board in 2013 decided, in order to reduce complexity, to offer a GEM Executive Incen-tive Programme (GEM EIP). The outcome from GEM EIP 2015 has been expensed in full in 2015 but will be paid out over a five year deferral period with forfeiture clauses in order to comply with the remuneration regulations from the Swedish FSA. The GEM EIP is indexed with Nordea’s total shareholder return (TSR) during the deferral period. The GEM EIP is further described in the separate section on remuneration in the Board of Directors’ report and below.
3) The fixed annual salary as CEO is, as communicated at the Annual General Meeting (AGM) 2015, SEK 11,646,020 (EUR 1,245,070). Remuneration as CEO is included for the period of appointment as CEO, for the period 1 January 2015 to 31 October 2015. Remuneration as Former CEO is included for the period 1 November 2015 to 31 December 2015.
4) The fixed annual salary as CEO is SEK 12,200,000 (EUR 1,304,295). Remuneration as CEO is included for the period of appointment as CEO, for the period 1 November 2015 to 31 December 2015. The remuneration as member of GEM is included together with other members of GEM for the period 1 January 2015 to 31 October 2015.
5) The fixed annual salary as Group COO and Deputy CEO is decided to be DKK 8,000,000 (EUR 1,072,567). Remuneration for the Group COO and Deputy CEO is included for the period of appointment as Group COO and Deputy CEO, for the period 1 November 2015 to 31 December 2015. The remuneration as member of GEM is included together with other members of GEM for the period 1 January 2015 to 31 October 2015.
6) Remuneration to GEM members is included for the period they have been appointed. One new GEM member was appointed 1 May 2015 and two members were appointed 1 November 2015. Two members are reported individually, as CEO and Group COO and Deputy CEO, as from 1 November 2015.
Remuneration to the Chief Executive Officer and Group Executive Management (excl. LTIP)
Fixed salary1GEM Executive
Incentive Programme2 Benefits1 Total
remuneration
EUR 2015 2014 2015 2014 2015 2014 2015 2014
Chief Executive Officer (CEO):
Christian Clausen3 1,041,869 1,241,653 1,003,526 1,084,267 72,114 73,026 2,117,509 2,398,946
Casper von Koskull4 217,383 – 179,123 – 8,164 – 404,670 –
Group Chief Operating Officer and Deputy Chief Executive Officer (Group COO and Deputy CEO):
Torsten Hagen Jørgensen5 178,761 – 165,175 – 2,015 – 345,951 –
Group Executive Management (GEM):
7 (6) individuals excluding CEO and Group COO and Deputy CEO6 4,800,274 4,451,342 3,657,267 3,912,561 108,072 175,714 8,565,613 8,539,617
Former Chief Executive Officer (Former CEO):
Christian Clausen3 207,512 – – – 5,390 – 212,902 –
Total 6,445,799 5,692,995 5,005,091 4,996,828 195,755 248,740 11,646,645 10,938,563
The benefits for 2015 amounted to EUR 2,015 and include primarily housing benefits.
The total earned remuneration for 2015, as Group COO and Deputy CEO, based on the three components amounted to EUR 345,951.
For more information on the LTIP programmes see the
Long Term Incentive Programmes (LTIP) 2010–2012
Expense1 (EUR) Number of outstanding shares2
2015 2014 LTIP 2012 LTIP 2011 LTIP 2010 Total
Chief Executive Officer (CEO):
Christian Clausen 51,172 398,081 – – – –
Casper von Koskull 6,550 – 39,340 24,448 8,097 71,885
Group Chief Operating Officer and Deputy Chief Executive Officer (Group COO and Deputy CEO):
Torsten Hagen Jørgensen 6,076 – 36,495 21,876 6,363 64,734
Group Executive Management (GEM):
7(6) individuals excluding CEO and Group COO and Deputy CEO 145,327 1,062,253 89,159 54,668 14,724 158,551
Former Chief Executive Officer (Former CEO):
Christian Clausen 10,234 – 61,470 38,200 10,152 109,822
Total 219,359 1,460,334 226,464 139,192 39,336 404,992
1) The expense from the LTIP programmes is recognised as the vesting requirements are fulfilled over the three years vesting period starting the year of issuance. The expense 2014 includes expense from LTIP 2011 and LTIP 2012. The expense 2015 includes expense from LTIP 2012 and LTIP 2012 was fully expensed in May 2015. The expense is calculated in accordance with IFRS 2 “Share-based Payment” and presented for the period appointed CEO, Group COO and Deputy CEO, GEM and Former CEO.
2) 60% of the vested shares are deferred with forfeiture clauses due to remuneration regula-tions from the Swedish FSA and allotted over a five year period, for LTIP 2010 starting May 2013, for LTIP 2011 starting May 2014 and for LTIP 2012 starting May 2015. See also the separate Remuneration section on page 53 and below for more details. The numbers of outstanding shares are presented as of 31 December 2015. Shares in LTIP 2010, LTIP 2011 and LTIP 2012 are fully vested and consequently not conditional.
separate section on remuneration in the Board of Directors’ report and below.
The BRC prepares alterations in salary levels and outcome of GEM EIP as well as other changes in the remuneration package for the Group COO and Deputy CEO, for resolution by the Board.

Notes to the income statement – Nordea Group
Nordea Annual Report 2015 97
G7 Staff costs, cont.
Group Executive Management (GEM) The BRC prepares alterations in salary levels and outcome of GEM EIP as well as other changes in the remuneration pack-age for members of GEM, for resolution by the Board. GEM EIP 2015, which is based on agreed, specific targets, can be a maximum of 100% of the fixed salary.
Benefits include primarily car and/or housing. As for the CEO, most GEM members took part of the previous LTIPs.
PensionChief Executive Officer (CEO) The CEO has a defined contribution plan in accordance with the Swedish collective agreement BTP1, with a complementing defined contribution plan on top of the collective agreement. The pension contribution in total is 30% of the fixed salary.
Group Chief Operating Officer and Deputy Chief Executive Officer (Group COO and Deputy CEO)The Group COO and Deputy CEO has a defined contribution plan. The pension contribution is 30% of the fixed salary.
Pension expense and pension obligation2015 2014
EUR Pension expense1 Pension obligation2 Pension expense1 Pension obligation2
Board members3:
Lars G Nordström – 334,110 – 367,851
Chief Executive Officer (CEO):
Christian Clausen4 –2,159,170 – 760,804 15,341,148
Casper von Koskull5 65,215 284,571 – –
Group Chief Operating Officer and Deputy Chief Executive Officer (Group COO and Deputy CEO):
Torsten Hagen Jørgensen6 53,677 – – –
Group Executive Management (GEM):
7 (6) individuals excluding CEO and Group COO and Deputy CEO7 1,837,118 8,741,323 2,122,898 8,585,591
Former Chairman of the Board and CEOs:
Vesa Vainio8 – 5,376,111 –339,377 5,773,806
Christian Clausen4 62,254 – – –
Total –140,906 14,736,115 2,544,325 30,068,396
1) The pension expense is related to pension premiums paid in defined contribution agree-ments and pension rights earned during the year in defined benefit agreements (Current service cost and Past service cost and settlements as defined in IAS 19). Of the total pension expense EUR 1,366,811 relates to defined contribution agreements.
2) The pension obligation is calculated in accordance with IAS 19. The obligation is depend-ent on changes in actuarial assumptions and inter annual variations can therefore be sig-nificant. IAS 19 includes an assumption about future increases in salary, which leads to that the pension obligations disclosed are the earned pension rights calculated using the expected salary levels at retirement. The pension plans are funded, meaning that these obligations are backed with plan assets with fair value generally on a similar level as the obligations.
3) Employee representatives excluded. The pension obligation is in accordance with the col-lective pension agreement BTP2 and earned during the employment period.
4) The pension agreement changed from a defined benefit plan to a defined contribution plan as from 1 April 2015. The pension obligation/pension risk was transferred to the CEO 1 April 2015 and the pension obligation for the Former CEO is hence accounted for as settled. The settlement led to a gain of EUR 2,611,144 which has had a decreasing impact on the pension expense. The pension agreement from 1 April 2015 is a defined contribution plan with a contribution amounting to 30% of fixed salary. The pension expense in 2015 is presented for the period appointed CEO, 1 January 2015 to 31 Octo-ber 2015. The pension expense excluding the settlement was EUR 451,974 for the period as CEO. The pension expense as Former CEO and Senior Advisor is presented for the period 1 November 2015 to 31 December 2015.
5) The pension agreement is a defined contribution plan. The contribution is 30% of fixed salary, consisting of the collective agreement BTP1 and a complementary additional con-tribution. The pension expense as CEO is presented for the period appointed CEO, for the period 1 November 2015 to 31 December 2015. The pension obligation is in accordance with the collective pension agreement BTP2 and earned as a member of GEM. The pen-sion expense as member of GEM is included together with other members of GEM for the period 1 January 2015 to 31 October 2015.
6) The Group COO and Deputy CEO’s pension agreement is a defined contribution plan and the contribution is 30% of fixed salary. The pension expense as Group COO and Deputy CEO is presented for the period appointed Group COO and Deputy CEO, 1 November 2015 to 31 December 2015. The pension expense as member of GEM is included together with other members of GEM for the period 1 January 2015 to 31 October 2015.
7) Members of GEM included for the period they are appointed. The pension obligation is the obligation towards the members of GEM as of 31 December.
8) The pension obligation for Vesa Vainio is mainly due to pension rights earned in, and funded by, banks forming Nordea. The decrease in the pension obligation is mainly due to pension payments in 2015.
Group Executive Management (GEM)The pension agreements vary due to local country practices.
GEM members are entitled to retire with pension at the age of 62, 65 or 70. Pension agreements are defined benefit plans, defined contribution plans or a combination of such plans.
One member has a defined benefit plan not based on a col-lective agreement. The defined benefit plan provides a retire-ment pension amounting to 50% of pensionable income for life from age 62, including national pension benefits. One member had a defined benefit plan which was closed by end of March 2015 and substituted by a defined benefit pension based on collective agreement, with a complementing defined contribution plan on top of the collective agreement. Four members have pensions in accordance with the Swedish col-lective agreement, two in BTP1 (defined contribution plan) and two in BTP2 (defined benefit plan), with complementing defined contribution plans on top of the collective agreement. Finally one member has a defined contribution plan not based on a collective agreement. Fixed salary is pensionable income for all GEM-members. Part of GEM EIP is included in the pensionable income for one member.

Nordea Group – Notes to the income statement
Nordea Annual Report 201598
Notice period and severance payIn accordance with their employment contracts CEO and one GEM member have a notice period of 12 months and a sever-ance pay equal to 12 months’ salary to be reduced by the sal-ary the executive receives as a result of any other employment during these 12 months. The Group COO and Deputy CEO and three GEM members have a notice period of 6 months and a severance pay equal to 12 months’ salary to be reduced by the salary the executive receives as a result of any other employment during these 12 months. Two GEM members have a notice period of 6 months’ and a severance pay equal to 18 months’ salary to be reduced by the salary the executive receives as a result of any other employment during these 18 months. One GEM member has a notice period of 4 months. The Former CEO is not entitled to any severance pay.
Loans to key management personnelLoans to key management personnel, as defined in Note G1 section 26, amount to EUR 4m (EUR 3m). Interest income on these loans amounts to EUR 0m (EUR 0m).
For key management personnel who are employed by Nordea the same credit terms apply as for other employees, except for key management personnel in Denmark whose loans are granted on terms based on market conditions. In Norway the employee interest rate for loans is variable and was at 31 December 2014 2.8% for loans up to NOK 5m and 3.15% for loans above NOK 5m. In Finland the employee interest rate for loans corresponds to Nordea’s funding cost with a margin of 40 basis points up to EUR 0.4m, and 60 basis points on the part that exceeds EUR 0.4m. In Sweden the employee interest rate on fixed- and variable interest rate loans is 215 basis points lower than the corresponding inter-est rate for external customers (with a lower limit of 50 basis points, a decrease from 150 basis points as from 1 December 2014). There is currently a cap of 57 Swedish price base amounts both on fixed- and variable interest rate loans. Inter-est on loans above the defined caps is set on market terms. Loans to family members of key management personnel are granted on normal market terms, as well as loans to key man-agement personnel who are not employed by Nordea.
G7 Staff costs, cont.
Long Term Incentive Programmes2015 2014
Conditional rights LTIP 2012Matching
SharePerformance
Share IPerformance
Share IIMatching
SharePerformance
Share IPerformance
Share II
Outstanding at the beginning of the year 1,254,300 3,141,893 1,254,300 1,260,752 3,164,297 1,260,752
Granted1 66,029 165,168 66,029 54,976 137,708 54,976
Forfeited –136,196 –395,678 –136,196 –61,428 –160,112 –61,428
Alloted –903,505 –2,069,499 –903,505 — — —
Outstanding at end of year 280,628 841,884 280,628 1,254,300 3,141,893 1,254,300
– of which currently exercisable — — — — — —
Rights LTIP 2011
Outstanding at the beginning of year 269,671 450,568 121,352 974,746 1,949,493 974,746
Granted1 14,513 24,248 6,531 42,030 84,060 42,030
Forfeited — — — –24,245 –375,231 –570,137
Alloted –71,643 –119,698 –32,242 –722,860 –1,207,754 –325,287
Outstanding at end of year 2 212,541 355,118 95,641 269,671 450,568 121,352
– of which currently exercisable — — — — — —
Rights LTIP 2010
Outstanding at the beginning of year 132,584 140,078 59,664 179,929 190,096 80,971
Alloted –45,629 –48,220 –20,545 –47,345 –50,018 –21,307
Outstanding at end of year 2 86,955 91,858 39,119 132,584 140,078 59,664
– of which currently exercisable — — — — — —
1) Granted rights are compensation for dividend on the underlying Nordea share during the year.2) Allotment of rights have been deferred following retention requirements by the Nordic FSAs. There is no execise price for the deferred rights.
Participation in the Long Term Incentive Programmes (LTIPs) requires that the participants take direct ownership by investing in Nordea shares.

Notes to the income statement – Nordea Group
Nordea Annual Report 2015 99
G7 Staff costs, cont.
Conditions and requirementsFor each ordinary share the participants lock in to the LTIPs, they are granted a conditional Matching Share to receive ordinary shares based on continued employment, with certain exemptions, and the conditional Performance Share I and II to receive additional ordinary shares also based on fulfillment of certain performance conditions. The performance conditions for Performance Share I comprise a target growth in risk adjusted profit per share (RAPPS) or a target in risk-adjusted return on capital at risk (RAROCAR). Should the reported earnings per share (EPS) be lower than a predetermined level the participants are not entitled to exercise any Performance
Share I. The performance conditions for Performance Share II are market related and comprise growth in total shareholder return (TSR) in comparison with a peer group’s TSR or a target in RAROCAR and in P/B-ranking compared to a peer group. Furthermore the profit for each right is capped.
When the performance conditions are not fulfilled in full, the rights that are no longer exercisable are shown as forfeited in the previous tables, together with shares forfeited due to participants leaving the Nordea Group.
LTIP 2012/2011/2010 are not alloted in full due to deferral and retention requirements by Nordic FSAs.
LTIP 2012 LTIP 2011
Service condition, Matching Share/Performance Share I and II
Employed, with certain exemptions, within the Nordea Group during the three year vesting period.
Employed, with certain exemptions, within the Nordea Group during the three year vesting period.
Performance condition, Performance Share I
Average RAROCAR during the period 2012 up to and including 2014. Full allotment will be obtained if the RAROCAR amounts to 17%.
Compound Annual Growth Rate in RAPPS from year 2010 (base year) to and including year 2013. Full allot-ment will be obtained if the Compound Annual Growth Rate amounts to or exceeds 10%.
EPS knock out, Performance Share I
— Average reported EPS for 2011–2013 lower than EUR 0.26.
Performance condition, Performance Share II
RAROCAR during the period 2012 up to and including 2014 and P/B-ranking year-end 2014 compared to a peer group. Full allotment will be obtained if the RAROCAR amounts to 14% and if Nordea’s P/B-ranking is 1–5.
TSR during 2011–2013 in comparison with a peer group. Full allotment will be obtained if Nordea is ranked number 1–5.
Cap The market value of the allotted shares is capped to the participants’ annual salary for year-end 2011.
The market value of the allotted shares is capped to the participants’ annual salary for year-end 2010.
Dividend compensation
The number of Matching Shares and Performance Shares will be adjusted for dividends on the under-lying Nordea share during the vesting period, as if assuming that each dividend was used to immedi-ately invest in additional Nordea shares.
The number of Matching Shares and Performance Shares will be adjusted for dividends on the underlying Nordea share during the vesting period, as if assuming that each dividend was used to immediately invest in additional Nordea shares.
Long Term Incentive Programmes, cont.LTIP 2012 LTIP 2011
Matching SharePerformance
Share IPerformance
Share II Matching SharePerformance
Share IPerformance
Share II
Ordinary share per right 1.00 1.00 1.00 1.00 1.00 1.00
Exercise price. EUR — — — — — —
Grant date 13 May 2012 13 May 2012 13 May 2012 13 May 2011 13 May 2011 13 May 2011
Vesting period 36 months 36 months 36 months 36 months 36 months 36 months
Contractual life 36 months 36 months 36 months 36 months 36 months 36 months
Allotment April/May 2015 April/May 2015 April/May 2015 April/May 2014 April/May 2014 April/May 2014
Fair value at grant date EUR 5.781 EUR 5.781 EUR 2.091 EUR 7.231 EUR 7.251 EUR 2.631
1) The fair value has been recalculated due to dividend during the vesting period which the participants are compensated for through additional Matching and Performance Shares.

Nordea Group – Notes to the income statement
Nordea Annual Report 2015100
As the exercise price (zero for LTIP 2012, LTIP 2011 and LTIP 2010) is significantly below the share price at grant date, the value has a limited sensitivity to expected volatility and risk-free interest.
The value of the Performance Share II are based on market related conditions and fulfilment of the TSR, RAROCAR and P/B targets have been taken into consideration when calculat-ing the rights’ fair value at grant date. When calculating the impact from the market conditions it has been assumed that all possible outcomes have equal possibilities. Also the caps in each programme have been taken into consideration when calculating the rights’ fair value at grant. The adjustment to fair value is approximately 2–3% of the weighted average share price.
Cash-settled share-based payment transactionsNordea operates share-linked deferrals on parts of variable compensation for certain employee categories, indexed with Nordea Total Shareholder Returns (TSR) and either transferred after three years or transferred in equal instalments over a three to five year period. Since 2011 Nordea also operates TSR-linked retention on part of variable compensation for certain employee categories. Due to that the allocation of variable compensation is not finally decided during the current year, the deferred amount during the year in the table below relates to variable compensation earned the previous year.
In addition Nordea in 2013 introduced the Executive Incen-tive Programme (“EIP”) which aims to strengthen Nordea’s capability to retain and recruit the best talents. The aim is further to stimulate the managers and key employees whose efforts have direct impact on Nordea’s result, profitability and long term value growth. EIP reward performance meeting agreed predetermined targets on Group, business unit and individual level. The effect on the long term result is to be con-sidered when determining the targets. The EIP shall not exceed the fixed salary. EIP shall be paid in the form of cash and be subject to TSR-indexation, deferral, forfeiture clauses and retention as per relevant remuneration regulations. The main part of EIP 2015 is paid no earlier than autumn 2019. Participa-tion in the programme is offered to up to 400 managers and key employees, except GEM who are instead offered a GEM EIP (further information about the GEM EIP can be found in
the Remuneration section in the Board of Director’s Report), within the Nordea Group. EIP is offered instead of Nordea’s LTIP and VSP for the invited employees. The allocation of the EIP 2015 is decided during spring 2016, and a reservation of EUR 47m excl. social costs is made 2015. 80% of the allocated amount will be subject to TSR-indexation.
The below table only includes deferred amounts indexed with Nordea TSR. EIP has been included as from 2014, when deferred. Further information regarding all deferred amounts can be found in the separate report on remuneration published on Nordea’s homepage (www.nordea.com).
Long Term Incentive Programmes, cont.
Fair value calculationsThe fair value is measured through the use of generally accepted valuation models with the following input factors:
LTIP 2012 LTIP 2011
Weighted average share price EUR 6.70 EUR 8.39
Right life 3.0 years 3.0 years
Deduction of expected dividends No No
Risk free rate Not applicable Not applicable
Expected volatility Not applicable Not applicable
Expenses for equity-settled share-based payment programmes1
EURm LTIP 2012 LTIP 2011
Total expense during 2015 –2 –
Total expense during 2014 –14 –2
1) All amounts excluding social security contribution.
Share linked deferrals
EURm 2015 2014
Opening balance 32 28
Reclassification1 12 —
Deferred/earned during the year 47 17
TSR indexation during the year 3 4
Payments during the year2 –26 –17
Translation differences –1 0
Closing balance 67 32
1) Relates to a reclassification from deferred amounts that are indexed with a fixed rate.2) There have been no adjustments due to forfeitures.
G7 Staff costs, cont.

Notes to the income statement – Nordea Group
Nordea Annual Report 2015 101
Average number of employees Total Men Women
2015 2014 2015 2014 2015 2014
Full-time equivalentsDenmark 8,288 8,255 4,486 4,328 3,802 3,927
Sweden 6,957 6,963 3,346 3,212 3,611 3,751Finland 6,946 6,971 2,181 1,990 4,765 4,981Norway 3,137 3,238 1,678 1,748 1,459 1,490Poland 1,197 931 585 461 612 470Russia 1,085 1,418 268 454 817 964
Estonia 480 486 114 104 366 382
Latvia 436 431 125 132 311 299Luxembourg 393 373 243 245 150 128
Lithuania 360 351 123 110 237 241United States 110 118 57 61 53 57Singapore 86 85 39 29 47 56United Kingdom 82 75 52 46 30 29Germany 58 57 32 31 26 26Switzerland 32 30 23 13 9 17China 29 28 13 12 16 16Brazil 5 4 4 3 1 1Total average 29,681 29,814 13,369 12,979 16,312 16,835
Total number of employees (FTEs), end of period 29,815 29,643
Gender distributionIn the parent company s Board of Directors 56% (50%) were men and 44% (50%) were women. In the Board of Directors of the Nordea Group companies, 73% (75%) were men and 27% (25%) were women. The corresponding numbers for Other executives were 69% (65%) men and 31% (35%) women. Internal Boards consist mainly of management in Nordea.
G7 Staff costs, cont.

Nordea Group – Notes to the income statement
Nordea Annual Report 2015102
G10 Net loan losses
EURm 2015 2014
Loan losses divided by class
Realised loan losses — –2
Allowances to cover realised loan losses — 2
Reversals of previous provisions 1 23
Loans to credit institutions1 1 23
Realised loan losses –605 –633
Allowances to cover realised loan losses 448 450
Recoveries on previous realised loan losses 63 81
Provisions –1,074 –998
Reversals of previous provisions 693 557
Loans to the public1 –475 –543
Realised loan losses –11 –3
Allowances to cover realised loan losses 11 3
Provisions –104 –107
Reversals of previous provisions 99 93
Off-balance sheet items2 –5 –14
Net loan losses –479 –534
1) See Note G13 “Loans and impairment”. 2) Included in Note G30 “Provisons” as “Transfer risk” and “Guarantees/commitments”.
G9 Depreciation, amortisation and impairment
charges of tangible and intangible assets
EURm 2015 2014
Depreciation/amortisationProperties and equipment –113 –125
Intangible assets –76 –110
Total –189 –235
Impairment charges
Intangible assets –20 –350
Total –20 –350
Total –209 –585
G8 Other expenses
EURm 2015 2014
Information technology –485 –561
Marketing and representation –84 –103
Postage, transportation, telephone and office expenses –145 –178
Rents, premises and real estate –373 –389
Other –398 –425
Total –1,485 –1,656
Auditors’ fees – Total operationsEURm 2015 2014
PricewaterhouseCoopers
Auditing assignments –5 —
Audit-related services 0 —
Tax advisory services –1 —
Other assignments –1 —
Total –7 —
KPMG
Auditing assignments –1 –5
Audit-related services –1 –1
Tax advisory services 0 0
Other assignments –1 –1
Total –3 –7
E&Y
Auditing assignments 0 –1
Audit-related services 0 0
Tax advisory services 0 0
Other assignments –1 0
Total –1 –1
Total Auditors’ fees –11 –8

Notes to the income statement – Nordea Group
Nordea Annual Report 2015 103
G11 Taxes
Income tax expense
EURm 2015 2014
Current tax –957 –884
Deferred tax –85 –6
Bank tax in Finland1 — –60
Total –1,042 –950
1) The Finnish bank tax which was introduced in 2013 and ended in 2014 was based on risk exposure amount rather than income.
For current and deferred tax recognised in Other comprehensive income, see Statement of comprehensive income. The tax on the Group’s operating profit differs from the theoretical amount that would arise using the tax rate in Sweden (excluding bank tax in Finland 2014) as follows:
EURm 2015 2014
Profi t before tax 4,704 4,307
Tax calculated at a tax rate of 22.0% –1,035 –948
Effect of different tax rates in other countries –34 –55
Income from associated undertakings 6 2
Tax-exempt income 72 131
Non-deductible expenses –16 –25
Adjustments relating to prior years –17 9
Utilization of non-capitalized tax losses carry-forwards from previous periods — 1
Change of tax rate 27 3
Not creditable foreign taxes –45 –8
Tax charge –1,042 –890Average effective tax rate 22% 21%
Deferred taxDeferred tax
assetsDeferred tax
liabilities
EURm 2015 2014 2015 2014
Deferred tax related to:Tax losses carry-forward 86 283 — —
Loans to the public 22 20 430 410
Derivatives 8 10 394 459
Intangible assets 6 0 45 44
Investment properties 0 0 142 150
Retirement benefi t assets/obligations 44 156 84 60
Hedge of net investments in foreign operations — — — 94
Liabilities/provisions 87 54 103 127
Other 17 7 24 39
Netting between deferred tax assets and liabilities –194 –400 –194 –400
Total 76 130 1,028 983
EURm 2015 2014
Unrecognised deferred tax assetsUnused tax losses carry-forward with no expire date 44 44
Total 44 44
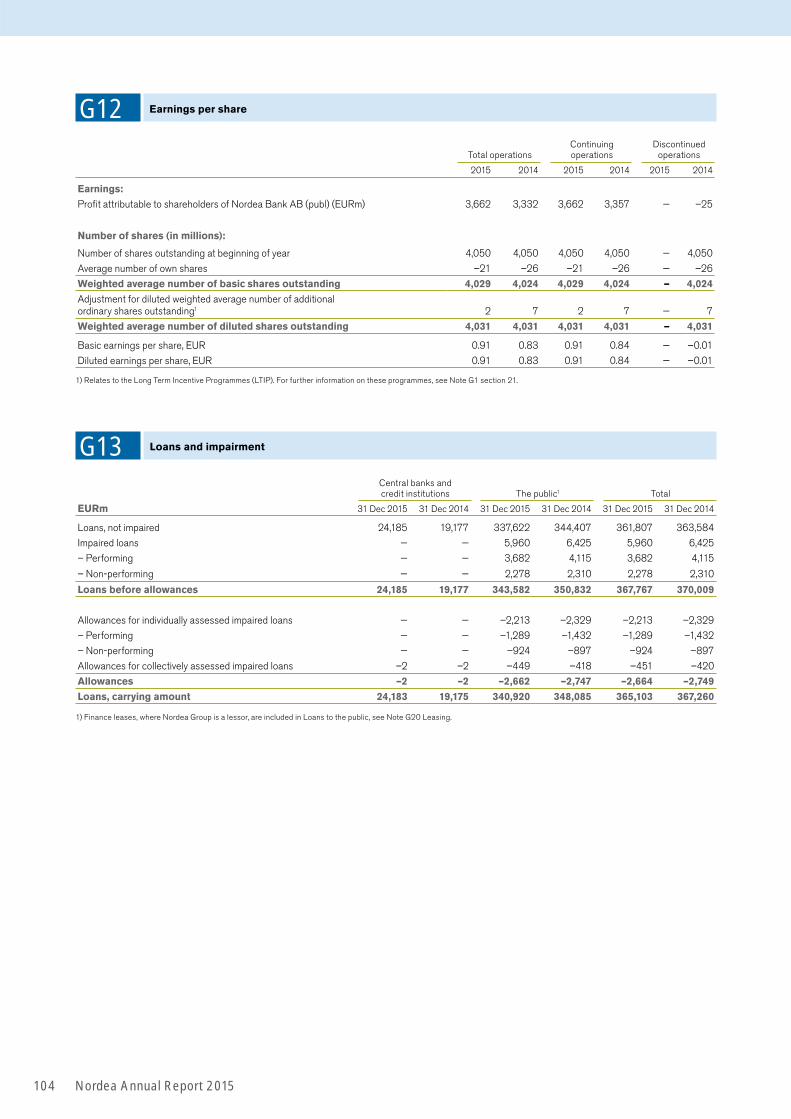
Nordea Annual Report 2015104
G13 Loans and impairment
Central banks and credit institutions The public1 Total
EURm 31 Dec 2015 31 Dec 2014 31 Dec 2015 31 Dec 2014 31 Dec 2015 31 Dec 2014
Loans, not impaired 24,185 19,177 337,622 344,407 361,807 363,584
Impaired loans — — 5,960 6,425 5,960 6,425
– Performing — — 3,682 4,115 3,682 4,115
– Non-performing — — 2,278 2,310 2,278 2,310
Loans before allowances 24,185 19,177 343,582 350,832 367,767 370,009
Allowances for individually assessed impaired loans — — –2,213 –2,329 –2,213 –2,329
– Performing — — –1,289 –1,432 –1,289 –1,432
– Non-performing — — –924 –897 –924 –897
Allowances for collectively assessed impaired loans –2 –2 –449 –418 –451 –420
Allowances –2 –2 –2,662 –2,747 –2,664 –2,749
Loans, carrying amount 24,183 19,175 340,920 348,085 365,103 367,260
1) Finance leases, where Nordea Group is a lessor, are included in Loans to the public, see Note G20 Leasing.
G12 Earnings per share
Total operationsContinuing operations
Discontinued operations
2015 2014 2015 2014 2015 2014
Earnings:Profi t attributable to shareholders of Nordea Bank AB (publ) (EURm) 3,662 3,332 3,662 3,357 — –25
Number of shares (in millions):
Number of shares outstanding at beginning of year 4,050 4,050 4,050 4,050 — 4,050
Average number of own shares –21 –26 –21 –26 — –26
Weighted average number of basic shares outstanding 4,029 4,024 4,029 4,024 — 4,024Adjustment for diluted weighted average number of additionalordinary shares outstanding1 2 7 2 7 — 7
Weighted average number of diluted shares outstanding 4,031 4,031 4,031 4,031 — 4,031
Basic earnings per share, EUR 0.91 0.83 0.91 0.84 — –0.01
Diluted earnings per share, EUR 0.91 0.83 0.91 0.84 — –0.01
1) Relates to the Long Term Incentive Programmes (LTIP). For further information on these programmes, see Note G1 section 21.
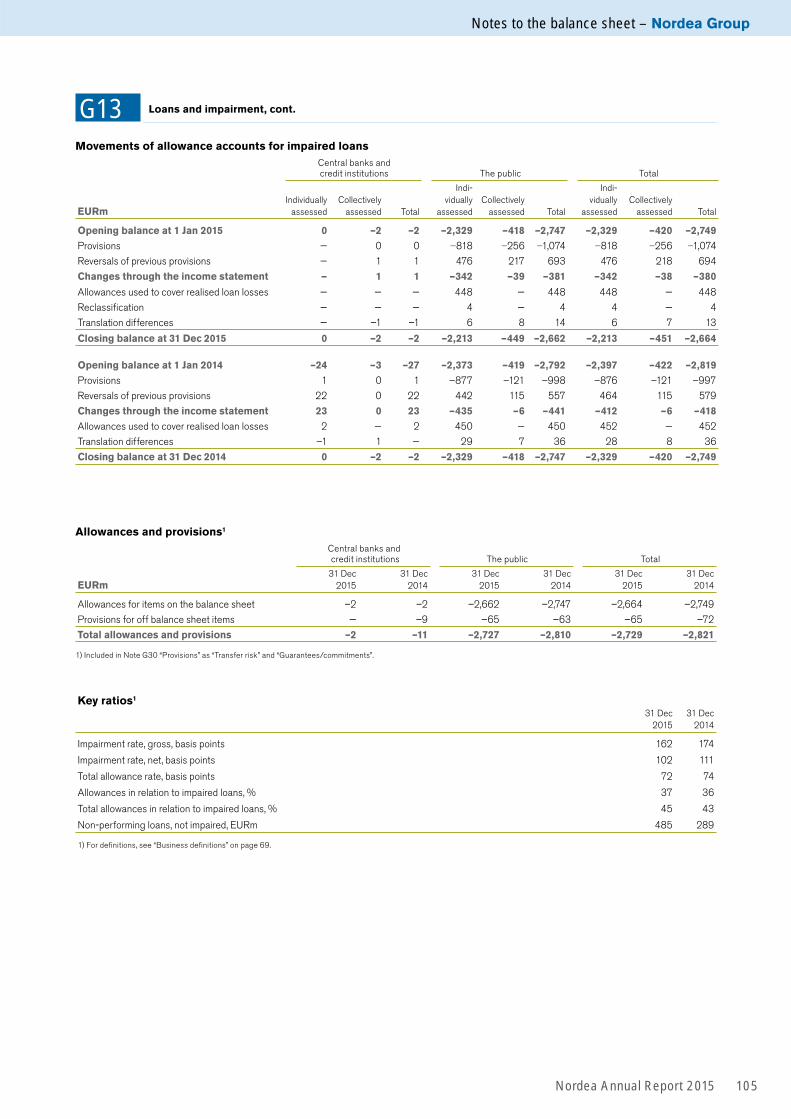
Notes to the balance sheet – Nordea Group
Nordea Annual Report 2015 105
Movements of allowance accounts for impaired loansCentral banks and credit institutions The public Total
EURmIndi vidually
assessed
Collectively
assessed Total
Indi-
vidually
assessed
Collectively
assessed Total
Indi-
vidually
assessed
Collectively
assessed Total
Opening balance at 1 Jan 2015 0 –2 –2 –2,329 –418 –2,747 –2,329 –420 –2,749Provisions — 0 0 –818 –256 –1,074 –818 –256 –1,074
Reversals of previous provisions — 1 1 476 217 693 476 218 694
Changes through the income statement — 1 1 –342 –39 –381 –342 –38 –380
Allowances used to cover realised loan losses — — — 448 — 448 448 — 448
Reclassifi cation — — — 4 — 4 4 — 4
Translation differences — –1 –1 6 8 14 6 7 13
Closing balance at 31 Dec 2015 0 –2 –2 –2,213 –449 –2,662 –2,213 –451 –2,664
Opening balance at 1 Jan 2014 –24 –3 –27 –2,373 –419 –2,792 –2,397 –422 –2,819Provisions 1 0 1 –877 –121 –998 –876 –121 –997
Reversals of previous provisions 22 0 22 442 115 557 464 115 579
Changes through the income statement 23 0 23 –435 –6 –441 –412 –6 –418Allowances used to cover realised loan losses 2 — 2 450 — 450 452 — 452
Translation differences –1 1 — 29 7 36 28 8 36
Closing balance at 31 Dec 2014 0 –2 –2 –2,329 –418 –2,747 –2,329 –420 –2,749
Allowances and provisions1
Central banks and credit institutions The public Total
EURm31 Dec
2015
31 Dec
2014
31 Dec
2015
31 Dec
2014
31 Dec
2015
31 Dec
2014
Allowances for items on the balance sheet –2 –2 –2,662 –2,747 –2,664 –2,749
Provisions for off balance sheet items — –9 –65 –63 –65 –72
Total allowances and provisions –2 –11 –2,727 –2,810 –2,729 –2,821
1) Included in Note G30 “Provisions” as “Transfer risk” and “Guarantees/commitments”.
G13 Loans and impairment, cont.
Key ratios1
31 Dec
2015
31 Dec
2014
Impairment rate, gross, basis points 162 174
Impairment rate, net, basis points 102 111
Total allowance rate, basis points 72 74
Allowances in relation to impaired loans, % 37 36
Total allowances in relation to impaired loans, % 45 43
Non-performing loans, not impaired, EURm 485 289
1) For defi nitions, see “Business defi nitions” on page 69.

Nordea Group – Notes to the balance sheet
Nordea Annual Report 2015106
G14 Interest-bearing securities
EURm31 Dec
201531 Dec
2014
State and sovereigns 23,093 26,107
Municipalities and other public bodies 2,667 2,385
Mortgage institutions 27,785 28,742
Other credit institutions 27,804 23,730
Corporates 6,176 5,175
Corporates sub-investment grade 650 758
Other 1 213
Total 88,176 87,110
G15 Financial instruments pledged as collateral
Financial instruments pledged as collateralIn repurchase transactions and in securities lending transac-tions, non-cash assets are transferred as collateral. When the counterpart receiving the collateral has the right to sell or repledge the assets, the assets are reclassified on the balance sheet to the item Financial instruments pledged as collateral.
EURm31 Dec
2015
31 Dec
2014
Interest-bearing securities 8,333 12,121
Shares 8 30
Total 8,341 12,151
For information on transferred assets and reverse repos, see Note G42.
G16 Shares
EURm31 Dec
2015
31 Dec
2014
Shares 15,302 15,505
Fund units, equity related 17,611 16,529
Fund units, interest related 7,840 7,745
Total 40,753 39,779
– of which Financial instruments pledged as collateral (Note G15) 8 30
Total 40,745 39,749

Notes to the balance sheet – Nordea Group
Nordea Annual Report 2015 107
G17 Derivatives and Hedge accounting
Derivatives held for trading Fair value
Total nom amount31 Dec 2015, EURm Positive Negative
Interest rate derivativesInterest rate swaps 46,918 42,076 4,517,572
FRAs 7 12 51,470
Futures and forwards 264 327 1,538,842
Options 10,731 9,392 431,777
Other 6 88 6,671
Total 57,926 51,895 6,546,332
Equity derivativesEquity swaps 294 332 6,825
Futures and forwards 8 15 985
Options 521 750 24,238
Total 823 1,097 32,048
Foreign exchange derivativesCurrency and interest rate swaps 14,529 21,136 856,486
Currency forwards 1,708 1,219 113,622
Options 266 208 28,027
Other 1 1 79
Total 16,504 22,564 998,214
Credit derivativesCredit Default Swaps (CDS) 2,304 2,288 92,427
Total 2,304 2,288 92,427
Commodity derivatives 17 13 483
Other derivatives 20 30 3,370
Total derivatives held for trading 77,594 77,887 7,672,874
Derivatives used for hedge accounting Fair value
Total nom amount31 Dec 2015, EURm Positive Negative
Interest rate derivatives 1,677 712 81,603
Foreign exchange derivatives 1,470 906 25,613
Total derivatives used for hedge accounting 3,147 1,618 107,216 – of which cash fl ow hedges 968 849 12,6641
– of which fair value hedges 1,891 708 86,5031
– of which net investment hedges 288 61 12,962
Total derivatives 80,741 79,505 7,780,090
1) Some cross currency interest rate swaps and interest rate swaps are used both as fair value hedges and cash fl ow hedges and the nominal amounts are then reported on both lines.
Periods when hedged cashflows are expected to occur and when they are expected to affect the income statement
31 Dec 2015, EURm <1 year 1–3 years 3–5 years 5–10 years 10 years
Cash infl ows (assets) — — — — —
Cash outfl ows (liabilities) 688 4,434 2,773 2,038 712
Net cash outfl ows 688 4,434 2,773 2,038 712

Nordea Group – Notes to the balance sheet
Nordea Annual Report 2015108
G17 Derivatives and Hedge accounting, cont.
Derivatives held for tradingFair value Total nom
amount31 Dec 2014, EURm Positive Negative
Interest rate derivativesInterest rate swaps 62,562 56,949 4,187,058
FRAs 55 62 61,419
Futures and forwards 360 392 1,294,054
Options 15,447 12,815 456,865
Total 78,424 70,218 5,999,396
Equity derivativesEquity swaps 105 275 7,372
Futures and forwards 13 22 981
Options 549 780 20,132
Total 667 1,077 28,485
Foreign exchange derivativesCurrency and interest rate swaps 17,526 19,612 723,861
Currency forwards 2,224 994 84,666
Options 467 329 29,654
Other 1 1 99
Total 20,218 20,936 838,280
Credit derivativesCredit Default Swaps (CDS) 2,864 2,853 91,827
Total 2,864 2,853 91,827
Commodity derivatives 71 19 787
Other derivatives 35 15 2,359
Total derivatives held for trading 102,279 95,118 6,961,134
Derivatives used for hedge accountingFair value Total nom
amount31 Dec 2014, EURm Positive Negative
Interest rate derivatives 2,044 1,064 95,925
Equity derivatives — 4 55
Foreign exchange derivatives 796 1,154 28,094
Total derivatives used for hedge accounting 2,840 2,222 124,074
– of which cash fl ow hedges 816 850 36,0911
– of which fair value hedges 1,672 1,370 100,5981
– of which net investment hedges 352 2 12,674
Total derivatives 105,119 97,340 7,085,208
1) Some cross currency interest rate swaps and interest rate swaps are used both as fair value hedges and cash fl ow hedges and the nominal amounts are then reported on both lines.
Periods when hedged cashflows are expected to occur and when they are expected to affec the income statement
31 Dec 2014, EURm <1 year 1–3 years 3–5 years 5–10 years 10 years
Cash infl ows (assets) — — — — —
Cash outfl ows (liabilities) 3,626 10,022 3,989 3,628 1,191
Net cash outfl ows 3,626 10,022 3,989 3,628 1,191
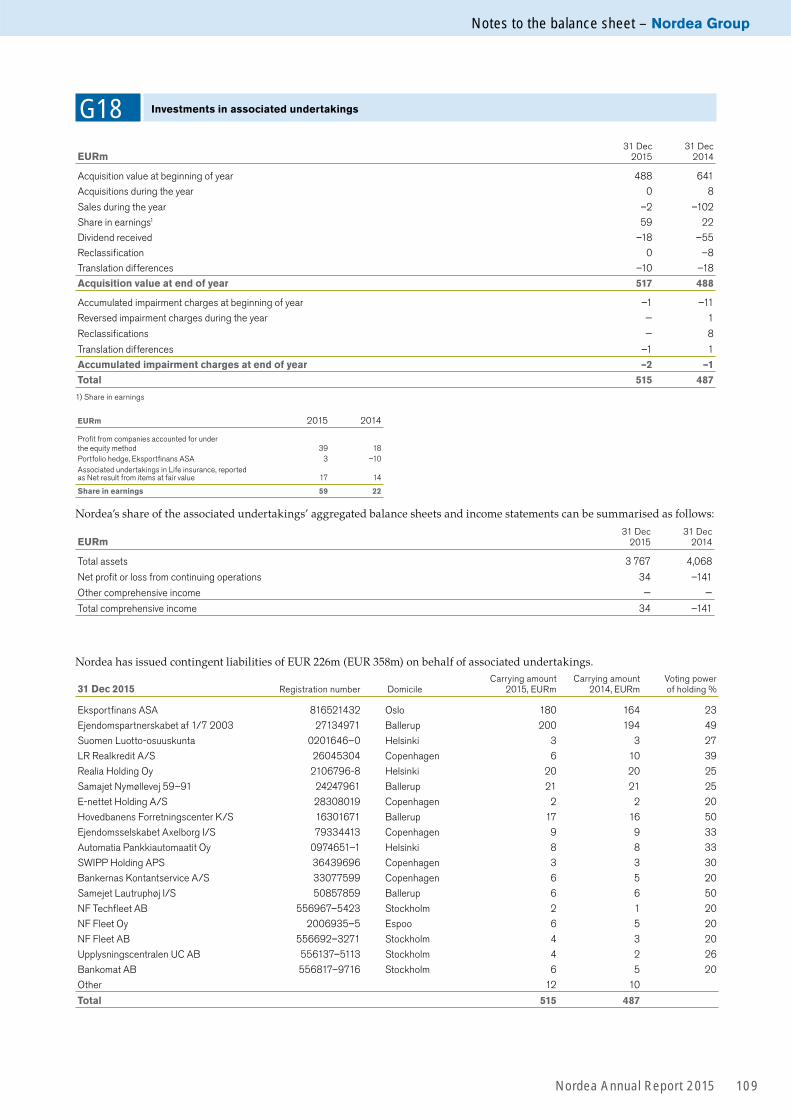
Notes to the balance sheet – Nordea Group
Nordea Annual Report 2015 109
G18 Investments in associated undertakings
EURm31 Dec
201531 Dec
2014
Acquisition value at beginning of year 488 641
Acquisitions during the year 0 8
Sales during the year –2 –102
Share in earnings1 59 22
Dividend received –18 –55
Reclassifi cation 0 –8
Translation differences –10 –18
Acquisition value at end of year 517 488
Accumulated impairment charges at beginning of year –1 –11
Reversed impairment charges during the year — 1
Reclassifi cations — 8
Translation differences –1 1
Accumulated impairment charges at end of year –2 –1
Total 515 487
1) Share in earnings
EURm 2015 2014
Profi t from companies accounted for under the equity method 39 18
Portfolio hedge, Eksportfi nans ASA 3 –10
Associated undertakings in Life insurance, reported as Net result from items at fair value 17 14
Share in earnings 59 22
Nordea’s share of the associated undertakings’ aggregated balance sheets and income statements can be summarised as follows:
EURm31 Dec
201531 Dec
2014
Total assets 3 767 4,068
Net profi t or loss from continuing operations 34 –141
Other comprehensive income — —
Total comprehensive income 34 –141
Nordea has issued contingent liabilities of EUR 226m (EUR 358m) on behalf of associated undertakings.
31 Dec 2015 Registration number DomicileCarrying amount
2015, EURmCarrying amount
2014, EURmVoting power of holding %
Eksportfi nans ASA 816521432 Oslo 180 164 23
Ejendomspartnerskabet af 1/7 2003 27134971 Ballerup 200 194 49
Suomen Luotto-osuuskunta 0201646–0 Helsinki 3 3 27
LR Realkredit A/S 26045304 Copenhagen 6 10 39
Realia Holding Oy 2106796-8 Helsinki 20 20 25
Samajet Nymøllevej 59–91 24247961 Ballerup 21 21 25
E-nettet Holding A/S 28308019 Copenhagen 2 2 20
Hovedbanens Forretningscenter K/S 16301671 Ballerup 17 16 50
Ejendomsselskabet Axelborg I/S 79334413 Copenhagen 9 9 33
Automatia Pankkiautomaatit Oy 0974651–1 Helsinki 8 8 33
SWIPP Holding APS 36439696 Copenhagen 3 3 30
Bankernas Kontantservice A/S 33077599 Copenhagen 6 5 20
Samejet Lautruphøj I/S 50857859 Ballerup 6 6 50
NF Techfl eet AB 556967–5423 Stockholm 2 1 20
NF Fleet Oy 2006935–5 Espoo 6 5 20
NF Fleet AB 556692–3271 Stockholm 4 3 20
Upplysningscentralen UC AB 556137–5113 Stockholm 4 2 26
Bankomat AB 556817–9716 Stockholm 6 5 20
Other 12 10
Total 515 487

Nordea Group – Notes to the balance sheet
Nordea Annual Report 2015110
G19 Intangible assets
EURm31 Dec
201531 Dec
2014
Goodwill allocated to cash generating units1 Retail Banking Norway 745 787
Retail Banking Denmark 588 591
Retail Banking Sweden 225 221
Life & Pensions, Denmark 128 129
Life & Pensions, Norway 127 127
Life & Pensions, Poland 41 40
Banking Russia 139 154
Shipping, Offshore & Oil services 177 185
Total goodwill 2,170 2,234
Computer software 938 580
Other intangible assets 100 94
Total intangible assets 3,208 2,908
1) Excluding goodwill in associated undertakings.
Movements in goodwillAcquisition value at beginning of year 2,235 2,422
Translation differences –64 –187
Acquisition value at end of year 2,171 2,235
Accumulated impairment charges at beginning of year –1 –1
Accumulated impairment charges at end of year –1 –1
Total 2,170 2,234
Movements in computer software
Acquisition value at beginning of year 1,415 1,184
Acquisitions during the year 429 279
Disposals during the year –635 –10
Reclassifi cations — 4
Translation differences –9 –42
Acquisition value at end of year 1,200 1,415
Accumulated amortisation at beginning of year –448 –380
Amortisation according to plan for the year –49 –85
Accumulated amortisation on disposals during the year 266 10
Translation differences 2 7
Accumulated amortisation at end of year –229 –448
Accumulated impairment charges at beginning of year –387 –47
Accumulated impairment charges on disposals during the year 369 —
Impairment charges during the year –20 –350
Translation differences 5 10
Accumulated impairment charges at end of year –33 –387
Total 938 580
Notes to the balance sheet – Nordea Group
Nordea Annual Report 2015 111
the market’s long-term risk-free rate of interest and yield requirements. The post-tax discount rate used for the impair-ment test 2015 is 7.6% (7.5%), which equals a pre-tax rate of 10.0% (9.9%). For operations in Norway, the expected interest rate is higher and the discount rate used is 8.1% (7.5%). For Russia an additional risk premium of 400 (580) basis points has been applied.
The impairment tests conducted in 2015 did not indicate any need for goodwill impairment. See Note G1 section 4 for more information.
An increase in the discount rate of 1 percentage point or a reduction in the future growth rate of 1 percentage points are considered to be reasonably possible changes in key assump-tions. Such a change would not result in an impairment in any of the cash generating units.
The impairment test for Russia did not indicate any impair-ment loss based on the estimated cash flows and abovemen-tioned assumptions. Reasonable possible changes to the dis-count rate and the growth rate do not trigger any impairment loss, but the current turmoil in Russia does however create uncertainty also around estimated cash flows. It is however Nordea’s assessment that even a significant decrease in future cash flows would, all other assumptions unchanged, will not lead to an impairment loss.
Impairment testing of goodwillA cash generating unit, defined as the operating segment, is the basis for the goodwill impairment test. For Life & Pensions, the cash generating units for which goodwill is tested, are the opera-tions in each country.
The impairment test is performed for each cash generating unit by comparing the carrying amount of the net assets, including goodwill, with the recoverable amount. The recov-erable amount is the value in use and is estimated based on discounted cash flows. Due to the long-term nature of the investments, cash flows are expected to continue indefinitely.
Cash flows in the near future (generally between 3–5 years) are based on financial forecasts, derived from forecasted mar-gins, volumes and cost development. These input variables are based on historical data adjusted to reflect Nordea’s assump-tions about the future. Cash flows for the period beyond the forecasting period are based on estimated sector growth rates. For impairment testing, a growth rate of 1.3% (2.0%) has been used for all cash generating units, except Retail Banking Nor-way and Life & Pensions, Norway where 1.8% (2.0%) has been used. Growth rates are based on historical data, updated to reflect the current situation.
Cash flows include normalised loan losses. The derived cash flows are discounted at a rate based on
G19 Intangible assets, cont.

Nordea Group – Notes to the balance sheet
Nordea Annual Report 2015112
Nordea as a lessorFinance leasesNordea owns assets leased to customers under finance lease agreements. Finance lease agreements are reported as receiv-ables from the lessee included in “Loans to the public” (see Note G13) at an amount equal to the net investment in the lease. The leased assets mainly comprise vehicles, machinery and other equipment.
Reconciliation of gross investments and present value of future minimum lease payments:
EURm31 Dec
201531 Dec
2014
Gross investments 7,281 7,480
Less unearned fi nance income –282 –356
Net investments in fi nance leases 6,999 7,124
Less unguaranteed residual values accruing to the benefi t of the lessor –21 –22
Present value of future minimum lease payments receivable 6,978 7,102Accumulated allowance for uncollectible minimum lease payments receivable 8 8
As of 31 December 2015 the gross investment and the net investment by remaining maturity was distributed as follows:
31 Dec 2015
EURmGross
InvestmentNet
Investment
2016 1,971 1,865
2017 1,769 1,696
2018 1,465 1,417
2019 963 935
2020 520 496
Later years 593 590
Total 7,281 6,999
Operating leases Assets subject to operating leases mainly comprise real estate, vehicles, aeroplanes and other equipment. On the balance sheet they are reported as tangible assets.
Under non-cancellable operating leases, the future minimum lease payments receivable are distributed as follows:
EURm 31 Dec 2015
2016 13
2017 15
2018 11
2019 6
2020 3
Later years 1
Total 49
Nordea as a lessee Finance leasesNordea has only to a minor extent entered into finance lease agreements.
Operating leases Nordea has entered into operating lease agreements for premises and office equipment.
Leasing expenses during the year, EURm
31 Dec2015
31 Dec2014
Leasing expenses during the year –236 –236
– of which minimum lease payments –231 –233
– of which contingent rents –5 –3
Leasing income during the year regarding sublease payments 5 6
Future minimum lease payments under non-cancellable operating leases amounted to and are distributed as follows:
EURm 31 Dec 2015
2016 136
2017 107
2018 89
2019 63
2020 56
Later years 227
Total 678
Total sublease payments expected to be received under non-cancellable subleases amounts to EUR 13m.
G20 Leasing

Notes to the balance sheet – Nordea Group
Nordea Annual Report 2015 113
G21 Investment properties
EURm31 Dec
201531 Dec
2014
Carrying amount at beginning of year 3,227 3,524
Acquisitions during the year 226 172
Sales/disposables during the year –205 –423
Fair value adjustments 28 50
Transfers/reclassifi cations during the year –156 –35
Translation differences 45 –61
Carrying amount at end of year 3,165 3,227
Amounts recognised in the income statement1
EURm 2015 2014
Fair value adjustments 28 50
Rental income 165 220
Direct operating expenses that generate rental income –37 –43
Direct operating expenses that did notgenerate rental income –10 –9
Total 146 218 1) Included in Net result from items at fair value.
The method applied when calculating fair value is a rate of return calculation, based on internal models. As a supplement to these values, appraisals were obtained from independent external valuers for parts of the investment properties.
Approximately 75% of the investment properties are valued using internal models based on a rate of return calculation. For the remaining 25% of the investment properties, apprai-sals were obtained from independent external valuers.
For further information regarding investment properties, see note G39.
G23 Prepaid expenses and accrued income
EURm31 Dec
201531 Dec
2014
Accrued interest income 310 404
Other accrued income 558 487
Prepaid expenses 658 723
Total 1,526 1,614
G22 Other assets
EURm31 Dec
201531 Dec
2014
Claims on securities settlement proceeds 1,596 3,339
Cash/margin receivables 14,697 11,176
Other 2,307 3,066
Total 18,600 17,581
G25 Deposits and borrowings from the public
EURm31 Dec
201531 Dec
2014
Deposits1 179,630 168,682
Contracts where the return is based on separate assets 4,293 4,287
Repurchase agreements 9,419 24,285
Total 193,342 197,254
1) Deposits related to individual pension savings (IPS) are also included.
G24 Deposits by credit institutions
EURm31 Dec
201531 Dec
2014
Central banks 12,243 13,601
Banks 20,187 28,940
Other credit institutions 11,779 13,781
Total 44,209 56,322
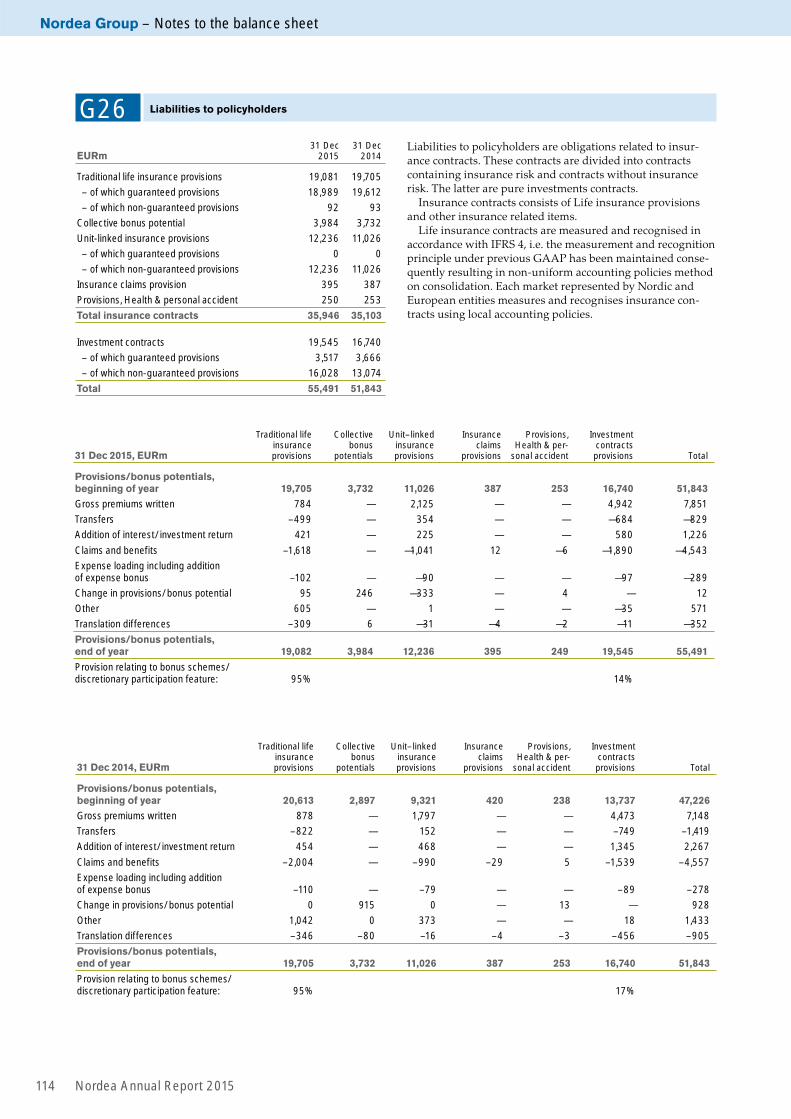
Nordea Group – Notes to the balance sheet
Nordea Annual Report 2015114
31 Dec 2015, EURm
Traditional life insurance provisions
Collective bonus
potentials
Unit–linked insurance provisions
Insurance claims
provisions
Provisions, Health & per-
sonal accident
Investment contracts
provisions Total
Provisions/bonus potentials, beginning of year 19,705 3,732 11,026 387 253 16,740 51,843
Gross premiums written 784 — 2,125 — — 4,942 7,851
Transfers –499 — 354 — — —684 —829
Addition of interest/investment return 421 — 225 — — 580 1,226
Claims and benefits –1,618 — —1,041 12 —6 —1,890 —4,543
Expense loading including addition of expense bonus –102 — —90 — — —97 —289
Change in provisions/bonus potential 95 246 —333 — 4 — 12
Other 605 — 1 — — —35 571
Translation differences –309 6 —31 —4 —2 —11 —352
Provisions/bonus potentials, end of year 19,082 3,984 12,236 395 249 19,545 55,491
Provision relating to bonus schemes/discretionary participation feature: 95% 14%
31 Dec 2014, EURm
Traditional life insurance provisions
Collective bonus
potentials
Unit–linked insurance provisions
Insurance claims
provisions
Provisions, Health & per-
sonal accident
Investment contracts
provisions Total
Provisions/bonus potentials, beginning of year 20,613 2,897 9,321 420 238 13,737 47,226
Gross premiums written 878 — 1,797 — — 4,473 7,148
Transfers –822 — 152 — — –749 –1,419
Addition of interest/investment return 454 — 468 — — 1,345 2,267
Claims and benefits –2,004 — –990 –29 5 –1,539 –4,557
Expense loading including addition of expense bonus –110 — –79 — — –89 –278
Change in provisions/bonus potential 0 915 0 — 13 — 928
Other 1,042 0 373 — — 18 1,433
Translation differences –346 –80 –16 –4 –3 –456 –905
Provisions/bonus potentials, end of year 19,705 3,732 11,026 387 253 16,740 51,843
Provision relating to bonus schemes/discretionary participation feature: 95% 17%
EURm31 Dec
201531 Dec
2014
Traditional life insurance provisions 19,081 19,705
– of which guaranteed provisions 18,989 19,612
– of which non-guaranteed provisions 92 93
Collective bonus potential 3,984 3,732
Unit-linked insurance provisions 12,236 11,026
– of which guaranteed provisions 0 0
– of which non-guaranteed provisions 12,236 11,026
Insurance claims provision 395 387
Provisions, Health & personal accident 250 253
Total insurance contracts 35,946 35,103
Investment contracts 19,545 16,740
– of which guaranteed provisions 3,517 3,666
– of which non-guaranteed provisions 16,028 13,074
Total 55,491 51,843
Liabilities to policyholders are obligations related to insur-ance contracts. These contracts are divided into contracts containing insurance risk and contracts without insurance risk. The latter are pure investments contracts.
Insurance contracts consists of Life insurance provisions and other insurance related items.
Life insurance contracts are measured and recognised in accordance with IFRS 4, i.e. the measurement and recognition principle under previous GAAP has been maintained conse-quently resulting in non-uniform accounting policies method on consolidation. Each market represented by Nordic and European entities measures and recognises insurance con-tracts using local accounting policies.
G26 Liabilities to policyholders

Notes to the balance sheet – Nordea Group
Nordea Annual Report 2015 115
G26 Liabilities to policyholders, cont.
Life insurance risk and market risks in the Life insurance operations
31 Dec 2015 31 Dec 2014
Sensitivites, EURm
Effect on policyholders
liabilities1
Effect on Nordeas
Equity2
Effect on policyholders
liabilities1
Effect on Nordeas
Equity2
Mortality – increased living with 1 year 27.8 —21.4 68.3 –52.6
Mortality – decreased living with 1 year —6.5 5.0 –1.2 0.9
Disability – 10% increase 13.8 —10.6 27.7 –21.3
Disability – 10% decrease —9.2 7.1 –16.1 12.4
50 bp increase in interest rates —816.6 0.3 –915.0 –7.6
50 bp decrease in interest rates 872.3 —0.5 1,001.7 4.7
12% decrease in all share prices —1,478.9 —2.8 –1,684.3 –1.8
8% decrease in property value —236.8 —1.5 –240.3 –0.7
8% loss on counterparts —24.9 —0.2 –31.7 0.0
1) + (plus) indicates that policyholders liabilities increase.
2) – (minus) indicates that equity decrease.
Liabilities to policyholders divided in guarantee levels (technical interest rate)
31 Dec 2015, EURm Non 0 pct. 0 to 2 pct. 2 to 3 pct. 3 to 4 pct. Over 4 pct. Total liabilities
Technical provision 28,357 2,340 7,666 4,820 3,996 3,684 50,863
31 Dec 2014, EURm Non 0 pct. 0 to 2 pct. 2 to 3 pct. 3 to 4 pct. Over 4 pct. Total liabilities
Technical provision 24,194 2,236 7,854 5,391 3,966 3,830 47,471
Insurance risksInsurance risk is described in the “Risk, Liquidity and Capital management“ section of the Board of Directors’ Report. Additional quantitative information is found below.
Risk profiles on insurance
Product Risk types Material effect
Traditional – Mortality Yes
– Disability Yes
– Return guaranties Yes
Unit-Link – Mortality Yes
– Disability Yes
– Return guaranties No
Health and personal accident – Mortality No
– Disability Yes
– Return guaranties No
Financial contract – Mortality No
– Disability No
– Return guaranties No
For investments where the customer is bearing the risk, see Note G43.
G27 Debt securities in issue
EURm31 Dec
201531 Dec
2014
Certificates of deposit 26,018 22,926
Commercial papers 23,243 30,133
Covered bonds 106,746 98,986
Other bonds 45,860 42,155
Other 70 74
Total 201,937 194,274
G28 Other liabilities
EURm31 Dec
201531 Dec
2014
Liabilities on securities settlement proceeds 1,108 3,085
Sold, not held, securities 8,824 6,903
Accounts payable 179 174
Cash/margin payables 11,141 10,061
Other 4,504 6,750
Total 25,756 26,973
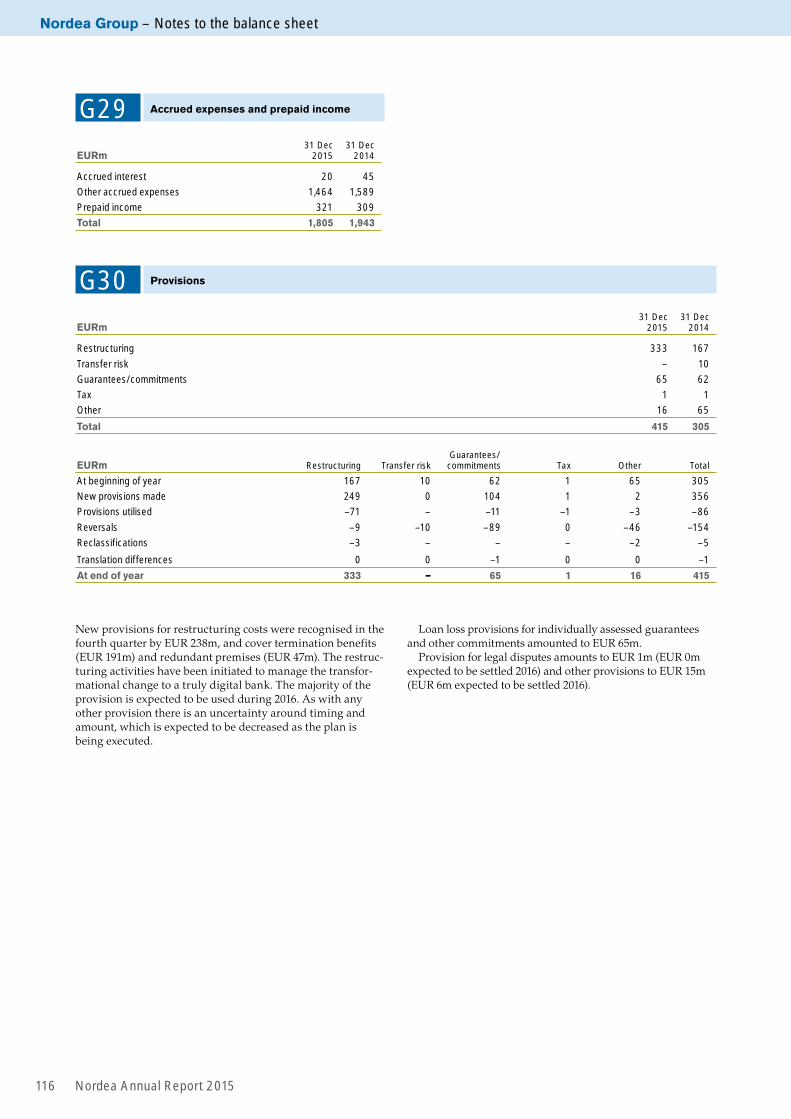
Nordea Group – Notes to the balance sheet
Nordea Annual Report 2015116
G29 Accrued expenses and prepaid income
EURm31 Dec
201531 Dec
2014
Accrued interest 20 45
Other accrued expenses 1,464 1,589
Prepaid income 321 309
Total 1,805 1,943
G30 Provisions
EURm31 Dec
201531 Dec
2014
Restructuring 333 167
Transfer risk – 10
Guarantees/commitments 65 62
Tax 1 1
Other 16 65
Total 415 305
EURm Restructuring Transfer riskGuarantees/
commitments Tax Other Total
At beginning of year 167 10 62 1 65 305
New provisions made 249 0 104 1 2 356
Provisions utilised –71 – –11 –1 –3 –86
Reversals –9 –10 –89 0 –46 –154
Reclassifications –3 – – – –2 –5
Translation differences 0 0 –1 0 0 –1
At end of year 333 – 65 1 16 415
New provisions for restructuring costs were recognised in the fourth quarter by EUR 238m, and cover termination benefits (EUR 191m) and redundant premises (EUR 47m). The restruc-turing activities have been initiated to manage the transfor-mational change to a truly digital bank. The majority of the provision is expected to be used during 2016. As with any other provision there is an uncertainty around timing and amount, which is expected to be decreased as the plan is being executed.
Loan loss provisions for individually assessed guarantees and other commitments amounted to EUR 65m.
Provision for legal disputes amounts to EUR 1m (EUR 0m expected to be settled 2016) and other provisions to EUR 15m (EUR 6m expected to be settled 2016).

Notes to the balance sheet – Nordea Group
Nordea Annual Report 2015 117
EURm31 Dec
201531 Dec
2014
Defined benefit plans, net 48 –498
Total 48 –498
Nordea sponsors both defined contribution plans (DCP) and defined benefit plans (DBP). IAS 19 secures that the pension obligations net of plan assets backing these obligations are reflected on the Group’s balance sheet. The major plans in each country are funded schemes covered by assets in pen-sion funds/foundations.
The plans are structured in accordance with local regula-tions and legislations, local practice and, where applicable, collective agreements. Nordea’s main DBPs in Sweden, Norwa y and Finland are all employer financed final salary and service based pension plans providing pension benefits on top of the statutory systems. All DBPs are closed for new entrants, new employees are offered DCPs. DBPs in Sweden are mainly offered in accordance with collective agreements and follow the regulations in the Pension Obligations Vesting Act (Tryggandelagen). Plan assets are held in a separate pen-sion foundation. In Norway the DBPs are in accordance with the Nordea Norway occupational pension plan and follow the Occupational Pension Act (Foretakspensjonloven). In Norway plan assets are also held by a separate pension fund. In Finlan d Nordea is providing additional pension benefits on top of the statutory system in accordance with the Nordea Finland occupational pension plan and follows the regula-tions in the Employees’ Pension Act (TyEL). Plan assets are generally held in a separate pension foundation. Minimum funding requirements differ between plans but where such requirements are based on collective agreements or internal policies the funding requirement is generally that the pension obligations measured using local requirements shall be cov-ered in full or with a predefined surplus. Some pension plans are not covered by funding requirements and are generally unfunded. Quarterly assessments are made to secure the level of future contributions.
Defined benefit plans may impact Nordea via changes in the net present value of obligations and/or changes in the market value of plan assets. Changes in the obligation are most importantly driven by changes in assumptions on discoun t rates (interest rates and credit spreads), salary increases, turnover and mortality as well as relevant experi-ence adjustments where the actual outcome differs from the assumptions. Assets are invested in diversified portfolios as further disclosed below, with bond exposures mitigating the interest rate risk in the obligations and a fair amount of real assets (inflation protected) to reduce the long term inflation-ary risk in liabilities.
No significant plan amendments, curtailments and settle-ments have been made during the year.
IAS 19 pension calculations and assumptionsCalculations on major plans are performed by external liabil-ity calculators and are based on different actuarial assump-tions.
Assumptions1 Swe Nor Fin Den
2015
Discount rate2 3.07% 2.89% 2.14% 2.67%
Salary increase 2.25% 2.75% 1.75% 2.25%
Inflation 1.25% 1.75% 1.25% 1.25%
Mortality DUS06 GAP07/I73 Gompertz FSA
2014
Discount rate2 2.50% 2.50% 2.00% 2.25%
Salary increase 2.50% 3.00% 2.00% 2.50%
Inflation 1.50% 1.75% 1.50% 1.50%
Mortality DUS06 GAP07/I73 Gompertz FSA
1) The assumptions disclosed for 2015 have an impact on the liability calculation by year-end 2015, while the assumptions disclosed for 2014 are used for calculating the pension expense in 2015.
2) More information on the discount rate can be found in Note G1, section 22. The sensitivities to changes in the discount rate can be found below.
Sensitivities – Impact on Defined Benefit Obligation (DBO) % Swe Nor Fin Den
Discount rate – Increase 50bps –7.3% –7.0% –6.8% –4.9%
Discount rate – Decrease 50bps 8.3% 7.8% 7.6% 5.3%
Salary increase – Increase 50bps 2.8% 2.5% 0.4% 5.3%
Salary increase – Decrease 50bps –2.0% –2.3% –0.4% –5.0%
Inflation – Increase 50bps 7.2% 6.5% 4.2% –
Inflation – Decrease 50bps –6.3% –5.9% –3.9% –
Mortality – Increase 1 year 3.2% 3.3% 3.9% 4.8%
Mortality – Decrease 1 year –3.2% –3.2% –3.8% –4.7%
The sensitivity analyses are prepared by changing one actu-arial assumption while keeping the other assumptions unchanged. This is a simplified approach since the actuarial assumptions usually are correlated. However, it gives the possibility to isolate one effect from another. The method used for calculating the impact on the obligation is the same as when calculating the obligation accounted for in the finan-cial statements. Compared with the 2014 Annual Report there have been no changes in the methods used when preparing the sensitivity analyses.
As all pensions in Denmark are salary indexed, the infla-tion has no impact on the DBO in Denmark.
G31 Retirement benefit obligations

Nordea Group – Notes to the balance sheet
Nordea Annual Report 2015118
G31 Retirement benefit obligations, cont.
Net retirement benefit liabilities/assets
EURmSwe
2015Nor
2015Fin
2015Den
2015Total 2015
Total 2014
Obligations 1,421 843 907 100 3,271 3,727
Plan assets 1,554 644 992 129 3,319 3,229
Net liability( –)/asset(+) 133 –199 85 29 48 –498
– of which retirement benefit liabilities 123 199 5 2 329 540
– of which retirement benefit assets 256 – 90 31 377 42
Movements in the obligation
2015, EURm
Swe
Nor Fin Den Total
Opening balance 1,663 968 985 111 3,727
Current service cost 29 20 3 0 52
Interest cost 40 24 21 2 87
Pensions paid –73 –29 –42 –5 –149
Past service cost and settlements –18 16 1 – –1
Remeasurement from changes in demographic assumptions – – –31 – –31
Remeasurement from changes in financial assumptions –204 –63 –26 –5 –298
Remeasurement from experience adjustments 7 –23 –12 –3 –31
Translation differences 35 –55 8 0 –12
Change in provision for SWT/SSC1 –58 –15 – – –73
Closing balance 1,421 843 907 100 3,271
– of which relates to the active population 32% 43% 11% – 28%
1) Change in provision for special wage tax (SWT) and social security contribution (SSC) in Sweden and Norway.
2014, EURm
Swe
Nor Fin Den Total
Opening balance 1,368 829 818 115 3,130
Current service cost 23 17 3 0 43
Interest cost 50 31 29 4 114
Pensions paid –68 –32 –43 –9 –152
Past service cost and settlements 22 25 0 –15 32
Remeasurement from changes in demographic assumptions – – – 1 1
Remeasurement from changes in financial assumptions 300 165 181 14 660
Remeasurement from experience adjustments 15 –9 –10 1 –3
Translation differences –91 –81 7 0 –165
Change in provision for SWT/SSC1 44 23 – – 67
Closing balance 1,663 968 985 111 3,727
– of which relates to the active population 34% 47% 10% – 30%
1) Change in provision for special wage tax (SWT) and social security contribution (SSC) in Sweden and Norway.
The average duration of the obligation is 15 (16) years in Sweden, 15 (15) years in Norway, 14 (14) years in Finland and 10 (10) years in Denmark based on discounted cash flows. The fact that all DBPs are closed for new entrants and that there are no active members in Denmark, and to some extent also in Finland, leads to lower duration.

Notes to the balance sheet – Nordea Group
Nordea Annual Report 2015 119
G31 Retirement benefit obligations, cont.
Asset compositionThe combined return on assets in 2015 was 4.2% (10.3%). The assets return was driven by positive return on equities and real estate with only limited contribution from bonds and credit investments. At the end of the year the equity exposure in Nordea’s pension funds/foundations represented 27% (26%) of total assets.
Asset composition in funded schemesSwe
2015Nor
2015Fin
2015Den
2015Total 2015
Total 2014
Bonds 70% 56% 55% 81% 63% 66%
– sovereign 35% 41% 38% 46% 38% 39%
– covered bonds 25% 11% – 35% 15% 18%
– corporate bonds 10% 4% 17% – 10% 9%
– with quoted market price in an active market 70% 56% 55% 81% 63% 66%
Equity 27% 27% 28% 17% 27% 26%
– domestic 6% 6% 8% 17% 7% 8%
– european 7% 9% 8% – 8% 7%
– US 8% 7% 7% – 7% 7%
– emerging 5% 5% 5% – 5% 4%
– Nordea shares 1% – – – – 0%
– with quoted market price in an active market 27% 27% 28% 17% 27% 26%
Real estate1 – 12% 10% – 6% 5%
– occupied by Nordea – – 3% – 1% 1%
Cash and cash equivalents 3% 5% 7% 2% 4% 3%
1) The geographical location of the real estate follows the geographical location of the relevant pension plan.
The Group expects to contribute EUR 36m to its defined benefit plans in 2016.
Movements in the fair value of plan assets
2015, EURm Swe Nor Fin Den Total
Opening balance 1,497 636 972 124 3,229
Interest income (calculated using the discount rate) 37 17 20 2 76
Pensions paid – –17 –42 –7 –66
Settlements –16 – 2 – –14
Contributions by employer 0 26 –1 6 31
Remeasurement (actual return less interest income) 2 22 33 2 59
Translation differences 34 –40 8 2 4
Closing balance 1,554 644 992 129 3,319
2014, EURm Swe Nor Fin Den Total
Opening balance 1,412 650 927 128 3,117
Interest income (calculated using the discount rate) 52 26 32 5 115
Pensions paid – –17 –43 –7 –67
Settlements – 8 – –13 –5
Contributions by employer 0 5 7 2 14
Refund to employer – – –21 – –21
Remeasurement (actual return less interest income) 118 18 62 9 207
Translation differences –85 –54 8 0 –131
Closing balance 1,497 636 972 124 3,229

Nordea Group – Notes to the balance sheet
Nordea Annual Report 2015120
G31 Retirement benefit obligations, cont.
Recognised in other comprehensive income
2015, EURm Swe Nor Fin Den Total
Remeasurement from changes in demographic assumptions – – –31 – –31
Remeasurement from changes in financial assumptions –204 –63 –26 –5 –298
Remeasurement from experience adjustments 7 –23 –12 –3 –31
Remeasurement of plan assets (actual return less interest income) –2 –22 –33 –2 –59
SWT/SSC1 –48 –16 – – –64
Pension cost on defined benefit plans (expense+/income–) –247 –124 –102 –10 –483
1) Cost related to special wage tax (SWT) in Sweden and social security contribution (SSC) in Norway.
2014, EURm Swe Nor Fin Den Total
Remeasurement from changes in demographic assumptions – – – 1 1
Remeasurement from changes in financial assumptions 300 165 181 14 660
Remeasurement from experience adjustments 15 –9 –10 1 –3
Remeasurement of plan assets (actual return less interest income) –118 –18 –62 –9 –207
SWT/SSC1 48 19 – – 67
Pension cost on defined benefit plans (expense+/income–) 245 157 109 7 518
1) Cost related to special wage tax (SWT) in Sweden and social security contribution (SSC) in Norway.
Defined benefit pension costThe total net pension cost related to defined benefit plans recognised in the Group’s income statement (as staff costs) for the year is EUR 90m (EUR 99m). Total pension costs comprise defined benefit pension costs as well as costs related to defined contribution plans (see specification in Note G7).
Recognised in the income statement
2015, EURm Swe Nor Fin Den Total
Current service cost 29 20 3 0 52
Net interest 3 7 1 0 11
Past service cost and settlements1 –2 16 –1 – 13
SWT/SSC2 8 6 – – 14
Pension cost on defined benefit plans (expense+ income–) 38 49 3 0 90
1) The past service cost 2015 mainly regards termination benefits in connection to restructuring activities launched in the fourth quarter.2) Cost related to special wage tax (SWT) in Sweden and social security contribution (SSC) in Norway.
2014, EURm Swe Nor Fin Den Total
Current service cost 23 17 3 0 43
Net interest –2 5 –3 –1 –1
Past service cost and settlements1 22 18 0 –2 38
SWT/SSC2 13 6 – – 19
Pension cost on defined benefit plans (expense+ income–) 56 46 0 –3 99
1) The past service cost 2014 mainly regards termination benefits in connection to the cost efficiency programme launched in the second quarter.2) Cost related to special wage tax (SWT) in Sweden and social security contribution (SSC) in Norway.
Compared with the pension cost 2014, excluding past service cost and related SWT and SSC, the pension cost has increased in 2015 as a consequence of the change of actuarial assumptions at the end of 2014.
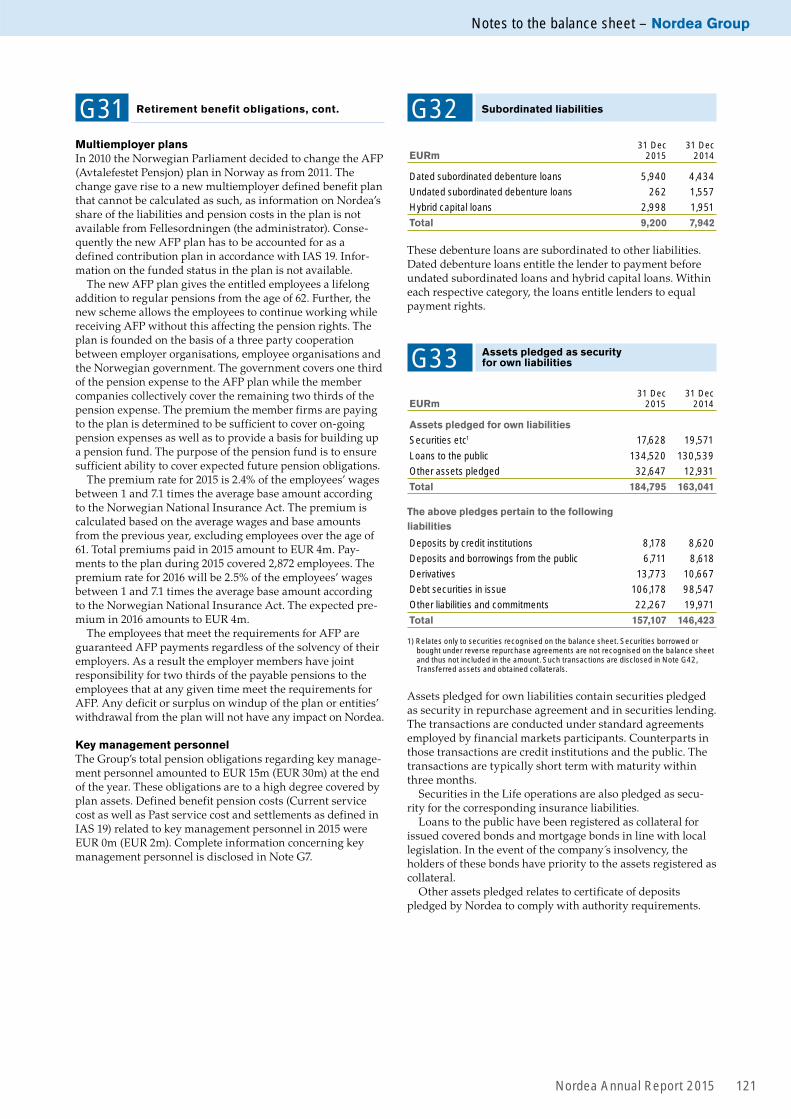
Notes to the balance sheet – Nordea Group
Nordea Annual Report 2015 121
G32 Subordinated liabilities
EURm31 Dec
201531 Dec
2014
Dated subordinated debenture loans 5,940 4,434
Undated subordinated debenture loans 262 1,557
Hybrid capital loans 2,998 1,951
Total 9,200 7,942
These debenture loans are subordinated to other liabilities. Dated debenture loans entitle the lender to payment before undated subordinated loans and hybrid capital loans. Within each respective category, the loans entitle lenders to equal payment rights.
G33 Assets pledged as security for own liabilities
EURm31 Dec
201531 Dec
2014
Assets pledged for own liabilities
Securities etc1 17,628 19,571
Loans to the public 134,520 130,539
Other assets pledged 32,647 12,931
Total 184,795 163,041
The above pledges pertain to the followingliabilities
Deposits by credit institutions 8,178 8,620
Deposits and borrowings from the public 6,711 8,618
Derivatives 13,773 10,667
Debt securities in issue 106,178 98,547
Other liabilities and commitments 22,267 19,971
Total 157,107 146,423
1) Relates only to securities recognised on the balance sheet. Securities borrowed or bought under reverse repurchase agreements are not recognised on the balance sheet and thus not included in the amount. Such transactions are disclosed in Note G42, Transferred assets and obtained collaterals.
Assets pledged for own liabilities contain securities pledged as security in repurchase agreement and in securities lending. The transactions are conducted under standard agreements employed by financial markets participants. Counterparts in those transactions are credit institutions and the public. The transactions are typically short term with maturity within three months.
Securities in the Life operations are also pledged as secu-rity for the corresponding insurance liabilities.
Loans to the public have been registered as collateral for issued covered bonds and mortgage bonds in line with local legislation. In the event of the company s insolvency, the holders of these bonds have priority to the assets registered as collateral.
Other assets pledged relates to certificate of deposits pledged by Nordea to comply with authority requirements.
G31 Retirement benefit obligations, cont.
Multiemployer plansIn 2010 the Norwegian Parliament decided to change the AFP (Avtalefestet Pensjon) plan in Norway as from 2011. The change gave rise to a new multiemployer defined benefit plan that cannot be calculated as such, as information on Nordea’s share of the liabilities and pension costs in the plan is not available from Fellesordningen (the administrator). Conse-quently the new AFP plan has to be accounted for as a defined contribution plan in accordance with IAS 19. Infor-mation on the funded status in the plan is not available.
The new AFP plan gives the entitled employees a lifelong addition to regular pensions from the age of 62. Further, the new scheme allows the employees to continue working while receiving AFP without this affecting the pension rights. The plan is founded on the basis of a three party cooperation between employer organisations, employee organisations and the Norwegian government. The government covers one third of the pension expense to the AFP plan while the member companies collectively cover the remaining two thirds of the pension expense. The premium the member firms are paying to the plan is determined to be sufficient to cover on-going pension expenses as well as to provide a basis for building up a pension fund. The purpose of the pension fund is to ensure sufficient ability to cover expected future pension obligations.
The premium rate for 2015 is 2.4% of the employees’ wages between 1 and 7.1 times the average base amount according to the Norwegian National Insurance Act. The premium is calculated based on the average wages and base amounts from the previous year, excluding employees over the age of 61. Total premiums paid in 2015 amount to EUR 4m. Pay-ments to the plan during 2015 covered 2,872 employees. The premium rate for 2016 will be 2.5% of the employees’ wages between 1 and 7.1 times the average base amount according to the Norwegian National Insurance Act. The expected pre-mium in 2016 amounts to EUR 4m.
The employees that meet the requirements for AFP are guaranteed AFP payments regardless of the solvency of their employers. As a result the employer members have joint responsibility for two thirds of the payable pensions to the employees that at any given time meet the requirements for AFP. Any deficit or surplus on windup of the plan or entities’ withdrawal from the plan will not have any impact on Nordea.
Key management personnelThe Group’s total pension obligations regarding key manage-ment personnel amounted to EUR 15m (EUR 30m) at the end of the year. These obligations are to a high degree covered by plan assets. Defined benefit pension costs (Current service cost as well as Past service cost and settlements as defined in IAS 19) related to key management personnel in 2015 were EUR 0m (EUR 2m). Complete information concerning key management personnel is disclosed in Note G7.
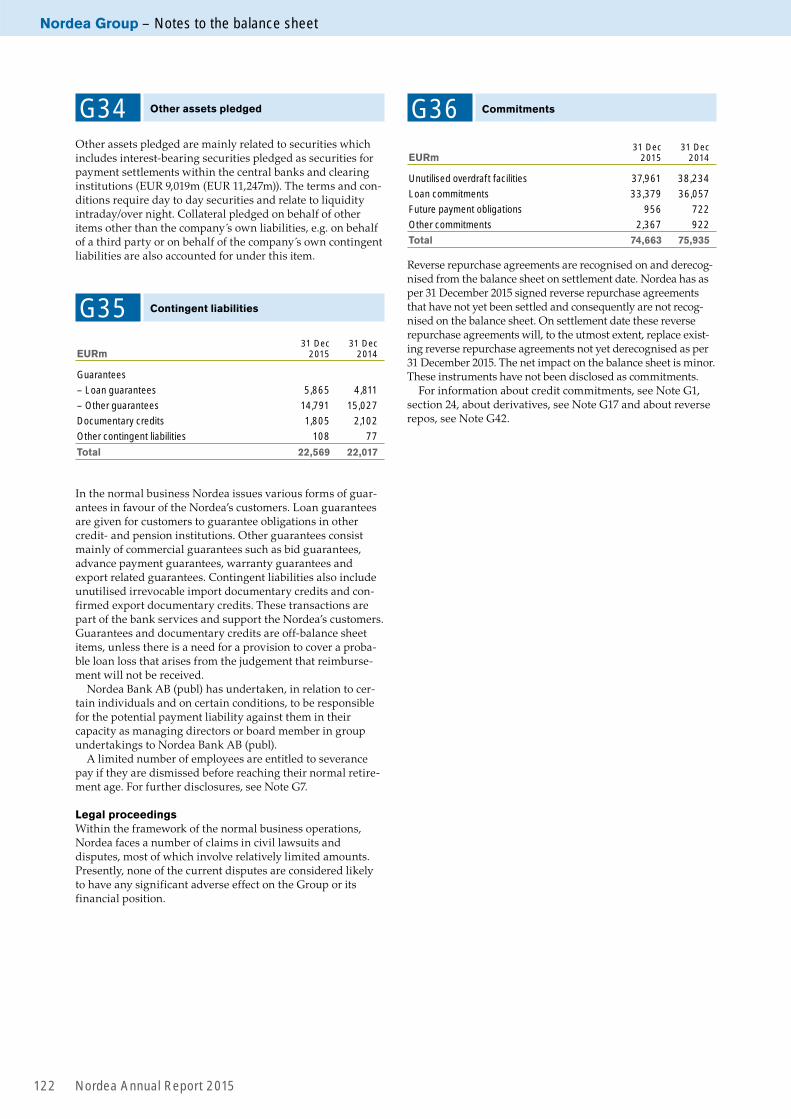
Nordea Group – Notes to the balance sheet
Nordea Annual Report 2015122
G34 Other assets pledged
Other assets pledged are mainly related to securities which includes interest-bearing securities pledged as securities for payment settlements within the central banks and clearing institutions (EUR 9,019m (EUR 11,247m)). The terms and con-ditions require day to day securities and relate to liquidity intraday/over night. Collateral pledged on behalf of other items other than the company s own liabilities, e.g. on behalf of a third party or on behalf of the company s own contingent liabilities are also accounted for under this item.
G35 Contingent liabilities
EURm31 Dec
201531 Dec
2014
Guarantees
– Loan guarantees 5,865 4,811
– Other guarantees 14,791 15,027
Documentary credits 1,805 2,102
Other contingent liabilities 108 77
Total 22,569 22,017
In the normal business Nordea issues various forms of guar-antees in favour of the Nordea’s customers. Loan guarantees are given for customers to guarantee obligations in other credit- and pension institutions. Other guarantees consist mainly of commercial guarantees such as bid guarantees, advance payment guarantees, warranty guarantees and export related guarantees. Contingent liabilities also include unutilised irrevocable import documentary credits and con-firmed export documentary credits. These transactions are part of the bank services and support the Nordea’s customers. Guarantees and documentary credits are off-balance sheet items, unless there is a need for a provision to cover a proba-ble loan loss that arises from the judgement that reimburse-ment will not be received.
Nordea Bank AB (publ) has undertaken, in relation to cer-tain individuals and on certain conditions, to be responsible for the potential payment liability against them in their capacity as managing directors or board member in group undertakings to Nordea Bank AB (publ).
A limited number of employees are entitled to severance pay if they are dismissed before reaching their normal retire-ment age. For further disclosures, see Note G7.
Legal proceedingsWithin the framework of the normal business operations, Nordea faces a number of claims in civil lawsuits and disputes, most of which involve relatively limited amounts. Presently, none of the current disputes are considered likely to have any significant adverse effect on the Group or its financial position.
G36 Commitments
EURm31 Dec
201531 Dec
2014
Unutilised overdraft facilities 37,961 38,234
Loan commitments 33,379 36,057
Future payment obligations 956 722
Other commitments 2,367 922
Total 74,663 75,935
Reverse repurchase agreements are recognised on and derecog-nised from the balance sheet on settlement date. Nordea has as per 31 December 2015 signed reverse repurchase agreements that have not yet been settled and consequently are not recog-nised on the balance sheet. On settlement date these reverse repurchase agreements will, to the utmost extent, replace exist-ing reverse repurchase agreements not yet derecognised as per 31 December 2015. The net impact on the balance sheet is minor. These instruments have not been disclosed as commitments.
For information about credit commitments, see Note G1, section 24, about derivatives, see Note G17 and about reverse repos, see Note G42.

Other notes – Nordea Group
Nordea Annual Report 2015 123
G37 Capital adequacy
Capital adequacy is a measure of the financial strength of a bank, usually expressed as a ratio of capital to assets. There is a worldwide capital adequacy standard (Basel III) drawn up by the Basel Committee on Banking Supervision. Within the EU, the capital adequacy requirements are outlined in the Capital Requirements Directive IV (CRD IV) and Capital Requirements Regulation (CRR).
CRD IV/CRR require higher capitalisation levels and better quality of capital, better risk coverage, the introduction of a lev-erage ratio as a backstop to the risk based requirement, meas-ures to promote the build-up of capital that can be drawn in periods of stress and the introduction of liquidity standards. CRD IV was implemented through national law within all EU countries during 2014, while the CRR entered into force in all EU countries on the first of January 2014.
The Basel III framework is built on three Pillars:• Pillar I – requirements for the calculation of REA and Capital • Pillar II – rules for the Supervisory Review Evaluation
Process (SREP) including the Internal Capital Adequacy Assessment Process (ICAAP)
• Pillar III – rules for the disclosure on risk and capital management, including capital adequacy
Nordea performs an ICAAP with the purpose to review the management, mitigation and measurement of material risks within the business environment in order to assess the ade-quacy of capitalisation and to determine an internal capital requirements reflecting the risks of the institution.
The ICAAP is a continuous process which increases aware-ness of capital requirements and exposure to material risks throughout the organisation, both in the business area and legal entity dimensions. Stress tests are important drivers of risk awareness, looking at capital and risk from a firm-wide perspective on a regular basis and on an ad-hoc basis for spe-cific areas or segments. The process includes a regular dia-logue with supervisory authorities, rating agencies and other external stakeholders with respect to capital management, measurement and mitigation techniques used.
Nordea’s capital levels continue to be adequate to support the risks taken, both from an internal perspective as well as from the perspective of supervisors. Heading into 2016, Nordea will continue to closely follow the development of the new capital requirement regime as well as maintain its open dialogue with the supervisory authorities.
The disclosures in this note cover the Nordea Group as defined on page 134.
Own fundsOwn funds is the sum of Tier 1 and Tier 2 capital. Tier 1 capital consists of both common equity Tier 1 (CET1) and additional Tier 1 capital.
Tier 1 capitalTier 1 capital is the sum of common equity tier 1 capital and additional Tier 1 capital. CET1 capital is considered to be capital of the highest quality with ultimate loss-absorb-ing characteristics and consists predominately of paid in capital and retained earnings. Profit may only be included
after permission from the financial supervisory authority and after deduction of proposed dividend. Due to the implementation of CRR, deduction that according to pre-vious rules were made 50 % from Tier 1 and 50 % from tier 2 are now fully deducted from common equity tier 1. Furthermore, CRR also changes the treatment of invest-ments in financial sector entities and deferred tax assets that rely on future profitability and arise from temporary differences, which are now risk weighted instead of deducted from Tier 1 and Tier 2.
Additional Tier 1 capital items consist of additional Tier 1 instruments and the related share premium. Additional Tier 1 instruments Additional Tier 1 instruments are subordinated capital instru-ments that rank senior only to share capital. CRR specifies the necessary characteristics required for inclusion in additional Tier 1 capital. The instruments are loss-absorbing from a going concern perspective as coupons can be cancelled at any time at the full discretion of the issuer and the principal will be writ-ten down if the Common Equity Tier 1 capital ratio would fall below a pre-defined trigger level. The instruments may only be repaid with the permission from the Swedish FSA and not ear-lier than five years after original issuance of the instrument. Additional Tier 1 instruments that fulfil the CRR requirements are fully included whereas remaining instruments are phased out according to transitional rules. During 2015, Nordea issued one Additional Tier 1 instrument of EUR 0.9bn and two undated Additional Tier 1 loans were called after approval by the Swed-ish FSA. As of year-end, Nordea held EUR 2.8bn in undated subordinated instruments.
Tier 2 capitalTier 2 capital must be subordinated to depositors and general creditors of the bank. It cannot be secured or covered by a guarantee of the issuer or related entity or include any other arrangement that legally or economically enhances the senior-ity of the claim vis-a -vis depositors and other bank creditors.
Tier 2 instrumentsTier 2 instruments are subordinated instruments. The basic principle for subordinated instruments in own funds is the order of priority in case of a default or bankruptcy situation.Under such conditions, the holder of the subordinated instru-ment would be repaid after other creditors, but before share-holders. Tier 2 instruments can be dated or undated instru-ments. According to the regulation, Tier 2 instruments that fulfil the CRD IV requirements are fully included whereas remaining instruments are phased out according to transi-tional rules.
The inclusion of outstanding Tier 2 instruments in the Tier 2 capital is reduced if the remaining maturity is less than five years. During 2015, Nordea issued four Tier 2 instrument of in total EUR 1.3bn. As of year-end, Nordea held EUR 5.8bn in dated subordinated instruments and EUR 0.2bn in undated subordinated instruments.
The tables below shows the main features of outstanding Common Equity Tier 1, Additional Tier 1 and Tier 2 instru-ments.

Nordea Group – Other notes
Nordea Annual Report 2015124
G37 Capital adequacy, cont.
Table A2 Transitional own funds
Common Equity Tier 1 capital: instruments and reserves
(A) amount at disclosure date,
EURm
(C) amounts subject to pre- regulation (eu)
no 575/2013 treatment or prescribed residual
amount of regulation (eu) no 575/2013
1 Capital instruments and the related share premium accounts 5,130 —
of which: Share capital 4,050 —
2 Retained earnings 21,589 —
3 Accumulated other comprehensive income (and other reserves, to include unrealised gains and losses under the applicable accounting standards) –64 —
5 Minority interests (amount allowed in consolidated CET1) 0 0
5a Independently reviewed interim profi ts net of any foreseeable charge or dividend 727 —
6 Common Equity Tier 1 (CET1) capital before regulatory adjustments 27,382 —
Common Equity Tier 1 (CET1) capital: regulatory adjustments
7 Additional value adjustments (negative amount) –258 —
8 Intangible assets (net of related tax liability) (negative amount) –2,866 —
10 Deferred tax assets that rely on future profi tability excluding those arising from temporary differences (net of related tax liability where conditions in Article 38 (3) are met) (negative amount) 0 —
11 Fair value reserves related to gains or losses on cash fl ow hedges –71 —
12 Negative amounts resulting from the calculation of expected loss amounts –297 0
14 Gains or losses on liabilities valued at fair value resulting from changes in own credit standing –12 —
15 Defi ned-benefi t pension fund assets (negative amount) –296 0
16 Direct and indirect holdings by an institution of own CET1 instruments (negative amount) –7 —
25 of which: deferred tax assets arising from temporary differences 0 —
25bForeseeable tax charges relating to CET1 items (negative amount) 0 —
26a Regulatory adjustments relating to unrealised gains and losses pursuant to Articles 467 and 468 0 —
Of which: … fi lter for unrealised loss 1 0 68
Of which: … fi lter for unrealised gain 1 0 283
28 Total regulatory adjustments to Common equity Tier 1 (CET1) –3,807 —
29 Common Equity Tier 1 (CET1) capital 23,575 —
Additional Tier 1 (AT1) capital: instruments
30 Capital instruments and the related share premium accounts 2,241 —
33 Amount of qualifying items referred to in Article 484 (4) and the related share premium accounts subject to phase out from AT1 729 0
36 Additional Tier 1 (AT1) capital before regulatory adjustments 2,970 —
Additional Tier 1 (AT1) capital: regulatory adjustments
37 Direct and indirect holdings by an institution of own AT1 Instruments (negative amount) –30 —
41a Residual amounts deducted from Additional Tier 1 capital with regard to deduction from Com-mon Equity Tier 1 capital during the transitional period pursuant to article 472 of Regulation (EU) No 575/2013 0 0
43 Total regulatory adjustments to Additional Tier 1 (AT1) capital –30 —
44 Additional Tier 1 (AT1) capital 2,941 —
45 Tier 1 capital (T1 = CET1 + AT1) 26,516 —
Tier 2 (T2) capital: instruments and provisions
46 Capital instruments and the related share premium accounts 5,870 —
47 Amount of qualifying items referred to in Article 484 (5) and the related share premium accounts subject to phase out from T2 76 —
48 Qualifying own funds instruments included in consolidated T2 capital (including minority inter-ests and AT1 instruments not included in rows 5 or 34) issued by subsidiaries and held by third parties 0 0
49 of which: instruments issued by subsidiaries subject to phase out 0 —
51 Tier 2 (T2) capital before regulatory adjustments 5,946 —
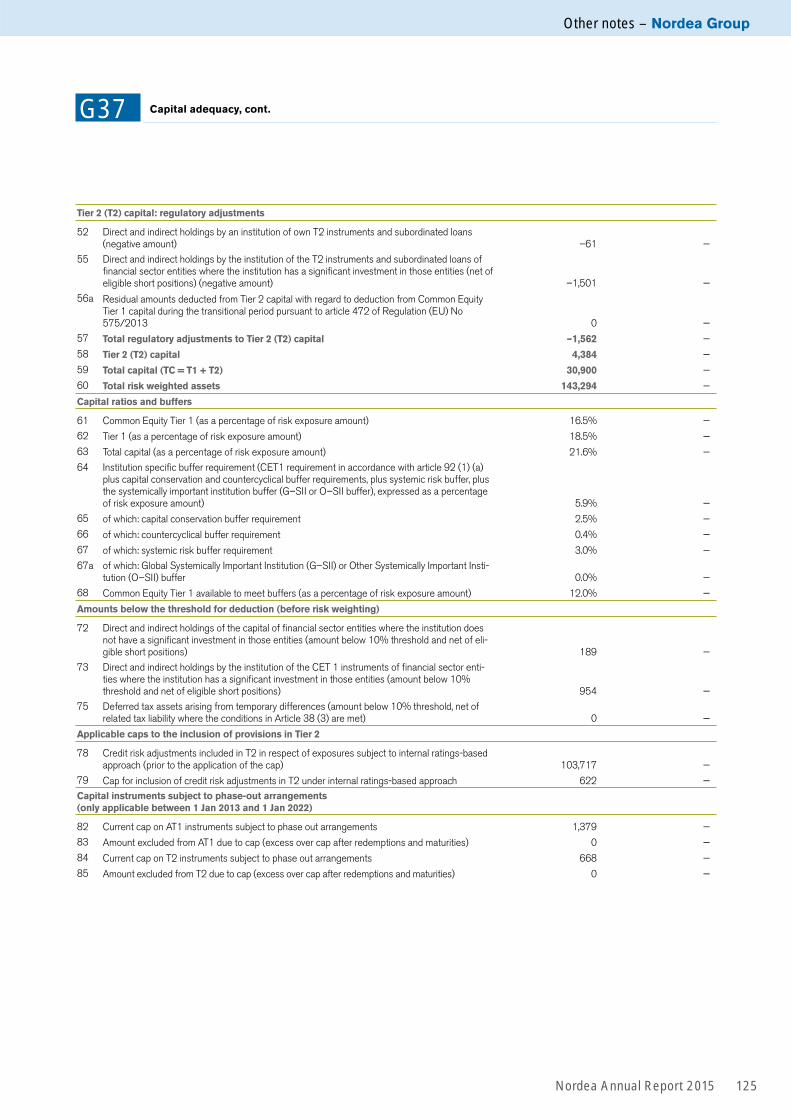
Other notes – Nordea Group
Nordea Annual Report 2015 125
G37 Capital adequacy, cont.
Tier 2 (T2) capital: regulatory adjustments
52 Direct and indirect holdings by an institution of own T2 instruments and subordinated loans (negative amount) –61 —
55 Direct and indirect holdings by the institution of the T2 instruments and subordinated loans of fi nancial sector entities where the institution has a signifi cant investment in those entities (net of eligible short positions) (negative amount) –1,501 —
56a Residual amounts deducted from Tier 2 capital with regard to deduction from Common Equity Tier 1 capital during the transitional period pursuant to article 472 of Regulation (EU) No 575/2013 0 —
57 Total regulatory adjustments to Tier 2 (T2) capital –1,562 —
58 Tier 2 (T2) capital 4,384 —
59 Total capital (TC = T1 + T2) 30,900 —
60 Total risk weighted assets 143,294 —
Capital ratios and buffers
61 Common Equity Tier 1 (as a percentage of risk exposure amount) 16.5% —
62 Tier 1 (as a percentage of risk exposure amount) 18.5% —
63 Total capital (as a percentage of risk exposure amount) 21.6% —
64 Institution specifi c buffer requirement (CET1 requirement in accordance with article 92 (1) (a) plus capital conservation and countercyclical buffer requirements, plus systemic risk buffer, plus the systemically important institution buffer (G–SII or O–SII buffer), expressed as a percentage of risk exposure amount) 5.9% —
65 of which: capital conservation buffer requirement 2.5% —
66 of which: countercyclical buffer requirement 0.4% —
67 of which: systemic risk buffer requirement 3.0% —
67a of which: Global Systemically Important Institution (G–SII) or Other Systemically Important Insti-tution (O–SII) buffer 0.0% —
68 Common Equity Tier 1 available to meet buffers (as a percentage of risk exposure amount) 12.0% —
Amounts below the threshold for deduction (before risk weighting)
72 Direct and indirect holdings of the capital of fi nancial sector entities where the institution does not have a signifi cant investment in those entities (amount below 10% threshold and net of eli-gible short positions) 189 —
73 Direct and indirect holdings by the institution of the CET 1 instruments of fi nancial sector enti-ties where the institution has a signifi cant investment in those entities (amount below 10% threshold and net of eligible short positions) 954 —
75 Deferred tax assets arising from temporary differences (amount below 10% threshold, net of related tax liability where the conditions in Article 38 (3) are met) 0 —
Applicable caps to the inclusion of provisions in Tier 2
78 Credit risk adjustments included in T2 in respect of exposures subject to internal ratings-based approach (prior to the application of the cap) 103,717 —
79 Cap for inclusion of credit risk adjustments in T2 under internal ratings-based approach 622 —
Capital instruments subject to phase-out arrangements (only applicable between 1 Jan 2013 and 1 Jan 2022)
82 Current cap on AT1 instruments subject to phase out arrangements 1,379 —
83 Amount excluded from AT1 due to cap (excess over cap after redemptions and maturities) 0 —
84 Current cap on T2 instruments subject to phase out arrangements 668 —
85 Amount excluded from T2 due to cap (excess over cap after redemptions and maturities) 0 —

Nordea Group – Other notes
Nordea Annual Report 2015126
Minimum capital requirement and REA31 Dec 2015 31 Dec 2014
EURm
Minimum Capital
requirement REA
Minimum Capital
requirement REA
Credit risk 9,358 116,978 9,522 119,029
– of which counterparty credit risk 761 9,510 843 10,535
IRB 8,297 103,717 8,451 105,637
- corporate 5,630 70,371 5,743 71,792
- advanced 4,497 56,211 4,048 50,600
- foundation 1,133 14,160 1,695 21,192
- institutions 682 8,526 766 9,572
- retail 1,802 22,520 1,755 21,940
- secured by immovable property collateral 1,016 12,702 897 11,219
- other retail 786 9,818 858 10 ,721
- other 183 2,300 187 2,333
Standardised 1,061 13,261 1,071 13,392
- central governments or central banks 40 504 57 717
- regional governments or local authorities 19 237 17 211
- public sector entities 3 32 2 20
- multilateral development banks 0 0 — —
- international organisations — — — —
- institutions 23 282 27 338
- corporate 169 2,109 154 1,921
- retail 251 3,137 255 3,181
- secured by mortgages on immovable properties 231 2,887 222 2,777
- in default 9 119 12 155
- associated with particularly high risk 59 741 53 666
- covered bonds — — — —
- institutions and corporates with a short-term credit assessment — — — —
- collective investments undertakings (CIU) — — — —
- equity 209 2,617 195 2,442
- other items 48 596 77 964
Credit Value Adjustment Risk 140 1,751 185 2,308
Market risk 522 6,534 588 7,341
- trading book, Internal Approach 239 2,990 312 3,898
- trading book, Standardised Approach1 96 1,209 116 1,447
- banking book, Standardised Approach 187 2,335 160 1,996
Operational risk 1,363 17,031 1,347 16,842
Standardised 1,363 17,031 1,347 16,842
Additional risk exposure amount, Article 3 CRR 80 1,000 — —
Sub total 11,463 143,294 11,642 145,520
Adjustment for Basel I fl oor
Additional capital requirement according to Basel I fl oor 6,283 78,533 5,995 74,938
Total 17,746 221,827 17,637 220,458
1) Market Risk – of which trading book, Standardised Approach restated for 2014.
Leverage ratio
31 Dec 2015 31 Dec 2014
Tier 1 capital, transitional defi nition, EURm1 26,516 25,382
Leverage ratio exposure, EURm 576,317 590,759
Leverage ratio, percentage 4.6 4.3
1) Including profi t for the period.
G37 Capital adequacy, cont.

Other notes – Nordea Group
Nordea Annual Report 2015 127
Capital requirements for market riskTrading book, IA Trading book, SA Banking book, SA Total
EURm REACapital
requirement REACapital
requirement REACapital
requirement REACapital
requirement
Interest rate risk & other1 1,193 96 966 77 — — 2,159 173
Equity risk 353 28 220 17 — — 573 45
Foreign exchange risk 209 17 — — 2,335 187 2,544 204
Commodity risk — — 22 2 — — 22 2
Settlement risk — — 1 0 — — 1 0
Diversifi cation effect –644 –52 — — — — –644 –52
Stressed Value-at-Risk 1,046 84 — — — — 1,046 84
Incremental Risk Measure 381 30 — — — — 381 30
Comprehensive Risk Measure 452 36 — — — — 452 36
Total 2,990 239 1,209 96 2,335 187 6,534 522
1) Interest rate risk column Trading book IA includes both general and specifi c interest rate risk which is elsewhere referred to as interest rate VaR and credit spread VaR.
G37 Capital adequacy, cont.
Table A3 – Capital main features template – CET1
Common equity Tier 1 capital
1 Issuer Nordea Bank AB (publ)
2 Unique identifi er (eg CUSIP, ISIN or Bloomberg identifi er for private placement) SE0000427361
3 Governing law(s) of the instrument Swedish
Regulatory treatment
4 Transitional CRR rules Common Equity Tier 1
5 Post-transitional CRR rules Common Equity Tier 1
6 Eligible at solo/(sub-)consolidated/solo & (sub-)consolidated Solo & consolidated
7 Instrument type (types to be specifi ed by each jurisdiction) Share capitalas published in Regulation (EU) No 575/2013 article 28
8 Amount recognised in regulatory capital (currency in million, as of most recent reporting date) EUR 4,050m
9 Nominal amount of instrument EUR 4,049,951,919
10 Accounting classifi cation Shareholders’ equity
12 Perpetual or dated Perpetual
13 Original maturity date No maturity
14 Issuer call subject to prior supervisory approval No
Coupons / dividends
20a Fully discretionary, partially discretionary or mandatory (in terms of timing) Fully discretionary
20b Fully discretionary, partially discretionary or mandatory (in terms of amount) Fully discretionary
35 Position in subordination hierarchy in liquidation (specify instrument type immediately senior to instrument)
Additional Tier 1
36 Non-compliant transitioned features No
Nordea may transfer capital within its legal entities without material restrictions, subject to the general conditions for entities considered solvent with sufficient liquidity under local law and satisfying minimum capital adequacy require-ments. International transfers of capital between legal enti-ties are normally possible after approval by the local regula-tor and are of importance in governing the capital position of Nordea’s entities. Such approval has to be applied and
authorised by the local FSA for internal subordinated loans as prescribed by Article 77 in the CRR.
Table A3–A5 include disclosure of capital instruments’ main features in accordance with §6.4 in FFFS 2014:18 and using the template in Annex II in article 3 in Commission imple-menting regulation (EU) No 1423/2013. Template items are excluded if not applicable.
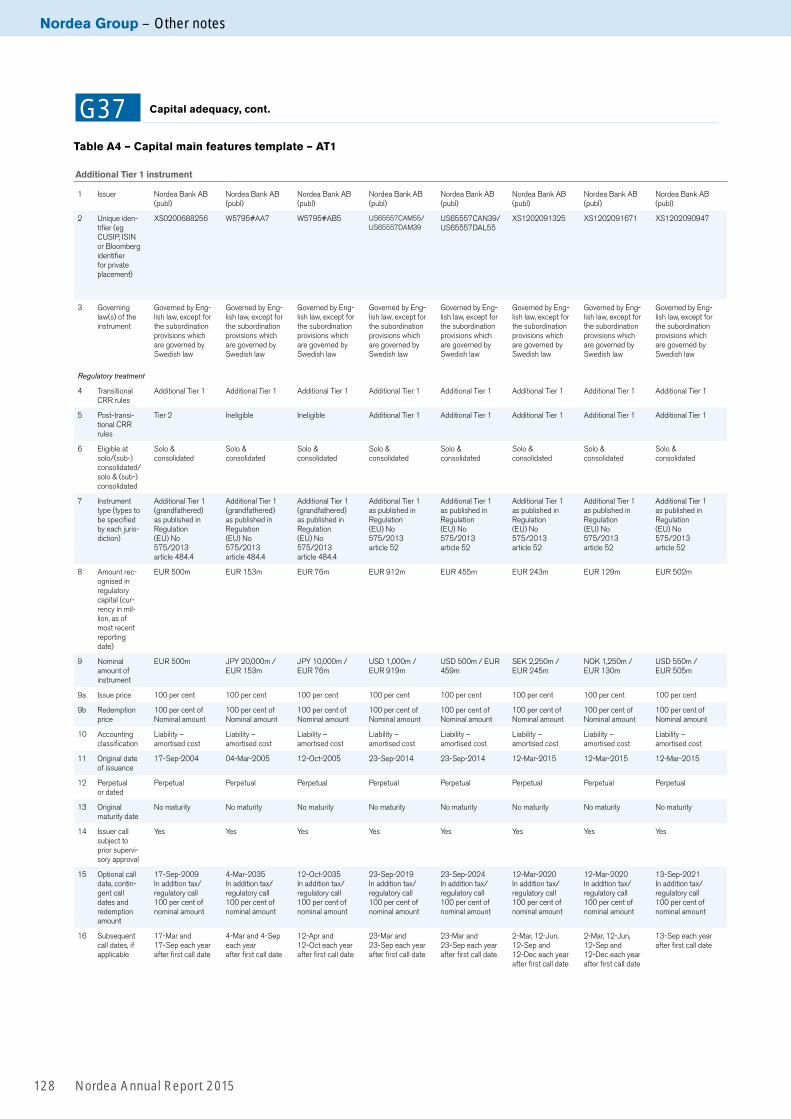
Nordea Group – Other notes
Nordea Annual Report 2015128
G37 Capital adequacy, cont.
Table A4 – Capital main features template – AT1
Additional Tier 1 instrument
1 Issuer Nordea Bank AB (publ)
Nordea Bank AB (publ)
Nordea Bank AB (publ)
Nordea Bank AB (publ)
Nordea Bank AB (publ)
Nordea Bank AB (publ)
Nordea Bank AB (publ)
Nordea Bank AB (publ)
2 Unique iden-tifi er (eg CUSIP, ISIN or Bloomberg identifi er for private placement)
XS0200688256 W5795#AA7 W5795#AB5 US65557CAM55/
US65557DAM39
US65557CAN39/US65557DAL55
XS1202091325 XS1202091671 XS1202090947
3 Governing law(s) of the instrument
Governed by Eng-lish law, except for the subordination provisions which are governed by Swedish law
Governed by Eng-lish law, except for the subordination provisions which are governed by Swedish law
Governed by Eng-lish law, except for the subordination provisions which are governed by Swedish law
Governed by Eng-lish law, except for the subordination provisions which are governed by Swedish law
Governed by Eng-lish law, except for the subordination provisions which are governed by Swedish law
Governed by Eng-lish law, except for the subordination provisions which are governed by Swedish law
Governed by Eng-lish law, except for the subordination provisions which are governed by Swedish law
Governed by Eng-lish law, except for the subordination provisions which are governed by Swedish law
Regulatory treatment
4 Transitional CRR rules
Additional Tier 1 Additional Tier 1 Additional Tier 1 Additional Tier 1 Additional Tier 1 Additional Tier 1 Additional Tier 1 Additional Tier 1
5 Post-transi-tional CRR rules
Tier 2 Ineligible Ineligible Additional Tier 1 Additional Tier 1 Additional Tier 1 Additional Tier 1 Additional Tier 1
6 Eligible at solo/(sub-)consolidated/solo & (sub-)consolidated
Solo & consolidated
Solo & consolidated
Solo & consolidated
Solo & consolidated
Solo & consolidated
Solo & consolidated
Solo & consolidated
Solo & consolidated
7 Instrument type (types to be specifi ed by each juris-diction)
Additional Tier 1 (grandfathered) as published in Regulation (EU) No 575/2013 article 484.4
Additional Tier 1 (grandfathered) as published in Regulation (EU) No 575/2013 article 484.4
Additional Tier 1 (grandfathered) as published in Regulation (EU) No 575/2013 article 484.4
Additional Tier 1as published in Regulation (EU) No 575/2013 article 52
Additional Tier 1as published in Regulation (EU) No 575/2013 article 52
Additional Tier 1as published in Regulation (EU) No 575/2013 article 52
Additional Tier 1as published in Regulation (EU) No 575/2013 article 52
Additional Tier 1as published in Regulation (EU) No 575/2013 article 52
8 Amount rec-ognised in regulatory capital (cur-rency in mil-lion, as of most recent reporting date)
EUR 500m EUR 153m EUR 76m EUR 912m EUR 455m EUR 243m EUR 129m EUR 502m
9 Nominal amount of instrument
EUR 500m JPY 20,000m / EUR 153m
JPY 10,000m / EUR 76m
USD 1,000m / EUR 919m
USD 500m / EUR 459m
SEK 2,250m / EUR 245m
NOK 1,250m / EUR 130m
USD 550m / EUR 505m
9a Issue price 100 per cent 100 per cent 100 per cent 100 per cent 100 per cent 100 per cent 100 per cent 100 per cent
9b Redemption price
100 per cent of Nominal amount
100 per cent of Nominal amount
100 per cent of Nominal amount
100 per cent of Nominal amount
100 per cent of Nominal amount
100 per cent of Nominal amount
100 per cent of Nominal amount
100 per cent of Nominal amount
10 Accounting classifi cation
Liability – amortised cost
Liability – amortised cost
Liability – amortised cost
Liability – amortised cost
Liability – amortised cost
Liability – amortised cost
Liability – amortised cost
Liability – amortised cost
11 Original date of issuance
17-Sep-2004 04-Mar-2005 12-Oct-2005 23-Sep-2014 23-Sep-2014 12-Mar-2015 12-Mar-2015 12-Mar-2015
12 Perpetual or dated
Perpetual Perpetual Perpetual Perpetual Perpetual Perpetual Perpetual Perpetual
13 Original maturity date
No maturity No maturity No maturity No maturity No maturity No maturity No maturity No maturity
14 Issuer call subject to prior supervi-sory approval
Yes Yes Yes Yes Yes Yes Yes Yes
15 Optional call date, contin-gent call dates and redemption amount
17-Sep-2009In addition tax/regulatory call100 per cent of nominal amount
4-Mar-2035In addition tax/regulatory call100 per cent of nominal amount
12-Oct-2035In addition tax/regulatory call100 per cent of nominal amount
23-Sep-2019In addition tax/regulatory call100 per cent of nominal amount
23-Sep-2024In addition tax/regulatory call100 per cent of nominal amount
12-Mar-2020In addition tax/regulatory call100 per cent of nominal amount
12-Mar-2020In addition tax/regulatory call100 per cent of nominal amount
13-Sep-2021In addition tax/regulatory call100 per cent of nominal amount
16 Subsequent call dates, if applicable
17-Mar and 17-Sep each year after fi rst call date
4-Mar and 4-Sep each year after fi rst call date
12-Apr and 12-Oct each year after fi rst call date
23-Mar and 23-Sep each year after fi rst call date
23-Mar and 23-Sep each year after fi rst call date
2-Mar, 12-Jun, 12-Sep and 12-Dec each year after fi rst call date
2-Mar, 12-Jun, 12-Sep and 12-Dec each year after fi rst call date
13-Sep each year after fi rst call date

Other notes – Nordea Group
Nordea Annual Report 2015 129
G37 Capital adequacy, cont.
Additional Tier 1 instrument
Coupons/dividends
17 Fixed or fl oat-ing dividend / coupon
Floating Fixed to fl oating Fixed to fl oating Fixed Fixed Floating Floating Fixed
18 Coupon rate and any relat-ed index
Floating 10-year CMS +0.05 per cent per annum subject to 8 per cent cap
Fixed USD 3.75 per cent per annum, until fi rst call date, thereaf-ter fl oating 6-month JPY deposit +1.22 per cent per annum
Fixed USD 3.84 per cent per annum, until fi rst call date, thereaf-ter fl oating 6-month JPY deposit +1.40 per cent per annum
Fixed 5.50 per cent per annum, until fi rst call date, thereafter fi xed 5-year mid swap +3.563 per cent per annum
Fixed 6.125 per cent per annum, until fi rst call date, thereafter fi xed 5-year mid swap +3.388 per cent per annum
Floating 3-month STIBOR +3.10 per cent per annum
Floating 3-month NIBOR +3.10 per cent per annum
Fixed 5.25 per cent per annum, until fi rst call date, thereafter fi xed 5-year mid swap +3.244 per cent per annum
19 Existence of a dividend stopper
Yes Yes Yes No No No No No
20a Fully discre-tionary, par-tially discre-tionary or mandatory (in terms of tim-ing)
Partially discretionaryDividend stopper
Partially discretionaryDividend stopper
Partially discretionaryDividend stopper
Fully discretionary Fully discretionary Fully discretionary Fully discretionary Fully discretionary
20b Fully discre-tionary, par-tially discre-tionary or mandatory (in terms of amount)
Partially discre-tionary
Partially discretionary
Partially discretionary
Fully discretionary Fully discretionary Fully discretionary Fully discretionary Fully discretionary
21 Existence of step up or other incen-tive to redeem
No Yes Yes No No No No No
22 Noncumula-tive or cumu-lative
Non-cumulative Non-cumulative Non-cumulative Non-cumulative Non-cumulative Non-cumulative Non-cumulative Non-cumulative
23 Convertible or non-converti-ble
Non-convertible Non-convertible Non-convertible Non-convertible Non-convertible Non-convertible Non-convertible Non-convertible
30 Write-down features
Yes Yes Yes Yes Yes Yes Yes Yes
31 If write-down, write-down trigger(s)
To avoid liquidation To avoid liquidation To avoid liquidation Group CET1 ratio 8 per centIssuer CET1 ratio 5.125 per cent
Group CET1 ratio 8 per centIssuer CET1 ratio 5.125 per cent
Group CET1 ratio 8 per centIssuer CET1 ratio 5.125 per cent
Group CET1 ratio 8 per centIssuer CET1 ratio 5.125 per cent
Group CET1 ratio 8 per centIssuer CET1 ratio 5.125 per cent
32 If write-down, full or partial
Fully or Partially Fully or Partially Fully or Partially Fully or Partially Fully or Partially Fully or Partially Fully or Partially Fully or Partially
33 If write-down, permanent or temporary
Temporary Temporary Temporary Temporary Temporary Temporary Temporary Temporary
34 If temporary write-down, description of write-up mechanism
Shareholders reso-lution regarding reconversion and reinstatement made out of availa-ble distributable funds
Shareholders reso-lution regarding reconversion and reinstatement, made out of availa-ble distribution funds
Shareholders reso-lution regarding reconversion and reinstatement, made out of availa-ble distribution funds
Fully discretionary, if a positive net profi t of both Issuer and Group
Fully discretionary, if a positive net profi t of both Issuer and Group
Fully discretionary, if a positive net profi t of both Issuer and Group
Fully discretionary, if a positive net profi t of both Issuer and Group
Fully discretionary, if a positive net profi t of both Issuer and Group
35 Position in subordination hierarchy in liquidation (specify instrument type immedi-ately senior to instrument)
Tier 2 Tier 2 Tier 2 Tier 2 Tier 2 Tier 2 Tier 2 Tier 2
36 Non-com-pliant tran-sitioned features
Yes Yes Yes No No No No No
37 If yes, specify non-compliant features
No specifi ed trig-ger level, dividend stopper
No specifi ed trig-ger level, step-up, dividend stopper
No specifi ed trig-ger level, step-up, dividend stopper
N/A N/A N/A N/A N/A

Nordea Group – Other notes
Nordea Annual Report 2015130
G37 Capital adequacy, cont.
Table A5 – Capital main features template – T2
Tier 2 instruments
1 Issuer Nordea Bank Norge ASA
Nordea Bank Finland PLC
Nordea Bank AB (publ)
Nordea Bank AB (publ)
Nordea Bank AB (publ)
Nordea Bank AB (publ)
2 Unique identifi -er (eg CUSIP, ISIN or Bloomberg identifi er for private place-ment)
GB0001961928 N/A XS0497179035 XS0544654162 US65557FAA49/US65557HAA05
XS0743689993
3 Governing law(s) of the instrument
Governed by English law, except for the subordination provisions which are governed by Nor wegian law
Governed by English law, except for the subordination provisions which are governed by Finnish law
Governed by English law, except for the subordination provisions which are governed by Swedish law
Governed by English law, except for the subordination provisions which are governed by Swedish law
Governed by the laws of the State of New York, except for the subordination provi-sions which are gov-erned by Swedish law
Governed by English law, except for the subordination provisions which are governed by Swedish law
Regulatory treatment
4 Transitional CRR rules
Tier 2 Tier 2 Tier 2 Tier 2 Tier 2 Tier 2
5 Post-transition-al CRR rules
Tier 2 Ineligible Tier 2 Tier 2 Tier 2 Tier 2
6 Eligible at solo/(sub-)consolidated/solo & (sub-)consolidated
Solo, sub-consolidat-ed & consolidated
Solo, sub-consolidat-ed & consolidated
Solo & consolidated Solo & consolidated Solo & consolidated Solo & consolidated
7 Instrument type (types to be specifi ed by each juris-diction)
Tier 2 as published in Regulation (EU) No 575/2013 article 63
Tier 2 (grandfa-thered) as published in Regulation (EU) No 575/2013 article 484.5
Tier 2 as published in Regulation (EU) No 575/2013 article 63
Tier 2 as published in Regulation (EU) No 575/2013 article 63
Tier 2 as published in Regulation (EU) No 575/2013 article 63
Tier 2 as published in Regulation (EU) No 575/2013 article 63
8 Amount recog-nised in regula-tory capital (currency in million, as of most recent reporting date)
EUR 184m EUR 76m EUR 845m (84.5 per cent of Nominal amount, <5 yrs to maturity)
EUR 747m EUR 1,142m EUR 749m
9 Nominal amount of instrument
USD 200m / EUR 184m
JPY 10,000m / EUR 76m
EUR 1,000m EUR 750m USD 1,250m / EUR 1,148m
EUR 750m
9a Issue price 100 per cent 100 per cent 99.810 per cent 99.699 per cent 99.508 per cent 99.803 per cent
9b Redemption price
100 per cent of Nominal amount
100 per cent of Nominal amount
100 per cent of Nominal amount
100 per cent of Nominal amount
100 per cent of Nominal amount
100 per cent of Nominal amount
10 Accounting classifi cation
Liability – amortised cost
Liability – amortised cost
Liability – amortised cost
Liability – amortised cost
Liability – amortised cost
Liability – amortised cost
11 Original date of issuance
04-Nov-1986 22-Aug-2001 26-Mar-2010 29-Sep-2010 13-May-2011 15-Feb-2012
12 Perpetual or dated
Perpetual Perpetual Dated Dated Dated Dated
13 Original maturi-ty date
No maturity No maturity 26-Mar-2020 29-Mar-2021 13-May-2021 15-Feb-2022
14 Issuer call sub-ject to prior supervisory approval
Yes Yes Yes Yes Yes Yes
15 Optional call date, contin-gent call dates and redemp-tion amount
18-Nov-1991In addition tax call100 per cent of nom-inal amount
26-Feb-2029In addition tax call100 per cent of nominal amount
Tax/regulatory call100 per cent of nom-inal amount
Tax call100 per cent of nom-inal amount
Tax call100 per cent of nom-inal amount
15-Feb-2017In addition tax call100 per cent of nom-inal amount
16 Subsequent call dates, if applicable
18-May and 18-Nov each year after fi rst call date
26-Feb and 26-Aug each year after fi rst call date
N/A N/A N/A N/A

Other notes – Nordea Group
Nordea Annual Report 2015 131
G37 Capital adequacy, cont.
Nordea Bank AB (publ)
Nordea Bank AB (publ)
Nordea Bank AB (publ)
Nordea Bank AB (publ)
Nordea Bank AB (publ)
US65557FAD87/US65557HAD44
XS1292434146 XS1292433767 N/A XS1317439559
Governed by the laws of the State of New York, except for the subordination provi-sions which are gov-erned by Swedish law
Governed by English law, except for the subordination provisions which are governed by Swedish law
Governed by English law, except for the subordination provisions which are governed by Swedish law
Governed by English law, except for the subordination provisions which are governed by Swedish law
Governed by English law, except for the subordination provisions which are governed by Swedish law
Tier 2 Tier 2 Tier 2 Tier 2 Tier 2
Tier 2 Tier 2 Tier 2 Tier 2 Tier 2
Solo & consolidated Solo & consolidated Solo & consolidated Solo & consolidated Solo & consolidated
Tier 2 as published in Regulation (EU) No 575/2013 article 63
Tier 2 as published in Regulation (EU) No 575/2013 article 63
Tier 2 as published in Regulation (EU) No 575/2013 article 63
Tier 2 as published in Regulation (EU) No 575/2013 article 63
Tier 2 as published in Regulation (EU) No 575/2013 article 63
EUR 911m EUR 185m EUR 250m EUR 114m EUR 743m
USD 1,000m / EUR 919m
SEK 1,700m / EUR 185m
SEK 2,300m / EUR 250m
JPY 15,000m / EUR 114m
EUR 750m
99.364 per cent 100 per cent 100 per cent 100 per cent 99.434 per cent
100 per cent of Nominal amount
100 per cent of Nominal amount
100 per cent of Nominal amount
100 per cent of Nominal amount
100 per cent of Nominal amount
Liability – amortised cost
Liability – amortised cost
Liability – amortised cost
Liability – amortised cost
Liability – amortised cost
21-Sep-2012 17-Sep-2015 17-Sep-2015 06-Oct-2015 10-Nov-2015
Dated Dated Dated Dated Dated
21-Sep-2022 17-Sep-2025 17-Sep-2025 06-Oct-2025 10-Nov-2025
Yes Yes Yes Yes Yes
Tax/regulatory call100 per cent of nomi-nal amount
17-Sep-2020In addition tax/regula-tory call100 per cent of nominal amount
17-Sep-2020In addition tax/regula-tory call100 per cent of nominal amount
Tax/regulatory call100 per cent of nominal amount
10-Nov-2020In addition tax/regula-tory call100 per cent of nominal amount
N/A 17-Mar, 17-Jun, 17-Sep and 17-Dec each year after fi rst call date
17-Sep each year after fi rst call date
N/A 10-Nov each year after fi rst call date

Nordea Group – Other notes
Nordea Annual Report 2015132
Coupons/dividends
17 Fixed or fl oat-ing dividend / coupon
Floating Fixed to fl oating Fixed Fixed Fixed Fixed
18 Coupon rate and any related index
Floating 6-month USD +0.1875 per cent per annum
Fixed USD 4.51 per cent per annum to call date, thereafter fl oating rate equiva-lent to 6-month JPY Deposit +2.00 per cent per annum
4,50% 4,00% 4,875% Fixed 4.625 per cent per annum (equiva-lent to Euro Swap Rate +3.15 per cent per annum) to call date, thereafter reset fi xed rate to Euro Swap Rate +3.15 per cent per annum
19 Existence of a dividend stop-per
No No No No No No
20a Fully discre-tionary, partially discretionary or mandatory (in terms of tim-ing)
Partially discretionaryDividend pusher
Partially discretionaryDividend pusher
Mandatory Mandatory Mandatory Mandatory
20b Fully discre-tionary, partially discretionary or mandatory (in terms of amount)
Partially discretionary Partially discretionary Mandatory Mandatory Mandatory Mandatory
21 Existence of step up or other incentive to redeem
No Yes No No No No
22 Noncumulative or cumulative
Cumulative Cumulative Non-cumulative Non-cumulative Non-cumulative Non-cumulative
23 Convertible or non-convertible
Non-convertible Non-convertible Non-convertible Non-convertible Non-convertible Non-convertible
30 Write-down features
No No No No No No
35 Position in sub-ordination hier-archy in liqui-dation (specify instrument type immedi-ately senior to instrument)
Senior debt Senior debt Senior debt Senior debt Senior debt Senior debt
36 Non-compliant transitioned features
No Yes No No No No
37 If yes, specify non-compliant features
N/A Step-up N/A N/A N/A N/A
Table A5 – Capital main features template – T2, cont
Tier 2 instruments
G37 Capital adequacy, cont.

Other notes – Nordea Group
Nordea Annual Report 2015 133
Fixed Floating Fixed Fixed Fixed
4,250% Floating 3-month STIBOR +1.5 per cent per annum
Fixed 1.935 per cent per annum, until fi rst call date, thereafter fi xed 5-year mid swap +1.5 per cent per annum
1,160% Fixed 1.875 per cent per annum, until fi rst call date, thereafter fi xed 5-year mid swap +1.7 per cent per annum
No No No No No
Mandatory Mandatory Mandatory Mandatory Mandatory
Mandatory Mandatory Mandatory Mandatory Mandatory
No No No No No
Non-cumulative Non-cumulative Non-cumulative Non-cumulative Non-cumulative
Non-convertible Non-convertible Non-convertible Non-convertible Non-convertible
No No No No No
Senior debt Senior debt Senior debt Senior debt Senior debt
No No No No No
N/A N/A N/A N/A N/A
G37 Capital adequacy, cont.
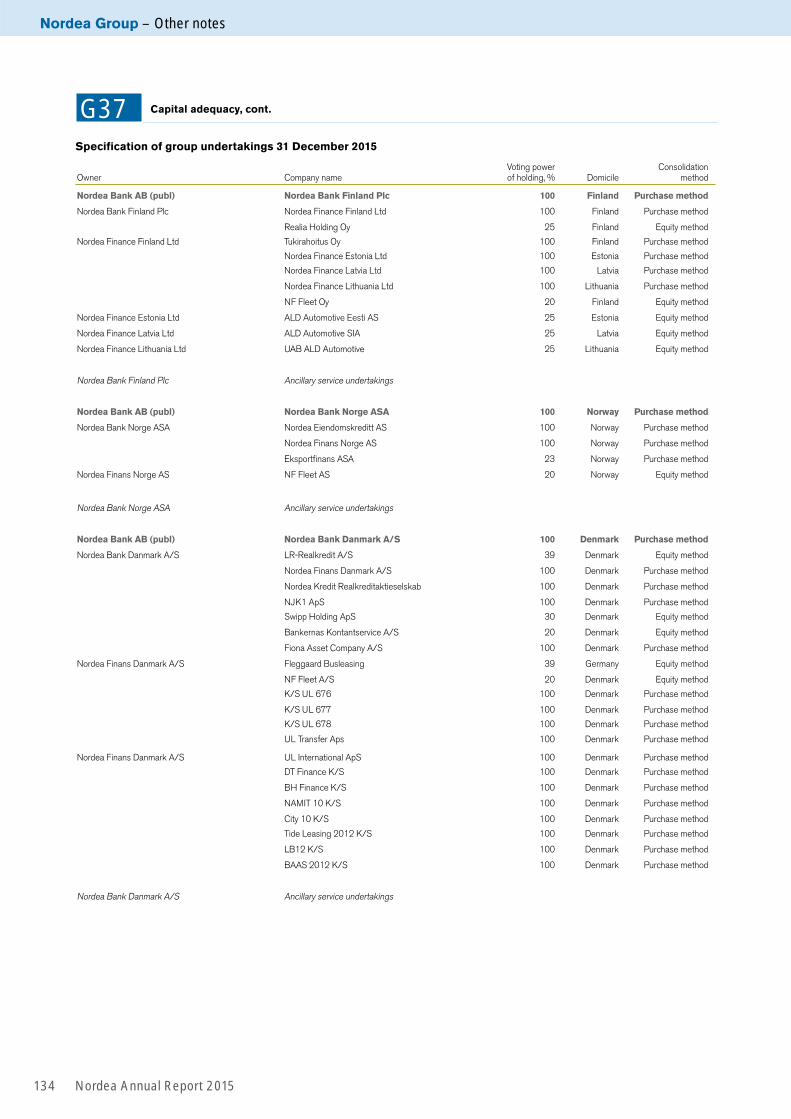
Nordea Group – Other notes
Nordea Annual Report 2015134
Specification of group undertakings 31 December 2015
Owner Company name Voting power
of holding, % DomicileConsolidation
method
Nordea Bank AB (publ) Nordea Bank Finland Plc 100 Finland Purchase method
Nordea Bank Finland Plc Nordea Finance Finland Ltd 100 Finland Purchase method
Realia Holding Oy 25 Finland Equity method
Nordea Finance Finland Ltd Tukirahoitus Oy 100 Finland Purchase method
Nordea Finance Estonia Ltd 100 Estonia Purchase method
Nordea Finance Latvia Ltd 100 Latvia Purchase method
Nordea Finance Lithuania Ltd 100 Lithuania Purchase method
NF Fleet Oy 20 Finland Equity method
Nordea Finance Estonia Ltd ALD Automotive Eesti AS 25 Estonia Equity method
Nordea Finance Latvia Ltd ALD Automotive SIA 25 Latvia Equity method
Nordea Finance Lithuania Ltd UAB ALD Automotive 25 Lithuania Equity method
Nordea Bank Finland Plc Ancillary service undertakings
Nordea Bank AB (publ) Nordea Bank Norge ASA 100 Norway Purchase method
Nordea Bank Norge ASA Nordea Eiendomskreditt AS 100 Norway Purchase method
Nordea Finans Norge AS 100 Norway Purchase method
Eksportfi nans ASA 23 Norway Purchase method
Nordea Finans Norge AS NF Fleet AS 20 Norway Equity method
Nordea Bank Norge ASA Ancillary service undertakings
Nordea Bank AB (publ) Nordea Bank Danmark A/S 100 Denmark Purchase method
Nordea Bank Danmark A/S LR-Realkredit A/S 39 Denmark Equity method
Nordea Finans Danmark A/S 100 Denmark Purchase method
Nordea Kredit Realkreditaktieselskab 100 Denmark Purchase method
NJK1 ApS 100 Denmark Purchase method
Swipp Holding ApS 30 Denmark Equity method
Bankernas Kontantservice A/S 20 Denmark Equity method
Fiona Asset Company A/S 100 Denmark Purchase method
Nordea Finans Danmark A/S Fleggaard Busleasing 39 Germany Equity method
NF Fleet A/S 20 Denmark Equity method
K/S UL 676 100 Denmark Purchase method
K/S UL 677 100 Denmark Purchase method
K/S UL 678 100 Denmark Purchase method
UL Transfer Aps 100 Denmark Purchase method
Nordea Finans Danmark A/S UL International ApS 100 Denmark Purchase method
DT Finance K/S 100 Denmark Purchase method
BH Finance K/S 100 Denmark Purchase method
NAMIT 10 K/S 100 Denmark Purchase method
City 10 K/S 100 Denmark Purchase method
Tide Leasing 2012 K/S 100 Denmark Purchase method
LB12 K/S 100 Denmark Purchase method
BAAS 2012 K/S 100 Denmark Purchase method
Nordea Bank Danmark A/S Ancillary service undertakings
G37 Capital adequacy, cont.

Other notes – Nordea Group
Nordea Annual Report 2015 135
Owner Company name Voting power
of holding, % DomicileConsolidation
method
Nordea Bank AB (publ)OOO Promyshlennaya Companiya Vestkon 100 Russia Purchase method
OOO Promyshlennaya Companiya Vestkon /
Nordea Bank AB (publ)
Joint Stock Company
Nordea Bank 100 Russia Purchase method
Joint Stock Company Nordea Bank Nordea Leasing LLC 100 Russia Purchase method
Joint Stock Company Nordea Bank Ancillary service undertakings
Nordea Bank AB (publ) Nordea Hypotek AB (publ) 100 Sweden Purchase method
Nordea Finans Sverige AB (publ) 100 Sweden Purchase method
Nordea Investment Management AB 100 Sweden Purchase method
Bankomatcentralen AB 48 Sweden Equity method
Svenska e-fakturabolaget AB 50 Sweden Equity method
BDB Bankernas Depå AB 20 Sweden Equity method
BAB Bankernas Automatbolag AB 20 Sweden Equity method
Getswish AB (former Goldcup 8289) 20 Sweden Equity method
PK Properties Int’l Corp 100 USA Purchase method
Nordea Funds Ltd 100 Finland Purchase method
Nordea Finans Sverige AB (publ) NF Fleet AB 20 Sweden Purchase method
Nordea Investment Management AB Nordea Investment Management North America Inc 100 USA Purchase method
Nordea Investment Management AG 100 Germany Purchase method
Nordea Private Equity Holding A/S 100 Denmark Purchase method
Nordea Private Equity Holding A/S Nordea Private Equity I A/S 100 Denmark Purchase method
Nordea Private Equity II – Global A/S 100 Denmark Purchase method
Nordea Private Equity III – GLOBAL A/S 100 Denmark Purchase method
Nordea Private Equity II – EU Mezz A/S 100 Denmark Purchase method
Nordea Private Equity II – EU MM Buyout A/S 100 Denmark Purchase method
PWM Global PE III ApS 100 Denmark Purchase method
NF Techfl eet AB 20 Sweden Equity method
Nordea Bank AB (publ) Ancillary service undertakings
Nordea Bank AB (publ) / Nordea Investment Management AB
Nordea Bank S.A. 100 Luxembourg Purchase method
Nordea Bank S.A. Nordea Investment Funds S.A. 100 Luxembourg Purchase method
Specification of group undertakings 31 December 2015, cont.
G37 Capital adequacy, cont.

Nordea Group – Other notes
Nordea Annual Report 2015136
G38 Classification of financial instruments
Financial assets at fair value through profi t or loss
31 Dec 2015, EURm Loans and
receivablesHeld to
maturityHeld for trading
Designated at fair value
through profi t or loss
Derivatives used for hedging
Available for sale
Non-fi nancial assets and associated
undertakings Total
AssetsCash and balances with central banks 35,500 — — — — — — 35,500
Loans to central banks 8,095 — 5,129 — — — — 13,224
Loans to credit institutions 7,449 — 3,489 21 — — — 10,959
Loans to the public 251,876 — 36,999 52,045 — — — 340,920
Interest-bearing securities 61 2,708 34,870 16,421 — 34,116 — 88,176
Financial instruments pledged as collateral — — 8,341 — — — — 8,341
Shares — — 4,917 35,828 — — — 40,745
Derivatives — — 77,594 — 3,147 — — 80,741
Fair value changes of the hedged items in portfolio hedge of interest rate risk 151 — — — — — — 151
Investments in associated undertakings — — — — — — 515 515
Intangible assets — — — — — — 3,208 3,208
Properties and equipment — — — — — — 557 557
Investment properties — — — — — — 3,165 3,165
Deferred tax assets — — — — — — 76 76
Current tax assets — — — — — — 87 87
Retirement benefi t assets — — — — — — 377 377
Other assets 2,698 — — 14,697 — — 1,205 18,600
Prepaid expenses and accrued income 968 — — — — — 558 1,526
Total 306,798 2,708 171,339 119,012 3,147 34,116 9,748 646,868
Financial liabilities at fair value through profi t or loss
31 Dec 2015, EURm Held for trading
Designated at fair value
through profi t or loss
Derivatives used for hedging
Other fi nancial liabilities
Non-fi nancial liabilities Total
LiabilitiesDeposits by credit institutions 17,534 1,086 — 25,589 — 44,209
Deposits and borrowings from the public 10,465 8,520 — 174,357 — 193,342
Liabilities to policyholders — 19,545 — — 35,946 55,491
Debt securities in issue 6,885 46,229 — 148,823 — 201,937
Derivatives 77,887 — 1,618 — — 79,505
Fair value changes of the hedged items in portfolio hedge of interest rate risk — — — 2,594 — 2,594
Current tax liabilities — — — — 225 225
Other liabilities 8,824 11,141 — 3,652 2,139 25,756
Accrued expenses and prepaid income — — — 341 1,464 1,805
Deferred tax liabilities — — — — 1,028 1,028
Provisions — — — — 415 415
Retirement benefi t liabilities — — — — 329 329
Subordinated liabilities — — — 9,200 — 9,200
Total 121,595 86,521 1,618 364,556 41,546 615,836

Other notes – Nordea Group
Nordea Annual Report 2015 137
Financial assets at fair value through profi t or loss
31 Dec 2014, EURm Loans and
receivablesHeld to
maturityHeld for trading
Designated at fair value
through profi t or loss
Derivatives used for hedging
Available for sale
Non-fi nancial assets and associated
undertakings Total
AssetsCash and balances with central banks 31,067 — — — — — — 31,067
Loans to central banks 6,676 — 282 — — — — 6,958
Loans to credit institutions 7,657 — 4,547 13 — — — 12,217
Loans to the public 246,862 — 49,517 51,706 — — — 348,085
Interest-bearing securities — 2,630 34,418 18,541 — 31,521 — 87,110
Financial instruments pledged as collateral — — 12,151 — — — — 12,151
Shares — — 8,445 31,300 — 4 — 39,749
Derivatives — — 102,279 — 2,840 — — 105,119
Fair value changes of the hedged items in portfolio hedge of interest rate risk 256 — — — — — — 256
Investments in associated undertakings — — — — — — 487 487
Intangible assets — — — — — — 2,908 2,908
Properties and equipment — — — — — — 509 509
Investment properties — — — — — — 3,227 3,227
Deferred tax assets — — — — — — 130 130
Current tax assets — — — — — — 132 132
Retirement benefi t assets — — — — — — 42 42
Other assets 4,590 — — 11,176 — — 1,815 17,581
Prepaid expenses and accrued income 1,123 — 4 — — — 487 1,614
Total 298,231 2,630 211,643 112,736 2,840 31,525 9,737 669,342
Financial liabilities at fair value through profi t or loss
31 Dec 2014, EURm Held for trading
Designated at fair value
through profi t or loss
Derivatives used for hedging
Other fi nancial liabilities
Non-fi nancial liabilities Total
LiabilitiesDeposits by credit institutions 23,806 3,220 — 29,296 — 56,322
Deposits and borrowings from the public 24,577 8,343 — 164,334 — 197,254
Liabilities to policyholders — 16,741 — — 35,102 51,843
Debt securities in issue 8,001 42,619 — 143,654 — 194,274
Derivatives 95,118 — 2,222 — — 97,340
Fair value changes of the hedged items in portfolio hedge of interest rate risk — — — 3,418 — 3,418
Current tax liabilities — — — — 368 368
Other liabilities 6,903 10,061 — 6,377 3,632 26,973
Accrued expenses and prepaid income 9 — — 345 1,589 1,943
Deferred tax liabilities — — — — 983 983
Provisions — — — — 305 305
Retirement benefi t liabilities — — — — 540 540
Subordinated liabilities — — — 7,942 — 7,942
Total 158,414 80,984 2,222 355,366 42,519 639,505
G38 Classification of financial instruments, cont.

Nordea Group – Other notes
Nordea Annual Report 2015138
Financial assets and liabilities designated at fair value through profit or lossChanges in fair values of financial liabilities attributable to changes in credit riskThe financial liabilities designated at fair value through profit or loss exposed to changes in credit risk are issued bonds in the Danish group undertaking Nordea Kredit Realkreditaktieselskab, EUR 46,229m (EUR 42,619m), the funding of the Markets operation, EUR 16,454m (EUR 17,337m) deposits linked to the investment return of separate assets, EUR 4,293m (EUR 4,287m) and investment contracts in Life, EUR 19,545m (EUR 16,741m). The funding of Markets is gen-erally of such a short term nature that the effect of changes in own credit risk is not significant. The value of the investment contracts in Life and assetslinked deposits is directly linked to the assets in the contracts and there is consequently no effect from changes in own credit risk in these contracts.
The fair value of bonds issued by Nordea Kredit Realkredit-aktieselskab decreased by EUR 100m (decreased EUR 6m) in 2015 due to changes in own credit risk. The cumulative change since designation is a decrease of EUR 691m (decrease EUR 592m). The method used to estimate the amount of changes in fair value attributable to changes in market condi-tions is based on relevant benchmark interest rates, which are the average yields on Danish and German (EUR) government bonds.
For the issued mortgage bonds a change in the liability’s credit risk and price will have a corresponding effect on the value of the loans. The reason is that a change in the price of the bonds will be offset by the opposite change in the value of the prepayment option of the loan.
Changes in fair values of financial assets attributable to changes in credit riskLending designated at fair value through profit or loss exposed to changes in credit risk consist of lending in the Danish group undertaking Nordea Kredit Realkreditaktieselskab, EUR 51,713m (EUR 51,244m) and lending in the Markets operation, EUR 353m (EUR 475). The fair value of lending in Nordea Kredit Realkreditaktieselskab decreased by EUR 19m (increased EUR 7m) in 2015 due to changes in credit risk. The cumulative change since designation is a decrease of EUR 171m (decrease EUR 153m). The method used to estimate the amount of change in the fair value attributable to changes in credit risk is similar to the incurred loss impairment model for amortised cost assets under IAS 39. The lending in Markets is generally of such a short term nature (mainly overnight depos-its) that the effect of changes in credit risk is not significant. Also instruments classified as “Other assets” and “Prepaid expenses and accrued income” are of such a short-term nature that the impact from changes in credit risk is not significant.
G39 Assets and liabilities at fair value
Fair value of financial assets and liabilities
31 Dec 2015 31 Dec 2014
EURmCarrying amount Fair value
Carrying amount Fair value
Financial assetsCash and balances with central banks 35,500 35,500 31,067 31,067
Loans 365,254 366,598 367,516 368,872
Interest-bearing securities 88,176 88,391 87,110 87,421
Financial instruments pledged as collateral 8,341 8,341 12,151 12,151
Shares 40,745 40,745 39,749 39,749
Derivatives 80,741 80,741 105,119 105,119
Other assets 17,395 17,395 15,766 15,766
Prepaid expenses and accrued income 968 968 1,127 1,127
Total 637,120 638,679 659,605 661,272
Financial liabilitiesDeposits and debt instruments 451,282 451,167 459,210 460,653
Liabilities to policyholders 19,545 19,545 16,741 16,741
Derivatives 79,505 79,505 97,340 97,340
Other liabilities 23,617 23,617 23,341 23,341
Accrued expenses and prepaid income 341 341 354 354
Total 574,290 574,175 596,986 598,429
For information about valuation of items measured at fair value on the balance sheet, see Note G1 and the section “Determina-tion of fair values for items measured at fair value on the bal-ance sheet” below. For information about valuation of items not measured at fair value on the balance sheet, see the section “Financial assets and liabilities not held at fair value on the bal-ance sheet” below.
Comparison of carrying amount and contractual amount to be paid at maturity
2015, EURmCarrying amount
Amount to be paid at maturity
Financial liabilities designated at fair value through profi t or loss 86,521 85,776
2014, EURmCarrying amount
Amount to be paid at maturity
Financial liabilities designated at fair value through profi t or loss 80,984 79,198
Liabilities to policyholders have no fixed maturities and there is no fixed amount to be paid. The amount disclosed to be paid at maturity has been set to the carrying amount.
G38 Classification of financial instruments, cont.
Loans designated at fair value through profit or loss
EURm 31 Dec 2015 31 Dec 2014
Carrying amount 52,066 51,719
Maximum exposure to credit risk 52,066 51,719
Carrying amount of credit derivatives used to mitigate the credit risk — —

Other notes – Nordea Group
Nordea Annual Report 2015 139
G39 Assets and liabilities at fair value, cont.
Categorisation into the fair value hierarchy
31 Dec 2015, EURm
Quoted prices in active markets for
the same instrument (Level 1)
– of which
Life
Valuation technique using observable data
(Level 2)
– of which
Life
Valuation technique using
non-observable data (Level 3)
– of which
Life Total
Assets at fair value on the balance sheet1
Loans to central banks — — 5,129 — — — 5,129
Loans to credit institutions — — 3,510 — — — 3,510
Loans to the public — — 89,044 — — — 89,044
Interest-bearing securities2 49,979 12,986 43,511 6,044 250 45 93,740
Shares3 33,158 26,757 2,717 2,414 4,878 4,212 40,753
Derivatives 211 — 78,875 32 1,655 — 80,741
Investment properties — — — — 3,165 3,085 3,165
Other assets — — 14,697 — — — 14,697
Total 83,348 39,743 237,483 8,490 9,948 7,342 330,779
Liabilities at fair value on the balance sheet1
Deposits by credit institutions — — 18,620 1,361 — — 18,620
Deposits and borrowings from the public — — 18,985 — — — 18,985
Liabilities to policyholders — — 19,545 19,545 — — 19,545
Debt securities in issue4 46,229 — 6,885 — — — 53,114
Derivatives4 242 — 77,739 153 1,524 — 79,505
Other liabilities 6,909 — 13,056 — — — 19,965
Total 53,380 — 154,830 21,059 1,524 — 209,734
1) All items are measured at fair value on a recurring basis at the end of each reporting period.2) Of which EUR 8,333m relates to the balance sheet item Financial instruments pledged as collateral.3) Of which EUR 8m relates to the balance sheet item Financial instruments pledged as collateral.4) For structured bonds the host contract and the embedded derivative are presented separately. The host contract is presented on the balance sheet as Debt securities in issue and
the embedded derivative as Derivatives. The total fair value of the structured bonds is EUR 6,825m, of which EUR 6,881m is categorised into Level 2 and a net positive fair value of EUR 56m into Level 3 in the fair value hierarchy.
31 Dec 2014, EURm
Quoted prices in active markets for
the same instrument (Level 1)
– of which
Life
Valuation technique using observable data
(Level 2)
– of which
Life
Valuation technique using
non-observable data (Level 3)
– of which
Life Total
Assets at fair value on the balance sheet1
Loans to central banks — — 282 — — — 282
Loans to credit institutions — — 4,560 7 — — 4,560
Loans to the public — — 101,223 — — — 101,223
Interest-bearing securities2 54,724 12,805 41,598 6,936 279 53 96,601
Shares3 32,724 22,739 1,597 1,596 5,458 4,486 39,779
Derivatives 102 — 103,551 119 1,466 — 105,119
Investment properties — — — — 3,227 3,127 3,227
Other assets — — 11,176 — — — 11,176
Prepaid expenses and accrued income — — 4 — — — 4
Total 87,550 35,544 263,991 8,658 10,430 7,666 361,971
Liabilities at fair value on the balance sheet1
Deposits by credit institutions — — 27,026 1,541 — — 27,026
Deposits and borrowings from the public — — 32,920 — — — 32,920
Liabilities to policyholders — — 16,741 16,741 — — 16,741
Debt securities in issue4 42,619 — 8,001 — — — 50,620
Derivatives4 91 — 95,623 56 1,626 — 97,340
Other liabilities 4,667 — 12,297 — — — 16,964
Accrued expenses and prepaid income — — 9 — — — 9
Total 47,377 — 192,617 18,338 1,626 — 241,620
1) All items are measured at fair value on a recurring basis at the end of each reporting period.2) Of which EUR 12,121m relates to the balance sheet item Financial instruments pledged as collateral.3 Of which EUR 30m relates to the balance sheet item Financial instruments pledged as collateral.4) For structured bonds the host contract and the embedded derivative are presented separately. The host contract is presented on the balance sheet as Debt securities in issue and
the embedded derivative on the balance sheet as Derivatives. The total fair value off the structured bonds is EUR 7,541m, of which EUR 7,185m is categorised into Level 2 and a net negative fair value of EUR –356m into Level 3 in the fair value hierarchy.
Assets and liabilities held at fair value on the balance sheet

Nordea Group – Other notes
Nordea Annual Report 2015140
Determination of fair value for items measured at fair value on the balance sheetFair value measurements of assets and liabilities carried at fair value have been categorised under the three levels of the IFRS fair value hierarchy. The fair value hierarchy gives the highest priority to quoted prices (unadjusted) in active mar-kets for identical assets or liabilities (Level 1) and the lowest priority to unobservable inputs (Level 3). The categorisation of these instruments is based on the lowest level input that is significant to the fair value measurement in its entirety.
Level 1 in the fair value hierarchy consists of assets and lia-bilities valued using unadjusted quoted prices in active mar-kets for identical assets or liabilities. An active market for the asset or liability is a market in which transactions for the asset or liability occur with sufficient frequency and volume to pro-vide pricing information on an on-going basis. This category includes listed derivatives, listed equities, government bonds in developed countries, and most liquid mortgage bonds and corporate bonds where direct tradable price quotes exist.
Level 2 in the fair value hierarchy consists of assets and lia-bilities that do not have directly quoted market prices availa-ble from active markets. The fair values are based on quoted prices for similar assets or liabilities in active markets or quoted prices for identical or similar assets or liabilities in markets that are not active. Alternatively, the fair values are estimated using valuation techniques or valuation models based on market prices or rates prevailing at the balance sheet date and any unobservable inputs have had an insignificant impact on the fair values. This is the case for the majority of Nordea’s OTC derivatives, securities purchased/sold under resale/repurchase agreements, securities borrowed/lent and other instruments where active markets supply the input to the valuation techniques or models.
Level 3 in the fair value hierarchy consists of those types of assets and liabilities which fair values cannot be obtained directly from quoted market prices or indirectly using valuation techniques or models supported by observable market prices or rates. This is generally the case for investments in unlisted secu-rities, private equity funds, hedge funds, investment properties, more complex OTC derivatives where unobservable input have a significant impact on the fair values, certain complex or struc-tured financial instruments and illiquid interest bearing securi-ties. Complex valuation models are generally characterised by the use of unobservable and model specific parameters.
All valuation models, both complex and simple models, make use of market parameters. These parameters comprise interest rates, volatilities, correlations etc. Some of these parameters are observable while others are not. For non-exotic currencies the interest rates are all observable, and the volatilities and the cor-relations of the interest rates and FX rates are observable up to a certain maturity. Volatilities and correlations are also observa-ble for the most liquid equity instruments in the short end. For less liquid equity instruments the option market is fairly illiq-uid, and hence the volatilities and correlations are unobserva-ble. For each instrument the sensitivity towards unobservable parameters is measured. If the impact from unobservable para-meters on the valuation is significant the instrument is cate-gorised as Level 3 in the fair value hierarchy.
For interest-bearing securities the categorisation into the three levels are based on the internal pricing methodology. These instruments can either be directly quoted in active markets (Level 1) or measured using a methodology giving a quote based on observable inputs (Level 2). Level 3 bonds are characterised by illiquidity.
For OTC derivatives valuation models are used for establish-ing fair value. For collateralised contracts OIS interest rates are used for discounting. These rates are observable in the market. The valuation is in addition based on several other market parameters, depending on the nature of the contract. Complex valuation models are used for more exotic OTC derivatives. The models are usually in-house developed, and based on assumptions about the behaviour of the underlying asset and statistical scenario analysis. As mentioned above OTC deriva-tives are generally categorised as Level 2 in the fair value hier-archy and all significant model parameters are thus observable in active markets. For vanilla derivatives standard models like e.g. Black-Scholes are used for valuation.
Valuations of Private Equity Funds (PEF) and unlisted equity instruments are by nature more uncertain than valua-tions of more actively traded equity instruments. Emphasis is put on using a consistent approach across all assets and over time. The methods used are consistent with the guideline “International Private Equity and Venture Capital Valuation Guidelines” issued by EVCA (European Venture Capital Association). The EVCA guidelines are considered as best practice in the PEF industry. For US based funds, similar methods are applied.
Nordea furthermore holds loans and issued debt securities in the subsidiary Nordea Kredit Realkreditaktieselskab at fair value. When Nordea grants mortgage loans to borrowers, in accordance with the Danish mortgage finance law, Nordea at the same time issues debt securities with matching terms, so called “match funding”. Fair value of the issued debt securi-ties is based on quoted prices and thus categorised as Level 1 in the fair value hierarchy. As the borrowers have the right to purchase debt securities issued by Nordea in the market and return these as repayment for their loans, the fair value of the loans is the same as the fair value of the issued bonds (due to the revaluation of the repayment option embedded in the loan) adjusted for changes in the credit risk of the borrower. The credit risk adjustment is calculated based on an incurred loss model.
Fair value of financial assets and liabilities are generally cal-culated as the theoretical net present value of the individual instruments, based on independently sourced market parame-ters as described above, and assuming no risks and uncertain-ties. This calculation is supplemented by a portfolio adjustment.
Nordea incorporates credit valuation adjustments (CVA) and debit valuation adjustments (DVA) into derivative valua-tions. CVA and DVA reflect the impact on fair value of the counterparty s credit risk and Nordea’s own credit quality, respectively. Calculations are based on estimates of exposure at default, probability of default and recovery rates, on a coun-terparty basis. Generally, exposure at default for CVA and DVA is based on expected exposure and estimated through the simulation of underlying risk factors. Where possible, probabilities of defaults (PDs) and recovery rates are sourced from the CDS markets. For counterparties where this informa-tion is not directly available, PDs and recovery rates are esti-mated using a cross sectional approach where the illiquid counterparties are mapped to comparable liquid CDS names.
The impact of funding costs and funding benefits on valua-tion of uncollateralised and imperfectly collateralised deriva-tives is recognises as a funding fair valuation adjustment (FFVA). In 2015 Nordea has developed its FFVA framework to incorporate an estimated funding curve which reflects the market cost of funding. Since FFVA is a newly developing market practice, Nordea is continuously monitoring the
G39 Assets and liabilities at fair value, cont.

Other notes – Nordea Group
Nordea Annual Report 2015 141
market practices, and consequently reviewing and developing the methodology in use.
Another important part of the portfolio adjustment serves to adjust the net open market risk exposures from mid-prices to ask or bid prices (depending on the net position). For dif-ferent risk categories, exposures are aggregated and netted according to internal guidelines and aggregated market price information on bid-ask spreads are applied in the calculation. Spreads are updated on a regular basis.
The fair value measurement of the investment properties takes into account a market participant s ability to generate economic benefits by using the investment properties in its highest and best use, i.e. taking into account the use of the investment properties that is physically possible, legally permissible and financially feasible. The current use of the investment properties in Nordea is in accordance with the highest and best use. The valuation of the investment proper-ties is carried out taking into account the purpose and the nature of the property by using the most appropriate valua-tion methods. The primary valuation approach is a dis-counted cash flow model using current cash flows, market interest rates and the current yield requirements.
Transfers between Level 1 and 2 During the year, Nordea transferred interest-bearing securities (including such financial instruments pledged as collateral) of EUR 1,129m (EUR 149m) from Level 1 to Level 2 and EUR 295m (EUR 1,290m) from Level 2 to Level 1 of the fair value hierar-chy. Nordea also transfered shares of EUR 22m (EUR 0m) from Level 1 to Level 2, derivative assets of EUR 96m (EUR 0m) and derivative liabilities of EUR 120m (EUR 0m) from Level 2 to Level 1 and other liabilities of EUR 4m (EUR 55m) from Level 2 to Level 1.
The reason for the transfers from Level 1 to Level 2 was that the instruments ceased to be actively traded during the year and fair values have now been obtained using valuation techniques with observable market inputs. The reason for the transfer from Level 2 to Level 1 was that the instruments have been actively traded during the year and reliable qouted prices are obtained in the market. Transfers have also occurred following the implementation of an improved and more granular classification approach. Transfers between lev-els are considered to have occurred at the end of the year.
Unrealised gains and losses relate to those assets and liabilities held at the end of the year. During 2015 Nordea transferred shares of EUR 29m from Level 2 to Level 3 and EUR 333m from Level 3 to Level 2. Nordea also transferred derivatives (net) of EUR 443 from Level 2 to Level 3 and EUR 133 m from Level 3 to Level 2. The reason for the transfer from Level 3 to Level 2 was that observable market data became available. The reason for the transfer from Level 2 to Level 3 was that oberservable market data was no longer avaliable. Transfers have also occurred following the implemenation of an improved and more granular clas-sifcation approach. Transfers between levels are considered to have occurred at the end of the year. Fair value gains and losses in the income statement during the year are included in “Net result from items at fair value” (see Note G5). Assets and liabilities related to derivatives are presented net.
Movements in Level 3 Fair value gains/
losses recognised in the income statement
during the year
2015, EURm 1 Jan2015 Realised Unrealised
Recog-nised in
OCIPurchases/
Issues SalesSettle-ments
Transfers into Level 3
Transfers out of Level 3
Translation differences
31 Dec2015
Interest-bearing securities 279 1 8 — 75 –111 –1 — –2 1 250
– of which Life 53 — –3 — — –6 — — — 1 45
Shares 5,458 307 49 — 4,468 –5,021 –58 29 –333 –21 4,878
– of which Life 4,486 281 36 — 4,377 –4,897 –55 3 — –19 4,212
Derivatives (net) –160 37 –18 — –1 — –37 443 –133 0 131
Investment properties 3,227 –1 27 — 222 –263 — — — –47 3,165
– of which Life 3,127 — 27 — 215 –237 — — — –47 3,085
G39 Assets and liabilities at fair value, cont.

Nordea Group – Other notes
Nordea Annual Report 2015142
G39 Assets and liabilities at fair value, cont.
Unrealised gains and losses relate to those assets and liabili-ties held at the end of the year. During 2014 Nordea trans-ferred shares of EUR 22m from Level 3 to Level 2. The reason for the transfer from Level 3 to Level 2 was that observable market data became available. Transfers between levels are considered to have occurred at the end of the year. Fair value gains and losses in the income statement during the year are included in “Net result from items at fair value” (see Note G5). Assets and liabilities related to derivatives are presented net.
The valuation processes for fair value measurements in Level 3Financial instrumentsNordea has an independent specialised valuation control unit, Group Valuation Control (GVC). GVC has the responsi-bility of setting the Nordea valuation framework as well as overseeing and independently assessing valuations of finan-cial instruments held at fair value on Nordea s balance sheet. GVC issues the Nordea Group Valuation Policy, which is approved by the Group Valuation Committee. The Group Val-uation Committee governs valuation matters and also serves as escalation point for valuation issues. Further escalation of valuation issues is addressed by the Assets and Liabilities Committee, which reports to the Board of Directors.
The valuation control process in Nordea consists of several steps. The first step is to determine the end of day (EOD) marking of mid-prices. It is the responsibility of the trading organisation to set correct prices used for the valuation pro-cess, these prices are either internally marked prices set by trading or externally sourced prices. These valuation prices and valuation approaches are then controlled and tested by independent control units. The cornerstone in the control process is the independent price verification (IPV). The IPV test comprises verification of the correctness of valuations by using independently sourced data that best reflects the mar-ket. Finally the results of valuation testing and valuations are analysed and any findings are escalated with valuation com-mittees as decision bodies.
The verification of the correctness of prices and other parameters is carried out daily. Third-party information, such as broker quotes and pricing services, is used as benchmark data in the verification. The quality of the benchmark data is assessed on a regular basis. This quality assessment is used in the measurement of the valuation uncertainty.
The valuation adjustment at portfolio level and the defer-rals of day 1 P/L on Level 3 trades are calculated and reported on a monthly basis. The actual assessment of instruments in the fair value hierarchy is performed on a continuous basis.
Investment propertiesThe main part of the investment properties in Nordea is held by Nordea Life and Pension (NLP). The valuation of the investment properties in NLP is performed quarterly by the real estate departments in each entity within NLP with full or partial assistance from external valuers. For the departments that use their own methodologies the changes in price levels of the properties are compared with valuations of similar properties assessed by external valuers. The result of the val-uation is presented to, and approved by, the local manage-ment in each entity. The CFO in each enitity within NLP is responsible for the approval of the concepts and for the values used. The principles used in all entities are in accordance with regulations provided by the local Financial Supervisory Authorities (FSA) which are in accordance with international valuation principles and in accordance with IFRS.
In addition there is an Investment Operation Committee (IOC) which is a joint forum focusing on valuation and accounting of investment operations issues within NLP. The entities within NLP report regularly to IOC and IOC report quarterly to the Nordea Group Valuation Committee.
Investment properties in NLP are backing the liabilities to policyholders in life insurance contracts, unit-linked contracts and investment contracts, which means that the impact on Nordea’s income statement and on shareholders’ equity depends on the financial buffers and the profit sharing agree-ments in the actual unit that owns the property.
Movements in Level 3, cont.Fair value gains/
losses recognised in the income statement
during the year
2014, EURm 1 Jan2014 Realised Unrealised
Recog-nised
in OCIPurchases/
Issues SalesSettle-ments
Transfers out of Level 3
Translation differences
31 Dec2014
Interest-bearing securities 478 8 10 –2 163 –373 –3 — –2 279
– of which Life 104 5 5 — 19 –78 — — –2 53
Shares 3,841 388 313 — 2,417 –1,441 –22 –22 –16 5,458
– of which Life 2,842 324 238 — 2,332 –1,196 –15 –22 –17 4,486
Derivatives (net) 37 –488 –197 — — — 488 — — –160
Investment properties 3,524 –1 –3 — 267 –462 — –33 –65 3,227
– of which Life 3,367 7 –3 — 241 –390 — –33 –62 3,127
Other liabilities 1 — — — — –1 — — — —

Other notes – Nordea Group
Nordea Annual Report 2015 143
G39 Assets and liabilities at fair value, cont.
Valuation techniques and inputs used in the fair value measurements in Level 3
31 Dec 2015, EURm Fair value Of which Life1 Valuation techniques Unobservable input Range of fair value
Interest-bearing securities
Mortgage and other credit institutions2 205 — Discounted cash fl ows Credit spread –5/5
Corporates 45 45 Discounted cash fl ows Credit spread –3/3
Total 250 45 –8/8
SharesPrivate equity funds 1,965 1,781 Net asset value3 –218/232
Hedge funds 474 298 Net asset value3 –31/37
Credit Funds 423 237 Net asset value/market consensus3 –23/28
Other funds 1,880 1,868 Net asset value/fund prices3 –223/224
Other 136 28 — –9/9
Total 4,878 4,212 –504/530
DerivativesInterest rate derivatives 180 — Option model Correlations –26/19
Volatilities
Equity derivatives –24 — Option model Correlations –26/19
Volatilities
Dividend
Foreign exchange derivatives –35 — Option model Correlations +/–0
Volatilities
Credit derivatives –18 — Credit derivative model Correlations –8/6
Recovery rates
Other 28 — Option model Correlations +/–0
Volatilities
Total 131 — –60/44
1) Investment in fi nancial instruments is a major part of the life insurance business, aquired to fulfi ll the obligations behind the insurance- and investment contracts. The gains or losses on these instruments are almost exclusively allocated to policyholders and do consequently not affect Nordea’s equity.
2) Of which EUR 155m is priced at a credit spread (the difference between the discount rate and LIBOR) of 1.45% and a resonable change of this credit spread would not affect the fair value due to callability features.
3) The fair values are based on prices and net assets values delivered by external suppliers/custodians. The prices are fi xed by the suppliers/custodians on the basis of the development in assets behind the investments. For private equity funds the dominant measurement methodology used by the suppliers/custodians, is consistent with the International Private Equity and Venture Capital Valuation (IPEV) guidelines issued by the EVCA (European Venture Capital Association). Less than 15% of the private equity fund investment are internally adjusted/valued based the IPEV guidelines. These carrying amounts are in a range of 0% to 100% compared to the values received from suppliers/custodians.
The table above shows, for each class of assets and liabilities cat-egorised in Level 3, the fair value, the valuation techniques used to estimate the fair value, significant unobservable inputs used in the valuation techniques and for financial assets and liabili-ties the fair value sensitivity to changes in key assumptions.
The column “range of fair value” in the tables above shows the sensitivity of the fair values of Level 3 financial instruments to changes in key assumptions. Where the exposure to an unobservable parameter is offset across different instruments then only the net impact is disclosed in the table. The ranges disclosed are likely to be greater than the true uncertainty in fair value of these instruments, as it is unlikely in practice that all unobservable parameters would be simultaneously at the extremes of their ranges of reasonably possible alterna-tives. The disclosure is neither predictive nor indicative of future movements in fair value.
In order to calculate the sensitivity (range) in fair value of derivatives a range of different modelling approaches are applied to determine an uncertainty interval around the
reported fair value. The different approaches applied target various aspects of derivatives pricing. Two common compo-nents of derivative valuation models are volatility of underly-ing risk factors and correlation between the relevant risk fac-tors. Each of these is addressed by applying different assumptions to input and/or the choice of modelling approach. Besides these common factors a number of asset class specific factors are addressed. These include equity divi-dend expectations, recovery assumptions for credit derivatives and inflation expectations. The fair values of derivatives are presented as the net of assets and liabilities.
In order to calculate the sensitivity (range) in fair value of shares and interest-bearing securities the fair value was increased and decreased within a total range of 2–10 percent-age units depending of the valuation uncertainty and under-lying assumptions. Higher ranges are applied to instruments with more uncertain valuations relative to actively traded instruments and underlying uncertainties in individual assumptions.

Nordea Group – Other notes
Nordea Annual Report 2015144
Valuation techniques and inputs used in the fair value measurements in Level 3
31 Dec 2014, EURm Fair value Of which Life1 Valuation techniques Unobservable input Range of fair value
Interest-bearing securities
Mortgage and other credit institutions2 235 9 Discounted cash fl ows Credit spread –8/8
Corporates 44 44 Discounted cash fl ows Credit spread –3/3
Total 279 53 –11/11
SharesPrivate equity funds 2,328 1,820 Net asset value3
Hedge funds 443 181 Net asset value3
Credit Funds 487 377 Net asset value/market consensus3
Other funds 1,970 1,950 Net asset value/Fund prices3
Other 230 158 —
Total 5,458 4,486 –542/575
DerivativesInterest rate derivatives 191 — Option model Correlations –13/9
Volatilities
Equity derivatives –220 — Option model Correlations –18/12
Volatilities
Dividend
Foreign exchange derivatives –31 — Option model Correlations +/–0
Volatilities
Credit derivatives –129 — Credit derivat model Correlations –10/9
Recovery rates
Other 29 — Option model Correlations +/–0
Volatilities
Total –160 − –41/30
1) Investment in fi nancial instruments is a major part of the life insurance business, aquired to fulfi ll the obligations behind the insurance- and investment contracts. The gains or losses on these instruments are almost exclusively allocated to policyholders and do consequently not affect Nordea’s equity.
2) Of which EUR 155m is priced at a credit spread (the difference between the discount rate and LIBOR) of 1.45% and a reasonable change of this credit spread would not affect the fair value due to callability features.
3) The fair values are based on prices and net assets values delivered by external suppliers/custodians. The prices are fi xed by the suppliers/custodians on the basis of the development in assets behind the investments. For private equity funds the dominant measurement methodology used by the suppliers/custodians, is consistent with the International Private Equity and Venture Capital Valuation (IPEV) guidelines issued by the EVCA (European Venture Capital Association). Less than 15% of the private equity fund investment are internally adjusted/valued based the IPEV guidelines. These carrying amounts are in a range of 0% to 95% compared to the values received from suppliers/custodians.
G39 Assets and liabilities at fair value, cont.

Other notes – Nordea Group
Nordea Annual Report 2015 145
Investment properties
31 Dec 2015, EURm Fair value1
Of which Life Valuation techniques Unobservable input
Range of unobservable input
Weighted average of unobservable input
Denmark 1,688 1,679 Discounted cash fl ows Market rent
Commercial 25–312 EUR/m2 159 EUR/m2
Offi ce 34–324 EUR/m2 110 EUR/m2
Apartment 65–245 EUR/m2 151 EUR/m2
Yield requirement
Commercial 6.4% – 9.5% 7.5%
Offi ce 4.3% – 9.5% 6.1%
Apartment 3.5% – 6.0% 3.9%
Norway 695 689 Discounted cash fl ows Market rent
Commercial 82–234 EUR/m2 170 EUR/m2
Offi ce 114–746 EUR/m2 205 EUR/m2
Apartment 151–151 EUR/m2 151 EUR/m2
Other 66–86 EUR/m2 67 EUR/m2
Yield requirement
Commercial 5.0% – 6.5% 5.5%
Offi ce 4.3% – 7.8% 5.5%
Apartment 5.6% – 5.6% 5.6%
Other 5.5% – 8.5% 7.9%
Finland 564 563 Discounted cash fl ows2 Market rent
Commercial 104–327 EUR/m2 177 EUR/m2
Offi ce 125–306 EUR/m2 187 EUR/m2
Apartment 186–237 EUR/m2 210 EUR/m2
Other 89–127 EUR/m2 97 EUR/m2
Yield requirement
Commercial 4.8% – 6.8% 5.8%
Offi ce 4.8% – 8.0% 6.4%
Apartment 4.0% – 6.0% 5.0%
Other 6.5% – 9.0% 7.8%
Sweden 154 154 Discounted cash fl ows2 Market rent
Commercial 117–195 EUR/m2 146 EUR/m2
Apartment 149–176 EUR/m2 156 EUR/m2
Other 65–66 EUR/m2 65 EUR/m2
Yield requirement
Commercial 5.8% – 6.8% 6.3%
Apartment 3.5% – 4.4% 3.7%
Other 7.0% – 7.8% 7.4%
Other 64 — Discounted cash fl ows —
Total 3,165 3,085
1) Split based on the valuation methodologies used in different countries. 2) The fair value is calculated by external valuers.
G39 Assets and liabilities at fair value, cont.

Nordea Group – Other notes
Nordea Annual Report 2015146
Investment properties
31 Dec 2014, EURm Fair value1
Of which Life Valuation techniques Unobservable input
Range of unobservable input
Weighted average of unobservable input
Denmark 1,656 1,645 Discounted cash fl ows Market rent
Commercial 26–235 EUR/m2 133 EUR/m2
Offi ce 28–377 EUR/m2 108 EUR/m2
Apartment 65–220 EUR/m2 140 EUR/m2
Yield requirement
Commercial 6.1%–9.0% 7.5%
Offi ce 4.6%–9.5% 6.0%
Apartment 3.5%–6.0% 5.0%
Norway 774 767 Discounted cash fl ows Market rent
Commercial 28–1,166 EUR/m2 271 EUR/m2
Offi ce 69–459 EUR/m2 227 EUR/m2
Apartment 166–238 EUR/m2 195 EUR/m2
Other 25–642 EUR/m2 91 EUR/m2
Yield requirement
Commercial 5.3%–8.5% 5.9%
Offi ce 5.0%–8.8% 6.3%
Apartment 5.5%–5.5% 5.5%
Other 7.3%–8.5% 7.8%
Finland 642 640 Discounted cash fl ows2 Market rent
Commercial 104–327 EUR/m2 177 EUR/m2
Offi ce 125–306 EUR/m2 187 EUR/m2
Apartment 186–237 EUR/m2 210 EUR/m2
Other 89–127 EUR/m2 97 EUR/m2
Yield requirement
Commercial 5.0%–7.0% 6.0%
Offi ce 5.0%–8.0% 6.5%
Apartment 4.5%–6.0% 5.3%
Other 6.5%–9.0% 7.8%
Sweden 75 75 Discounted cash fl ows2 Market rent
Commercial 122–191 EUR/m2 147 EUR/m2
Apartment 146–172 EUR/m2 153 EUR/m2
Other 64–64 EUR/m2 64 EUR/m2
Yield requirement
Commercial 6.3%–7.0% 6.7%
Apartment 4.0%–4.5% 4.1%
Other 7.0%–7.0% 7.0%
Other 80 — Discounted cash fl ows — — —
Total 3,227 3,127
1) Split based on the valuation methodologies used in different countries. 2) The fair value is calculated by external valuers.
The significant unobservable inputs used in the fair value measurement of the investment properties are market rent and yield requirement. Significant increases (decreases) in market rate or yield requirement in isolation would result in a significant lower (higher) fair value.
G39 Assets and liabilities at fair value, cont.

Other notes – Nordea Group
Nordea Annual Report 2015 147
Movements in deferred Da y 1 profitThe transaction price for financial instruments in some cases differs from the fair value at initial recognition measured using a valuation model, mainly due to that the transaction price is not established in an active market. If there are signif-icant unobservable inputs used in the valuation technique (Level 3), the financial instrument is recognised at the trans-action price and any difference between the transaction price and fair value at initial recognition measured using a valua-tion model (Day 1 profit) is deferred. For more information see, Note G1 “Accounting policies”. The table below shows the aggregate difference yet to be recognised in the income
Cash and balances with central banks The fair value of “Cash and balances with central banks” is, due to its short term nature, assumed to equal the carrying amount and is thus categorised into Level 3 in the fair value hierarchy.
LoansThe fair value of “Loans to central banks”, “Loans to credit institutions” and “Loans to the public” have been estimated by discounting the expected future cash flows with an assumed customer interest rate that would have been used on the mar-ket if the loans had been issued at the time of the measure-ment. The assumed customer interest rate is calculated as the benchmark interest rate plus the average margin on new lend-ing in Retail Banking and Wholesale Banking respectively.
The fair value measurement is categorised into Level 3 in the fair value hierarchy.
Interest-bearing securitiesThe fair value is EUR 2,984m (EUR 2,941m), of which EUR 2m (EUR 27m) is categorised in Level 1 and EUR 2,922m (EUR 2,914m) in Level 2 and EUR 60m (EUR 0m) in Level 3. The measurement principles follow those for similar instruments that are held at fair value on the balance sheet.
Other assets and prepaid expenses and accrued incomeThe balance sheet items “Other assets” and “Prepaid expenses and accrued income” consist of short receivables, mainly accrued interest receivables. The fair value is therefore considered to equal the carrying amount and is categorised into Level 3 in the fair value hierarchy.
statement at the beginning and end of the period and a recon-ciliation of how this aggregated difference has changed dur-ing the year (movements in deferred Day 1 profit).
Deferred day 1 profi t – derivatives EURm 2015 2014
Amount at beginning of year 36 38
Deferred profi t/loss on new transactions 9 9
Recognised in the income statement during the year –11 –11
Amount at end of year 34 36
Deposits and debt instrumentsThe fair value of ”Deposits by credit institutions”, “Deposits and borrowings from the public”, “Debt securities in issue” and “Subordinated liabilities” has been calculated as the car-rying amount adjusted for fair value changes in interest rate risk and in own credit risk. The fair value is categorised into Level 3 in the fair value hierarchy. The fair value changes related to interest rate risk is based on changes in relevant interest rates compared with corresponding nominal interest rate in the portfolios. The fair value changes in the credit risk is calculated as the difference between the credit spread in the nominal interest rate compared with the current spread that is observed in the market. This calculation is performed on an aggregated level for all long term issuances recognised in the balance sheet items “Debt securities in issue” and “Subordinated liabilities”. As the contractual maturity is short for “Deposits by credit institutions” and “Deposits and bor-rowing from the public” the changes in Nordea s own credit risk related to these items is assumed not to be significant. This is also the case for short term issuances recognised in the balance sheet items “Debt securities in issue” and “Subor-dinated liabilities”.
Other liabilities and accrued expenses and prepaid incomeThe balance sheet items “Other liabilities” and “Accrued expenses and prepaid income” consist of short-term liabili-ties, mainly liabilities on securities settlement. The fair value is therefore considered to be equal to the carrying amount and is categorised into Level 3 in the fair value hierarchy.
Financial assets and liabilities not held at fair value on the balance sheet
31 Dec 2015 31 Dec 2014
EURm Carrying amount Fair value Carrying amount Fair valueLevel in fair
value hierarchy
Assets not held at fair value on the balance sheetCash and balances with central banks 35,500 35,500 31,067 31,067 3
Loans 267,571 268,915 261,451 259,547 3
Interest-bearing securities 2,769 2,984 2,630 2,941 1,2,3
Other assets 2,698 2,698 4,590 4,590 3
Prepaid expenses and accrued income 968 968 1,123 1,123 3
Total 309,506 311,065 300,861 299,268
Liabilities not held at fair value on the balance sheetDeposits and debt instruments 360,563 360,448 348,644 350,087 3
Other liabilities 3,652 3,652 6,377 6,377 3
Accrued expenses and prepaid income 341 341 345 345 3
Total 364,556 364,441 355,366 356,809
G39 Assets and liabilities at fair value, cont.

Nordea Group – Other notes
Nordea Annual Report 2015148
Amounts not set off but subject to master netting agreements and similar agreements
31 Dec 2015, EURm
Gross recognised
financial assets1
Gross recog-nised financial
liabilities set off on the
balance sheet
Net carrying amount on
the balance sheet2
Financial instruments
Financial collateral received
Cash collateral received Net amount
Assets
Derivatives 207,514 –127,812 79,702 –60,192 – –9,828 9,682
Reverse repurchase agreements 60,734 –9,888 50,846 –16,491 –34,162 – 193
Securities borrowing agreements 4,765 – 4,765 – –4,765 – 0
Total 273,013 –137,700 135,313 –76,683 –38,927 –9,828 9,875
Amounts not set off but subject to master netting agreements and similar agreements
31 Dec 2015, EURm
Gross recognised
financial liabilities1
Gross recog-nised financial
liabilities set off on the
balance sheet
Net carrying amount on
the balance sheet2
Financial instruments
Financial collateral pledged
Cash collateral pledged Net amount
Liabilities
Derivatives 205,970 –127,812 78,158 –60,192 – –10,991 6,975
Repurchase agreements 46,372 –9,888 36,484 –16,491 –19,956 – 37
Securities lending agreements 1,402 – 1,402 – –1,402 – 0
Total 253,744 –137,700 116,044 –76,683 –21,358 –10,991 7,012
1) All amounts are measured at fair value.2) Reverse repurchase agreements and Securities borrowing agreements are on the balance sheet classified as Loans to central banks, Loans to credit institutions or Loans to the pub-
lic. Repurchase agreements and Securities lending agreements are on the balance sheet classified as Deposits by credit institution or as Deposits and borrowings from the public.
Amounts not set off but subject to master netting agreements and similar agreements
31 Dec 2014, EURm
Gross recognised
financial assets1
Gross recog-nised financial
liabilities set off on the
balance sheet
Net carrying amount on
the balance sheet2
Financial instruments
Financial collateral received
Cash collateral received Net amount
Assets
Derivatives 245,959 –141,572 104,387 –79,016 — –11,994 13,377
Reverse repurchase agreements 49,352 — 49,352 –19,299 –29,605 — 448
Securities borrowing agreements 5,272 — 5,272 — –5,272 — 0
Total 300,583 –141,572 159,011 –98,315 –34,877 –11,994 13,825
Amounts not set off but subject to master netting agreements and similar agreements
31 Dec 2014, EURm
Gross recognised
financial liabilities1
Gross recog-nised financial assets set off
on the balance sheet
Net carrying amount on
the balance sheet2
Financial instruments
Financial collateral pledged
Cash collateral pledged Net amount
Liabilities
Derivatives 237,562 –141,572 95,990 –79,016 — –10,360 6,614
Repurchase agreements 44,488 — 44,488 –19,299 –23,559 — 1,630
Securities lending agreements 2,778 — 2,778 — –2,778 — 0
Total 284,828 –141,572 143,256 –98,315 –26,337 –10,360 8,244
1) All amounts are measured at fair value.2) Reverse repurchase agreements and Securities borrowing agreements are on the balance sheet classified as Loans to central banks, Loans to credit institutions or Loans to the pub-
lic. Repurchase agreements and Securities lending agreements are on the balance sheet classified as Deposits by credit institution or as Deposits and borrowings from the public.
Enforceable master netting arrangements and similar agreementsThe fact that financial instruments are being accounted for on a gross basis on the balance sheet, would not imply that the financial instruments are not subject to master netting agree-ments or similar arrangements. Generally financial instru-ments (derivatives, repos and securities lending transactions),
would be subject to master netting agreements, and as a con-sequence Nordea would be allowed to benefit from netting in the case of default by its counter parties, in any calculations involving counterparty credit risk.
For a description of counterparty risk see section Risk, Liquidity and Capital management, in the Board of Directors’ report.
G40 Financial instruments set off on balance or subject to netting agreements

Other notes – Nordea Group
Nordea Annual Report 2015 149
G41 Discontinued operations
EURm 2015 2014
Net interest income — 28
Net fee and commission income — 0
Other operating income — 4
Total operating income — 32
Total operating expenses — –19
Net loan losses — –5
Operating profit — 8
Income tax expense — –4
Net profit for the period from discontinued operations — 4
Net result for the period recognised on the measurement at fair value — –19
Transaction and transition cost (including cost to sell) — –10
Net profit for the period from discontinued operations after meas-urement at fair value less cost to sell — –25
Discontinued operations relate to Nordea’s earlier announced decision to divest its Polish banking, financing and life insur-ance operations, including Nordea Bank Polska S.A., Nordea Finance Polska S.A. and Nordea Polska Towarzystwo Ubez-pieczen na Zycie S.A., to PKO Bank Polski. All regulatory approvals were received and the transaction closed during the second quarter 2014, when also the operations were derecognised. During the second quarter 2015 the scope of discontinued operations changed and the IT-operations
earlier classified as discontinued operations were reclassified to continuing operations. The disposal group is excluded from Note G2 “Segment reporting” as this is not part of the reporting to the Chief Operating Decision Maker (CODM). The majority of the business was previously reported in the Retail Banking Poland segment. The impact from discontin-ued operation on the other comprehensive income can be found in the statement of comprehensive income.

Nordea Group – Other notes
Nordea Annual Report 2015150
The Life Group and Nordea Bank Danmark A/S have assets and liabilities included on their balance sheet where customers are bearing the risk. Since the assets and liabilities legally belong to the entities, these assets and liabilities are included on the Group’s balance sheet.
EURm31 Dec
201531 Dec
2014
Assets
Interest-bearing securities 12,205 9,971
Shares 20,921 18,294
Other assets 1,411 860
Total assets 34,537 29,125
Liabilities
Deposits and borrowings from the public 4,293 4,287
Insurance contracts 12,236 11,025
Investment contracts 16,784 13,813
Other liabilities 1,224 —
Total liabilities 34,537 29,125
G43 Investments, customer bearing the risk
EURm31 Dec
201531 Dec
2014
Repurchase agreements
Interest-bearing securities 8,333 12,121
Securities lending agreements
Shares 8 30
Total 8,341 12,151
Liabilities associated with the assets
EURm31 Dec
201531 Dec
2014
Repurchase agreements
Deposits by credit institutions 6,288 7,291
Deposits and borrowings from the public 1,921 4,659
Securities lending agreements
Deposits by credit institutions 8 31
Total 8,217 11,981
Net 124 170
Transferred assets that are not derecognised in their entirety and associated liabilitiesAll assets transferred continue to be recognised on the balance sheet if Nordea is still exposed to changes in the fair value of the assets. This is the case for repurchase agreements and securities lending transactions.
Repurchase agreements are a form of collateralised bor-rowing where Nordea sells securities with an agreemement to repurchase them at a later date at a fixed price. The cash received is recognised as a deposit (liability). Securities deliv-ered under repurchase agreements are not derecognised from the balance sheet.
Securities lending transactions are transactions where Nordea lends securities it holds to a counterpart and receives a fee.
As both repurchase agreements and securities lending transactions result in that securities are returned to Nordea, all risks and rewards of the instruments transferred are retained by Nordea, although they are not available for Nordea during the period during which they are transferred. The counterparts in the transactions hold the securities as collateral, but have no recourse to other assets in Nordea.
The securities still reported on the balance sheet and the corresponding liabilities are measured at fair value.
G42 Transferred assets and obtained collaterals
Obtained collaterals which are permitted to be sold or repledgedNordea obtains collaterals under reverse repurchase and securities borrowing agreements which, under the terms of the agreements, can be sold or repledged. The transactions are conducted under standard agreements employed by financial markets participants. Generally, the agreements require additional collateral to be provided if the value of the securities falls below a predetermined level. Under standard terms for most repurchase transactions, the recipient of col-lateral has an unrestricted right to sell or repledge it, subject to returning equivalent securities on settlement of the trans-actions. The fair value of the securities obtained as collateral under reverse repurchase and securities borrowing agree-ments are disclosed below.
EURm31 Dec
201531 Dec
2014
Reverse repurchase agreements
Received collaterals which can be repledged or sold 38,819 47,165
– of which repledged or sold 19,447 36,676
Securities borrowing agreements
Received collaterals which can be repledged or sold 4,869 5,469
– of which repledged or sold 152 2,969
Total 43,688 52,634
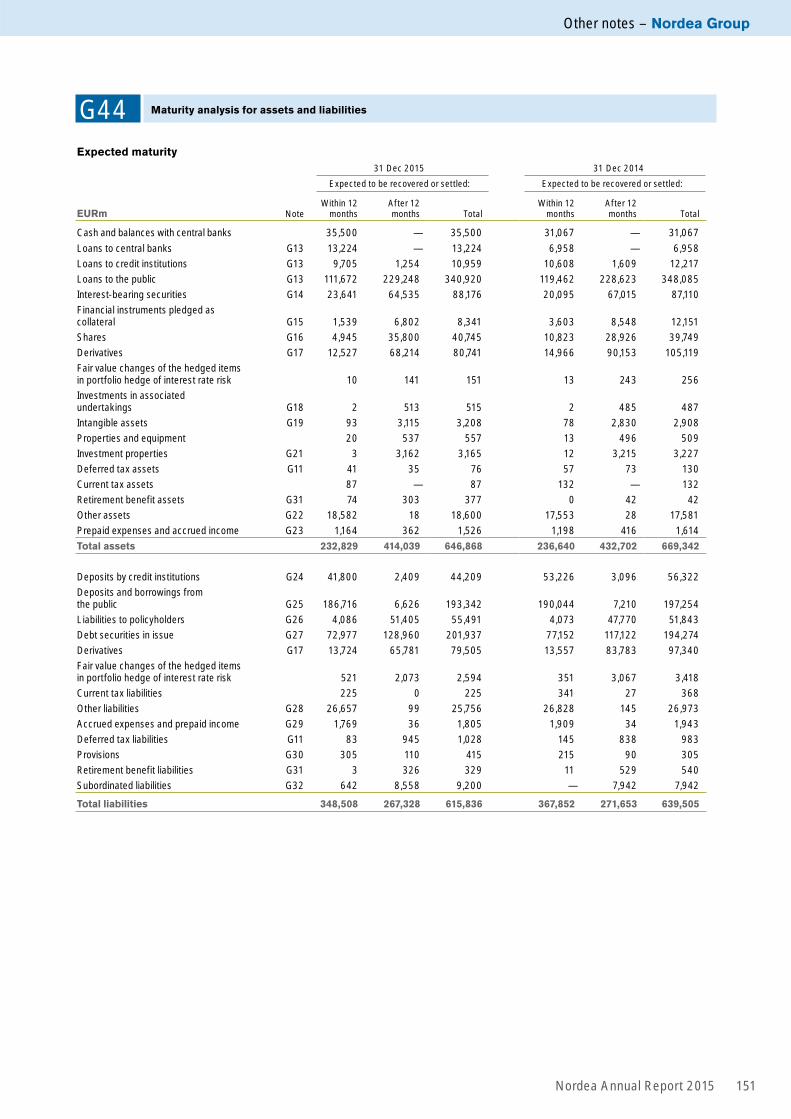
Other notes – Nordea Group
Nordea Annual Report 2015 151
G44 Maturity analysis for assets and liabilities
Expected maturity31 Dec 2015 31 Dec 2014
Expected to be recovered or settled: Expected to be recovered or settled:
EURm NoteWithin 12
monthsAfter 12 months Total
Within 12 months
After 12 months Total
Cash and balances with central banks 35,500 — 35,500 31,067 — 31,067
Loans to central banks G13 13,224 — 13,224 6,958 — 6,958
Loans to credit institutions G13 9,705 1,254 10,959 10,608 1,609 12,217
Loans to the public G13 111,672 229,248 340,920 119,462 228,623 348,085
Interest-bearing securities G14 23,641 64,535 88,176 20,095 67,015 87,110
Financial instruments pledged as collateral G15 1,539 6,802 8,341 3,603 8,548 12,151
Shares G16 4,945 35,800 40,745 10,823 28,926 39,749
Derivatives G17 12,527 68,214 80,741 14,966 90,153 105,119
Fair value changes of the hedged items in portfolio hedge of interest rate risk 10 141 151 13 243 256
Investments in associated undertakings G18 2 513 515 2 485 487
Intangible assets G19 93 3,115 3,208 78 2,830 2,908
Properties and equipment 20 537 557 13 496 509
Investment properties G21 3 3,162 3,165 12 3,215 3,227
Deferred tax assets G11 41 35 76 57 73 130
Current tax assets 87 — 87 132 — 132
Retirement benefit assets G31 74 303 377 0 42 42
Other assets G22 18,582 18 18,600 17,553 28 17,581
Prepaid expenses and accrued income G23 1,164 362 1,526 1,198 416 1,614
Total assets 232,829 414,039 646,868 236,640 432,702 669,342
Deposits by credit institutions G24 41,800 2,409 44,209 53,226 3,096 56,322
Deposits and borrowings from the public G25 186,716 6,626 193,342 190,044 7,210 197,254
Liabilities to policyholders G26 4,086 51,405 55,491 4,073 47,770 51,843
Debt securities in issue G27 72,977 128,960 201,937 77,152 117,122 194,274
Derivatives G17 13,724 65,781 79,505 13,557 83,783 97,340
Fair value changes of the hedged items in portfolio hedge of interest rate risk 521 2,073 2,594 351 3,067 3,418
Current tax liabilities 225 0 225 341 27 368
Other liabilities G28 26,657 99 25,756 26,828 145 26,973
Accrued expenses and prepaid income G29 1,769 36 1,805 1,909 34 1,943
Deferred tax liabilities G11 83 945 1,028 145 838 983
Provisions G30 305 110 415 215 90 305
Retirement benefit liabilities G31 3 326 329 11 529 540
Subordinated liabilities G32 642 8,558 9,200 — 7,942 7,942
Total liabilities 348,508 267,328 615,836 367,852 271,653 639,505

Nordea Group – Other notes
Nordea Annual Report 2015152
G44 Maturity analysis for assets and liabilities, cont.
Contractual undiscounted cash flows
31 Dec 2015, EURmPayable on
demandMaximum 3 months 3–12 months 1–5 years
More than 5 years Total
Interest-bearing financial assets 52,162 96,460 50,330 153,919 244,812 597,683
Non interest-bearing financial assets — — — — 67,601 67,601
Non-financial assets — — — — 9,748 9,748
Total assets 52,162 96,460 50,330 153,919 322,161 675,032
Interest-bearing financial liabilities 148,270 120,280 56,979 105,474 49,556 480,559
Non interest-bearing financial liabilities — — — — 46,097 46,097
Non-financial liabilities and equity — — — — 72,578 72,578
Total liabilities and equity 148,270 120,280 56,979 105,474 168,231 599,234
Derivatives, cash inflow — 526,203 115,018 57,379 14,915 713,515
Derivatives, cash outflow — 526,114 115,240 61,418 14,387 717,159
Net exposure − 89 —222 —4,039 528 —3,644
Exposure —96,108 —23,731 —6,871 44,406 154,458 72,154
Cumulative exposure —96,108 —119,839 —126,710 —82,304 72,154 −
31 Dec 2014, EURmPayable on
demandMaximum 3 months 3–12 months 1–5 years
More than 5 years Total
Interest-bearing financial assets 21,618 117,658 52,743 154,129 245,499 591,647
Non interest-bearing financial assets — — — — 57,627 57,627
Non-financial assets — — — — 9,737 9,737
Total assets 21,618 117,658 52,743 154,129 312,863 659,011
Interest-bearing financial liabilities 128,160 139,785 63,412 98,666 49,086 479,109
Non interest-bearing financial liabilities — — — — 43,844 43,844
Non-financial liabilities and equity — — — — 72,356 72,356
Total liabilities and equity 128,160 139,785 63,412 98,666 165,286 595,309
Derivatives, cash inflow — 416,856 127,842 228,299 75,117 848,114
Derivatives, cash outflow — 435,736 126,093 217,485 75,285 854,599
Net exposure − –18,880 1,749 10,814 –168 –6,485
Exposure –106,542 –41,007 –8,920 66,277 147,409 57,217
Cumulative exposure –106,542 –147,549 –156,469 –90,192 57,217 −
The table is based on contractual maturities for the balance sheet items. For derivatives, the expected cash inflows and outflows are disclosed for both derivative assets and deriva-tive liabilities, as derivatives are managed on a net basis. In addition to the instruments on the balance sheet items, Nordea has credit commitments amounting to EUR 71,340m (EUR 74,291m), which could be drawn on at any time. Nordea
has also issued guarantees of EUR 20,656m (EUR 19,838m) which may lead to future cash outflows if certain events occur.
For further information about remaining maturity, see also the section “Risk, Liquidity and Capital management”.

Other notes – Nordea Group
Nordea Annual Report 2015 153
Compensation and loans to key management personnelCompensation and loans to key management personnel are specified in Note G7.
Other related-party transactions Starting in March 2008 Nordea takes part in a guarantee con-sortium to support Norwegian Eksportfinans ASA in relation to its securities portfolio. Nordea owns 23% of the company with other owners being the Norwegian state and other Nordic banks. Nordea’s share of the negative fair value of the contract as of the balance sheet date amounts to approx. EUR 16m. The agreement’s expiring date corresponds with the maturity dates of the bonds included in the guarantee. The latest maturity is on 31 December 2023.
Associated undertakings
Other related parties1
EURm31 Dec
201531 Dec
201431 Dec
201531 Dec
2014
Assets
Loans 546 594 — —
Interest-bearing securities 73 59 — —
Derivatives 76 224 — —
Investments in associated undertakings 515 487 — —
Total assets 1,210 1,364 − −
Liabilities
Deposits 69 215 74 36
Derivatives 118 154 — —
Total liabilities 187 369 74 36
Off balance2 5,307 6,212 − −
Associated undertakings
Other related parties1
EURm 2015 2014 2015 2014
Net interest income 5 9 — —
Net fee and commission income 4 5 — 1
Net result from items at fair value 246 –90 — —
Profit before loan losses 255 –76 − 1
1) Shareholders with significant influence and close family members to key management personell in Nordea Group as well as companies significantly influenced by key man-agement personnel or by close family members to key management personnel in Nordea Group are considered to be related parties to Nordea. Included in this group of related parties are Sampo Oyj and Aegon Asset Management. If transactions with related companies are made in Nordea’s and the related companies’ ordinary course of business and on the same criteria and terms as those for comparable transactions with companies of similar standing, and if they did not involve more than normal risk-taking, the transactions are not included in the table. Nordea has thus not disclosed any transactions with shareholders with significant influence.
2) Including nominal values on derivatives.
G45 Related-party transactions
The information below is presented from a Nordea perspec-tive, meaning that the information shows the effect from related party transactions on the Nordea figures.
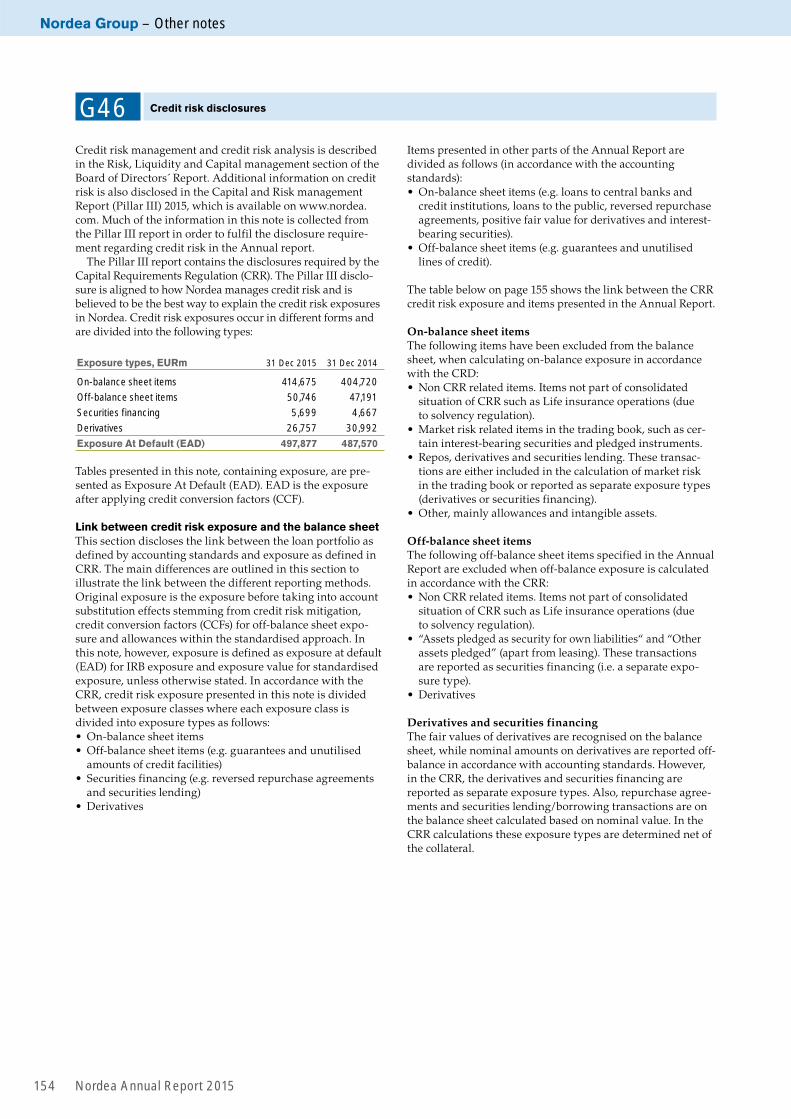
Nordea Group – Other notes
Nordea Annual Report 2015154
Credit risk management and credit risk analysis is described in the Risk, Liquidity and Capital management section of the Board of Directors´ Report. Additional information on credit risk is also disclosed in the Capital and Risk management Report (Pillar III) 2015, which is available on www.nordea. com. Much of the information in this note is collected from the Pillar III report in order to fulfil the disclosure require-ment regarding credit risk in the Annual report.
The Pillar III report contains the disclosures required by the Capital Requirements Regulation (CRR). The Pillar III disclo-sure is aligned to how Nordea manages credit risk and is believed to be the best way to explain the credit risk exposures in Nordea. Credit risk exposures occur in different forms and are divided into the following types:
Exposure types, EURm 31 Dec 2015 31 Dec 2014
On-balance sheet items 414,675 404,720
Off-balance sheet items 50,746 47,191
Securities financing 5,699 4,667
Derivatives 26,757 30,992
Exposure At Default (EAD) 497,877 487,570
Tables presented in this note, containing exposure, are pre-sented as Exposure At Default (EAD). EAD is the exposure after applying credit conversion factors (CCF).
Link between credit risk exposure and the balance sheetThis section discloses the link between the loan portfolio as defined by accounting standards and exposure as defined in CRR. The main differences are outlined in this section to illustrate the link between the different reporting methods. Original exposure is the exposure before taking into account substitution effects stemming from credit risk mitigation, credit conversion factors (CCFs) for off-balance sheet expo-sure and allowances within the standardised approach. In this note, however, exposure is defined as exposure at default (EAD) for IRB exposure and exposure value for standardised exposure, unless otherwise stated. In accordance with the CRR, credit risk exposure presented in this note is divided between exposure classes where each exposure class is divided into exposure types as follows:• On-balance sheet items• Off-balance sheet items (e.g. guarantees and unutilised
amounts of credit facilities)• Securities financing (e.g. reversed repurchase agreements
and securities lending)• Derivatives
G46 Credit risk disclosures
Items presented in other parts of the Annual Report are divided as follows (in accordance with the accounting standards):• On-balance sheet items (e.g. loans to central banks and
credit institutions, loans to the public, reversed repurchase agreements, positive fair value for derivatives and interest-bearing securities).
• Off-balance sheet items (e.g. guarantees and unutilised lines of credit).
The table below on page 155 shows the link between the CRR credit risk exposure and items presented in the Annual Report.
On-balance sheet itemsThe following items have been excluded from the balance sheet, when calculating on-balance exposure in accordance with the CRD:• Non CRR related items. Items not part of consolidated
situation of CRR such as Life insurance operations (due to solvency regulation).
• Market risk related items in the trading book, such as cer-tain interest-bearing securities and pledged instruments.
• Repos, derivatives and securities lending. These transac-tions are either included in the calculation of market risk in the trading book or reported as separate exposure types (derivatives or securities financing).
• Other, mainly allowances and intangible assets.
Off-balance sheet itemsThe following off-balance sheet items specified in the Annual Report are excluded when off-balance exposure is calculated in accordance with the CRR:• Non CRR related items. Items not part of consolidated
situation of CRR such as Life insurance operations (due to solvency regulation).
• “Assets pledged as security for own liabilities“ and “Other assets pledged” (apart from leasing). These transactions are reported as securities financing (i.e. a separate expo-sure type).
• Derivatives
Derivatives and securities financingThe fair values of derivatives are recognised on the balance sheet, while nominal amounts on derivatives are reported off-balance in accordance with accounting standards. However, in the CRR, the derivatives and securities financing are reported as separate exposure types. Also, repurchase agree-ments and securities lending/borrowing transactions are on the balance sheet calculated based on nominal value. In the CRR calculations these exposure types are determined net of the collateral.

Other notes – Nordea Group
Nordea Annual Report 2015 155
G46 Credit risk disclosures
31 Dec 2015, EURmOriginal
exposure Items related
to market risk
Repos, derivatives,
securities lending
Items excluded from CRR
scope of con-solidation Other Balance sheet
Cash and balances with central banks 35,500 — — — — 35,500
Loans to credit institutions and central banks 14,409 — 8,618 1,158 —2 24,183
Loans to the public 304,896 — 39,527 —4,386 883 340,920
Interest-bearing securities and pledged instruments 56,629 18,807 — 21,081 — 95,517
Derivatives1 — — 82,781 —2,040 — 80,741
Intangible assets — — — 342 2,866 3,208
Other assets and prepaid expenses 4,283 26,225 — 34,870 421 65,799
Total assets 415,717 45,032 130,926 51,025 4,168 646,868
Exposure at default2 414,675
1) Derivatives are included in banking and trading books, but not at book values. Counterparty risk in trading derivatives are included in the credit risk. 2) The on-balance exposure have a CCF of 100% but can still have a lower EAD due to provisions in the standardised approach, that are deducted from the original exposure when
calculating EAD.
31 Dec 2014, EURmOriginal
exposure Items related
to market risk
Repos, derivatives,
securities lending
Items excluded from CRR
scope of con-solidation Other Balance sheet
Cash and balances with central banks 31,067 — — — — 31,067
Loans to credit institutions and central banks 14,030 — 4,822 326 –3 19,175
Loans to the public 300,926 — 49,515 — –2,356 348,085
Interest-bearing securities and pledged instruments 53,432 24,181 — 21,648 — 99,261
Derivatives1 — — 104,999 120 — 105,119
Intangible assets — — — 324 2,584 2,908
Other assets and prepaid expenses 6,301 25,144 91 32,896 –705 63,727
Total assets 405,756 49,325 159,427 55,314 –480 669,342
Exposure at default2 404,720
1) Derivatives are included in banking and trading books, but not at book values. Counterparty risk in trading derivatives are included in the credit risk. 2) The on-balance exposure have a CCF of 100% but can still have a lower EAD due to provisions in the standardised approach, that are deducted from the original exposure when
calculating EAD.
On-balance sheet items
Off-balance sheet items
31 Dec 2015, EURm
Credit risk accordance
with CRR
Items excluded from CRR scope of consolidation
Included in derivatives
and securities financing
Off-balance
sheet
Contingent liabilities 22,541 28 — 22,569
Commitments 73,673 990 — 74,663
Total 96,214 1,018 − 97,232
31 Dec 2015, EURm
Credit risk accordance
with CRR
Items not included in
accountsOriginal
exposure
Average conversion
factorExposure at default EAD
Credit facilities 50,637 1,422 52,059 48% 24,760
Checking accounts 16,800 4,205 21,005 51% 10,786
Loan commitments 6,194 7,827 14,021 41% 5,692
Guarantees 21,012 — 21,012 44% 8,939
Other 1,571 27 1,598 36% 569
Total 96,214 13,481 109,695 50,746

Nordea Group – Other notes
Nordea Annual Report 2015156
G46 Credit risk disclosures
31 Dec 2014, EURm
Credit risk in accordance
with CRR
Items excluded from CRR scope of consolidation
Included in derivatives
and securities financing
Off-balance
sheet
Contingent liabilities 21,985 32 — 22,017
Commitments 75,032 875 28 75,935
Total 97,017 907 28 97,952
31 Dec 2014, EURm
Credit risk in accordance
with CRR
Items not included in
accountsOriginal
exposure
Average conversion
factorExposure
at default EAD
Credit facilities 50,777 437 51,214 48% 24,626
Checking accounts 18,161 3,960 22,121 50% 11,065
Loan commitments 6,091 7,246 13,337 36% 4,858
Guarantees 20,760 1 20,761 31% 6,335
Other 1,228 32 1,260 24% 307
Total 97,017 11,676 108,693 47,191
31 Dec 2015, EURmOn-balance sheet items
Off-balance sheet items
Securities financing Derivatives
Total exposure
Government, local authorities and central banks 76,620 1,074 713 4,418 82,825
Institutions 35,462 1,086 3,335 8,548 48,431
Corporate 126,266 34,021 1,111 13,416 174,814
Retail1 167,086 14,367 1 89 181,543
Other 9,241 198 539 286 10,264
Total exposure 414,675 50,746 5,699 26,757 497,877
31 Dec 2014, EURmOn-balance sheet items
Off-balance sheet items
Securities financing Derivatives
Total exposure
Government, local authorities and central banks 67,781 1,502 932 5,338 75,553
Institutions 37,940 968 2,751 9,994 51,653
Corporate 126,683 31,251 751 15,078 173,763
Retail1 163,051 13,263 — 141 176,455
Other 9,265 207 233 441 10,146
Total exposure 404,720 47,191 4,667 30,992 487,570
1) Includes exposures secured by real estate.
Exposure classes split by exposure type As of year-end 2015, 80% of the total credit risk exposure was calculated using the IRB approach. The main part of the exposure is within the IRB corporate and IRB retail portfolios. During 2015, total exposure slightly increased due to growth of the sovereign, retail and corporate portfolios.
Exposure split by geography and exposure classes Nordea is geographically well diversified and as of end 2015, no market accounts for more than 25% of the total exposure. The exposures in Denmark and Sweden represent 25% and 24% of the total exposure in Nordea respectively, while Fin-land accounts for 16% and Norway 13%.
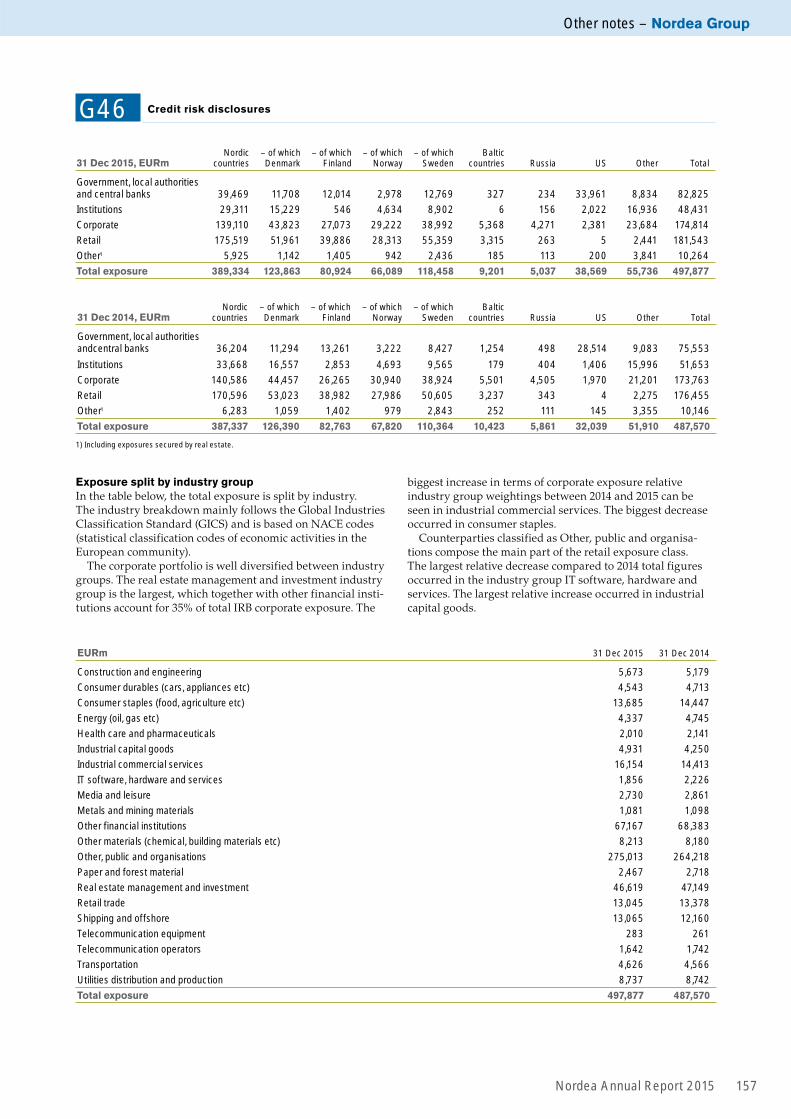
Other notes – Nordea Group
Nordea Annual Report 2015 157
EURm 31 Dec 2015 31 Dec 2014
Construction and engineering 5,673 5,179
Consumer durables (cars, appliances etc) 4,543 4,713
Consumer staples (food, agriculture etc) 13,685 14,447
Energy (oil, gas etc) 4,337 4,745
Health care and pharmaceuticals 2,010 2,141
Industrial capital goods 4,931 4,250
Industrial commercial services 16,154 14,413
IT software, hardware and services 1,856 2,226
Media and leisure 2,730 2,861
Metals and mining materials 1,081 1,098
Other financial institutions 67,167 68,383
Other materials (chemical, building materials etc) 8,213 8,180
Other, public and organisations 275,013 264,218
Paper and forest material 2,467 2,718
Real estate management and investment 46,619 47,149
Retail trade 13,045 13,378
Shipping and offshore 13,065 12,160
Telecommunication equipment 283 261
Telecommunication operators 1,642 1,742
Transportation 4,626 4,566
Utilities distribution and production 8,737 8,742
Total exposure 497,877 487,570
G46 Credit risk disclosures
Exposure split by industry group In the table below, the total exposure is split by industry. The industry breakdown mainly follows the Global Industries Classification Standard (GICS) and is based on NACE codes (statistical classification codes of economic activities in the European community).
The corporate portfolio is well diversified between industry groups. The real estate management and investment industry group is the largest, which together with other financial insti-tutions account for 35% of total IRB corporate exposure. The
biggest increase in terms of corporate exposure relative industry group weightings between 2014 and 2015 can be seen in industrial commercial services. The biggest decrease occurred in consumer staples.
Counterparties classified as Other, public and organisa-tions compose the main part of the retail exposure class. The largest relative decrease compared to 2014 total figures occurred in the industry group IT software, hardware and services. The largest relative increase occurred in industrial capital goods.
31 Dec 2014, EURmNordic
countries– of whichDenmark
– of whichFinland
– of whichNorway
– of whichSweden
Balticcountries Russia US Other Total
Government, local authorities andcentral banks 36,204 11,294 13,261 3,222 8,427 1,254 498 28,514 9,083 75,553
Institutions 33,668 16,557 2,853 4,693 9,565 179 404 1,406 15,996 51,653
Corporate 140,586 44,457 26,265 30,940 38,924 5,501 4,505 1,970 21,201 173,763
Retail 170,596 53,023 38,982 27,986 50,605 3,237 343 4 2,275 176,455
Other1 6,283 1,059 1,402 979 2,843 252 111 145 3,355 10,146
Total exposure 387,337 126,390 82,763 67,820 110,364 10,423 5,861 32,039 51,910 487,570
1) Including exposures secured by real estate.
31 Dec 2015, EURmNordic
countries– of whichDenmark
– of whichFinland
– of whichNorway
– of whichSweden
Balticcountries Russia US Other Total
Government, local authorities and central banks 39,469 11,708 12,014 2,978 12,769 327 234 33,961 8,834 82,825
Institutions 29,311 15,229 546 4,634 8,902 6 156 2,022 16,936 48,431
Corporate 139,110 43,823 27,073 29,222 38,992 5,368 4,271 2,381 23,684 174,814
Retail 175,519 51,961 39,886 28,313 55,359 3,315 263 5 2,441 181,543
Other1 5,925 1,142 1,405 942 2,436 185 113 200 3,841 10,264
Total exposure 389,334 123,863 80,924 66,089 118,458 9,201 5,037 38,569 55,736 497,877

Nordea Group – Other notes
Nordea Annual Report 2015158
Exposure secured by collaterals, guarantees and credit derivatives The guarantees used as credit risk mitigation are to a large extent issued by central and regional governments in the Nordic countries. Banks and insurance companies are also important guarantors of credit risk. Only eligible providers of guarantees and credit derivatives can be recognised in the standardised and IRB approach for credit risk. All central gov-ernments, regional governments and institutions are eligible as well as some multinational development banks and inter-national organisations. Corporate guarantees that have a credit assessment by an ECAI, or cases where institutions cal-
culate REA and expected loss amount under the IRB approach and are internally rated by the institutions, are eligible. Cen-tral governments and municipalities guarantee approximately 52% of the total guaranteed exposure. Exposure guarantee by these guarantors has an average risk weight of 0%. 2% of the total guaranteed exposure is guaranteed by IRB institutions. The remainder is guaranteed by IRB corporate guarantors. Credit derivatives are only used as credit risk protection to a very limited extent since the credit portfolio is considered to be well diversified. At the end of the year, approximately 43% (41%) of the total exposure was secured by eligible collateral. The relative share of collateralised exposure remains stable.
G46 Credit risk disclosures
31 Dec 2015, EURmOriginal
exposure EAD
– of which secured by guarantees
and credit derivatives
– of which secured by
collateral
Government, local authorities and central banks 82,345 82,825 551 —
Institutions 50,375 48,431 144 608
Corporate 222,486 174,814 11,551 67,611
Retail 191,986 181,543 2,054 143,507
Other 10,967 10,264 53 52
Total exposure 558,159 497,877 14,353 211,778
31 Dec 2014, EURmOriginal
exposure EAD
– of which secured by guarantees
and credit derivatives
– of which secured by
collateral
Government, local authorities and central banks 73,966 75,553 501 —
Institutions 54,139 51,653 524 543
Corporate 224,415 173,763 12,050 63,637
Retail 187,169 176,455 1,706 136,550
Other 10,640 10,146 16 42
Total exposure 550,329 487,570 14,797 200,772
31 Dec 2015 31 Dec 2014
Financial Collateral 1.3% 1.4%
Receivables 0.8% 0.9%
Residential Real Estate 71.8% 71.9%
Commercial Real Estate 17.4% 17.5%
Other Physical Collateral 8.7% 8.3%
Total 100.0% 100.0%
Collateral distribution The table below presents the distribution of collateral used in the capital adequacy calculation process. The table shows real estate to constitute a major share of eligible collateral in rela-tive terms. The other physical collateral category saw an increase during the year while residential and commercial
real estate, receivables and financial collateral decreased in relative. Real estate is commonly used as collateral for credit risk mitigation purposes. There is no concentration of real estate collateral to any particular region within the Nordic and Baltic countries. Other physical collateral consists mainly of ships.

Other notes – Nordea Group
Nordea Annual Report 2015 159
31 Dec 2015 31 Dec 2014
Nominal, EURmBought
protectionSold
protectionBought
protectionSold
protection
CDOs, gross 788 2,418 1,204 2,155
Hedged exposures 754 754 1,005 1,005
CDOs, net2 343 1,6644 1993 1,1504
– of which Equity 3 509 20 355
– of which Mezzanine 10 626 98 512
– of which Senior 21 529 81 283
1) First-to-Default swaps are not classified as CDOs and are therefore not included in the table. Net bought protection amounts to EUR 15m (EUR 47m) and net sold protection to EUR 64m (EUR 46m). Both bought and sold protection are, to the predominant part, investment grade.
2) Net exposure disregards exposure where tranches are completely identical in terms of reference pool attachment, detachment, maturity and currency.3) Of which investment grade EUR 0m (EUR 54m) and sub investment grade EUR 34m (EUR 145m).4) Of which investment grade EUR 604m (EUR 457m) and sub investment grade EUR 962m (EUR 600m) and not rated EUR 98m (EUR 93m).
G46 Credit risk disclosures
31 Dec 2015 31 Dec 2014
Retail mortgage exposure EURbn % EURbn %
<50% 105.3 78 98.2 77
50–70% 21.4 16 20.8 16
70–80% 5.1 4 5.4 4
80–90% 1.7 1 2.1 2
>90% 0.8 1 1.1 1
Total 134.3 100 127.6 100
Collateralised Debt Obligations (CDO) – Exposure1
Nordea acts as an intermediary in the credit derivatives market, especially in Nordic names. Nordea also uses credit deriva-tives to hedge positions in corporate bonds and synthetic CDOs. When Nordea sells protection in a CDO transaction, it carries the risk of losses in the reference portfolio if a credit event occurs. When Nordea buys protection in a CDO trans-action, any losses in the reference portfolio triggered by a credit event are carried by the seller of protection.
Credit derivative transactions create counterparty credit risk in a similar manner to other derivative trans-actions. Counterparties in these transactions are typically subject to a financial collateral agreement, where the exposure is covered daily by collateral placements.
CDO valuations are subject to fair value adjustments for model risk. These fair value adjustments are recog-nised in the income statement.
Loan-to-value distribution A common way to analyse the value of the collateral is to meas-ure the loan to value (LTV) ratio, i.e. the credit extended divided by the market value of the collateral pledged. In the
table below, the retail mortgage exposures are distributed by LTV range up to the top LTV bucket based on the LTV ratio. In 2015, the retail mortgage exposure remained stable including the LTV bucket representing LTV below 50%.
Forbearance
EURm 31 Dec 2015 31 Dec 2014
Forborne loans 5,568 6,165
– of which defaulted 2,466 2,697
Allowances for individually assessed impaired and forborne loans 1,050 1,070
– of which defaulted 1,050 1,070
Key ratios 31 Dec 2015 31 Dec 2014
Forberance ratio1 1.5% 1.7%
Forbearance coverage ratio2 19% 17%
– of which defaulted 43% 40%
1) Forborne loans / Loans before allowances.2) Individual allowances / Forborne loans.
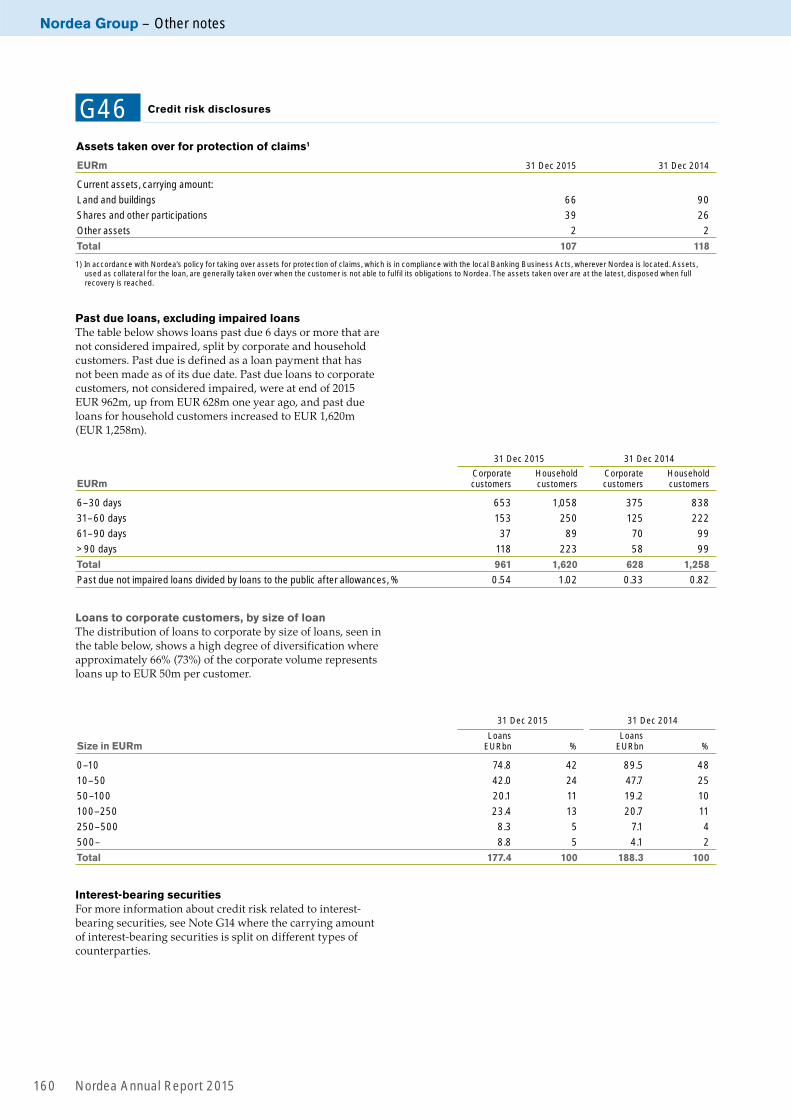
Nordea Group – Other notes
Nordea Annual Report 2015160
G46 Credit risk disclosures
31 Dec 2015 31 Dec 2014
EURmCorporate customers
Household customers
Corporate customers
Household customers
6–30 days 653 1,058 375 838
31–60 days 153 250 125 222
61–90 days 37 89 70 99
>90 days 118 223 58 99
Total 961 1,620 628 1,258
Past due not impaired loans divided by loans to the public after allowances, % 0.54 1.02 0.33 0.82
31 Dec 2015 31 Dec 2014
Size in EURmLoans
EURbn %Loans
EURbn %
0–10 74.8 42 89.5 48
10–50 42.0 24 47.7 25
50–100 20.1 11 19.2 10
100–250 23.4 13 20.7 11
250–500 8.3 5 7.1 4
500– 8.8 5 4.1 2
Total 177.4 100 188.3 100
Past due loans, excluding impaired loans The table below shows loans past due 6 days or more that are not considered impaired, split by corporate and household customers. Past due is defined as a loan payment that has not been made as of its due date. Past due loans to corporate customers, not considered impaired, were at end of 2015 EUR 962m, up from EUR 628m one year ago, and past due loans for household customers increased to EUR 1,620m (EUR 1,258m).
Loans to corporate customers, by size of loan The distribution of loans to corporate by size of loans, seen in the table below, shows a high degree of diversification where approximately 66% (73%) of the corporate volume represents loans up to EUR 50m per customer.
Interest-bearing securities For more information about credit risk related to interest-bearing securities, see Note G14 where the carrying amount of interest-bearing securities is split on different types of counterparties.
EURm 31 Dec 2015 31 Dec 2014
Current assets, carrying amount:
Land and buildings 66 90
Shares and other participations 39 26
Other assets 2 2
Total 107 118
1) In accordance with Nordea’s policy for taking over assets for protection of claims, which is in compliance with the local Banking Business Acts, wherever Nordea is located. Assets, used as collateral for the loan, are generally taken over when the customer is not able to fulfil its obligations to Nordea. The assets taken over are at the latest, disposed when full recovery is reached.
Assets taken over for protection of claims1
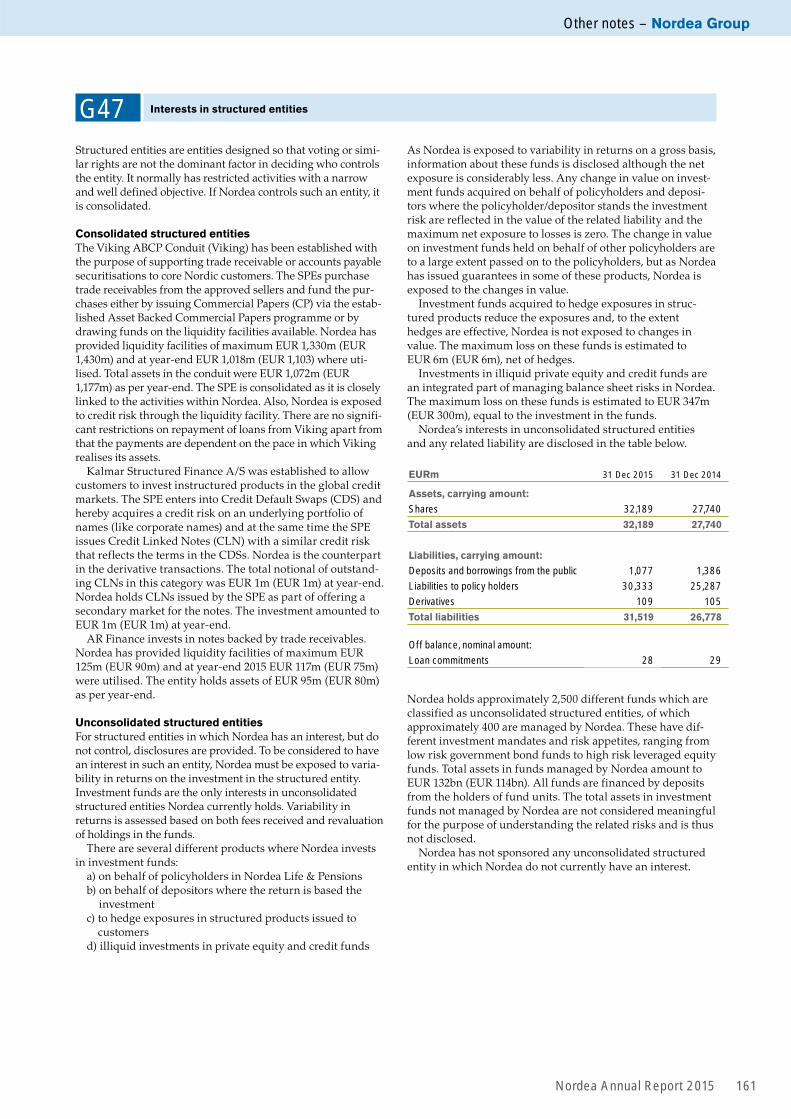
Other notes – Nordea Group
Nordea Annual Report 2015 161
Structured entities are entities designed so that voting or simi-lar rights are not the dominant factor in deciding who controls the entity. It normally has restricted activities with a narrow and well defined objective. If Nordea controls such an entity, it is consolidated.
Consolidated structured entitiesThe Viking ABCP Conduit (Viking) has been established with the purpose of supporting trade receivable or accounts payable securitisations to core Nordic customers. The SPEs purchase trade receivables from the approved sellers and fund the pur-chases either by issuing Commercial Papers (CP) via the estab-lished Asset Backed Commercial Papers programme or by drawing funds on the liquidity facilities available. Nordea has provided liquidity facilities of maximum EUR 1,330m (EUR 1,430m) and at year-end EUR 1,018m (EUR 1,103) where uti-lised. Total assets in the conduit were EUR 1,072m (EUR 1,177m) as per year-end. The SPE is consolidated as it is closely linked to the activities within Nordea. Also, Nordea is exposed to credit risk through the liquidity facility. There are no signifi-cant restrictions on repayment of loans from Viking apart from that the payments are dependent on the pace in which Viking realises its assets.
Kalmar Structured Finance A/S was established to allow customers to invest instructured products in the global credit markets. The SPE enters into Credit Default Swaps (CDS) and hereby acquires a credit risk on an underlying portfolio of names (like corporate names) and at the same time the SPE issues Credit Linked Notes (CLN) with a similar credit risk that reflects the terms in the CDSs. Nordea is the counterpart in the derivative transactions. The total notional of outstand-ing CLNs in this category was EUR 1m (EUR 1m) at year-end. Nordea holds CLNs issued by the SPE as part of offering a secondary market for the notes. The investment amounted to EUR 1m (EUR 1m) at year-end.
AR Finance invests in notes backed by trade receivables. Nordea has provided liquidity facilities of maximum EUR 125m (EUR 90m) and at year-end 2015 EUR 117m (EUR 75m) were utilised. The entity holds assets of EUR 95m (EUR 80m)as per year-end.
Unconsolidated structured entitiesFor structured entities in which Nordea has an interest, but do not control, disclosures are provided. To be considered to have an interest in such an entity, Nordea must be exposed to varia-bility in returns on the investment in the structured entity. Investment funds are the only interests in unconsolidated structured entities Nordea currently holds. Variability in returns is assessed based on both fees received and revaluation of holdings in the funds.
There are several different products where Nordea invests in investment funds:
a) on behalf of policyholders in Nordea Life & Pensionsb) on behalf of depositors where the return is based the
investmentc) to hedge exposures in structured products issued to
customersd) illiquid investments in private equity and credit funds
G47 Interests in structured entities
As Nordea is exposed to variability in returns on a gross basis, information about these funds is disclosed although the net exposure is considerably less. Any change in value on invest-ment funds acquired on behalf of policyholders and deposi-tors where the policyholder/depositor stands the investment risk are reflected in the value of the related liability and the maximum net exposure to losses is zero. The change in value on investment funds held on behalf of other policyholders are to a large extent passed on to the policyholders, but as Nordea has issued guarantees in some of these products, Nordea is exposed to the changes in value.
Investment funds acquired to hedge exposures in struc-tured products reduce the exposures and, to the extent hedges are effective, Nordea is not exposed to changes in value. The maximum loss on these funds is estimated to EUR 6m (EUR 6m), net of hedges.
Investments in illiquid private equity and credit funds are an integrated part of managing balance sheet risks in Nordea. The maximum loss on these funds is estimated to EUR 347m (EUR 300m), equal to the investment in the funds.
Nordea’s interests in unconsolidated structured entities and any related liability are disclosed in the table below.
EURm 31 Dec 2015 31 Dec 2014
Assets, carrying amount:
Shares 32,189 27,740
Total assets 32,189 27,740
Liabilities, carrying amount:
Deposits and borrowings from the public 1,077 1,386
Liabilities to policy holders 30,333 25,287
Derivatives 109 105
Total liabilities 31,519 26,778
Off balance, nominal amount:
Loan commitments 28 29
Nordea holds approximately 2,500 different funds which are classified as unconsolidated structured entities, of which approximately 400 are managed by Nordea. These have dif-ferent investment mandates and risk appetites, ranging from low risk government bond funds to high risk leveraged equity funds. Total assets in funds managed by Nordea amount to EUR 132bn (EUR 114bn). All funds are financed by deposits from the holders of fund units. The total assets in investment funds not managed by Nordea are not considered meaningful for the purpose of understanding the related risks and is thus not disclosed.
Nordea has not sponsored any unconsolidated structured entity in which Nordea do not currently have an interest.

Nordea Group – Other notes
Nordea Annual Report 2015162
G48 Country by country reporting
In accordance with the requirements under FFFS 2008:25, the table below presents for each country where Nordea is estab-lished, i.e. where Nordea has a physical presence, information about the businesses, the geografical area, averages number of employees, total operating income, operating profit and
income tax expense. Nordea is considered to have physical presence in a country if Nordea has a subsidiary, associated undertaking or branch in that country. Nordea has not received any significant government subsidies.
2015 2014
Country Business1Geographical area
Average number of
employees
Total operating income2,
EURm
Operating profit,
EURm
Income tax
expense, EURm
Average number of
employees
Total operating income2,
EURm
Operating profit,
EURm
Income tax
expense, EURm
Denmark RB, WB, AM, LP Denmark 8,288 2,602 914 –202 8,255 2,974 1,130 –161
Finland RB, WB, AM, LP Finland 6,946 2,605 1,535 –358 6,971 2,197 1,136 –222
Sweden RB, WB, AM, LP Sweden 6,957 2,893 773 –130 6,963 2,963 706 –205
Norway RB, WB, AM, LP Norway 3,137 1,584 835 –180 3,238 1,732 900 –238
Russia WB Russia 1,085 182 94 –22 1,418 203 92 –20
Poland Other Poland 1,197 62 0 –2 931 15 –40 7
Estonia RB, WB, LP Estonia 480 90 60 –12 486 61 27 –3
Latvia RB, WB Latvia 436 76 28 –6 431 64 –49 –3
Luxembourg AM, LP Luxembourg 393 313 211 –64 373 252 143 –42
Lithuania RB, WB, LP Lithuania 360 38 14 –2 351 52 21 –4
United States RB, WB, AM, LP New York 110 147 95 –31 118 134 94 –45
United Kingdom RB, WB, AM, LP London 82 128 88 –17 75 103 71 0
Singapore WB Singapore 86 51 28 –5 85 51 50 –8
Germany WB, AM Frankfurt 58 33 24 –9 57 37 23 –5
Switzerland AM Zürich 32 14 4 –1 30 13 2 0
China WB Shanghai 29 7 1 –1 28 6 1 –1
Brazil WB Sao Paolo 5 2 0 0 4 1 0 0
Eliminations3 — –686 — — — –617 — —
Total 29,681 10,141 4,704 –1,042 29,814 10,241 4,307 –950
1) RB=Retail banking, WB=Wholesale banking, AM=Asset management, LP= Life and pension.2) Total operating income presented in this table is split on countries based on where Nordea has a physical presence, i.e. where Nordea has a subsidiary, associated undertaking
or branch, while total operating profit presented in Note G2 is split on countries based on the location of the customers´ operations.3) Eliminations of transactions consist mainly of intra-group IT-services.

Other notes – Nordea Group
Nordea Annual Report 2015 163
G48 Country by country reporting, cont.
In accordance with the requirements under FFFS 2008:25 Nordea also discloses the names of the subsidiaries, associ-ated undertakings and branches for each country where Nordea is established. These disclosures are presented in the table below, in the table “Specification of group undertakings 31 December 2015” in Note G37 and in the last table in Note G18.
Denmark Nordea Liv & Pension, Livforsikringsselskab A/S Nordea Investment Management AB, Denmark Branch Nordea, Filial af Nordea Bank AB (publ), Sverige Finland Nordea Life Assurance Finland Ltd Nordea Investment Management AB, Finland Branch Nordea Fund Management, filial af Nordea funds Oy, FinlandNordea Bank AB (publ) Finnish Branch Sweden Nordea Life Holding AB Nordea Livförsäkring Sverige AB (publ) Nordea Funds Ab, Svensk Filial
Norway Nordea Liv Holding Norge AS Livforsikringsselskapet Nordea Liv Norge AS Nordea Investment Management AB, Norway Branch Nordea Funds, Norwegian Branch Nordea Bank AB (publ), Norsk avdelning av utenlandsk foretak Estonia Nordea Bank AB Estonia Branch
Latvia Nordea Bank AB Latvia Branch
Lithuania Nordea Bank AB Lithuania Branch
Germany Nordea Bank AB Frankfurt Branch
China Nordea Bank AB Shanghai Branch
Poland Nordea Bank AB Spólka Akcyjna Oddział w Połsce Singapore Nordea Bank Finland Plc, Singapore Branch Switzerland Nordea Bank S.A., Zürich Branch
United Kingdom Nordea Bank AB London Branch
United StatesNordea Bank Finland Plc, New York and Cayman Islands Branch

Parent company – Financial statements
Nordea Annual Report 2015164
Financial statements, Parent company – Contents Income statement. . . . . . . . . . . . . . . . . . . . . . . . . . . . . . . . . . . . . . . . . . . . . . . . . . . . . . . 165
Statement of comprehensive income. . . . . . . . . . . . . . . . . . . . . . . . . . . . 165
Balance sheet . . . . . . . . . . . . . . . . . . . . . . . . . . . . . . . . . . . . . . . . . . . . . . . . . . . . . . . . . . . . 166
Statement of changes in equity . . . . . . . . . . . . . . . . . . . . . . . . . . . . . . . . . . . 167
Cash flow statement . . . . . . . . . . . . . . . . . . . . . . . . . . . . . . . . . . . . . . . . . . . . . . . . . . . 169
5 year overview . . . . . . . . . . . . . . . . . . . . . . . . . . . . . . . . . . . . . . . . . . . . . . . . . . . . . . . . . . .171
Ratios and key figures. . . . . . . . . . . . . . . . . . . . . . . . . . . . . . . . . . . . . . . . . . . . . . . . . 172
Notes to the financial statements
Accounting policies
P1 Accounting policies. . . . . . . . . . . . . . . . . . . . . . . . . . . . . . . . . . . . . . . . . . . .173
Notes to the income statement
P2 Segment reporting. . . . . . . . . . . . . . . . . . . . . . . . . . . . . . . . . . . . . . . . . . . . .174
P3 Net interest income . . . . . . . . . . . . . . . . . . . . . . . . . . . . . . . . . . . . . . . . . . .174
P4 Net fee and commission income . . . . . . . . . . . . . . . . . . . . . . . . .175
P5 Net result from items at fair value . . . . . . . . . . . . . . . . . . . . . . .175
P6 Dividends. . . . . . . . . . . . . . . . . . . . . . . . . . . . . . . . . . . . . . . . . . . . . . . . . . . . . . . . . .175
P7 Other operating income. . . . . . . . . . . . . . . . . . . . . . . . . . . . . . . . . . . . . .175
P8 Staff costs . . . . . . . . . . . . . . . . . . . . . . . . . . . . . . . . . . . . . . . . . . . . . . . . . . . . . . .176
P9 Other expenses . . . . . . . . . . . . . . . . . . . . . . . . . . . . . . . . . . . . . . . . . . . . . . . . 177
P10 Depreciation, amortisation and impairment charges of tangible and intangible assets . . . . . . . . . . . 177
P11 Net loan losses. . . . . . . . . . . . . . . . . . . . . . . . . . . . . . . . . . . . . . . . . . . . . . . . . 177
P12 Appropriations . . . . . . . . . . . . . . . . . . . . . . . . . . . . . . . . . . . . . . . . . . . . . .178
P13 Taxes. . . . . . . . . . . . . . . . . . . . . . . . . . . . . . . . . . . . . . . . . . . . . . . . . . . . . . . . . . . . . . . .178
Notes to the balance sheet and memorandum items
P14 Treasury bills . . . . . . . . . . . . . . . . . . . . . . . . . . . . . . . . . . . . . . . . . . . . . . . . . . . .178
P15 Loans and impairment. . . . . . . . . . . . . . . . . . . . . . . . . . . . . . . . . . . . . . . 179
P16 Interest-bearing securities. . . . . . . . . . . . . . . . . . . . . . . . . . . . . . . . . 180
P17 Financial instruments pledged as collateral. . . . . . . . . 180
P18 Shares . . . . . . . . . . . . . . . . . . . . . . . . . . . . . . . . . . . . . . . . . . . . . . . . . . . . . . . . . . . . . 180
P19 Derivatives and hedge accounting. . . . . . . . . . . . . . . . . . . . . . .181
P20 Investments in group undertakings . . . . . . . . . . . . . . . . . . . . 183
P21 Investments in associated undertakings . . . . . . . . . . . . . 184
P22 Intangible assets . . . . . . . . . . . . . . . . . . . . . . . . . . . . . . . . . . . . . . . . . . . . . . 185
P23 Properties and equipment . . . . . . . . . . . . . . . . . . . . . . . . . . . . . . . . . 186
P24 Other assets . . . . . . . . . . . . . . . . . . . . . . . . . . . . . . . . . . . . . . . . . . . . . . . . . . . . 186
P25 Prepaid expenses and accrued income . . . . . . . . . . . . . . 187
P26 Deposits by credit institutions . . . . . . . . . . . . . . . . . . . . . . . . . . . . 187
P27 Deposits and borrowings from the public . . . . . . . . . . . . 187
P28 Debt securities in issue . . . . . . . . . . . . . . . . . . . . . . . . . . . . . . . . . . . . 187
P29 Other liabilities . . . . . . . . . . . . . . . . . . . . . . . . . . . . . . . . . . . . . . . . . . . . . . . . . 187
P30 Accrued expenses and prepaid income . . . . . . . . . . . . . . 187
P31 Provisions . . . . . . . . . . . . . . . . . . . . . . . . . . . . . . . . . . . . . . . . . . . . . . . . . . . . . . . . 187
P32 Retirement benefit obligations . . . . . . . . . . . . . . . . . . . . . . . . . . . 188
P33 Subordinated liabilities . . . . . . . . . . . . . . . . . . . . . . . . . . . . . . . . . . . . . . 188
P34 Untaxed reserves . . . . . . . . . . . . . . . . . . . . . . . . . . . . . . . . . . . . . . . . . . . . . 188
P35 Assets pledged as security for own liabilities . . . . . . 189
P36 Other assets pledged. . . . . . . . . . . . . . . . . . . . . . . . . . . . . . . . . . . . . . . . 189
P37 Contingent liabilities . . . . . . . . . . . . . . . . . . . . . . . . . . . . . . . . . . . . . . . . . 189
P38 Commitments. . . . . . . . . . . . . . . . . . . . . . . . . . . . . . . . . . . . . . . . . . . . . . . . . . . 189
Other notes
P39 Capital adequacy . . . . . . . . . . . . . . . . . . . . . . . . . . . . . . . . . . . . . . . . . . . . . . 190
P40 Classification of financial instruments . . . . . . . . . . . . . . . . 200
P41 Assets and liabilities at fair value. . . . . . . . . . . . . . . . . . . . . . . . 202
P42 Financial instruments set off on balanceor subject to netting agreements . . . . . . . . . . . . . . . . . . . . . . . 206
P43 Assets and liabilities in foreign currencies . . . . . . . . . . 207
P44 Transferred assets and obtained collaterals . . . . . . . . 207
P45 Maturity analysis for assets and liabilities . . . . . . . . . . . 208
P46 Related-party transactions . . . . . . . . . . . . . . . . . . . . . . . . . . . . . . . . .210

Financial statements – Parent company
Nordea Annual Report 2015 165
EURm Note 2015 2014
Operating income
Interest income 1,607 1,942
Interest expense –1,031 –1,293
Net interest income P3 576 649
Fee and commission income 1,094 1,093
Fee and commission expense –273 –273
Net fee and commission income P4 821 820
Net result from items at fair value P5 136 186
Dividends P6 2,176 2,333
Other operating income P7 833 975
Total operating income 4,542 4,963
Operating expenses
General administrative expenses:
Staff costs P8 –1,196 –1,070
Other expenses P9 –851 –904
Depreciation, amortisation and impairment charges of tangible and intangible assets P10, P22, P23 –140 –261
Total operating expenses –2,187 –2,235
Profit before loan losses 2,355 2,728
Net loan losses P11 –143 –98
Impairment of securities held as financial non-current assets P20 –9 –15
Operating profit 2,203 2,615
Appropriations P12 2 –1
Income tax expense P13 –285 –189
Net profit for the year 1,920 2,425
Income statement, Parent company
Statement of comprehensive incomeEURm 2015 2014
Net profit for the year 1,920 2,425
Items that may be reclassified subsequently to the income statement
Currency translation differences during the year –4 2
Available for sale investments1:
Valuation gains/losses during the year –55 6
Tax on valuation gains/losses during the year 12 –1
Transferred to the income statement during the year –4 0
Tax on transfers to the income statement during the year 1 0
Cash flow hedges:
Valuation gains/losses during the year 181 140
Tax on valuation gains/losses during the year –40 –31
Transferred to the income statement during the year –154 –139
Tax on transfers to the income statement during the year 34 31
Items that may not be reclassified subsequently to the income statement
Defined benefit plans:
Remeasurement of benefit plans during the year 12 –11
Tax on remeasurement of benefit plans during the year –3 2
Other comprehensive income, net of tax –20 –1
Total comprehensive income 1,900 2,424
1) Valuation gains/losses related to hedged risks under fair value hedge accounting are accounted for directly in the income statement.

Parent company – Financial statements
Nordea Annual Report 2015166
Balance sheet, Parent company
EURm Note31 Dec
201531 Dec
2014
Assets
Cash and balances with central banks 75 931
Treasury bills P14 6,905 5,035
Loans to credit institutions P15 90,009 86,704
Loans to the public P15 45,820 39,809
Interest-bearing securities P16 12,163 11,321
Financial instruments pledged as collateral P17 – 43
Shares P18 2,363 6,061
Derivatives P19 5,011 5,981
Fair value changes of the hedged items in portfolio hedge of interest rate risk 1 1
Investments in group undertakings P20 19,394 16,986
Investments in associated undertakings P21 7 7
Intangible assets P22 1,091 758
Properties and equipment P23 138 119
Deferred tax assets P13 26 14
Current tax assets 3 50
Other assets P24 4,387 3,727
Prepaid expenses and accrued income P25 780 884
Total assets 188,173 178,431
Liabilities
Deposits by credit institutions P26 19,069 27,452
Deposits and borrowings from the public P27 61,043 49,367
Debt securities in issue P28 68,908 63,280
Derivatives P19 4,180 4,653
Fair value changes of the hedged items in portfolio hedge of interest rate risk 1,158 1,368
Current tax liabilities 34 4
Other liabilities P29 3,531 2,895
Accrued expenses and prepaid income P30 759 642
Deferred tax liabilities P13 0 0
Provisions P31 301 206
Retirement benefit liabilities P32 159 171
Subordinated liabilities P33 8,951 7,728
Total liabilities 168,093 157,766
Untaxed reserves P34 2 4
Equity
Share capital 4,050 4,050
Share premium reserve 1,080 1,080
Other reserves –21 –5
Retained earnings 14,969 15,536
Total equity 20,078 20,661
Total liabilities and equity 188,173 178,431
Assets pledged as security for own liabilities P35 1,208 3,946
Other assets pledged P36 7,686 9,238
Contingent liabilities P37 72,402 71,103
Commitments P38 27,927 23,824

Financial statements – Parent company
Nordea Annual Report 2015 167
Statement of changes in equity,Parent company
Restricted equity Unrestricted equity1
Other reserves:
EURmShare
capital
Share premium
reserveCash flow
hedges
Available for sale invest-ments
Defined benefit
plansRetained earnings
Total equity
Balance at 1 Jan 2015 4,050 1,080 –37 41 –9 15,536 20,661
Net profit for the year – – – – – 1,920 1,920
Items that may be reclassifi ed subsequently to the income statement
Currency translation differences during the year – – – – – –4 –4
Available for sale investments:
Valuation gains/losses during the year – – – –55 – – –55
Tax on valuation gains/losses during the year – – – 12 – – 12
Transferred to the income statement during the year – – – –4 – – –4
Tax on transfers to the income statement during the year – – – 1 – – 1
Cash flow hedges:
Valuation gains/losses during the year – – 181 – – – 181
Tax on valuation gains/losses during the year – – –40 – – – –40
Transferred to the income statement during the year – – –154 – – – –154
Tax on transfers to the income statement during the year – – 34 – – – 34
Items that may not be reclassifi ed subsequently to the income statement
Defined benefit plans:
Remeasurement of benefit plans during the year – – – – 12 – 12
Tax on remeasurement of benefit plans during the year – – – – –3 – –3
Other comprehensive income, net of tax – – 21 –46 9 –4 –20
Total comprehensive income – – 21 –46 9 1,916 1,900
Share-based payments – – – – – 2 2
Dividend for 2014 – – – – – –2,501 –2,501
Divestment of own shares2 – – – – – 16 16
Balance at 31 Dec 2015 4,050 1,080 –16 –5 0 14,969 20,078
1) Apart from retained earnings, unrestricted equity consists of a free fund to the amount of EUR 2,762m.2) Refers to the change in the holding of own shares related to Long Term Incentive Programme and trading portfolio. The number of own shares were 11.7 million.
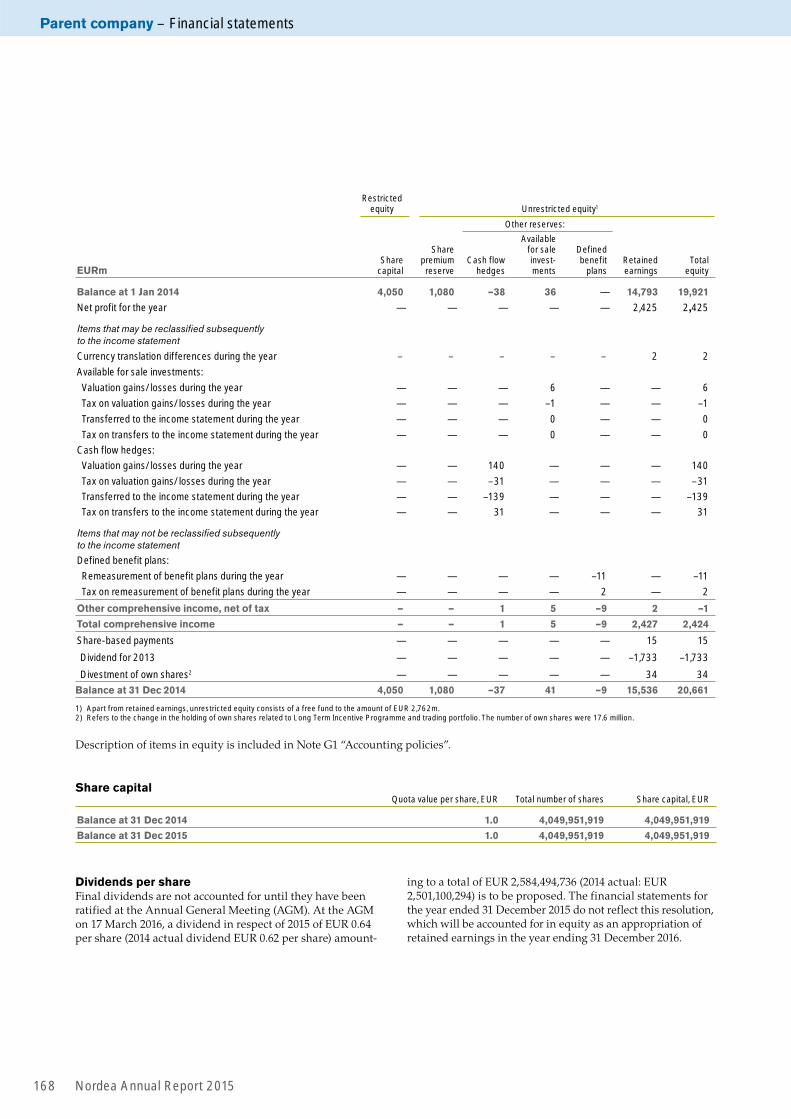
Parent company – Financial statements
Nordea Annual Report 2015168
Share capitalQuota value per share, EUR Total number of shares Share capital, EUR
Balance at 31 Dec 2014 1.0 4,049,951,919 4,049,951,919
Balance at 31 Dec 2015 1.0 4,049,951,919 4,049,951,919
Dividends per shareFinal dividends are not accounted for until they have been ratified at the Annual General Meeting (AGM). At the AGM on 17 March 2016, a dividend in respect of 2015 of EUR 0.64 per share (2014 actual dividend EUR 0.62 per share) amount-
ing to a total of EUR 2,584,494,736 (2014 actual: EUR 2,501,100,294) is to be proposed. The financial statements for the year ended 31 December 2015 do not reflect this resolution, which will be accounted for in equity as an appropriation of retained earnings in the year ending 31 December 2016.
Restricted equity Unrestricted equity1
Other reserves:
EURmShare
capital
Share premium
reserveCash flow
hedges
Available for sale invest-ments
Defined benefit
plansRetained earnings
Total equity
Balance at 1 Jan 2014 4,050 1,080 –38 36 — 14,793 19,921
Net profit for the year — — — — — 2,425 2,425
Items that may be reclassifi ed subsequently to the income statement
Currency translation differences during the year – – – – – 2 2
Available for sale investments:
Valuation gains/losses during the year — — — 6 — — 6
Tax on valuation gains/losses during the year — — — –1 — — –1
Transferred to the income statement during the year — — — 0 — — 0
Tax on transfers to the income statement during the year — — — 0 — — 0
Cash flow hedges:
Valuation gains/losses during the year — — 140 — — — 140
Tax on valuation gains/losses during the year — — –31 — — — –31
Transferred to the income statement during the year — — –139 — — — –139
Tax on transfers to the income statement during the year — — 31 — — — 31
Items that may not be reclassifi ed subsequently to the income statement
Defined benefit plans:
Remeasurement of benefit plans during the year — — — — –11 — –11
Tax on remeasurement of benefit plans during the year — — — — 2 — 2
Other comprehensive income, net of tax — — 1 5 –9 2 –1
Total comprehensive income — — 1 5 –9 2,427 2,424
Share-based payments — — — — — 15 15
Dividend for 2013 — — — — — –1,733 –1,733
Divestment of own shares2 — — — — — 34 34
Balance at 31 Dec 2014 4,050 1,080 –37 41 –9 15,536 20,661
1) Apart from retained earnings, unrestricted equity consists of a free fund to the amount of EUR 2,762m.2) Refers to the change in the holding of own shares related to Long Term Incentive Programme and trading portfolio. The number of own shares were 17.6 million.
Description of items in equity is included in Note G1 “Accounting policies”.

Financial statements – Parent company
Nordea Annual Report 2015 169
Cash flow statement, Parent company
EURm 2015 2014
Operating activities
Operating profit 2,203 2,615
Adjustment for items not included in cash flow –1,026 –655
Income taxes paid –226 –232
Cash flow from operating activities before changes in operating assets and liabilities 951 1,728
Changes in operating assets
Change in treasury bills –1,918 –58
Change in loans to credit institutions –7,543 –239
Change in loans to the public –6,153 –5,809
Change in interest-bearing securities –927 –217
Change in financial assets pledged as collateral 43 694
Change in shares 3,699 –704
Change in derivatives, net 558 –63
Change in other assets 1,643 561
Changes in operating liabilities
Change in deposits by credit institutions –5,952 9,941
Change in deposits and borrowings from the public 11,460 1,817
Change in debt securities in issue 5,600 –10
Change in other liabilities –1,570 –1,279
Cash flow from operating activities –109 6,362
Investing activities
Shareholder’s contributions to group undertakings –2,754 —
Sale of business operations 200 626
Acquisition of properties and equipment –55 –30
Sale of property and equipment 1 1
Acquisition of intangible assets –446 –258
Sale of intangible assets –1 —
Net divestments in debt securities, held to maturity 110 209
Cash flow from investing activities –2,945 548
Financing activities
Issued subordinated liabilities 2,166 1,224
Amortised subordinated liabilities –1,317 —
Repurchase/divestment of own shares incl change in trading portfolio 16 34
Dividend paid –2,501 –1,734
Cash flow from financing activities –1,636 –476
Cash flow for the year –4,690 6,434
Cash and cash equivalents at the beginning of year 8,033 1,599
Cash and cash equivalents at the end of year 3,343 8,033
Change –4,690 6,434

Parent company – Financial statements
Nordea Annual Report 2015170
Comments on the cash flow statementThe cash flow statement shows inflows and outflows of cash and cash equivalents during the year. Nordea’s cash flow has been prepared in accordance with the indirect method, whereby operating profit is adjusted for effects of non-cash transactions such as depreciation and loan losses. The cash flows are classified by operating, investing and financing activities.
Operating activitiesOperating activities are the principal revenue-producing activities and cash flows are mainly derived from the operating profit for the year with adjustment for items not included in cash flow and income taxes paid. Adjustment for items not included in cash flow includes:
EURm 2015 2014
Depreciation 130 118
Impairment charges 19 158
Loan losses 152 122
Unrealised gains/losses –14 –281
Capital gains/losses (net) –171 –280
Change in accruals and provisions 287 236
Anticipated dividends –1,293 –1,109
Group contributions –614 –645
Translation differences 681 386
Change in fair value of the hedged items, assets/lia-bilities (net) –210 641
Other 7 –1
Total –1,026 –655
Changes in operating assets and liabilities consists of assets and liabilities that are part of normal business activities, such as loans, deposits and debt securities in issue. Changes in derivatives are reported net.
Cash flow from operating activities includes interest payments received and interest expenses paid with the following amounts:
EURm 2015 2014
Interest payments received 1,574 2,039
Interest expenses paid 1,024 1,315
Investing activitiesInvesting activities include acquisitions and disposals of non-current assets, like property and equipment, intangi-ble and financial assets.
Financing activitiesFinancing activities are activities that result in changes in equity and subordinated liabilities, such as new issues of shares, dividends and issued/amortised subordinated liabilities.
Cash and cash equivalentsThe following items are included in Cash and cash equivalents:
EURm 31 Dec
2015 31 Dec
2014
Cash and balances with central banks 75 931
Loans to credit institutions, payable on demand 3,268 7,102
Total 3,343 8,033
Cash comprises legal tender and bank notes in foreign currencies. Balances with central banks consists of depos-its in accounts with central banks and postal giro systems under government authority, where the following condi-tions are fulfilled:• the central bank or the postal giro system is domiciled
in the country where the institution is established,• the balance on the account is readily available any time.
Loans to credit institutions, payable on demand include liquid assets not represented by bonds or other interest-bearing securities.

Financial statements – Parent company
Nordea Annual Report 2015 171
5 year overview, Parent company
Income statement
EURm 2015 2014 2013 2012 2011
Net interest income 576 649 641 724 680
Net fee and commission income 821 820 1,009 623 560
Net result from items at fair value 136 186 131 189 234
Dividends 2 ,176 2,333 1,827 3,554 1,534
Other income 833 975 674 501 122
Total operating income 4,542 4,963 4,282 5,591 3,130
General administrative expenses:
Staff costs –1,196 –1,070 –982 –938 –823
Other expenses –851 –904 –1,018 –842 –561
Depreciation, amortisation and impairment charges of tangible and intangible assets –140 –261 –109 –105 –112
Total operating expenses –2,187 –2,235 –2,109 –1,885 –1,496
Profit before loan losses 2,355 2,728 2,173 3,706 1,634
Net loan losses –143 –98 –124 –19 –20
Impairment of securities held as financial non-current assets –9 –15 –4 –15 –9
Operating profit 2,203 2,615 2,045 3,672 1,605
Appropriations 2 –1 102 –103 1
Income tax expense –285 –189 –192 –95 –114
Net profit for the year 1,920 2,425 1,955 3,474 1,492
Balance sheet
EURm31 Dec
201531 Dec
201431 Dec
201331 Dec
201231 Dec
2011
Treasury bills and interest-bearing securities 19,068 16,356 16,080 16,686 18,314
Loans to credit institutions 90,009 86,704 80,918 68,006 59,379
Loans to the public 45,820 39,809 34,155 36,214 36,421
Investments in group undertakings 19,394 16,986 17,723 17,659 16,713
Other assets 13,882 18,576 15,047 13,565 10,554
Total assets 188,173 178,431 163,923 152,130 141,381
Deposits by credit institutions 19,069 27,452 17,500 19,342 22,441
Deposits and borrowings from the public 61,043 49,367 47,531 50,263 44,389
Debt securities in issue 68,908 63,280 62,961 48,285 45,367
Subordinated liabilities 8,951 7,728 5,971 7,131 6,154
Other liabilities/untaxed reserves 10,124 9,943 10,039 7,734 6,109
Equity 20,078 20,661 19,921 19,375 16,921
Total liabilities and equity 188,173 178,431 163,923 152,130 141,381

Parent company – Financial statements
Nordea Annual Report 2015172
2015 2014 2013 2012 2011
Return on equity, % 10.1 12.6 10.5 20.5 9.4
Return on assets, % 1.0 1.4 1.2 2.3 1.1
Cost/income ratio, % 48.2 45.0 49.3 33.9 47.8
Loan loss ratio, basis points 31 25 36 5 5
Common Equity Tier 1 capital ratio excluding transition rules1,2, % 18.8 21.8 20.8 17.6 24.9
Tier 1 capital ratio, excluding transition rules1, % 22.2 25.3 23.1 19.6 28.1
Total capital ratio, excluding transition rules1, % 27.1 30.6 28.0 24.4 33.3
Tier 1 capital1,2,3, EURm 19,314 19,932 19,300 19,244 17,134
Risk-exposure amount, including transition rules1, EURbn 87 79 83 98 61
1) End of the year.2) Including result of the year.3) The 2013 ratios are reported under the Basel II regulation framework and the 2014 and 2015 ratios are reported using the Basel III (CRR/CRD IV) framework.
Ratios and key figures, Parent company

Accounting policies – Parent company
Nordea Annual Report 2015 173
Basis for presentation The financial statements for the parent company, Nordea Bank AB (publ), are prepared in accordance with the Swedish Annual Accounts Act for Credit Institutions and Securities Companies (1995:1559) and the accounting regulations of the Swedish Financial Supervisory Authority (FFFS 2008:25 including amendments) and the accounting recommendation RFR 2 Accounting for legal entities (RFR 2) issued by the Swedish Financial Reporting Board. This means that the par-ent company applies International Financial Reporting Stand-ards (IFRS) as endorsed by the EU Commission to the extent possible within the framework of Swedish accounting legisla-tion and considering the close tie between financial reporting and taxation.
The Group’s accounting policies described in Note G1 “Accounting policies” are applicable also for the parent com-pany, considering also the information provided below.
Changed accounting policiesThe accounting policies, basis for calculations and presenta-tion are, in all material aspects, unchanged in comparison with the 2014 Annual Report.
The Swedish Financial Reporting Board has amended the accounting recommendation for legal entities RFR 2 by issu-ing “RFR 2 Accounting for Legal Entities – January 2015”. Those amendments were implemented by the parent com-pany 1 January 2015, but have not had any significant impact on the parent company’s financial statement.
Other changes implemented by the parent company 1 Janu-ary 2015 can be found in section “Changed accounting policies” in Note G1 “Accounting policies”. The conclusions within this section are also, where applicable, relevant for the parent company.
Changes in IFRSs not yet appliedThe IASB has issued “Amendments to IAS 27, Equity method in Separate Financial Statements” which allows the equity method when accounting for investments in subsidiaries, joint ventures and associated companies. The amendment is effective as from annual periods beginning on or after 1 Janu-ary 2016. The amendment is endorsed by the EU commission. However, the Swedish accounting laws do not allow the equity method for investments in subsidiaries. Nordea’s expectation is that the amendments in IAS 27 will not have any significant impact on the parent company’s financial statements, capital adequacy or large exposures in the period of initial application.
Other forthcoming changes in IFRS not yet implemented by the parent company can be found in the section 3 “Changes in IFRSs not yet applied” in Note G1 “Accounting policies”. The conclusions within this section are also, where applica-ble, relevant for the parent company.
Accounting policies applicable for the parent company onlyInvestments in group undertakings and associated undertakingsThe parent company’s investments in group undertakings and associated undertakings are recognised under the cost model. At each balance sheet date, all shares in group under-takings and associated undertakings are reviewed for indica-tions of impairment. If such indication exists, an analysis is
performed to assess whether the carrying amount of each holding of shares is fully recoverable. The recoverable amount is the higher of fair value less costs to sell and the value in use. Any impairment charge is calculated as the difference between the carrying amount and the recoverable amount and is classified as “Impairment of securities held as financial non-current assets” in the income statement.
The parent company applies fair value hedge accounting for the foreign exchange risk in investments in subsidiaries. The shares in subsidiaries are remeasured with regards to the hedged risk with a corresponding entry in “Net result from items at fair value”. The change in fair value of the hedging instruments is also recognised in the income statement in “Net result from items at fair value”.
DividendsDividends paid to the shareholders of Nordea Bank AB (publ) are recorded as a liability following the approval of the Annual General Meeting.
Dividends paid by group undertakings to the parent com-pany are anticipated if the parent alone can decide on the size of the dividend and if the formal decision has been made before the financial report is published. Dividends from group- and associated undertakings are recognised on the separate income line “Dividends”.
Amortisation of goodwillGoodwill and other intangible assets with indefinite useful lives are not amortised in the consolidated financial state-ments. In the parent company financial statements goodwill is amortised, normally over a period of five years unless, under exceptional circumstances, a longer amortisation period is justified.
Functional currencyThe accounting currency (Sw: redovisningsvaluta) of the par-ent company is EUR. All transactions in other currencies are converted to EUR in accordance with the policies disclosed in section 9 “Translation of assets and liabilities denominated in foreign currencies” in Note G1 “Accounting policies”. Any remaining equity in foreign branches is converted at the clos-ing rates with translation differences recognised in other comprehensive income.
PensionsThe accounting principle for defined benefit obligations fol-lows the Swedish rules (“Tryggandelagen”) and the regula-tions of the Swedish Financial Supervisory Authority as this is the condition for tax deductibility. The significant differ-ences compared with IAS 19 consists of how the discount rate is determined, that the calculation of the defined benefit obli-gation is based on current salary level without assumptions about future salary increases.
In Sweden, defined pension commitments are guaranteed by a pension foundation or recognised as a liability. No net defined benefit assets are recognised. The pension cost in the parent company, classified as “Staff cost” in the income state-ment, consists of changes in recognised pension provisions (including special wage tax) for active employees, pension benefits paid, contributions made to or received from the pen-sion foundation and related special wage tax.
The pension obligations in the foreign branches are calcu-lated in accordance with local accounting requirements.
P1 Accounting policies

Parent company – Notes to the income statement
Nordea Annual Report 2015174
EURmSweden Finland Norway Denmark Others Total
2015 2014 2015 2014 2015 2014 2015 2014 2015 2014 2015 2014
Net interest income 576 649 — — — — — — — — 576 649
Net fee and commission income 821 820 — — — — — — — — 821 820
Net result from items at fair value 136 186 — — — — — — — — 136 186
Dividends1 734 949 876 604 — — 401 750 165 30 2,176 2,333
Other operating income 156 327 205 214 91 94 381 340 — — 833 975
Total operating income 2,423 2,931 1,081 818 91 94 782 1,090 165 30 4,542 4,963
1) Regards dividends from group undertakings.
P3 Net interest income
EURm 2015 2014
Interest income
Loans to credit institutions 455 651
Loans to the public 880 928
Interest-bearing securities 201 295
Other interest income 71 68
Interest income 1,607 1,942
Interest expense
Deposits by credit institutions –46 –127
Deposits and borrowings from the public –83 –193
Debt securities in issue –917 –958
Subordinated liabilities –359 –313
Other interest expenses1 374 298
Interest expense –1,031 –1,293
Net interest income 576 649
1) The net interest income from derivatives, measured at fair value and related to Nordea´s funding. This can have both a positive and negative impact on other interest expenses, for further information see Note G1 “Accounting policies”.
P2 Segment reporting
P1 Accounting policies, cont.
Geographical information
Group contributionsGroup contributions paid to group undertakings are recog-nised as an increase in the value of investments in group undertakings, net of tax. Group contributions received from group undertakings are recognised as dividends. The possi-ble tax effects on group contributions received are classified as “Income tax expense” in the income statement.
Untaxed reservesThe parent company reports untaxed reserves, related to accelerated depreciation and tax allocation reserve under tax regulations. In the consolidated financial statements, untaxed reserves are split on the items “Retained earnings” and “Deferred tax liabilities” on the balance sheet.
Interest income from financial instruments not measured at fair value through profit and loss amounts to EUR 1,407m (EUR 1,655m). Interest expenses from financial instruments not measured at fair value through profit and loss amounts to EUR –1,424m (EUR –1,617m). Interest on impaired loans amounted to an insignificant portion of interest income.

Notes to the income statement – Parent company
Nordea Annual Report 2015 175
P4 Net fee and commission income
EURm 2015 2014
Asset management commissions 154 129
Life insurance 1 1
Brokerage, securities issues and corporate
finance 150 168
Custody and issuers services 34 24
Deposits 19 23
Total savings related commissions 358 345
Payments 108 105
Cards 230 238
Total payment commissions 338 343
Lending 162 157
Guarantees and documentary payment 197 215
Total lending related commissions 359 372
Other commission income 39 33
Fee and commission income 1,094 1,093
Savings and investments –35 –30
Payments –24 –22
Cards –130 –136
State guarantee fees –65 –55
Other commission expenses –19 –30
Fee and commission expense –273 –273
Net fee and commission income 821 820
Fee income, not included in determining the effective interest rate, from financial assets and liabilities not measured at fair value through profit or loss amounts to EUR 181m (EUR 180m).
Fee income, not included in determining the effective inter-est rate, from fiduciary activities that result in the holding or investing of assets on behalf of customers amounts to EUR 305m (EUR 298m). The corresponding amount for fee expenses is EUR –35m (EUR –30m).
EURm 2015 2014
Equity related instruments 7 47
Interest related instruments and foreign exchange gains/losses 131 125
Other financial instruments (including credit and commodities) –2 14
Total1 136 186
1) Of which EUR 26m (EUR 41m) is dividends from shares.
P5 Net result from items at fair value
P6 Dividends
EURm 2015 2014
Dividends from group undertakings
Nordea Bank Finland Plc 780 550
Nordea Bank Denmark A/S 395 739
LLC Promyshlennaya Kompaniya VESTKON 89 —
JSC Nordea Bank 6 —
Nordea Life Holding AB — 220
Nordea Funds Ltd 96 54
Nordea Bank S.A. 70 30
Nordea Investment Management AB 120 75
Nordea Ejendomsinvestering A/S 5 11
Barkman Elektronik AB in liquidation — 8
Dividends from associated undertakings
Upplysningscentralen (UC) AB — 1
Group Contributions
Nordea Hypotek AB 492 494
Nordea Nordic Baltic 1 AB — 8
Nordea Investment Management AB 11 14
Nordea Finans AB 112 129
Total 2,176 2,333
P7 Other operating income
EURm 2015 2014
Divestment of shares 170 278
Remuneration from group undertakings 661 691
Other 2 6
Total 833 975
Net result from categories of financial instruments
EURm 2015 2014
Available for sale assets, realised 4 0
Financial instruments designated at fair value through profit or loss 19 21
Financial instruments held for trading 29 53
Financial instruments under fair value hedge accounting 1 6
– of which net losses on hedging instruments –157 –487
– of which net gains on hedged items 158 493
Financial assets measured at amortised cost 14 27
Foreign exchange gains/losses excluding currency hedges 69 83
Other 0 –4
Total 136 186
P5 Net result from items at fair value, cont.

Parent company – Notes to the income statement
Nordea Annual Report 2015176
EURm 2015 2014
Salaries and remuneration (specification below)1 –836 –716
Pension costs (specification below) –146 –134
Social security contributions –233 –213
Other staff costs 19 –7
Total –1,196 –1,070
Salaries and remuneration
To executives2
– Fixed compensation and benefits –6 –6
– Performance-related compensation –4 –6
– Allocation to profit-sharing 0 0
Total –10 –12
To other employees –826 –704
Total –836 –716
1) Allocation to profit-sharing foundation 2015 EUR 29m (EUR 25m) consists of a new allocation of EUR 28m (EUR 24m) and an allocation related to prior year of EUR 1m (EUR 1m).
2) Executives include the Board of Directors (including deputies), CEO, deputy CEO, execu-tive vice presidents and Group Executive Management in the parent company. Former board members (including deputies), CEOs, deputy CEOs, managing directors and execu-tive vice presidents, are included. Executives amounts to 18 (15) positions.
EURm 2015 2014
Pension costs1
Defined benefit plans –77 –73
Defined contribution plans –69 –61
Total –146 –134
1) Pension costs for executives, see Note G7 “Staff costs”.
Additional disclosures on remuneration under Swedish FSA regulations and general guidelinesThe qualitative disclosures under these regulations can be found in the separate section on remuneration in the Board of Directors’ Report, while the quantitative disclosures will be published in a separate report on Nordea’s homepage (www.nordea.com) not later than one week before the Annual General Meeting on 17 March 2016.
Compensation to key management personnelSalaries and renumeration to the Board of Directors, CEO and Group Executive Management, see Note G7 “Staff costs”.
Loans to key management personnelLoans to key management personnel amounts to EUR 0m (EUR 0m). Interest income on these loans amounts to EUR 0m (EUR 0m). For information about loan conditions, see Note G7 “Staff costs”.
Long Term Incentive ProgrammesParticipation in the Long Term Incentive Programmes (LTIPs) requires that the participants take direct ownership by invest-ing in Nordea shares. For more information about conditions and requirements, see Note G7 “Staff costs”.
For information on number of outstanding conditional rights in the LTIPs, see Note G7 “Staff costs”. All rights in the LTIPs, both to employees in the parent company as well as to employees in group undertakings, are issued by Nordea Bank AB (publ).
The expenses in below table regards only employees in Nordea Bank AB (publ).
P8 Staff costs
Expenses for equity-settled share-based payment programmes1
EURmLTIP
2012LTIP
2011
Total expense during 2015 –1 —
Total expense during 2014 –5 –1
1) All amounts excluding social security contribution.
Cash-settled share-based payment transactionsNordea operates share-linked deferrals on parts of variable compensation for certain employee categories, indexed with Nordea Total Shareholder Returns (TSR) and either trans-ferred after three years or transferred in equal instalments over a three to five year period. Since 2011 Nordea also oper-ates TSR-linked retention on part of variable compensation for certain employee categories. Due to that the allocation of vari-able compensation is not finally decided during the current year, the deferred amount during the year in the table below relates to variable compensation earned the previous year.
In addition Nordea in 2013 introduced the Executive Incen-tive Programme (“EIP”) which aims to strengthen Nordea’s capability to retain and recruit the best talents. The aim is further to stimulate the managers and key employees whose efforts have direct impact on Nordea’s result, profitability and long term value growth. EIP reward performance meeting agreed predetermined targets on Group, business unit and individual level. The effect on the long term result is to be considered when determining the targets. The EIP shall not exceed the fixed salary. EIP shall be paid in the form of cash and be subject to TSR-indexation, deferral, forfeiture clauses and retention as per relevant remuneration regulations. The main part of EIP 2015 is paid no earlier than autumn 2019. Participation in the programme is offered to up to 400 manag-ers and key employees, except GEM who are instead offered a GEM EIP (further information about the GEM EIP can be found in the Remuneration section in the Board of Director’s Report), within the Nordea Group. EIP is offered instead of Nordea’s LTIP and VSP for the invited employees. The allo-cation of the EIP 2015 is decided during spring 2016, and a reservation of EUR 18m excl. social costs is made 2015. 80% of the allocated amount will be subject to TSR-indexation.
The below table only includes deferred amounts indexed with Nordea TSR. EIP has been included as from 2014, when deferred. Further information regarding all deferred amounts can be found in the separate report on remuneration pub-lished on Nordea’s homepage (www.nordea.com).
Share linked deferrals
EURm 2015 2014
Opening balance 7 3
Reclassification1 2 —
Deferred/earned during the year 16 5
TSR indexation during the year 1 1
Payments during the year2 –5 –1
Translation differences 1 –1
Closing balance 22 7
1) Relates to a reclassification from deferred amounts that are indexed with a fixed rate. 2) There have been no adjustments due to forfeitures.

Notes to the income statement – Parent company
Nordea Annual Report 2015 177
Average number of employees
Total Men Women
2015 2014 2015 2014 2015 2014
Full-time equivalentsSweden 6,450 6,485 3,034 2,983 3,416 3,502Other countries 4,151 3,613 2,200 1,854 1,951 1,759
Total average 10,601 10,098 5,234 4,837 5,367 5,261
Gender distribution, executives
Per cent31 Dec
201531 Dec
2014
Nordea Bank AB (publ)
Board of Directors – Men 56 50
Board of Directors – Women 44 50
Other executives – Men 78 86
Other executives – Women 22 14
P9 Other expenses
EURm 2015 2014
Information technology –467 –538
Marketing and representation –31 –34
Postage, transportation, telephone and office expenses –48 –55
Rents, premises and real estate –136 –133
Other1 –169 –144
Total –851 –904
1) Including fees and remuneration to auditors distributed as follows.
Auditors’ feeEURm 2015 2014
PricewaterhouseCoopers
Auditing assignments –2 —
Audit-related services 0 —
Tax advisory services 0 —
Other assignments –1 —
Total –3 −
KPMG
Auditing assignments –1 –2
Audit-related services –1 0
Tax advisory services — 0
Other assignments 0 –1
Total –2 –3
P10 Depreciation, amortisation and impairment charges of tangible and intangible assetsP8 Staff costs, cont.
P11 Net loan losses
EURm 2015 2014
Loan losses divided by class
Recoveries on previous realised loan losses 0 —
Provisions 0 —
Reversals of previous provisions 1 0
Loans to credit institutions1 1 0
Realised loan losses –72 –68
Allowances to cover realised loan losses 34 24
Recoveries on previous realised loan losses 8 23
Provisions –175 –77
Reversals of previous provisions 84 64
Loans to the public1 –121 –34
Realised loan losses –9 –37
Recoveries on previous realised loan losses 6 —
Provisions –42 –77
Reversals of previous provisions 22 50
Off-balance sheet items2 –23 –64
Net loan losses –143 –98
1) See Note P15 “Loans and impairment”.2) Included in Note P31 “Provisions” as “Transfer risk” and “Guarantees”.
EURm 2015 2014
Depreciation/amortisationProperties and equipment (Note P23)
Equipment –26 –27
Intangible assets (Note P22)
Goodwill –56 –49
Computer software –31 –31
Other intangible assets –17 –11
Total –130 –118
Impairment chargesIntangible assets (Note P22)
Computer software –7 –142
Other intangible assets –3 –1
Total –10 –143
Total –140 –261

Parent company – Notes to the income statement
Nordea Annual Report 2015178
P13 Taxes
Income tax expense
EURm 2015 2014
Current tax –303 –176
Deferred tax 18 –13
Total –285 –189
The tax on the operating profit differs from the theoretical amount that would arise using the tax rate in Sweden as follows:
EURm 2015 2014
Profit before tax 2,205 2,614
Tax calculated at a tax rate of 22.0% –485 –575
Tax-exempt income 381 431
Non-deductible expenses –81 –16
Adjustments relating to prior years –100 –29
Tax charge –285 –189
Average effective tax rate 13% 7%
Deferred taxDeferred tax
assetsDeferred tax
liabilities
EURm 2015 2014 2015 2014
Deferred tax related to:
Derivatives 4 10 — —
Properties and equipment — — 11 9
Retirement benefit obligations 7 3 — —
Liabilities/provisions 26 10 0 0
Netting between deferred tax assets and liabilities –11 –9 –11 –9
Total 26 14 0 0
P12 Appropriations
EURm 2015 2014
Change in depreciation in excess of plan, equipment 2 –1
Total 2 –1
P14 Treasury bills
31 Dec 2015 31 Dec 2014EURm
State and sovereigns 6,086 4,328
Municipalities and other public bodies1 819 750
Total 6,905 5,078
– of which Financial instruments pledged as collateral (Note P17) — 43
Total 6,905 5,035
1) Of which EUR 32m (EUR 0m) held at amortised cost with a nominal amount of EUR 32m (EUR 0m).
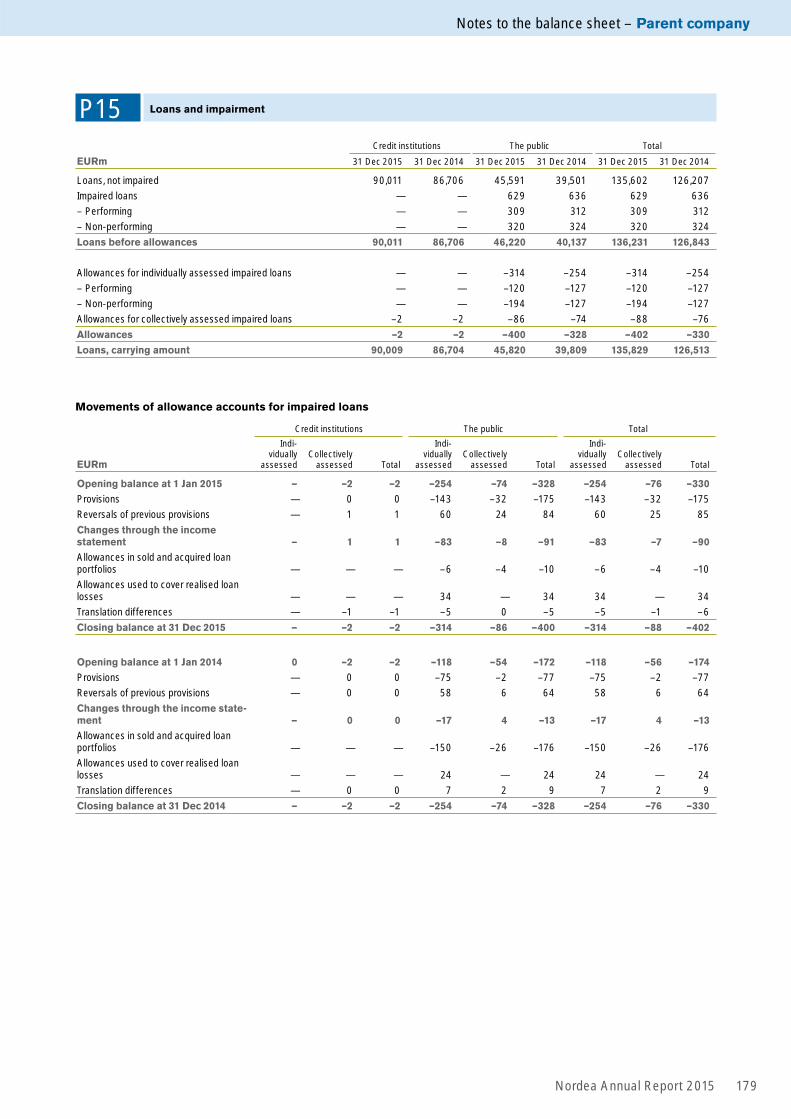
Notes to the balance sheet – Parent company
Nordea Annual Report 2015 179
P15 Loans and impairment
Credit institutions The public Total
EURm 31 Dec 2015 31 Dec 2014 31 Dec 2015 31 Dec 2014 31 Dec 2015 31 Dec 2014
Loans, not impaired 90,011 86,706 45,591 39,501 135,602 126,207
Impaired loans — — 629 636 629 636
– Performing — — 309 312 309 312
– Non-performing — — 320 324 320 324
Loans before allowances 90,011 86,706 46,220 40,137 136,231 126,843
Allowances for individually assessed impaired loans — — –314 –254 –314 –254
– Performing — — –120 –127 –120 –127
– Non-performing — — –194 –127 –194 –127
Allowances for collectively assessed impaired loans –2 –2 –86 –74 –88 –76
Allowances –2 –2 –400 –328 –402 –330
Loans, carrying amount 90,009 86,704 45,820 39,809 135,829 126,513
Movements of allowance accounts for impaired loans
Credit institutions The public Total
EURm
Indi-vidually
assessedCollectively
assessed Total
Indi-vidually
assessedCollectively
assessed Total
Indi-vidually
assessedCollectively
assessed Total
Opening balance at 1 Jan 2015 — –2 –2 –254 –74 –328 –254 –76 –330
Provisions — 0 0 –143 –32 –175 –143 –32 –175
Reversals of previous provisions — 1 1 60 24 84 60 25 85
Changes through the income statement — 1 1 –83 –8 –91 –83 –7 –90
Allowances in sold and acquired loan portfolios — — — –6 –4 –10 –6 –4 –10
Allowances used to cover realised loan losses — — — 34 — 34 34 — 34
Translation differences — –1 –1 –5 0 –5 –5 –1 –6
Closing balance at 31 Dec 2015 — –2 –2 –314 –86 –400 –314 –88 –402
Opening balance at 1 Jan 2014 0 –2 –2 –118 –54 –172 –118 –56 –174
Provisions — 0 0 –75 –2 –77 –75 –2 –77
Reversals of previous provisions — 0 0 58 6 64 58 6 64
Changes through the income state-ment — 0 0 –17 4 –13 –17 4 –13
Allowances in sold and acquired loan portfolios — — — –150 –26 –176 –150 –26 –176
Allowances used to cover realised loan losses — — — 24 — 24 24 — 24
Translation differences — 0 0 7 2 9 7 2 9
Closing balance at 31 Dec 2014 — –2 –2 –254 –74 –328 –254 –76 –330

Parent company – Notes to the balance sheet
Nordea Annual Report 2015180
P15 Loans and impairment, cont.
Allowances and provisions1
Credit institutions The public Total
EURm 31 Dec 2015 31 Dec 2014 31 Dec 2015 31 Dec 2014 31 Dec 2015 31 Dec 2014
Allowances for items on the balance sheet –2 –2 –400 –328 –402 –330
Provisions for off balance sheet items –181 –162 –2 –1 –183 –163
Total allowances and provisions –183 –164 –402 –329 –585 –493
1) Included in Note P31 “Provisions” as “Transfer risk” and “Guarantees”.
Key ratios 31 Dec2015
31 Dec2014
Impairment rate, gross, basis points 46 50
Impairment rate, net, basis points 23 30
Total allowance rate, basis points 29 26
Allowances in relation to impaired loans, % 50 40
Total allowances in relation to impaired loans, % 64 52
Non-performing loans, not impaired, EURm 41 68
P16 Interest-bearing securities
EURm31 Dec
201531 Dec
2014
Issued by public bodies 45 43
Issued by other borrowers1 12,118 11,278
Total 12,163 11,321
Listed securities 12,163 11,166
Unlisted securities — 155
Total 12,163 11,321
1) Of which EUR 30m (EUR 111m) held at amortised cost with a nominal amount of EUR 30m (EUR 112m).
Financial instruments pledged as collateral In repurchase transactions and in securities lending trans-actions, non-cash assets are transferred as collateral. When the counterpart receiving the collateral has the right to sell or repledge the assets, the assets are reclassified in the balance sheet to the item Financial instruments pledged as collateral.
EURm31 Dec
201531 Dec
2014
Treasury bills — 43
Total − 43
For more information on transferred assets, see Note P44 “Transferred assets and obtained collaterals”.
P18 Shares
EURm31 Dec
201531 Dec
2014
Shares 2,363 6,060
Shares taken over for protection of claims 0 1
Total 2,363 6,061
Listed shares 2,331 6,029
Unlisted shares 32 32
Total 2,363 6,061
P17 Financial instruments pledged as collateral

Notes to the balance sheet – Parent company
Nordea Annual Report 2015 181
P19 Derivatives and hedge accounting
Fair value Total nom. amount31 Dec 2015, EURm Positive Negative
Derivatives held for tradingInterest rate derivatives
Interest rate swaps 1,913 1,983 200,183
FRAs 9 10 57,952
Futures and forwards 0 0 2,696
Options 84 84 62,092
Other 3 2 11,307
Total 2,009 2,079 334,230
Equity derivatives
Equity swaps 116 137 253
Futures and forwards — 1 19
Options 57 9 334
Total 173 147 606
Foreign exchange derivatives
Currency and interest rate swaps 630 531 16,869
Currency forwards 47 345 27,949
Total 677 876 44,818
Credit derivatives 5 1 299
Other derivatives — 6 1,668
Total derivatives held for trading 2,864 3,109 381,621
Derivatives used for hedge accountingInterest rate derivatives 1,427 232 45,711
Foreign exchange derivatives 720 839 10,243
Total derivatives used for hedge accounting 2,147 1,071 55,954
– of which fair value hedges1 1,612 238 50,768
– of which cash flow hedges1 535 833 10,243
Total derivatives 5,011 4,180 437,575
1) Some cross currency interest rate swaps and interest rate swaps are used both as fair value hedges and cash flow hedges and the nominal amounts are then reported on both lines.

Parent company – Notes to the balance sheet
Nordea Annual Report 2015182
Fair value Total nom. amount31 Dec 2014, EURm Positive Negative
Derivatives held for tradingInterest rate derivatives
Interest rate swaps 2,315 2,423 138,982
FRAs 57 66 63,168
Futures and forwards 0 0 1,866
Options — 5 11,097
Other 5 0 4,258
Total 2,377 2,494 219,371
Equity derivatives
Equity swaps 57 215 272
Futures and forwards 0 5 97
Options 277 230 2,648
Total 334 450 3,017
Foreign exchange derivatives
Currency and interest rate swaps 534 477 17,745
Currency forwards 424 22 17,581
Total 958 499 35,326
Credit derivatives 8 — 256
Other derivatives 5 — 1,772
Total derivatives held for trading 3,682 3,443 259,742
Derivatives used for hedge accountingInterest rate derivatives 1,764 404 42,020
Equity derivatives 0 5 55
Foreign exchange derivatives 535 801 9,872
Total derivatives used for hedge accounting 2,299 1,210 51,947
– of which fair value hedges1 1,747 360 46,635
– of which cash flow hedges1 552 850 32,130
Total derivatives 5,981 4,653 311,689
1) Some cross currency interest rate swaps and interest rate swaps are used both as fair value hedges and cash flow hedges and the nominal amounts are then reported on both lines.
P19 Derivatives and hedge accounting, cont.

Notes to the balance sheet – Parent company
Nordea Annual Report 2015 183
P20 Investments in group undertakings
EURm31 Dec
201531 Dec
2014
Acquisition value at beginning of year 17,611 18,347
Acquisitions/capital contributions during the year 2,754 56
Revaluations under hedge accounting –298 –425
IFRS 2 expenses1 1 9
Sales during the year –40 –376
Acquisition value at end of year 20,028 17,611
Accumulated impairment charges at beginning of year –625 –624
Accumulated impairment charges on group undertakings sold during the year — 14
Impairment charges during the year –9 –15
Accumulated impairment charges at end of year –634 –625
Total 19,394 16,986
– of which listed shares — —
1) Allocation of IFRS 2 expenses for LTIP 2012 related to the group undertakings.
P20 Investments in group undertakings, cont.
SpecificationThis specification includes all directly owned group undertakings and major group undertakings to the directly owned companies.
31 Dec 2015Number of
shares
Carrying amount
2015, EURm
Carrying amount
2014, EURm
Voting power of
holding % Domicile Registration number
Nordea Bank Finland Plc 1,030,800,000 7,962 5,962 100.0 Helsinki 1680235–8
Nordea Finance Finland Ltd 100.0 Helsinki 0112305–3
Nordea Bank Danmark A/S 50,000,000 4,020 4,024 100.0 Copenhagen 13522197
Nordea Finans Danmark A/S 100.0 Høje Taastrup 89805910
Nordea Kredit Realkreditaktieselskab 100.0 Copenhagen 15134275
Fionia Asset Company A/S 100.0 Copenhagen 31934745
Nordea Bank Norge ASA 551,358,576 2,811 2,428 100.0 Oslo 911044110
Nordea Eiendomskreditt AS 100.0 Oslo 971227222
Nordea Finans Norge AS 100.0 Oslo 924507500
Privatmegleren AS 100.0 Oslo 986386661
LLC Promyshlennaya Kompaniya Vestkon 4,601,942,6801 659 659 100.0 Moscow 1027700034185
JSC Nordea Bank 100.0 Moscow 1027739436955
Nordea Life Holding AB 1,000 719 719 100.0 Stockholm 556742–3305
Nordea Liv & Pension, Livforsikringsselskab A/S 100.0 Ballerup 24260577
Livforsikringsselskapet Nordea Liv Norge AS 100.0 Bergen 959922659
Nordea Livförsäkring Sverige AB (publ) 100.0 Stockholm 516401–8508
Nordea Life Assurance Finland Ltd 100.0 Helsinki 0927072–8

Parent company – Notes to the balance sheet
Nordea Annual Report 2015184
P21 Investments in associated undertakings
EURm31 Dec
201531 Dec
2014
Acquisition value at beginning of year 7 7
Acquisition value at end of year 7 7
– of which listed shares — —
31 Dec 2015Number of
shares
Carrying amount
2015, EURm
Carrying amount
2014, EURm
Voting power of
holding % Domicile Registration number
Nordea Funds Ltd 3,350 385 174 100.0 Helsinki 1737785–9
Nordea Bank S.A. 999,999 455 455 100.0 Luxembourg B–14157
Nordea Hypotek AB (publ)2 100,000 1,900 1,874 100.0 Stockholm 556091–5448
Nordea Nordic Baltic 1 AB3 15,000 — 242 100.0 Stockholm 556020–4694
Nordea Finans Sverige AB (publ)2 1,000,000 118 104 100.0 Stockholm 556021–1475
Nordea Investment Management AB 12,600 231 231 100.0 Stockholm 556060–2301
Nordea Ejendomsinvestering A/S 1,000 29 29 100.0 Glostrup 26640172
Nordea IT Polska S.p. z.o.o. 100 30 30 100.0 Warsaw 0000429783
PK Properties Int’l Corp 100,000 0 0 100.0 Atlanta, USA 601624718
Nordea Hästen Fastighetsförvaltning AB 1,000 0 0 100.0 Stockholm 556653–6800
Nordea Putten Fastighetsförvaltning AB 1,000 0 0 100.0 Stockholm 556653–5257
Nordea do Brasil Representações Ltda 1,162,149 0 0 100.0 Sao Paulo, Brazil 51.696.268/0001–40
Nordic Baltic Holding (NBH) AB 1,000 26 0 100.0 Stockholm 556592–7950
Nordea Fastigheter AB3 3,380,000 — 1 100.0 Stockholm 556021–4917
Promano Est OÜ 1 10 10 100.0 Tallinn, Estonia 11681888
Uus-Sadama 11 OÜ 1 0 0 100.0 Tallinn, Estonia 11954914
SIA Promano Lat 21,096 12 14 100.0 Riga, Latvia 40103235197
SIA Realm 7,034 6 7 100.0 Riga, Latvia 50103278681
SIA Lidosta RE 765 1 1 100.0 Riga, Latvia 40103424424
SIA Trioleta 2,786 4 4 99.9 Riga, Latvia 40103565264
Promano Lit UAB 34,528 11 11 100.0 Vilnius, Lithua-nia 302423219
UAB Recurso 15,000 5 5 100.0 Vilnius, Lithua-nia 302784511
UAB Inrec 6,900 — 2 100.0 Vilnius, Lithua-nia 302996806
Total 19,394 16,986
1) Nominal value expressed in RUB, representing Nordea’s participation in Vestkon. Combined ownership, Nordea Bank AB directly 7.2% and indirecly 92.8% through LLC Promyshlennaya Kompaniya Vestkon.
2) Credit institutions as defined in the Swedish Annual Account Act for Credit Institutions and Securities Companies (1995:1559).3) Transferred to Nordea Baltic Holding AB in September 2015 .
P20 Investments in group undertakings, cont.
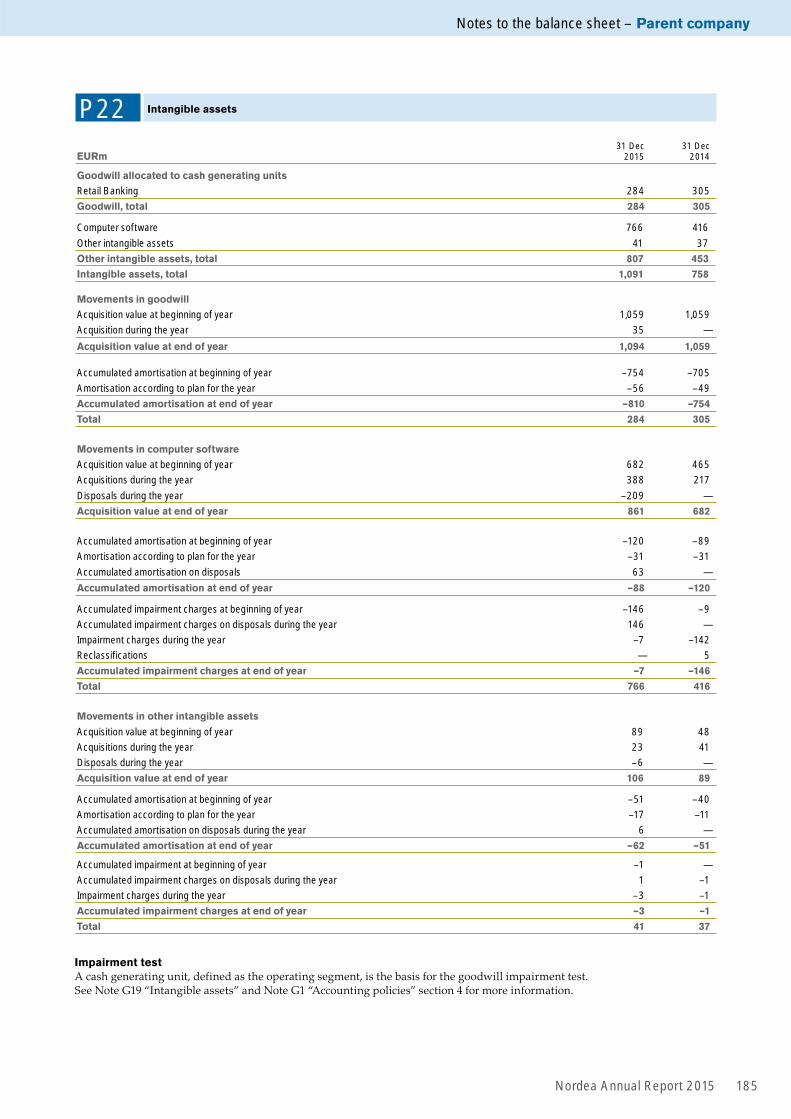
Notes to the balance sheet – Parent company
Nordea Annual Report 2015 185
P22 Intangible assets
EURm31 Dec
201531 Dec
2014
Goodwill allocated to cash generating units
Retail Banking 284 305
Goodwill, total 284 305
Computer software 766 416
Other intangible assets 41 37
Other intangible assets, total 807 453
Intangible assets, total 1,091 758
Movements in goodwill
Acquisition value at beginning of year 1,059 1,059
Acquisition during the year 35 —
Acquisition value at end of year 1,094 1,059
Accumulated amortisation at beginning of year –754 –705
Amortisation according to plan for the year –56 –49
Accumulated amortisation at end of year –810 –754
Total 284 305
Movements in computer software
Acquisition value at beginning of year 682 465
Acquisitions during the year 388 217
Disposals during the year –209 —
Acquisition value at end of year 861 682
Accumulated amortisation at beginning of year –120 –89
Amortisation according to plan for the year –31 –31
Accumulated amortisation on disposals 63 —
Accumulated amortisation at end of year –88 –120
Accumulated impairment charges at beginning of year –146 –9
Accumulated impairment charges on disposals during the year 146 —
Impairment charges during the year –7 –142
Reclassifications — 5
Accumulated impairment charges at end of year –7 –146
Total 766 416
Movements in other intangible assets
Acquisition value at beginning of year 89 48
Acquisitions during the year 23 41
Disposals during the year –6 —
Acquisition value at end of year 106 89
Accumulated amortisation at beginning of year –51 –40
Amortisation according to plan for the year –17 –11
Accumulated amortisation on disposals during the year 6 —
Accumulated amortisation at end of year –62 –51
Accumulated impairment at beginning of year –1 —
Accumulated impairment charges on disposals during the year 1 –1
Impairment charges during the year –3 –1
Accumulated impairment charges at end of year –3 –1
Total 41 37
Impairment test A cash generating unit, defined as the operating segment, is the basis for the goodwill impairment test. See Note G19 “Intangible assets” and Note G1 “Accounting policies” section 4 for more information.
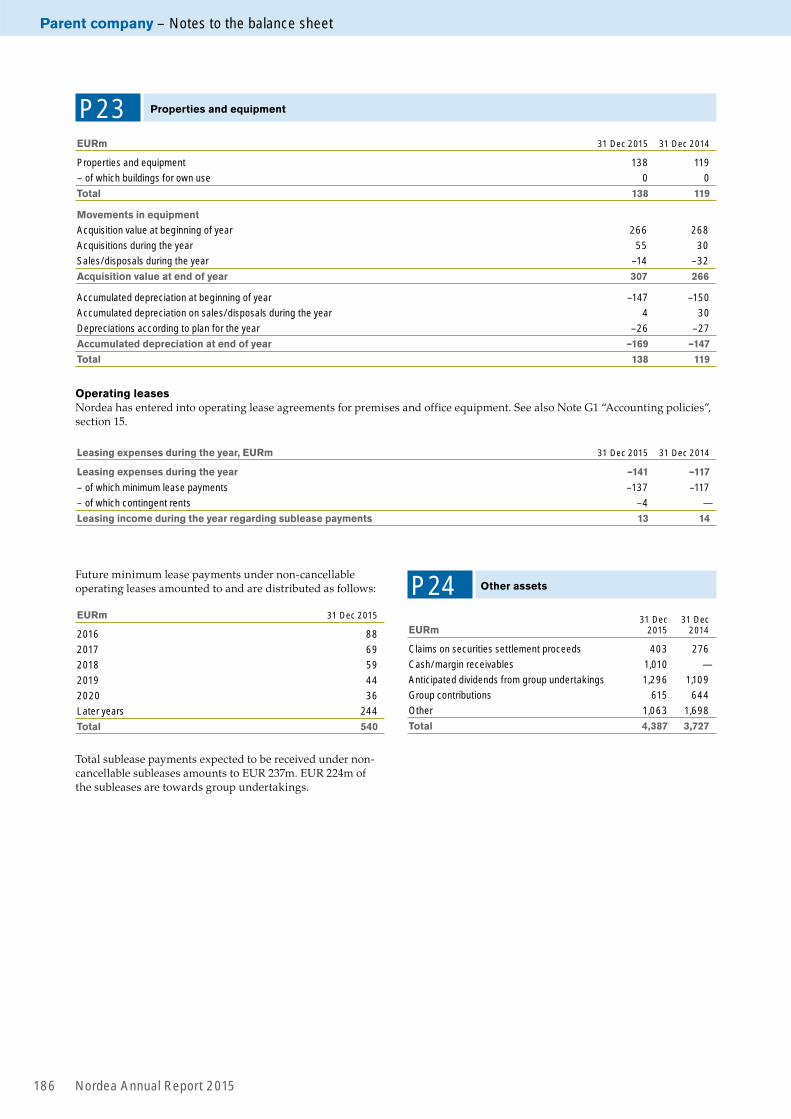
Parent company – Notes to the balance sheet
Nordea Annual Report 2015186
P23 Properties and equipment
EURm 31 Dec 2015 31 Dec 2014
Properties and equipment 138 119
– of which buildings for own use 0 0
Total 138 119
Movements in equipment
Acquisition value at beginning of year 266 268
Acquisitions during the year 55 30
Sales/disposals during the year –14 –32
Acquisition value at end of year 307 266
Accumulated depreciation at beginning of year –147 –150
Accumulated depreciation on sales/disposals during the year 4 30
Depreciations according to plan for the year –26 –27
Accumulated depreciation at end of year –169 –147
Total 138 119
Operating leasesNordea has entered into operating lease agreements for premises and office equipment. See also Note G1 “Accounting policies”, section 15.
Leasing expenses during the year, EURm 31 Dec 2015 31 Dec 2014
Leasing expenses during the year –141 –117
– of which minimum lease payments –137 –117
– of which contingent rents –4 —
Leasing income during the year regarding sublease payments 13 14
Future minimum lease payments under non-cancellable operating leases amounted to and are distributed as follows:
EURm 31 Dec 2015
2016 88
2017 69
2018 59
2019 44
2020 36
Later years 244
Total 540
Total sublease payments expected to be received under non-cancellable subleases amounts to EUR 237m. EUR 224m of the subleases are towards group undertakings.
P24 Other assets
EURm31 Dec
201531 Dec
2014
Claims on securities settlement proceeds 403 276
Cash/margin receivables 1,010 —
Anticipated dividends from group undertakings 1,296 1,109
Group contributions 615 644
Other 1,063 1,698
Total 4,387 3,727

Notes to the balance sheet – Parent company
Nordea Annual Report 2015 187
P25 Prepaid expenses and accrued income
EURm31 Dec
201531 Dec
2014
Accrued interest income 109 115
Other accrued income 101 81
Prepaid expenses 570 688
Total 780 884
P27 Deposits and borrowings from the public
EURm31 Dec
201531 Dec
2014
Deposits 60,423 48,176
Borrowings 620 1,191
Total 61,043 49,367
Deposits are defined as funds in deposit accounts covered by the government deposit guarantee but also including amounts in excess of the individual amount limits. Individual pension savings (IPS) are also included.
P26 Deposits by credit institutions
EURm31 Dec
201531 Dec
2014
Central banks 2,550 2,418
Banks 15,672 24,258
Other credit institutions 847 776
Total 19,069 27,452
P28 Debt securities in issue
EURm31 Dec
201531 Dec
2014
Certificates of deposit 7,460 55
Commercial papers 23,244 29,246
Bond loans 38,138 33,908
Other 66 71
Total 68,908 63,280
P29 Other liabilities
EURm31 Dec
201531 Dec
2014
Liabilities on securities settlement proceeds 69 215
Sold, not held, securities 136 285
Cash/margin payables 1,982 —
Accounts payable 15 22
Other 1,329 2,373
Total 3,531 2,895
P30 Accrued expenses and prepaid income
EURm31 Dec
201531 Dec
2014
Accrued interest 6 13
Other accrued expenses 526 443
Prepaid income 227 186
Total 759 642
P31 Provisions
EURm31 Dec
201531 Dec
2014
Restructuring 116 42
Transfer risk — 1
Guarantees 183 162
Other 2 1
Total 301 206
Restructuring Transfer risk Guarantees Other Total
At beginning of year 42 1 162 1 206
New provisions made 94 0 42 1 137
Provisions utilised –20 0 0 0 –20
Reversals –1 –1 –21 0 –23
Translation differences 1 0 0 0 1
At end of year 116 0 183 2 301
Provision for restructuring costs amounts to EUR 116m and covers termination benefits (EUR 96m) and other provisions mainly related to redundant premises (EUR 20m). Loan loss provisions for quarantees amounts to EUR 183m, of which EUR 180m covers the guarantee in favour of Nordea Bank Finland Plc.

Parent company – Notes to the balance sheet
Nordea Annual Report 2015188
Pension provisionsThe pension liabilities of Nordea Bank AB (publ) are mainly covered by allocations to its pension foundation.
The provisions in the balance sheet pertain to former employees of Postgirot Bank and pension obligations in for-eign branches. EUR 129m (EUR 124 m) of the provisions are covered by “Tryggandelagen”.
A small percentage of the pension obligations are covered by insurance policies.
The following figures are mainly based on calculations in accordance with Swedish rules (“Tryggandelagen”).
The pension obligations in the foreign branches are calcu-lated in accordance with local accounting requirements.
Specification of amounts recognised on the balance sheet
EURm31 Dec
201531 Dec
2014
Present value of commitments relating to in whole or in part funded pension plans –1,323 –1,155Fair value at the end of the period relating to specifi-cally separated assets 1,421 1,384
Surplus in the pension foundation 98 229
Present value of commitments relating to unfunded pension plans –159 –171Unrecognised surplus in the pension foundation –98 –229
Reported liability net on the balance sheet –159 –171
Movements in the liability recognised on balance sheet as pension
EURm31 Dec
201531 Dec
2014
Balance at 1 Jan recognised as pension commitments 171 166Pensions paid related to former employees of Post-girot Bank –7 –7Actuarial pension calculations through Profit and Loss 14 12Actuarial pension calculations through Balance Sheet –18 10Effect of exchange rate changes –1 –10
Balance at 31 Dec 159 171
Specification of cost and income in respect of pensions
EURm 2015 2014
Pensions paid related to former employees of Post-girot Bank –7 –7
Pensions paid covered by the pension foundation –63 –61Actuarial pension calculations –7 –5
Defined benefit plans –77 –73
Defined contribution plans –69 –61
Pension costs1 –146 –134
Return on specifically separated assets, % 2.5 12.4
1) See Note P8 “Staff costs”.
Actual value of holdings in pension foundations
EURm31 Dec
201531 Dec
2014
Shares 370 353
Interest-bearing securities 1,004 1,004
Other assets 47 27
Total 1,421 1,384
P33 Subordinated liabilities
EURm31 Dec
201531 Dec
2014
Dated subordinated debenture loans 5,949 4,435
Hybrid capital loans 3,002 3,293
Total 8,951 7,728
Debenture loans are subordinated to other liabilities. Dated debenture loans entitle the lender to payment before hybrid capital loans. Within each respective category, the loans enti-tle lenders to equal payment rights.
The carrying amount at year end representing revaluations in the fair value of the hedged part of subordinated liabilities is included in “Fair value changes of the hedged items in portfolio hedge of interest rate risk” under “Liabilities” and amounts to EUR 386 m (EUR 417 m).
At 31 December 2015 six loans – with terms specified below – exceeded 10% of the total outstanding volume dated subor-dinated loans.
EURm
Nominalvalue
Carrying amount
Interest rate (coupon)
Dated loan1 1,250 1,142 Fixed
Dated loan2 750 749 Fixed
Dated loan3 1,000 998 Fixed
Dated loan4 750 747 Fixed
Dated loan5 1,000 911 Fixed
Dated loan6 750 743 Fixed
1) Maturity date 13 May 2021.2) Call date 15 February 2017, maturity date 15 February 2022.3) Maturity date 2 March 2020.4) Maturity date 29 March 2021.5) Maturity date 21 September 2022.6) Call date 10 November 2020, maturity date 10 November 2025.
P34 Untaxed reserves
EURm31 Dec
201531 Dec
2014
Accumulated excess depreciation, equipment 2 4
Main assumptions for defined benefit obligations
2015 2014
Discount rate 1.6% 2.2%
The calculation is based on pay and pension levels on the accounting date Yes Yes
Next year’s expected payment regarding defined benefit plans amounts to EUR 70m.
P32 Retirement benefit obligations, cont.P32 Retirement benefit obligations
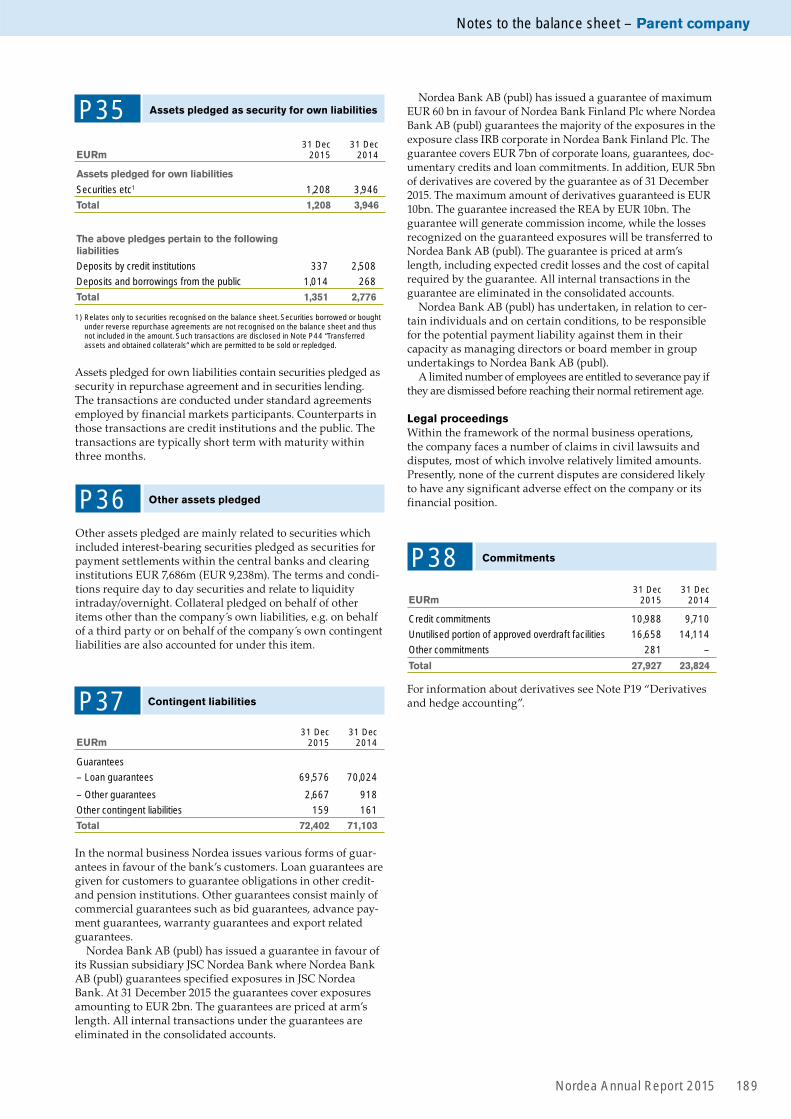
Notes to the balance sheet – Parent company
Nordea Annual Report 2015 189
P36 Other assets pledged
Other assets pledged are mainly related to securities which included interest-bearing securities pledged as securities for payment settlements within the central banks and clearing institutions EUR 7,686m (EUR 9,238m). The terms and condi-tions require day to day securities and relate to liquidity intraday/overnight. Collateral pledged on behalf of other items other than the company s own liabilities, e.g. on behalf of a third party or on behalf of the company s own contingent liabilities are also accounted for under this item.
P35 Assets pledged as security for own liabilities
EURm31 Dec
201531 Dec
2014
Assets pledged for own liabilities
Securities etc1 1,208 3,946
Total 1,208 3,946
The above pledges pertain to the following liabilities
Deposits by credit institutions 337 2,508
Deposits and borrowings from the public 1,014 268
Total 1,351 2,776
1) Relates only to securities recognised on the balance sheet. Securities borrowed or bought under reverse repurchase agreements are not recognised on the balance sheet and thus not included in the amount. Such transactions are disclosed in Note P44 “Transferred assets and obtained collaterals” which are permitted to be sold or repledged.
Assets pledged for own liabilities contain securities pledged as security in repurchase agreement and in securities lending. The transactions are conducted under standard agreements employed by financial markets participants. Counterparts in those transactions are credit institutions and the public. The transactions are typically short term with maturity within three months.
P37 Contingent liabilities
EURm31 Dec
201531 Dec
2014
Guarantees
– Loan guarantees 69,576 70,024
– Other guarantees 2,667 918
Other contingent liabilities 159 161
Total 72,402 71,103
In the normal business Nordea issues various forms of guar-antees in favour of the bank’s customers. Loan guarantees are given for customers to guarantee obligations in other credit- and pension institutions. Other guarantees consist mainly of commercial guarantees such as bid guarantees, advance pay-ment guarantees, warranty guarantees and export related guarantees.
Nordea Bank AB (publ) has issued a guarantee in favour of its Russian subsidiary JSC Nordea Bank where Nordea Bank AB (publ) guarantees specified exposures in JSC Nordea Bank. At 31 December 2015 the guarantees cover exposures amounting to EUR 2bn. The guarantees are priced at arm’s length. All internal transactions under the guarantees are eliminated in the consolidated accounts.
P38 Commitments
EURm31 Dec
201531 Dec
2014
Credit commitments 10,988 9,710
Unutilised portion of approved overdraft facilities 16,658 14,114
Other commitments 281 –
Total 27,927 23,824
For information about derivatives see Note P19 “Derivatives and hedge accounting”.
Nordea Bank AB (publ) has issued a guarantee of maximum EUR 60 bn in favour of Nordea Bank Finland Plc where Nordea Bank AB (publ) guarantees the majority of the exposures in the exposure class IRB corporate in Nordea Bank Finland Plc. The guarantee covers EUR 7bn of corporate loans, guarantees, doc-umentary credits and loan commitments. In addition, EUR 5bn of derivatives are covered by the guarantee as of 31 December 2015. The maximum amount of derivatives guaranteed is EUR 10bn. The guarantee increased the REA by EUR 10bn. The guarantee will generate commission income, while the losses recognized on the guaranteed exposures will be transferred to Nordea Bank AB (publ). The guarantee is priced at arm’s length, including expected credit losses and the cost of capital required by the guarantee. All internal transactions in the guarantee are eliminated in the consolidated accounts.
Nordea Bank AB (publ) has undertaken, in relation to cer-tain individuals and on certain conditions, to be responsible for the potential payment liability against them in their capacity as managing directors or board member in group undertakings to Nordea Bank AB (publ).
A limited number of employees are entitled to severance pay if they are dismissed before reaching their normal retirement age.
Legal proceedingsWithin the framework of the normal business operations, the company faces a number of claims in civil lawsuits and disputes, most of which involve relatively limited amounts. Presently, none of the current disputes are considered likely to have any significant adverse effect on the company or its financial position.

Nordea Annual Report 2015190
Parent company – Other notes
Table A2 Transitional own funds
For information of the capital adequacy regulations see Note G37 “Capital adequacy”.
Common Equity Tier 1 capital: instruments and reserves
(A) amount at disclosure date,
EURm
(C) amounts subject to pre- regulation (eu) no
575/2013 treatment or prescribed residual
amount of regulation (eu) no 575/2013
1 Capital instruments and the related share premium accounts 5,130 —
of which: Share capital 4,050 —
2 Retained earnings 13,050 —
3 Accumulated other comprehensive income (and other reserves, to include unrealised gains and losses under the applicable accounting standards) –21 —
5a Independently reviewed interim profits net of any foreseeable charge or dividend –664 0
6 Common Equity Tier 1 (CET1) capital before regulatory adjustments 17,495 −
Common Equity Tier 1 (CET1) capital: regulatory adjustments
7 Additional value adjustments (negative amount) –19 —
8 Intangible assets (net of related tax liability) (negative amount) –1,091 —
10 Deferred tax assets that rely on future profitability excluding those arising from temporary differences (net of related tax liability where the conditions in Article 38 (3) are met) (negative amount) 0 —
11 Fair value reserves related to gains or losses on cash flow hedges 16 —
12 Negative amounts resulting from the calculation of expected loss amounts 0 0
14 Gains or losses on liabilities valued at fair value resulting from changes in own credit standing –28 —
15 Defined-benefit pension fund assets (negative amount) 0 0
16 Direct and indirect holdings by an institution of own CET1 instruments (negative amount) 0 —
25 of which: deferred tax assets arising from temporary differences 0 —
25b Foreseeable tax charges relating to CET1 items (negative amount) 0 —
26a Regulatory adjustments relating to unrealised gains and losses pursuant to Articles 467 and 468 0 —
Of which: …filter for unrealised loss 1 0 19
Of which: …filter for unrealised gain 1 0 137
28 Total regulatory adjustments to Common equity Tier 1 (CET1) –1,121 −
29 Common Equity Tier 1 (CET1) capital 16,373 −
Additional Tier 1 (AT1) capital: instruments
30 Capital instruments and the related share premium accounts 2,241 —
33 Amount of qualifying items referred to in Article 484 (4) and the related share premium accounts subject to phase out from AT1 729 0
36 Additional Tier 1 (AT1) capital before regulatory adjustments 2,970 −
Additional Tier 1 (AT1) capital: regulatory adjustments
37 Direct and indirect holdings by an institution of own AT1 Instruments (negative amount) –30 —
43 Total regulatory adjustments to Additional Tier 1 (AT1) capital –30 −
44 Additional Tier 1 (AT1) capital 2,941 −
45 Tier 1 capital (T1 = CET1 + AT1) 19,314 −
Tier 2 (T2) capital: instruments and provisions
46 Capital instruments and the related share premium accounts 5,686 —
47 Amount of qualifying items referred to in Article 484 (5) and the related share premium accounts subject to phase out from T2 0 —
50 Credit risk adjustments 109 —
51 Tier 2 (T2) capital before regulatory adjustments 5,795 −
P39 Capital adequacy
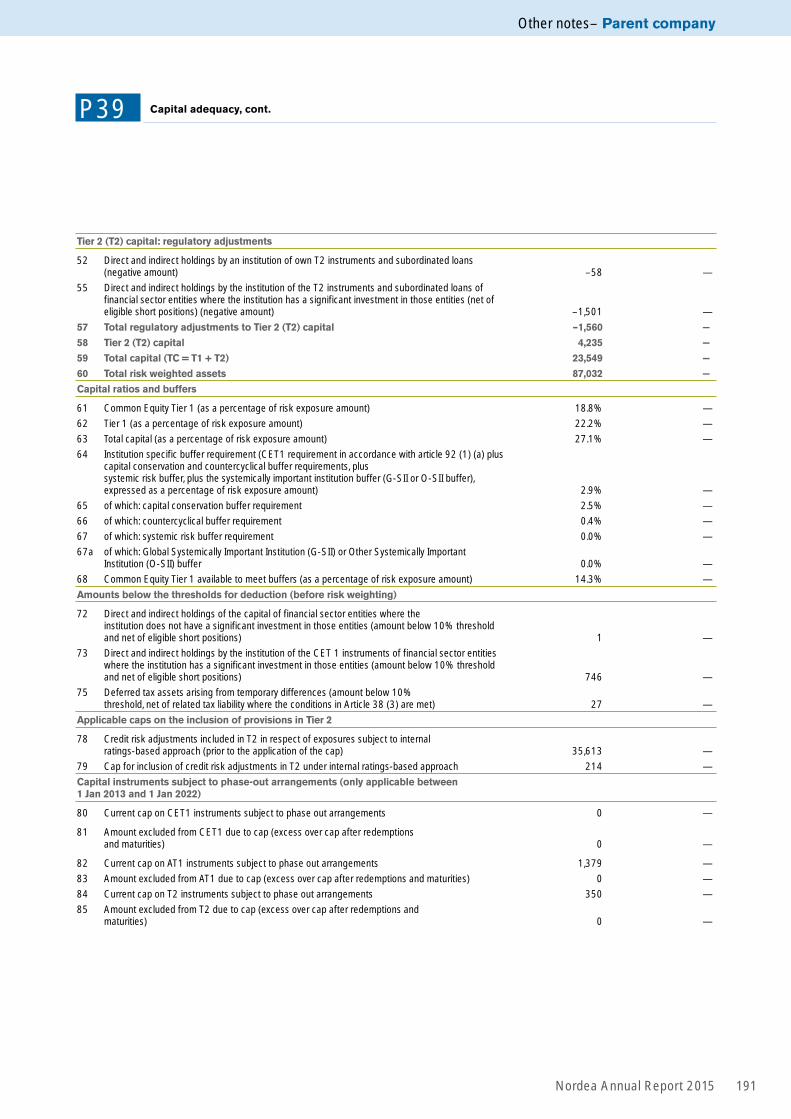
Other notes – Parent company
Nordea Annual Report 2015 191
Tier 2 (T2) capital: regulatory adjustments
52 Direct and indirect holdings by an institution of own T2 instruments and subordinated loans (negative amount) –58 —
55 Direct and indirect holdings by the institution of the T2 instruments and subordinated loans of financial sector entities where the institution has a significant investment in those entities (net of eligible short positions) (negative amount) –1,501 —
57 Total regulatory adjustments to Tier 2 (T2) capital –1,560 −
58 Tier 2 (T2) capital 4,235 −
59 Total capital (TC = T1 + T2) 23,549 −
60 Total risk weighted assets 87,032 −
Capital ratios and buffers
61 Common Equity Tier 1 (as a percentage of risk exposure amount) 18.8% —
62 Tier 1 (as a percentage of risk exposure amount) 22.2% —
63 Total capital (as a percentage of risk exposure amount) 27.1% —
64 Institution specific buffer requirement (CET1 requirement in accordance with article 92 (1) (a) plus capital conservation and countercyclical buffer requirements, plus systemic risk buffer, plus the systemically important institution buffer (G-SII or O-SII buffer), expressed as a percentage of risk exposure amount) 2.9% —
65 of which: capital conservation buffer requirement 2.5% —
66 of which: countercyclical buffer requirement 0.4% —
67 of which: systemic risk buffer requirement 0.0% —
67a of which: Global Systemically Important Institution (G-SII) or Other Systemically Important Institution (O-SII) buffer 0.0% —
68 Common Equity Tier 1 available to meet buffers (as a percentage of risk exposure amount) 14.3% —
Amounts below the thresholds for deduction (before risk weighting)
72 Direct and indirect holdings of the capital of financial sector entities where the institution does not have a significant investment in those entities (amount below 10% threshold and net of eligible short positions) 1 —
73 Direct and indirect holdings by the institution of the CET 1 instruments of financial sector entities where the institution has a significant investment in those entities (amount below 10% threshold and net of eligible short positions) 746 —
75 Deferred tax assets arising from temporary differences (amount below 10% threshold, net of related tax liability where the conditions in Article 38 (3) are met) 27 —
Applicable caps on the inclusion of provisions in Tier 2
78 Credit risk adjustments included in T2 in respect of exposures subject to internal ratings-based approach (prior to the application of the cap) 35,613 —
79 Cap for inclusion of credit risk adjustments in T2 under internal ratings-based approach 214 —
Capital instruments subject to phase-out arrangements (only applicable between1 Jan 2013 and 1 Jan 2022)
80 Current cap on CET1 instruments subject to phase out arrangements 0 —
81 Amount excluded from CET1 due to cap (excess over cap after redemptions and maturities) 0 —
82 Current cap on AT1 instruments subject to phase out arrangements 1,379 —
83 Amount excluded from AT1 due to cap (excess over cap after redemptions and maturities) 0 —
84 Current cap on T2 instruments subject to phase out arrangements 350 —
85 Amount excluded from T2 due to cap (excess over cap after redemptions and maturities) 0 —
P39 Capital adequacy, cont.
Other notes– Parent company

Parent company – Other notes
Nordea Annual Report 2015192
P39 Capital adequacy, cont.
Leverage ratio31 Dec 2015 31 Dec 2014
Tier 1 capital, transitional definition, EURm1 19,314 20,047
Leverage ratio exposure, EURm 227,029 225,148
Leverage ratio, percentage 8.5 8.9
1) Including profit of the period.
Minimum capital requirement and REA 31 Dec 2015 31 Dec 2014
EURm
Minimum capital
requirement REA
Minimum capital
requirement REA
Credit risk 6,346 79,328 5,759 71,986
- of which counterparty credit risk 133 1,660 100 1,249
IRB 2,849 35,613 2,674 33,429
- corporate 2,367 29,584 2,130 26,622
- advanced 1,717 21,467 1,461 18,257
- foundation 649 8,117 669 8,365
- institutions 256 3,195 302 3,777
- retail 125 1,562 148 1,854
- secured by immovable property collateral 7 84 7 86
- other retail 118 1,479 141 1,768
- other 102 1,272 94 1,176
Standardised 3,497 43,715 3,085 38,557
- central governments or central banks 5 66 14 174
- regional governments or local authorities 2 19 1 8
- public sector entities — — — —
- multilateral development banks — — — —
- international organisations — — — —
- institutions 1,279 15,986 1,319 16,481
- corporate 42 529 57 718
- retail 26 323 28 345
- secured by mortgages on immovable properties 212 2,646 202 2,530
- in default 3 43 5 60
- associated with particularly high risk — — — —
- covered bonds 0 0 0 0
- institutions and corporates with a short-term — — — —
- collective investments undertakings (CIU) — — — —
- equity 1,925 24,065 1,451 18,139
- other items 3 36 8 102
Credit Value Adjustment Risk 12 156 14 172
Market risk 210 2,623 218 2,724
- trading book, Internal Approach 23 288 42 524
- trading book, Standardised Approach1 — — 2 26
- banking book, Standardised Approach 187 2,335 174 2,174
Operational risk 378 4,730 322 4,028
Standardised 378 4,730 322 4,028
Additional risk exposure amount due to Article 3 CRR 16 195 − −
Sub total 6,963 87,032 6,313 78,910
Adjustment for Basel I floor
Additional capital requirement according to Basel I floor — — — —
Total 6,963 87,032 6,313 78,910
1) Market risk – of which trading book, Standardised Approach, have been restated for 2014.
More Capital Adequacy information can be found in the section “Risk, Liquidity and Capital Management”.
Parent company – Other notes

Nordea Annual Report 2015 193
Table A3 – Capital main features template — CET 1
Common equity Tier 1 capital
1 Issuer Nordea Bank AB (publ)
2 Unique identifier (eg CUSIP, ISIN or Bloomberg identifier for private placement) SE0000427361
3 Governing law(s) of the instrument Swedish
Regulatory treatment
4 Transitional CRR rules Common Equity Tier 1
5 Post-transitional CRR rules Common Equity Tier 1
6 Eligible at solo/(sub-)consolidated/solo & (sub-)consolidated Solo & consolidated
7 Instrument type (types to be specified by each jurisdiction) Share capital as publishedin Regulation (EU) No 575/2013 article 28
8 Amount recognised in regulatory capital (currency in million, as of most recent reporting date) EUR 4,050m
9 Nominal amount of instrument EUR 4,049,951,919
10 Accounting classification Shareholders’ equity
12 Perpetual or dated Perpetual
13 Original maturity date No maturity
14 Issuer call subject to prior supervisory approval No
Coupons / dividends
20a Fully discretionary, partially discretionary or mandatory (in terms of timing) Fully discretionary
20b Fully discretionary, partially discretionary or mandatory (in terms of amount) Fully discretionary
35 Position in subordination hierarchy in liquidation (specify instrument type immediately senior to instrument)
Additional Tier 1
36 Non-compliant transitioned features No
P39 Capital adequacy, cont.
Capital requirements for market risk, 31 December 2015Trading book, IA Trading book, SA Banking book, SA Total
EURm REACapital
requirement REACapital
requirement REACapital
requirement REACapital
requirement
Interest rate risk & other1 16 1 — — — — 16 1
Equity risk 122 10 — — — — 122 10
Foreign exchange risk 23 2 — — 2,335 187 2,357 189
Commodity risk — — — — — — — —
Settlement risk — — — — — — — —
Diversification effect –9 –1 — — — — –9 –1
Stressed Value-at-Risk 136 11 — — — — 136 11
Incremental Risk Measure 0 0 — — — — 0 0
Comprehensive Risk Measure — — — — — — — —
Total 288 23 − − 2,335 187 2,623 210
1) Interest rate risk column Trading book IA includes both general and specific interest rate risk which is elsewhere referred to as interest rate VaR and credit spread VaR.
Table A3–A5 include disclosure of capital instruments’ main features in accordance with §6.4 in FFFS 2014:18 and using the template in Annex II in article 3 in Commission implementing regulation (EU) No 1423/2013. Template items are excluded if not applicable.
Other notes– Parent company

Nordea Annual Report 2015194
P39 Capital adequacy, cont.
Table A4 – Capital instruments’ main features — AT
Additional Tier 1 instrument
1 Issuer Nordea Bank AB (publ)
Nordea Bank AB (publ)
Nordea Bank AB (publ)
Nordea Bank AB (publ)
Nordea Bank AB (publ)
Nordea Bank AB (publ)
Nordea Bank AB (publ)
Nordea Bank AB (publ)
2 Unique identi-fier (eg CUSIP, ISIN or Bloomberg identifier for private place-ment)
XS0200688256 W5795#AA7 W5795#AB5 US65557CAM55/US65557DAM39
US65557CAN39/US65557DAL55
XS1202091325 XS1202091671 XS1202090947
3 Governing law(s) of the instrument
Governed by Eng-lish law, except for the subordination provisions which are governed by Swedish law
Governed by Eng-lish law, except for the subordination provisions which are governed by Swedish law
Governed by Eng-lish law, except for the subordination provisions which are governed by Swedish law
Governed by English law, except for the subordination provisions which are governed by Swedish law
Governed by English law, except for the subordination provisions which are governed by Swedish law
Governed by Eng-lish law, except for the subordination provisions which are governed by Swedish law
Governed by Eng-lish law, except for the subordination provisions which are governed by Swedish law
Governed by Eng-lish law, except for the subordination provisions which are governed by Swedish law
Regulatory treatment
4 Transitional CRR rules
Additional Tier 1 Additional Tier 1 Additional Tier 1 Additional Tier 1 Additional Tier 1 Additional Tier 1 Additional Tier 1 Additional Tier 1
5 Post-transi-tional CRR rules
Tier 2 Ineligible Ineligible Additional Tier 1 Additional Tier 1 Additional Tier 1 Additional Tier 1 Additional Tier 1
6 Eligible at solo/(sub-)consoli-dated/solo & (sub-)consoli-dated
Solo & consolidated
Solo & consolidated
Solo & consolidated
Solo & consolidated
Solo & consolidated
Solo & consolidated
Solo & consolidated
Solo & consolidated
7 Instrument type (types to be specified by each jurisdic-tion)
Additional Tier 1 (grandfathered) as published in Regulation (EU) No 575/2013 article 484.4
Additional Tier 1 (grandfathered) as published in Regulation (EU) No 575/2013 article 484.4
Additional Tier 1 (grandfathered) as published in Regulation (EU) No 575/2013 article 484.4
Additional Tier 1as published in Regulation (EU) No 575/2013 article 52
Additional Tier 1as published in Regulation (EU) No 575/2013 article 52
Additional Tier 1as published in Regulation (EU) No 575/2013 article 52
Additional Tier 1as published in Regulation (EU) No 575/2013 article 52
Additional Tier 1as published in Regulation (EU) No 575/2013 article 52
8 Amount recog-nised in regula-tory capital (currency in million, as of most recent reporting date)
EUR 500m EUR 153m EUR 76m EUR 912m EUR 455m EUR 243m EUR 129m EUR 502m
9 Nominal amount of instrument
EUR 500m JPY 20,000m / EUR 153m
JPY 10,000m / EUR 76m
USD 1,000m / EUR 919m
USD 500m / EUR 459m
SEK 2,250m / EUR 245m
NOK 1,250m / EUR 130m
USD 550m / EUR 505m
9a Issue price 100 per cent 100 per cent 100 per cent 100 per cent 100 per cent 100 per cent 100 per cent 100 per cent
9b Redemption price
100 per cent of Nominal amount
100 per cent of Nominal amount
100 per cent of Nominal amount
100 per cent of Nominal amount
100 per cent of Nominal amount
100 per cent of Nominal amount
100 per cent of Nominal amount
100 per cent of Nominal amount
10 Accounting classification
Liability – amortised cost
Liability – amortised cost
Liability – amortised cost
Liability – amortised cost
Liability – amortised cost
Liability – amortised cost
Liability – amortised cost
Liability – amortised cost
11 Original date of issuance
17-Sep-2004 04-Mar-2005 12-Oct-2005 23-Sep-2014 23-Sep-2014 12-Mar-2015 12-Mar-2015 12-Mar-2015
12 Perpetual or dated
Perpetual Perpetual Perpetual Perpetual Perpetual Perpetual Perpetual Perpetual
13 Original matu-rity date
No maturity No maturity No maturity No maturity No maturity No maturity No maturity No maturity
14 Issuer call sub-ject to prior supervisory approval
Yes Yes Yes Yes Yes Yes Yes Yes
15 Optional call date, contin-gent call dates and redemption amount
17-Sep-2009In addition tax/regulatory call100 per cent of nominal amount
4-Mar-2035In addition tax/regulatory call100 per cent of nominal amount
12-Oct-2035In addition tax/regulatory call100 per cent of nominal amount
23-Sep-2019In addition tax/regulatory call100 per cent of nominal amount
23-Sep-2024In addition tax/regulatory call100 per cent of nominal amount
12-Mar-2020In addition tax/regulatory call100 per cent of nominal amount
12-Mar-2020In addition tax/regulatory call100 per cent of nominal amount
13-Sep-2021In addition tax/regulatory call100 per cent of nominal amount
16 Subsequent call dates, if applicable
17-Mar and 17-Sep each year after first call date
4-Mar and 4-Sep each year after first call date
12-Apr and 12-Oct each year after first call date
23-Mar and 23-Sep each year after first call date
23-Mar and 23-Sep each year after first call date
12-Mar, 12-Jun, 12-Sep and 12-Dec each year after first call date
12-Mar, 12-Jun, 12-Sep and 12-Dec each year after first call date
13-Sep each year after first call date
Parent company – Other notes

Nordea Annual Report 2015 195
Additional Tier 1 instrument
Coupons / dividends
17 Fixed or float-ing dividend / coupon
Floating Fixed to floating Fixed to floating Fixed Fixed Floating Floating Fixed
18 Coupon rate and any related index
Floating 10-year CMS +0.05 per cent per annum subject to 8 per cent cap
Fixed USD 3.75 per cent per annum, until first call date, thereaf-ter floating 6-month JPY deposit +1.22 per cent per annum
Fixed USD 3.84 per cent per annum, until first call date, thereaf-ter floating 6-month JPY deposit +1.40 per cent per annum
Fixed 5.50 per cent per annum, until first call date, thereafter fixed 5-year mid swap +3.563 per cent per annum
Fixed 6.125 per cent per annum, until first call date, thereafter fixed 5-year mid swap +3.388 per cent per annum
Floating 3-month STIBOR +3.10 per cent per annum
Floating 3-month NIBOR +3.10 per cent per annum
Fixed 5.25 per cent per annum, until first call date, thereafter fixed 5-year mid swap +3.244 per cent per annum
19 Existence of a dividend stop-per
Yes Yes Yes No No No No No
20a Fully discretion-ary, partially dis-cretionary or mandatory (in terms of timing)
Partially discretionaryDividend stopper
Partially discretionaryDividend stopper
Partially discretionaryDividend stopper
Fully discretionary Fully discretionary Fully discretionary Fully discretionary Fully discretionary
20b Fully discretion-ary, partially dis-cretionary or mandatory (in terms of amount)
Partially discretionary
Partially discretionary
Partially discretionary
Fully discretionary Fully discretionary Fully discretionary Fully discretionary Fully discretionary
21 Existence of step up or other incentive to redeem
No Yes Yes No No No No No
22 Noncumulative or cumulative
Non-cumulative Non-cumulative Non-cumulative Non-cumulative Non-cumulative Non-cumulative Non-cumulative Non-cumulative
23 Convertible or non-convertible
Non-convertible Non-convertible Non-convertible Non-convertible Non-convertible Non-convertible Non-convertible Non-convertible
30 Write-down features
Yes Yes Yes Yes Yes Yes Yes Yes
31 If write-down, write-down trigger(s)
To avoid liquida-tion
To avoid liquida-tion
To avoid liquida-tion
Group CET1 ratio 8 per centIssuer CET1 ratio 5.125 per cent
Group CET1 ratio 8 per centIssuer CET1 ratio 5.125 per cent
Group CET1 ratio 8 per centIssuer CET1 ratio 5.125 per cent
Group CET1 ratio 8 per centIssuer CET1 ratio 5.125 per cent
Group CET1 ratio 8 per centIssuer CET1 ratio 5.125 per cent
32 If write-down, full or partial
Fully or Partially Fully or Partially Fully or Partially Fully or Partially Fully or Partially Fully or Partially Fully or Partially Fully or Partially
33 If write-down, permanent or temporary
Temporary Temporary Temporary Temporary Temporary Temporary Temporary Temporary
34 If temporary write-down, description of write-up mech-anism
Shareholders res-olution regarding reconversion and reinstatement made out of avail-able distributable funds
Shareholders res-olution regarding reconversion and reinstatement, made out of avail-able distribution funds
Shareholders res-olution regarding reconversion and reinstatement, made out of avail-able distribution funds
Fully discretion-ary, if a positive net profit of both Issuer and Group
Fully discretion-ary, if a positive net profit of both Issuer and Group
Fully discretionary, if a positive net profit of both Issuer and Group
Fully discretionary, if a positive net profit of both Issuer and Group
Fully discretionary, if a positive net profit of both Issuer and Group
35 Position in sub-ordination hier-archy in liquida-tion (specify instrument type immediately senior to instru-ment)
Tier 2 Tier 2 Tier 2 Tier 2 Tier 2 Tier 2 Tier 2 Tier 2
36 Non-compliant transitioned features
Yes Yes Yes No No No No No
37 If yes, specify non-compliant features
No specified trig-ger level, dividend stopper
No specified trig-ger level, step-up, dividend stopper
No specified trig-ger level, step-up, dividend stopper
N/A N/A N/A N/A N/A
P39 Capital adequacy, cont.
Other notes– Parent company
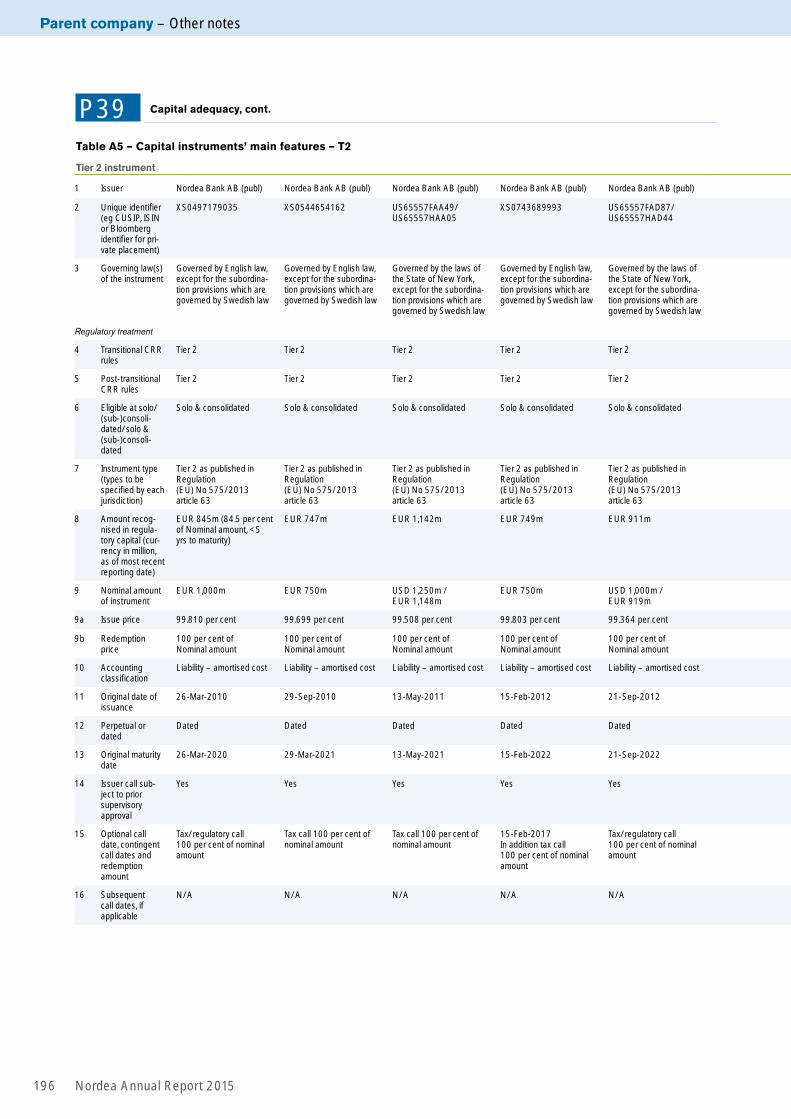
Parent company – Notes to the balance sheet
Nordea Annual Report 2015196
P39 Capital adequacy, cont.
Table A5 – Capital instruments’ main features – T2
Tier 2 instrument
1 Issuer Nordea Bank AB (publ) Nordea Bank AB (publ) Nordea Bank AB (publ) Nordea Bank AB (publ) Nordea Bank AB (publ)
2 Unique identifier (eg CUSIP, ISIN or Bloomberg identifier for pri-vate placement)
XS0497179035 XS0544654162 US65557FAA49/US65557HAA05
XS0743689993 US65557FAD87/US65557HAD44
3 Governing law(s) of the instrument
Governed by English law, except for the subordina-tion provisions which are governed by Swedish law
Governed by English law, except for the subordina-tion provisions which are governed by Swedish law
Governed by the laws of the State of New York, except for the subordina-tion provisions which are governed by Swedish law
Governed by English law, except for the subordina-tion provisions which are governed by Swedish law
Governed by the laws of the State of New York, except for the subordina-tion provisions which are governed by Swedish law
Regulatory treatment
4 Transitional CRR rules
Tier 2 Tier 2 Tier 2 Tier 2 Tier 2
5 Post-transitional CRR rules
Tier 2 Tier 2 Tier 2 Tier 2 Tier 2
6 Eligible at solo/(sub-)consoli-dated/solo & (sub-)consoli-dated
Solo & consolidated Solo & consolidated Solo & consolidated Solo & consolidated Solo & consolidated
7 Instrument type (types to be specified by each jurisdiction)
Tier 2 as published in Regulation (EU) No 575/2013 article 63
Tier 2 as published in Regulation (EU) No 575/2013 article 63
Tier 2 as published in Regulation (EU) No 575/2013 article 63
Tier 2 as published in Regulation (EU) No 575/2013 article 63
Tier 2 as published in Regulation (EU) No 575/2013 article 63
8 Amount recog-nised in regula-tory capital (cur-rency in million, as of most recent reporting date)
EUR 845m (84.5 per cent of Nominal amount, <5 yrs to maturity)
EUR 747m EUR 1,142m EUR 749m EUR 911m
9 Nominal amount of instrument
EUR 1,000m EUR 750m USD 1,250m / EUR 1,148m
EUR 750m USD 1,000m / EUR 919m
9a Issue price 99.810 per cent 99.699 per cent 99.508 per cent 99.803 per cent 99.364 per cent
9b Redemption price
100 per cent of Nominal amount
100 per cent of Nominal amount
100 per cent of Nominal amount
100 per cent of Nominal amount
100 per cent of Nominal amount
10 Accounting classification
Liability – amortised cost Liability – amortised cost Liability – amortised cost Liability – amortised cost Liability – amortised cost
11 Original date of issuance
26-Mar-2010 29-Sep-2010 13-May-2011 15-Feb-2012 21-Sep-2012
12 Perpetual or dated
Dated Dated Dated Dated Dated
13 Original maturity date
26-Mar-2020 29-Mar-2021 13-May-2021 15-Feb-2022 21-Sep-2022
14 Issuer call sub-ject to prior supervisory approval
Yes Yes Yes Yes Yes
15 Optional call date, contingent call dates and redemption amount
Tax/regulatory call100 per cent of nominal amount
Tax call 100 per cent of nominal amount
Tax call 100 per cent of nominal amount
15-Feb-2017In addition tax call100 per cent of nominal amount
Tax/regulatory call100 per cent of nominal amount
16 Subsequent call dates, if applicable
N/A N/A N/A N/A N/A
Parent company – Other notes

Other notes – Parent company
Nordea Annual Report 2015 197
Nordea Bank AB (publ) Nordea Bank AB (publ) Nordea Bank AB (publ) Nordea Bank AB (publ)
XS1292434146 XS1292433767 N/A XS1317439559
Governed by English law, except for the subordina-tion provisions which are governed by Swedish law
Governed by English law, except for the subordina-tion provisions which are governed by Swedish law
Governed by English law, except for the subordina-tion provisions which are governed by Swedish law
Governed by English law, except for the subordina-tion provisions which are governed by Swedish law
Tier 2 Tier 2 Tier 2 Tier 2
Tier 2 Tier 2 Tier 2 Tier 2
Solo & consolidated Solo & consolidated Solo & consolidated Solo & consolidated
Tier 2 as published in Regulation (EU) No 575/2013 article 63
Tier 2 as published in Regulation (EU) No 575/2013 article 63
Tier 2 as published in Regulation (EU) No 575/2013 article 63
Tier 2 as published in Regulation (EU) No 575/2013 article 63
EUR 185m EUR 250m EUR 114m EUR 743m
SEK 1,700m / EUR 185m
SEK 2,300m / EUR 250m
JPY 15,000m / EUR 114m
EUR 750m
100 per cent 100 per cent 100 per cent 99.434 per cent
100 per cent of Nominal amount
100 per cent of Nominal amount
100 per cent of Nominal amount
100 per cent of Nominal amount
Liability – amortised cost Liability – amortised cost Liability – amortised cost Liability – amortised cost
17-Sep-2015 17-Sep-2015 06-Oct-2015 10-Nov-2015
Dated Dated Dated Dated
17-Sep-2025 17-Sep-2025 06-Oct-2025 10-Nov-2025
Yes Yes Yes Yes
17-Sep-2020In addition tax/regulatory call 100 per cent of nominal amount
17-Sep-2020In addition tax/regulatory call 100 per cent of nominal amount
Tax/regulatory call100 per cent of nominal amount
10-Nov-2020In addition tax/regulatory call 100 per cent of nominal amount
17-Mar, 17-Jun, 17-Sep and 17-Dec each year after first call date
17-Sep each year after first call date
N/A 10-Nov each year after first call date
P39 Capital adequacy, cont.
Other notes– Parent company

Parent company – Other notes
Nordea Annual Report 2015198
Coupons / dividends
17 Fixed or floating dividend / coupon
Fixed Fixed Fixed Fixed Fixed
18 Coupon rate and any related index
4.50% 4.00% 4.875% Fixed 4.625 per cent per annum (equivalent to Euro Swap Rate +3.15 per cent per annum) to call date, thereafter reset fixed rate to Euro Swap Rate +3.15 per cent per annum
4.250%
19 Existence of a dividend stopper
No No No No No
20a Fully discretion-ary, partially discretionary or mandatory (in terms of timing)
Mandatory Mandatory Mandatory Mandatory Mandatory
20b Fully discretion-ary, partially discretionary or mandatory (in terms of amount)
Mandatory Mandatory Mandatory Mandatory Mandatory
21 Existence of step up or other incentive to redeem
No No No No No
22 Noncumulative or cumulative
Non-cumulative Non-cumulative Non-cumulative Non-cumulative Non-cumulative
23 Convertible or non-convertible
Non-convertible Non-convertible Non-convertible Non-convertible Non-convertible
30 Write-down features
No No No No No
35 Position in subor-dination hierar-chy in liquidation (specify instru-ment type imme-diately senior to instrument)
Senior debt Senior debt Senior debt Senior debt Senior debt
36 Non-compliant transitioned features
No No No No No
P39 Capital adequacy, cont.
Table A5 – Capital instruments’ main features – T2, cont.
Tier 2 instrument

Other notes – Parent company
Nordea Annual Report 2015 199
Floating Fixed Fixed Fixed
Floating 3-month STIBOR +1.5 per cent per annum
Fixed 1.935 per cent per annum, until first call date, thereafter fixed 5-year mid swap +1.5 per cent per annum
1.160% Fixed 1.875 per cent per annum, until first call date, thereafter fixed 5-year mid swap +1.7 per cent per annum
No No No No
Mandatory Mandatory Mandatory Mandatory
Mandatory Mandatory Mandatory Mandatory
No No No No
Non-cumulative Non-cumulative Non-cumulative Non-cumulative
Non-convertible Non-convertible Non-convertible Non-convertible
No No No No
Senior debt Senior debt Senior debt Senior debt
No No No No
P39 Capital adequacy, cont.

Parent company – Other notes
Nordea Annual Report 2015200
P40 Classification of financial instruments
Financial assets at fair value through
profit or loss
31 Dec 2015, EURm Loans and
receivablesHeld to
maturityHeld for trading
Designated at fair value
through profit or loss
Derivatives used for hedging
Available for sale
Non-finan-cial assets,
group/associated
under-takings Total
Assets
Cash and balances with central banks 75 — — — — — — 75
Treasury bills 32 — 3,999 — — 2,874 — 6,905
Loans to credit institutions 90,005 — 4 0 — — — 90,009
Loans to the public 41,104 — 4,716 — — — — 45,820
Interest-bearing securities 28 2 3,963 86 — 8,084 — 12,163
Financial instruments pledged as collateral — — — — — — — —
Shares — — 2,330 33 — — — 2,363
Derivatives — — 2,863 — 2,148 — — 5,011
Fair value changes of the hedged items in portfolio hedge of interest rate risk 1 — — — — — — 1
Investments in group undertakings — — — — — — 19,394 19,394
Investments in associated undertakings — — — — — — 7 7
Intangible assets — — — — — — 1,091 1,091
Property and equipment — 138 138
Deferred tax assets — — — — — — 26 26
Current tax assets — — — — — — 3 3
Other assets 629 — — 1,010 — — 2,748 4,387
Prepaid expenses and accrued income 679 — — — — — 101 780
Total 132,553 2 17,875 1,129 2,148 10,958 23,508 188,173
Financial liabilities at fair value through
profit or loss
31 Dec 2015, EURm Held for trading
Designated at fair value
through profit or loss
Derivatives used for hedging
Other financial liabilities
Non-finan-cial liabili-
ties Total
Liabilities
Deposits by credit institutions 337 983 — 17,749 — 19,069
Deposits and borrowings from the public 1,014 683 — 59,346 — 61,043
Debt securities in issue — — — 68,908 — 68,908
Derivatives 3,109 — 1,071 — — 4,180
Fair value changes of the hedged items in portfolio hedge of interest rate risk — — — 1,158 — 1,158
Current tax liabilities — — — — 34 34
Other liabilities 136 1,982 — 330 1,083 3,531
Accrued expenses and prepaid income — — — 232 527 759
Deferred tax liabilities — — — — — —
Provisions — — — — 301 301
Retirement benefit liabilities — — — — 159 159
Subordinated liabilities — — — 8,951 — 8,951
Total 4,596 3,648 1,071 156,674 2,104 168,093

Other notes – Parent company
Nordea Annual Report 2015 201
Financial assets at fair value through
profit or loss
31 Dec 2014, EURm Loans and
receivablesHeld to
maturityHeld for trading
Designated at fair value
through profit or loss
Derivatives used for hedging
Available for sale
Non-finan-cial assets,
group/associated
under-takings Total
Assets
Cash and balances with central banks 931 — — — — — — 931
Treasury bills — — 2,427 — — 2,608 — 5,035
Loans to credit institutions 86,259 — 445 0 — — — 86,704
Loans to the public 34,804 — 5,005 — — — — 39,809
Interest-bearing securities 10 112 3,687 — — 7,512 — 11,321
Financial instruments pledged as collateral — — 43 — — — — 43
Shares — — 6,028 33 — — — 6,061
Derivatives — — 3,682 — 2,299 — — 5,981
Fair value changes of the hedged items in portfolio hedge of interest rate risk 1 — — — — — — 1
Investments in group undertakings — — — — — — 16,986 16,986
Investments in associated undertakings — — — — — — 7 7
Intangible assets — — — — — — 758 758
Property and equipment — — — — — — 119 119
Deferred tax assets — — — — — — 14 14
Current tax assets — — — — — — 50 50
Other assets 786 — — 10 — — 2,931 3,727
Prepaid expenses and accrued income 803 — — — — — 81 884
Total 123,594 112 21,317 43 2,299 10,120 20,946 178,431
Financial liabilities at fair value through
profit or loss
31 Dec 2014, EURm Held for trading
Designated at fair value
through profit or loss
Derivatives used for hedging
Other financial liabilities
Non-finan-cial liabili-
ties Total
Liabilities
Deposits by credit institutions 2,508 2,026 — 22,918 — 27,452
Deposits and borrowings from the public 268 466 — 48,633 — 49,367
Debt securities in issue — — — 63,280 — 63,280
Derivatives 3,443 — 1,210 — — 4,653
Fair value changes of the hedged items in portfolio hedge of interest rate risk — — — 1,368 — 1,368
Current tax liabilities — — — — 4 4
Other liabilities 285 — — 443 2,167 2,895
Accrued expenses and prepaid income — — — 198 444 642
Deferred tax liabilities — — — — 0 0
Provisions — — — — 206 206
Retirement benefit liabilities — — — — 171 171
Subordinated liabilities — — — 7,728 — 7,728
Total 6,504 2,492 1,210 144,568 2,992 157,766
P40 Classification of financial instruments, cont.

Parent company – Other notes
Nordea Annual Report 2015202
Financial assets and liabilities designated at fair value through profit or lossChanges in fair values of financial liabilities attributable to changes in credit riskThe funding of Markets operations is measured at fair value and classified into the category “Fair value through profit or loss”. The funding of Markets is generally of such a short term nature that the effect of changes in own credit risk is not sig-nificant.Changes in fair values of financial assets attributable to changes in credit riskThe lending in Markets is generally of such a short term nature (mainly overnight deposits) that the effect of changes in credit risk is not significant.
Comparison of carrying amount and contractual amount to be paid at maturity
2015, EURmCarrying amount
Amount to be
paid at maturity
Financial liabilities designated at fair value through profit or loss 3,648 3,648
2014, EURmCarrying amount
Amount to be
paid at maturity
Financial liabilities designated at fair value through profit or loss 2,492 2,492
P41 Assets and liabilities at fair value
31 Dec 2015 31 Dec 2014
EURmCarrying amount Fair value
Carrying amount Fair value
Financial assets
Cash and balances with central banks 75 75 931 931
Treasury bills 6,905 6,905 5,035 5,035
Loans 135,830 136,258 126,514 126,518
Interest-bearing securities 12,163 12,163 11,321 11,322
Financial instruments pledged as collateral — — 43 43
Shares 2,363 2,363 6,061 6,061
Derivatives 5,011 5,011 5,981 5,981
Other assets 1,639 1,639 796 796
Prepaid expenses and accrued income 679 679 803 803
Total financial assets 164,665 165,093 157,485 157,490
Financial liabilities
Deposits and debt instru-ments 159,129 159,080 149,195 149,792
Derivatives 4,180 4,180 4,653 4,653
Other liabilities 2,448 2,448 728 728
Accrued expenses and prepaid income 232 232 198 198
Total financial liabilities 165,989 165,940 154,774 155,371
For information about valuation of items measured at fair value on the balance sheet, see Note G1 “Accounting poli-cies” and the section “Determination of fair value items measured at fair value on the balance sheet” in Note G39 “Assets and liabilities at fair value”. For information about valuation of items not measured at fair value on the balance sheet, see the section “Financial assets and liabilities not held at fair value on the balance sheet”, in Note G39.
P40 Classification of financial instruments, cont.
Fair value of financial assets and liabilities
Parent company – Other notes

Other notes – Parent company
Nordea Annual Report 2015 203
P41 Assets and liabilities at fair value, cont.
Assets and liabilities held at fair value on the balance sheetCategorisation into the fair value hierarchy
31 Dec 2015, EURm
Quoted prices in active markets for the
same instrument (Level 1)
Valuation technique using observable data
(Level 2)
Valuation technique using non-observable data
(Level 3) Total
Assets at fair value on the balance sheet1
Treasury bills 2,613 4,260 — 6,873
Loans to credit institutions — 4 — 4
Loans to the public — 4,716 — 4,716
Interest-bearing securities2 6,944 5,034 155 12,133
Shares 2,334 — 29 2,363
Derivatives 4 4,983 24 5,011
Other assets — 1,010 — 1,010
Total 11,895 20,007 208 32,110
Liabilities at fair value on the balance sheet1
Deposits by credit institutions — 1,320 — 1,320
Deposits and borrowings from the public — 1,697 — 1,697
Derivatives 7 4,150 23 4,180
Other liabilities — 2,118 — 2,118
Total 7 9,285 23 9,315
1) All items are measured at fair value on a recurring basis at the end of each reporting period.2) Of which EUR 0m relates to the balance sheet item Financial instruments pledged as collateral.
31 Dec 2014, EURm
Quoted prices in active markets for the
same instrument (Level 1)
Valuation technique using observable data
(Level 2)
Valuation technique using non-observable data
(Level 3) Total
Assets at fair value on the balance sheet1
Treasury bills 2,814 2,221 — 5,035
Loans to credit institutions — 445 — 445
Loans to the public — 5,005 — 5,005
Interest-bearing securities2 7,229 3,858 155 11,242
Shares 6,032 — 29 6,061
Derivatives 50 5,911 20 5,981
Other assets — 10 — 10
Total 16,125 17,450 204 33,779
Liabilities at fair value on the balance sheet1
Deposits by credit institutions — 4,534 — 4,534
Deposits and borrowings from the public — 734 — 734
Derivatives 51 4,590 12 4,653
Other liabilities 185 100 — 285
Total 236 9,958 12 10,206
1) All items are measured at fair value on a recurring basis at the end of each reporting period.2) Of which EUR 43m relates to the balance sheet item Financial instruments pledged as collateral.
For determination of fair values for items measured at fair value on the balance sheet, see Note G39 “Assets and liabilities at fair value“.
Transfers between Level 1 and 2No transfers between Level 1 and 2 have occurred during the year. During 2014 the parent company transferred interest-bearing securities (including such financial instruments pledged as collateral) of EUR 570m from Level 2 to Level 1 of the fair value hierarchy. The reason for the transfers from Level 2 to Level 1 was that the instruments have again been actively traded during the year and reliable quoted prices are obtained in the markets. Transfers between levels are considered to have occurred at the end of the year.

Parent company – Other notes
Nordea Annual Report 2015204
P41 Assets and liabilities at fair value, cont.
Movements in Level 3
31 Dec 2015, EURm 1 Jan 2015 Purchases Transfers into level 3 Transfers out of level 3 31 Dec
2015
Interest-bearing securities 155 — — — 155
Shares 29 — — — 29
Derivatives (net) 8 –1 –1 –5 1
During the year Nordea Bank AB transferred derivatives (net) of EUR –5m from Level 3 to Level 2 and EUR –1m from Level 2 to Level 3. The reason for the transfer from Level 3 to Level 2 was that observable market data became available. The reason for the transfer from Level 2 to Level 3 was that observable market data was no longer available. Transfers
between levels are considered to have occurred at the end of the year. Fair value gains and losses in the income statement during the year are included in “Net result from items at fair value” (see Note G5). Assets and liabilities related to deriva-tives are presented net.
Unrealised gains and losses relates to those assets and lia-bilities held at the end of the year. No transfers have been made into or out of Level 3. Assets and liabilities related to derivatives are presented net.
The valuation processes for fair value measurements in Level 3Financial instrumentsFor information about the valuation processes, see Note G39 “Assets and liabilities at fair value”.
Fair value gains/losses recognised in the income statement during the year
31 Dec 2014, EURm 1 Jan 2014 Reclassification Realised Unrealised Sales31 Dec
2014
Interest-bearing securities 159 — — — –4 155
Shares 25 — 4 — — 29
Derivatives (net) 18 –3 — –7 — 8
Valuation techniques and inputs used in the fair value measurements in Level 3
31 Dec 2015, EURm Fair value Valuation techniques Unobservable input Range of fair value
Interest-bearing securities
Credit institutions1 155 Discounted cash flows Credit spread +/–0
Total 155 +/–0
Shares
Unlisted shares 29 Net asset value — +/–0
Total 29 +/–0
Derivatives
Interest rate derivatives 1 Option model Corrections, Volatilities +/–0
Total 1 +/–0
1) Of which EUR 155m is priced at a credit spread (the difference between the discount rate and LIBOR) of 1.45% and a reasonable change of this credit spread would not affect the fair value due to callability features.

Other notes – Parent company
Nordea Annual Report 2015 205
For more information about measurement of the fair values in the table above, see section “Financial assets and liabilities not held at fair value on the balance sheet” in Note G39 “Financial assets and liabilities not held at fair value”.
Valuation techniques and inputs used in the fair value measurements in Level 3
31 Dec 2014, EURm Fair value Valuation techniques Unobservable input Range of fair value
Interest-bearing securities
Credit institutions1 155 Discounted cash flows Credit spread +/–0
Total 155 +/–0
Shares
Unlisted shares 29 Net asset value — +/–2
Total 29 +/–2
Derivatives
Interest rate derivatives 8 Option model Corrections, Volatilities +/–0
Total 8 +/–0
1) Of which EUR 155m is priced at a credit spread (the difference between the discount rate and LIBOR) of 1.45% and a reasonable change of this credit spread would not affect the fair value due to callability features.
P41 Assets and liabilities at fair value, cont.
Financial assets and liabilities not held at fair value on the balance sheet
31 Dec 2015 31 Dec 2014
31 Dec 2015, EURmCarrying amount Fair value
Carrying amount Fair value
Level in fair value hierarchy
Assets not held at fair value on the balance sheet
Cash and balances with central banks 75 75 931 931 3
Treasury bills1,2 32 32 0 0 3
Loans 131,110 131,538 121,063 121,068 3
Interest-bearing securities2 30 30 122 123 1, 2, 3
Other assets 629 629 786 786 3
Prepaid expenses and accrued income 679 679 803 803 3
Total 132,555 132,983 123,705 123,711
Liabilities not held at fair value on the balance sheet
Deposits and debt instruments 156,112 156,063 143,927 144,524 3
Other liabilities 330 330 443 443 3
Accrued expenses and prepaid income 232 232 198 198 3
Total 156,674 156,625 144,568 145,165
1) The measurement principles follow those for similar instruments that are held at fair value on the balance sheet.2) The fair value of Treasury bills and Interest-bearing securities is EUR 62m (EUR 123m), of which EUR 2m (EUR 54m) is categorised in level 1 and EUR 0m (EUR 69m) in level 2 and
EUR 60m (EUR 0m) in level 3 of the fair value hierarchy.
For more information about measurement of the fair values in the table above, see section “Financial assets and liabilities not held at fair value on the balance sheet” in Note G39 “Financial assets and liabilities not held at fair value”.

Parent company – Other notes
Nordea Annual Report 2015206
Amounts not set off but subject to master netting agreements and similar agreements
31 Dec 2015, EURm
Gross recognised
financial assets1
Gross recog-nised financial
liabilities set off on the bal-
ance sheet
Net carrying amount on
the balance sheet2
Financial instruments
Financial collateral received
Cash collat-eral received Net amount
Assets
Derivatives 4,696 –320 4,376 –2,111 — –1,854 411
Securities borrowing agreements 4,718 — 4,718 — –4,718 — 0
Total 9,414 –320 9,094 –2,111 –4,718 –1,854 411
Amounts not set off but subject to master netting agreements and similar agreements
31 Dec 2015, EURm
Gross recognised
financial liabilities1
Gross recog-nised financial assets set off
on the bal-ance sheet
Net carrying amount on
the balance sheet2
Financial instruments
Financial collateral pledged
Cash collat-eral pledged Net amount
Liabilities
Derivatives 4,289 –320 3,969 –2,111 — –130 1,728
Securities lending agreements 1,351 — 1,351 — –1,351 — 0
Total 5,640 –320 5,320 –2,111 –1,351 –130 1,728
1) All amounts are measured at fair value.2) Securities borrowing agreements are on the balance sheet classified as “Loans to credit institutions” or “Loans to the public”. Securities lending agreements are on the balance sheet clas-
sified as “Deposits by credit institution” or as “Deposits and borrowings from the public”.
Amounts not set off but subject to master netting agreements and similar agreements
31 Dec 2014, EURm
Gross recognised
financial assets1
Gross recog-nised financial
liabilities set off on the bal-
ance sheet
Net carrying amount on
the balance sheet2
Financial instruments
Financial collateral received
Cash collat-eral received Net amount
Assets
Derivatives 5,558 –70 5,488 –1,286 — –2,157 2,045
Reverse repurchase agreements 218 — 218 — — — 218
Securities borrowing agreements 5,232 — 5,232 — –5,232 — 0
Total 11,008 –70 10,938 –1,286 –5,232 –2,157 2,263
Amounts not set off but subject to master netting agreements and similar agreements
31 Dec 2014, EURm
Gross recognised
financial liabilities1
Gross recog-nised financial assets set off
on the bal-ance sheet
Net carrying amount on
the balance sheet2
Financial instruments
Financial collateral pledged
Cash collat-eral pledged Net amount
Liabilities
Derivatives 4,189 –70 4,119 –1,286 — –363 2,470
Repurchase agreements 43 — 43 — — — 43
Securities lending agreements 2,732 — 2,732 — –2,732 — 0
Total 6,964 –70 6,894 –1,286 –2,732 –363 2,513
1) All amounts are measured at fair value.2) Reverse repurchase agreements and Securities borrowing agreements are on the balance sheet classified as “Loans to credit institutions” or “Loans to the public”. Repurchase agreements
and Securities lending agreements are on the balance sheet classified as “Deposits by credit institution” or as “Deposits and borrowings from the public”.
For more information about the master netting arrangements and similar agreements see section “Enforcable master netting arrangements and similar agreements” in Note G40 “Financial instruments set off on balance or subject to netting agreements”.
P42 Financial instruments set off on balance or subject to netting agreements
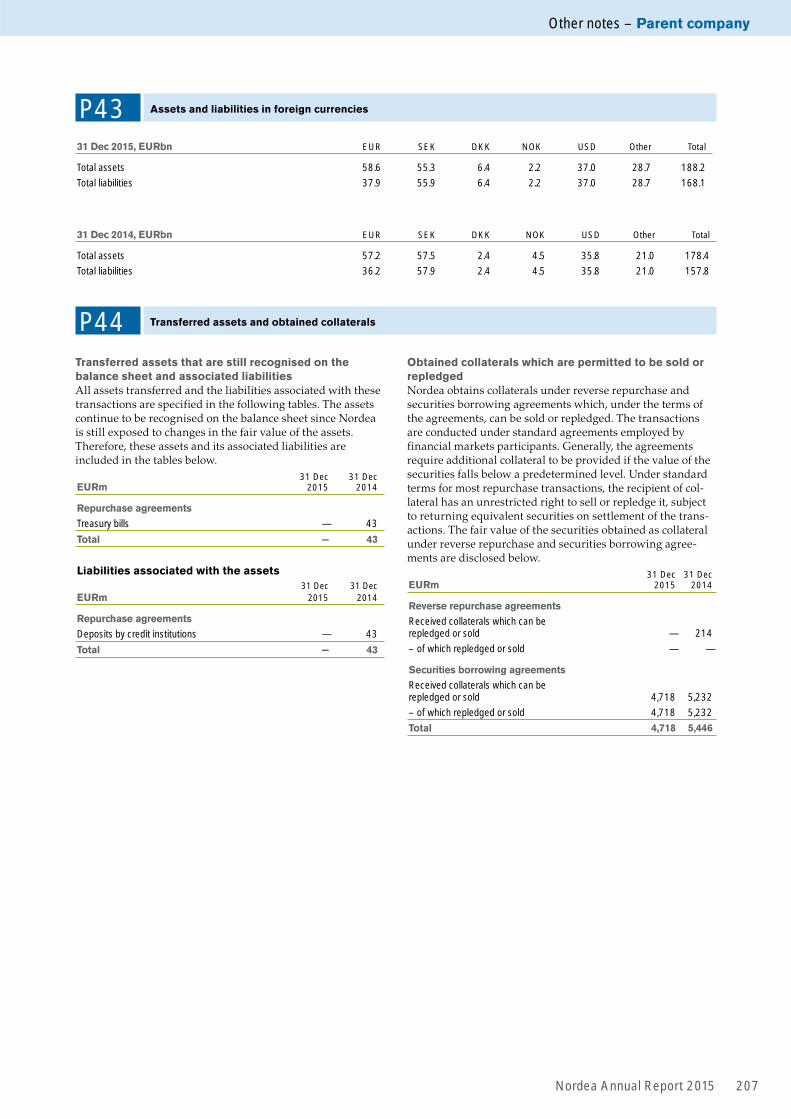
Other notes – Parent company
Nordea Annual Report 2015 207
P43 Assets and liabilities in foreign currencies
31 Dec 2015, EURbn EUR SEK DKK NOK USD Other Total
Total assets 58.6 55.3 6.4 2.2 37.0 28.7 188.2
Total liabilities 37.9 55.9 6.4 2.2 37.0 28.7 168.1
31 Dec 2014, EURbn EUR SEK DKK NOK USD Other Total
Total assets 57.2 57.5 2.4 4.5 35.8 21.0 178.4
Total liabilities 36.2 57.9 2.4 4.5 35.8 21.0 157.8
Obtained collaterals which are permitted to be sold or repledged Nordea obtains collaterals under reverse repurchase and securities borrowing agreements which, under the terms of the agreements, can be sold or repledged. The transactions are conducted under standard agreements employed by financial markets participants. Generally, the agreements require additional collateral to be provided if the value of the securities falls below a predetermined level. Under standard terms for most repurchase transactions, the recipient of col-lateral has an unrestricted right to sell or repledge it, subject to returning equivalent securities on settlement of the trans-actions. The fair value of the securities obtained as collateral under reverse repurchase and securities borrowing agree-ments are disclosed below.
EURm31 Dec
201531 Dec
2014
Reverse repurchase agreements
Received collaterals which can be repledged or sold — 214
– of which repledged or sold — —
Securities borrowing agreements
Received collaterals which can be repledged or sold 4,718 5,232
– of which repledged or sold 4,718 5,232
Total 4,718 5,446
P44 Transferred assets and obtained collaterals
Transferred assets that are still recognised on the balance sheet and associated liabilities All assets transferred and the liabilities associated with these transactions are specified in the following tables. The assets continue to be recognised on the balance sheet since Nordea is still exposed to changes in the fair value of the assets. Therefore, these assets and its associated liabilities are included in the tables below.
EURm31 Dec
201531 Dec
2014
Repurchase agreements
Treasury bills — 43
Total − 43
Liabilities associated with the assets
EURm31 Dec
201531 Dec
2014
Repurchase agreements
Deposits by credit institutions — 43
Total − 43

Parent company – Other notes
Nordea Annual Report 2015208208
P45 Maturity analysis for assets and liabilities
Expected maturity31 Dec 2015, EURm 31 Dec 2014, EURm
Expected to be recovered or settled: Expected to be recovered or settled:
NoteWithin 12
monthsAfter 12 months Total
Within 12 months
After 12 months Total
Cash and balances with central banks 75 — 75 931 — 931
Treasury bills P14 3,295 3,610 6,905 — 5,035 5,035
Loans to credit institutions P15 60,125 29,884 90,009 62,067 24,637 86,704
Loans to the public P15 37,993 7,827 45,820 34,829 4,980 39,809
Interest-bearing securities P16 2,165 9,998 12,163 3,849 7,472 11,321
Financial instruments pledged as collateral P17 — — — 43 — 43
Shares P18 2,330 33 2,363 6,028 33 6,061
Derivatives P19 994 4,017 5,011 1,520 4,461 5,981
Fair value changes of the hedged items in port-folio hedge of interest rate risk 0 1 1 — 1 1
Investments in group undertakings P20 30 19,364 19,394 30 16,956 16,986
Investments in associated undertakings P21 — 7 7 — 7 7
Intangible assets P22 — 1,091 1,091 — 758 758
Property and equipment P23 — 138 138 0 119 119
Deferred tax assets P13 20 6 26 11 3 14
Current tax assets 3 — 3 50 — 50
Other assets P24 4,387 — 4,387 3,727 — 3,727
Prepaid expenses and accrued income P25 412 368 780 496 388 884
Total assets 111,829 76,344 188,173 113,581 64,850 178,431
Deposits by credit institutions P26 12,693 6,376 19,069 15,595 11,857 27,452
Deposits and borrowings from the public P27 60,367 676 61,043 48,948 419 49,367
Debt securities in issue P28 32,726 36,182 68,908 33,755 29,525 63,280
Derivatives P19 1,151 3,029 4,180 1,023 3,630 4,653
Fair value changes of the hedged items in portfolio hedge of interest rate risk 296 862 1,158 178 1,190 1,368
Current tax liabilities 34 — 34 4 — 4
Other liabilities P29 3,531 — 3,531 2,895 — 2,895
Accrued expenses and prepaid income P30 759 — 759 642 — 642
Deferred tax liabilities P13 0 0 0 0 — 0
Provisions P31 299 2 301 43 163 206
Retirement benefit liabilities P32 8 151 159 — 171 171
Subordinated liabilities P33 642 8,309 8,951 — 7,728 7,728
Total liabilities 112,506 55,587 168,093 103,083 54,683 157,766
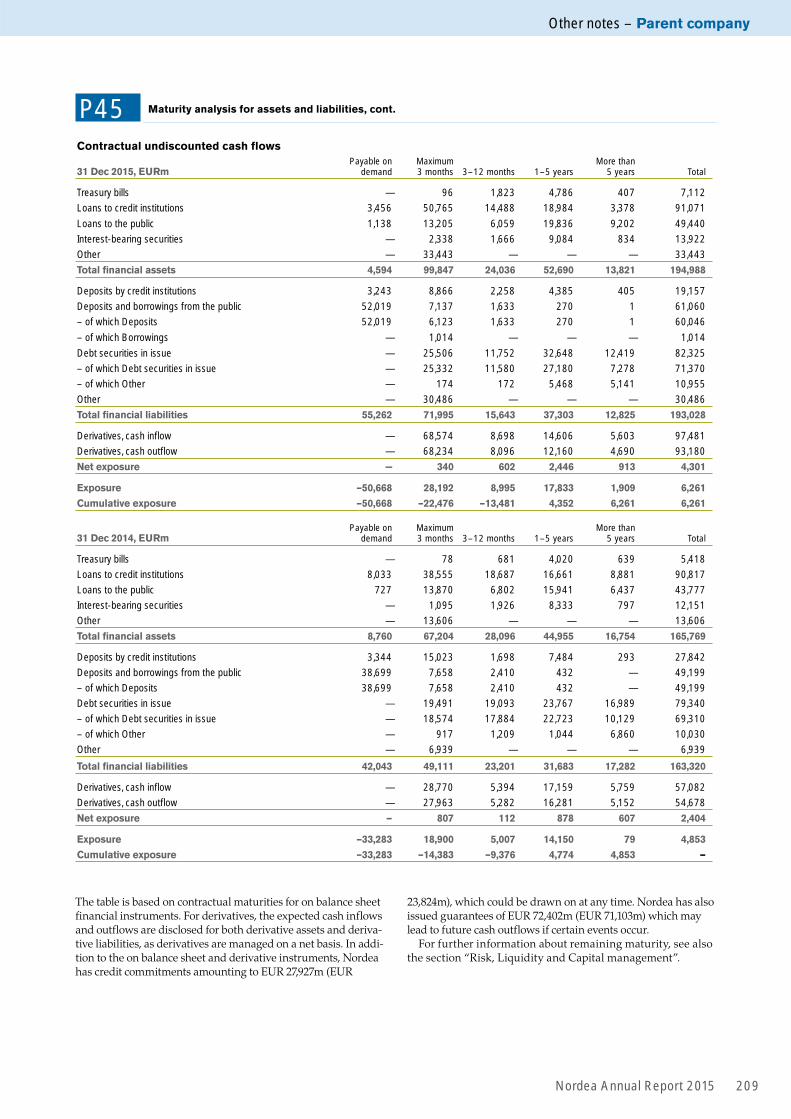
Other notes – Parent company
Nordea Annual Report 2015 209
P45 Maturity analysis for assets and liabilities, cont.
Contractual undiscounted cash flows
31 Dec 2015, EURmPayable on
demandMaximum 3 months 3–12 months 1–5 years
More than 5 years Total
Treasury bills — 96 1,823 4,786 407 7,112
Loans to credit institutions 3,456 50,765 14,488 18,984 3,378 91,071
Loans to the public 1,138 13,205 6,059 19,836 9,202 49,440
Interest-bearing securities — 2,338 1,666 9,084 834 13,922
Other — 33,443 — — — 33,443
Total financial assets 4,594 99,847 24,036 52,690 13,821 194,988
Deposits by credit institutions 3,243 8,866 2,258 4,385 405 19,157
Deposits and borrowings from the public 52,019 7,137 1,633 270 1 61,060
– of which Deposits 52,019 6,123 1,633 270 1 60,046
– of which Borrowings — 1,014 — — — 1,014
Debt securities in issue — 25,506 11,752 32,648 12,419 82,325
– of which Debt securities in issue — 25,332 11,580 27,180 7,278 71,370
– of which Other — 174 172 5,468 5,141 10,955
Other — 30,486 — — — 30,486
Total financial liabilities 55,262 71,995 15,643 37,303 12,825 193,028
Derivatives, cash inflow — 68,574 8,698 14,606 5,603 97,481
Derivatives, cash outflow — 68,234 8,096 12,160 4,690 93,180
Net exposure − 340 602 2,446 913 4,301
Exposure –50,668 28,192 8,995 17,833 1,909 6,261
Cumulative exposure –50,668 –22,476 –13,481 4,352 6,261 6,261
31 Dec 2014, EURmPayable on
demandMaximum 3 months 3–12 months 1–5 years
More than 5 years Total
Treasury bills — 78 681 4,020 639 5,418
Loans to credit institutions 8,033 38,555 18,687 16,661 8,881 90,817
Loans to the public 727 13,870 6,802 15,941 6,437 43,777
Interest-bearing securities — 1,095 1,926 8,333 797 12,151
Other — 13,606 — — — 13,606
Total financial assets 8,760 67,204 28,096 44,955 16,754 165,769
Deposits by credit institutions 3,344 15,023 1,698 7,484 293 27,842
Deposits and borrowings from the public 38,699 7,658 2,410 432 — 49,199
– of which Deposits 38,699 7,658 2,410 432 — 49,199
Debt securities in issue — 19,491 19,093 23,767 16,989 79,340
– of which Debt securities in issue — 18,574 17,884 22,723 10,129 69,310
– of which Other — 917 1,209 1,044 6,860 10,030
Other — 6,939 — — — 6,939
Total financial liabilities 42,043 49,111 23,201 31,683 17,282 163,320
Derivatives, cash inflow — 28,770 5,394 17,159 5,759 57,082
Derivatives, cash outflow — 27,963 5,282 16,281 5,152 54,678
Net exposure — 807 112 878 607 2,404
Exposure –33,283 18,900 5,007 14,150 79 4,853
Cumulative exposure –33,283 –14,383 –9,376 4,774 4,853 —
The table is based on contractual maturities for on balance sheet financial instruments. For derivatives, the expected cash inflows and outflows are disclosed for both derivative assets and deriva-tive liabilities, as derivatives are managed on a net basis. In addi-tion to the on balance sheet and derivative instruments, Nordea has credit commitments amounting to EUR 27,927m (EUR
23,824m), which could be drawn on at any time. Nordea has also issued guarantees of EUR 72,402m (EUR 71,103m) which may lead to future cash outflows if certain events occur.
For further information about remaining maturity, see also the section “Risk, Liquidity and Capital management”.

Parent company – Other notes
Nordea Annual Report 2015210
Compensation and loans to key management personnelCompensation and loans to key management personnel are specified in Note G7 “Staff costs”.
Other related-party transactionsNordea Bank AB (publ) takes part in a guarantee consortium to support Norwegian Eksportfinans ASA. For further information, see Note G45 “Related-party transactions”.
P46 Related-party transactions
The information below is presented from a Nordea perspective, meaning that the information shows the effect from related party transactions on the Nordea figures. For more information on definitions, see Note G1 “Accounting policies”, section 26 and Note G45 “Related-party transactions”.
Group undertakings Associated undertakings Other related parties
EURm 31 Dec 2015 31 Dec 2014 31 Dec 2015 31 Dec 2014 31 Dec 2015 31 Dec 2014
Assets
Loans and receivables 85,865 82,711 333 369 — —
Interest-bearing securities 87 64 — — — —
Derivatives 1,780 2,495 — 5 — —
Investments in associated undertakings — — — 7 — —
Investments in group undertakings 19,394 16,986 — — — —
Other assets 914 857 — — — —
Prepaid expenses and accrued income 579 638 — — — —
Total assets 108,619 103,751 333 381 — —
Group undertakings Associated undertakings Other related parties
EURm 31 Dec 2015 31 Dec 2014 31 Dec 2015 31 Dec 2014 31 Dec 2015 31 Dec 2014
Liabilities
Deposits 13,052 15,240 3 2 43 20
Debt securities in issue 111 260 — — — —
Derivatives 2,798 3,246 5 — — —
Other liabilities 2 4 — — — —
Accrued expenses and deferred income 286 240 — — — —
Subordinated liabilities 12 20 — — — —
Total liabilities 16,261 19,010 8 2 43 20
Off balance1 70,814 72,836 1,668 1,809 — —
1) Including guarantees to Nordea Bank Finland Plc and Nordea Bank Polska S.A., see Note P37 “Contingent liabilities” as well as nominal values on derivatives in associated undertakings.
Group undertakings Associated undertakings Other related parties
EURm 2015 2014 2015 2014 2015 2014
Net interest income and expenses –26 108 1 3 0 0Net fee and commission income 399 406 0 0 — —Net result from items at fair value –229 –309 –3 12 — —
Other operating income 748 687 — — — —Total operating expenses –565 –137 0 0 — —Profit before loan losses 327 755 —2 15 0 0

Nordea Annual Report 2015 211
Signing of the Annual report
The Board of Directors and the President and Group CEO certify that the annual report has been prepared in accordance with generally accepted accounting principles in Sweden and that the consolidated financial
statements have been prepared in accordance with the International Reporting Standards (IFRS/IAS) referred to in the European parliament and councils’ regulation (EC) 1606/2002, from 19 July 2002, on application of
International Accounting Standards. They give a true and fair view of the Group’s and the Company’s financial position and result. The Board of Directors’ Report for the Group and the Company gives a true and fair
overview of the development of the operations, financial position and result of the Group and the Company and describes the material risks and uncertainties that the Company and the Group companies are facing.
4 February 2016
Björn WahlroosChairman
Marie Ehrling Kari Ahola Tom Knutzen Vice Chairman Board member 1 Board member
Robin Lawther Toni H. Madsen Lars G Nordström Board member Board member1 Board member
Hans Christian Riise Sarah Russell Silvija Seres Board member 1 Board member Board member
Kari Stadigh Birger Steen Board member Board member
Casper von Koskull President and Group CEO
Our audit report was submitted on 12 February 2016
Öhrlings PricewaterhouseCoopers AB
Peter Clemedtson Catarina Ericsson Authorised Public Accountant Authorised Public Accountant Auditor-in-charge
1) Employee representative.
Signing of the Annual Report

Nordea Annual Report 2015212
Auditor’s report
Report on the annual accounts and the consolidated accountsWe have audited the annual accounts and the consolidated accounts of Nordea Bank AB (publ) for the year 2015. The annual accounts and the consolidated accounts of the company are included in the printed version of this docu-ment on pages 26–210.
Responsibilities of the Board of Directors and the Managing Director for the annual accounts and the consolidated accountsThe Board of Directors and the Managing Director are responsible for the preparation and fair presentation of the annual accounts in accordance with the Annual Accounts Act of Credit Institutions and Security Companies and for the fair presentation of the consolidated accounts in accordance with the International Financial Reporting Standards, as adopted by the EU, and the Annual Accounts Act of Credit Institutions and Securities Companies, and for such internal control as the Board of Directors and the Managing Director determine is necessary to enable the preparation of annual accounts and the consolidated accounts that are free from material misstatement, whether due to fraud or error.
Auditor’s responsibilityOur responsibility is to express an opinion on these annual accounts and consolidated accounts based on our audit. We conducted our audit in accordance with International Standards on Auditing and generally accepted auditing standards in Sweden. Those standards require that we comply with ethical requirements and plan and perform the audit to obtain reasonable assurance about whether the annual accounts and the consolidated accounts are free from material misstatements. An audit involves per-forming procedures to obtain audit evidence about the amounts and disclosures in the annual accounts and the consolidated accounts. The procedures selected depend on the auditor’s judgment, including the assessment of the risks of material misstatement of the annual accounts and the consolidated accounts, whether due to fraud or error. In making those risk assessments, the auditor considers internal control relevant to the company’s preparation and fair presentation of the annual accounts and the consoli-dated accounts in order to design audit procedures that are appropriate in the circumstances, but not for the pur-pose of expressing an opinion on the effectiveness of the company’s internal control. An audit also includes evalu-ating the appropriateness of accounting policies used and the reasonableness of accounting estimates made by the Board of Directors and the Managing Director, as well as evaluating the overall presentation of the annual accounts and the consolidated accounts.
We believe that the audit evidence we have obtained is sufficient and appropriate to provide a basis for our audit opinions.
OpinionsIn our opinion, the annual accounts have been prepared in accordance with the Annual Accounts Act of Credit Insti-tutions and Securities Companies, and present fairly, in all material respects, the financial position of the parent com-pany as of 31 December 2015 and of its financial perfor-mance and cash flows for the year then ended in accord-ance with the Annual Accounts Act of Credit Institutions and Securities Companies. The consolidated accounts have been prepared in accordance with the Annual Accounts Act of Credit Institutions and Securities Companies, and present fairly, in all material respects, the financial posi-tion of the group as of 31 December 2015 and of its finan-cial performance and cash flows for the year then ended in accordance with the International Financial Reporting Standards, as adopted by the EU, and the Annual Accounts Act of Credit Institutions and Securities Companies. A Corporate Governance Report has been prepared. The Board of Directors’ report and the Corporate Governance Report are consistent with the other parts of the annual accounts and the consolidated accounts.
We therefore recommend that the annual meeting of shareholders adopt the income statement and balance sheet of the parent company and the group.
Report on other legal and regulatory requirementsIn addition to our audit of the annual accounts and the consolidated accounts, we have also audited the proposed appropriations of the company’s profit or loss and the administration of the Board of Directors and the Manag-ing Director of Nordea Bank AB (publ) for the year 2015.
Responsibilities of the Board of Directors and the Managing DirectorThe Board of Directors is responsible for the proposal for appropriations of the company’s profit or loss, and the Board of Directors and the Managing Director are respon-sible for administration under the Companies Act and the Banking and Financing Business Act.
Auditor’s responsibilityOur responsibility is to express an opinion with reasonable assurance on the proposed appropriations of the company’s profit or loss and on the administration based on our audit. We conducted the audit in accordance with generally accepted auditing standards in Sweden.
As a basis for our opinion on the Board of Directors’ proposed appropriations of the company’s profit or loss, we examined the Board of Directors’ reasoned statement and a selection of supporting evidence in order to be able to assess whether the proposal is in accordance with the Companies Act.
As a basis for our opinion concerning discharge from liability, in addition to our audit of the annual accounts and the consolidated accounts, we examined significant
To the annual meeting of the shareholders of Nordea Bank AB (publ)Corporate identity number 516406-0120

Nordea Annual Report 2015 213
decisions, actions taken and circumstances of the company in order to determine whether any member of the Board of Directors or the Managing Director is liable to the company. We also examined whether any member of the Board of Directors or the Managing Director has, in any other way, acted in contravention of the Companies Act, the Bank-ing and Financing Business Act, the Annual Accounts Act of Credit Institutions and Securities Companies, or the Articles of Association.
Stockholm, 12 February 2016
Öhrlings PricewaterhouseCoopers AB
Peter ClemedtsonAuthorised Public Accountant
Auditor-in-charge
Catarina EricssonAuthorised Public Accountant
We believe that the audit evidence we have obtained is sufficient and appropriate to provide a basis for our opinions.
OpinionsWe recommend to the annual meeting of shareholders that the profit be appropriated in accordance with the proposal in the Board of Director’s report and that the members of the Board of Directors and the Managing Director be discharged from liability for the financial year.
Legal structureMain legal structure*, as of 31 December 2015
Nordea Bank AB (publ)Sweden
Nordea Life Holding AB Sweden
Holdingcompany
JSC Nordea Bank
Russia
Nordea BankNorge ASA
Norway
Nordea BankDanmark A/S
Denmark
Nordea Hypotek AB (publ)
Sweden
Nordea Pensions
Estonia ASEstonia
IPAS Nordea Pensions
LatviaLatvia
Varioussubsidiaries
Nordea Life AssuranceFinland Ltd
Finland
Nordea Life &Pension S.A.Luxembourg
Nordea PowszechneTowarzystwo
Emerytalne S.A.Poland
Nordea Livförsäkring Sverige AB
(publ)Sweden
Nordea Liv & Pension
livsforsikrings- selskab A/S
Denmark
Varioussubsidiaries
Nordea BankFinland Plc
Finland
Fund companiesInvestment manage-
ment companiesVarious subsidiaries
Varioussubsidiaries
Nordea Kredit Realkredit-
aktieselskab Denmark
Nordea Eiendoms-kreditt AS
Norway
Varioussubsidiaries
Varioussubsidiaries
Livforsikrings-selskapetNordea Liv Norge AS
Norway
* Further information is presented in Note P20. Nordea’s banking business in the Baltic countries is operated as branches of Nordea Bank AB (publ).

192819-3-22-v2.0 - 10- 70-40619915
ANNEX 2
NBF ANNUAL REPORT 2015
Nordea Bank Finland plc
Page
(of the NBF Annual
Report 2015) 1. Audited consolidated income statement dated 31 December 2015 30
2. Audited consolidated statement of comprehensive income dated 31
December 2015 31
3. Audited consolidated balance sheet dated 31 December 2015 32
4. Audited consolidated statement of changes in equity dated 31
December 2015 33-36
5. Audited consolidated cash flow statement dated 31 December 2015 37-38
6. Notes to the Consolidated Financial Statements 39-126
7. Audit Report of PricewaterhouseCoopers OY 129

Nordea Bank Finland Plc . Annual Report 2015 30
Nordea Bank Finland Group and Nordea Bank Finland P lc
Income statement
Group Parent company
EURm Note 2015 2014 2015 2014
Operating income
Interest income 3 1,532 1,806 1,268 1,551
Interest expense 3 -479 -617 -478 -615
Net interest income 3 1,053 1,189 790 936 Fee and commission income 4 759 794 726 757
Fee and commission expense 4 -655 -719 -648 -712
Net fee and commission income 4 104 75 78 45 Net result from items at fair value 5 1,257 970 1,254 975
Profit from associated undertakings accounted for under the equity method 19 5 3 - -
Dividends 6 - - 101 117
Other operating income 7 66 41 65 29
Total operating income 2,485 2,278 2,288 2,102 Operating expenses
General administrative expenses:
Staff costs 8 -547 -559 -516 -525
Other expenses 9 -413 -433 -389 -410
Depreciation, amortisation and impairment charges of tangible and intangible assets 10, 20 -31 -92 -28 -88
Total operating expenses -991 -1,084 -933 -1,023
Profit before loan losses 1,494 1,194 1,355 1,079
Net loan losses 11 -92 -60 -42 -54
Impairment of securities held as financial non-current assets - - - -16
Operating profit 1,402 1,134 1,313 1,009 Income tax expense 12 -347 -232 -311 -188
Net profit for the year 1,055 902 1,002 821
Attributable to:
Shareholders of Nordea Bank Finland Plc 1,055 902 1,002 821
Non-controlling interests - - - -
Total 1,055 902 1,002 821
Net profit for the period from transferred internat ional operations 48 - 86 - 86
Net profit for the period from transferred Baltic o perations 48 - -29 - -36

Nordea Bank Finland Plc . Annual Report 2015 31
Statement of comprehensive income
Group Parent company
EURm 2015 2014 2015 2014
Net profit for the year 1,055 902 1,002 821
Items that may be reclassified subsequently to the income statement
Currency translation differences during the year 0 0 - - Available-for-sale investments1: - Valuation gains/losses during the year 12 33 11 33
- Tax on valuation gains/losses during the year -2 -7 -2 -6
- Transferred to the income statement during the year -30 - -30 -
- Tax on transfers to the income statement during the year 6 - 6 -
Cash flow hedges:
- Valuation gains/losses during the year 210 29 210 29
- Tax on valuation gains/losses during the year -42 -6 -42 -6
- Transferred to the income statement during the year -190 -21 -190 -21
- Tax on transfers to the income statement during the year 38 4 38 4
Items that may be reclassified subsequently to the income statement
Defined benefit plans:
- Remeasurement of defined benefit plans during the year 89 -104 87 -101
- Tax on remeasurement of defined benefit plans during the year -18 21 -17 20
Other comprehensive income, net of tax 73 -51 71 -48
Total comprehensive income 1,128 851 1,073 773
Attributable to:
Shareholders of Nordea Bank Finland Plc 1,128 851 1,073 773
Non-controlling interests - - - -
Total 1,128 851 1,073 773 1 Valuation gains/losses related to hedged risks under fair value hedge accounting are accounted for directly in the income statement.

Nordea Bank Finland Plc . Annual Report 2015 32
Balance sheet
Group Parent company
EURm Note 31 Dec 2015 31 Dec 2014 31 Dec 2015 31 Dec 2014
Assets
Cash and balances with central banks 32,613 28,846 32,613 28,846
Loans to central banks 13 5,328 300 5,129 300
Loans to credit institutions 13 27,089 35,051 33,507 40,791
Loans to the public 13 101,447 113,748 94,063 106,639
Interest-bearing securities 14 30,143 34,643 30,143 34,643
Financial instruments pledged as collateral 15 4,627 11,058 4,627 11,058
Shares 16 2,020 1,918 2,019 1,917
Derivatives 17 80,557 105,254 80,557 105,254 Fair value changes of the hedged items in portfolio hedge of interest rate risk 51 76 51 76
Investments in group undertakings 18 - - 309 308
Investments in associated undertakings 19 42 39 28 28
Intangible assets 20 44 47 31 35
Properties and equipment 76 84 69 71
Investment properties 22 1 2 1 2
Deferred tax assets 12 14 43 12 41
Current tax assets 12 1 0 - -
Retirement benefit assets 31 90 25 90 25
Other assets 23 17,015 14,624 16,970 14,586
Prepaid expenses and accrued income 24 432 440 263 259
Total assets 301,590 346,198 300,482 344,879
Liabilities
Deposits by credit institutions 25 78,162 87,368 78,172 87,128
Deposits and borrowings from the public 26 62,153 76,879 62,150 76,873
Debt securities in issue 27 43,407 48,472 43,407 48,472
Derivatives 17 83,538 102,876 83,538 102,876 Fair value changes of the hedged items in portfolio hedge of interest rate risk 557 773 557 773
Current tax liabilities 12 77 41 77 39
Other liabilities 28 20,066 18,577 19,856 18,370
Accrued expenses and prepaid income 29 567 804 382 611
Deferred tax liabilities 12 54 57 - -
Provisions 30 81 85 78 82
Retirement benefit liabilities 31 4 28 4 25
Subordinated liabilities 32 628 620 628 620
Total liabilities 289,294 336,580 288,849 335,869
Equity
Non-controlling interests - - - -
Share capital 2,319 2,319 2,319 2,319
Share premium reserve 599 599 599 599
Other reserves 4,897 2,824 4,897 2,826
Retained earnings 4,481 3,876 3,818 3,266
Total equity 12,296 9,618 11,633 9,010
Total liabilities and equity 301,590 346,198 300,482 344,879
Assets pledged as security for own liabilities 33 40,932 43,426 40,931 43,426
Other assets pledged 34 4,811 5,017 4,811 5,017
Contingent liabilities 35 12,432 14,906 12,599 15,102
Credit commitments 36 13,613 16,021 10,765 13,297
Other commitments 36 359 769 2 452
Other notes Note 1 Accounting policies Note 42 Maturity analysis for assets and liabilities Note 2 Segment reporting Note 43 Related-party transactions Note 37 Capital adequacy Note 44 Credit risk disclosures Note 38 Classification of financial instruments Note 45 Interests in structured entities Note 39 Assets and liabilities at fair value Note 46 Country by country reporting Note 40 Financial instruments set off on balance or subject to netting agreements Note 47 Nordea shares Note 41 Transferred assets and obtained collaterals Note 48 Transferred operations
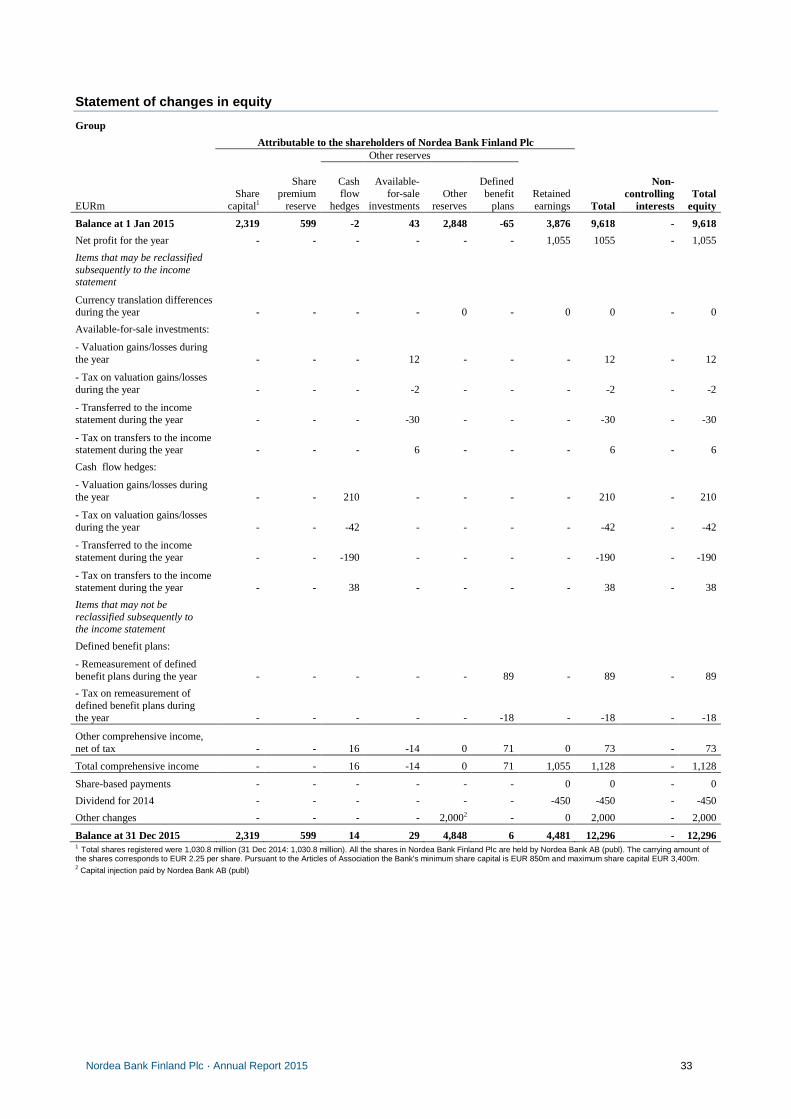
Nordea Bank Finland Plc . Annual Report 2015 33
Statement of changes in equity
Group Attributable to the shareholders of Nordea Bank Finland Plc Other reserves
EURm Share
capital1
Share premium
reserve
Cash flow
hedges
Available- for-sale
investments Other
reserves
Defined benefit
plans Retained earnings Total
Non-controlling
interests Total
equity
Balance at 1 Jan 2015 2,319 599 -2 43 2,848 -65 3,876 9,618 - 9,618
Net profit for the year - - - - - - 1,055 1055 - 1,055
Items that may be reclassified subsequently to the income statement
Currency translation differences during the year - - - - 0 - 0 0 - 0
Available-for-sale investments:
- Valuation gains/losses during the year - - - 12 - - - 12 - 12
- Tax on valuation gains/losses during the year - - - -2 - - - -2 - -2
- Transferred to the income statement during the year - - - -30 - - - -30 - -30
- Tax on transfers to the income statement during the year - - - 6 - - - 6 - 6
Cash flow hedges:
- Valuation gains/losses during the year - - 210 - - - - 210 - 210
- Tax on valuation gains/losses during the year - - -42 - - - - -42 - -42
- Transferred to the income statement during the year - - -190 - - - - -190 - -190
- Tax on transfers to the income statement during the year - - 38 - - - - 38 - 38
Items that may not be reclassified subsequently to the income statement
Defined benefit plans:
- Remeasurement of defined benefit plans during the year - - - - - 89 - 89 - 89
- Tax on remeasurement of defined benefit plans during the year - - - - - -18 - -18 - -18
Other comprehensive income, net of tax - - 16 -14 0 71 0 73 - 73
Total comprehensive income - - 16 -14 0 71 1,055 1,128 - 1,128
Share-based paymentsP - - - - - - 0 0 - 0
Dividend for 2014 - - - - - - -450 -450 - -450
Other changes - - - - 2,0002 - 0 2,000 - 2,000
Balance at 31 Dec 2015 2,319 599 14 29 4,848 6 4,481 12,296 - 12,296 1 Total shares registered were 1,030.8 million (31 Dec 2014: 1,030.8 million). All the shares in Nordea Bank Finland Plc are held by Nordea Bank AB (publ). The carrying amount of the shares corresponds to EUR 2.25 per share. Pursuant to the Articles of Association the Bank's minimum share capital is EUR 850m and maximum share capital EUR 3,400m. 2 Capital injection paid by Nordea Bank AB (publ)

Nordea Bank Finland Plc . Annual Report 2015 34
Statement of changes in equity cont.
Group Attributable to the shareholders of Nordea Bank Finland Plc Other reserves
EURm Share
capital1
Share premium
reserve
Cash flow
hedges
Available- for-sale
investments Other
reserves
Defined benefit
plans Retained earnings Total
Non-controlling
interests Total
equity
Balance at 1 Jan 2014 2,319 599 -8 17 2,848 18 3,720 9,513 1 9,514
Net profit for the year - - - - - - 902 902 - 902
Items that may be reclassified subsequently to the income statement
Currency translation differences during the year - - - - - - 0 0 - 0
Available-for-sale investments:
- Valuation gains/losses during the year - - - 33 - - - 33 - 33
- Tax on valuation gains/losses during the year - - - -7 - - - -7 - -7
Cash flow hedges:
- Valuation gains/losses during the year - - 29 - - - - 29 - 29
- Tax on valuation gains/losses during the year - - -6 - - - - -6 - -6
- Transferred to the income statement during the year - - -21 - - - - -21 - -21
- Tax on transfers to the income statement during the year - - 4 - - - - 4 - 4
Items that may not be reclassified subsequently to the income statement
Defined benefit plans:
- Remeasurement of defined benefit plans during the year - - - - - -104 - -104 - -104
- Tax on remeasurement of defined benefit plans during the year - - - - - 21 - 21 - 21
Other comprehensive income, net of tax - - 6 26 0 -83 0 -51 - -51
Total comprehensive income - - 6 26 0 -83 902 851 - 851
Share-based paymentsP - - - - - - 2 2 - 2
Dividend for 2013 - - - - - - -750 -750 - -750
Other changes - - - - 0 - 2 2 -1 1
Balance at 31 Dec 2014 2,319 599 -2 43 2,848 -65 3,876 9,618 0 9,618 1 Total shares registered were 1,030.8 million (31 Dec 2013: 1,030.8 million). All the shares in Nordea Bank Finland Plc are held by Nordea Bank AB (publ). The carrying amount of the shares corresponds to EUR 2.25 per share. Pursuant to the Articles of Association the Bank's minimum share capital is EUR 850m and maximum share capital EUR 3,400m.
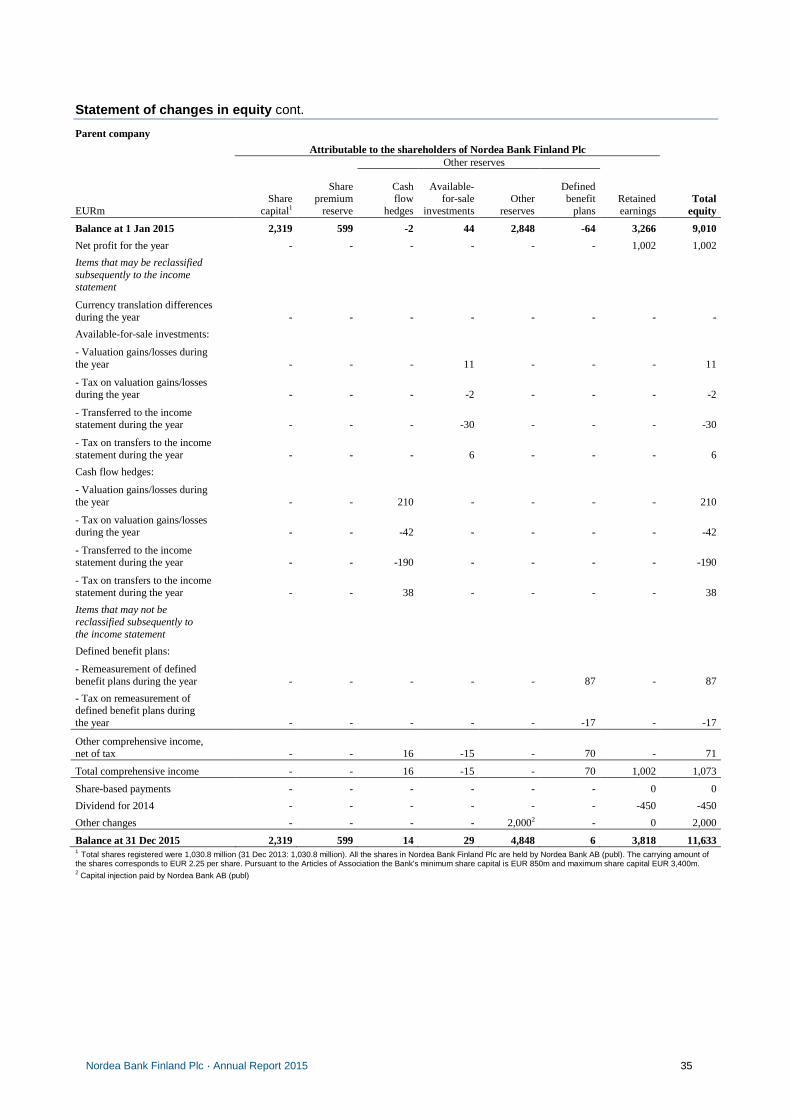
Nordea Bank Finland Plc . Annual Report 2015 35
Statement of changes in equity cont.
Parent company Attributable to the shareholders of Nordea Bank Finland Plc Other reserves
EURm Share
capital1
Share premium
reserve
Cash flow
hedges
Available-for-sale
investments Other
reserves
Defined benefit
plans Retained earnings
Total equity
Balance at 1 Jan 2015 2,319 599 -2 44 2,848 -64 3,266 9,010
Net profit for the year - - - - - - 1,002 1,002
Items that may be reclassified subsequently to the income statement
Currency translation differences during the year - - - - - - - -
Available-for-sale investments:
- Valuation gains/losses during the year - - - 11 - - - 11
- Tax on valuation gains/losses during the year - - - -2 - - - -2
- Transferred to the income statement during the year - - - -30 - - - -30
- Tax on transfers to the income statement during the year - - - 6 - - - 6
Cash flow hedges:
- Valuation gains/losses during the year - - 210 - - - - 210
- Tax on valuation gains/losses during the year - - -42 - - - - -42
- Transferred to the income statement during the year - - -190 - - - - -190
- Tax on transfers to the income statement during the year - - 38 - - - - 38
Items that may not be reclassified subsequently to the income statement
Defined benefit plans:
- Remeasurement of defined benefit plans during the year - - - - - 87 - 87
- Tax on remeasurement of defined benefit plans during the year - - - - - -17 - -17
Other comprehensive income, net of tax - - 16 -15 - 70 - 71
Total comprehensive income - - 16 -15 - 70 1,002 1,073
Share-based paymentsP - - - - - - 0 0
Dividend for 2014 - - - - - - -450 -450
Other changes - - - - 2,0002 - 0 2,000
Balance at 31 Dec 2015 2,319 599 14 29 4,848 6 3,818 11,633 1 Total shares registered were 1,030.8 million (31 Dec 2013: 1,030.8 million). All the shares in Nordea Bank Finland Plc are held by Nordea Bank AB (publ). The carrying amount of the shares corresponds to EUR 2.25 per share. Pursuant to the Articles of Association the Bank's minimum share capital is EUR 850m and maximum share capital EUR 3,400m. 2 Capital injection paid by Nordea Bank AB (publ)

Nordea Bank Finland Plc . Annual Report 2015 36
Statement of changes in equity cont.
Parent company Attributable to the shareholders of Nordea Bank Finland Plc Other reserves
EURm Share
capital1
Share premium
reserve
Cash flow
hedges
Available-for-sale
investments Other
reserves
Defined benefit
plans Retained earnings
Total equity
Balance at 1 Jan 2014 2,319 599 -8 17 2,848 17 3,193 8,985
Net profit for the year - - - - - - 821 821
Items that may be reclassified subsequently to the income statement
Currency translation differences during the year - - - - - - - -
Available-for-sale investments:
- Valuation gains/losses during the year - - - 33 - - - 33
- Tax on valuation gains/losses during the year - - - -6 - - - -6
Cash flow hedges: -
- Valuation gains/losses during the year - - 29 - - - - 29
- Tax on valuation gains/losses during the year - - -6 - - - - -6
- Transferred to the income statement during the year - - -21 - - - - -21
- Tax on transfers to the income statement during the year - - 4 - - - - 4
Items that may not be reclassified subsequently to the income statement
Defined benefit plans:
- Remeasurement of defined benefit plans during the year - - - - - -101 - -101
- Tax on remeasurement of defined benefit plans during the year - - - - - 20 - 20
Other comprehensive income, net of tax - - 6 27 0 -81 - -48
Total comprehensive income - - 6 27 0 -81 821 773
Share-based paymentsP - - - - - - 2 2
Dividend for 2013 - - - - - - -750 -750
Other changes - - - - - - 0 0
Balance at 31 Dec 2014 2,319 599 -2 44 2,848 -64 3,266 9,010 1 Total shares registered were 1,030.8 million (31 Dec 2013: 1,030.8 million). All the shares in Nordea Bank Finland Plc are held by Nordea Bank AB (publ). The carrying amount of the shares corresponds to EUR 2.25 per share. Pursuant to the Articles of Association the Bank's minimum share capital is EUR 850m and maximum share capital EUR 3,400m.
No decision was made during the financial year to issue equity warrants or convertible bonds entitling to subscription of shares in the NBF. At the end of 2015, NBF held no authorisations given by the General Meeting for issuance or buybacks of shares, equity warrants or convertible bonds.

Nordea Bank Finland Plc . Annual Report 2015 37
Cash flow statement – Total operations
Group Parent company
EURm 2015 2014 2015 2014
Operating activities
Operating profit 1,402 1,164 1,313 1,046
Operating profit for the period from transferred Baltic operations - -30 - -37
Adjustments for items not included in cash flow 738 891 675 837
Income taxes paid -304 -218 -261 -179
Cash flow from operating activities before changes in operating assets and liabilities 1,836 1,807 1,727 1,666
Changes in operating assets Change in loans to central banks -5,046 3,378 -4,844 3,378
Change in loans to credit institutions 14,368 -3,662 13,679 -3,945
Change in loans to the public 12,196 714 12,530 1,083
Change in interest-bearing securities 5,170 -5,827 5,171 -5,827
Change in financial assets pledged as collateral 6,431 -1,319 6,431 -1,319
Change in shares -102 -1,243 -102 -1,243
Change in derivatives, net 3,583 1,136 3,583 1,136
Change in investment properties 1 8 1 7
Change in other assets -2,392 -8,009 -2,386 -8,008
Changes in operating liabilities
Change in deposits by credit institutions -9,209 6,876 -8,957 6,973
Change in deposits and borrowings from the public -14,726 -5,042 -14,723 -5,037
Change in debt securities in issue -5,065 -565 -5,065 -565
Change in other liabilities 1,491 228 1,487 188
Cash flow from operating activities 8,536 -11,520 8,532 -11,513
Investing activities Acquisition of business operations 0 - - -4
Sale of business operations - 9 - 9
Dividends from associated companies 1 17 - -
Acquisition of associated undertakings 0 - - -
Sale of associated undertakings - 5 - 5
Acquisition of property and equipment -38 -53 -40 -55
Sale of properties and equipment 8 6 4 0
Acquisition of intangible assets -9 -21 -5 -10
Sale of intangible assets 2 1 2 1
Net divestments in debt securities, held to maturity - 2,183 - 2,183
Purchase/sale of other financial fixed assets 25 2 25 3
Cash flow from investing activities -11 2,149 -14 2,132
Financing activities Issued subordinated liabilities 8 191 8 191
Amortised subordinated liabilities - - - -
Dividend paid -450 -750 -450 -750
Other changes 2,073 -34 2,070 -22
Cash flow from financing activities 1,631 -593 1,628 -581
Cash flow for the year 10,156 -9,964 10,146 -9,962
Cash and cash equivalents at the beginning of year 29,714 36,324 29,711 36,317
Translation difference - -3,354 - -3,356
Cash and cash equivalents at the end of year 39,870 29,714 39,857 29,711
Change 10,156 -9,964 10,146 -9,962

Nordea Bank Finland Plc . Annual Report 2015 38
Cash flow statement – Total operations cont.
Comments on the cash flow statement
The cash flow statement shows inflows and outflows of cash and cash equivalents during the year for total operations. Nordea Bank Finland's cash flow has been prepared in accordance with the indirect method, whereby operating profit is adjusted for effects of non-cash transactions such as depreciation and loan losses. The cash flows are classified by operating, investing and financing activities.
Operating activities
Operating activities are the principal revenue-producing activities and cash flows are mainly derived from the operating profit for the year with adjustment for items not included in cash flow and income taxes paid. Adjustment for items not included in the cash flow includes:
Group Parent company
EURm 2015 2014 2015 2014
Depreciation 28 36 25 33
Impairment charges 3 56 3 72
Loan losses 106 88 46 63
Unrealised gains/losses 1,079 51 1,080 52
Capital gains/losses (net) -4 -10 -3 -9
Change in accruals and provisions -200 66 -219 73
Translation differences -1 -10 0 1
Other -273 614 -257 552
Total 738 891 675 837
Changes in operating assets and liabilities consist of assets and liabilities that are part of normal business activities, such as loans, deposits and debt securities in issue. Changes in derivatives are reported net.
Cash flow from operating activities includes interest payments received and interest expenses paid with the following amounts:
Group Parent company
EURm 2015 2014 2015 2014
Interest payments received 1,558 2,006 1,295 1,754
Interest expenses paid -488 -910 -488 -908 Investing activities Investing activities include acquisitions and disposals of non-current assets, like property and equipment, intangible and financial assets. Financing activities Financing activities are activities that result in changes in equity and subordinated liabilities, such as new issues of shares, dividends and issued/amortised subordinated liabilities.
Cash and cash equivalents
The following items are included in Cash and cash equivalents assets:
Group Parent company
31 Dec 31 Dec 31 Dec 31 Dec
EURm 2015 2014 2015 2014
Cash and balances with central banks 32,613 28,846 32,613 28,846
Loans to credit institutions, payable on demand 7,257 868 7,244 865
39,870 29,714 39,857 29,711 Cash comprises legal tender and bank notes in foreign currencies. Balances with central banks consist of deposits in accounts with central banks and postal giro systems under government authority, where the following conditions are fulfilled; - the central bank or the postal giro system is domiciled in the country where the institution is established - the balance on the account is readily available at any time. Loans to credit institutions, payable on demand include liquid assets not represented by bonds or other interest-bearing securities. Loans to central banks, payable on demand includes instruments where Nordea has the right to resell immediately.

Nordea Bank Finland Plc . Annual Report 2015 39
Notes to the financial statements
Note 1 Accounting policies Contents for Note 1 1. Basis for presentation ...........................................................39
2. Changed accounting policies and presentation .....................39 3. Changes in IFRSs not yet applied .......................................39 4. Critical judgements and estimation uncertainty ....................41 5. Principles of consolidation ...................................................43 6. Recognition of operating income and impairment ................44 7. Recognition and derecognition of financial instruments on
the balance sheet ..................................................................46
8. Translation of assets and liabilities denominated in foreign currencies .............................................................................46
9. Hedge accounting .................................................................47
10. Determination of fair value of financial instruments .............48
11. Cash and balances with central banks ............................ 49 12. Financial instruments .................................................... 49 13. Loans to the public/credit institutions ............................ 51 14. Leasing .......................................................................... 53
15. Intangible assets ............................................................ 53 16. Properties and equipment .............................................. 54 17. Taxes ............................................................................. 54
18. Employee benefits ......................................................... 55 19. Equity ............................................................................ 56
20. Financial guarantee contracts and credit commitments . 56 21. Share-based payment ..................................................... 56 22. Related party transactions .............................................. 57
1. Basis for presentation
NBF’s consolidated financial statements are prepared in accordance with International Financial Reporting Standards (IFRS) as endorsed by the EU Commission. In addition, certain complementary rules in the Finnish Accounting Act, the Finnish Credit Institutions Act, the Financial Supervision Authority’s Regulations and Guidelines and the Decision of the Ministry of Finance on the financial statements and consolidated statements of credit institutions have also been applied.
The disclosures, required in the standards, recommendations and legislation above, have been included in the notes, the Risk, Liquidity and Capital management section or in other parts of the “Financial statements”.
On 26 February 2016 the Board of Directors approved the financial statements, subject to the final approval of the Annual General Meeting on 9 March 2016.
2. Changed accounting policies and presentation
The accounting policies, basis for calculations and presentation are, in all material aspects, unchanged in comparison with the 2014 Annual Report. The new accounting requirements implemented during 2015 and their effects on Nordea’s financial statements are described below.
The following new and amended standards and interpretations were implemented 1 January 2015 but have not had any significant impact on the financial statements of Nordea:
• Amendments to IAS 19: “Defined Benefit Plans: Employee Contributions”
• “Annual Improvements to IFRSs, 2010-2012 Cycle”
• “Annual Improvements to IFRSs, 2011-2013 Cycle”
• IFRIC 21 “Levies”.
3. Changes in IFRSs not yet applied
IFRS 9 “Financial Instruments” IASB has completed the new standard for financial instruments, IFRS 9 “Financial instruments”. IFRS 9 covers classification and measurement, impairment and general hedging and replaces the current requirements covering these areas in IAS 39. IFRS 9 is effective as from annual periods beginning on or after 1 January 2018. Earlier application is permitted, but IFRS 9 is not yet endorsed by the EU commission. Nordea does not currently intend to early adopt the standard.
The changes in classification and measurement are not expected to have a significant impact on Nordea’s income statement or balance sheet as the mixed measurement model will be maintained, and as there will still be a measurement category similar to the current Available For Sale (AFS) category in IAS 39. Significant reclassifications between fair value and amortised cost or impact on the capital adequacy and large exposures are not expected in the period of initial application, but this is naturally dependent on the financial instruments on Nordea’s balance sheet at transition.
The impairment requirements in IFRS 9 are based on an expected loss model as opposed to the current incurred loss model in IAS 39. In general, it is expected that the new requirements will increase loan loss provisions, decrease equity and have a negative impact on capital adequacy, but no impact on large exposures, in the period of initial application. IFRS 9 requires all assets measured at amortised cost and fair value through other comprehensive income, as well as guarantees and loan commitments, to be included in the impairment test. Currently Nordea does not calculate collective provisions for off balance sheet exposures or the AFS portfolio.

Nordea Bank Finland Plc . Annual Report 2015 40
The assets to test for impairment will be divided into three groups depending on the stage of credit deterioration. Stage 1 includes assets where there has been no significant deterioration in credit risk, stage 2 includes assets where there has been a significant deterioration and stage 3 includes assets that have been individually assessed to be impaired. In stage 1, the provisions should equal the 12-month expected loss. In stage 2 and 3, the provisions should equal the lifetime expected losses.
Nordea’s current model for calculating collective provisions defines a loss event as a deterioration in rating/scoring, but it is not expected that the loss event in the current model will equal the trigger event for moving items from stage 1 to stage 2 under IFRS 9. Currently Nordea does not, in addition, hold any provisions for assets where there has been no deterioration in credit risk. For assets where there has been a significant deterioration in credit risk, Nordea currently holds provisions based on the losses estimated to occur during the period between the date when the loss event occurred and the date when the loss event is identified on an individual basis, the so called “Emergence period” while IFRS 9 will require provisions equal to the lifetime expected loss. This means total provisions will increase when IFRS 9 is implemented.
The main change to the general hedging requirements is that the standard aligns hedge accounting more closely with the risk management activities. As Nordea generally uses macro (portfolio) hedge accounting. Nordea’s assessment is that the new requirements will not have any significant impact on Nordea’s financial statements, capital adequacy, or large exposures in the period of initial application.
Nordea has not yet finalised the impact assessment of the implementation of IFRS 9.
IFRS 15 “Revenue from Contracts with Customers”, amendments to IFRS 11 “Accounting for Acquisition of Interest in Joint Operations” and amendments to IFRS 10 and IAS 28 “Sale or Contribution of Assets between an Investor and its Associate or Joint Venture” The IASB has published the new standard, IFRS 15 “Revenue from Contracts with Customers” as well as Amendments to IFRS 11 “Accounting for Acquisition of Interest in Joint Operations” and Amendments to IFRS 10 and IAS 28 “Sale or Contribution of Assets between an Investor and its Associate or Joint Venture”. It is assessed that the new IFRS 15 standard and the amendments to IFRS 11, IFRS10 and IAS 28 will not have any impact on NBF’s financial statements, capital adequacy or large exposures in the period of initial application.
IAS 1 The IASB has amended IAS 1 as a result of the IASB’s disclosure initiative. The amendments in IAS 1 regards materiality, disaggregation and subtotals, note structure, disclosures of accounting policies and presentation of items of OCI arising from equity accounted investments. The amendments are effective for annual periods beginning on or after 1 January 2016. Earlier application is permitted. The amendments are endorsed by the EU commission. Nordea does not intend to early adopt the amendments. The new requirements are not expected to have any effect on Nordea’s financial statements, capital adequacy, or large exposures in the period of initial application.
IFRS 16 “ Leases” The IASB has published the new standard, IFRS 16 “Leases”. The new standard changes the accounting requirements for lessees. All leases (except for short contracts and small ticket leases) should be accounted for on the balance sheet of the lessee as a right to use the asset and a liability. The lease payments should be recognised as amortisation and interest expense. The accounting requirements for lessors are unchanged. Additional disclosures are also required. The new standard is effective for annual periods beginning on or after 1 January 2019. Earlier application is permitted. The amendments are not yet endorsed by the EU Commission. Nordea does not currently intend to early adopt the amendments. Nordea´s current assessment is that the new standard will change the accounting of property leases which mainly affects Nordea´s balance sheet.
Other changes in IFRS The IASB has published the following new or amended standards that are assessed to have no significant impact on Nordea’s financial statement, capital adequacy or large exposures in the period of initial application:
• Amendments to IFRS 10, IFRS 12 and IAS 28: “Investment Entities: Applying the Consolidation Exception”,
• Amendments to IAS 16 and IAS 38: ”Clarification of Acceptable Methods of Depreciation and Amortisation”,
• Amendments to IAS 12: “Recognition of Deferred Tax Assets for Unrealised Losses”,
• “Annual Improvements to IFRSs, 2012-2014 Cycle”.

Nordea Bank Finland Plc . Annual Report 2015 41
4. Critical judgements and estimation uncertainty
The preparation of financial statements in accordance with generally accepted accounting principles requires, in some cases, the use of judgements and estimates by management. Actual outcome can later, to some extent, differ from the estimates and the assumptions made. In this section a description is made of:
• the sources of estimation uncertainty at the end of the reporting period, that have a significant risk of resulting in a material adjustment to the carrying amount of assets and liabilities within the next financial year, and
• the judgements made when applying accounting policies (apart from those involving estimations) that have the most significant effect on the amounts recognised in the financial statements.
Critical judgements and estimates are in particular associated with:
• the fair value measurement of certain financial instruments
• the impairment testing of loans to the public/credit institutions
• the effectiveness testing of cash flow hedges • the actuarial calculations of pension liabilities and
plan assets related to employees • the classification of leases • the classification of Additional Tier 1 instruments • the translations of assets and liabilities
denominated in foreign currencies • the valuation of deferred tax assets • claims in civil lawsuits.
Fair value measurement of certain financial instruments Nordea’s accounting policy for determining the fair value of financial instruments is described in section 10 “Determination of fair value of financial instruments” and Note 39 “Assets and liabilities at fair value”. Critical judgements that have a significant impact on the recognised amounts for financial instruments is exercised when determining fair value of OTC derivatives and other financial instruments that lack quoted prices or recently observed market prices. Those judgements relate to the following areas:
• The choice of valuation techniques • The determination of when quoted prices fail to
represent fair value (including the judgement of whether markets are active)
• The construction of fair value adjustments in order to incorporate relevant risk factors such as credit risk, model risk and liquidity risk
• The judgement of which market parameters that are observable.
When determining fair value of financial instruments that lack quoted prices or recently observed market prices there is also a high degree of estimation uncertainty. That estimation uncertainty is mainly a result of the judgement management exercises when:
• selecting an appropriate discount rate for the instrument and
• determining expected timing of future cash flows from the instruments.
In all of these instances, decisions are based upon professional judgement in accordance with Nordea’s accounting and valuation policies. In order to ensure proper governance, Nordea has a Group Valuation Committee that on an on-going basis reviews critical judgements that are deemed to have a significant impact on fair value measurements.
The fair value of financial assets and liabilities measured at fair value using a valuation technique, level 2 and 3 in the fair value hierarchy, was EUR 158,548m (190,120) and EUR 126,941m (174,016) respectively at the end of the year.
Sensitivity analysis disclosures covering fair values of financial instruments with significant unobservable inputs can be found in Note 39 “Assets and liabilities at fair value”.
Estimation uncertainty also arises at initial recognition of financial instruments that are part of larger structural transactions. Although subsequently not necessarily held at fair value such instruments are initially recognised at fair value and as there is normally no separate transaction price or active market for such individual instruments, the fair value has to be estimated.
Impairment testing of loans to the public/credit institutions Nordea’s accounting policy for impairment testing of loans is described in section 13 “Loans to the public / credit institutions”.
Management is required to exercise critical judgements and estimates when calculating loan impairment allowances on both individually assessed and collectively assessed loans. NBF’s total lending before impairment allowances was EUR 134,491m (149,734) at the end of the year. For more information, see Note 13 “Loans and impairment”.
The most judgemental area is the calculation of collective impairment allowances. When testing a group of loans collectively for impairment, judgement has to be exercised when identifying the events and/or the observable data that indicate that losses have been incurred in the group of loans. Nordea monitors its portfolio through rating migrations and a loss event is an event resulting in a negative rating migration.

Nordea Bank Finland Plc . Annual Report 2015 42
Assessing the net present value of the cash flows generated by the customers in the group of loans also includes estimation uncertainty. This includes the use of historical data on probability of default and loss given default supplemented by acquired experience when adjusting the assumptions based on historical data to reflect the current situation.
Effectiveness testing of cash flow hedges Nordea’s accounting policies for cash flow hedges are described in section 9 “Hedge accounting”.
One important judgement in connection to cash flow hedge accounting is the choice of method used for effectiveness testing.
Where Nordea applies cash flow hedge accounting the hedging instruments used are predominantly cross currency interest rate swaps, which are always held at fair value. The currency component is designated as a cash flow hedge of currency risk and the interest component as a fair value hedge of interest rate risk. The hypothetical derivative method is used when measuring the effectiveness of these cash flow hedges, meaning that the change in a perfect hypothetical swap is used as proxy for the present value of the cumulative change in expected future cash flows on the hedged transaction (the currency component). Critical judgement has to be exercised when defining the characteristics of the perfect hypothetical swap.
Actuarial calculations of pension liabilities and plan assets related to employees Nordea’s accounting policy for post-employment benefits is described in section 18 “Employee benefits”.
The defined benefit obligation for major pension plans is calculated by external actuaries using demographic assumptions based on the current population. As a basis for these calculations a number of actuarial and financial parameters are used.
The estimation of the discount rate is subject to uncertainty around whether corporate bond markets are deep enough, of high quality and also in connection to the extrapolation of yield curves to relevant maturities. In Finland, the discount rate is determined with reference to high quality corporate bonds. Other parameters, like assumptions about salary increases and inflation, are based on the expected long-term development of these parameters and also subject to estimation uncertainty. The main parameters used at year-end are disclosed in Note 31 “Retirement benefit obligations” together with a description of the sensitivity to changes in assumptions. The defined benefit obligation was EUR 871m (948) at the end of the year.
Classification of leases Nordea’s accounting policies for leases are described in section 14 “Leasing”.
Critical judgement has to be exercised when classifying lease contracts. A lease is classified as a finance lease if it transfers substantially all the risks and rewards related to ownership. A lease is classified as an operating lease if it does not transfer substantially all the risks and rewards related to ownership.
The central district properties in Finland that Nordea has divested are leased back. The duration of the lease agreements was initially 3-25 years with renewal options. The lease agreements include no transfers of ownerships of the assets by the end of the lease term, nor any economic benefit from appreciation in value of the leased properties. In addition, the lease term is not for the major part of the assets’ economic life. As a result, Nordea has classified these leases as operating leases. This judgement is a critical judgement that has a significant impact on the carrying amounts in the financial statement.
More information on lease contracts can be found in Note 21 “Leasing”.
Classification of Additional Tier 1 instruments NBF has issued perpetual subordinated instruments where the interest payments to the holders are at the discretion of NBF and non-accumulating. These instruments also include a requirement for Nordea to pay interest if the instruments are no longer allowed to be included in tier 1 capital. If there is a requirement to pay interest based on the occurrence or non-occurrence of an uncertain future event that is beyond the control of both the issuer and the holder of the instrument, the instrument shall be classified as a financial liability. The inclusion of the subordinated loan in tier 1 capital is decided by the regulators and is thus beyond the control of NBF and the holders of the instrument. NBF classifies the instruments as financial liabilities.
Assessing control for consolidation purposes One decisive variable when assessing if Nordea controls another entity is whether Nordea is exposed to variability in returns from the investment. For structured entities where voting rights are not the dominant factor when determining control, critical judgement has to be exercised when defining when Nordea is exposed to significant variability in returns. Nordea’s critical judgement is that Nordea is normally exposed to variability in returns when Nordea receives more than 30% of the return produced by the structured entity. This is only relevant for structured entities where Nordea also is the investment manager and thus have influence over the return produced by the structured entity. For more information see Note 45 “Interest in structured entities”.

Nordea Bank Finland Plc . Annual Report 2015 43
Another judgement relating to control is whether Nordea acts as an agent or as a principal. For unit linked and other contracts where the policyholder/depositor decides both the amount and which assets to invest in, Nordea is considered to act as an agent and thus does not have control.
Translation of assets and liabilities denominated in foreign currencies Nordea’s accounting policies covering the translation of assets and liabilities denominated in foreign currencies is described in section 8 “Translation of assets and liabilities denominated in foreign currencies”.
Claims in civil lawsuits Within the framework of the normal business operations, Nordea faces a number of claims in civil lawsuits and disputes, most of which involve relatively limited amounts. Presently, none of the current disputes are considered likely to have any significant adverse effect on Nordea or its financial position. See also Note 30 “Provisions” and Note 35 “Contingent liabilities”.
5. Principles of consolidation
Consolidated entities The consolidated financial statements include the accounts of the parent company Nordea Bank Finland Plc, and those entities that the parent company controls. Control exists when NBF is exposed to variability in returns from its investments in another entity and has the ability to affect those returns through its power over the other entity. Control is generally achieved when the parent company owns, directly or indirectly through group undertakings, more than 50 per cent of the voting rights. For entities where voting rights does not decide control, see section “Structured entities” below.
All group undertakings are consolidated using the acquisition method. Under the acquisition method, the acquisition is regarded as a transaction whereby the parent company indirectly acquires the group undertaking’s assets and assumes its liabilities and contingent liabilities. The group’s acquisition cost is established in a purchase price allocation analysis. In such analysis, the cost of the business combination is the aggregate of the fair values, at the date of exchange, of assets given, liabilities incurred or assumed and equity instruments issued by the acquirer, in exchange for the identifiable net assets acquired. Costs directly attributable to the business combination are expensed.
As at the acquisition date NBF recognises the identifiable assets acquired and the liabilities assumed at their acquisition date fair values.
For each business combination NBF measures the non-controlling interest in the acquired business either at fair value or at their proportionate share of the acquired identifiable net assets.
When the aggregate of the consideration transferred in a business combination and the amount recognised for non-controlling interest exceeds the net fair value of the identifiable assets, liabilities and contingent liabilities, the excess is reported as goodwill. If the difference is negative, such difference is recognised immediately in the income statement.
Equity and net income attributable to non-controlling interests are separately disclosed on the balance sheet, income statement and statement of comprehensive income.
Intra-group transactions and balances between the consolidated group undertakings are eliminated.
The group undertakings are included in the consolidated accounts as from the date on which control is transferred to NBF and are no longer consolidated as from the date on which control ceases.
In the consolidation process the reporting from the group undertakings is adjusted to ensure consistency with the IFRS principles applied by Nordea.
Note 18 “Investments in group undertakings” lists the major group undertakings in the NBF Group.
Investments in associated undertakings The equity method of accounting is used for associated undertakings where the share of voting rights is between 20 and 50 per cent and/or where Nordea has significant influence. Significant influence is the power to participate in the financial and operating decisions of the investee but is not control over those policies. Investments within Nordea’s investment activities, which are classified as a venture capital organisation within Nordea, are measured at fair value in accordance with the rules set out in IAS 28 and IAS 39. Further information on the equity method is disclosed in section 6 “Recognition of operating income and impairment”.
Profits from companies accounted for under the equity method are reported post-taxes in the income statement. Consequently, the tax expense related to these profits is not included in the income tax expense for Nordea.
Nordea does generally not have any sales or contribution of assets to or from associated undertakings. Other transactions between Nordea and its associates are not eliminated.

Nordea Bank Finland Plc . Annual Report 2015 44
Note 19 “Investments in associated undertakings” lists the major associated undertakings in the NBF Group.
Structured entities A structured entity is an entity created to accomplish a narrow and well defined objective where voting rights are not the dominant factor in determining control. Often legal arrangements impose strict limits on the decision making powers of the management over the on-going activities of a structured entity. The same consolidation requirements apply to these entities, but as voting rights do not decide whether control exists, other factors are used to determine control.
Power can exist due to agreements or other types of influence over a structured entity. Nordea normally has power over entities sponsored or established by Nordea. Nordea has created a number of structured entities to allow clients to invest in assets invested in by the structured entity. Some structured entities invest in tradable financial instruments, such as shares and bonds (mutual funds). Structured entities can also invest in structured credit products or acquire assets from customers of Nordea, although only one such structured entity currently exists. Nordea is generally the investment manager and has sole discretion about investments and other administrative decisions and thus has power over these entities.
Typically, Nordea will receive service and commission fees in connection with the creation of the structured entity, or because it acts as investment manager, custodian or in some other function. Such income is normally not significant enough to expose Nordea to variability in returns and will thus not trigger consolidation. In some structured entities Nordea has also supplied substantial parts of the funding in the form of fund units, loans or credit commitments. In these structured entities Nordea is exposed to variability in returns and as the power over these entities affects the return, these structured entities are consolidated. Nordea normally considers a share of more than 30% of the return produced by a structured entity to give rise to variability and thus give control. Variability is measured as the sum of fees received and revaluation of assets held. For unit linked and other contracts where the policyholder/depositor decide both the amount and which assets to invest in, Nordea is considered to act as an agent and does thus not have control.
Further information about consolidated and unconsolidated structured entities is disclosed in Note 45 “Interests in structured entities”.
Currency translation of foreign entities The consolidated financial statements are prepared in euro (EUR), the presentation currency of the parent company Nordea Bank Finland Plc. The current method is used when translating the financial statements of foreign entities into EUR from their functional currency. The assets and liabilities of foreign entities have been translated at the closing rates, while items in the income statement and statement of comprehensive income are translated at the average exchange rate for the year. The average exchange rates are calculated based on daily exchange rates divided by the number of banking days in the period. Translation differences are accounted for in other comprehensive income and are accumulated in the translation reserve in equity.
Fair value adjustments arising from the acquisition of group undertakings are treated as items in the same functional currency as the cash generating unit to which they belong and are also translated at the closing rate.
6. Recognition of operating income and impairment
Net interest income Interest income and expense are calculated and recognised based on the effective interest rate method or, if considered appropriate, based on a method that results in an interest income or interest expense that is a reasonable approximation of using the effective interest rate method as basis for the calculation. The effective interest includes fees considered to be an integral part of the effective interest rate of a financial instrument (generally fees received as compensation for risk). The effective interest rate equals the rate that discounts the contractual future cash flows to the carrying amount of the financial asset or financial liability.
Interest income and expenses from financial instruments are, with the exceptions described below, classified as “Net interest income”.
Interest income and interest expense related to all balance sheet items held at fair value in Markets are classified as “Net result from items at fair value” in the income statement. Also the interest on the net funding of the operations in Markets is recognised on this line.
The interest component in FX swaps, and the interest paid and received in interest rate swaps plus changes in accrued interest, is classified as “Net result from items at fair value”, apart from derivatives used for hedging, including economical hedges of Nordea’s funding, where such components are classified as “Net interest income”.

Nordea Bank Finland Plc . Annual Report 2015 45
Net fee and commission income Nordea earns commission income from different services provided to its customers. The recognition of commission income depends on the purpose for which the fees are received. Fees are either recognised as revenue when services are provided or in connection to the execution of a significant act. Fees received in connection to performed services are recognised as income in the period these services are provided. A loan syndication fee received as payment for arranging a loan, as well as other fees received as payments for certain acts, are recognised as revenue when the act has been completed, i.e. when the syndication has been finalised.
Commission expenses are normally transaction based and recognised in the period when the services are received.
Income from issued financial guarantees and expenses from bought financial guarantees, including fees paid to state guarantees, are amortised over the duration of the instruments and classified as “Fee and commission income” and “Fee and commission expense” respectively.
Net result from items at fair value Realised and unrealised gains and losses on financial instruments measured at fair value through profit or loss are recognised in the item “Net result from items at fair value”.
Realised and unrealised gains and losses derive from:
• Shares/participations and other share-related instruments
• Interest-bearing securities and other interest-related instruments
• Other financial instruments, including credit derivatives as well as commodity instruments/derivatives
• Foreign exchange gains/losses • Investment properties, which include realised and
unrealised income, for instance revaluation gains and losses. This line also includes realised results from disposals as well as the running property yield stemming from the holding of investment properties.
Interest income and interest expense related to all balance sheet items held at fair value in Markets are classified as “Net result from items at fair value” in the income statement. Also the interest on the net funding of the operations in Markets is recognised on this line.
Also the ineffective portion of cash flow hedges as well as recycled gains and losses on financial instruments classified into the category Available for sale are recognised in “Net result from items at fair value”.
This item also includes realised gains and losses from financial instruments measured at amortised cost, such as interest compensation received and realised gains/losses on buy-backs of issued own debt.
“Net result from items at fair value” includes also losses from counterparty risk on instruments classified into the category Financial assets at fair value through profit or loss as well as impairment on instruments classified into the category Available for sale. Impairment losses from instruments within other categories are recognised in the items ”Net loan losses” or “Impairment of securities held as financial non-current assets” (see also the sub-sections ”Net loan losses” and “Impairment of securities held as financial non-current assets” below).
Dividends received are recognised in the income statement as “Net result from items at fair value” and classified as “Shares/participations and other share-related instruments” in the note. Income is recognised in the period in which the right to receive payment is established.
Profit from companies accounted for under the equity method The profit from companies accounted for under the equity method is defined as the post-acquisition change in NBF’s share of net assets in the associated undertakings. NBF’s share of items accounted for in other comprehensive income in the associated undertakings is accounted for in other comprehensive income in NBF. Profits from companies accounted for under the equity method are, as stated in section 5 “Principles of consolidation”, are reported in the income statement post-taxes. Consequently the tax expense related to these profits is excluded from the income tax expense for NBF.
Fair values are, at acquisition, allocated to the associated undertaking’s identifiable assets, liabilities and contingent liabilities. Any difference between NBF’s share of the fair values of the acquired identifiable net assets and the purchase price is goodwill or negative goodwill. Subsequently the investment in the associated undertaking increases/decreases with NBF’s share of the post-acquisition change in net assets in the associated undertaking and decreases through received dividends and impairment. An impairment charge can be reversed in a subsequent period.
Other operating income Net gains from divestments of shares in group undertakings and associated undertakings and net gains on sale of tangible assets as well as other operating income, not related to any other income line, are generally recognised when it is probable that the benefits associated with the transaction will flow to Nordea and if the significant risks and rewards have
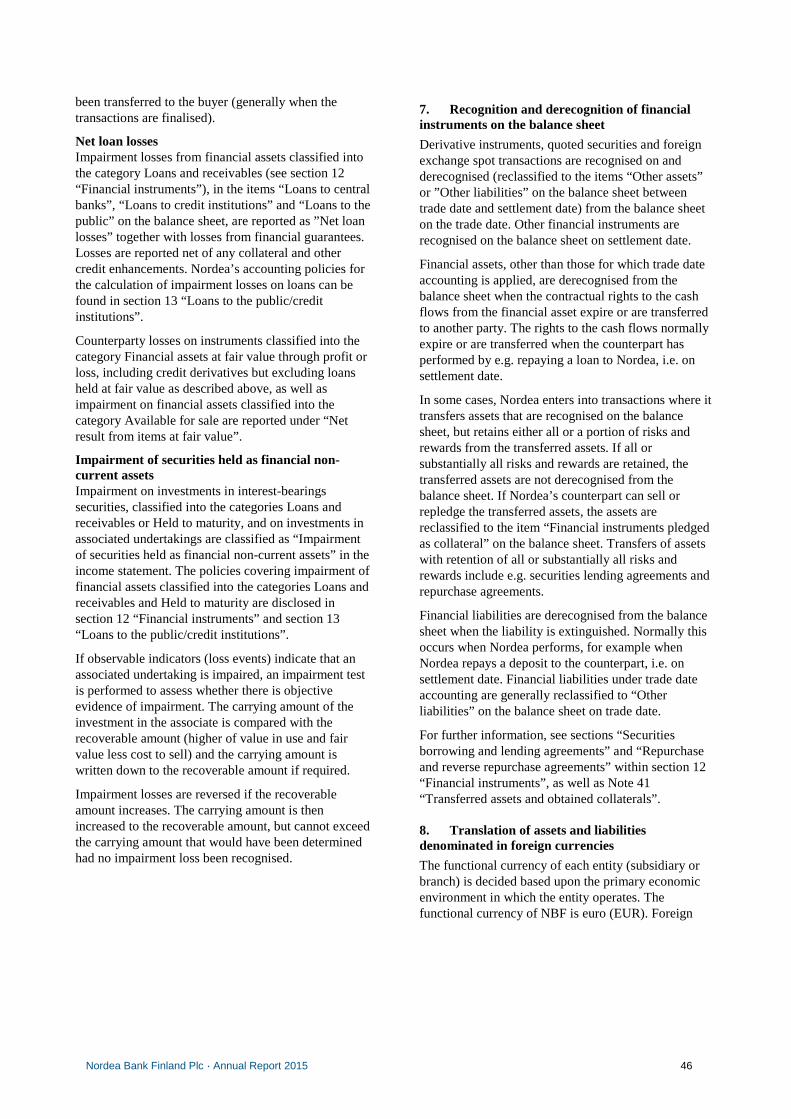
Nordea Bank Finland Plc . Annual Report 2015 46
been transferred to the buyer (generally when the transactions are finalised).
Net loan losses Impairment losses from financial assets classified into the category Loans and receivables (see section 12 “Financial instruments”), in the items “Loans to central banks”, “Loans to credit institutions” and “Loans to the public” on the balance sheet, are reported as ”Net loan losses” together with losses from financial guarantees. Losses are reported net of any collateral and other credit enhancements. Nordea’s accounting policies for the calculation of impairment losses on loans can be found in section 13 “Loans to the public/credit institutions”.
Counterparty losses on instruments classified into the category Financial assets at fair value through profit or loss, including credit derivatives but excluding loans held at fair value as described above, as well as impairment on financial assets classified into the category Available for sale are reported under “Net result from items at fair value”.
Impairment of securities held as financial non-current assets Impairment on investments in interest-bearings securities, classified into the categories Loans and receivables or Held to maturity, and on investments in associated undertakings are classified as “Impairment of securities held as financial non-current assets” in the income statement. The policies covering impairment of financial assets classified into the categories Loans and receivables and Held to maturity are disclosed in section 12 “Financial instruments” and section 13 “Loans to the public/credit institutions”.
If observable indicators (loss events) indicate that an associated undertaking is impaired, an impairment test is performed to assess whether there is objective evidence of impairment. The carrying amount of the investment in the associate is compared with the recoverable amount (higher of value in use and fair value less cost to sell) and the carrying amount is written down to the recoverable amount if required.
Impairment losses are reversed if the recoverable amount increases. The carrying amount is then increased to the recoverable amount, but cannot exceed the carrying amount that would have been determined had no impairment loss been recognised.
7. Recognition and derecognition of financial instruments on the balance sheet
Derivative instruments, quoted securities and foreign exchange spot transactions are recognised on and derecognised (reclassified to the items “Other assets” or ”Other liabilities” on the balance sheet between trade date and settlement date) from the balance sheet on the trade date. Other financial instruments are recognised on the balance sheet on settlement date.
Financial assets, other than those for which trade date accounting is applied, are derecognised from the balance sheet when the contractual rights to the cash flows from the financial asset expire or are transferred to another party. The rights to the cash flows normally expire or are transferred when the counterpart has performed by e.g. repaying a loan to Nordea, i.e. on settlement date.
In some cases, Nordea enters into transactions where it transfers assets that are recognised on the balance sheet, but retains either all or a portion of risks and rewards from the transferred assets. If all or substantially all risks and rewards are retained, the transferred assets are not derecognised from the balance sheet. If Nordea’s counterpart can sell or repledge the transferred assets, the assets are reclassified to the item “Financial instruments pledged as collateral” on the balance sheet. Transfers of assets with retention of all or substantially all risks and rewards include e.g. securities lending agreements and repurchase agreements.
Financial liabilities are derecognised from the balance sheet when the liability is extinguished. Normally this occurs when Nordea performs, for example when Nordea repays a deposit to the counterpart, i.e. on settlement date. Financial liabilities under trade date accounting are generally reclassified to “Other liabilities” on the balance sheet on trade date.
For further information, see sections “Securities borrowing and lending agreements” and “Repurchase and reverse repurchase agreements” within section 12 “Financial instruments”, as well as Note 41 “Transferred assets and obtained collaterals”.
8. Translation of assets and liabilities denominated in foreign currencies
The functional currency of each entity (subsidiary or branch) is decided based upon the primary economic environment in which the entity operates. The functional currency of NBF is euro (EUR). Foreign

Nordea Bank Finland Plc . Annual Report 2015 47
currency is defined as any currency other than the functional currency of the entity. Foreign currency transactions are recorded at the exchange rate on the date of the transaction. Monetary assets and liabilities including foreign exchange trades, currently denominated cash balances and derivatives are translated at the exchange rate on the balance sheet date.
Exchange differences arising on the settlement of transactions at rates different from those at the date of the transaction, and unrealised translation differences on unsettled foreign currency monetary assets and liabilities, are recognised in the income statement in the item “Net result from items at fair value”.
9. Hedge accounting
Nordea applies the EU carve out version of IAS 39 for portfolio hedges of both assets and liabilities. The EU carve out macro hedging enables a group of derivatives (or proportions thereof) to be viewed in combination and be designated as the hedging instrument. It also removes some of the limitations in fair value hedge accounting relating to hedging core deposits and under-hedging strategies.
Nordea uses hedge accounting in order to have a symmetrical accounting treatment of the changes in fair value of the hedged item and changes in fair value of the hedging instruments as well as to hedge the exposure to variability in future cash flows and the exposure to net investments in foreign operations.
There are three forms of hedge accounting:
• Fair value hedge accounting • Cash flow hedge accounting • Hedges of net investments NBF currently applies fair value hedge accounting and cash flow hedge accounting.
Fair value hedge accounting Fair value hedge accounting is used when derivatives are hedging changes in fair value of a recognised asset or liability attributable to a specific risk. The risk of changes in fair value of assets and liabilities in Nordea’s financial statements originates mainly from loans, securities and deposits with a fixed interest rate, causing interest rate risk. Changes in fair value from derivatives as well as changes in fair value of the hedged item attributable to the risks being hedged are recognised separately in the income statement in the item “Net result from items at fair value”. Given an effective hedge, the two changes in fair value will more or less balance, meaning the net result is close to zero. The changes in fair value of the hedged item attributable to the risks hedged with the derivative instrument are reflected in an adjustment to the carrying amount of the hedged item, which is also
recognised in the income statement. The fair value change of the hedged items held at amortised cost in a portfolio hedge of interest rate risks is reported separately from the portfolio in the item “Fair value changes of the hedged items in portfolio hedge of interest rate risk” on the balance sheet.
Fair value hedge accounting in Nordea is performed mainly on a portfolio basis. Any ineffectiveness is recognised in the income statement under the item “Net result from items at fair value”.
Hedged items A hedged item in a fair value hedge can be a recognised single asset or liability, an unrecognised firm commitment, or a portion thereof. The hedged item can also be a group of assets, liabilities or firm commitments with similar risk characteristics. Hedged items in Nordea consist of both individual assets or liabilities and portfolios of assets and/or liabilities.
Hedging instruments The hedging instruments used in Nordea are predominantly interest rate swaps and cross currency interest rate swaps, which are always held at fair value. Cash instruments are only used as hedging instruments when hedging currency risk.
Cash flow hedge accounting Cash flow hedge accounting can be used for the hedging of exposure to variations in future interest payments on instruments with variable interest rates and for the hedging of currency exposures. The portion of the gain or loss on the hedging instrument, that is determined to be an effective hedge, is recognised in other comprehensive income and accumulated in the cash flow hedge reserve in equity. The ineffective portion of the gain or loss on the hedging instrument is recycled to the item “Net result from items at fair value” in the income statement.
Gains or losses on hedging instruments recognised in the cash flow hedge reserve in equity through other comprehensive income are recycled and recognised in the income statement in the same period as the hedged item affects profit or loss, normally in the period that interest income or interest expense is recognised.
Hedged items A hedged item in a cash flow hedge can be highly probable floating interest rate cash flows from recognised assets or liabilities or from future assets or liabilities. Nordea uses cash flow hedges when hedging currency risk in future payments of interest and principal in foreign currency.
Hedging instruments The hedging instruments used in Nordea are predominantly cross currency interest rate swaps, which are always held at fair value, where the currency component is designated as a cash flow hedge of

Nordea Bank Finland Plc . Annual Report 2015 48
currency risk and the interest component as a fair value hedge of interest rate risk.
Hedge effectiveness The application of hedge accounting requires the hedge to be highly effective. A hedge is regarded as highly effective if at inception and throughout its life it can be expected that changes in fair value of the hedged item as regards the hedged risk can be essentially offset by changes in fair value of the hedging instrument. The result should be within a range of 80–125 per cent. When assessing hedge effectiveness retrospectively Nordea measures the fair value of the hedging instruments and compares the change in fair value of the hedging instrument to the change in fair value of the hedged item. The effectiveness measurement is made on a cumulative basis. The hypothetical derivative method is used when measuring the effectiveness of cash flow hedges, meaning that the change in a perfect hypothetical swap is used as proxy for the present value of the cumulative change in expected future cash flows from the hedged transaction (the currency component).
If the hedge relationship does not fulfil the requirements, hedge accounting is terminated. For fair value hedges the hedging instrument is reclassified to a trading derivative and the change in the fair value of the hedged item, up to the point when the hedge relationship is terminated, is amortised to the income statement on a straight-line basis over the remaining maturity of the hedged item.
In cash flow hedges, changes in the unrealised value of the hedging instrument will prospectively from the last time it was proven effective be accounted for in the income statement. The cumulative gain or loss on the hedging instrument that has been recognised in the cash flow hedge reserve in equity through other comprehensive income from the period when the hedge was effective is reclassified from equity to “Net result from items at fair value” in the income statement if the expected transaction no longer is expected to occur. If the expected transaction no longer is highly probable, but is still expected to occur, the cumulative gain or loss on the hedging instrument that has been recognised in other comprehensive income from the period when the hedge was effective remains in other comprehensive income until the transaction occurs or is no longer expected to occur.
10. Determination of fair value of financial instruments
Financial assets and liabilities classified into the categories Financial assets/liabilities at fair value through profit or loss (including derivative instruments) are recorded at fair value on the balance sheet with changes in fair value recognised in the
income statement in the item “Net result from items at fair value”.
Fair value is defined as the price that at the measurement date would be received to sell an asset or paid to transfer a liability in an orderly transaction between market participants under current market conditions in the principal market for the asset or liability or, in the absence of a principal market, in the most advantageous market for the asset or liability.
The existence of published price quotations in an active market is the best evidence of fair value and when they exist they are used to measure financial assets and financial liabilities. An active market for the asset or liability is a market in which transactions for the asset or liability occur with sufficient frequency and volume to provide pricing information on an on-going basis. The absolute level for liquidity and volume required for a market to be considered active vary with the instrument classes. For some classes low price volatility is seen, also for those instruments within the class where the trade frequency is high. For instruments in such a class the liquidity requirements are lower and, correspondingly, the age limit for the prices used for establishing fair value is higher.
If markets are active or non-active is assessed regularly. The trade frequency and volume are monitored daily.
Nordea is predominantly using published price quotations to establish fair value for items disclosed under the following balance sheet items:
• Interest-bearing securities • Shares (listed) • Derivatives (listed).
If quoted prices for a financial instrument fail to represent actual and regularly occurring market transactions or if quoted prices are not available, fair value is established by using an appropriate valuation technique. The adequacy of the valuation technique, including an assessment of whether to use quoted prices or theoretical prices, is monitored on a regular basis.
Valuation techniques can range from simple discounted cash flow analysis to complex option pricing models. Valuation models are designed to apply observable market prices and rates as input whenever possible, but can also make use of unobservable model parameters. The adequacy of the valuation model is assessed by measuring its capability to hit market prices. This is done by comparison of calculated prices to relevant benchmark data, e.g. quoted prices from exchanges, the counterparty´s valuations, price data from consensus services etc.
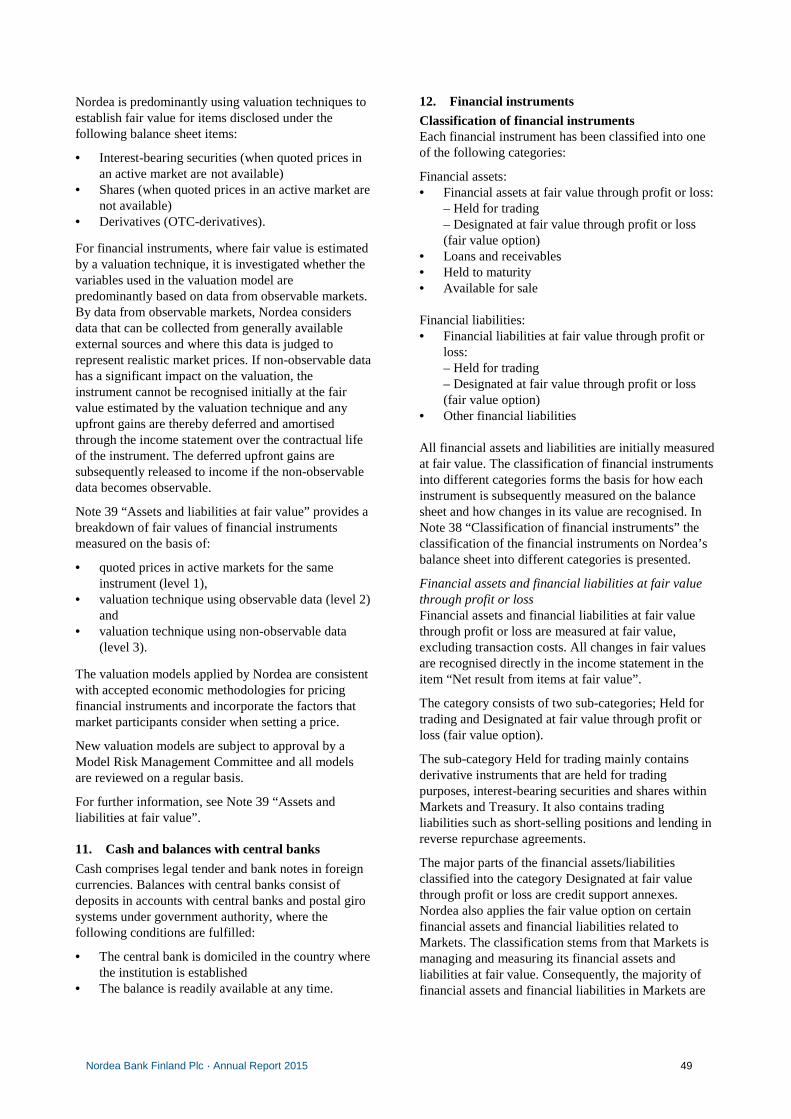
Nordea Bank Finland Plc . Annual Report 2015 49
Nordea is predominantly using valuation techniques to establish fair value for items disclosed under the following balance sheet items:
• Interest-bearing securities (when quoted prices in an active market are not available)
• Shares (when quoted prices in an active market are not available)
• Derivatives (OTC-derivatives).
For financial instruments, where fair value is estimated by a valuation technique, it is investigated whether the variables used in the valuation model are predominantly based on data from observable markets. By data from observable markets, Nordea considers data that can be collected from generally available external sources and where this data is judged to represent realistic market prices. If non-observable data has a significant impact on the valuation, the instrument cannot be recognised initially at the fair value estimated by the valuation technique and any upfront gains are thereby deferred and amortised through the income statement over the contractual life of the instrument. The deferred upfront gains are subsequently released to income if the non-observable data becomes observable.
Note 39 “Assets and liabilities at fair value” provides a breakdown of fair values of financial instruments measured on the basis of:
• quoted prices in active markets for the same instrument (level 1),
• valuation technique using observable data (level 2) and
• valuation technique using non-observable data (level 3).
The valuation models applied by Nordea are consistent with accepted economic methodologies for pricing financial instruments and incorporate the factors that market participants consider when setting a price.
New valuation models are subject to approval by a Model Risk Management Committee and all models are reviewed on a regular basis.
For further information, see Note 39 “Assets and liabilities at fair value”.
11. Cash and balances with central banks
Cash comprises legal tender and bank notes in foreign currencies. Balances with central banks consist of deposits in accounts with central banks and postal giro systems under government authority, where the following conditions are fulfilled:
• The central bank is domiciled in the country where the institution is established
• The balance is readily available at any time.
12. Financial instruments
Classification of financial instruments Each financial instrument has been classified into one of the following categories:
Financial assets: • Financial assets at fair value through profit or loss:
– Held for trading – Designated at fair value through profit or loss (fair value option)
• Loans and receivables • Held to maturity • Available for sale Financial liabilities: • Financial liabilities at fair value through profit or
loss: – Held for trading – Designated at fair value through profit or loss (fair value option)
• Other financial liabilities All financial assets and liabilities are initially measured at fair value. The classification of financial instruments into different categories forms the basis for how each instrument is subsequently measured on the balance sheet and how changes in its value are recognised. In Note 38 “Classification of financial instruments” the classification of the financial instruments on Nordea’s balance sheet into different categories is presented.
Financial assets and financial liabilities at fair value through profit or loss Financial assets and financial liabilities at fair value through profit or loss are measured at fair value, excluding transaction costs. All changes in fair values are recognised directly in the income statement in the item “Net result from items at fair value”.
The category consists of two sub-categories; Held for trading and Designated at fair value through profit or loss (fair value option).
The sub-category Held for trading mainly contains derivative instruments that are held for trading purposes, interest-bearing securities and shares within Markets and Treasury. It also contains trading liabilities such as short-selling positions and lending in reverse repurchase agreements.
The major parts of the financial assets/liabilities classified into the category Designated at fair value through profit or loss are credit support annexes. Nordea also applies the fair value option on certain financial assets and financial liabilities related to Markets. The classification stems from that Markets is managing and measuring its financial assets and liabilities at fair value. Consequently, the majority of financial assets and financial liabilities in Markets are

Nordea Bank Finland Plc . Annual Report 2015 50
classified into the categories Financial assets/Financial liabilities at fair value through profit or loss.
Loans and receivables Loans and receivables are non-derivative financial assets, with fixed or determinable payments, that are not quoted in an active market. These assets and their impairment are further described in the separate section 13 “Loans to the public/credit institutions”.
Held to maturity Financial assets that Nordea has chosen to classify into the category Held to maturity are non-derivative financial assets with fixed or determinable payments and fixed maturity that Nordea has the positive intent and ability to hold to maturity. Financial assets classified into the category Held to maturity are initially recognised on the balance sheet at the acquisition price, including transaction costs. Subsequent to initial recognition, the instruments within this category are measured at amortised cost. In an amortised cost measurement, the difference between acquisition cost and redemption value is amortised in the income statement over the remaining term using the effective interest rate method.
If more than an insignificant amount of the Held to maturity portfolio is sold or transferred the Held to maturity category is tainted, except for if the sale or transfer either occur close to maturity, after substantially all of the original principal is already collected, or due to an isolated non-recurring event beyond the control of Nordea.
Nordea assesses at each reporting date whether there is any objective evidence that the asset is impaired. If there is such evidence, an impairment loss is recorded. The loss is calculated as the difference between the carrying amount and the present value of estimated future cash flows and is recognised as “Impairment of securities held as financial non-current assets” in the income statement. See section 13 “Loans to the public/credit institutions” for more information on the identification and measurement of objective evidence of impairment, which is applicable also for interest-bearings securities classified into the category Held to maturity.
Available for sale Financial instruments classified into the category Available for sale are measured at fair value. Changes in fair values, except for interest, foreign exchange effects and impairment losses, are recognised in the fair value reserve in equity through other comprehensive income. Interest is recognised in the item “Interest income” and foreign exchange effects and impairment losses in the item “Net result from items at fair value” in the income statement.
When an instrument classified into the category Available for sale is disposed of, the fair value changes that previously have been accumulated in the fair value reserve (related to Available for sale investments) in other comprehensive income are removed from equity and recognised in the income statement in the item “Net result from items at fair value”.
Financial assets classified into the category Available for sale are assessed in order to determine any need for impairment losses. If there is objective evidence of impairment, the accumulated loss that has been recognised in other comprehensive income is removed from equity and recognised as “Net result from items at fair value” in the income statement. The amount of the accumulated loss that is recycled from equity is the difference between the asset’s acquisition cost and current fair value. For equity investments a prolonged or significant decline in the fair value, compared to the acquisition cost, is considered to be objective evidence of impairment. Objective evidence of impairment for a debt instrument is rather connected to a loss event, such as an issuer’s financial difficulty.
Other financial liabilities Financial liabilities, other than those classified into the category Financial liabilities at fair value through profit or loss, are measured at amortised cost. Interest on Other financial liabilities is recognised in the item “Interest expense” in the income statement.
Hybrid (combined) financial instruments Hybrid (combined) financial instruments are contracts containing a host contract and an embedded derivative instrument. Such combinations arise predominantly from the issuance of structured debt instruments, such as issued index-linked bonds.
Index-linked bonds issued by Markets as part of the trading portfolio are classified into the category Held for trading, and the entire combined instrument, host contract together with the embedded derivative, is measured at fair value through profit or loss. Changes in fair values are recognised in the income statement in the item “Net result from items at fair value”. From a presentation perspective the host contract is on the balance sheet presented as “Debt securities in issue” and the embedded derivative as “Derivatives”.
Securities borrowing and lending agreements Generally, securities borrowing and securities lending transactions are entered into on a collateralised basis. Unless the risks and rewards of ownership are transferred, the securities are not recognised on or derecognised from the balance sheet. In the cases where the counterpart is entitled to resell or repledge the securities, the securities are reclassified to the balance sheet item “Financial instruments pledged as collateral”.

Nordea Bank Finland Plc . Annual Report 2015 51
Securities in securities lending transactions are also disclosed in the item “Assets pledged as security for own liabilities”.
Cash collateral advanced (securities borrowing) to the counterparts is recognised on the balance sheet as “Loans to central banks”, “Loans to credit institutions” or as “Loans to the public”. Cash collateral received (securities lending) from the counterparts is recognised on the balance sheet as “Deposits by credit institutions” or as “Deposits and borrowings from the public”.
Repurchase and reverse repurchase agreements Securities delivered under repurchase agreements and securities received under reverse repurchase agreements are not derecognised from or recognised on the balance sheet. In the cases where the counterpart has the right to resell or repledge the securities, the securities are reclassified to the balance sheet line “Financial instruments pledged as collateral”.
Securities delivered under repurchase agreements are also disclosed in the item “Assets pledged as security for own liabilities”.
Cash received under repurchase agreements is recognised on the balance sheet as “Deposits by credit institutions” or as “Deposits and borrowings from the public”. Cash delivered under reverse repurchase agreements is recognised on the balance sheet as “Loans to central banks”, “Loans to credit institutions” or as “Loans to the public”.
Additionally, the sale of securities received in reverse repurchase agreements trigger the recognition of a trading liability (short sale).
Derivatives All derivatives are recognised on the balance sheet and measured at fair value. Derivatives with total positive fair values, including any accrued interest, are recognised as assets in the item “Derivatives” on the asset side. Derivatives with total negative fair values, including any accrued interest, are recognised as liabilities in the item “Derivatives” on the liability side.
Realised and unrealised gains and losses from derivatives are recognised in the income statement in the item “Net result from items at fair value”.
Offsetting of financial assets and liabilities Nordea offsets financial assets and liabilities on the balance sheet if there is a legal right to offset, in the ordinary course of business and in case of bankruptcy, and if the intent is to settle the items net or realise the asset and settle the liability simultaneously. This is generally achieved through the central counterparty clearing houses that Nordea has agreements with.
Exchange traded derivatives are generally accounted for as settled on a daily basis when cash is paid or received and the instrument is reset to market terms. Derivative assets and liabilities against central counterparty clearing houses are, as mentioned above, generally set off on the balance sheet, but net cash collateral received or paid is generally accounted for separately as cash collateral paid (asset) or received (liability), which is also the case for cash collateral paid or received in bilateral OTC derivative transactions. Cash collateral paid or received in bilateral OTC derivative transactions are consequently not offset against the fair value of the derivatives.
Issued debt and equity instruments A financial instrument issued by Nordea is either classified as a financial liability or equity. Issued financial instruments are classified as a financial liability if the contractual arrangement results in Nordea having a present obligation to either deliver cash or another financial asset, or a variable number of equity instruments to the holder of the instrument. If this is not the case, the instrument is generally an equity instrument and classified as equity, net of transaction costs. Where issued financial instruments contain both liability and equity components, these are accounted for separately.
13. Loans to the public/credit institutions
Financial instruments classified as “Loans to the public/credit institutions” (including loans to central banks) on the balance sheet and into the category Loans and receivables are measured at amortised cost (see also the separate section 7 “Recognition and derecognition of financial instruments on the balance sheet” as well as Note 38 ”Classification of financial instruments”).
Nordea monitors loans as described in the separate section on Risk, Liquidity and Capital management. Loans attached to individual customers or groups of customers are identified as impaired if the impairment tests indicate an objective evidence of impairment.
Also interest-bearings securities classified into the categories Loans and receivables and Held to maturity are held at amortised cost and the description below is valid also for the identification and measurement of impairment on these assets. Possible impairment losses on interest-bearing securities classified into the categories Loans and receivables and Held to maturity are recognised as “Impairment of securities held as non-current financial assets” in the income statement.

Nordea Bank Finland Plc . Annual Report 2015 52
Impairment test of individually assessed loans Nordea tests all loans for impairment on an individual basis. The purpose of the impairment tests is to find out if the loans have become impaired. As a first step in the identification process for impaired loans, Nordea monitors whether there are indicators of impairment (loss event) and whether these loss events represent objective evidence of impairment. More information on the identification of loss events can be found in the Risk, Liquidity and Capital management section.
Loans that are not individually impaired will be transferred to a group of loans with similar risk characteristics for a collective impairment test.
Impairment test of collectively assessed loans Loans not impaired on an individual basis are collectively tested for impairment.
These loans are grouped on the basis of similar credit risk characteristics that are indicative of the debtors´ ability to pay all amounts due according to the contractual terms. Nordea monitors its portfolio through rating migrations, the credit decision and annual review process supplemented by quarterly risk reviews. Through these processes Nordea identifies loss events indicating incurred losses in a group. A loss event is an event resulting in a deterioration of the expected future cash flows. Only loss events incurred up to the reporting date are included when performing the assessment of the group.
The objective for the group assessment process is to evaluate if there is a need to make a provision due to the fact that a loss event has occurred, which has not yet been identified on an individual basis. This period between the date when the loss event occurred and the date when it is identified on an individual basis is called “Emergence period”. The impairment remains related to the group of loans until the losses have been identified on an individual basis. The identification of the loss is made through a default of the engagement or by other indicators.
For corporate customers and bank counterparts, Nordea uses the existing rating system as a basis when assessing the credit risk. Nordea uses historical data on probability of default to estimate the risk for a default in a rating class. These loans are rated and grouped mostly based on type of industry and/or sensitivity to certain macro parameters, e.g. dependency to oil prices etc.
Personal customers and small corporate customers are monitored through scoring models. These are based mostly on historical data, as default rates and loss rates given a default, and experienced judgement performed by management. Rating and scoring models are described in more detail in the separate section on Risk, Liquidity and Capital management.
Impairment loss If the carrying amount of the loans is higher than the sum of the net present value of estimated cash flows (discounted with the original effective interest rate), including the fair value of the collaterals and other credit enhancements, the difference is the impairment loss.
For significant loans that have been individually identified as impaired the measurement of the impairment loss is made on an individual basis.
For insignificant loans that have been individually identified as impaired and for loans not identified as impaired on an individual basis the measurement of the impairment loss is measured using a portfolio based expectation of the future cash flows.
If the impairment loss is not regarded as final, the impairment loss is accounted for on an allowance account representing the accumulated impairment losses. Changes in the credit risk and accumulated impairment losses are accounted for as changes in the allowance account and as ”Net loan losses” in the income statement (see also section 6 “Recognition of operating income and impairment”).
If the impairment loss is regarded as final, it is reported as a realised loss and the value of the loan and the related allowance for impairment loss are derecognised. An impairment loss is regarded as final when the obligor is filed for bankruptcy and the administrator has declared the economic outcome of the bankruptcy procedure, or when Nordea forgives its claims either through a legal based or voluntary reconstruction or when Nordea, for other reasons, deems it unlikely that the claim will be recovered.
Discount rate The discount rate used to measure impairment is the original effective interest rate for loans attached to an individual customer or, if applicable, to a group of loans. If considered appropriate, the discount rate can be based on a method that results in an impairment that is a reasonable approximation of using the effective interest rate method as basis for the calculation.
Restructured loans In this context a restructured loan is defined as a loan where Nordea has granted concessions to the obligor due to its deteriorated financial situation and where this concession has resulted in an impairment loss for Nordea. After a reconstruction the loan is normally regarded as not impaired if it performs according to the new conditions. Concessions made in reconstructions are regarded as loan losses unless Nordea retains the possibility to regain the loan losses incurred. In the event of a recovery the payment is reported as a recovery of loan losses.

Nordea Bank Finland Plc . Annual Report 2015 53
Assets taken over for protection of claims In a financial reconstruction the creditor may concede loans to the obligor and in exchange for this concession acquire an asset pledged for the conceded loans, shares issued by the obligor or other assets. Assets taken over for protection of claims are reported on the same balance sheet line as similar assets already held by Nordea. For example a property taken over, not held for Nordea’s own use, is reported together with other investment properties.
At initial recognition, all assets taken over for protection of claims are recognised at fair value and the possible difference between the carrying amount of the loan and the fair value of the assets taken over is recognised as “Net loan losses”. The fair value of the asset on the date of recognition becomes its cost or amortised cost value, as applicable. In subsequent periods, assets taken over for protection of claims are valued in accordance with the valuation principles for the appropriate type of asset. Investment properties are then measured at fair value. Financial assets that are foreclosed are generally classified into the categories Available for sale or Designated at fair value through profit or loss (fair value option) (see section 12 “Financial instruments”) and measured at fair value. Changes in fair values are recognised in other comprehensive income for assets classified into the category Available for sale. For assets classified into the category Designated at fair value through profit or loss, changes in fair value are recognised in the income statement under the line “Net result from items at fair value”.
Any change in value, after the initial recognition of the asset taken over, is presented in the income statement in line with the Group’s presentation policies for the appropriate asset. ”Net loan losses” in the income statement is, after the initial recognition of the asset taken over, consequently not affected by any subsequent remeasurement of the asset.
14. Leasing
NBF as lessor Finance leases Nordea’s leasing operations mainly comprise finance leases. A finance lease is reported as a receivable from the lessee in the balance sheet item “Loans to the public” at an amount equal to the net investment in the lease. The lease payment, excluding cost of services, is recorded as repayment of principal and interest income. The income allocation is based on a pattern reflecting a constant periodic return on the net investment outstanding in respect of the finance lease.
Operating leases Assets subject to operating leases on the balance sheet are reported in accordance with the nature of the assets, in general as properties and equipment. Leasing
income is recognised as income on a straight-line basis over the lease term and classified as “Net interest income”. The depreciation of the leased assets is calculated on the basis of Nordea’s depreciation policy for similar assets and reported as “Depreciation, amortisation and impairment charges of tangible and intangible assets” in the income statement.
NBF as lessee Finance leases No leases in NBF have been classified as finance leases.
Operating leases Operating leases are not recognised on NBF’s balance sheet. For operating leases the lease payments are recognised as expenses in the income statement on a straight-line basis over the lease term unless another systematic way better reflects the time pattern of Nordea’s benefit. The original lease terms normally range between 3 to 25 years.
Operating leasing is mainly related to office premises contracts and office equipment contracts normal to the business.
The central district properties in Finland that Nordea has divested are leased back. The duration of the lease agreements was initially 3-25 years with renewal options. The lease agreements include no transfers of ownerships of the asset by the end of the lease term, nor any economic benefits from appreciation in value of the leased properties. In addition, the lease term is not for the major part of the assets’ economic life. These leases are thus classified as operating leases. The rental expense for these premises is recognised on the basis of the time-pattern of Nordea’s economic benefit which differs from the straight-line basis and better resembles an ordinary rental arrangement.
Embedded leases Agreements can contain a right to use an asset in return for a payment, or a series of payments, although the agreement is not in the legal form of a leasing contract. If applicable, these assets are separated from the contract and accounted for as leased assets.
15. Intangible assets
Intangible assets are identifiable, non-monetary assets without physical substance. The assets are under Nordea’s control, which means that Nordea has the power and rights to obtain the future economic benefits flowing from the underlying resource. The intangible assets in Nordea mainly consist of goodwill, IT-development/computer software and customer related intangible assets.
IT-development/Computer software Costs associated with maintaining computer software programs are expensed as incurred. Costs directly associated with major software development

Nordea Bank Finland Plc . Annual Report 2015 54
investments, with the ability to generate future economic benefits, are recognised as intangible assets. These costs include software development staff costs and overhead expenditures directly attributable to preparing the asset for use. Computer software includes also acquired software licenses not related to the function of a tangible asset.
Amortisation is calculated on a straight-line basis over the useful life of the software, generally a period of 3 to 10 years.
Impairment At each balance sheet date, all intangible assets with definite useful lives are reviewed for indications of impairment. If such indications exist, an analysis is performed to assess whether the carrying amount of the intangible asset is fully recoverable.
The recoverable amount is the higher of fair value less costs of disposal and the value in use of the asset or the cash-generating unit, which is defined as the smallest identifiable group of assets that generates largely independent cash flows in relation to other assets. The value in use is the present value of the cash flows expected to be realised from the asset or the cash-generating unit. The cash flows are assessed based on the asset or cash-generating unit in its current condition and discounted at a rate based on the long-term risk free interest rate plus a risk premium. If the recoverable amount is less than the carrying amount, an impairment loss is recognised.
16. Properties and equipment
Properties and equipment includes own-used properties, leasehold improvements, IT equipment, furniture and other equipment. Items of properties and equipment are measured at cost less accumulated depreciation and accumulated impairment losses. The cost of an item of properties and equipment comprise its purchase price, as well as any directly attributable costs of bringing the asset to the working condition for its intended use. When parts of an item of property and equipment have different useful lives, they are accounted for as separate items.
Properties and equipment is depreciated on a straight-line basis over the estimated useful life of the assets. The estimates of the useful life of different assets are reassessed on a yearly basis. Below follows the current estimates:
• Buildings: 30–75 years • Equipment: 3–5 years • Leasehold improvements: Changes within
buildings the shorter of 10 years and the remaining leasing term. Fixtures installed in leased properties are depreciated over the shorter of 10–20 years and the remaining leasing term.
At each balance sheet date, Nordea assesses whether there is any indication that an item of property and equipment may be impaired. If any such indication exists, the recoverable amount of the asset is estimated and any impairment loss is recognised.
Impairment losses are reversed if the recoverable amount increases. The carrying amount is then increased to the recoverable amount, but cannot exceed the carrying amount that would have been determined had no impairment loss been recognised.
17. Taxes
The item “Income tax expense” in the income statement comprises current and deferred income tax. The income tax expense is recognised in the income statement, except to the extent the tax effect relates to items recognised in other comprehensive income or directly in equity, in which case the tax effect is recognised in other comprehensive income or in equity respectively.
Current tax is the tax expense on the taxable income for the year, using tax rates enacted or substantively enacted at the reporting date, and any adjustment to tax payable in respect of previous years.
Deferred tax assets and liabilities are recognised, using the balance sheet method, for temporary differences between the carrying amounts of assets and liabilities for financial reporting purposes and the amounts used for taxation purposes. Deferred tax assets are recognised for the carry forward of unused tax losses and unused tax credits. Deferred tax is not recognised for temporary differences arising on initial recognition of assets or liabilities in a transaction that is not a business combination and that affects neither accounting nor taxable profit, nor for differences relating to investments in group undertakings and associated undertakings to the extent that it is probable that they will not reverse in the foreseeable future.
Deferred tax is measured at the tax rates that are expected to be applied to the temporary differences when they reverse, based on the laws that have been enacted or substantively enacted at the reporting date. Deferred tax assets and liabilities are not discounted. A deferred tax asset is recognised only to the extent that it is probable that future taxable profits will be available against which the temporary differences, tax losses carry forward and unused tax credits can be utilised. Deferred tax assets are reviewed at each reporting date and are reduced to the extent that it is no longer probable that the related tax benefit will be realised.
Current tax assets and current tax liabilities are offset when the legal right to offset exists and NBF intends to either settle the tax asset and the tax liability net or to recover the asset and settle the liability simultaneously.

Nordea Bank Finland Plc . Annual Report 2015 55
Deferred tax assets and deferred tax liabilities are offset if there is a legally enforceable right to offset current tax assets and current tax liabilities.
18. Employee benefits
All forms of consideration given by Nordea to its employees as compensation for services performed are employee benefits. Short-term benefits are to be settled within twelve months after the reporting period when the services have been performed. Post-employment benefits are benefits payable after the termination of the employment. Post-employment benefits in Nordea consist only of pensions. Termination benefits normally arise if an employment is terminated before the normal retirement date, or if an employee accepts an offer of voluntary redundancy.
Short-term benefits Short term benefits consist mainly of fixed and variable salary. Both fixed and variable salaries are expensed in the period when the employees have performed services to Nordea. Nordea has also issued share-based payment programmes, which are further described in section 21 “Share-based payment”.
More information can be found in Note 8 “Staff costs”.
Post-employment benefits Pension plans The companies within Nordea have various pension plans, consisting of both defined benefit pension plans and defined contribution pension plans, reflecting national practices and conditions in the countries where Nordea operates. The major defined benefit pension plans are funded schemes covered by assets in pension funds/foundations. If the fair value of plan assets, associated with a specific pension plan, is lower than the gross present value of the defined benefit obligation determined using the projected unit credit method, the net amount is recognised as a liability (“Retirement benefit liabilities”). If not, the net amount is recognised as an asset (“Retirement benefit assets”). Non-funded pension plans are recognised as “Retirement benefit liabilities”.
Most pensions are based on defined contribution arrangements that hold no pension liability for Nordea. All defined benefit pension plans are closed for new employees. Nordea also contributes to public pension systems.
Pension costs Obligations for defined contribution pension plans are recognised as an expense as the employee renders services to the entity and the contribution payable in exchange for that service becomes due. Nordea’s net
obligation for defined benefit pension plans is calculated separately for each plan by estimating the amount of future benefit that employees have earned for their service in the current and prior periods. That benefit is discounted to determine its present value. Actuarial calculations including the projected unit credit method are applied to assess the present value of defined benefit obligations and related costs, based on several actuarial and financial assumptions (as disclosed in Note 31 “Retirement benefit obligations”).
When establishing the present value of the obligation and the fair value of any plan assets, remeasurement effects may arise as a result of changes in actuarial assumptions and experience effects (actual outcome compared to assumptions). The remeasurement effects are recognised immediately in equity through other comprehensive income.
When the calculation results in a benefit the recognised asset is limited to the present value of any future refunds from the plan or reductions in future contributions to the plan.
Discount rate in defined benefit pension plans The discount rate is determined by reference to high quality corporate bonds, where a deep enough market for such bonds exists. In countries where no such market exists the discount rate is determined by reference to government bond yields. In Finland the discount rate is determined with reference to corporate bonds.
Termination benefits As mentioned above, termination benefits normally arise if an employment is terminated before the normal retirement date, or if an employee accepts an offer of voluntary redundancy. Termination benefits do not arise if the employees have to continue performing services and the termination benefits can be considered to be normal compensation for those services.
Termination benefits are expensed when Nordea has an obligation to make the payment. An obligation arises when there is a formal plan committed to on the appropriate organisational level and when Nordea is without realistic possibility of withdrawal, which normally occurs when the plan has been communicated to the group affected or to their representatives.
Termination benefits can include both short-term benefits, for instance a number of months’ salary, and post-employment benefits, normally in the form of early retirement. Short-term benefits are classified as “Salaries and remuneration” and post-employment benefits as “Pension costs” in Note 8 “Staff costs”.
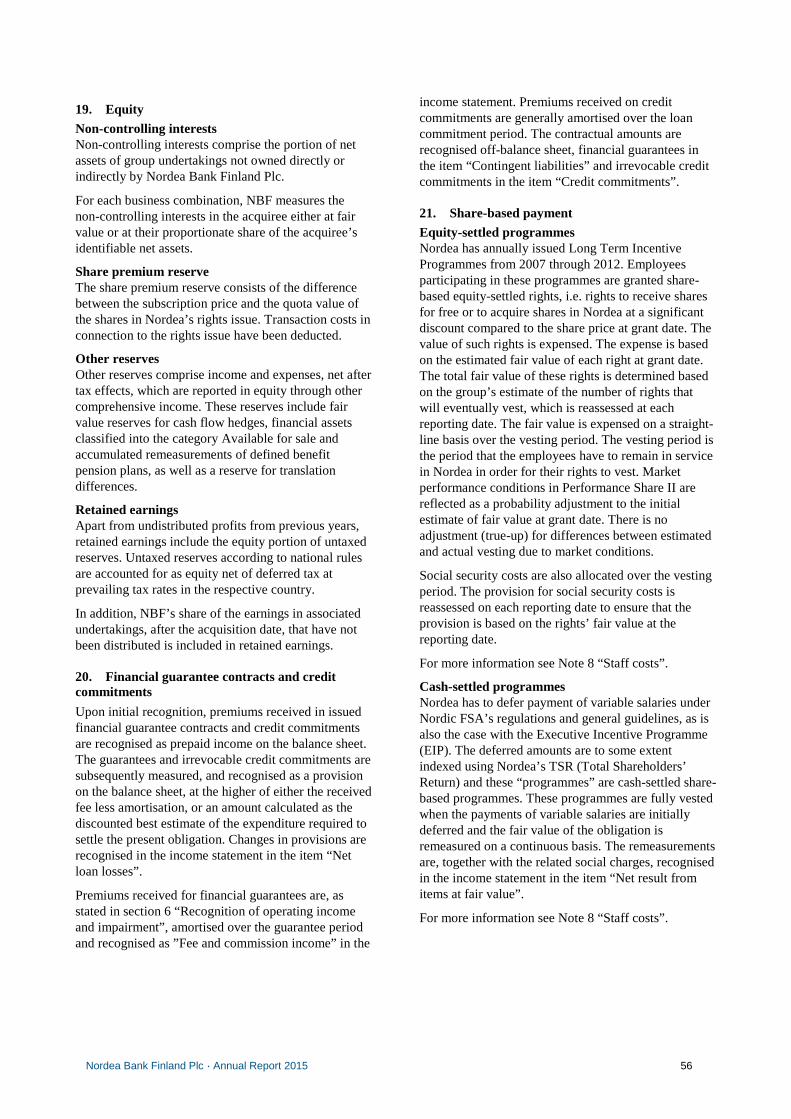
Nordea Bank Finland Plc . Annual Report 2015 56
19. Equity
Non-controlling interests Non-controlling interests comprise the portion of net assets of group undertakings not owned directly or indirectly by Nordea Bank Finland Plc.
For each business combination, NBF measures the non-controlling interests in the acquiree either at fair value or at their proportionate share of the acquiree’s identifiable net assets.
Share premium reserve The share premium reserve consists of the difference between the subscription price and the quota value of the shares in Nordea’s rights issue. Transaction costs in connection to the rights issue have been deducted.
Other reserves Other reserves comprise income and expenses, net after tax effects, which are reported in equity through other comprehensive income. These reserves include fair value reserves for cash flow hedges, financial assets classified into the category Available for sale and accumulated remeasurements of defined benefit pension plans, as well as a reserve for translation differences.
Retained earnings Apart from undistributed profits from previous years, retained earnings include the equity portion of untaxed reserves. Untaxed reserves according to national rules are accounted for as equity net of deferred tax at prevailing tax rates in the respective country.
In addition, NBF’s share of the earnings in associated undertakings, after the acquisition date, that have not been distributed is included in retained earnings.
20. Financial guarantee contracts and credit commitments
Upon initial recognition, premiums received in issued financial guarantee contracts and credit commitments are recognised as prepaid income on the balance sheet. The guarantees and irrevocable credit commitments are subsequently measured, and recognised as a provision on the balance sheet, at the higher of either the received fee less amortisation, or an amount calculated as the discounted best estimate of the expenditure required to settle the present obligation. Changes in provisions are recognised in the income statement in the item “Net loan losses”.
Premiums received for financial guarantees are, as stated in section 6 “Recognition of operating income and impairment”, amortised over the guarantee period and recognised as ”Fee and commission income” in the
income statement. Premiums received on credit commitments are generally amortised over the loan commitment period. The contractual amounts are recognised off-balance sheet, financial guarantees in the item “Contingent liabilities” and irrevocable credit commitments in the item “Credit commitments”.
21. Share-based payment
Equity-settled programmes Nordea has annually issued Long Term Incentive Programmes from 2007 through 2012. Employees participating in these programmes are granted share-based equity-settled rights, i.e. rights to receive shares for free or to acquire shares in Nordea at a significant discount compared to the share price at grant date. The value of such rights is expensed. The expense is based on the estimated fair value of each right at grant date. The total fair value of these rights is determined based on the group’s estimate of the number of rights that will eventually vest, which is reassessed at each reporting date. The fair value is expensed on a straight-line basis over the vesting period. The vesting period is the period that the employees have to remain in service in Nordea in order for their rights to vest. Market performance conditions in Performance Share II are reflected as a probability adjustment to the initial estimate of fair value at grant date. There is no adjustment (true-up) for differences between estimated and actual vesting due to market conditions.
Social security costs are also allocated over the vesting period. The provision for social security costs is reassessed on each reporting date to ensure that the provision is based on the rights’ fair value at the reporting date.
For more information see Note 8 “Staff costs”.
Cash-settled programmes Nordea has to defer payment of variable salaries under Nordic FSA’s regulations and general guidelines, as is also the case with the Executive Incentive Programme (EIP). The deferred amounts are to some extent indexed using Nordea’s TSR (Total Shareholders’ Return) and these “programmes” are cash-settled share-based programmes. These programmes are fully vested when the payments of variable salaries are initially deferred and the fair value of the obligation is remeasured on a continuous basis. The remeasurements are, together with the related social charges, recognised in the income statement in the item “Net result from items at fair value”.
For more information see Note 8 “Staff costs”.

Nordea Bank Finland Plc . Annual Report 2015 57
22. Related party transactions
NBF defines related parties as:
• Shareholders with significant influence • Group undertakings • Associated undertakings • Key management personnel • Other related parties. All transactions with related parties are made on an arm’s length basis, apart from loans granted to employees, see Note 8 “Staff costs”.
Shareholders with significant influence Shareholders with significant influence are shareholders that have the power to participate in the financial and operating decisions of NBF but do not control those policies. Nordea and its group companies are considered having such a power.
Group undertakings For the definition of group undertakings see section 5 “Principles of consolidation”. Further information on the undertakings included in the NBF Group is found in Note 18 “Investments in group undertakings”.
Group internal transactions between legal entities are performed according to arm’s length principles in conformity with OECD requirements on transfer pricing. These transactions are eliminated in the consolidated accounts.
Associated undertakings For the definition of associated undertakings see section 5 “Principles of consolidation”.
Further information on the associated undertakings included in the NBF Group is found in Note 19 “Investments in associated undertakings”.
Key management personnel Key management personnel include the following positions: • The Board of Directors of Nordea Bank Finland
Plc and Nordea Bank AB (publ) • The President of Nordea Bank Finland Plc and the
deputy to the President • The Group Executive Management (GEM). For information about compensation, pensions and other transactions with key management personnel, see Note 8 “Staff costs”.
Other related parties Other related parties comprise close family members to individuals in key management personnel. Other related parties also include companies significantly influenced by key management personnel in the NBF Group as well as companies significantly influenced by close family members to these key management personnel. Other related parties also include Nordea Pension Foundation.
Information concerning transactions between NBF and other related parties is found in Note 43 “Related-party transactions”.

Nordea Bank Finland Plc . Annual Report 2015 58
Note 2 Segment reporting
Operating segments
Group Measurement of Operating segments' performance The measurement principles and allocation between operating segments follow the information reported to the Chief Operating Decision Maker (CODM). In NBF the CODM has been defined as Group Executive Management. Basis of segmentation Financial results are presented for the two main business areas Retail Banking and Wholesale Banking, with further breakdown on operating segments, and for the operating segment Group Corporate Centre. Group functions and eliminations, as well as the result that is not fully allocated to any of the operating segments, are shown separately as reconciling items. There have not been any changes to the basis of segmentation compared with the Annual Report 2014. Reportable Operating segments Retail Banking conducts a full service banking operation and offers a wide range of products. It is Nordea's largest customer area and serves household customers and corporate customers in the Nordic markets (Retail Banking Nordic) as well as the Baltic countries (Retail Banking Baltic). Wholesale Banking provides banking and other financial solutions to large Nordic and international corporate, institutional and public companies. The division Corporate & Institutional Banking is a customer oriented organisation serving the largest globally operating corporates. This division is also responsible for Nordea's customers within the financial sector, and offers single products such as funds and equity products as well as consulting services, within asset allocation and fund sales. The division Shipping, Offshore & Oil Services is responsible for Nordea's customers within the shipping, offshore and oil services industries and provides tailor-made solutions and syndicated loan transactions. Capital Markets unallocated includes the result in Capital Markets which is not allocated to the main business areas (allocated on Nordea Group level). Group Corporate Centre's main objective is to manage the Group's funding and to support the management and control of the NBF Group. The main income in Group Corporate Centre originates from Group Treasury.
Retail Banking Wholesale Banking Group Corporate Centre
Income statement, EURm 2015 2014 2015 2014 2015 2014
Net interest income 812 851 218 287 32 47
Net fee and commission income 730 645 -276 -184 -8 -8
Net result from items at fair value 145 134 1 005 822 18 34
Profit from associated undertakings accounted for under the equity method 4 3 - - - -
Other income 12 15 0 2 12 13
Total operating income 1,703 1,648 947 927 54 86
Staff costs -332 -354 -116 -127 -60 -47
Other expenses -363 -385 -73 -66 -5 -3
Depreciation, amortisation and impairment charges of tangible and intangible assets -17 -23 -2 -4 -9 -6
Total operating expenses -712 -762 -191 -197 -74 -56
Profit before loan losses 991 886 756 730 -20 30
Net loan losses -103 -118 -11 -9 0 2
Operating profit 888 768 745 721 -20 32
Income tax expense - - - - - -
Net profit for the year 888 768 745 721 -20 32
Balance sheet, EURm
Loans to the public 54,906 53,895 46,465 59,579 20 0
Deposits and borrowings from the public 34,246 33,455 22,874 37,043 4,462 5,955

Nordea Bank Finland Plc . Annual Report 2015 59
Note 2 Segment reporting, cont.
Operating segments
Group Total operating
segments Reconciliation Total Group Income statement, EURm 2015 2014 2015 2014 2015 2014
Net interest income 1,062 1,185 -9 4 1,053 1,189
Net fee and commission income 446 453 -342 -378 104 75
Net result from items at fair value 1,168 990 89 -20 1,257 970 Profit from associated undertakings accounted for under the equity method 4 3 1 0 5 3
Other income 24 30 42 11 66 41
Total operating income 2,704 2,661 -219 -383 2,485 2,278
Staff costs -508 -528 -39 -31 -547 -559
Other expenses -441 -454 28 21 -413 -433 Depreciation, amortisation and impairment charges of tangible and intangible assets -28 -33 -3 -59 -31 -92
Total operating expenses -977 -1,015 -14 -69 -991 -1,084 Profit before loan losses 1,727 1,646 -233 -452 1,494 1,194
Net loan losses -114 -125 22 65 -92 -60
Operating profit 1,613 1,521 -211 -387 1,402 1,134
Income tax expense - - -347 -232 -347 -232
Net profit for the year 1,613 1,521 -558 -619 1,055 902
Balance sheet, EURm
Loans to the public 101,391 113,474 55 275 101,447 113,748 Deposits and borrowings from the public 61,582 76,453 571 427 62,153 76,879
Break-down of Retail Banking Retail Banking
Nordic1 Retail Banking Baltic2 Retail Banking
Other3 Total
Retail Banking Income statement, EURm 2015 2014 2015 2014 2015 2014 2015 2014
Net interest income 769 770 40 70 3 11 812 851
Net fee and commission income 709 657 5 -11 17 0 730 645
Net result from items at fair value 144 117 0 15 1 2 145 134 Profit from associated undertakings accounted for under the equity method - - - - 3 2 4 3
Other income 3 19 2 4 6 -8 12 15
Total operating income 1,625 1,563 47 78 30 7 1,703 1,648
Staff costs -246 -253 -6 -14 -80 -87 -332 -354
Other expenses -454 -469 -4 -4 95 88 -363 -385 Depreciation, amortisation and impairment charges of tangible and intangible assets -11 -10 0 -1 -5 -13 -17 -23
Total operating expenses -711 -732 -10 -19 10 -12 -712 -762 Profit before loan losses 914 831 37 59 40 -5 991 886
Net loan losses -88 -72 -9 -39 -6 -7 -103 -118
Operating profit 826 759 28 20 34 -12 888 768
Income tax expense - - - - - - - -
Net profit for the year 826 759 28 20 34 -12 888 768
Balance sheet, EURm
Loans to the public 47,352 46,693 1,588 1,403 5,966 5,799 54,906 53,895 Deposits and borrowings from the public 34,243 33,437 0 12 3 6 34,246 33,455 1 Retail Banking Nordic includes banking operations in Finland.
2 Retail Banking Baltic includes banking operations in Estonia, Latvia and Lithuania. 3 Retail Banking Other includes the support areas Development & Projects, Distribution, Segments, Products and IT.
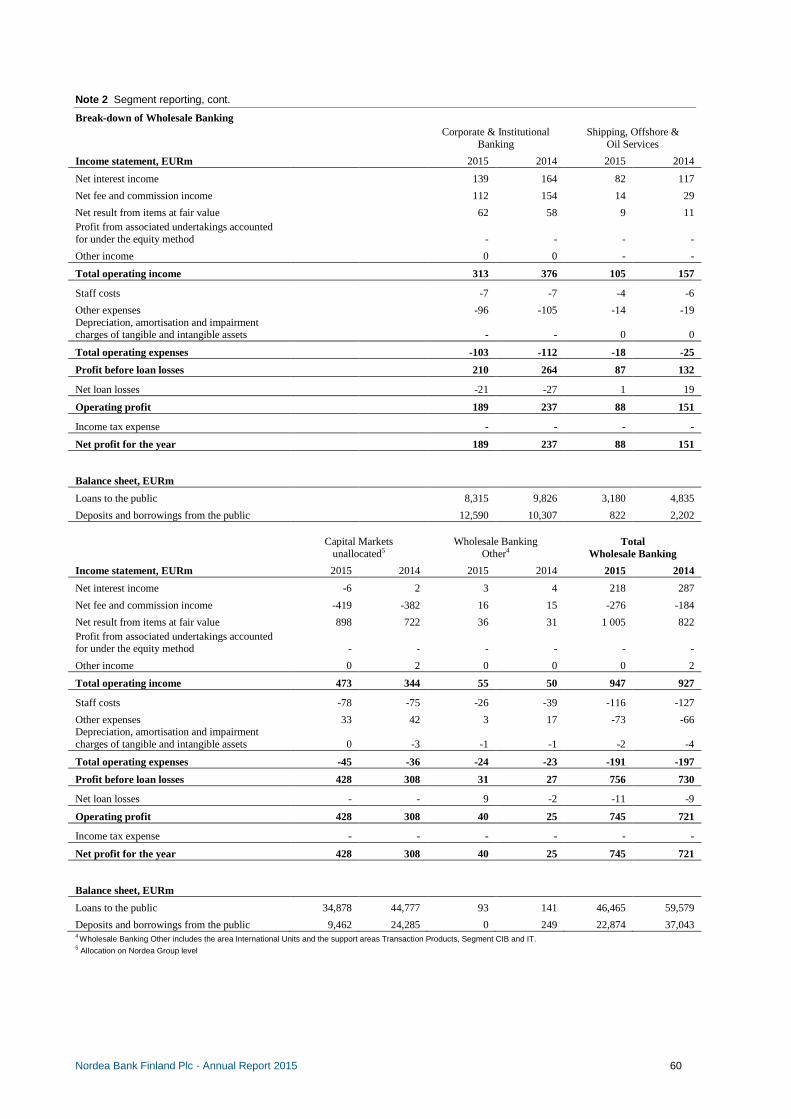
Nordea Bank Finland Plc . Annual Report 2015 60
Note 2 Segment reporting, cont.
Break-down of Wholesale Banking Corporate & Institutional
Banking Shipping, Offshore &
Oil Services
Income statement, EURm 2015 2014 2015 2014
Net interest income 139 164 82 117
Net fee and commission income 112 154 14 29
Net result from items at fair value 62 58 9 11 Profit from associated undertakings accounted for under the equity method - - - -
Other income 0 0 - -
Total operating income 313 376 105 157
Staff costs -7 -7 -4 -6
Other expenses -96 -105 -14 -19 Depreciation, amortisation and impairment charges of tangible and intangible assets - - 0 0
Total operating expenses -103 -112 -18 -25
Profit before loan losses 210 264 87 132
Net loan losses -21 -27 1 19
Operating profit 189 237 88 151
Income tax expense - - - -
Net profit for the year 189 237 88 151
Balance sheet, EURm
Loans to the public 8,315 9,826 3,180 4,835
Deposits and borrowings from the public 12,590 10,307 822 2,202
Capital Markets unallocated5
Wholesale Banking Other4
Total Wholesale Banking
Income statement, EURm 2015 2014 2015 2014 2015 2014
Net interest income -6 2 3 4 218 287
Net fee and commission income -419 -382 16 15 -276 -184
Net result from items at fair value 898 722 36 31 1 005 822 Profit from associated undertakings accounted for under the equity method - - - - - -
Other income 0 2 0 0 0 2
Total operating income 473 344 55 50 947 927
Staff costs -78 -75 -26 -39 -116 -127
Other expenses 33 42 3 17 -73 -66 Depreciation, amortisation and impairment charges of tangible and intangible assets 0 -3 -1 -1 -2 -4
Total operating expenses -45 -36 -24 -23 -191 -197
Profit before loan losses 428 308 31 27 756 730
Net loan losses - - 9 -2 -11 -9
Operating profit 428 308 40 25 745 721
Income tax expense - - - - - -
Net profit for the year 428 308 40 25 745 721
Balance sheet, EURm
Loans to the public 34,878 44,777 93 141 46,465 59,579
Deposits and borrowings from the public 9,462 24,285 0 249 22,874 37,043 4 Wholesale Banking Other includes the area International Units and the support areas Transaction Products, Segment CIB and IT. 5 Allocation on Nordea Group level

Nordea Bank Finland Plc . Annual Report 2015 61
Note 2 Segment reporting, cont.
Reconciliation between total operating segments and financial statements
Total operating income Operating profit Loans to the public
Deposits and borrowings from
the public
EURm 2015 2014 2015 2014 2015 2014 2015 2014
Total Operating segments 2,704 2,661 1,613 1,521 101,391 113,474 61,582 76,453
Group functions1 -219 -383 -211 -387 63 282 573 429
Eliminations 0 0 - - -7 -8 -2 -3
Total 2,485 2,278 1,402 1,134 101,447 113,748 62,153 76,879 1 Consists of Group Risk Management, Group Internal Audit, Group Identity & Communications, Group Human Resources, Board of Directors and Group Executive Management. Group Total operating income split on product groups
EURm 2015 2014
Banking products 1,605 1,725
Capital Markets products 829 542
Savings Products & Asset Management 1 -
Life & Pensions 50 11
Other 0 -
Total 2,485 2,278 Banking products consists of three different product types. Account products include account-based products, such as lending, deposits, cards and Netbank services. Transaction products consists of cash management as well as trade and project finance services. Financing products include asset-based financing through leasing, hire purchase and factoring as well as sales to finance partners such as dealers, vendors and retailers. Capital Markets products contains financial instruments, or arrangements for financial instruments, that are available in the financial market place, including currencies, commodities, stocks and bonds. Savings products & Asset Management includes Investment funds, Discretionary Management, Portfolio Advice, Equity Trading and Pension Accounts. Investment Funds is a bundled product where the fund company invests in stocks, bonds, derivatives or other standardised products on behalf of the fund's shareholders. Discretionary Management is a service providing the management of an investment portfolio on behalf of the customer and Portfolio Advice is a service provided to support the customers' investment decisions. Life & Pensions includes life insurance and pension products and services. Group Geographical information
Total operating income Assets
EURm 2015 2014 2015 2014
Sweden 152 69 21,139 21,087
Finland 1,700 1,484 100,414 115,625
Norway 108 44 7,322 9,427
Denmark 281 278 118,254 145,439
Baltic countries 54 82 1,608 1,415
Singapore 50 53 2,649 2,672
United States 140 130 50,204 41,668
Other - 138 - 8,865
Total 2,485 2,278 301,590 346,198 NBF's main geographical market comprises the Nordic countries. Revenues and assets are distributed to geographical areas based on the location of customer operations.

Nordea Bank Finland Plc . Annual Report 2015 62
Note 3 Net interest income
Group Parent company
EURm 2015 2014 2015 2014
Interest income
Loans to credit institutions 81 128 96 156
Loans to the public 1,268 1,460 984 1,171
Interest-bearing securities 125 146 125 146
Other interest income 58 72 63 78
Interest income1 1,532 1,806 1,268 1,551 1 Of which contingent leasing income amounts to EUR 26m (32). Contingent leasing income in Nordea consists of variable interest rates, excluding the fixed margin. If the contingent leasing income decreases, there will be an offsetting impact from lower funding expenses.
Interest expense
Deposits by credit institutions -233 -250 -232 -248
Deposits and borrowings from the public -82 -151 -82 -151
Debt securities in issue -381 -408 -381 -408
Subordinated liabilities -28 -23 -28 -23
Other interest expenseP
2 245 215 245 215
Interest expense -479 -617 -478 -615
Net interest income 1,053 1,189 790 936 2The net interest income from derivatives, measured at fair value, related to Nordea's funding. This can have both a positive and negative impact on other interest expense, for further information see Note 1. Interest income from financial instruments not measured at fair value through profit and loss amounts to EUR 1,407m (1,664) for the Group and EUR 1,142m (1,409) for the parent company. Interest expenses from financial instruments not measured at fair value through profit and loss amounts to EUR -725m (-834) for the Group and EUR -724m (-833) for the parent company. Interest on impaired loans amounted to an insignificant portion of interest income. Note 4 Net fee and commission income
Group Parent company
EURm 2015 2014 2015 2014
Asset Management commissions 86 69 86 69
Life insurance 10 9 10 10
Brokerage, securities issues and corporate finance 77 75 77 75
Custody and issuer services 24 28 24 28
Deposits 1 5 1 5
Total savings and investments 198 186 198 187
Payments 198 198 200 200
Cards 128 128 94 92
Total payments and cards 326 326 294 292
Lending 96 129 95 126
Guarantees and documentary payments 106 120 106 120
Total lending related to commissions 202 249 201 246
Other commission income 33 33 33 32
Fee and commission income 759 794 726 757
Savings and investments -382 -360 -382 -360
Payments -13 -11 -10 -9
Cards -59 -58 -58 -56
Other commission expenses1 -201 -290 -198 -287
Fee and commission expenses -655 -719 -648 -712
Net fee and commission income 104 75 78 45 1 Mainly consists of guarantee commission fee paid to Nordea Bank AB (publ) and in 2014 also Finnish bank tax Fee income, not included in determining the effective interest rate, from financial assets and liabilities not measured at fair value through profit or loss amounts to EUR 97m (134) for the Group and EUR 97m (131) for the parent company. Fee income, not included in determining the effective interest rate, from fiduciary activities that result in the holding or investing of assets on behalf of customers amounted to EUR 172m (153) for the Group and EUR 172m (153) for the parent company.

Nordea Bank Finland Plc . Annual Report 2015 63
Note 5 Net result from items at fair value
Group Parent company
EURm 2015 2014 2015 2014
Equity-related instruments 163 342 163 342
Interest-related instruments and foreign exchange gains/losses 1,039 235 1,036 231
Other financial instruments (including credit and commodities) 57 406 57 406
Investment properties -2 -13 -2 -4
Total 1,257 970 1,254 975
Net result from categories of financial instruments
Group Parent company
EURm 2015 2014 2015 2014
Available for sale assets, realised 29 21 29 21
Financial instruments designated at fair value through profit or loss 85 159 85 158
Financial instruments held for tradingP
1 336 1,313 336 1,313
Financial instruments under fair value hedge accounting -6 4 -6 4
- of which net result on hedging instruments -142 179 -142 179
- of which net result on hedged items 136 -174 136 -174
Financial assets measured at amortised cost2 2 6 2 6
Foreign exchange gains/losses excl. currency hedges 815 -518 812 -521
Other -4 -15 -4 -6
Total 1,257 970 1,254 975 1
POf which amortised deferred day one profits amounted to EUR 0m for 2015 (-3) both for the Group and the parent company. 2 Of which EUR 2m (6) related to instruments classified into the category "Loans and receivables" and EUR 0m (-) related to instruments classified into the category "Held to maturity".
Note 6 Dividends
Group Parent company
EURm 2015 2014 2015 2014
Investments in group undertakings - - 100 100
Investments in associated undertakings - - 1 17
Total - - 101 117
Note 7 Other operating income
Group Parent company
EURm 2015 2014 2015 2014
Divestment of shares - 9 - 9
Income from real estate 1 6 1 1
Sale of tangible and intangible assets 4 2 3 0
Other 61 24 61 19
Total 66 41 65 29

Nordea Bank Finland Plc . Annual Report 2015 64
Note 8 Staff costs
Group Parent company
EURm 2015 2014 2015 2014
Salaries and remuneration -413 -420 -391 -394
Pension costs (specification below) -67 -62 -64 -58
Social security contributions -25 -35 -23 -33
Allocation to profit-sharing foundation1 -20 -19 -18 -18
Other staff costs -22 -23 -20 -22
Total -547 -559 -516 -525 1 Allocation to profit-sharing 2015 EUR 20m (19) in the Group and EUR 18m (18) in the parent company consisting of a new allocation of EUR 19m (18) in the Group and EUR 18m (17) in the parent company and an adjustment related to prior years of EUR 1m (1) in the Group and EUR 0m (1) in the parent company. Group Parent company
2015 2014 2015 2014
Pension costs:
Defined benefit plans (Note 31) -2 1 -1 1
Defined contribution plans -65 -63 -63 -59
Total -67 -62 -64 -58 Additional disclosures on remuneration under Nordic FSAs' regulation and general guidelines (including EU Commission Regulation 604/2014) The qualitative disclosures under these regulations can be found in the separate section on remuneration in the Board of Director's Report, while the quantitative disclosures will be published in a separate report on Nordea's homepage (www.nordea.com) no later than one week before the Annual General Meeting on 9 March 2016. Compensation etc. to the Board of Directors, President and his deputy As at 31 December 2015, the members of the Board of Directors of Nordea Bank Finland Plc, were members of the Nordea Bank AB (publ) Group Executive Management except for the external member Carl-Johan Granvik. The monthly fee for the external Board member was 1,250 euros, totalling 15,000 euros in 2015 (15,000). The monthly fee for committee work for Carl-Johan Granvik was 1,000 euros, totalling 12,000 euros in 2015 (6,000). In 2015, Nordea Bank AB (publ) has paid all salaries, fees, pension- and other staff-related expenses to the other members of the Board. Nordea Bank AB (publ) has allocated these salary expenses to Nordea Bank Finland Plc as part of the Head Office Allocation expenses. Salaries, fees, pensions and other staff-related expenses paid to the President, his deputy and former President in 2015 are presented below. Information on salaries, loans and pension liabilities of the other members of the Board is presented in the Annual Report of Nordea Bank AB (publ). Remuneration to the President of Nordea Bank Finland Plc and Deputy to the President of Nordea Bank Finland Plc
Fixed salary
GEM Executive Incentive
Programme
Long Term Incentive
Programme Benefits Total EUR 2015 2015 2015 2015 2015 President of NBF: Ari Kaperi 1 Jan - 31 Aug (employed by Nordea Bank AB (publ)) 447,741 320,551 119,160 11,132 898,583
Topi Manner 1 Sep - 31 Dec 128,353 10,107 120,825 5,390 264,675
Deputy to the President of NBF:
Topi Manner 1 Jan - 31 Aug 260,990 120,907 90,619 10,330 482,846
Jukka Perttula 1 Sep - 31 Dec 86,717 92,841 57,173 3,980 240,712 There was no pension obligation for the President of Nordea Bank Finland Plc at the yearend. The pension obligation for Carl-Johan Granvik amounted to EUR 3,876,791 and for Jukka Perttula to EUR 2,473,674. The pension obligation for Carl-Johan Granvik is included in the pension obligations of Nordea Bank AB (publ) and for Jukka Perttula in the pension obligations of Nordea Bank Finland Plc. Pension obligation for the former Presidents and Deputies of the President of Nordea Bank Finland Plc amounted to EUR 7,466,539 of which EUR 4,110,340 is included in the pension obligations of Nordea Bank AB (publ).
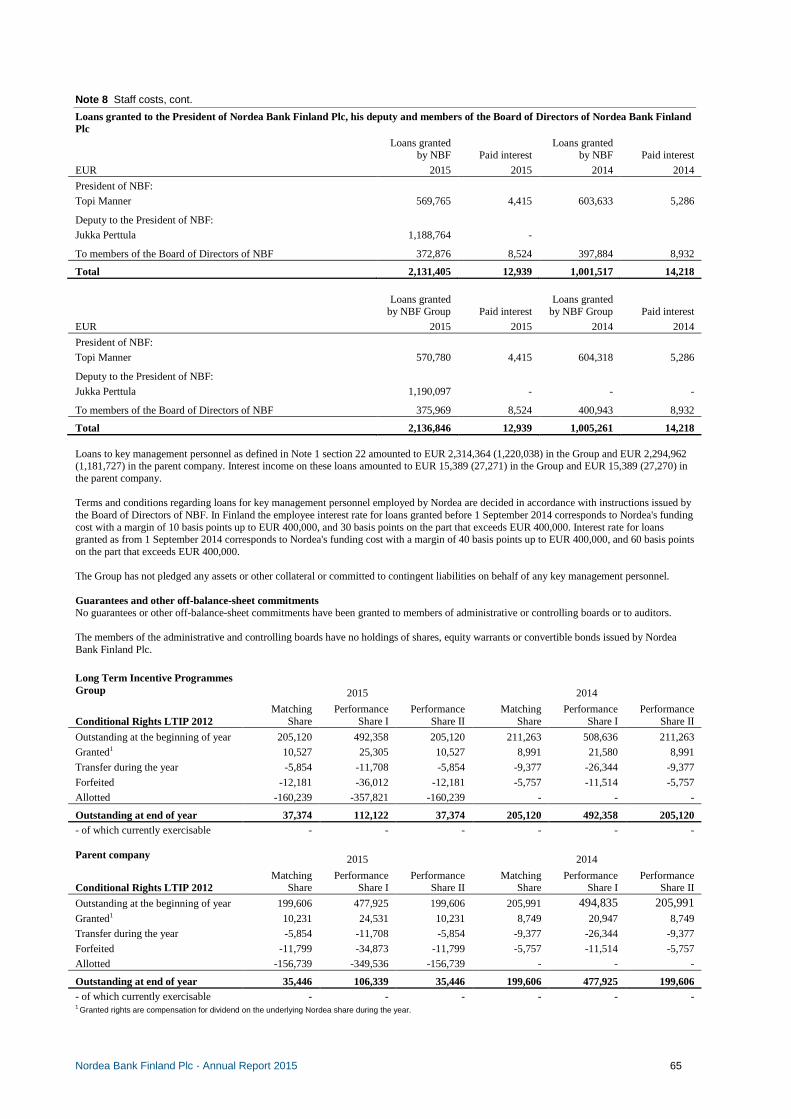
Nordea Bank Finland Plc . Annual Report 2015 65
Note 8 Staff costs, cont.
Loans granted to the President of Nordea Bank Finland Plc, his deputy and members of the Board of Directors of Nordea Bank Finland Plc
Loans granted by NBF Paid interest
Loans granted by NBF Paid interest
EUR 2015 2015 2014 2014
President of NBF:
Topi Manner 569,765 4,415 603,633 5,286
Deputy to the President of NBF:
Jukka Perttula 1,188,764 -
To members of the Board of Directors of NBF 372,876 8,524 397,884 8,932
Total 2,131,405 12,939 1,001,517 14,218
Loans granted by NBF Group Paid interest
Loans granted by NBF Group Paid interest
EUR 2015 2015 2014 2014
President of NBF:
Topi Manner 570,780 4,415 604,318 5,286
Deputy to the President of NBF:
Jukka Perttula 1,190,097 - - -
To members of the Board of Directors of NBF 375,969 8,524 400,943 8,932
Total 2,136,846 12,939 1,005,261 14,218 Loans to key management personnel as defined in Note 1 section 22 amounted to EUR 2,314,364 (1,220,038) in the Group and EUR 2,294,962 (1,181,727) in the parent company. Interest income on these loans amounted to EUR 15,389 (27,271) in the Group and EUR 15,389 (27,270) in the parent company. Terms and conditions regarding loans for key management personnel employed by Nordea are decided in accordance with instructions issued by the Board of Directors of NBF. In Finland the employee interest rate for loans granted before 1 September 2014 corresponds to Nordea's funding cost with a margin of 10 basis points up to EUR 400,000, and 30 basis points on the part that exceeds EUR 400,000. Interest rate for loans granted as from 1 September 2014 corresponds to Nordea's funding cost with a margin of 40 basis points up to EUR 400,000, and 60 basis points on the part that exceeds EUR 400,000. The Group has not pledged any assets or other collateral or committed to contingent liabilities on behalf of any key management personnel. Guarantees and other off-balance-sheet commitments No guarantees or other off-balance-sheet commitments have been granted to members of administrative or controlling boards or to auditors. The members of the administrative and controlling boards have no holdings of shares, equity warrants or convertible bonds issued by Nordea Bank Finland Plc.
Long Term Incentive Programmes Group 2015 2014
Conditional Rights LTIP 2012 Matching
Share Performance
Share I Performance
Share II Matching
Share Performance
Share I Performance
Share II
Outstanding at the beginning of year 205,120 492,358 205,120 211,263 508,636 211,263
Granted1 10,527 25,305 10,527 8,991 21,580 8,991
Transfer during the year -5,854 -11,708 -5,854 -9,377 -26,344 -9,377
Forfeited -12,181 -36,012 -12,181 -5,757 -11,514 -5,757
Allotted -160,239 -357,821 -160,239 - - -
Outstanding at end of year 37,374 112,122 37,374 205,120 492,358 205,120 - of which currently exercisable - - - - - - Parent company 2015 2014
Conditional Rights LTIP 2012 Matching
Share Performance
Share I Performance
Share II Matching
Share Performance
Share I Performance
Share II
Outstanding at the beginning of year 199,606 477,925 199,606 205,991 494,835 205,991 Granted1 10,231 24,531 10,231 8,749 20,947 8,749
Transfer during the year -5,854 -11,708 -5,854 -9,377 -26,344 -9,377
Forfeited -11,799 -34,873 -11,799 -5,757 -11,514 -5,757
Allotted -156,739 -349,536 -156,739 - - -
Outstanding at end of year 35,446 106,339 35,446 199,606 477,925 199,606 - of which currently exercisable - - - - - - 1 Granted rights are compensation for dividend on the underlying Nordea share during the year.

Nordea Bank Finland Plc . Annual Report 2015 66
Note 8 Staff costs, cont.
Long Term Incentive Programmes Group 2015 2014
Rights LTIP 2011 Matching
Share Performance
Share I Performance
Share II Matching
Share Performance
Share I Performance
Share II
Outstanding at the beginning of year 26,823 44,818 12,070 147,709 295,418 147,709
Granted1 1,443 2,412 649 6,161 12,323 6,161
Transfer during the year - - - -6,121 -12,242 -6,121
Forfeited - - - -2,251 -52,398 -82,275
Allotted -7,637 -12,760 -3,437 -118,675 -198,282 -53,404
Outstanding at end of year 20,629 34,470 9,282 26,823 44,818 12,070 - of which currently exercisable - - - - - - Parent company 2015 2014
Rights LTIP 2011 Matching
Share Performance
Share I Performance
Share II Matching
Share Performance
Share I Performance
Share II
Outstanding at the beginning of year 25,370 42,388 11,416 144,054 288,107 144,054
Granted1 1,365 2,281 614 6,000 12,000 6,000
Transfer during the year - - - -6,121 -12,242 -6,121
Forfeited - - - -2,246 -51,134 -80,174
Allotted -7,331 -12,248 -3,299 -116,317 -194,343 -52,343
Outstanding at end of year 19,404 32,421 8,731 25,370 42,388 11,416 - of which currently exercisable - - - - - - 1 Granted rights are compensation for dividend on the underlying Nordea share during the year.
Group 2015 2014
Rights LTIP 2010 Matching
Share Performance
Share I Performance
Share II Matching
Share Performance
Share I Performance
Share II
Outstanding at the beginning of year 15,345 16,213 6,905 23,955 25,310 10,780
Transfer during the year - - - -2,959 -3,126 -1,332
Forfeited - - - - - -2,543
Allotted -5,480 -5,789 -2,465 -5,651 -5,971 -
Outstanding at end of year 9,865 10,424 4,440 15,345 16,213 6,905 - of which currently exercisable - - - - - - Parent company 2015 2014
Rights LTIP 2010 Matching
Share Performance
Share I Performance
Share II Matching
Share Performance
Share I Performance
Share II
Outstanding at the beginning of year 15,345 16,213 6,905 23,955 25,310 10,780
Transfer during the year - - - -2,959 -3,126 -1,332
Allotted -5,480 -5,789 -2,465 -5,651 -5,971 -2,543
Outstanding at end of year 9,865 10,424 4,440 15,345 16,213 6,905 - of which currently exercisable - - - - - - Participation in the Long-Term Incentive Programmes (LTIPs) requires that the participants take direct ownership by investing in Nordea shares.
LTIP 2012 LTIP 2011
Matching
Share Performance
Share I Performance
Share II Matching
Share Performance
Share I Performance
Share II
Ordinary share per right 1.00 1.00 1.00 1.00 1.00 1.00
Exercise price, EUR - - - - - -
Grant date 13 May 2012 13 May 2012 13 May 2012 13 May 2011 13 May 2011 13 May 2011
Vesting period, months 36 36 36 36 36 36
Contractual life, months 36 36 36 36 36 36
Allotment April/May
2015 April/May
2015 April/'May
2015 April/May
2014 April/May
2014 April/May
2014 Fair value at grant date, EUR1 5.78 5.78 2.09 7.23 7.25 2.63 1 The fair value has been recalculated due to dividend during the vesting period which the participants are compensated for through additional Matching and Performance Shares.

Nordea Bank Finland Plc . Annual Report 2015 67
Note 8 Staff costs, cont.
Conditions and requirements For each ordinary share the participants lock in to the LTIPs, they are granted a conditional Matching Share to receive ordinary shares based on continued employment, with certain exemptions, and the conditional Performance Share I and II to receive additional ordinary shares also based on fulfilment of certain performance conditions. The performance conditions for Performance Share I comprise a target growth in risk adjusted profit per share (RAPPS) or a target in risk-adjusted return on capital at risk (RAROCAR). Should the reported earnings per share (EPS) be lower than a predetermined level, the participants are not entitled to exercise any Performance Share I. The performance conditions for Performance Share II are market related and comprise growth in total shareholder return (TSR) in comparison with a peer group's TSR or a target in RAROCAR and in P/B-ranking compared to a peer group. Furthermore the profit for each right is capped. When the performance conditions are not fulfilled in full, the rights that are no longer exercisable are shown as forfeited in the previous tables, together with shares forfeited due to participants leaving the Nordea Group. LTIP 2012/2011/2010 are not allotted in full due to deferral and retention requirements by the Nordic FSAs.
LTIP 2012 LTIP 2011 Service condition, Matching Share / Performance Share I and II
Employed, with certain exemptions, within the Nordea Group during the three year vesting
period.
Employed, with certain exemptions, within the Nordea Group during the three year vesting
period.
Performance condition, Performance Share I
Average RAROCAR during the period 2012 up to and including 2014. Full allotment will be obtained if the RAROCAR amounts to 17%.
Compound Annual Growth Rate in RAPPS from year 2010 (base year) to and including
year 2013. Full allotment will be obtained if the Compound Annual Growth Rate amounts to or
exceeds 10%.
EPS knock out, Performance Share I - Average reported EPS for 2011-2013 lower than EUR 0.26.
Performance condition, Performance Share II
RAROCAR during the period 2012 up to and including 2014 and P/B-ranking year-end 2014 compared to a peer group. Full allotment will
be obtained if the RAROCAR amounts to 14% and if Nordea's P/B-ranking is 1-5.
TSR during 2011-2013 in comparison with a peer group. Full allotment will be obtained if
Nordea is ranked number 1-5.
Cap The market value of the allotted shares is capped to the participants' annual salary for
year-end 2011.
The market value of the allotted shares is capped to the participants' annual salary for
year-end 2010.
Dividend compensation The number of Matching Shares and Performance Shares will be adjusted for
dividends on the underlying Nordea share during the vesting period, as if assuming that each dividend was used to immediately invest
in additional Nordea shares.
The number of Matching Shares and Performance Shares will be adjusted for
dividends on the underlying Nordea share during the vesting period, as if assuming that each dividend was used to immediately invest
in additional Nordea shares.
Fair value calculations The fair value is measured through the use of generally accepted valuation models with the following input factors: LTIP 2012 LTIP 2011
Weighted average share price, EUR 6.70 8.39
Right life, years 3.0 3.0
Deduction of expected dividends No No
Risk free rate, % Not applicable Not applicable
Expected volatility, % Not applicable Not applicable As the exercise price (zero for LTIP 2012 and LTIP 2011) is significantly below the share price at grant date, the value has a limited sensitivity to expected volatility and risk-free interest.

Nordea Bank Finland Plc . Annual Report 2015 68
Note 8 Staff costs, cont. The value of the Performance Share II is based on market related conditions and fulfilment of the TSR, RAROCAR and P/B targets have been taken into consideration when calculating the right's fair value at grant. When calculating the impact from the market conditions it has been assumed that all possible outcomes have equal possibilities. Also the caps in each programme have been taken into consideration when calculating the rights’ fair value at grant. The adjustment to fair value is approximately 2-3% of the weighted average share price. Expenses for equity-settled share-based payment programmes1
Group
EURm LTIP 2012 LTIP 2011
Total expense during 2015 -0,5 0,0
Total expense during 2014 -2,2 -0,3 Parent company
EURm LTIP 2012 LTIP 2011
Total expense during 2015 -0,4 0,0
Total expense during 2014 -2,1 -0,3 1 All amounts excluding social security contribution. Cash-settled share-based payment transactions Nordea operates share-linked deferrals on parts of variable compensation for certain employee categories, indexed with Nordea Total Shareholder Returns (TSR) and either transferred after three years or transferred in equal instalments over a three to five year period. Since 2011 Nordea also operates TSR-linked retention on part of variable compensation for certain employee categories. Due to that the allocation of variable compensation is not finally decided during the current year, the deferred amount during the year in the table below relates to variable compensation earned the previous year. In addition Nordea introduced in 2013 the Executive Incentive Programme (“EIP”) which aims to strengthen Nordea’s capability to retain and recruit the best talents. The aim is further to stimulate the managers and key employees whose efforts have a direct impact on Nordea’s result, profitability and long term value growth. EIP rewards performance meeting agreed predetermined targets on Group, business unit and individual level. The effect on the long term result is to be considered when determining the targets. The EIP shall not exceed the fixed salary. EIP shall be paid in the form of cash and be subject to TSR-indexation, deferral, forfeiture clauses and retention as per relevant remuneration regulations. The main part of EIP 2015 is paid no earlier than autumn 2018. Participation in the programme is offered to up to 400 managers and key employees, except GEM who are instead offered a GEM EIP (further information about the GEM EIP can be found in the Annual Report of Nordea Bank AB (publ)), within the Nordea Group. EIP is offered instead of Nordea’s LTIP and VSP for the invited employees. The allocation of the EIP 2015 was decided during spring 2016, and a reservation of EUR 7m excl. social costs was made in 2015 both in the Group and parent company. 80% of the allocated amount will be subject to TSR-indexation. The table below only includes deferred amounts indexed with Nordea TSR. EIP has been included as from 2015, when deferred. Further information regarding all deferred amounts can be found in the separate report on remuneration published on Nordea’s homepage (www.nordea.com). Share linked deferrals Group Parent company
EURm 2015 2014 2015 2014
Opening balance 4 4 4 4
Reclassifications1 3 0 3 -
Deferred/earned during the year 9 2 8 2
TSR indexation during the year 0 1 0 1
Payments during the year2 -4 -3 -4 -3
Translation differences 0 0 0 0
Closing balance 11 4 11 4 1 Relates to a reclassification from deferred amounts that are indexed with a fixed rate. 2 There have been no adjustments due to forfeitures.

Nordea Bank Finland Plc . Annual Report 2015 69
Note 8 Staff costs, cont.
Average number of employees Group Parent company
2015 2014 2015 2014
Full-time employees 6,760 7,258 6,227 6,712
Part-time employees 525 544 487 505
Total 7,285 7 802 6,714 7 217
Total number of employees (FTEs), end of period 6,595 6,653 6,088 6,130 Note 9 Other expenses
Group Parent company
EURm 2015 2014 2015 2014
Information technology -183 -196 -179 -190
Marketing and representation -17 -22 -15 -20
Postage, transportation, telephone and office expenses -33 -38 -27 -33
Rents, premises and real estate -74 -89 -74 -82
Other -106 -88 -94 -85
Total -413 -433 -389 -410 Auditors' fees
Group Parent company
EURm 2015 2015
PricewaterhouseCoopers
Auditing assignments -1 0
Audit-related services 0 0
Tax advisory services 0 0
Other assignments 0 0
Total -1 -1
Group Parent company
EURm 2015 2014 2015 2014
KPMG
Auditing assignments 0 -1 0 -1
Audit-related services 0 0 0 0
Tax advisory services 0 0 0 0
Other assignments 0 0 0 0
Total 0 -1 0 -1
Total of auditors’ fees -1 -1 -1 -1
Note 10 Depreciation, amortisation and impairment charges of tangible and intangible assets
Group Parent company
EURm 2015 2014 2015 2014
Depreciation/amortisation
Properties and equipment -22 -21 -21 -19
Intangible assets (Note 20) -6 -15 -4 -13
Total -28 -36 -25 -32
Impairment charges
Intangible assets (Note 20) -3 -56 -3 -56
Total -3 -56 -3 -56
Total -31 -92 -28 -88

Nordea Bank Finland Plc . Annual Report 2015 70
Note 11 Net loan losses
Group Parent company
EURm 2015 2014 2015 2014
Loan losses divided by class
Realised loan losses - -2 - -2
Allowances to cover realised loan losses - 2 - 2
Recoveries on previous realised loan losses 0 0 0 0
Provisions - 0 - 0
Reversals of previous provisions 0 22 0 22
Loans to credit institutions1 0 22 0 22
Realised loan losses -129 -114 -96 -77
Allowances to cover realised loan losses 96 127 90 120
Recoveries on previous realised loan losses 14 28 4 9
Provisions -184 -223 -141 -213
Reversals of previous provisions 95 101 85 86
Loans to the public1 -108 -81 -58 -75
Realised loan losses - - - - Allowances to cover realised loan losses - - - - Recoveries on previous realised loan losses - - - - Provisions 3 -14 3 -14
Reversals of previous provisions 13 13 13 13
Off-balance sheet items2 16 -1 16 -1
Net loan losses -92 -60 -42 -54 1 See Note 13 Loans and impairment 2 Included in Note 30 Provisions as "Transfer risk, off-balance" and "Individually assessed guarantees and other commitments". Key ratios
Group Parent company
2015 2014 2015 2014
Loan loss ratio, basis points3 9 5 4 5
- of which individual 9 4 7 3
- of which collective 0 2 -3 2 3 Net loan losses (annualised) divided by the closing balance of loans to the public (lending).
Nordea Bank AB (publ) has guaranteed part of NBF’s corporate exposures and based on the agreement NBF’s loan losses decreased EUR 22m in 2015 and EUR 66m in 2014. Note 12 Taxes
Income tax expense
Group Parent company
EURm 2015 2014 2015 2014
Current tax -339 -253 -300 -214
Deferred tax -8 21 -11 26
Bank tax in Finland1
Total -347 -232 -311 -188 1 The Finnish bank tax was introduced in 2013 and was based on risk weighted assets rather than income. This tax is not included in the current- and deferred tax disclosures in this Note.
For current and deferred tax recognised in Other comprehensive income, see Statement of comprehensive income.
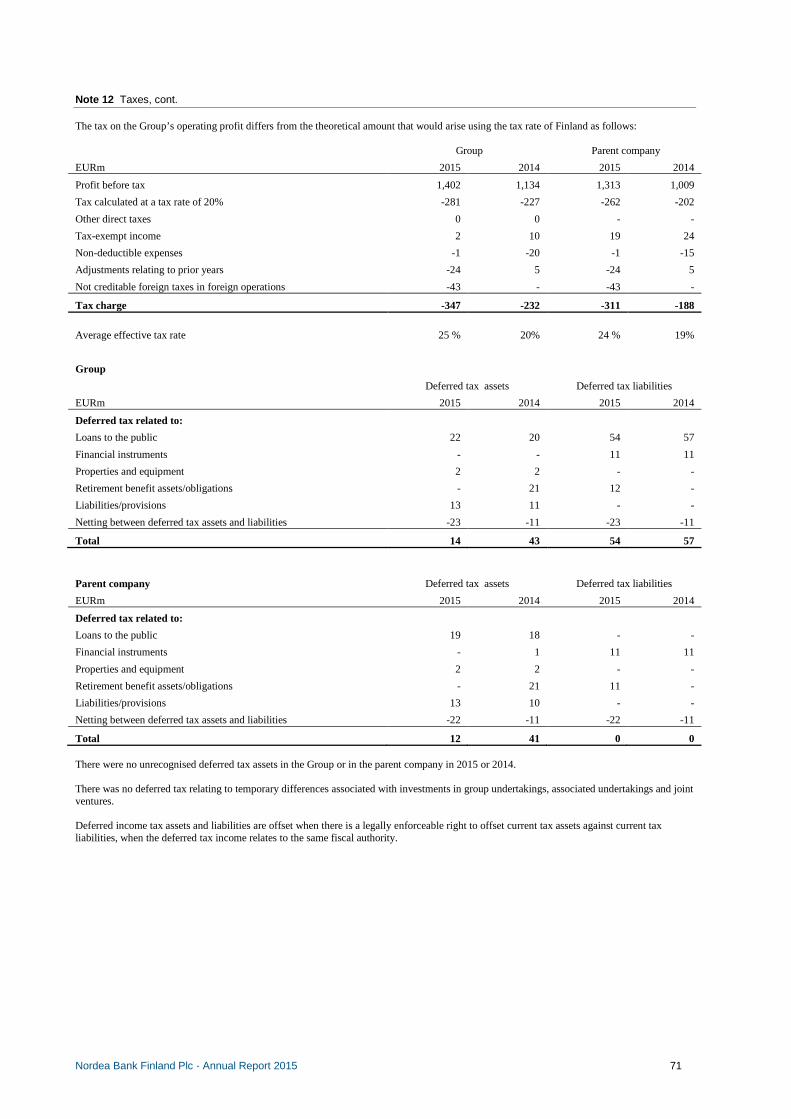
Nordea Bank Finland Plc . Annual Report 2015 71
Note 12 Taxes, cont. The tax on the Group’s operating profit differs from the theoretical amount that would arise using the tax rate of Finland as follows: Group Parent company
EURm 2015 2014 2015 2014
Profit before tax 1,402 1,134 1,313 1,009
Tax calculated at a tax rate of 20% -281 -227 -262 -202
Other direct taxes 0 0 - -
Tax-exempt income 2 10 19 24
Non-deductible expenses -1 -20 -1 -15
Adjustments relating to prior years -24 5 -24 5
Not creditable foreign taxes in foreign operations -43 - -43 -
Tax charge -347 -232 -311 -188
Average effective tax rate 25 % 20% 24 % 19%
Group
Deferred tax assets Deferred tax liabilities
EURm 2015 2014 2015 2014
Deferred tax related to:
Loans to the public 22 20 54 57
Financial instruments - - 11 11
Properties and equipment 2 2 - -
Retirement benefit assets/obligations - 21 12 -
Liabilities/provisions 13 11 - -
Netting between deferred tax assets and liabilities -23 -11 -23 -11
Total 14 43 54 57
Parent company Deferred tax assets Deferred tax liabilities
EURm 2015 2014 2015 2014
Deferred tax related to:
Loans to the public 19 18 - -
Financial instruments - 1 11 11
Properties and equipment 2 2 - -
Retirement benefit assets/obligations - 21 11 -
Liabilities/provisions 13 10 - -
Netting between deferred tax assets and liabilities -22 -11 -22 -11
Total 12 41 0 0 There were no unrecognised deferred tax assets in the Group or in the parent company in 2015 or 2014. There was no deferred tax relating to temporary differences associated with investments in group undertakings, associated undertakings and joint ventures. Deferred income tax assets and liabilities are offset when there is a legally enforceable right to offset current tax assets against current tax liabilities, when the deferred tax income relates to the same fiscal authority.

Nordea Bank Finland Plc . Annual Report 2015 72
Note 13 Loans and impairment
Total
Group Parent company
31 Dec 31 Dec 31 Dec 31 Dec
EURm 2015 2014 2015 2014
Loans, not impaired 132,990 148,254 131,902 147,107
Impaired loans 1,501 1,480 1,330 1,188
- performing 646 823 619 653
- non-performing 855 657 711 535
Loans before allowances 134,491 149,734 133,232 148,295
Allowances for individually assessed impaired loans -523 -516 -471 -464
- performing -277 -323 -275 -274
- non-performing -246 -193 -196 -190
Allowances for collectively assessed impaired loans -104 -119 -62 -101
Allowances -627 -635 -533 -565
Loans, carrying amount 133,864 149,099 132,699 147,730
Central banks and credit institutions
Group Parent company
31 Dec 31 Dec 31 Dec 31 Dec
EURm 2015 2014 2015 2014
Loans, not impaired 32,417 35,351 38,636 41,091
Impaired loans - 0 - 0
- performing - - - -
- non-performing - 0 - 0
Loans before allowances 32,417 35,351 38,636 41,091
Allowances for individually assessed impaired loans - - - -
- performing - - - -
- non-performing - - - -
Allowances for collectively assessed impaired loans - 0 - 0
Allowances - 0 - 0
Loans, carrying amount 32,417 35,351 38,636 41,091
The public1
Group Parent company
31 Dec 31 Dec 31 Dec 31 Dec
EURm 2015 2014 2015 2014
Loans, not impaired 100,573 112,903 93,266 106,016
Impaired loans 1,501 1,480 1,330 1,188
- Performing 646 823 619 653
- Non-performing 855 657 711 535
Loans before allowances 102,074 114,383 94,596 107,204
Allowances for individually assessed impaired loans -523 -516 -471 -464
- Performing -277 -323 -275 -274
- Non-performing -246 -193 -196 -190
Allowances for collectively assessed impaired loans -104 -119 -62 -101
Allowances -627 -635 -533 -565
Loans, carrying amount 101,447 113,748 94,063 106,639 1 Finance leases, where the Nordea Group is a lessor, are included in Loans to the public, see Note 21 Leasing.
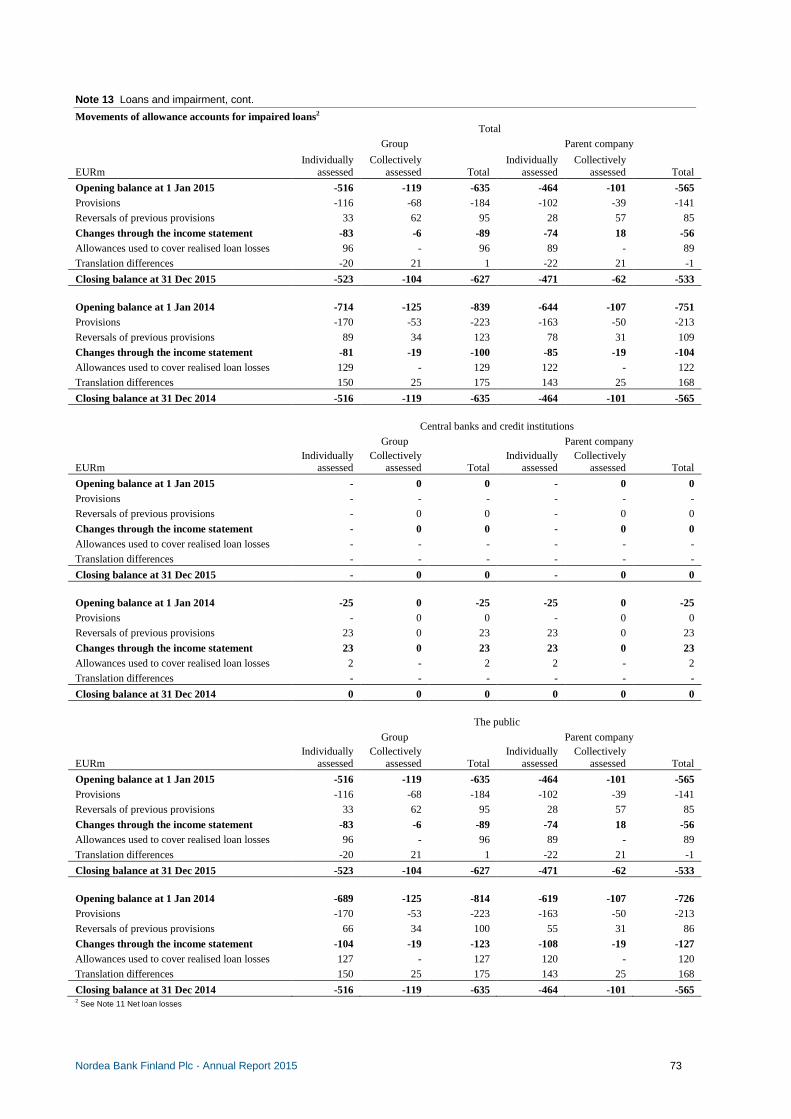
Nordea Bank Finland Plc . Annual Report 2015 73
Note 13 Loans and impairment, cont.
Movements of allowance accounts for impaired loans2 Total
Group Parent company
EURm Individually
assessed Collectively
assessed Total Individually
assessed Collectively
assessed Total
Opening balance at 1 Jan 2015 -516 -119 -635 -464 -101 -565 Provisions -116 -68 -184 -102 -39 -141
Reversals of previous provisions 33 62 95 28 57 85
Changes through the income statement -83 -6 -89 -74 18 -56 Allowances used to cover realised loan losses 96 - 96 89 - 89
Translation differences -20 21 1 -22 21 -1
Closing balance at 31 Dec 2015 -523 -104 -627 -471 -62 -533
Opening balance at 1 Jan 2014 -714 -125 -839 -644 -107 -751 Provisions -170 -53 -223 -163 -50 -213
Reversals of previous provisions 89 34 123 78 31 109
Changes through the income statement -81 -19 -100 -85 -19 -104 Allowances used to cover realised loan losses 129 - 129 122 - 122
Translation differences 150 25 175 143 25 168
Closing balance at 31 Dec 2014 -516 -119 -635 -464 -101 -565
Central banks and credit institutions
Group Parent company
EURm Individually
assessed Collectively
assessed Total Individually
assessed Collectively
assessed Total
Opening balance at 1 Jan 2015 - 0 0 - 0 0 Provisions - - - - - -
Reversals of previous provisions - 0 0 - 0 0
Changes through the income statement - 0 0 - 0 0 Allowances used to cover realised loan losses - - - - - -
Translation differences - - - - - -
Closing balance at 31 Dec 2015 - 0 0 - 0 0
Opening balance at 1 Jan 2014 -25 0 -25 -25 0 -25 Provisions - 0 0 - 0 0
Reversals of previous provisions 23 0 23 23 0 23
Changes through the income statement 23 0 23 23 0 23 Allowances used to cover realised loan losses 2 - 2 2 - 2
Translation differences - - - - - -
Closing balance at 31 Dec 2014 0 0 0 0 0 0
The public
Group Parent company
EURm Individually
assessed Collectively
assessed Total Individually
assessed Collectively
assessed Total
Opening balance at 1 Jan 2015 -516 -119 -635 -464 -101 -565 Provisions -116 -68 -184 -102 -39 -141
Reversals of previous provisions 33 62 95 28 57 85
Changes through the income statement -83 -6 -89 -74 18 -56 Allowances used to cover realised loan losses 96 - 96 89 - 89
Translation differences -20 21 1 -22 21 -1
Closing balance at 31 Dec 2015 -523 -104 -627 -471 -62 -533
Opening balance at 1 Jan 2014 -689 -125 -814 -619 -107 -726 Provisions -170 -53 -223 -163 -50 -213
Reversals of previous provisions 66 34 100 55 31 86
Changes through the income statement -104 -19 -123 -108 -19 -127 Allowances used to cover realised loan losses 127 - 127 120 - 120
Translation differences 150 25 175 143 25 168
Closing balance at 31 Dec 2014 -516 -119 -635 -464 -101 -565 2 See Note 11 Net loan losses

Nordea Bank Finland Plc . Annual Report 2015 74
Note 13 Loans and impairment, cont.
Allowances and provisions
Total
Group Parent company
31 Dec 31 Dec 31 Dec 31 Dec
EURm 2015 2014 2015 2014
Allowances for items in the balance sheet -627 -635 -533 -565
Provisions for off balance sheet items1 -15 -31 -15 -31
Total allowances and provisions -642 -666 -548 -596
Central banks and credit institutions
Group Parent company
31 Dec 31 Dec 31 Dec 31 Dec
EURm 2015 2014 2015 2014
Allowances for items in the balance sheet - 0 - 0
Provisions for off balance sheet items1 - -7 - -7
Total allowances and provisions - -7 - -7
The public
31 Dec 31 Dec 31 Dec 31 Dec
EURm 2015 2014 2015 2014
Allowances for items in the balance sheet -627 -635 -533 -565
Provisions for off balance sheet items1 -15 -24 -15 -24
Total allowances and provisions -642 -659 -548 -589 1 Included in Note 30 "Provisions" as "Individually assessed guarantees and other commitments".
Key ratios
Group Parent company
31 Dec 31 Dec 31 Dec 31 Dec
2015 2014 2015 2014
Impairment rate, gross2, basis points 112 99 100 80
Impairment rate, net3, basis points 73 64 64 49
Total allowance rate4, basis points 47 42 40 38
Allowances in relation to impaired loans5, % 35 35 35 39
Total allowances in relation to impaired loans6, % 42 43 40 48
Non-performing loans, not impaired7, EURm 95 28 57 20 2 Individually assessed impaired loans before allowances divided by total loans before allowances. 3 Individually assessed impaired loans after allowances divided by total loans before allowances. 4 Total allowances divided by total loans before allowances. 5 Allowances for individually assessed impaired loans divided by individually assessed impaired loans before allowances. 6 Total allowances divided by total impaired loans before allowances. 7 Past due loans, not impaired due to future cash flows (included in Loans, not impaired).

Nordea Bank Finland Plc . Annual Report 2015 75
Note 14 Interest-bearing securities
Group Parent company
31 Dec 31 Dec 31 Dec 31 Dec
EURm 2015 2014 2015 2014
State and sovereigns 9,237 13,991 9,237 13,991
Municipalities and other public bodies 188 165 188 165
Mortgage institutions 8,939 8,455 8,939 8,455
Other credit institutions 10,054 9,924 10,054 9,924
Corporates 1,111 1,388 1,111 1,388
Corporates, sub-investment grade 614 720 614 720
Other 0 - 0 -
Total 30,143 34,643 30,143 34,643 Note 15 Financial instruments pledged as collatera l
Financial instruments pledged as collateral In repurchase transactions and in securities lending transactions, non-cash assets are transferred as collateral. When the counterpart receiving the collateral has the right to sell or repledge the assets, the assets are reclassified on the balance sheet to the item Financial instruments pledged as collateral.
Group Parent company
31 Dec 31 Dec 31 Dec 31 Dec
EURm 2015 2014 2015 2014
Interest-bearing securities 4,627 11,058 4,627 11,058
Total 4,627 11,058 4,627 11,058 For information on transferred assets and reverse repos, see Note 41. Note 16 Shares
Group Parent company
31 Dec 31 Dec 31 Dec 31 Dec
EURm 2015 2014 2015 2014
Shares 1,426 1,215 1,425 1,215
Shares taken over for protection of claims 0 - 0 -
Fund units, equity related 591 688 591 687
Fund units, interest related 3 15 3 15
Total 2,020 1,918 2,019 1,917
- of which Financial instruments pledged as collateral (Note 15) - - - -
Total 2,020 1,918 2,019 1,917

Nordea Bank Finland Plc . Annual Report 2015 76
Note 17 Derivatives and hedge accounting Group Parent company
Fair value1 Total nominal amount
Fair value1 Total nominal amount 31 Dec 2015, EURm Positive Negative Positive Negative
Derivatives held for trading
Interest rate derivatives Interest rate swaps 48,585 46,118 4,456,279 48,585 46,118 4,456,279 Futures and forwards 226 291 1,541,648 226 291 1,541,648 Options 10,937 10,333 433,045 10,937 10,333 433,045 Other 12 52 5,349 12 52 5,349 Total 59,760 56,794 6,436,321 59,760 56,794 6,436,321
Equity derivatives Equity swaps 238 255 13,063 238 255 13,063 Futures and forwards 11 9 865 11 9 865 Options 461 739 23,804 461 739 23,804 Total 710 1,003 37,732 710 1,003 37,732
Foreign exchange derivatives Currency and interest rate swaps 15,233 22,134 909,849 15,233 22,134 909,849 Currency forwards 1,434 813 83,379 1,434 813 83,379 Options 266 208 28,000 266 208 28,000 Total 16,933 23,155 1,021,228 16,933 23,155 1,021,228
Credit derivatives Credit default swaps (CDS) 2,305 2,293 92,726 2,305 2,293 92,726 Total 2,305 2,293 92,726 2,305 2,293 92,726
Commodity derivatives Swaps 16 13 159 16 13 159 Futures and forwards 0 - 25 0 - 25 Options 1 0 303 1 0 303 Total 17 13 487 17 13 487
Other derivatives Options 15 14 1,379 15 14 1,379
Other 5 10 15 5 10 15 Total 20 24 1,394 20 24 1,394
Total derivatives held for trading 79,745 83,282 7,589,888 79,745 83,282 7,589,888
Derivatives used for hedge accounting Interest rate derivatives 733 250 29,920 733 250 29,920
Foreign exchange derivatives 79 6 400 79 6 400 Total derivatives used for hedge accounting 812 256 30,320 812 256 30,320 - of which cash flow hedges 30 6 400 30 6 400
- of which fair value hedges 782 250 29,920 782 250 29,920 Total derivatives 80,557 83,538 7,620,208 80,557 83,538 7,620,208 1 As at 31 Dec 2015 the netting effect to positive and negative market values of derivatives was EUR 127,466m. Periods when hedged cash flows are expected to occur and when they are expected to affect the income statement Group
31 Dec 2015, EURm <1 year 1-3 years 3-5 years 5-10 years Over
10 years
Cash inflows (assets) - - - - -
Cash outflows (liabilities) - 8 - 116 276 Net cash outflows - 8 - 116 276
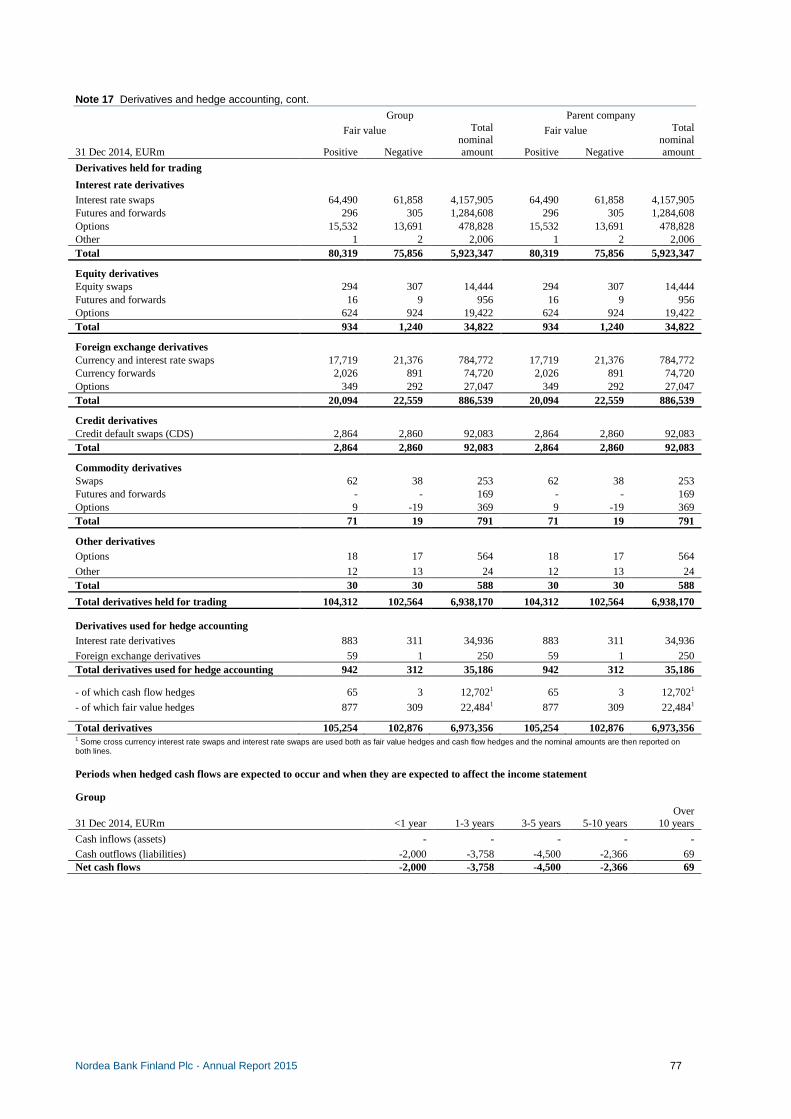
Nordea Bank Finland Plc . Annual Report 2015 77
Note 17 Derivatives and hedge accounting, cont. Group Parent company
Fair value Total nominal amount
Fair value Total nominal amount 31 Dec 2014, EURm Positive Negative Positive Negative
Derivatives held for trading
Interest rate derivatives Interest rate swaps 64,490 61,858 4,157,905 64,490 61,858 4,157,905 Futures and forwards 296 305 1,284,608 296 305 1,284,608 Options 15,532 13,691 478,828 15,532 13,691 478,828 Other 1 2 2,006 1 2 2,006 Total 80,319 75,856 5,923,347 80,319 75,856 5,923,347
Equity derivatives Equity swaps 294 307 14,444 294 307 14,444 Futures and forwards 16 9 956 16 9 956 Options 624 924 19,422 624 924 19,422 Total 934 1,240 34,822 934 1,240 34,822
Foreign exchange derivatives Currency and interest rate swaps 17,719 21,376 784,772 17,719 21,376 784,772 Currency forwards 2,026 891 74,720 2,026 891 74,720 Options 349 292 27,047 349 292 27,047 Total 20,094 22,559 886,539 20,094 22,559 886,539
Credit derivatives Credit default swaps (CDS) 2,864 2,860 92,083 2,864 2,860 92,083 Total 2,864 2,860 92,083 2,864 2,860 92,083
Commodity derivatives Swaps 62 38 253 62 38 253 Futures and forwards - - 169 - - 169 Options 9 -19 369 9 -19 369 Total 71 19 791 71 19 791
Other derivatives Options 18 17 564 18 17 564
Other 12 13 24 12 13 24 Total 30 30 588 30 30 588
Total derivatives held for trading 104,312 102,564 6,938,170 104,312 102,564 6,938,170
Derivatives used for hedge accounting Interest rate derivatives 883 311 34,936 883 311 34,936
Foreign exchange derivatives 59 1 250 59 1 250 Total derivatives used for hedge accounting 942 312 35,186 942 312 35,186 - of which cash flow hedges 65 3 12,7021 65 3 12,7021
- of which fair value hedges 877 309 22,4841 877 309 22,4841
Total derivatives 105,254 102,876 6,973,356 105,254 102,876 6,973,356 1 Some cross currency interest rate swaps and interest rate swaps are used both as fair value hedges and cash flow hedges and the nominal amounts are then reported on both lines. Periods when hedged cash flows are expected to occur and when they are expected to affect the income statement Group
31 Dec 2014, EURm <1 year 1-3 years 3-5 years 5-10 years Over
10 years
Cash inflows (assets) - - - - -
Cash outflows (liabilities) -2,000 -3,758 -4,500 -2,366 69 Net cash flows -2,000 -3,758 -4,500 -2,366 69

Nordea Bank Finland Plc . Annual Report 2015 78
Note 18 Investments in group undertakings
Parent company
31 Dec 31 Dec
EURm 2015 2014
Acquisition value at beginning of year 324 376
Acquisitions during the year - 4
Sales during the year - -55
Translation differences 1 -1
Acquisition value at end of year 325 324
Accumulated impairment charges at beginning of year -16 -
Impairment charges during the year - -16
Translation differences - -
Accumulated impairment charges at end of year -16 -16
Total 309 308
Specification This specification includes all directly owned group undertakings and major group undertakings to the directly owned companies. Group
31 Dec 2015 Number of
shares
Carrying amount
2015 EURm
Carrying amount
2014 EURm
Voting power of
holding, % Domicile Business ID
Domestic
Credit institutions
- Nordea Finance Finland Ltd 1,000,000 306 306 100.0 Helsinki 0112305-3
Financial institutions
- Tukirahoitus Oy1 672 7 7 100.0 Espoo 0677131-6
Real estate companies
- Kiinteistö Oy Tampereen Kirkkokatu 71 280 50 50 100.0 Tampere 0819781-3
- Kiinteistö Oy Levytie 61 67 4 5 100.0 Helsinki 2557073-9
- Kiinteistö Oy Tulppatie 71 80 6 7 100.0 Helsinki 2557075-5
International
Financial institutions
- Nordea Finance Estonia Ltd1 60,000 6 6 100.0 Tallinn EE100212426
- Nordea Finance Latvia Ltd1 1,100 4 4 100.0 Riga LV40003348054
- Nordea Finance Lithuania Ltd1 6,540 4 4 100.0 Vilnius LT111667277
- Nordea Securities Holding (U.K.) Ltd 49,010,000 2 2 100.0 London 01803666
Other subsidiaries included in the consolidated financial statements; total assets of less than EUR 10m
Number of companies
Carrying amount of
shares, EURm Total assets
EURm
Real estate companies 6 10 18
Other companies 5 0 70 1 Indirect holding through Nordea Finance Finland Ltd, a subsidiary of Nordea Bank Finland Plc.
The parent company of Nordea Bank Finland Plc is Nordea Bank AB (publ) domiciled in Stockholm, registration number 516406-0120. The Annual Report 2015 of Nordea Bank AB (publ) may be downloaded on the Internet at www.nordea.com and is available from Nordea Group Investor Relations, SE 105 71 Stockholm, Sweden. The Annual Report 2015 of the Nordea Group is also available at branches of Nordea Bank Finland Plc. No subsidiaries were acquired, sold, merged or dissolved in 2015.
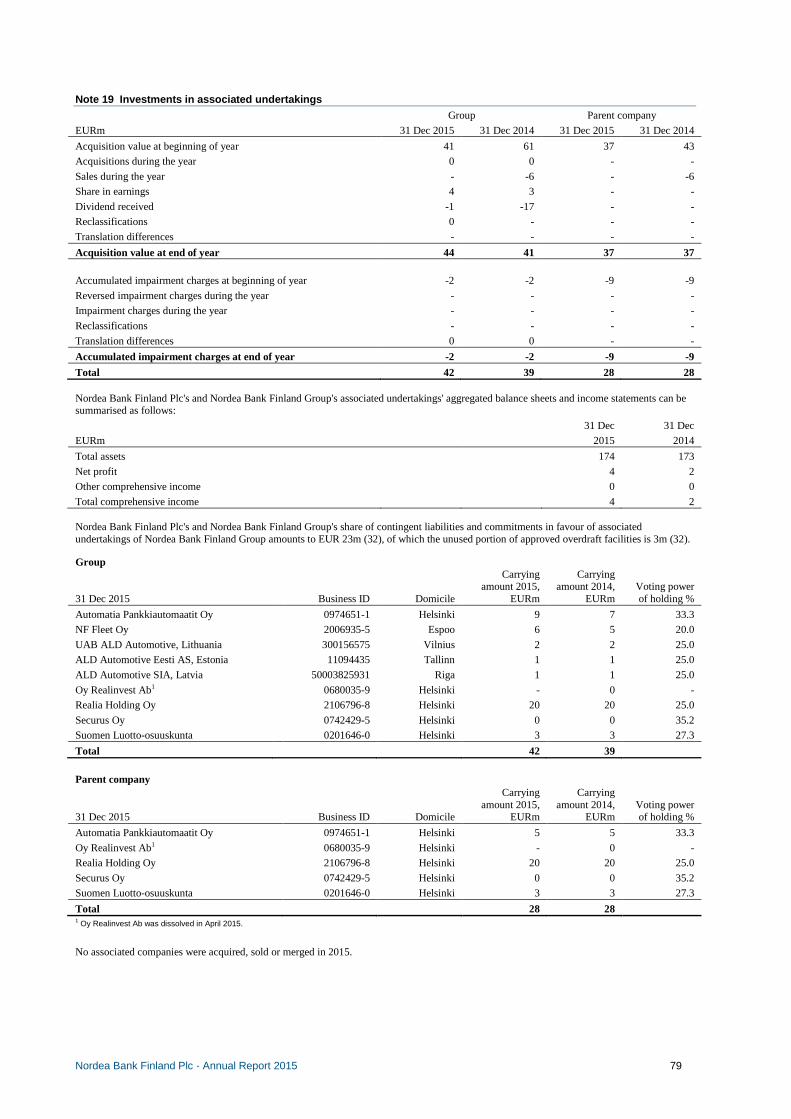
Nordea Bank Finland Plc . Annual Report 2015 79
Note 19 Investments in associated undertakings Group Parent company
EURm 31 Dec 2015 31 Dec 2014 31 Dec 2015 31 Dec 2014
Acquisition value at beginning of year 41 61 37 43
Acquisitions during the year 0 0 - -
Sales during the year - -6 - -6
Share in earnings 4 3 - -
Dividend received -1 -17 - -
Reclassifications 0 - - -
Translation differences - - - -
Acquisition value at end of year 44 41 37 37
Accumulated impairment charges at beginning of year -2 -2 -9 -9
Reversed impairment charges during the year - - - -
Impairment charges during the year - - - -
Reclassifications - - - -
Translation differences 0 0 - -
Accumulated impairment charges at end of year -2 -2 -9 -9
Total 42 39 28 28 Nordea Bank Finland Plc's and Nordea Bank Finland Group's associated undertakings' aggregated balance sheets and income statements can be summarised as follows:
31 Dec 31 Dec
EURm 2015 2014
Total assets 174 173
Net profit 4 2
Other comprehensive income 0 0
Total comprehensive income 4 2 Nordea Bank Finland Plc's and Nordea Bank Finland Group's share of contingent liabilities and commitments in favour of associated undertakings of Nordea Bank Finland Group amounts to EUR 23m (32), of which the unused portion of approved overdraft facilities is 3m (32). Group
31 Dec 2015 Business ID Domicile
Carrying amount 2015,
EURm
Carrying amount 2014,
EURm Voting power of holding %
Automatia Pankkiautomaatit Oy 0974651-1 Helsinki 9 7 33.3
NF Fleet Oy 2006935-5 Espoo 6 5 20.0
UAB ALD Automotive, Lithuania 300156575 Vilnius 2 2 25.0
ALD Automotive Eesti AS, Estonia 11094435 Tallinn 1 1 25.0
ALD Automotive SIA, Latvia 50003825931 Riga 1 1 25.0
Oy Realinvest Ab1 0680035-9 Helsinki - 0 -
Realia Holding Oy 2106796-8 Helsinki 20 20 25.0
Securus Oy 0742429-5 Helsinki 0 0 35.2
Suomen Luotto-osuuskunta 0201646-0 Helsinki 3 3 27.3
Total 42 39
Parent company
31 Dec 2015 Business ID Domicile
Carrying amount 2015,
EURm
Carrying amount 2014,
EURm Voting power of holding %
Automatia Pankkiautomaatit Oy 0974651-1 Helsinki 5 5 33.3
Oy Realinvest Ab1 0680035-9 Helsinki - 0 -
Realia Holding Oy 2106796-8 Helsinki 20 20 25.0
Securus Oy 0742429-5 Helsinki 0 0 35.2
Suomen Luotto-osuuskunta 0201646-0 Helsinki 3 3 27.3
Total 28 28 1 Oy Realinvest Ab was dissolved in April 2015.
No associated companies were acquired, sold or merged in 2015.

Nordea Bank Finland Plc . Annual Report 2015 80
Note 20 Intangible assets
Group Parent company
31 Dec 31 Dec 31 Dec 31 Dec
EURm 2015 2014 2015 2014
Computer software 36 42 28 35
Other intangible assets, total 8 5 3 0
Total intangible assets 44 47 31 35
Group Parent company
31 Dec 31 Dec 31 Dec 31 Dec
2015 2014 2015 2014
Movements in computer software
Acquisition value at beginning of year 186 166 182 171
Acquisitions during the year 4 20 2 10
Sales/disposals during the year -116 0 -116 -2
Reclassifications - 0 - 3
Translation differences - 0 - 0
Acquisition value at end of year 74 186 68 182
Accumulated amortisation at beginning of year -79 -64 -82 -66
Amortisation according to plan for the year -4 -14 -4 -13
Accumulated amortisation on sales/disposals during the year 49 - 49 1
Reclassifications - -1 - -4
Translation differences -1 - 0 0
Accumulated amortisation at end of year -35 -79 -37 -82
Accumulated impairment charges at beginning of year -65 -8 -65 -8
Accumulated impairment charges on disposals during the year 65 - 65 -
Impairment charges during the year -3 -57 -3 -57
Accumulated impairment charges at end of year -3 -65 -3 -65
Total 36 42 28 35 Note 21 Leasing NBF as a lessor Finance leases Nordea Bank Finland Group owns assets leased to customers under finance lease agreements. Finance lease agreements are reported as receivables from the lessee included in "Loans to the public" (see Note 13) at an amount equal to the net investment in the lease. The leased assets mainly comprise vehicles, machinery and other equipment. Reconciliation of gross investments and present value of future minimum lease payments:
Group
31 Dec 31 Dec
EURm 2015 2014
Gross investments 2,557 2,509
Less unearned finance income -106 -124
Net investments in finance leases 2,451 2,385
Less unguaranteed residual values accruing to the benefit of the lessor -21 -22
Present value of future minimum lease payments receivable 2,430 2,363
Accumulated allowance for uncollectible minimum lease payments receivable 8 8

Nordea Bank Finland Plc . Annual Report 2015 81
Note 21 Leasing, cont.
As of 31 December 2015, the gross investment and the net investment by remaining maturity were distributed as follows:
Group
31 Dec 31 Dec
2015 2015
EURm Gross investment Net investment
2016 952 902
2017 669 639
2018 455 440
2019 272 265
2020 163 160
Later years 46 45
Total 2,557 2,451 Operating leases Assets subject to operating leases mainly comprise vehicles and other equipment. On the balance sheet they are reported as tangible assets. Under non-cancellable operating leases, the future minimum lease payments receivables are distributed as follows:
Group
EURm 31 Dec 2015
2016 1
2017 0
2018 0
2019 0
2020 0
Later years 0
Total 1
NBF as a lessee Finance leases
Nordea Bank Finland Group has only to a minor extent entered into finance lease agreements. Operating leases Nordea Bank Finland Group has entered into operating lease agreements for premises and office equipment.
Group Parent company
31 Dec 31 Dec 31 Dec 31 Dec
Leasing expenses during the year, EURm 2015 2014 2015 2014
Leasing expenses during the year -57 -65 -57 -63
- of which minimum lease payments -57 -62 -57 -63
- of which contingent rents 0 -1 - -
Leasing income during the year regarding sublease payments - - - - Future minimum lease payments under non-cancellable operating leases amounted to and are distributed as follows:
Group Parent company
EURm 31 Dec 2015 31 Dec 2015
2016 38 37
2017 25 25
2018 20 20
2019 18 18
2020 16 16
Later years 75 75
Total 192 191

Nordea Bank Finland Plc . Annual Report 2015 82
Note 22 Investment properties Group Parent company
31 Dec 31 Dec 31 Dec 31 Dec
EURm 2015 2014 2015 2014
Carrying amount at beginning of year 2 113 2 8
Acquisitions during the year - 1 - -
Sales/disposals during the year -1 -112 -1 -6
Carrying amount at end of year 1 2 1 2
Amounts recognised in the income statement1
EURm 2015 2014 2015 2014
Rental income 1 1 1 1
Direct operating expenses that generate rental income - -4 - -4
Direct operating expenses that do not generate rental income -2 - -2 -
Total -1 -3 -1 -3 1Together with fair value adjustments included in Net result from items at fair value. Market value 1 2 1 2 Note 23 Other assets
Group Parent company
31 Dec 31 Dec 31 Dec 31 Dec
EURm 2015 2014 2015 2014
Claims on securities settlement proceeds 941 980 940 980
Cash/ margin receivables 15,285 12,978 15,285 12,978
Other 789 666 745 628
Total 17,015 14,624 16,970 14,586
Note 24 Prepaid expenses and accrued income
Group Parent company
31 Dec 31 Dec 31 Dec 31 Dec
EURm 2015 2014 2015 2014
Accrued interest income 87 113 77 105
Other accrued income 330 319 171 146
Prepaid expenses 15 8 15 8
Total 432 440 263 259
Note 25 Deposits by credit institutions
Group Parent company
31 Dec 31 Dec 31 Dec 31 Dec
EURm 2015 2014 2015 2014
Central banks 8,680 10,139 8,680 10,139
Banks 60,137 68,212 59,848 67,970
Other credit institutions 9,345 9,017 9,644 9,020
Total 78,162 87,368 78,172 87,128

Nordea Bank Finland Plc . Annual Report 2015 83
Note 26 Deposits and borrowings from the public
Group Parent company
31 Dec 31 Dec 31 Dec 31 Dec
EURm 2015 2014 2015 2014
Deposits 52,690 52,593 52,688 52,587
Repurchase agreements 9,463 24,286 9,462 24,286
Total 62,153 76,879 62,150 76,873
Note 27 Debt securities in issue
Group Parent company
31 Dec 31 Dec 31 Dec 31 Dec
EURm 2015 2014 2015 2014
Certificates of deposit 18,558 22,871 18,558 22,871
Commercial papers - 887 - 887
Covered bonds 17,377 16,212 17,377 16,212
Other bonds 7,472 8,502 7,472 8,502
Total 43,407 48,472 43,407 48,472
Note 28 Other liabilities
Group Parent company
31 Dec 31 Dec 31 Dec 31 Dec
EURm 2015 2014 2015 2014
Liabilities on securities settlement proceeds 837 631 837 631
Sold, not held, securities 8,519 6,273 8,519 6,273
Accounts payable 19 37 16 31
Cash/margin payables 8,832 10,061 8,831 10,061
Other 1,859 1,575 1,653 1,374
Total 20,066 18,577 19,856 18,370
Note 29 Accrued expenses and prepaid income
Group Parent company
31 Dec 31 Dec 31 Dec 31 Dec
EURm 2015 2014 2015 2014
Accrued interest 2 10 1 10
Other accrued expenses 390 611 287 502
Prepaid income 175 183 94 99
Total 567 804 382 611

Nordea Bank Finland Plc . Annual Report 2015 84
Note 30 Provisions
Group Parent company
31 Dec 31 Dec 31 Dec 31 Dec
EURm 2015 2014 2015 2014
Reserve for restructuring costs 60 45 59 44
Transfer risks, off-balance 0 8 0 8
Individually assessed guarantees and other commitments 15 23 15 23
Tax 0 0 - -
Other 6 9 4 7
Total 81 85 78 82 Group
EURm Restructuring Transfer risks Guarantees/
commitments Tax Other Total
At the beginning of year 45 8 23 0 9 85
New provisions made 32 - -3 - - 29
Provisions utilised -14 - - - 0 -14
Reversals -3 -8 -5 - -3 -19
Reclassifications - - - - 0 -
Translation differences - - - - 0 0
At the end of year 60 0 15 0 6 81 Provision for restructuring costs amounts to EUR 60m. New provisions recognised in 2015 amounted to EUR 34m. The restructuring activities have been initiated to manage the transformational change to a truly digital bank. The majority of the provision is expected to be used during 2016. As with any other provision, there is an uncertainty around timing and amount, which is expected to be decreased as the plan is being executed. Provision for Transfer risk that was related to off-balance items released during the year 2015. Loan loss provisions for individually assessed guarantees and other commitments amounted to EUR 15m. Other provisions (EUR 6m) refer to the following provisions: Legal Disputes of EUR 1m, provision for environmental and property-related obligations of EUR 3m and other provisions amounting to EUR 2m. All other provisions are expected to be settled in 2016. Parent company
EURm Restructuring Transfer
risks Guarantees/
commitments Other Total
At beginning of year 44 8 23 7 82
New provisions made 32 - -3 - 29
Provisions utilised -14 - - 0 -14
Reversals -3 -8 -5 -3 -19
Translation differences - - - 0 0
At the end of year 59 0 15 4 78 Provision for restructuring costs amounts to EUR 59m. New provisions recognised in 2015 amounted to EUR 34m. The restructuring activities have been initiated to manage the transformational change to a truly digital bank. The majority of the provision is expected to be used during 2016. As with any other provision, there is an uncertainty around timing and amount, which is expected to be decreased as the plan is being executed. Provision for Transfer risk that was related to off-balance items released during the year 2015. Loan loss provisions for individually assessed guarantees and other commitments amounted to EUR 15m. Other provisions (4m) refer to the following provisions: Legal Disputes of EUR 1m and provision for environmental and property-related obligations of EUR 3m. All other provisions are expected to be settled in 2016.
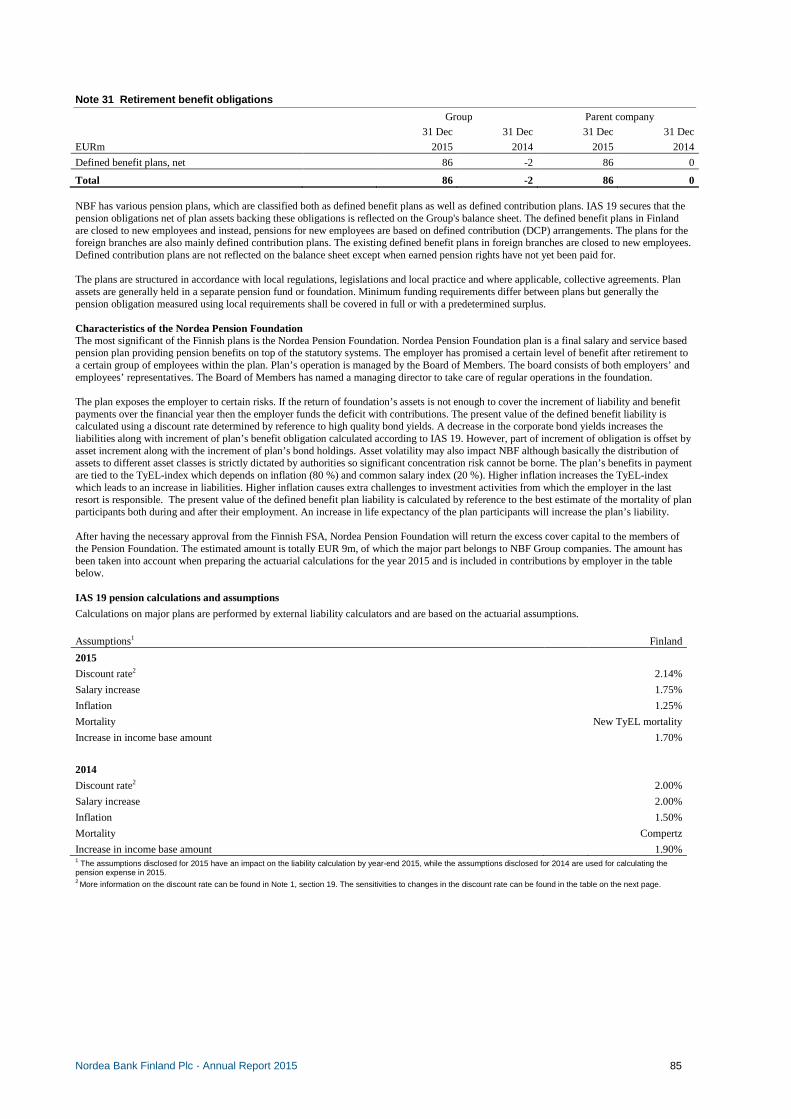
Nordea Bank Finland Plc . Annual Report 2015 85
Note 31 Retirement benefit obligations
Group Parent company
31 Dec 31 Dec 31 Dec 31 Dec
EURm 2015 2014 2015 2014
Defined benefit plans, net 86 -2 86 0
Total 86 -2 86 0 NBF has various pension plans, which are classified both as defined benefit plans as well as defined contribution plans. IAS 19 secures that the pension obligations net of plan assets backing these obligations is reflected on the Group's balance sheet. The defined benefit plans in Finland are closed to new employees and instead, pensions for new employees are based on defined contribution (DCP) arrangements. The plans for the foreign branches are also mainly defined contribution plans. The existing defined benefit plans in foreign branches are closed to new employees. Defined contribution plans are not reflected on the balance sheet except when earned pension rights have not yet been paid for. The plans are structured in accordance with local regulations, legislations and local practice and where applicable, collective agreements. Plan assets are generally held in a separate pension fund or foundation. Minimum funding requirements differ between plans but generally the pension obligation measured using local requirements shall be covered in full or with a predetermined surplus. Characteristics of the Nordea Pension Foundation The most significant of the Finnish plans is the Nordea Pension Foundation. Nordea Pension Foundation plan is a final salary and service based pension plan providing pension benefits on top of the statutory systems. The employer has promised a certain level of benefit after retirement to a certain group of employees within the plan. Plan’s operation is managed by the Board of Members. The board consists of both employers’ and employees’ representatives. The Board of Members has named a managing director to take care of regular operations in the foundation. The plan exposes the employer to certain risks. If the return of foundation’s assets is not enough to cover the increment of liability and benefit payments over the financial year then the employer funds the deficit with contributions. The present value of the defined benefit liability is calculated using a discount rate determined by reference to high quality bond yields. A decrease in the corporate bond yields increases the liabilities along with increment of plan’s benefit obligation calculated according to IAS 19. However, part of increment of obligation is offset by asset increment along with the increment of plan’s bond holdings. Asset volatility may also impact NBF although basically the distribution of assets to different asset classes is strictly dictated by authorities so significant concentration risk cannot be borne. The plan’s benefits in payment are tied to the TyEL-index which depends on inflation (80 %) and common salary index (20 %). Higher inflation increases the TyEL-index which leads to an increase in liabilities. Higher inflation causes extra challenges to investment activities from which the employer in the last resort is responsible. The present value of the defined benefit plan liability is calculated by reference to the best estimate of the mortality of plan participants both during and after their employment. An increase in life expectancy of the plan participants will increase the plan’s liability. After having the necessary approval from the Finnish FSA, Nordea Pension Foundation will return the excess cover capital to the members of the Pension Foundation. The estimated amount is totally EUR 9m, of which the major part belongs to NBF Group companies. The amount has been taken into account when preparing the actuarial calculations for the year 2015 and is included in contributions by employer in the table below. IAS 19 pension calculations and assumptions
Calculations on major plans are performed by external liability calculators and are based on the actuarial assumptions.
Assumptions1 Finland
2015
Discount rate2 2.14%
Salary increase 1.75%
Inflation 1.25%
Mortality New TyEL mortality
Increase in income base amount 1.70%
2014
Discount rate2 2.00%
Salary increase 2.00%
Inflation 1.50%
Mortality Compertz
Increase in income base amount 1.90% 1 The assumptions disclosed for 2015 have an impact on the liability calculation by year-end 2015, while the assumptions disclosed for 2014 are used for calculating the pension expense in 2015. 2 More information on the discount rate can be found in Note 1, section 19. The sensitivities to changes in the discount rate can be found in the table on the next page.

Nordea Bank Finland Plc . Annual Report 2015 86
Note 31 Retirement benefit obligation, cont.
Group Parent company
Sensitivities - Impact on Defined Benefit Obligation (DBO) 2015 2014 2015 2014
Discount rate - Increase 50bps -6.8% -7.2% -6.7% -7.1%
Discount rate - Decrease 50bps 7.6 % 8.1% 7.6% 8.1%
Salary increase - Increase 50bps 0.4% 0.4% 0.4% 0.4%
Salary increase - Decrease 50bps -0.4% -0.4% -0.4% -0.4%
Inflation - Increase 50bps 4.2% 4.7% 4.2% 4.6%
Inflation - Decrease 50bps -3.9% -4.3% -3.9% -4.3%
Mortality - Increase 1 year 2.6% 3.7% 2.7% 3.7%
Mortality - Decrease 1 year -2.6% -3.6% -2.6% -3.6% The sensitivity analyses are prepared by changing one actuarial assumption while keeping the other assumptions unchanged. This is a simplified approach since the actuarial assumptions usually are correlated. However, it enables the reader to isolate one effect from another. The method used for calculating the impact on the obligation is the same as when calculating the obligation accounted for in the financial statements. Compared with the 2014 Annual Report, there have been no changes in the methods used when preparing the sensitivity analyses. Net retirement benefit liabilities/assets
Group Parent company
EURm 2015 2014 2015 2014
Obligations 871 948 857 934
Plan assets 957 946 943 934
Net liability(-)/asset (+) 86 -2 86 0
- of which retirement benefit liabilities 4 28 4 25
- of which retirement benefit assets 90 25 90 25
Movements in the obligation
Group Parent company
EURm 2015 2014 2015 2014
Opening balance 948 788 934 776
Current service cost 2 2 2 2
Interest cost 20 27 20 27
Pensions paid -42 -42 -41 -42
Past service cost 1 0 1 0
Settlements 0 0 0 0
Remeasurement from changes in demographic assumptions -32 28 -32 28
Remeasurement from changes in financial assumptions -24 145 -23 142
Remeasurement from experience adjustments -11 -8 -11 -7
Translation differences 9 8 7 8
Closing balance 871 948 857 934 The average duration of the obligation is 17 years (14) both in the Group and the parent company. The duration is based on discounted cash flows. The fact that the main part of the defined benefit plans are closed for new entrants leads to a lower duration.

Nordea Bank Finland Plc . Annual Report 2015 87
Note 31 Retirement benefit obligations, cont.
Movements in the fair value of plan assets
Group Parent company
EURm 2015 2014 2015 2014
Opening balance 946 900 934 887
Interest income (calculated using the discount rate) 20 31 20 31
Pensions paid -42 -42 -41 -42
Settlements 2 0 2 0
Contributions by employer -1 -14 -1 -13
Remeasurement (actual return less interest income) 24 63 23 63
Administrative expenses 0 0 0 0
Translation differences 8 8 6 8
Closing balance 957 946 943 934
Asset composition The combined return on assets in 2015 was 5% (10). The asset return was driven by positive return on equities and real estate with only limited contribution from bonds and credit investments. At the end of the year, the equity exposure in pension foundation represented 29% (28) of total assets.
Asset composition in funded schemes, % 2015 2014
Bonds 54 % 59 %
- sovereign 37 % 44 %
- covered bonds - -
- corporate bonds 17 % 13 %
- issued by Nordea entities - -
- with quoted market price in an active market 54 % 59 %
Equity 29 % 28 %
- domestic 8 % 9 %
- European 8 % 8 %
- US 7 % 7 %
- emerging 5 % 4 %
- Nordea shares 0 % -
- with quoted market price in an active market 29 % 28 %
Real Estate1 10 % 10 %
- occupied by Nordea 3 % 3 %
Cash and cash equivalents 7 % 3 % 1 The geographical location of the real estate follows the geographical location of the relevant pension plan. Both the Group and the parent company are expected to contribute EUR 3m to its defined benefit plans in 2016. Defined benefit pension cost The total net pension cost related to defined benefit plans recognised in the Group's income statement (as staff costs) for the year 2015 is EUR 1m (1m positive). In the parent company's income statement the respective cost was EUR 1m (1 m positive) in 2015. Total pension costs comprise defined benefit pension costs as well as costs related to defined contribution plans (see specification in Note 8).
Group Parent company
Recognised in the income statement, EURm 2015 2014 2015 2014
Current service cost 3 3 2 2
Net interest 0 -4 0 -3
Past service cost 1 0 1 0
Settlements -2 0 -2 0
Administrative expenses 0 0 0 0
Pension cost on defined benefit plans (expense+, income-) 2 -1 1 -1 Except past service cost and settlements, the pension cost is in line with what was expected at the start of the year.

Nordea Bank Finland Plc . Annual Report 2015 88
Note 31 Retirement benefit obligations, cont.
Group Parent company
Recognised in other comprehensive income, EURm 2015 2014 2015 2014
Remeasurement from changes in demographic assumptions -32 28 -32 28
Remeasurement from changes in financial assumptions -24 145 -23 142
Remeasurement from experience adjustments -11 -8 -11 -7
Remeasurement of plan assets (actual return less interest income) -24 -63 -23 -63
Pension cost on defined benefit plans (expense+, income-) -91 102 -89 100
Group Parent company
Net retirement benefit asset//liability 2015 2014 2015 2014
Opening balance 2 -112 1 -111
Pension cost in the income statement 2 -1 1 -1
Remeasurements in other comprehensive income -91 102 -89 100
Contributions by employer 1 13 1 13
Translation differences 0 0 1 0
Closing balance -86 2 -85 1
Key management personnel As at 31 December 2015, members of the Board of Directors of Nordea Bank Finland Plc were members of the Nordea Bank AB (publ) Group Executive Management, except for the one external member, Carl-Johan Granvik. In 2015, Nordea Bank AB (publ) has paid all salaries, fees, pensions and other staff-related expenses to the other members of the Board. Nordea Bank AB (publ) has allocated these salary expenses to Nordea Bank Finland Plc as part of the Head Office Allocation expenses. Information on salaries, loans and pension liabilities regarding members of the Board, the President and the deputy to the President is presented in Note 8 and in the Annual report of Nordea Bank AB (publ). Note 32 Subordinated liabilities
Group Parent company
31 Dec 31 Dec 31 Dec 31 Dec
EURm 2015 2014 2015 2014
Dated subordinated debenture loans - - - -
Undated subordinated debenture loans 78 70 78 70
Hybrid capital loans 550 550 550 550
Total 628 620 628 620 These debenture loans are subordinated to other liabilities. Dated debenture loans entitle the lender to payment before undated subordinated loans and hybrid capital loans. Within each respective category, the loans entitle lenders to equal payment rights. Group and parent company On 31 December 2015 loans - with terms specified below - exceeded 10% of the total outstanding volume.
Issued by Year of issue/
maturity Nominal value Carrying amount,
EURm Interest rate
(coupon)
Nordea Bank Finland Plc1 1999/undated MJPY 10,000 78 4.51%
Nordea Bank Finland Plc2 2014/30 Sep 2019 MEUR 550 550 Floating 3-month EURIBOR
+4.34% 1 Call date 26 February 2029 2 Call date 30 February 2019

Nordea Bank Finland Plc . Annual Report 2015 89
Note 33 Assets pledged as security for own liabili ties
Group Parent company
31 Dec 31 Dec 31 Dec 31 Dec
EURm 2015 2014 2015 2014
Assets pledged for own liabilities
Securities etc.P
1 4,627 11,058 4,627 11,058
Loans to the public 20,731 19,800 20,730 19,800
Other pledged assets 15,574 12,568 15,574 12,568
Total 40,932 43,426 40,931 43,426
The above pledges pertain to the following liabilities Deposits by credit institutions 2,706 6,399 2,706 6,399
Deposits and borrowings from the public 1,921 4,659 1,921 4,659
Derivatives 15,285 12,314 15,285 12,314
Debt securities in issue 17,378 16,212 17,377 16,212
Other liabilities and commitments 260 - 260 -
Total 37,550 39,584 37,549 39,584 1 Relates only to securities recognised on the balance sheet. Securities borrowed or bought under reverse repurchase agreements are not recognised on the balance sheet and thus not included in the amount. Such transactions are disclosed in Note 41 Transferred assets and obtained collaterals. Assets pledged for own liabilities contain securities pledged as security in repurchase agreement and in securities lending. The transactions are conducted under standard agreements employed by financial markets participants. Counterparts in those transactions are credit institutions and the public. The transactions are typically short term with maturity within three months. Loans to the public amounting to EUR 20,730m (19,800) have been registered as collateral for issued Finnish covered bonds amounting to EUR 17,377m (16,212). In the event of the company's insolvency, the holders of these bonds have priority to the assets registered as collateral. Collaterals are valuated up to the first 70% of the market value of the property. NBF has used Realia Management Oy, Newsec Valuation Oy and Catella Property Oy to valuate commercial real estate collaterals.
Note 34 Other assets pledged
Other assets pledged are mainly related to securities which include interest-bearing securities pledged as securities for payment settlements within the central banks and clearing institutions EUR 4,792 m (5,000). The terms and conditions require day to day securities and relate to liquidity intraday/overnight. Collateral pledged on behalf of other items than the company´s own liabilities, e.g. on behalf of a third party or on behalf of the company´s own contingent liabilities, are also accounted for under this item. Note 35 Contingent liabilities
Group Parent company
31 Dec 31 Dec 31 Dec 31 Dec
EURm 2015 2014 2015 2014
Guarantees
Loan guarantees 1,415 1,350 1,580 1,538
Other guarantees 9,666 11,933 9,665 11,941
Documentary credits 1,331 1,603 1,334 1,603
Other contingent liabilities 20 20 20 20
Total 12,432 14,906 12,599 15,102 In the normal business of Nordea Bank Finland, the bank issues various forms of guarantees in favour of the bank's customers. Loan guarantees are given for customers to guarantee obligations in other credit and pension institutions. Other guarantees consist mainly of commercial guarantees such as bid guarantees, advance payment guarantees, warranty guarantees and export related guarantees. Contingent liabilities also include unutilised irrevocable import documentary credits and confirmed export documentary credits. These transactions are part of the bank’s services and support the bank's customers. Guarantees and documentary credits are off-balance sheet items, unless there is a need for a provision to cover a probable loan loss that arises from the judgement that reimbursement will not be received.

Nordea Bank Finland Plc . Annual Report 2015 90
Note 36 Commitments
Group Parent company
31 Dec 31 Dec 31 Dec 31 Dec
EURm 2015 2014 2015 2014
Unutilised overdraft facilities 7,411 7,760 7,411 7,784
Loan commitments 6,202 8,261 3,354 5,513
Future payment obligations 2 3 2 3
Other commitments 357 766 - 449
Total 13,972 16,790 10,767 13,749 Reverse repurchase agreements are recognised on and derecognised from the balance sheet on settlement date. Nordea has as per 31 December 2015 signed reverse repurchase agreements of EUR 6,809 m (26,849) that have not yet been settled and consequently are not recognised on the balance sheet. On settlement date, these reverse repurchase agreements will, to the utmost extent, replace existing reverse repurchase agreements not yet derecognised as per 31 December 2015. Net impact on the balance sheet is minor. These instruments have not been disclosed as commitments. Note 37 Capital adequacy Capital adequacy is a measure of the financial strength of a bank, usually expressed as a ratio of capital to assets. There is now a worldwide capital adequacy standard (Basel III) drawn up by the Basel Committee on Banking Supervision. Within the EU, the capital adequacy requirements are outlined in the CRD.
Common Equity Tier 1 capital and Tier 1 capital Common Equity Tier (CET) 1 capital is defined as eligible capital including eligible reserves, net of regulatory required deductions made directly to CET1 capital. The capital recognised as CET 1 capital holds the ultimate characteristics for loss absorbance defined from a going concern perspective and represents the most subordinated claim in the event of liquidation. The Tier 1 capital is defined as the sum of CET1 capital and Additional Tier 1 (AT1) capital where AT1 capital is the total of instruments (hybrids) issued by the bank that meet the transitional regulatory criteria and are not included in the CET1 net after AT1 deductions. All AT1 capital instruments are undated subordinated capital loans. Eligible capital and eligible reserves Paid up capital is the share capital contributed by shareholders, including the share premium paid. Eligible reserves consist primarily of retained earnings, other reserves and income from the current year. Retained earnings are earnings from previous years reported via the income statement. Other reserves are related to revaluation and translation reserves referred to acquisitions and associated companies under the equity method. The equity interests of minority shareholdings in companies that are fully consolidated in the financial group are not included. Positive income from the current year is included as eligible capital after verification by the external auditors, however negative income must be deducted. Additional Tier 1 instruments The inclusion of undated subordinated loans in additional Tier 1 capital is restricted and repurchase can normally not take place until five years after original issuance of the instrument. Undated subordinated loans may be repaid only upon decision by the Board of Directors in NBF and with the permission of the Supervisory Authority. Furthermore, there are restrictions related to step-up conditions, order of priority, and interest payments under constraint conditions. Additional Tier 1 instruments issued that fulfil the CRD IV requirements are fully included whereas remaining instruments are phased out according to transitional rules. For the additional Tier 1 instruments, conditions specify appropriation in order to avoid being obliged to enter into liquidation. To the extent that may be required to avoid liquidation, the principal amounts of additional Tier 1 instruments (together with accrued interest) would be written down and converting such amount into a conditional capital contribution. Tier 2 capital Tier 2 capital must be subordinated to depositors and general creditors of the bank. It cannot be secured or covered by a guarantee of the issuer or related entity or include any other arrangement that legally or economically enhances the seniority of the claim vis-à-vis depositors and other bank creditors. Tier 2 instruments Tier 2 instruments consists mainly of subordinated debt. Tier 2 instruments include two different types of subordinated loan capital; undated loans and dated loans. According to the regulation, Tier 2 instruments issued that fulfil the CRD IV requirements are fully included whereas remaining instruments are phased out according to transitional rules. The basic principle for subordinated debt in own funds is the order of priority in case of a default or bankruptcy situation. Under such conditions, the holder of the subordinated loan would be repaid after other creditors, but before shareholders. The share of outstanding loan amount possible to include in the Tier 2 capital related to dated loans is reduced if the remaining maturity is less than five years.

Nordea Bank Finland Plc . Annual Report 2015 91
Note 37 Capital adequacy, cont. Table A2 Transitional own funds
Group Common Equity Tier 1 capital: instruments and reserves, EURm
(A) amount at disclosure date
(C) amounts subject to pre-regulation (EU)
no 575/2013 treatment or
prescribed residual amount of regulation
(EU) no 575/2013
1 Capital instruments and the related share premium accounts 2,918
of which: Share capital 2,319
2 Retained earnings 8,277
3 Accumulated other comprehensive income (and other reserves, to include unrealised gains and losses under the applicable accounting standards) 48
5 Minority Interests (amount allowed in consolidated CET1) 0 0
5a Independently reviewed interim profits net of any foreseeable charge or dividend 274
6 Common Equity Tier 1 (CET1) capital before regulatory adjustments 11,516
Common Equity Tier 1 (CET1) capital: regulatory adjustments
7 Additional value adjustments (negative amount) -219
8 Intangible assets (net of related tax liability) (negative amount) -44
10 Deferred tax assets that rely on future profitability excluding those arising from temporary differences (net of related tax liability where the conditions in Article 38 (3) are met) (negative amount) 0
11 Fair value reserves related to gains or losses on cash flow hedges -13
12 Negative amounts resulting from the calculation of expected loss amounts -207 0
14 Gains or losses on liabilities valued at fair value resulting from changes in own credit standing 37
15 Defined-benefit pension fund assets (negative amount) -72 0
25b Foreseeable tax charges relating to CET1 items (negative amount) 0
26a Regulatory adjustments relating to unrealised gains and losses pursuant to Articles 467 and 468 0
Of which: …filter for unrealised loss 1 0 4,029
Of which: …filter for unrealised gain 1 0 135
28 Total regulatory adjustments to Common Equity Tier 1 (CET1) -518
29 Common Equity Tier 1 (CET1) capital 10,998
Additional Tier 1 (AT1) capital: instruments
30 Capital instruments and the related share premium accounts 550
36 Additional Tier 1 (AT1) capital before regulatory adjustments 550
Additional Tier 1 (AT1) capital: regulatory adjustm ents
43 Total regulatory adjustments to Additional Tier 1 (AT1) capital 0
44 Additional Tier 1 (AT1) capital 550
45 Tier 1 capital (T1 = CET1 + AT1) 11,548
Tier 2 (T2) capital: instruments and provisions
46 Capital instruments and the related share premium accounts 0
47 Amount of qualifying items referred to in Article 484 (5) and the related share premium accounts subject to phase out from T2 76
51 Tier 2 (T2) capital before regulatory adjustments 76
Tier 2 (T2) capital: regulatory adjustments
57 Total regulatory adjustments to Tier 2 (T2) capital 0
58 Tier 2 (T2) capital 76
59 Total capital (TC = T1 + T2) 11,624
60 Total risk weighted assets 44,378
Capital ratios and buffers
61 Common Equity Tier 1 (as a percentage of risk exposure amount) 24.8%
62 Tier 1 (as a percentage of risk exposure amount) 26.0%
63 Total capital (as a percentage of risk exposure amount) 26.2%
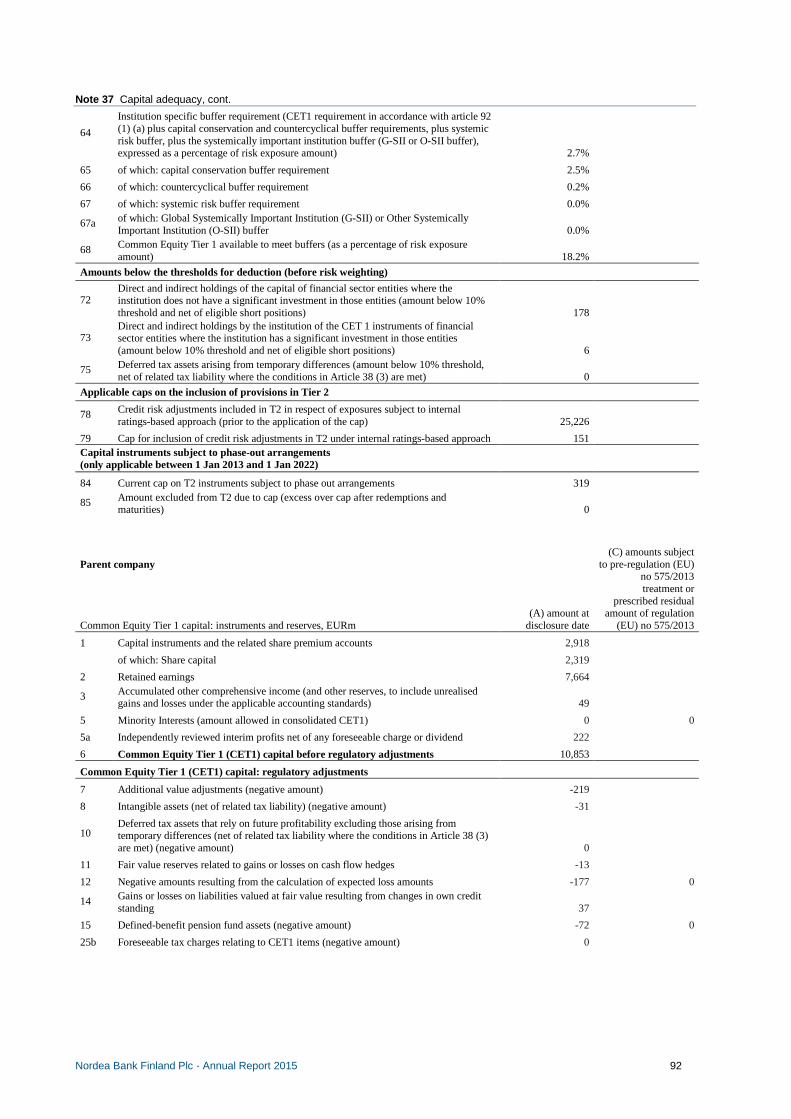
Nordea Bank Finland Plc . Annual Report 2015 92
Note 37 Capital adequacy, cont.
64
Institution specific buffer requirement (CET1 requirement in accordance with article 92 (1) (a) plus capital conservation and countercyclical buffer requirements, plus systemic risk buffer, plus the systemically important institution buffer (G-SII or O-SII buffer), expressed as a percentage of risk exposure amount) 2.7%
65 of which: capital conservation buffer requirement 2.5%
66 of which: countercyclical buffer requirement 0.2%
67 of which: systemic risk buffer requirement 0.0%
67a of which: Global Systemically Important Institution (G-SII) or Other Systemically Important Institution (O-SII) buffer 0.0%
68 Common Equity Tier 1 available to meet buffers (as a percentage of risk exposure amount) 18.2%
Amounts below the thresholds for deduction (before risk weighting)
72 Direct and indirect holdings of the capital of financial sector entities where the institution does not have a significant investment in those entities (amount below 10% threshold and net of eligible short positions) 178
73 Direct and indirect holdings by the institution of the CET 1 instruments of financial sector entities where the institution has a significant investment in those entities (amount below 10% threshold and net of eligible short positions) 6
75 Deferred tax assets arising from temporary differences (amount below 10% threshold, net of related tax liability where the conditions in Article 38 (3) are met) 0
Applicable caps on the inclusion of provisions in Tier 2
78 Credit risk adjustments included in T2 in respect of exposures subject to internal ratings-based approach (prior to the application of the cap) 25,226
79 Cap for inclusion of credit risk adjustments in T2 under internal ratings-based approach 151 Capital instruments subject to phase-out arrangements (only applicable between 1 Jan 2013 and 1 Jan 2022)
84 Current cap on T2 instruments subject to phase out arrangements 319
85 Amount excluded from T2 due to cap (excess over cap after redemptions and maturities) 0
Parent company Common Equity Tier 1 capital: instruments and reserves, EURm
(A) amount at disclosure date
(C) amounts subject to pre-regulation (EU)
no 575/2013 treatment or
prescribed residual amount of regulation
(EU) no 575/2013
1 Capital instruments and the related share premium accounts 2,918
of which: Share capital 2,319
2 Retained earnings 7,664
3 Accumulated other comprehensive income (and other reserves, to include unrealised gains and losses under the applicable accounting standards) 49
5 Minority Interests (amount allowed in consolidated CET1) 0 0
5a Independently reviewed interim profits net of any foreseeable charge or dividend 222
6 Common Equity Tier 1 (CET1) capital before regulatory adjustments 10,853
Common Equity Tier 1 (CET1) capital: regulatory adjustments
7 Additional value adjustments (negative amount) -219
8 Intangible assets (net of related tax liability) (negative amount) -31
10 Deferred tax assets that rely on future profitability excluding those arising from temporary differences (net of related tax liability where the conditions in Article 38 (3) are met) (negative amount) 0
11 Fair value reserves related to gains or losses on cash flow hedges -13
12 Negative amounts resulting from the calculation of expected loss amounts -177 0
14 Gains or losses on liabilities valued at fair value resulting from changes in own credit standing 37
15 Defined-benefit pension fund assets (negative amount) -72 0
25b Foreseeable tax charges relating to CET1 items (negative amount) 0
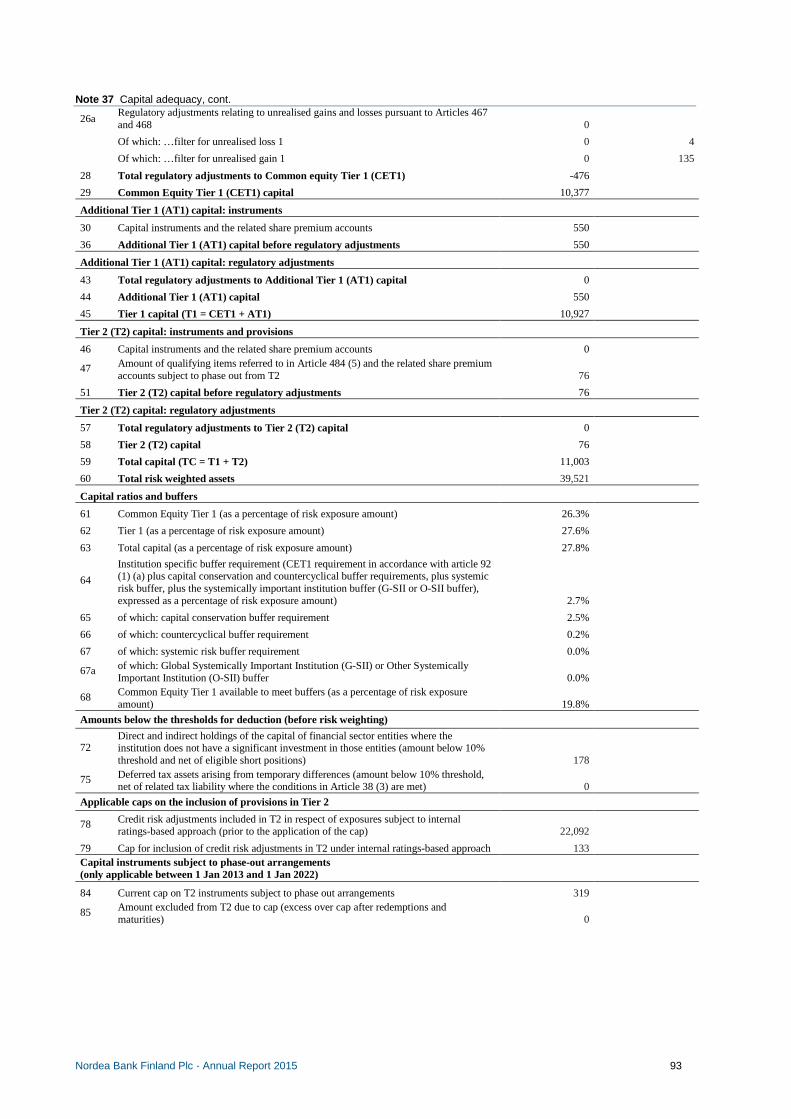
Nordea Bank Finland Plc . Annual Report 2015 93
Note 37 Capital adequacy, cont. 26a
Regulatory adjustments relating to unrealised gains and losses pursuant to Articles 467 and 468 0
Of which: …filter for unrealised loss 1 0 4
Of which: …filter for unrealised gain 1 0 135
28 Total regulatory adjustments to Common equity Tier 1 (CET1) -476
29 Common Equity Tier 1 (CET1) capital 10,377
Additional Tier 1 (AT1) capital: instruments
30 Capital instruments and the related share premium accounts 550
36 Additional Tier 1 (AT1) capital before regulatory adjustments 550
Additional Tier 1 (AT1) capital: regulatory adjustm ents
43 Total regulatory adjustments to Additional Tier 1 (AT1) capital 0
44 Additional Tier 1 (AT1) capital 550
45 Tier 1 capital (T1 = CET1 + AT1) 10,927
Tier 2 (T2) capital: instruments and provisions
46 Capital instruments and the related share premium accounts 0
47 Amount of qualifying items referred to in Article 484 (5) and the related share premium accounts subject to phase out from T2 76
51 Tier 2 (T2) capital before regulatory adjustments 76
Tier 2 (T2) capital: regulatory adjustments
57 Total regulatory adjustments to Tier 2 (T2) capital 0
58 Tier 2 (T2) capital 76
59 Total capital (TC = T1 + T2) 11,003
60 Total risk weighted assets 39,521
Capital ratios and buffers
61 Common Equity Tier 1 (as a percentage of risk exposure amount) 26.3%
62 Tier 1 (as a percentage of risk exposure amount) 27.6%
63 Total capital (as a percentage of risk exposure amount) 27.8%
64
Institution specific buffer requirement (CET1 requirement in accordance with article 92 (1) (a) plus capital conservation and countercyclical buffer requirements, plus systemic risk buffer, plus the systemically important institution buffer (G-SII or O-SII buffer), expressed as a percentage of risk exposure amount) 2.7%
65 of which: capital conservation buffer requirement 2.5%
66 of which: countercyclical buffer requirement 0.2%
67 of which: systemic risk buffer requirement 0.0%
67a of which: Global Systemically Important Institution (G-SII) or Other Systemically Important Institution (O-SII) buffer 0.0%
68 Common Equity Tier 1 available to meet buffers (as a percentage of risk exposure amount) 19.8%
Amounts below the thresholds for deduction (before risk weighting)
72 Direct and indirect holdings of the capital of financial sector entities where the institution does not have a significant investment in those entities (amount below 10% threshold and net of eligible short positions) 178
75 Deferred tax assets arising from temporary differences (amount below 10% threshold, net of related tax liability where the conditions in Article 38 (3) are met) 0
Applicable caps on the inclusion of provisions in Tier 2
78 Credit risk adjustments included in T2 in respect of exposures subject to internal ratings-based approach (prior to the application of the cap) 22,092
79 Cap for inclusion of credit risk adjustments in T2 under internal ratings-based approach 133 Capital instruments subject to phase-out arrangements (only applicable between 1 Jan 2013 and 1 Jan 2022)
84 Current cap on T2 instruments subject to phase out arrangements 319
85 Amount excluded from T2 due to cap (excess over cap after redemptions and maturities) 0

Nordea Bank Finland Plc . Annual Report 2015 94
Note 37 Capital adequacy, cont. Minimum capital requirement and REA
Group
31 Dec 2015 31 Dec 2014
EURm
Minimum capital
requirement REA
Minimum capital
requirement REA
Credit risk 2,713 33,909 3,059 38,231
- of which counterparty credit risk 586 7,330 663 8,285
IRB 2,018 25,226 2,200 27,496
- corporate 1,214 15,175 1,358 16,976
- advanced 811 10,143 488 6,103
- foundation 403 5,032 870 10,873
- institutions 295 3,683 358 4,465
- retail 500 6,248 465 5,816
- secured by immovable property collateral 216 2,699 184 2,300
- other retail 284 3,549 281 3,516
- other 9 120 19 239
Standardised 695 8,683 859 10,735
- central governments or central banks 7 90 17 208
- regional governments or local authorities 13 166 14 170
- public sector entities 2 30 2 20
- multilateral development banks 0 0 - -
- international organisations - - - -
- institutions 538 6,728 692 8,663
- corporate 81 1,007 79 995
- retail 35 433 32 395
- secured by mortgages on immovable property
- in default 1 16 1 13
- associated with particularly high risk - - - -
- covered bonds 4 48 12 145
- institutions and corporates with a short-term credit assessment - - - -
- collective investments undertakings (CIU) - - - -
- equity 5 59 4 54
- other items 9 106 6 72
Credit Value Adjustment Risk 130 1,625 172 2,153
Market risk 346 4,329 447 5,589
- trading book, Internal Approach 231 2,887 298 3,720
- trading book, Standardised Approach1 108 1,350 139 1,743
- banking book, Standardised Approach 7 92 10 126
Operational risk 338 4,229 366 4,579
Standardised 338 4,229 366 4,579
Additional risk exposure amount, Article 3 CRR 23 286 - -
Sub total 3,550 44,378 4,044 50,552
Adjustment for Basel I floor
Additional capital requirement according to Basel I floor 1,105 13,810 862 10,776
Total 4,655 58,188 4,906 61,328 1 Market Risk - of which trading book, Standardised Approach has been restated in 2014

Nordea Bank Finland Plc . Annual Report 2015 95
Note 37 Capital adequacy, cont. Minimum capital requirement and REA Parent company
31 Dec 2015 31 Dec 2014
EURm
Minimum capital
requirement REA
Minimum capital
requirement REA
Credit risk 2,372 29,650 2,737 34,223
- of which counterparty credit risk 586 7,330 663 8,285
IRB 1,767 22,092 1,959 24,486
- corporate 1,104 13,795 1,248 15,599
- advanced 812 10,149 489 6,115
- foundation 292 3,646 759 9,484
- institutions 294 3,682 356 4,457
- retail 361 4,514 337 4,215
- secured by immovable property collateral 216 2,698 184 2,300
- other retail 145 1,816 153 1,916
- other 8 101 17 215
Standardised 605 7,558 779 9,736
- central governments or central banks 7 85 16 205
- regional governments or local authorities 13 166 14 170
- public sector entities 2 29 2 20
- multilateral development banks 0 0 - -
- international organisations - - - -
- institutions 538 6,725 700 8,742
- corporate 1 16 1 8
- retail 4 46 4 56
- secured by mortgages on immovable property - - - -
- in default 0 0 0 1
- associated with particularly high risk - - - -
- covered bonds 4 48 10 122
- institutions and corporates with a short-term credit assessment - - - -
- collective investments undertakings (CIU) - - - -
- equity 28 343 27 343
- other items 8 100 5 69
Credit Value Adjustment Risk 130 1,625 172 2,153
Market risk 346 4,328 447 5,586
- trading book, Internal Approach 231 2,887 298 3,720
- trading book, Standardised Approach1 108 1,350 139 1,743
- banking book, Standardised Approach 7 91 10 123
Operational risk 293 3,666 324 4,045
Standardised 293 3,666 324 4,045
Additional risk exposure amount, Article 3 CRR 21 252 - -
Sub total 3,162 39,521 3,680 46,008
Adjustment for Basel I floor
Additional capital requirement according to Basel I floor 966 12,079 704 8,807
Total 4,128 51,600 4,384 54,814 1 Market Risk - of which trading book, Standardised Approach has been restated in 2014
Nordea Bank AB (publ) has in December 2012 issued a guarantee in favour of Nordea Bank Finland Plc where Nordea Bank AB (publ) guarantees part of the exposures in the exposure class IRB corporate in Nordea Bank Finland Plc. The net effect of the guarantee in REA in Nordea Bank Finland Plc was EUR -2,9bn as at the end of 2015 (-3.7).

Nordea Bank Finland Plc . Annual Report 2015 96
Note 37 Capital adequacy, cont. Leverage ratio
Group Parent company
31 Dec 2015 31 Dec 2014 31 Dec 2015 31 Dec 2014
Tier 1 capital, transitional definition, EURm1 11,548 9,004 10,926 8,458
Leverage ratio exposure, EURm 255,891 269,431 255,589 268,340
Leverage ratio, percentage 4.5 3.3 4.3 3.2 1 Including profit of the period REA and capital requirements for market risk, 31 December 2015 Group Trading book, IM Trading book, SA Banking book, SA Total
EURm REA Capital
requirement REA Capital
requirement REA Capital
requirement REA Capital
requirement
Interest rate risk1 1,224 98 1,108 88 2,332 186
Equity risk 327 26 220 18 547 44
Foreign exchange risk 205 17 92 7 297 24
Commodity risk 22 2 22 2
Settlement risk 0 0 0 0
Diversification effect -660 -53 -660 -53
Stressed Value-at-Risk 957 77 957 77
Incremental Risk Measure 382 30 382 30
Comprehensive Risk Measure 452 36 452 36
Total 2,887 231 1,350 108 92 7 4,329 346 1 Interest rate risk in the column Trading book IM includes both general and specific interest rate risk which is elsewhere referred to as interest rate VaR and credit spread VaR. Parent company Trading book, IM Trading book, SA Banking book, SA Total
EURm REA Capital
requirement REA Capital
requirement REA Capital
requirement REA Capital
requirement
Interest rate risk1 1,224 98 1,108 89 2,332 187
Equity risk 328 27 220 17 548 44
Foreign exchange risk 205 17 91 7 296 24
Commodity risk 22 2 22 2
Settlement risk 0 0 0 0
Diversification effect -660 -53 -660 -53
Stressed Value-at-Risk 957 76 957 76
Incremental Risk Measure 381 30 381 30
Comprehensive Risk Measure 452 36 452 36
Total 2,887 231 1,350 108 91 7 4,328 346 1 Interest rate risk in the column Trading book IM includes both general and specific interest rate risk which is elsewhere referred to as interest rate VaR and credit spread VaR. The main features of the capital instruments issued by NBF are presented on the internet at www.nordea.com/investor relations. Specification over group undertakings consolidated in the Nordea Bank Finland Group
31 Dec 2015 Number of
shares
Carrying amount EURm
Voting power of
holding, % Domicile Consolidation
method
Group undertakings included in the NBF Group
Nordea Finance Finland Ltd 1,000,000 306 100 Helsinki purchase method
Other companies 3
Total included in the capital base 309
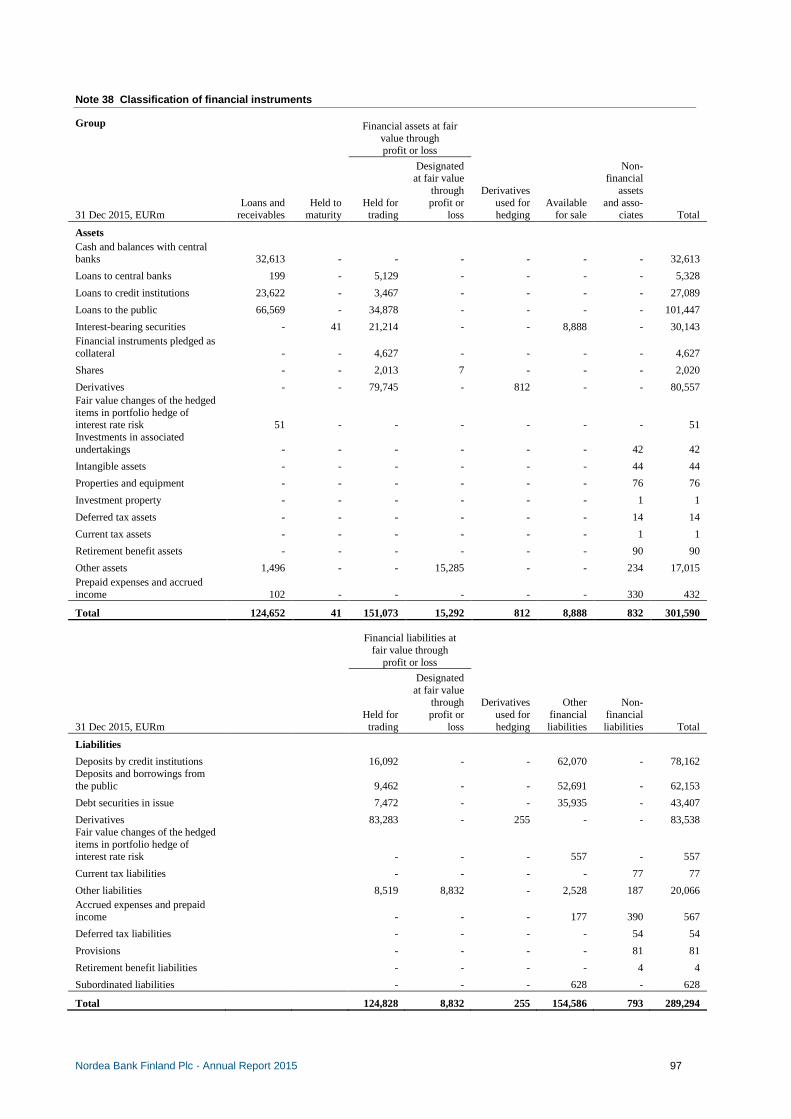
Nordea Bank Finland Plc . Annual Report 2015 97
Note 38 Classification of financial instruments
Group Financial assets at fair value through profit or loss
31 Dec 2015, EURm Loans and
receivables Held to
maturity Held for trading
Designated at fair value
through profit or
loss
Derivatives used for hedging
Available for sale
Non-financial
assets and asso-
ciates Total
Assets Cash and balances with central banks 32,613 - - - - - - 32,613
Loans to central banks 199 - 5,129 - - - - 5,328
Loans to credit institutions 23,622 - 3,467 - - - - 27,089
Loans to the public 66,569 - 34,878 - - - - 101,447
Interest-bearing securities - 41 21,214 - - 8,888 - 30,143 Financial instruments pledged as collateral - - 4,627 - - - - 4,627
Shares - - 2,013 7 - - - 2,020
Derivatives - - 79,745 - 812 - - 80,557 Fair value changes of the hedged items in portfolio hedge of interest rate risk 51 - - - - - - 51 Investments in associated undertakings - - - - - - 42 42
Intangible assets - - - - - - 44 44
Properties and equipment - - - - - - 76 76
Investment property - - - - - - 1 1
Deferred tax assets - - - - - - 14 14
Current tax assets - - - - - - 1 1
Retirement benefit assets - - - - - - 90 90
Other assets 1,496 - - 15,285 - - 234 17,015 Prepaid expenses and accrued income 102 - - - - - 330 432
Total 124,652 41 151,073 15,292 812 8,888 832 301,590
Financial liabilities at fair value through
profit or loss
31 Dec 2015, EURm Held for trading
Designated at fair value
through profit or
loss
Derivatives used for hedging
Other financial liabilities
Non-financial liabilities Total
Liabilities
Deposits by credit institutions 16,092 - - 62,070 - 78,162 Deposits and borrowings from the public 9,462 - - 52,691 - 62,153
Debt securities in issue 7,472 - - 35,935 - 43,407
Derivatives 83,283 - 255 - - 83,538 Fair value changes of the hedged items in portfolio hedge of interest rate risk - - - 557 - 557
Current tax liabilities - - - - 77 77
Other liabilities 8,519 8,832 - 2,528 187 20,066 Accrued expenses and prepaid income - - - 177 390 567
Deferred tax liabilities - - - - 54 54
Provisions - - - - 81 81
Retirement benefit liabilities - - - - 4 4
Subordinated liabilities - - - 628 - 628
Total 124,828 8,832 255 154,586 793 289,294

Nordea Bank Finland Plc . Annual Report 2015 98
Note 38 Classification of financial instruments, cont.
Group Financial assets at fair value through profit or loss
31 Dec 2014, EURm Loans and
receivables Held to
maturity Held for trading
Designated at fair value
through profit or
loss
Derivatives used for hedging
Available for sale
Non-financial
assets and asso-
ciates Total
Assets Cash and balances with central banks 28,846 - - - - - - 28,846
Loans to central banks 18 - 282 - - - - 300
Loans to credit institutions 29,565 - 5,486 - - - - 35,051
Loans to the public 68,971 - 44,777 - - - - 113,748
Interest-bearing securities - 66 22,772 - - 11,805 - 34,643 Financial instruments pledged as collateral - - 11,058 - - - - 11,058
Shares - - 1,911 7 - - - 1,918
Derivatives - - 104,312 - 942 - - 105,254 Fair value changes of the hedged items in portfolio hedge of interest rate risk 76 - - - - - - 76 Investments in associated undertakings - - - - - - 39 39
Intangible assets - - - - - - 47 47
Properties and equipment - - - - - - 84 84
Investment property - - - - - - 2 2
Deferred tax assets - - - - - - 43 43
Current tax assets - - - - - - 0 0
Retirement benefit assets - - - - - - 25 25
Other assets 1,337 - - 12,977 - - 310 14,624 Prepaid expenses and accrued income 121 - - - - - 319 440
Total 128,934 66 190,598 12,984 942 11,805 869 346,198
Financial liabilities at fair value through
profit or loss
31 Dec 2014, EURm Held for trading
Designated at fair value
through profit or
loss
Derivatives used for hedging
Other financial liabilities
Non-financial liabilities Total
Liabilities
Deposits by credit institutions 26,194 - - 61,174 - 87,368 Deposits and borrowings from the public 24,286 - - 52,593 - 76,879
Debt securities in issue 8,502 - - 39,970 - 48,472
Derivatives 102,564 - 312 - - 102,876 Fair value changes of the hedged items in portfolio hedge of interest rate risk - - - 773 - 773
Current tax liabilities - - - - 41 41
Other liabilities 6,273 10,061 - 2,034 209 18,577 Accrued expenses and prepaid income - - - 193 611 804
Deferred tax liabilities - - - - 57 57
Provisions - - - - 85 85
Retirement benefit liabilities - - - - 28 28
Subordinated liabilities - - - 620 - 620
Total 167,819 10,061 312 157,357 1,031 336,580

Nordea Bank Finland Plc . Annual Report 2015 99
Note 38 Classification of financial instruments, cont.
Parent company Financial assets at fair value through profit or loss
31 Dec 2015, EURm Loans and
receivables Held to
maturity Held for trading
Designated at fair value
through profit or
loss
Derivatives used for hedging
Available for sale
Non-financial
assets and asso-
ciates Total
Assets Cash and balances with central banks 32,613 - - - - - - 32,613
Loans to central banks - - 5,129 - - - - 5,129
Loans to credit institutions 30,040 - 3,467 - - - - 33,507
Loans to the public 59,185 - 34,878 - - - - 94,063
Interest-bearing securities - 41 21,214 - - 8,888 - 30,143 Financial instruments pledged as collateral - - 4,627 - - - - 4,627
Shares - - 2,012 7 - - - 2,019
Derivatives - - 79,745 - 812 - - 80,557 Fair value changes of the hedged items in portfolio hedge of interest rate risk 51 - - - - - - 51 Investments in group undertakings - - - - - - 309 309 Investments in associated undertakings - - - - - - 28 28
Intangible assets - - - - - - 31 31
Properties and equipment - - - - - - 69 69
Investment property - - - - - - 1 1
Deferred tax assets - - - - - - 12 12
Current tax assets - - - - - - - -
Retirement benefit assets - - - - - - 90 90
Other assets 1,459 - - 15,285 - - 226 16,970 Prepaid expenses and accrued income 92 - - - - - 171 263
Total 123,440 41 151,072 15,292 812 8,888 937 300,482
Financial liabilities at fair value through
profit or loss
31 Dec 2015, EURm Held for trading
Designated at fair value
through profit or
loss
Derivatives used for hedging
Other financial liabilities
Non-financial liabilities Total
Liabilities
Deposits by credit institutions 16,092 - - 62,080 - 78,172 Deposits and borrowings from the public 9,462 - - 52,688 - 62,150
Debt securities in issue 7,472 - - 35,935 - 43,407
Derivatives 83,282 - 256 - - 83,538 Fair value changes of the hedged items in portfolio hedge of interest rate risk - - - 557 - 557
Current tax liabilities - - - - 77 77
Other liabilities 8,519 8,832 - 2,409 96 19,856 Accrued expenses and prepaid income - - - 96 286 382
Deferred tax liabilities - - - - - -
Provisions - - - - 78 78
Retirement benefit liabilities - - - - 4 4
Subordinated liabilities - - - 628 - 628
Total 124,827 8,832 256 154,393 541 288,849

Nordea Bank Finland Plc . Annual Report 2015 100
Note 38 Classification of financial instruments, cont.
Parent company Financial assets at fair value through profit or loss
31 Dec 2014, EURm Loans and
receivables Held to
maturity Held for trading
Designated at fair value
through profit or
loss
Derivatives used for hedging
Available for sale
Non-financial
assets and asso-
ciates Total
Assets Cash and balances with central banks 28,846 - - - - - - 28,846
Loans to central banks 18 - 282 - - - - 300
Loans to credit institutions 35,305 - 5,486 - - - - 40,791
Loans to the public 61,862 - 44,777 - - - - 106,639
Interest-bearing securities - 66 22,772 - - 11,805 - 34,643 Financial instruments pledged as collateral - - 11,058 - - - - 11,058
Shares - - 1,910 7 - - - 1,917
Derivatives - - 104,312 - 942 - - 105,254 Fair value changes of the hedged items in portfolio hedge of interest rate risk 76 - - - - - - 76 Investments in group undertakings - - - - - - 308 308 Investments in associated undertakings - - - - - - 28 28
Intangible assets - - - - - - 35 35
Properties and equipment - - - - - - 71 71
Investment property - - - - - - 2 2
Deferred tax assets - - - - - - 41 41
Current tax assets - - - - - - - -
Retirement benefit assets - - - - - - 25 25
Other assets 1,308 - - 12,977 - - 301 14,586 Prepaid expenses and accrued income 112 - - - - - 147 259
Total 127,527 66 190,597 12,984 942 11,805 958 344,879
Financial liabilities at fair value through
profit or loss
31 Dec 2014, EURm Held for trading
Designated at fair value
through profit or
loss
Derivatives used for hedging
Other financial liabilities
Non-financial liabilities Total
Liabilities
Deposits by credit institutions 26,194 - - 60,934 - 87,128 Deposits and borrowings from the public 24,286 - - 52,587 - 76,873
Debt securities in issue 8,502 - - 39,970 - 48,472
Derivatives 102,564 - 312 - - 102,876 Fair value changes of the hedged items in portfolio hedge of interest rate risk - - - 773 - 773
Current tax liabilities - - - - 39 39
Other liabilities 6,273 10,061 - 1,908 128 18,370 Accrued expenses and prepaid income - - - 110 501 611
Deferred tax liabilities - - - - - -
Provisions - - - - 82 82
Retirement benefit liabilities - - - - 25 25
Subordinated liabilities - - - 620 - 620
Total 167,819 10,061 312 156,902 775 335,869

Nordea Bank Finland Plc . Annual Report 2015 101
Note 39 Assets and liabilities at fair value
Fair value of financial assets and liabilities Group
31 Dec 2015 31 Dec 2014
EURm Carrying amount Fair value Carrying amount Fair value
Financial assets Cash and balances with central banks 32,613 32,613 28,846 28,846
Loans 133,915 133,622 149,175 147,950
Interest-bearing securities 30,143 30,145 34,643 34,647
Financial instruments pledged as collateral 4,627 4,627 11,058 11,058 Shares 2,020 2,020 1,918 1,918
Derivatives 80,557 80,557 105,254 105,254
Other assets 16,781 16,781 14,314 14,312
Prepaid expenses and accrued income 102 102 121 121
Total financial assets 300,758 300,467 345,329 344,106
Financial liabilities Deposits and debt instruments 184,279 184,260 213,492 213,727
Derivatives 83,538 83,538 102,876 102,876 Other liabilities 19,879 19,879 18,368 18,367
Accrued expenses and prepaid income 177 177 193 193
Subordinated liabilities 628 628 620 620
Total financial liabilities 288,501 288,482 335,549 335,783
Parent company
31 Dec 2015 31 Dec 2014
EURm Carrying amount Fair value Carrying amount Fair value
Financial assets Cash and balances with central banks 32,613 32,613 28,846 28,846
Loans 132,749 132,311 147,806 146,678
Interest-bearing securities 30,143 30,145 34,643 34,647 Financial instruments pledged as collateral 4,627 4,627 11,058 11,058
Shares 2,019 2,019 1,917 1,917
Derivatives 80,557 80,557 105,254 105,254
Other assets 16,745 16,744 14,285 14,284 Prepaid expenses and accrued income 92 92 112 112
Total financial assets 299,545 299,108 343,921 342,796
Financial liabilities Deposits and debt instruments 184,286 184,267 213,246 213,480 Derivatives 83,538 83,538 102,876 102,876
Other liabilities 19,760 19,760 18,242 18,242
Accrued expenses and prepaid income 96 96 110 110
Subordinated liabilities 628 628 620 620
Total financial liabilities 288,308 288,289 335,094 335,328 For information about valuation of items measured at fair value on the balance sheet, see Note 1 and the section "Determination of fair values for items measured at fair value on the balance sheet" in this note. For information about valuation of items not measured at fair value on the balance sheet, see the section "Financial assets and liabilities not held at fair value on the balance sheet" in this note.

Nordea Bank Finland Plc . Annual Report 2015 102
Note 39 Assets and liabilities at fair value, cont.
Assets and liabilities at fair value on the balance sheet Group Categorisation into the fair value hierarchy
Quoted prices in active markets
for same instrument
Valuation technique using observable data
Valuation technique using non-observable
data
31 Dec 2015, EURm (Level 1) (Level 2) (Level 3) Total
Assets at fair value on the balance sheet1 Loans to central banks - 5,129 - 5,129
Loans to credit institutions - 3,467 - 3,467
Loans to the public - 34,878 - 34,878
Interest-bearing securities 12,381 17,662 59 30,102
Financial instruments pledged as collateral 3,279 1,348 - 4,627
Shares 1,647 301 72 2,020
Derivatives 211 78,684 1,662 80,557
Investment properties - 1 - 1
Other assets - 15,285 - 15,285
Total 17,518 156,755 1,793 176,066
Liabilities at fair value on the balance sheet1 Deposits by credit institutions - 16,092 - 16,092
Deposits and borrowings from the public - 9,462 - 9,462
Debt securities in issue2 - 7,472 - 7,472
Derivatives2 235 81,752 1,551 83,538
Other liabilities 6,739 10,612 - 17,351
Total 6,974 125,390 1,551 133,915 1 All items are measured at fair value on a recurring basis at the end of each reporting period. 2 For structured bonds the host contract and the embedded derivative are presented separately. The host contract is presented on the balance sheet as “Debt securities in issue” and the embedded derivative on the balance sheet as “Derivatives”. The total fair value of the structured bonds is EUR 7,411m, of which EUR 7,468m is categorised into Level 2 and EUR -57m into Level 3 in the fair value hierarchy.
Quoted prices in active markets
for same instrument
Valuation technique using observable data
Valuation technique using non-observable
data
31 Dec 2014, EURm (Level 1) (Level 2) (Level 3) Total
Assets at fair value on the balance sheet1 Loans to central banks - 282 - 282
Loans to credit institutions - 5,486 - 5,486
Loans to the public - 44,777 - 44,777
Interest-bearing securities 18,905 15,595 77 34,577
Financial instruments pledged as collateral 5,789 5,269 - 11,058
Shares 1,465 - 453 1,918
Derivatives 52 103,755 1,447 105,254
Investment properties - 2 - 2
Other assets - 12,977 - 12,977
Total 26,211 188,143 1,977 216,331
Liabilities at fair value on the balance sheet1 Deposits by credit institutions - 26,194 - 26,194
Deposits and borrowings from the public - 24,286 - 24,286
Debt securities in issue2 - 8,502 - 8,502
Derivatives2 39 101,199 1,638 102,876
Other liabilities 4,137 12,197 - 16,334
Total 4,176 172,378 1,638 178,192 1 All items are measured at fair value on a recurring basis at the end of each reporting period. 2 For structured bonds the host contract and the embedded derivative are presented separately. The host contract is presented on the balance sheet as “Debt securities in issue” and the embedded derivative on the balance sheet as “Derivatives”. The total fair value of the structured bonds is EUR 8,042m, of which EUR 7,686 is categorised into Level 2 and EUR 356m into Level 3 in the fair value hierarchy.
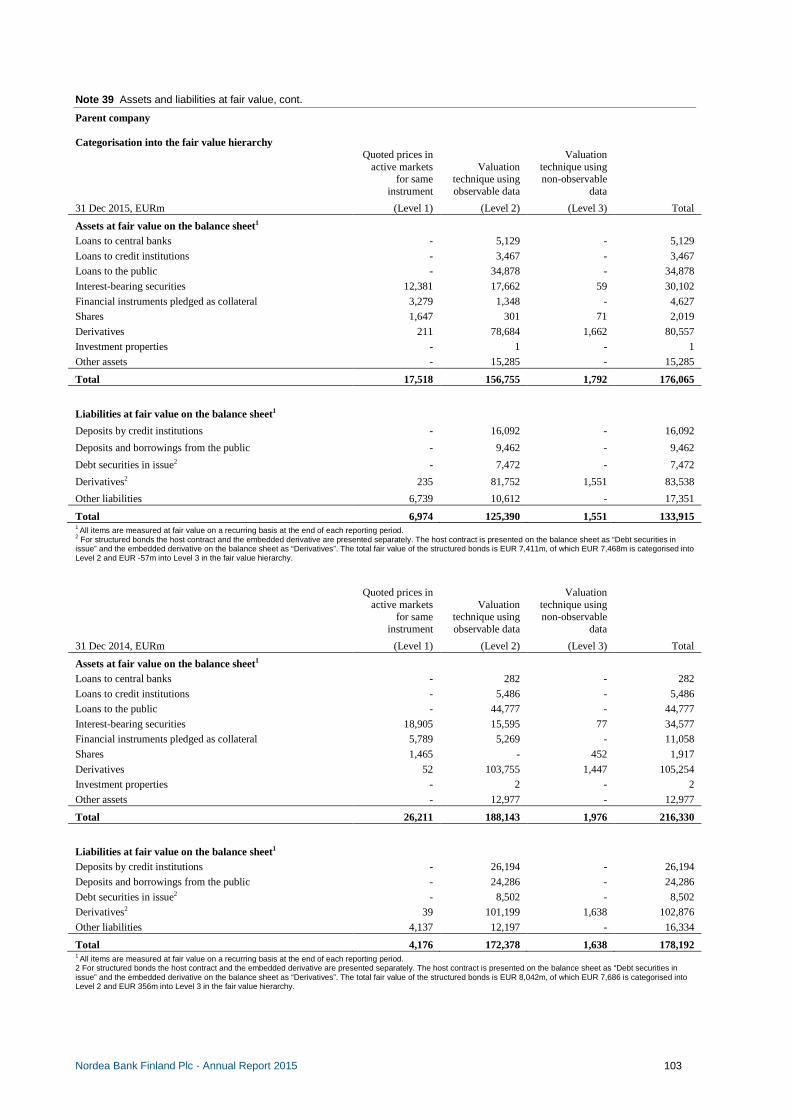
Nordea Bank Finland Plc . Annual Report 2015 103
Note 39 Assets and liabilities at fair value, cont.
Parent company Categorisation into the fair value hierarchy
Quoted prices in active markets
for same instrument
Valuation technique using observable data
Valuation technique using non-observable
data
31 Dec 2015, EURm (Level 1) (Level 2) (Level 3) Total
Assets at fair value on the balance sheet1 Loans to central banks - 5,129 - 5,129
Loans to credit institutions - 3,467 - 3,467
Loans to the public - 34,878 - 34,878
Interest-bearing securities 12,381 17,662 59 30,102
Financial instruments pledged as collateral 3,279 1,348 - 4,627
Shares 1,647 301 71 2,019
Derivatives 211 78,684 1,662 80,557
Investment properties - 1 - 1
Other assets - 15,285 - 15,285
Total 17,518 156,755 1,792 176,065
Liabilities at fair value on the balance sheet1
Deposits by credit institutions - 16,092 - 16,092
Deposits and borrowings from the public - 9,462 - 9,462
Debt securities in issue2 - 7,472 - 7,472
Derivatives2 235 81,752 1,551 83,538
Other liabilities 6,739 10,612 - 17,351
Total 6,974 125,390 1,551 133,915 1 All items are measured at fair value on a recurring basis at the end of each reporting period. 2 For structured bonds the host contract and the embedded derivative are presented separately. The host contract is presented on the balance sheet as “Debt securities in issue” and the embedded derivative on the balance sheet as “Derivatives”. The total fair value of the structured bonds is EUR 7,411m, of which EUR 7,468m is categorised into Level 2 and EUR -57m into Level 3 in the fair value hierarchy.
Quoted prices in
active markets for same
instrument
Valuation technique using observable data
Valuation technique using non-observable
data
31 Dec 2014, EURm (Level 1) (Level 2) (Level 3) Total
Assets at fair value on the balance sheet1 Loans to central banks - 282 - 282
Loans to credit institutions - 5,486 - 5,486
Loans to the public - 44,777 - 44,777
Interest-bearing securities 18,905 15,595 77 34,577
Financial instruments pledged as collateral 5,789 5,269 - 11,058
Shares 1,465 - 452 1,917
Derivatives 52 103,755 1,447 105,254
Investment properties - 2 - 2
Other assets - 12,977 - 12,977
Total 26,211 188,143 1,976 216,330
Liabilities at fair value on the balance sheet1 Deposits by credit institutions - 26,194 - 26,194
Deposits and borrowings from the public - 24,286 - 24,286
Debt securities in issue2 - 8,502 - 8,502
Derivatives2 39 101,199 1,638 102,876
Other liabilities 4,137 12,197 - 16,334
Total 4,176 172,378 1,638 178,192 1 All items are measured at fair value on a recurring basis at the end of each reporting period. 2 For structured bonds the host contract and the embedded derivative are presented separately. The host contract is presented on the balance sheet as “Debt securities in issue” and the embedded derivative on the balance sheet as “Derivatives”. The total fair value of the structured bonds is EUR 8,042m, of which EUR 7,686 is categorised into Level 2 and EUR 356m into Level 3 in the fair value hierarchy.

Nordea Bank Finland Plc . Annual Report 2015 104
Note 39 Assets and liabilities at fair value, cont.
Determination of fair values for items measured at fair value on the balance sheet Fair value measurements of assets and liabilities carried at fair value have been categorised under the three levels of the IFRS fair value hierarchy. The fair value hierarchy gives the highest priority to quoted prices (unadjusted) in active markets for identical assets or liabilities (Level 1) and the lowest priority to unobservable inputs (Level 3). The categorisation of these instruments is based on the lowest level input that is significant to the fair value measurement in its entirety.
Level 1 in the fair value hierarchy consists of assets and liabilities valued using unadjusted quoted prices in active markets for identical assets or liabilities. An active market for the asset or liability is a market in which transactions for the asset or liability occur with sufficient frequency and volume to provide pricing information on an on-going basis. This category includes listed derivatives, listed equities, government bonds in developed countries, and most liquid mortgage bonds and corporate bonds where direct tradable price quotes exist.
Level 2 in the fair value hierarchy consists of assets and liabilities that do not have directly quoted market prices available from active markets. The fair values are based on quoted prices for similar assets or liabilities in active markets or quoted prices for identical or similar assets or liabilities in markets that are not active. Alternatively, the fair values are estimated using valuation techniques or valuation models based on market prices or rates prevailing at the balance sheet date and where any unobservable inputs have had an insignificant impact on the fair values. This is the case for the majority of Nordea’s OTC derivatives, securities purchased/sold under resale/repurchase agreements, securities borrowed/lent and other instruments where active markets supply the input to the valuation techniques or models.
Level 3 in the fair value hierarchy consists of those types of assets and liabilities for which fair values cannot be obtained directly from quoted market prices or indirectly using valuation techniques or models supported by observable market prices or rates. This is generally the case for investments in unlisted securities, private equity funds, hedge funds, investment properties, more complex OTC derivatives where unobservable input have a significant impact on the fair values, certain complex or structured financial instruments and illiquid interest bearing securities. Complex valuation models are generally characterised by the use of unobservable and model specific parameters.
All valuation models, both complex and simple models, make use of market parameters. These parameters comprise interest rates, volatilities, correlations etc. Some of these parameters are observable while others are not. For non-exotic currencies the interest rates are all observable, and the volatilities and the correlations of the interest rates and FX rates are observable up to a certain maturity. Volatilities and correlations are also observable for the most liquid equity instruments in the short end. For less liquid equity instruments the option market is fairly illiquid, and hence the volatilities and correlations are unobservable. For each instrument the sensitivity towards unobservable parameters is measured. If the impact from unobservable parameters on the valuation is significant, the instrument is categorised as Level 3 in the fair value hierarchy.
For interest-bearing securities the categorisation into the three levels are based on the internal pricing methodology. These instruments can either be directly quoted in active markets (Level 1) or measured using a methodology giving a quote based on observable inputs (Level 2). Level 3 bonds are characterised by illiquidity.
For OTC derivatives valuation models are used for establishing fair value. For collateralised contracts OIS interest rates are used for discounting. These rates are observable in the market. The valuation is in addition based on several other market parameters, depending on the nature of the contract. Complex valuation models are used for more exotic OTC derivatives. The models are usually in-house developed, and based on assumptions about the behaviour of the underlying asset and statistical scenario analysis. As mentioned above, OTC derivatives are generally categorised as Level 2 in the fair value hierarchy and all significant model parameters are thus observable in active markets. For vanilla derivatives, standard models like e.g. Black-Scholes are used for valuation.
Valuations of Private Equity Funds (PEF) and unlisted equity instruments are by nature more uncertain than valuations of more actively traded equity instruments. Emphasis is put on using a consistent approach across all assets and over time. The methods used are consistent with the guideline “International Private Equity and Venture Capital Valuation Guidelines” issued by EVCA (European Venture Capital Association). The EVCA guidelines are considered best practice in the PEF industry. For US based funds, similar methods are applied.
Fair value of financial assets and liabilities are generally calculated as the theoretical net present value of the individual instruments, based on independently sourced market parameters as described above, and assuming no risks and uncertainties. This calculation is supplemented by a portfolio adjustment.
Nordea incorporates credit valuation adjustments (CVA) and debit valuation adjustments (DVA) into derivative valuations. CVA and DVA reflect the impact on fair value of the counterparty's credit risk and Nordea’s own credit quality, respectively. Calculations are based on estimates of exposure at default, probability of default and recovery rates, on a counterparty basis.
Generally, exposure at default for CVA and DVA is based on expected exposure and estimated through the simulation of underlying risk factors. Where possible, probabilities of defaults (PDs) and recovery rates are sourced from the CDS markets. For counterparties where this information is not directly available, PDs and recovery rates are estimated using a cross sectional approach where the illiquid counterparties are mapped to comparable liquid CDS names. The impact of funding costs and funding benefits on valuation of uncollateralised and imperfectly collateralised derivatives is recognised as a funding fair valuation adjustment (FFVA). In 2015, Nordea developed its FFVA framework to incorporate an estimated funding curve which reflects the market cost of funding. Since FFVA is a newly developing market practice, Nordea is continuously monitoring the market practices, and consequently reviewing and developing the methodology in use. Another important part of the portfolio adjustment serves to adjust the net open market risk exposures from mid-prices to ask or bid prices (depending on the net position). For different risk categories, exposures are aggregated and netted according to internal guidelines and aggregated market price information on bid-ask spreads are applied in the calculation. Spreads are updated on a regular basis.
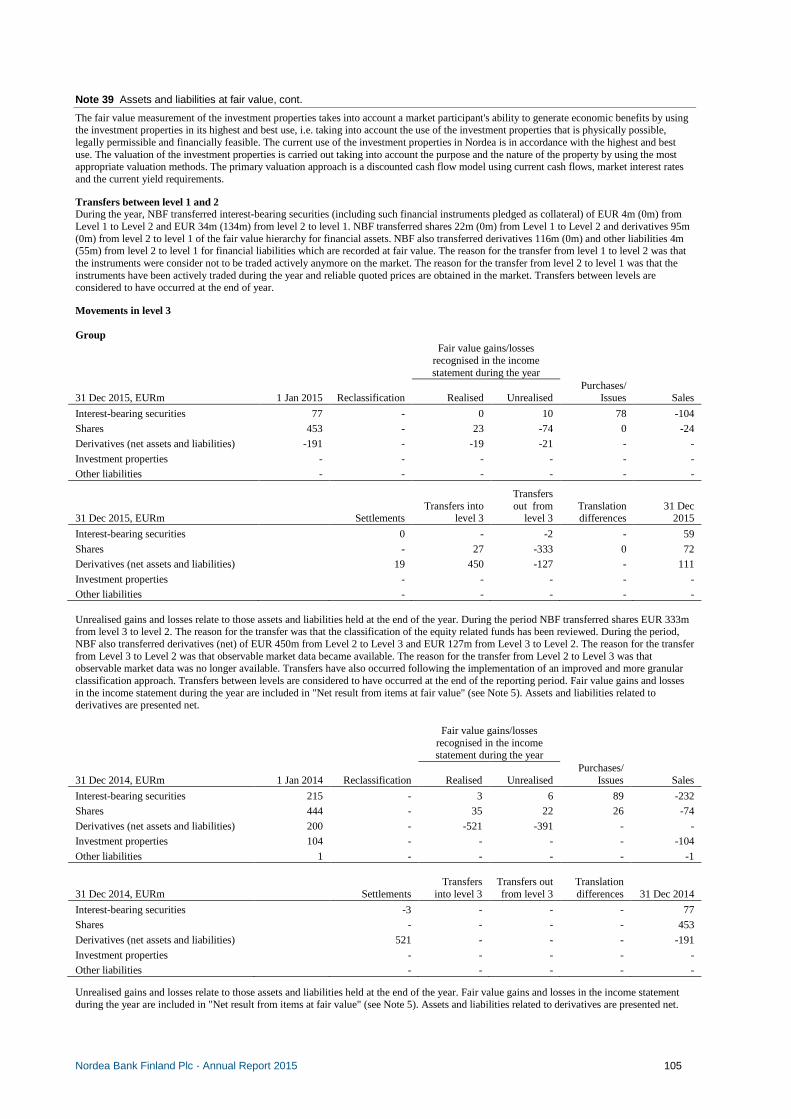
Nordea Bank Finland Plc . Annual Report 2015 105
Note 39 Assets and liabilities at fair value, cont.
The fair value measurement of the investment properties takes into account a market participant's ability to generate economic benefits by using the investment properties in its highest and best use, i.e. taking into account the use of the investment properties that is physically possible, legally permissible and financially feasible. The current use of the investment properties in Nordea is in accordance with the highest and best use. The valuation of the investment properties is carried out taking into account the purpose and the nature of the property by using the most appropriate valuation methods. The primary valuation approach is a discounted cash flow model using current cash flows, market interest rates and the current yield requirements. Transfers between level 1 and 2 During the year, NBF transferred interest-bearing securities (including such financial instruments pledged as collateral) of EUR 4m (0m) from Level 1 to Level 2 and EUR 34m (134m) from level 2 to level 1. NBF transferred shares 22m (0m) from Level 1 to Level 2 and derivatives 95m (0m) from level 2 to level 1 of the fair value hierarchy for financial assets. NBF also transferred derivatives 116m (0m) and other liabilities 4m (55m) from level 2 to level 1 for financial liabilities which are recorded at fair value. The reason for the transfer from level 1 to level 2 was that the instruments were consider not to be traded actively anymore on the market. The reason for the transfer from level 2 to level 1 was that the instruments have been actively traded during the year and reliable quoted prices are obtained in the market. Transfers between levels are considered to have occurred at the end of year. Movements in level 3 Group
Fair value gains/losses recognised in the income statement during the year
31 Dec 2015, EURm 1 Jan 2015 Reclassification Realised Unrealised Purchases/
Issues Sales
Interest-bearing securities 77 - 0 10 78 -104
Shares 453 - 23 -74 0 -24
Derivatives (net assets and liabilities) -191 - -19 -21 - -
Investment properties - - - - - -
Other liabilities - - - - - -
31 Dec 2015, EURm Settlements Transfers into
level 3
Transfers out from
level 3 Translation differences
31 Dec 2015
Interest-bearing securities 0 - -2 - 59
Shares - 27 -333 0 72
Derivatives (net assets and liabilities) 19 450 -127 - 111
Investment properties - - - - -
Other liabilities - - - - - Unrealised gains and losses relate to those assets and liabilities held at the end of the year. During the period NBF transferred shares EUR 333m from level 3 to level 2. The reason for the transfer was that the classification of the equity related funds has been reviewed. During the period, NBF also transferred derivatives (net) of EUR 450m from Level 2 to Level 3 and EUR 127m from Level 3 to Level 2. The reason for the transfer from Level 3 to Level 2 was that observable market data became available. The reason for the transfer from Level 2 to Level 3 was that observable market data was no longer available. Transfers have also occurred following the implementation of an improved and more granular classification approach. Transfers between levels are considered to have occurred at the end of the reporting period. Fair value gains and losses in the income statement during the year are included in "Net result from items at fair value" (see Note 5). Assets and liabilities related to derivatives are presented net.
Fair value gains/losses recognised in the income statement during the year
31 Dec 2014, EURm 1 Jan 2014 Reclassification Realised Unrealised Purchases/
Issues Sales
Interest-bearing securities 215 - 3 6 89 -232
Shares 444 - 35 22 26 -74
Derivatives (net assets and liabilities) 200 - -521 -391 - -
Investment properties 104 - - - - -104
Other liabilities 1 - - - - -1
31 Dec 2014, EURm Settlements Transfers
into level 3 Transfers out from level 3
Translation differences 31 Dec 2014
Interest-bearing securities -3 - - - 77
Shares - - - - 453
Derivatives (net assets and liabilities) 521 - - - -191
Investment properties - - - - -
Other liabilities - - - - -
Unrealised gains and losses relate to those assets and liabilities held at the end of the year. Fair value gains and losses in the income statement during the year are included in "Net result from items at fair value" (see Note 5). Assets and liabilities related to derivatives are presented net.

Nordea Bank Finland Plc . Annual Report 2015 106
Note 39 Assets and liabilities at fair value, cont.
Movements in level 3 Parent company
Fair value gains/losses recognised in the income statement during the year
31 Dec 2015, EURm 1 Jan 2015 Reclassification Realised Unrealised Purchases/
Issues Sales
Interest-bearing securities 77 - 0 10 78 -104
Shares 452 - 23 -74 0 -24
Derivatives (net assets and liabilities) -191 - -19 -21 - -
Investment properties - - - - - -
Other liabilities - - - - - -
31 Dec 2015, EURm Settlements Transfers into
level 3 Transfers out from level 3
Translation differences
31 Dec 2015
Interest-bearing securities 0 - -2 - 59
Shares - 27 -333 - 71
Derivatives (net assets and liabilities) 19 450 -127 - 111
Investment properties - - - - -
Other liabilities - - - - - Unrealised gains and losses relate to those assets and liabilities held at the end of the year. During the period, NBF transferred shares EUR 333m from level 3 to level 2. The reason for the transfer was that the classification of the equity related funds has been reviewed. During the period, NBF also transferred derivatives (net) of EUR 450m from Level 2 to Level 3 and EUR 127m from Level 3 to Level 2. The reason for the transfer from Level 3 to Level 2 was that observable market data became available. The reason for the transfer from Level 2 to Level 3 was that observable market data was no longer available. Transfers have also occurred following the implementation of an improved and more granular classification approach. Transfers between levels are considered to have occurred at the end of the reporting period. Fair value gains and losses in the income statement during the year are included in "Net result from items at fair value" (see Note 5). Assets and liabilities related to derivatives are presented net. Parent company
Fair value gains/losses recognised in the income statement during the year
31 Dec 2014, EURm 1 Jan 2014 Reclassification Realised Unrealised Purchases/
Issues Sales
Interest-bearing securities 215 - 3 6 89 -232
Shares 444 - 35 22 26 -74
Derivatives (net assets and liabilities) 200 - -521 -391 - -
Investment properties 4 - - - - -4
Other liabilities 1 - - - - -1
31 Dec 2014, EURm Settlements Transfers into
level 3 Transfers out from level 3
Translation differences 31 Dec 2014
Interest-bearing securities -3 - - - 77
Shares - - - - 452
Derivatives (net assets and liabilities) 521 - - - -191
Investment properties - - - - -
Other liabilities - - - - -
Unrealised gains and losses relate to those assets and liabilities held at the end of the year. Fair value gains and losses in the income statement during the year are included in "Net result from items at fair value" (see Note 5). Assets and liabilities related to derivatives are presented net.

Nordea Bank Finland Plc . Annual Report 2015 107
Note 39 Assets and liabilities at fair value, cont.
The valuation processes for fair value measurements in level 3
Financial instruments Nordea has an independent specialised valuation control unit, Group Valuation Control (GVC). GVC has the responsibility of setting the Nordea valuation framework, as well as overseeing and independently assessing valuations of financial instruments held at fair value on Nordea´s balance sheet. GVC issues the Nordea Group Valuation Policy, which is approved by the Group Valuation Committee. The Group Valuation Committee governs valuation matters and also serves as an escalation point for valuation issues. Further escalation of valuation issues is addressed by the Assets and Liabilities Committee, which reports to the Board of Directors The valuation control process in Nordea consists of several steps. The first step is to determine the end of day (EOD) marking of mid-prices. It is the responsibility of the trading organisation to set correct prices used for the valuation process, these prices are either internally marked prices set by trading or externally sourced prices. These valuation prices and valuation approaches are then controlled and tested by independent control units. The cornerstone in the control process is the independent price verification (IPV). The IPV test comprises verification of the correctness of valuations by using independently sourced data that best reflects the market. Finally the results of valuation testing and valuations are analysed and any findings are escalated with valuation committees as decision bodies. The verification of the correctness of prices and other parameters is carried out daily. Third-party information, such as broker quotes and pricing services, is used as benchmark data in the verification. The quality of the benchmark data is assessed on a regular basis. This quality assessment is used in the measurement of the valuation uncertainty. The valuation adjustments at portfolio level and the deferrals of day 1 P/L on level 3 trades are calculated and reported on a monthly basis. The actual assessment of instruments in the fair value hierarchy is performed on a continuous basis. Valuation techniques and inputs used in the fair value measurements in level 3 Group and parent company
31 Dec 2015, EURm Fair value Valuation techniques Unobservable input Range of fair value
Interest-bearing securities
Mortgage and other credit institutions 59 Discounted cash flows Credit spread -4/4
Corporates 0 Discounted cash flows Credit spread -
Total 59
Shares
Private equity funds 2 Net asset value1
Hedge funds 38 Net asset value1
Credit Funds 26 Net asset value1
Other funds 1 Net asset value1
Other 5 -
Total2 72
Derivatives
Interest rate derivatives 159 Option model Correlations -26/19
Volatilities
Equity derivatives -23 Option model Correlations -26/19
Volatilities
Dividend
Foreign exchange derivatives -34 Option model Correlations +/-0
Volatilities
Credit derivatives -19 Credit derivate model Correlations -8/6
Recovery rates
Other 28 Option model Correlations +/-0
Volatilities
Total 111 1 The fair values are based on prices and net assets values delivered by external suppliers/custodians. The prices are fixed by the suppliers/custodians on the basis of the development in assets behind the investments. For private equity funds the dominant measurement methodology used by the suppliers/custodians, is consistent with the International Private Equity and Venture Capital Valuation (IPEV) guidelines issued by the EVCA (European Venture Capital Association). 2 Effects of reasonably possible alternative assumptions are EURm -4/4 (EURm -39/39).

Nordea Bank Finland Plc . Annual Report 2015 108
Note 39 Assets and liabilities at fair value, cont.
Valuation techniques and inputs used in the fair value measurements in level 3 Group and parent company
31 Dec 2014, EURm Fair value Valuation techniques Unobservable input Range of
fair value3
Interest-bearing securities
Municipalities and other public bodies - Discounted cash flows Credit spread -
Mortgage and other credit institutions 77 Discounted cash flows Credit spread -7/7
Corporates - Discounted cash flows Credit spread -
Other - - - -
Total 77
Other liabilities - Discounted cash flows Credit spread -
Total -
Shares
Private equity funds 318 Net asset value1
Hedge funds 129 Net asset value1
Credit Funds - Net asset value/market consensus1
Other funds - Net asset value/Fund prices1
Other 6 -
Total2 453
Derivatives
Interest rate derivatives 180 Option model Correlations -12/9
Volatilities
Equity derivatives -242 Option model Correlations -18/12
Volatilities
Dividend
Foreign exchange derivatives -31 Option model Correlations +/-0
Volatilities
Credit derivatives -129 Credit derivate model Correlations -10/9
Recovery rates
Other 31 Option model Correlations +/-0
Volatilities
Total -191 1 The fair values are based on prices and net assets values delivered by external suppliers/custodians. The prices are fixed by the suppliers/custodians on the basis of the development in assets behind the investments. For private equity funds the dominant measurement methodology used by the suppliers/custodians, is consistent with the International Private Equity and Venture Capital Valuation (IPEV) guidelines issued by the EVCA (European Venture Capital Association). 2 Effects of reasonably possible alternative assumptions are EURm -39/39 (EURm -36/36). 3 Range of fair value for derivatives 31 Dec 2013 was EURm -30/25 and for interest-bearing securities EURm -20/20.
The tables above show, for each class of assets and liabilities categorised in Level 3, the fair value, the valuation techniques used to estimate the fair value, significant unobservable inputs used in the valuation techniques and for financial assets and liabilities, the fair value sensitivity to changes in key assumptions. The column “range of fair value” in the tables above shows the sensitivity of the fair values of Level 3 financial instruments to changes in key assumptions. Where the exposure to an unobservable parameter is offset across different instruments then only the net impact is disclosed in the table. The range disclosed is likely to be greater than the true uncertainty in fair value of these instruments, as it is unlikely in practice that all unobservable parameters would be simultaneously at the extremes of their ranges of reasonably possible alternatives. The disclosure is neither predictive nor indicative of future movements in fair value. In order to calculate the sensitivity (range) in fair value of derivatives, a range of different modelling approaches are applied to determine an uncertainty interval around the reported fair value. The different approaches applied target various aspects of derivatives pricing. Two common components of derivative valuation models are volatility of underlying risk factors and correlation between the relevant risk factors. Each of these is addressed by applying different assumptions to input and/or the choice of modelling approach. Besides these common factors a number of asset class specific factors are addressed. These include equity dividend expectations, recovery assumptions for credit derivatives and inflation expectations. The fair values of derivatives are presented as the net of assets and liabilities. In order to calculate the sensitivity (range) in fair value of shares and interest-bearing securities, the fair value was increased and decreased within a total range of 2-10 percentage units depending on the valuation uncertainty and underlying assumptions. Higher ranges are applied to instruments with more uncertain valuations relative to actively traded instruments and underlying uncertainties in individual assumptions.

Nordea Bank Finland Plc . Annual Report 2015 109
Note 39 Assets and liabilities at fair value, cont.
Movements in deferred Day 1 profit or loss The transaction price for financial instruments in some cases differs from the fair value at initial recognition measured using a valuation model, mainly due to that the transaction price is not established in an active market. If there are significant unobservable inputs used in the valuation technique (Level 3), the financial instrument is recognised at the transaction price and any difference between the transaction price and fair value at initial recognition measured using a valuation model (Day 1 profit) is deferred. For more information see, Note 1 “Accounting policies”. The table below shows the aggregate difference yet to be recognised in the income statement at the beginning and end of the period and a reconciliation of how this aggregated difference has been changed during the year (movements in deferred Day 1 profit).
Group Parent company
31 Dec 31 Dec 31 Dec 31 Dec
Deferred day 1 profit - derivatives EURm 2015 2014 2015 2014
Amount at beginning of year -44 -41 -44 -41
Deferred profit/loss on new transactions -14 -15 -14 -15
Recognised in the income statement during the year 14 12 14 12
Subsequent move to observability 0 - 0 -
Amount at end of year -44 -44 -44 -44
Financial assets and liabilities not held at fair value on the balance sheet
Group
31 Dec 2015, EURm Carrying amount Fair value Level in fair
value hierarchy
Assets not held at fair value on the balance sheet
Cash and balances with central banks 32,613 32,613 3
Loans 90,441 90,149 3
Interest bearing-securities 41 42 2
Other assets and Prepaid expenses and accrued income 1,600 1,600 3
Total 124,695 124,404
Liabilities not held at fair value on the balance sheet Deposits and debt instruments 151,881 151,862 3
Other liabilities and Accrued expenses and prepaid income 2,705 2,705 3
Total 154,586 154,567
31 Dec 2014, EURm Carrying amount Fair value Level in fair
value hierarchy
Assets not held at fair value on the balance sheet
Cash and balances with central banks 28,846 28,846 3
Loans 98,630 97,405 3
Interest bearing-securities 66 70 1, 2, 3
Other assets and Prepaid expenses and accrued income 1,458 1,458 3
Total 129,000 127,779
Liabilities not held at fair value on the balance sheet
Deposits and debt instruments 155,130 155,364 3
Other liabilities and Accrued expenses and prepaid income 2,227 2,226 3
Total 157,357 157,590
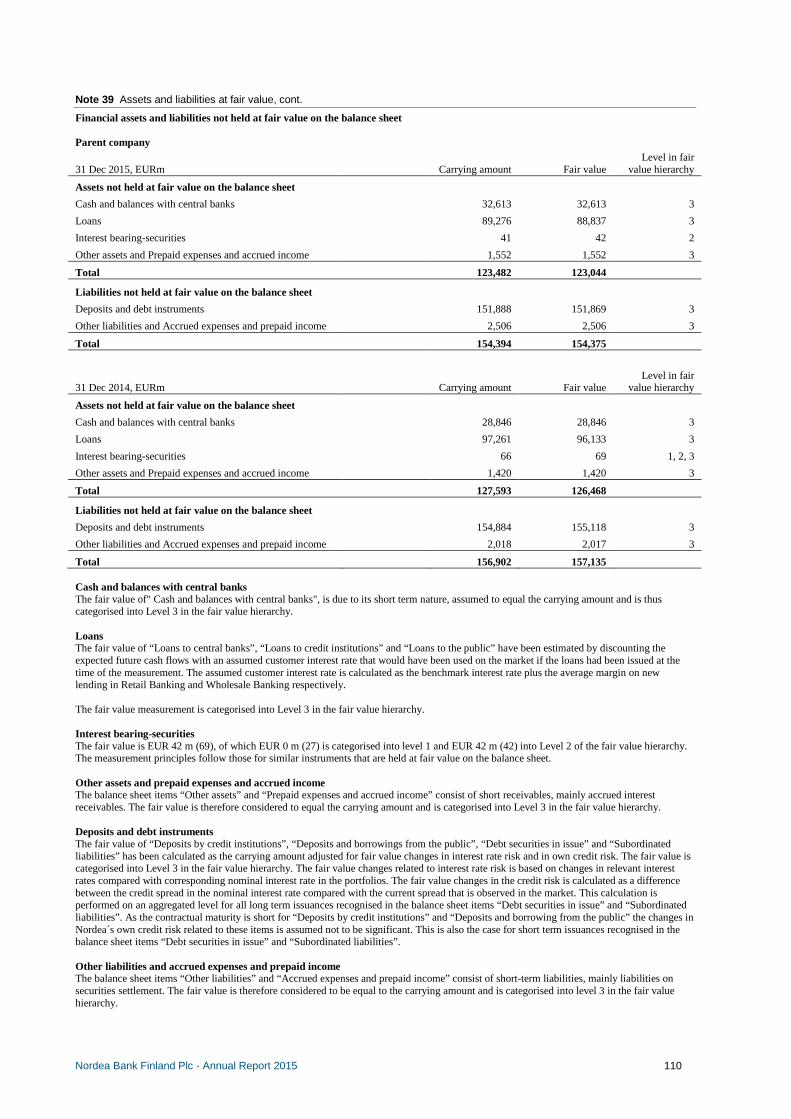
Nordea Bank Finland Plc . Annual Report 2015 110
Note 39 Assets and liabilities at fair value, cont.
Financial assets and liabilities not held at fair value on the balance sheet Parent company
31 Dec 2015, EURm Carrying amount Fair value Level in fair
value hierarchy
Assets not held at fair value on the balance sheet
Cash and balances with central banks 32,613 32,613 3
Loans 89,276 88,837 3
Interest bearing-securities 41 42 2
Other assets and Prepaid expenses and accrued income 1,552 1,552 3
Total 123,482 123,044
Liabilities not held at fair value on the balance sheet Deposits and debt instruments 151,888 151,869 3
Other liabilities and Accrued expenses and prepaid income 2,506 2,506 3
Total 154,394 154,375
31 Dec 2014, EURm Carrying amount Fair value Level in fair
value hierarchy
Assets not held at fair value on the balance sheet
Cash and balances with central banks 28,846 28,846 3
Loans 97,261 96,133 3
Interest bearing-securities 66 69 1, 2, 3
Other assets and Prepaid expenses and accrued income 1,420 1,420 3
Total 127,593 126,468
Liabilities not held at fair value on the balance sheet
Deposits and debt instruments 154,884 155,118 3
Other liabilities and Accrued expenses and prepaid income 2,018 2,017 3
Total 156,902 157,135 Cash and balances with central banks The fair value of" Cash and balances with central banks", is due to its short term nature, assumed to equal the carrying amount and is thus categorised into Level 3 in the fair value hierarchy. Loans The fair value of “Loans to central banks”, “Loans to credit institutions” and “Loans to the public” have been estimated by discounting the expected future cash flows with an assumed customer interest rate that would have been used on the market if the loans had been issued at the time of the measurement. The assumed customer interest rate is calculated as the benchmark interest rate plus the average margin on new lending in Retail Banking and Wholesale Banking respectively. The fair value measurement is categorised into Level 3 in the fair value hierarchy. Interest bearing-securities The fair value is EUR 42 m (69), of which EUR 0 m (27) is categorised into level 1 and EUR 42 m (42) into Level 2 of the fair value hierarchy. The measurement principles follow those for similar instruments that are held at fair value on the balance sheet. Other assets and prepaid expenses and accrued income The balance sheet items “Other assets” and “Prepaid expenses and accrued income” consist of short receivables, mainly accrued interest receivables. The fair value is therefore considered to equal the carrying amount and is categorised into Level 3 in the fair value hierarchy. Deposits and debt instruments The fair value of “Deposits by credit institutions”, “Deposits and borrowings from the public”, “Debt securities in issue” and “Subordinated liabilities” has been calculated as the carrying amount adjusted for fair value changes in interest rate risk and in own credit risk. The fair value is categorised into Level 3 in the fair value hierarchy. The fair value changes related to interest rate risk is based on changes in relevant interest rates compared with corresponding nominal interest rate in the portfolios. The fair value changes in the credit risk is calculated as a difference between the credit spread in the nominal interest rate compared with the current spread that is observed in the market. This calculation is performed on an aggregated level for all long term issuances recognised in the balance sheet items “Debt securities in issue” and “Subordinated liabilities”. As the contractual maturity is short for “Deposits by credit institutions” and “Deposits and borrowing from the public” the changes in Nordea´s own credit risk related to these items is assumed not to be significant. This is also the case for short term issuances recognised in the balance sheet items “Debt securities in issue” and “Subordinated liabilities”. Other liabilities and accrued expenses and prepaid income The balance sheet items “Other liabilities” and “Accrued expenses and prepaid income” consist of short-term liabilities, mainly liabilities on securities settlement. The fair value is therefore considered to be equal to the carrying amount and is categorised into level 3 in the fair value hierarchy.

Nordea Bank Finland Plc . Annual Report 2015 111
Note 40 Financial instruments set off on balance o r subject to netting agreements Group Amounts not set off but subject to master
netting agreements and similar agreements
31 Dec 2015, EURm
Gross recognised
financial assets1
Gross recognised
financial liabilities set off on
the balance sheet
Net carrying amount on the balance
sheet2 Financial
instruments
Financial collateral received
Cash collateral received Net amount
Assets
Derivatives 207,755 -127,466 80,290 -62,598 - -7,582 10,111
Reverse repurchase agreements 63,251 -9,888 53,362 -16,532 -36,631 - 199
Total 271,006 -137,354 133,652 -79,130 -36,631 -7,582 10,310
Amounts not set off but subject to master netting agreements and similar agreements
31 Dec 2015, EURm
Gross recognised
financial liabilities1
Gross recognised
financial assets set off on the
balance sheet
Net carrying amount on the balance
sheet2 Financial
instruments
Financial collateral pledged
Cash collateral pledged Net amount
Liabilities
Derivatives 210 312 -127 466 82 846 -62 598 - -12,390 7,859
Repurchase agreements 45 330 -9 888 35 442 -16 532 -18 875 - 36
Total 255 642 -137 354 118 288 -79 130 -18 875 -12,390 7,895 1 All amounts are measured at fair value. 2 Reverse repurchase agreements and Securities borrowing agreements are on the balance sheet classified as Loans to central banks, Loans to credit institutions or Loans to the public. Repurchase agreements and Securities lending agreements are on the balance sheet classified as Deposits by credit institution or as Deposits and borrowings from the public.
Group Amounts not set off but subject to master
netting agreements and similar agreements
31 Dec 2014, EURm
Gross recognised
financial assets1
Gross recognised
financial liabilities set off on
the balance sheet
Net carrying amount on the balance sheet2
Financial instruments
Financial collateral received
Cash collateral received Net amount
Assets
Derivatives 246,566 -141,495 105,071 -82,119 - -9,530 13,422
Reverse repurchase agreements 50,545 - 50,545 -19,750 -30,370 - 425
Total 297,111 -141,495 155,616 -101,869 -30,370 -9,530 13,847
Amounts not set off but subject to master netting agreements and similar agreements
31 Dec 2014, EURm
Gross recognised
financial liabilities1
Gross recognised
financial assets set off on the
balance sheet
Net carrying amount on the balance sheet2
Financial instruments
Financial collateral pledged
Cash collateral pledged Net amount
Liabilities
Derivatives 243,463 -141,495 101,968 -82,119 - -11,796 8,053
Repurchase agreements 50,480 - 50,480 -19,750 -29,096 - 1,634
Total 293,943 -141,495 152,448 -101,869 -29,096 -11,796 9,687 1 All amounts are measured at fair value. 2 Reverse repurchase agreements and Securities borrowing agreements are on the balance sheet classified as Loans to central banks, Loans to credit institutions or Loans to the public. Repurchase agreements and Securities lending agreements are on the balance sheet classified as Deposits by credit institutions or as Deposits and borrowings from the public.

Nordea Bank Finland Plc . Annual Report 2015 112
Note 40 Financial instruments set off on balance or subject to netting agreements, cont. Parent company Amounts not set off but subject to master
netting agreements and similar agreements
31 Dec 2015, EURm
Gross recognised
financial assets1
Gross recognised
financial liabilities set off on
the balance sheet
Net carrying amount on the balance
sheet2 Financial
instruments
Financial collateral received
Cash collateral received Net amount
Assets
Derivatives 207,755 -127,466 80,290 -62,598 - -7,582 10,111
Reverse repurchase agreements 63,251 -9,888 53,362 -16,532 -36,631 - 199
Total 271,006 -137,354 133,652 -79,130 -36,631 -7,582 10,310
Amounts not set off but subject to master netting agreements and similar agreements
31 Dec 2015, EURm
Gross recognised
financial liabilities1
Gross recognised
financial assets set off on the
balance sheet
Net carrying amount on the balance
sheet2 Financial
instruments
Financial collateral pledged
Cash collateral pledged Net amount
Liabilities
Derivatives 210,312 -127,466 82,846 -62,598 - -12,390 7,859
Repurchase agreements 45,330 -9,888 35,442 -16,532 -18,875 - 36
Total 255,642 -137,354 118,288 -79,130 -18,875 -12,390 7,895 1 All amounts are measured at fair value. 2 Reverse repurchase agreements and Securities borrowing agreements are on the balance sheet classified as Loans to central banks, Loans to credit institutions or Loans to the public. Repurchase agreements and Securities lending agreements are on the balance sheet classified as Deposits by credit institutions or as Deposits and borrowings from the public.
Parent company Amounts not set off but subject to master
netting agreements and similar agreements
31 Dec 2014, EURm
Gross recognised
financial assets1
Gross recognised
financial liabilities set off on
the balance sheet
Net carrying amount on the balance sheet2
Financial instruments
Financial collateral received
Cash collateral received Net amount
Assets
Derivatives 246,566 -141,495 105,071 -82,119 - -9,530 13,422
Reverse repurchase agreements 50,545 - 50,545 -19,750 -30,370 - 425
Total 297,111 -141,495 155,616 -101,869 -30,370 -9,530 13,847
Amounts not set off but subject to master netting agreements and similar agreements
31 Dec 2014, EURm
Gross recognised
financial liabilities1
Gross recognised
financial assets set off on the
balance sheet
Net carrying amount on the balance sheet2
Financial instruments
Financial collateral pledged
Cash collateral pledged Net amount
Liabilities
Derivatives 243,463 -141,495 101,968 -82,119 - -11,796 8,053
Repurchase agreements 50,480 - 50,480 -19,750 -29,096 - 1,634
Total 293,943 -141,495 152,448 -101,869 -29,096 -11,796 9,687 1 All amounts are measured at fair value. 2 Reverse repurchase agreements and Securities borrowing agreements are on the balance sheet classified as Loans to central banks, Loans to credit institutions or Loans to the public. Repurchase agreements and Securities lending agreements are on the balance sheet classified as Deposits by credit institutions or as Deposits and borrowings from the public.

Nordea Bank Finland Plc . Annual Report 2015 113
Note 40 Financial instruments set off on balance or subject to netting agreements, cont.
Enforceable master netting arrangements and similar agreements The fact that financial instruments are being accounted for on a gross basis on the balance sheet, would not imply that the financial instruments are not subject to master netting agreements or similar arrangements. Generally financial instruments (derivatives, repos and securities lending transactions), would be subject to master netting agreements, and as a consequence, Nordea would be allowed to benefit from netting both in the ordinary course of business and in the case of default towards its counter parties, in any calculations involving counterparty credit risk. The reason why the netted exposures are not reflected under assets and liabilities on the balance sheet, would in most instances depend on the limited application of net settlement of financial transactions. For a description of counterparty risk see section Risk, Liquidity and Capital management, counterparty credit risk, in the Board of Directors' report. Note 41 Transferred assets and obtained collateral s
Transferred assets that are not derecognised in their entirety and associated liabilities All assets transferred continue to be recognised on the balance sheet if Nordea is still exposed to changes in the fair value of the assets. This is the case for repurchase agreements and securities lending transactions. Repurchase agreements are a form of collateralised borrowing where Nordea sells securities with an agreement to repurchase them at a later date at a fixed price. The cash received is recognised as a deposit (liability). Securities delivered under repurchase agreements are not derecognised from the balance sheet. Securities lending transactions are transactions where Nordea lends securities it holds to a counterpart and receives a fee. As both repurchase agreements and securities lending transactions results in the securities are returned to Nordea, all risks and rewards of the instruments transferred is retained by Nordea, although they are not available for Nordea during the period they are transferred. The counterpart in the transactions holds the securities as collateral, but has no recourse to other assets in Nordea. The securities are still reported on the balance sheet and the corresponding liabilities are measured at fair value.
Group Parent company
31 Dec 31 Dec 31 Dec 31 Dec
EURm 2015 2014 2015 2014
Repurchase agreements
Interest-bearing securities 4,627 11,058 4,627 11,058
Total 4,627 11,058 4,627 11,058
Liabilities associated with the assets Group Parent company
31 Dec 31 Dec 31 Dec 31 Dec
EURm 2015 2014 2015 2014
Repurchase agreements
Deposits by credit institutions 2,706 6,399 2 706 6,399
Deposits and borrowings from the public 1,921 4,659 1 921 4,659
Total 4,627 11,058 4,627 11,058
Net 0 0 0 0 Obtained collaterals which are permitted to be sold or repledged NBF obtains collaterals under reverse repurchase and securities borrowing agreements which, under the terms of the agreements, can be sold or repledged. The transactions are conducted under standard agreements employed by financial markets participants. Generally, the agreements require additional collateral to be provided if the value of the securities falls below a predetermined level. Under standard terms for most repurchase transactions, the recipient of collateral has an unrestricted right to sell or repledge it, subject to returning equivalent securities on settlement of the transactions. The fair value of the securities obtained as collateral under reverse repurchase and securities borrowing agreements are disclosed below.
Group Parent company
31 Dec 31 Dec 31 Dec 31 Dec
EURm 2015 2014 2015 2014
Reverse repurchase agreements
Received collaterals which can be repledged or sold 40 915 48,465 40,915 48,465
- of which repledged or sold 19 660 38,733 19,660 38,733
Total 40 915 48,465 40,915 48,465

Nordea Bank Finland Plc . Annual Report 2015 114
Note 42 Maturity analysis for assets and liabiliti es
Group Expected maturity 31 Dec 2015 31 Dec 2014
Expected to be recovered
or settled: Expected to be recovered
or settled:
EURm Note Within 12
months After 12 months Total
Within 12 months
After 12 months Total
Cash and balances with central banks 32,613 - 32,613 28,846 - 28,846
Loans to central banks 13 5,328 - 5,328 300 - 300
Loans to credit institutions 13 20,929 6,160 27,089 26,051 9,000 35,051
Loans to the public 13 45,624 55,823 101,447 56,322 57,426 113,748
Interest-bearing securities 14 9,850 20,293 30,143 12,775 21,868 34,643
Financial instruments pledged as collateral 15 1,504 3,123 4,627 4,065 6,993 11,058
Shares 16 2,019 1 2,020 1,917 1 1,918
Derivatives 17 11,865 68,692 80,557 14,823 90,431 105,254
Fair value changes of the hedged items in portfolio hedge of interest rate risk 3 48 51 2 74 76
Investments in group undertakings 18 - - - - - -
Investments in associated undertakings 19 2 40 42 2 37 39
Intangible assets 20 8 36 44 6 41 47
Properties and equipment 6 70 76 7 77 84
Investment properties 22 - 1 1 - 2 2
Deferred tax assets 12 14 0 14 43 0 43
Current tax assets 12 1 - 1 0 - 0
Retirement benefit assets 31 - 90 90 - 25 25
Other assets 23 17,010 5 17,015 14,623 1 14,624
Prepaid expenses and accrued income 24 432 - 432 440 - 440
Total assets 147,208 154,382 301,590 160,222 185,976 346,198
Deposits by credit institutions 25 73,178 4,984 78,162 82,291 5,077 87,368
Deposits and borrowings from the public 26 61,486 667 62,153 76,646 233 76,879
Debt securities in issue 27 19,651 23,756 43,407 26,510 21,962 48,472
Derivatives 17 13,778 69,760 83,538 14,427 88,449 102,876
Fair value changes of the hedged items in portfolio hedge of interest rate risk 50 507 557 35 738 773
Current tax liabilities 12 77 - 77 41 - 41
Other liabilities 28 20,066 - 20,066 18,577 - 18,577
Accrued expenses and prepaid income 29 562 5 567 801 3 804
Deferred tax liabilities 12 36 18 54 41 16 57
Provisions 30 1 80 81 0 85 85
Retirement benefit liabilities 31 1 3 4 3 25 28
Subordinated liabilities 32 - 628 628 - 620 620
Total liabilities 188,886 100,408 289,294 219,372 117,208 336,580

Nordea Bank Finland Plc . Annual Report 2015 115
Note 42 Maturity analysis for assets and liabilities, cont.
Parent company Expected maturity 31 Dec 2015 31 Dec 2014
Expected to be recovered
or settled: Expected to be recovered
or settled:
EURm Note Within 12
months After 12 months Total
Within 12 months
After 12 months Total
Cash and balances with central banks 32,613 - 32,613 28,846 - 28,846
Loans to central banks 13 5,129 - 5,129 300 - 300
Loans to credit institutions 13 24,337 9,170 33,507 30,631 10,160 40,791
Loans to the public 13 41,145 52,918 94,063 52,012 54,627 106,639
Interest-bearing securities 14 9,850 20,293 30,143 12,775 21,868 34,643
Financial instruments pledged as collateral 15 1,504 3,123 4,627 4,065 6,993 11,058
Shares 16 2,019 - 2,019 1,917 - 1,917
Derivatives 17 11,865 68,692 80,557 14,822 90,432 105,254
Fair value changes of the hedged items in portfolio hedge of interest rate risk 3 48 51 2 74 76
Investments in group undertakings 18 - 309 309 - 308 308
Investments in associated undertakings 19 - 28 28 - 28 28
Intangible assets 20 - 31 31 - 35 35
Properties and equipment - 69 69 - 71 71
Investment properties 22 - 1 1 - 2 2
Deferred tax assets 12 12 - 12 41 - 41
Current tax assets 12 - - - - - -
Retirement benefit assets 31 - 90 90 - 25 25
Other assets 23 16,970 - 16,970 14,586 - 14,586
Prepaid expenses and accrued income 24 263 - 263 259 - 259
Total assets 145,710 154,772 300,482 160,256 184,623 344,879
Deposits by credit institutions 25 73,188 4,984 78,172 82,051 5,077 87,128
Deposits and borrowings from the public 26 61,483 667 62,150 76,646 227 76,873
Debt securities in issue 27 19,651 23,756 43,407 26,510 21,962 48,472
Derivatives 17 13,778 69,760 83,538 14,427 88,449 102,876
Fair value changes of the hedged items in portfolio hedge of interest rate risk 50 507 557 35 738 773
Current tax liabilities 12 77 - 77 39 - 39
Other liabilities 28 19,856 - 19,856 18,370 - 18,370
Accrued expenses and prepaid income 29 382 - 382 611 - 611
Deferred tax liabilities 12 - - - - - -
Provisions 30 - 78 78 - 82 82
Retirement benefit liabilities 31 - 4 4 - 25 25
Subordinated liabilities 32 - 628 628 - 620 620
Total liabilities 188,465 100,384 288,849 218,689 117,180 335,869

Nordea Bank Finland Plc . Annual Report 2015 116
Note 42 Maturity analysis for assets and liabilities, cont.
Contractual undiscounted cash flows
Group
31 Dec 2015, EURm Payable
on demand Maximum 3 months 3-12 months 1-5 years
More than 5 years Total
Interest-bearing financial assets 40,166 66,539 24,891 53,088 36,266 220,949
Non interest-bearing financial assets 99,511 99,511
Non-financial assets 832 832
Total assets 40,166 66,539 24,891 53,088 136,608 321,292
Interest-bearing financial liabilities 48,601 91,441 25,095 23,865 7,411 196,413
Non interest-bearing financial liabilities 104,152 104,152
Non-financial liabilities and equity 13,089 13,089
Total liabilities and equity 48,601 91,441 25,095 23,865 124,652 313,654
Derivatives, cash inflow 546,220 110,138 46,883 9,444 712,685
Derivatives, cash outflow 546,781 111,220 52,935 9,916 720,853
Net exposure 0 -561 -1,081 -6,052 -472 -8,167
Exposure -8,435 -25,463 -1,286 23,171 11,483 -529
Cumulative exposure -8,435 -33,898 -35,184 -12,013 -529
31 Dec 2014, EURm Payable
on demand Maximum 3 months 3-12 months 1-5 years
More than 5 years Total
Interest-bearing financial assets 30,571 69,519 35,671 60,185 37,974 233,920
Non interest-bearing financial assets 121,682 121,682
Non-financial assets 869 869
Total assets 30,571 69,519 35,671 60,185 160,525 356,471
Interest-bearing financial liabilities 46,057 106,000 34,041 23,669 6,025 215,792
Non interest-bearing financial liabilities 122,209 122,209
Non-financial liabilities and equity 10,649 10,649
Total liabilities and equity 46,057 106,000 34,041 23,669 138,883 348,650
Derivatives, cash inflow 460,348 126,316 221,216 69,384 877,264
Derivatives, cash outflow 480,726 124,947 212,268 70,075 888,017
Net exposure - -20,378 1,369 8,948 -691 -10,752
Exposure -15,486 -56,859 2,998 45,463 20,952 -2,932
Cumulative exposure -15,486 -72,345 -69,347 -23,883 -2,932

Nordea Bank Finland Plc . Annual Report 2015 117
Note 42 Maturity analysis for assets and liabilities, cont.
Contractual undiscounted cash flows
Parent company
31 Dec 2015, EURm Payable
on demand Maximum 3 months 3-12 months 1-5 years
More than 5 years Total
Interest-bearing financial assets 40,153 66,728 24,927 53,695 34,131 219,633
Non interest-bearing financial assets 99,859 99,859
Non-financial assets 541 541
Total assets 40,153 66,728 24,927 53,695 134,531 320,033
Interest-bearing financial liabilities 48,601 91,442 25,099 23,866 7,412 196,420
Non interest-bearing financial liabilities 103,952 103,952
Non-financial liabilities and equity 12,174 12,174
Total liabilities and equity 48,601 91,442 25,099 23,866 123,538 312,546
Derivatives, cash inflow 546,220 110,138 46,883 9,444 712,685
Derivatives, cash outflow 546,781 111,220 52,935 9,916 720,853
Net exposure 0 -561 -1,081 -6,052 -472 -8,167
Exposure -8,448 -25,275 -1,253 23,776 10,521 -680
Cumulative exposure -8,448 -33,723 -34,977 -11,201 -680
31 Dec 2014, EURm Payable
on demand Maximum 3 months 3-12 months 1-5 years
More than 5 years Total
Interest-bearing financial assets 29,728 70,756 35,183 58,635 37,565 231,866
Non interest-bearing financial assets 121,757 121,757
Non-financial assets 958 958
Total assets 29,728 70,756 35,183 58,635 160,280 354,582
Interest-bearing financial liabilities 45,986 105,721 33,911 22,990 6,671 215,279
Non interest-bearing financial liabilities 122,115 122,115
Non-financial liabilities and equity 9,785 9,785
Total liabilities and equity 45,986 105,721 33,911 22,990 138,570 347,179
Derivatives, cash inflow 460,348 126,316 221,216 69,384 877,264
Derivatives, cash outflow 480,726 124,947 212,268 70,075 888,017
Net exposure - -20,378 1,369 8,948 -691 -10,752
Exposure -16,258 -55,343 2,641 44,592 21,019 -3,350
Cumulative exposure -16,258 -71,602 -68,961 -24,369 -3,350 The table is based on contractual maturities for the balance sheet items. For derivatives, the expected cash inflows and outflows are disclosed for both derivative assets and derivative liabilities, as derivatives are managed on a net basis. In addition to the instruments on the balance sheet items, Nordea has credit commitments amounting to EUR 13,613m (16,021), which could be drawn on at any time. NBF has also issued guarantees of EUR 11,081 m (13,283) which may lead to future cash outflows if certain events occur.

Nordea Bank Finland Plc . Annual Report 2015 118
Note 43 Related-party transactions
Shareholders with significant influence and close family members to key management personnel in the Nordea Group as well as companies significantly influenced by key management personnel or by close family members to key management personnel in the Nordea Group are considered to be related parties to Nordea. Included in this group of related parties are Sampo Oyj and Aegon Asset Management. If transactions with related companies are made in Nordea's and the related companies' ordinary course of business and on the same criteria and terms as those for comparable transactions with parties of similar standing, and if they did not involve more than normal risk taking, the transactions are not included in the table. Nordea has thus not disclosed any transactions with shareholders with significant influence. Group
Nordea Group undertakings
Nordea Group associated undertakings Other related parties
31 Dec 31 Dec 31 Dec 31 Dec 31 Dec 31 Dec
EURm 2015 2014 2015 2014 2015 2014
Assets
Loans 25,580 31,145 164 185 - -
Interest-bearing securities 2,115 2,750 73 57 - -
Financial instruments pledged as collateral 286 1,823 - - - -
Derivatives 3,909 4,455 76 218 - -
Other assets 1,860 2,193 - - - -
Prepaid expenses and accrued income 14 24 - - - -
Total assets 33,764 42,390 313 460 - -
Liabilities
Deposits 47,061 52,794 4 106 11 1
Debt securities in issue 587 759 - 0 - -
Derivatives 5,925 7,398 112 154 - -
Subordinated liabilities 550 550 - - - -
Other liabilities 85 230 - - - -
Accrued expenses and deferred income 204 210 - - - -
Total liabilities 54,412 61,941 116 260 11 1
Off balance1 248,344 242,058 3,337 4,123 - - 1 Including nominal values on derivatives. Group
31 Dec 31 Dec 31 Dec 31 Dec 31 Dec 31 Dec
EURm 2015 2014 2015 2014 2015 2014
Net interest income 85 162 2 3 0 -
Net fee and commission income -454 -477 1 1 0 1
Net result from items at fair value 790 -1,237 246 -102 - -
Other operating income 18 76 0 0 - -
Total operating expenses -189 -194 0 0 - -
Profit before loan losses 250 -1,670 249 -98 0 1 Parent company
Group undertakings Associated undertakings Other related parties
31 Dec 31 Dec 31 Dec 31 Dec 31 Dec 31 Dec
EURm 2015 2014 2015 2014 2015 2014
Assets
Loans 32,004 36,892 142 121 - -
Interest-bearing securities 2,115 2,750 - - - -
Financial instruments pledged as collateral 286 1,823 - - - -
Derivatives 3,909 4,455 4 4 - -
Investments in associated undertakings - - 28 28 - -
Investments in group undertakings 309 309 - - - -
Other assets 1,860 2,032 - - - -
Prepaid expenses and accrued income 21 31 - - - -
Total assets 40,504 48,292 174 153 - -

Nordea Bank Finland Plc . Annual Report 2015 119
Note 43 Related-party transactions, cont.
Parent company Group undertakings Associated undertakings Other related parties
31 Dec 31 Dec 31 Dec 31 Dec 31 Dec 31 Dec
EURm 2015 2014 2015 2014 2015 2014
Liabilities
Deposits 47,071 52,553 4 1 11 1
Debt securities in issue 587 759 - - - -
Derivatives 5,925 7,398 - 0 - -
Subordinated liabilities 550 550 - - - -
Other liabilities 85 230 - - - -
Accrued expenses and deferred income 136 138 - - - -
Total liabilities 54,354 61,628 4 1 11 1
Off balance1 248,700 242,773 93 141 - - 1 Including nominal values on derivatives.
Parent company 31 Dec 31 Dec 31 Dec 31 Dec 31 Dec 31 Dec
EURm 2015 2014 2015 2014 2015 2014
Net interest income 101 191 2 3 0 -
Net fee and commission income -387 -416 0 0 0 1
Net result from items at fair value 790 -1,237 1 -2 - -
Other operating income 22 13 - - - -
Total operating expenses -190 -186 - - - -
Profit before loan losses 336 -1,635 3 1 0 1
The terms “group undertakings” and “associated undertakings” refer to group undertakings and associated undertakings of the Nordea Group. Related-party transactions of Nordea Bank Finland Group and the Nordea Group are included in group undertakings of the parent company. Comparative figures have been updated accordingly. Compensations and loans and receivables to key management personnel
Compensations and loans to Key management personnel are specified in Note 8. Note 44 Credit risk disclosure
Credit risk management and credit risk analysis are described in the Risk, Liquidity and Capital management section of the Board of Directors´ Report. Additional information on credit risk is also disclosed in the Capital and Risk Management Report 2015 (Pillar III), which is available at www.nordea.com. Group
31 Dec 31 Dec
Exposure types, EURm 2015 2014
On-balance sheet items 139,617 146,714
Off-balance sheet items 11,828 10,262
Securities financing 4,828 4,063
Derivatives 24,437 31,563
Exposure At Default (EAD) 180,710 192,603 Tables presented in this note, containing exposure, are presented as Exposure At Default (EAD). EAD is the exposure after applying credit conversion factors (CCF).

Nordea Bank Finland Plc . Annual Report 2015 120
Note 44 Credit risk disclosure, cont.
Link between credit risk exposure and the balance sheet This section discloses the link between the loan portfolio as defined by accounting standards and exposure as defined in Capital Requirements Regulation (CRR). The main differences are outlined in this section to illustrate the link between the different reporting methods. Original exposure is the exposure before taking into account substitution effects stemming from credit risk mitigation, credit conversion factors (CCFs) for off-balance sheet exposure and allowances within the standardised approach. In this note, however, exposure is defined as exposure at default (EAD) for IRB exposure and exposure value for standardised exposure unless otherwise stated. In accordance with the CRR, credit risk exposure presented in this note, is divided between exposure classes where each exposure class is divided into exposure types as follows: • On-balance sheet items • Off-balance sheet items (e.g. guarantees and unutilised amounts of credit facilities) • Securities financing (e.g. reverse repurchase agreements and securities lending) • Derivatives Items presented in other parts of the Annual Report are divided as follows (in accordance with the accounting standards): • On-balance sheet items (e.g. loans to central banks and credit institutions, loans to the public, reverse repurchase agreements, positive fair
value for derivatives and interest-bearing securities) • Off-balance sheet items (e.g. guarantees and unutilised lines of credit) The table below shows the link between the CRR credit risk exposure and items presented in the Annual Report. On-balance sheet items The following items have been excluded from the balance sheet, when calculating on-balance exposure in accordance with the CRR: • Market risk related items in the trading book, such as certain interest-bearing securities and pledged instruments. • Repos, derivatives and securities lending. These transactions are either included in the calculation of market risk in the trading book or
reported as separate exposure types (derivatives or securities financing). • Other, mainly allowances and intangible assets. Off-balance sheet items The following off-balance sheet items specified in the Annual Report are excluded when off-balance exposure is calculated in accordance with the CRR: • “Assets pledged as security for own liabilities” and “Other assets pledged” (apart from leasing). These transactions are reported as
securities financing (i.e. a separate exposure type) • Derivatives Derivatives and securities financing Derivatives can be both on-balance sheet (i.e. positive fair value) and off-balance (i.e. nominal amounts) in accordance with accounting standards. However, in the CRR, the derivatives and securities financing are reported as separate exposure types. Also, repurchase agreements and securities lending/borrowing transactions are on the balance sheet calculated based on nominal value. In the CRR calculations these exposure types are determined net of the collateral.
On-balance sheet items
Group
31 Dec 2015, EURm Original exposure
Items related to
market risk
Repos, derivatives,
securities lending
Items excluded from CCR scope of consolidation Other
Balance sheet
Cash and balances with central banks 32,613 0 0 0 0 32,613
Loans to central banks and credit institutions 23,817 0 8,596 4 0 32,417
Loans to the public 67,210 0 34,878 -6 -635 101,447
Interest-bearing securities and pledged instruments 14,850 19,921 0 0 0 34,771
Derivatives1 0 0 80,557 0 0 80,557
Intangible assets 0 0 0 0 44 44
Other assets and prepaid expenses 1,175 17,297 116 70 1,083 19,742
Total assets 139,665 37,218 124,147 68 491 301,590
Exposure at default2 139,617 1 Derivatives are included in banking and trading books, but not at book values. Counterparty risk in trading derivatives is included in the credit risk. 2 The on-balance exposure have a CCF of 100%, but can still have a lower EAD due to provisions in the standardised approach, that are deducted from the original exposure when calculating EAD.

Nordea Bank Finland Plc . Annual Report 2015 121
Note 44 Credit risk disclosure, cont.
On-balance sheet items
Group
31 Dec 2014, EURm Original exposure
Items related to market risk
Repos, derivatives,
securities lending Other Balance sheet
Cash and balances with central banks 28,846 28,846
Loans to central banks and credit institutions 29,584 5,768 0 35,352
Loans to the public 69,616 44,777 -645 113,748
Interest-bearing securities and pledged instruments 17,520 28,180 45,701
Derivatives1 105,254 105,254
Intangible assets 47 47
Other assets and prepaid expenses 1,190 14,887 91 1,082 17,250
Total assets 146,757 43,068 155,890 483 346,198
Exposure at default2 146,750 1 Derivatives are included in banking and trading books, but not at book values. Counterparty risk in trading derivatives is included in the credit risk. 2 The on-balance exposure have a CCF of 100%, but can still have a lower EAD due to provisions in the standardised approach, that are deducted from the original exposure when calculating EAD.
Off-balance sheet items Group
31 Dec 2015, EURm
Credit risk in accordance with CRR
Off-balance sheet
Contingent liabilities 12,432 12,432
Commitments 13,972 13,972
Total 26,404 26,404
31 Dec 2015, EURm
Credit risk in accordance with CRR
Items not included in
accounts Original exposure
Average conversion
factor
Exposure at default
EAD
Credit facilities 5,810 4,611 10,421 38% 3,945
Checking accounts 7,157 7,157 44% 3,121
Loan commitments 979 347 1,326 44% 579
Guarantees 11,646 11,646 34% 3,926
Other 812 812 32% 257
Total 26,404 4,958 31,362 11,828
31 Dec 2014, EURm
Credit risk in accordance with CRR
Off-balance sheet
Contingent liabilities 14,906 14,906
Commitments 16,790 16,790
Total 31,696 31,696
31 Dec 2014, EURm
Credit risk in accordance with CRR
Items not included in
accounts Original exposure
Average conversion
factor
Exposure at default
EAD
Credit facilities 8,610 4,036 12,646 37% 4,724
Checking accounts 7,312 7,312 37% 2,695
Loan commitments 857 287 1,144 45% 520
Guarantees 13,747 13,747 15% 2,017
Other 1,171 1,171 26% 306
Total 31,696 4,323 36,019 10,262
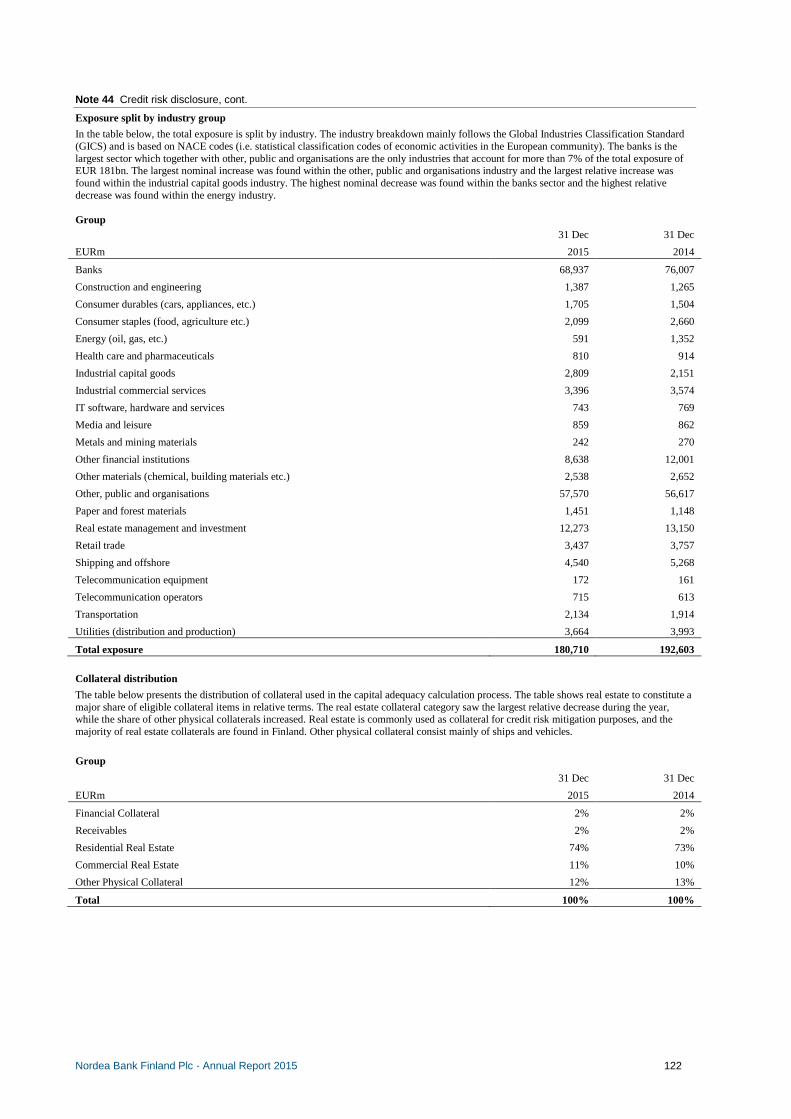
Nordea Bank Finland Plc . Annual Report 2015 122
Note 44 Credit risk disclosure, cont.
Exposure split by industry group
In the table below, the total exposure is split by industry. The industry breakdown mainly follows the Global Industries Classification Standard (GICS) and is based on NACE codes (i.e. statistical classification codes of economic activities in the European community). The banks is the largest sector which together with other, public and organisations are the only industries that account for more than 7% of the total exposure of EUR 181bn. The largest nominal increase was found within the other, public and organisations industry and the largest relative increase was found within the industrial capital goods industry. The highest nominal decrease was found within the banks sector and the highest relative decrease was found within the energy industry. Group
31 Dec 31 Dec
EURm 2015 2014
Banks 68,937 76,007
Construction and engineering 1,387 1,265
Consumer durables (cars, appliances, etc.) 1,705 1,504
Consumer staples (food, agriculture etc.) 2,099 2,660
Energy (oil, gas, etc.) 591 1,352
Health care and pharmaceuticals 810 914
Industrial capital goods 2,809 2,151
Industrial commercial services 3,396 3,574
IT software, hardware and services 743 769
Media and leisure 859 862
Metals and mining materials 242 270
Other financial institutions 8,638 12,001
Other materials (chemical, building materials etc.) 2,538 2,652
Other, public and organisations 57,570 56,617
Paper and forest materials 1,451 1,148
Real estate management and investment 12,273 13,150
Retail trade 3,437 3,757
Shipping and offshore 4,540 5,268
Telecommunication equipment 172 161
Telecommunication operators 715 613
Transportation 2,134 1,914
Utilities (distribution and production) 3,664 3,993
Total exposure 180,710 192,603
Collateral distribution
The table below presents the distribution of collateral used in the capital adequacy calculation process. The table shows real estate to constitute a major share of eligible collateral items in relative terms. The real estate collateral category saw the largest relative decrease during the year, while the share of other physical collaterals increased. Real estate is commonly used as collateral for credit risk mitigation purposes, and the majority of real estate collaterals are found in Finland. Other physical collateral consist mainly of ships and vehicles.
Group 31 Dec 31 Dec
EURm 2015 2014
Financial Collateral 2% 2%
Receivables 2% 2%
Residential Real Estate 74% 73%
Commercial Real Estate 11% 10%
Other Physical Collateral 12% 13%
Total 100% 100%

Nordea Bank Finland Plc . Annual Report 2015 123
Note 44 Credit risk disclosure, cont.
Collaterised Debt Obligations (CDO) - Exposure1 Nordea acts as an intermediary in the credit derivatives market, especially in Nordic names. Nordea also uses credit derivatives to hedge positions in corporate bonds and synthetic CDOs. When Nordea sells protection in a CDO transaction, it carries the risk of losses in the reference portfolio if a credit event occurs. When Nordea buys protection in a CDO transaction, any losses in the reference portfolio triggered by a credit event are carried by the seller of protection. Credit derivatives transactions create counterparty credit risk in similar manner to other derivative transactions. Counterparties in these transactions are typically subject to a financial collateral agreement, where the exposure is covered daily by collateral placements. CDO valuations are subject to fair value adjustments for model risk. These fair value adjustments are recognised in the income statement. Group and parent company 31 Dec 2015 31 Dec 2014
Nominals, EURm
Bought
protection Sold
protection Bought
protection Sold
protection
CDOs, gross 788 1,854 1,204 1,691
Hedged exposures 754 754 1,005 1,004
CDOs, net2 343 1,1004 1993 6874
- of which Equity 3 74 20 67
- of which Mezzanine 10 539 98 370
- of which Senior 21 487 81 250 1 First-to-Default swaps are not classified as CDOs and are therefore not included in the table. Net bought protection amounts to EUR 15m (47) and net sold protection to EUR 64m (46). Both bought and sold protection are, to the predominant part, investment grade. 2 Net exposure disregards exposure where tranches are completely identical in terms of reference pool attachment, detachment, maturity and currency. 3 Of which investment grade EUR 0m (90) and sub investment grade EUR 34m (109). 4 Of which investment grade EUR 538m (423) and sub investment grade EUR 563m (264) and not rated EUR 0m (0).
Assets taken over for protection of claims1
Group Parent company
31 Dec 31 Dec 31 Dec 31 Dec
EURm 2015 2014 2015 2014
Current assets, carrying amount: Shares and other participations 1 2 1 2
Other assets 1 1 1 1
Total 2 3 2 3 1 In accordance with Nordea’s policy for taking over assets for protection of claims, which is in compliance with the local Banking Business Acts, wherever Nordea is located. Assets, used as collateral for the loan, are generally taken over when the customer is not able to fulfil its obligations to Nordea.
Past due loans, excl. impaired loans The table below shows past due loans not impaired split by corporate and household customers. Past due loans to corporate customers that are not considered impaired were at end of 2015 EUR 245m up from EUR 223m one year ago. Past due loans for household customers increased to EUR 565m (280). Group Parent company 31 Dec 2015 31 Dec 2014 31 Dec 2015 31 Dec 2014
EURm Corporate customers
Household customers
Corporate customers
Household customers
Corporate customers
Household customers
Corporate customers
Household customers
6-30 days 146 364 80 147 103 358 27 125
31-60 days 48 108 64 91 39 106 27 80
61-90 days 14 35 50 42 10 34 18 40
>90 days 37 58 28 0 26 32 20 0
Total 245 565 223 280 177 530 92 244 Past due not impaired loans divided by loans to the public after allowances, % 0.39 1.53 0.29 0.77 0.30 1.56 0.13 0.73

Nordea Bank Finland Plc . Annual Report 2015 124
Note 44 Credit risk disclosure, cont.
Loans to corporate customers, by size of loan The distribution of loans to corporate customers by size of loans shows that approximately 81% of the corporate volume represents loans up to EUR 50m. Group Parent company
EURm 31 Dec
2015 % 31 Dec
2014 % 31 Dec
2015 % 31 Dec
2014 %
0-10 34,723 55.0 42,561 55.8 32,326 55.0 40,213 55.8
10-50 16,250 25.7 19,552 25.6 15,128 25.7 18,473 25.6
50-100 5,321 8.4 5,673 7.4 4,954 8.4 5,360 7.4
100-250 6,089 9.6 7,433 9.8 5,669 9.6 7,023 9.8
250-500 796 1.3 1,018 1.3 741 1.3 962 1.3
500- 0 0.0 0 0.0 0 0.0 0 0.0
Total 63,179 100.0 76,238 100.0 58,818 100.0 72,031 100.0 Interest-bearing securities For more information about credit risk related to interest-bearing securities, see Note 14 where the carrying amount of interest-bearing securities is split on different types of counterparties. Note 45 Interests in structured entities
Structured entities are entities designed so that voting or similar rights are not the dominant factor in deciding who controls the entity. It normally has restricted activities with a narrow and well defined objective. If Nordea controls such an entity, it is consolidated. Unconsolidated structured entities For structured entities in which Nordea has an interest but does not control it, disclosures are provided. To be considered to have an interest in such an entity, Nordea must be exposed to variability in returns on the investment in the structured entity. Investment funds are the only interest in unconsolidated structured entities Nordea currently holds. Variability in returns is assessed based on both fees received and revaluation of holdings in the funds. There are several different products where Nordea invests in investment funds: • on behalf of depositors where the return is based the investment • to hedge exposures in structured products issued to customers • illiquid investments in private equity and credit funds As Nordea is exposed to variability in returns on a gross basis, information about these funds are disclosed although the net exposure is considerably less. Investment funds acquired to hedge exposures in structured products reduce the exposures and to the extent hedges are effective, Nordea is not exposed to changes in value. The maximum loss on these funds is estimated to EUR 6m, net of hedges. NBF’s interests in unconsolidated structured entities and any related liability are disclosed in the table below:
Group Parent company
31 Dec 31 Dec
EURm 2015 2015
Assets, carrying amount
Loans to credit institutions - -
Shares 592 592
Total assets 592 592
Liabilities
Deposits and borrowings from the public - -
Liabilities to policy holders - -
Derivatives 109 109
Total liabilities 109 109
Off balance, nominal amount
Loan commitments - - NBF has not sponsored any unconsolidated structured entity in which NBF does not currently have an interest.

Nordea Bank Finland Plc . Annual Report 2015 125
Note 46 Country by country reporting
In accordance with the requirements under the Act on Credit Institutions, the table below presents for each country where NBF is established, i.e. where NBF has a physical presence, information about the businesses, the geographical area, average number of employees, total operating income, operating profit and income tax expense. NBF is considered to have physical presence in a country if NBF has a subsidiary, associated undertaking or branch in that country. NBF has not received any significant government subsidies. Group 2015
Country Business1 Geographical area
Average number of employees
Total operating income2,
EURm Operating
profit, EURm
Income tax expense,
EURm
Denmark WB Denmark - 281 250 -59
Finland RB, WB Finland 7,096 1,692 751 -184
Sweden WB Sweden - 152 131 -29
Norway WB Norway - 108 101 -27
Estonia WB Estonia - 24 12 -3
Latvia WB Latvia - 15 12 -2
Lithuania WB Lithuania - 14 12 -1
United Kingdom WB London - 9 9 -2
United States RB, WB New York 116 140 93 -37
Singapore RB, WB Singapore 73 50 31 -3
Total 7,285 2,485 1,402 -347 1 RB= Retail banking, WB=Wholesale banking 2 Total operating income presented in this table is split on countries based on where Nordea has a physical presence, i.e. where Nordea has a subsidiary, associated undertaking or branch, while total operating profit presented in Note 2 is split on countries based on the location of the customers´ operations. Note 47 Nordea shares
Nordea Bank Finland Plc does not possess its own shares. During the year, Nordea Bank Finland has bought and sold shares in its parent company Nordea Bank AB (publ) as part of its normal trading and market making activities. The trades are specified in the table enclosed. The increased volumes are explained by higher trading activity in NBF.
Acquisitions Sales
Month Quantity Average acq.price Amount, EUR Quantity Average price Amount, EUR
January 5,133,896 10.21 52,404,183.36 -5,655,775 10.26 -58,022,605.89
February 2,752,196 11.48 31,604,067.52 -3,452,839 11.53 -39,820,460.05
March 5,729,711 12.08 69,194,161.98 -4,061,226 11.95 -48,546,175.66
April 2,412,835 11.67 28,152,409.28 -4,293,960 11.67 -50,121,438.45
May 4,625,617 11.56 53,481,511.93 -3,416,882 11.60 -39,630,231.03
June 4,057,658 11.56 46,919,995.72 -2,627,820 11.59 -30,468,005.93
July 3,801,147 11.40 43,335,351.80 -3,491,281 11.38 -39,734,219.12
August 2,863,191 10.66 30,528,433.86 -2,904,257 10.61 -30,800,059.02
September 2,554,635 10.31 26,330,647.01 -2,683,284 10.30 -27,638,025.94
October 2,336,772 10.34 24,155,149.75 -2,247,832 10.32 -23,207,076.38
November 5,284,354 10.27 54,249,503.31 -5,978,349 10.25 -61,289,775.50
December 4,315,954 9.97 43,026,205.72 -3,412,490 9.94 -33,922,461.07
45,867,966 503,381,621.25 -44,225,995 -483,200,534.05 The quota value of the Nordea Bank AB (publ) share is EUR 1.00. The trades had an insignificant effect on the shareholding and voting-power in Nordea Bank AB (publ). At year-end 2015 NBF owned 6,470,948 shares of the parent company.
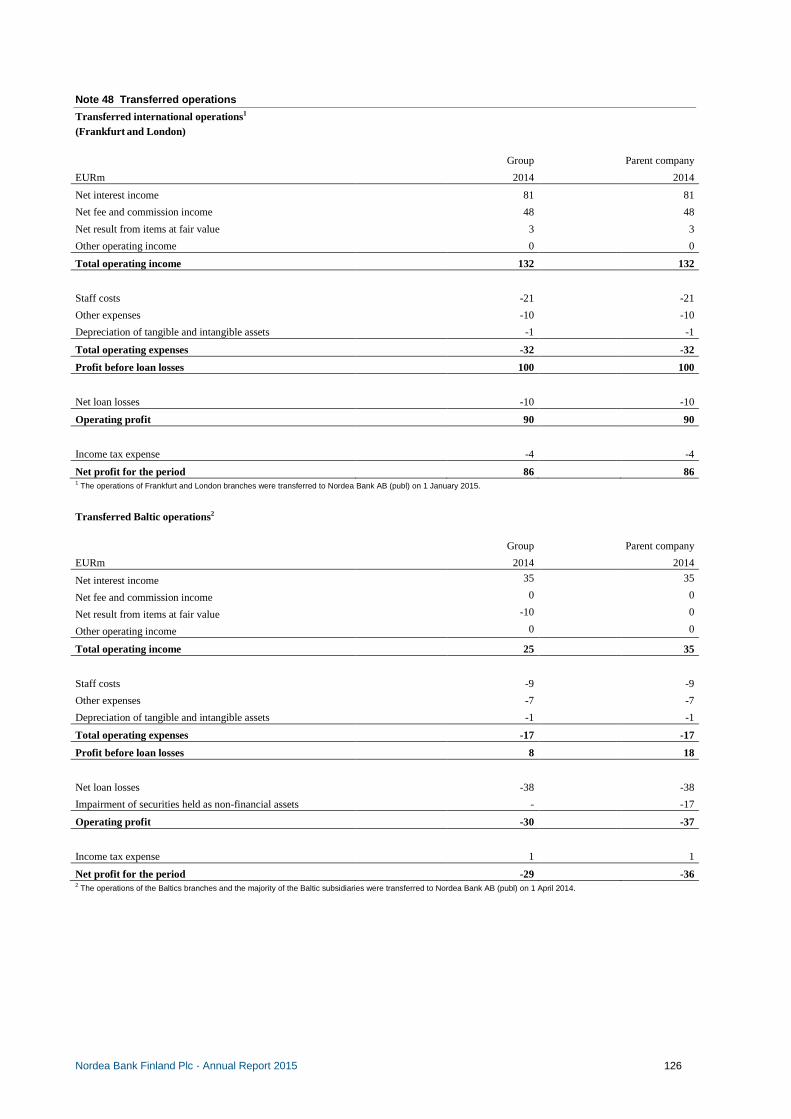
Nordea Bank Finland Plc . Annual Report 2015 126
Note 48 Transferred operations
Transferred international operations1
(Frankfurt and London)
Group Parent company
EURm 2014 2014
Net interest income 81 81
Net fee and commission income 48 48
Net result from items at fair value 3 3
Other operating income 0 0
Total operating income 132 132
Staff costs -21 -21
Other expenses -10 -10
Depreciation of tangible and intangible assets -1 -1
Total operating expenses -32 -32
Profit before loan losses 100 100
Net loan losses -10 -10
Operating profit 90 90
Income tax expense -4 -4
Net profit for the period 86 86 1 The operations of Frankfurt and London branches were transferred to Nordea Bank AB (publ) on 1 January 2015.
Transferred Baltic operations2
Group Parent company
EURm 2014 2014
Net interest income 35 35
Net fee and commission income 0 0
Net result from items at fair value -10 0
Other operating income 0 0
Total operating income 25 35
Staff costs -9 -9
Other expenses -7 -7
Depreciation of tangible and intangible assets -1 -1
Total operating expenses -17 -17
Profit before loan losses 8 18
Net loan losses -38 -38
Impairment of securities held as non-financial assets - -17
Operating profit -30 -37
Income tax expense 1 1
Net profit for the period -29 -36 2 The operations of the Baltics branches and the majority of the Baltic subsidiaries were transferred to Nordea Bank AB (publ) on 1 April 2014.
Nordea Bank Finland Plc . Annual Report 2015 127
The proposal of the Board of Directors to the Annua l General Meeting The parent company’s distributable funds on 31 December 2015 were EUR 8,665,706,000.51 of which the profit for the year was EUR 1,001,571,275.51. The Board of Directors proposes that
1. a dividend of EUR 780,000,000.00 be paid 2. whereafter the distributable funds will be EUR 7,885,706,000.51.
Signatures of the Directors’ report and of the Financial Statements:
Helsinki, 26 February 2016
Heikki Ilkka Erik Ekman
Carl-Johan Granvik Lennart Jacobsen
Topi Manner President
The Auditor's Note
Our auditors’ report has been issued today.
Helsinki, 26 February 2016
PricewaterhouseCoopers Oy Authorised Public Accountants
Juha Wahlroos Authorised Public Accountant
Nordea Bank Finland Plc . Annual Report 2015 128
Auditors’ report (Translation from the Finnish Original)
To the Annual General Meeting of Nordea Bank Finland Plc
We have audited the accounting records, the financial statements, the report of the Board of Directors and the administration of Nordea Bank Finland Plc for the year ended 31 December, 2015. The financial statements comprise both the consolidated and the parent company’s statement of financial position, income statement, statement of comprehensive income, statement of changes in equity and statement of cash flows, and notes to the financial statements.
Responsibility of the Board of Directors and the Managing Director
The Board of Directors and the Managing Director are responsible for the preparation of financial statements that give a true and fair view in accordance with International Financial Reporting Standards (IFRS) as adopted by the EU, as well as for the preparation of financial statements and the report of the Board of Directors that give a true and fair view in accordance with the laws and regulations governing the preparation of the financial statements and the report of the Board of Directors in Finland. The Board of Directors is responsible for the appropriate arrangement of the control of the company’s accounts and finances, and the Managing Director shall see to it that the accounts of the company are in compliance with the law and that its financial affairs have been arranged in a reliable manner.
Auditor’s responsibility
Our responsibility is to express an opinion on the financial statements, on the consolidated financial statements and on the report of the Board of Directors based on our audit. The Auditing Act requires that we comply with the requirements of professional ethics. We conducted our audit in accordance with good auditing practice in Finland. Good auditing practice requires that we plan and perform the audit to obtain reasonable assurance about whether the financial statements and the report of the Board of Directors are free from material misstatement, and whether the members of the Board of Directors of the parent company or the Managing Director are guilty of an act or negligence which may result in liability in damages towards the company or whether they have violated the Limited Liability Companies Act or the articles of association of the company.
An audit involves performing procedures to obtain audit evidence about the amounts and disclosures in the financial statements and the report of the Board of Directors. The procedures selected depend on the auditor’s judgment, including the assessment of the risks of material misstatement, whether due to fraud or error. In making those risk assessments, the auditor considers internal control relevant to the entity’s preparation of financial statements and report of the Board of Directors that give a true and fair view in order to design audit procedures that are appropriate in the circumstances, but not for the purpose of expressing an opinion on the effectiveness of the company’s internal control. An audit also includes evaluating the appropriateness of accounting policies used and the reasonableness of accounting estimates made by management, as well as evaluating the overall presentation of the financial statements and the report of the Board of Directors.
We believe that the audit evidence we have obtained is sufficient and appropriate to provide a basis for our audit opinion.
Opinion
In our opinion,
• the financial statements give a true and fair view of the financial position, financial performance, and cash flows of the company in accordance with International Financial Reporting Standards (IFRS) as adopted by the EU
• the financial statements and the report of the Board of Directors give a true and fair view of the financial performance and financial position of the company in accordance with the laws and regulations governing the preparation of the financial statements and the report of the Board of Directors in Finland
• the information in the report of the Board of Directors is consistent with the information in the financial statements.

Nordea Bank Finland Plc . Annual Report 2015 129
Other opinions
We support that the financial statements should be adopted. The proposal by the Board of Directors regarding the use of the profit shown in the balance sheet is in compliance with the Limited Liability Companies Act. We support that the Members of the Board of Directors and the Managing Director should be discharged from liability for the financial period audited by us.
Helsinki 26 February 2016
PricewaterhouseCoopers Oy Authorised Public Accountants
Juha Wahlroos Authorised Public Accountant

192819-3-22-v2.0 - 11- 70-40619915
APPENDIX 1
SUMMARY OF THE BASE PROSPECTUS
Summaries are made up of disclosure requirements known as "Elements". These elements are numbered
in Sections A – E (A.1 – E.7).
This summary contains all the Elements required to be included in a summary for this type of securities
and these Issuers. Because some Elements are not required to be addressed, there may be gaps in the
numbering sequence of the Elements.
Even though an Element may be required to be inserted in the summary because of the type of securities
and relevant Issuer, it is possible that no relevant information can be given regarding the Element. In this
case a short description of the Element is included in the summary with the mention of "Not Applicable".
In particular Elements in italics denote placeholders for completing the issue specific summary relating
to a Tranche of Notes for which such issue specific summary is to be prepared.
Words and expressions defined in the sections entitled "Terms and Conditions of the Notes" or elsewhere
in this Base Prospectus have the same meanings in this summary.
Section A – Introduction and Warnings
A.1 Introduction: This summary should be read as an introduction to this Base Prospectus and
any decision to invest in the Notes should be based on a consideration of the
Base Prospectus as a whole by the investor. Where a claim relating to the
information contained in this Base Prospectus is brought before a court in a
Member State of the European Economic Area, the plaintiff may, under the
national legislation of the Member States, be required to bear the costs of
translating the Base Prospectus before the legal proceedings are initiated.
No civil liability will attach to the Issuers in any such Member State solely
on the basis of this summary, including any translation thereof, unless it is
misleading, inaccurate or inconsistent when read together with the other
parts of this Base Prospectus or it does not provide, when read together with
the other parts of this Base Prospectus, key information in order to aid
investors when considering whether to invest in the Notes.
A.2 Consent: Certain Tranches of Notes with a denomination of less than €100,000 (or its
equivalent in any other currency) may be offered in circumstances where
there is no exemption from the obligation under the Prospectus Directive to
publish a prospectus. Any such offer is referred to as a "Public Offer".
The Issuer consents to the use of this Base Prospectus in connection with a
Public Offer of the Notes by any financial intermediary which is authorised
to make such offers under the Markets in Financial Instruments Directive
(Directive 2004/39/EC) (an "Authorised Offeror") on the following basis:
(a) the relevant Public Offer must occur during the period from and
including [•] to but excluding [ ] (the "Offer Period") in [•] [and [•]] (the
"Public Offer Jurisdiction(s)") and (b) the relevant Authorised Offeror must
have agreed to the Authorised Offeror Terms [and satisfy the following
additional conditions: [•]]./The Issuer consents to the use of this Base
Prospectus in connection with a Public Offer of the Notes by [•](an
"Authorised Offeror") on the following basis: (a) the relevant Public Offer
must occur during the period from and including [•]] to but excluding [ ]
(the "Offer Period") in [•] [and [•]] (the "Public Offer Jurisdiction(s)")
and (b) the relevant Authorised Offeror must have agreed to the Authorised
Offeror Terms [and satisfy the following additional conditions: [•]].

192819-3-22-v2.0 - 12- 70-40619915
Authorised Offerors will provide information to an Investor on the
terms and conditions of the Public Offer of the relevant Notes at the
time such Public Offer is made by the Authorised Offeror to the
Investor.
Section B – Issuers
B.1 Legal names of
the Issuers:
Nordea Bank AB (publ)
Nordea Bank Finland Plc
Commercial
names of the
Issuers:
Nordea
B.2 Domicile and legal
forms of the
Issuers:
NBAB is a public (publ) limited liability company with registration No.
516406-0120. The head office is located in Stockholm at the following
address: Smålandsgatan 17, 105 71 Stockholm. The principal legislation
under which NBAB operates is the Swedish Companies Act and the
Swedish Banking and Financing Business Act.
NBF is a company with limited liability pursuant to the Finnish Companies
Act. NBF is registered in the trade register with business identity code
1680235-8. NBF has its head office in Helsinki at the following address:
Aleksanterinkatu 36 B, 00100 Helsinki, Finland. The principal legislation
under which NBF operates is the Finnish Companies Act and the Finnish
Act on Commercial Banks and Other Credit Institutions in the form of a
limited company.
B.4b Trends: Not applicable. There are no clear trends affecting the Issuers or the markets
in which they operate.
B.5 The Group: NBAB is the parent company of the Nordea Group. The Nordea Group is a
large financial services group in the Nordic markets (Denmark, Finland,
Norway and Sweden), with additional operations in Russia, the Baltic
countries and Luxembourg, as well as branches in a number of other
international locations. The three main subsidiaries of NBAB are Nordea
Bank Danmark A/S in Denmark, NBF in Finland and Nordea Bank Norge
ASA in Norway. The Nordea Group's organisational structure is built around
three main business areas: Retail Banking, Wholesale Banking and Wealth
Management. Group Corporate Centre, Group Risk Management and Group
Compliance are other central parts of the Nordea Group's organisation.
Retail Banking is responsible for customer relations with household
customers as well as large, medium-sized and small corporate customers in
the Nordic and Baltic countries. Wholesale Banking provides services and
financial solutions to large Nordic and international corporate and
institutional customers. Wealth Management provides investment, savings
and risk management products. It manages the Nordea Group's customers'
assets and advises affluent and high-net-worth individuals as well as
institutional investors on their financial situation.
As of 30 September 2015, the Nordea Group had total assets of EUR 679.9
billion and tier 1 capital of EUR 26.7 billion, and was the largest Nordic-
based asset manager with EUR 273.3 billion in assets under management.
B.9 Profit Forecasts
and Profit
Estimates:
Not Applicable. The Issuers do not make a profit forecast or profit estimate
in the Base Prospectus.
B.10 Audit Report Not Applicable. There are no qualifications in the audit reports for the

192819-3-22-v2.0 - 13- 70-40619915
Qualifications: Issuers.
B.12 Selected Key
Financial
Information:
The tables below show certain selected summarised financial information
which, without material changes, is derived from, and must be read together
with, the Issuers' audited consolidated financial statements for the year
ended 31 December 2015 set out in the annexes to this Supplement and the
Base Prospectus and the auditors' reports and notes thereto.1
NBAB Group – selected key financial information:
Year ended 31 December
2015 2014
(EUR millions)
Income Statement Total operating income ........................... 10,140 10,241
Net loan losses ........................................ -479 -534
Net profit for the period from continuing operations2 ............................................. 3,662 3,357
Net profit for the period .......................... 3,662 3,332
Balance Sheet Total assets.............................................. 646,868 669,342
Total liabilities ........................................ 615,836 639,505
Total equity ............................................. 31,032 29,837 Total liabilities and equity ....................... 646,868 669,342
Cash Flow Statement
Cash flow from operating activities before changes in operating assets and liabilities 6,472 11,456
Cash flow from operating activities ........ 196 -10,824
Cash flow from investing activities ......... -522 3,254 Cash flow from financing activities ........ -1,746 -1,040
Cash flow for the period .......................... -2,072 -8,610
Change .................................................... -2,072 -8,610
NBF Group – selected key financial information:
Year ended 31 December
2015 2014
(EUR Millions)
Income Statement
Total operating income ...................... 2,485 2,278 Net profit for the period ..................... 1,055 902
Balance Sheet Total assets......................................... 301,590 346,198
Total liabilities ................................... 289,294 336,580
Total equity ........................................ 12,296 9,618 Total liabilities and equity .................. 301,590 346,198
Cash Flow Statement Cash flow from operating activities
before changes in operating assets and
liabilities ............................................ 1,836 1,807 Cash flow from operating activities ... 8,536 -11,520
Cash flow from investing activities .... -11 2,149
Cash flow from financing activities ... 1,631 -593 Cash flow for the period ..................... 10,156 -9,964
Change .................................................... 10,156 -9,964
1 By virtue of the Supplement dated 7 March 2016, selected key audited information of NBAB for the year ending 31 December
2015 has been included and audited information of NBAB for the year ended 31 December 2013 has been removed. By virtue of the Supplement dated 7 March 2016, selected key audited information of NBF for the year ending 31 December 2015 has
been included and unaudited information of NBAB for the six months ended 30 June 2015 has been removed. 2 By virtue of the Supplement dated 5 February 2016, the Issuer has introduced "Net profit for the period from continuing
operations" from its Income Statement into its Selected key financial information.

192819-3-22-v2.0 - 14- 70-40619915
There has been no material adverse change in the ordinary course of
business or in the prospects or condition of NBAB or NBF since 31
December 20153, being the date of its last published audited financial
statements.
There has been no significant change in the financial or trading position of
NBAB or NBF which has occurred since 31 December 20154 ,being the date
of its last published financial statements.
B.13 Recent Events: Not Applicable for either Issuer. There have been no recent events particular
to either Issuer which are to a material extent relevant to the evaluation of
such Issuer's solvency since the date of the relevant Issuer's last published
audited or unaudited financial statements.
B.14 Dependence upon
other entities
within the Group:
Not Applicable. Neither NBAB nor NBF is dependent upon other entities
within the Nordea Group.
B.15 The Issuer's
Principal
Activities:
The Nordea Group's organisational structure is built around three main
business areas: Retail Banking, Wholesale Banking and Wealth
Management. In addition to these business areas, the Nordea Group's
organisation includes the following three Group functions: Group Corporate
Centre, Group Risk Management and Group Compliance.
NBAB conducts banking operations in Sweden within the scope of the
Nordea Group's business organisation. NBAB develops and markets
financial products and services to personal customers, corporate customers
and the public sector.
NBF conducts banking operations in Finland as a part of the Nordea Group
and its operations are fully integrated into the Nordea Group's operations.
NBF holds a licence to conduct banking operations in accordance with the
Finnish Act on Credit Institutions.
B.16 Controlling
Persons:
Not Applicable. To the best of NBAB's knowledge, the Nordea Group is not
directly or indirectly owned or controlled by any single person or group of
persons acting together. NBF is a direct, wholly-owned subsidiary of
NBAB.
B.17 Ratings assigned
to the Issuer or its
Debt Securities:
As of the date of this Base Prospectus, the long term (senior) debt ratings of
each of the Issuers are:
Moody's Investors Service Limited: Aa3
Standard & Poor's Credit Market Services Europe Limited: AA-5
Fitch Ratings Limited: AA-
DBRS Ratings Limited: AA
The Issuers' credit ratings do not always mirror the risk related to individual
Notes issued under the Programme.
The Notes to be issued have not been rated
3 By virtue of the Supplement dated 7 March 2016, the date which there has been no material adverse change in the ordinary
course of business or in the prospects or condition of NBAB or NBF has been updated to 31 December 2015, being the date of its last published audited financial statements.
4 By virtue of the Supplement dated 7 March 2016, the date which there has been no significant change in the financial or trading
position of NBAB or NBF has been updated to 31 December 2015, being the date of their last published financial statements. 5 negative outlook

192819-3-22-v2.0 - 15- 70-40619915
Section C – The Notes
C.1 Description of
Type and Class of
Securities:
Issuance in Series: Notes are issued in series (each a "Series") and Notes of
each Series will all be subject to identical terms (except issue price, issue
date and interest commencement date, which may or may not be identical)
whether as to currency, denomination, interest or maturity or otherwise, save
that a Series may comprise Notes in bearer form and in registered form.
Further tranches of Notes (each a "Tranche") may be issued as part of an
existing Series.
The Series number of the Notes is [ ]. [The Tranche number is [ ].
Forms of Notes: Notes may be issued in bearer or in registered form. Notes
in bearer form will not be exchangeable for Notes in registered form and
Notes in registered form will not be exchangeable for Notes in bearer form.
The Notes are in bearer form/The Notes are in registered Form.
Notes may be specified in the applicable Final Terms as "VP Notes". VP
Notes will be issued in uncertificated and dematerialised book entry form,
with the legal title thereto being evidenced by book entries in the register for
such VP Notes kept by VP Securities A/S on behalf of the relevant Issuer
(the "Danish Note Register"). Title to VP Notes will not be evidenced by
any physical note or document of title. Definitive Notes will not be issued
in respect of any VP Notes. Nordea Bank Danmark A/S will act as the VP
Issuing Agent in respect of VP Notes.
Notes may be specified in the applicable Final Terms as "VPS Notes". VPS
Notes will be issued pursuant to a registrar agreement with Nordea Bank
Norge ASA as VPS Paying Agent and will be registered in uncertificated
and dematerialised book entry form with the Norwegian Central Securities
Depositary (Verdipapirsentralen ASA and referred to herein as the "VPS").
Notes may be specified in the applicable Final Terms as "Swedish Notes".
Swedish Notes will be issued in uncertificated and dematerialised book entry
form, with the legal title thereto being evidenced by book entries in the
register for such Swedish Notes kept by Euroclear Sweden on behalf of the
relevant Issuer. Title to Swedish Notes will not be evidenced by any
physical note or document of title. Definitive Notes will not be issued in
respect of any Swedish Notes. Nordea Bank AB (publ) will act as the
Swedish Issuing Agent in respect of Swedish Notes.
Notes may be specified in the applicable Final Terms as "Finnish Notes".
Finnish Notes will be issued in uncertificated and dematerialised book entry
form, with the legal title thereto being evidenced by book entries in the
register for such Finnish Notes kept by Euroclear Finland on behalf of the
relevant Issuer. Title to Finnish Notes will not be evidenced by any physical
note or document of title. Definitive Notes will not be issued in respect of
any Finnish Notes. Nordea Bank Finland Plc will act as the Finnish Issuing
Agent in respect of Finnish Notes.
Swiss Franc Notes: Swiss Franc Notes will be denominated in Swiss francs,
issued in bearer form and will be represented exclusively by a Permanent
Global Note which shall be deposited with SIX SIS AG, Olten, Switzerland,
or such other depositary as may be approved by the SIX Regulatory Board
of the SIX Swiss Exchange. The Permanent Global Note will be
exchangeable for definitive Notes only in certain limited circumstances.
Security Identification Number(s): In respect of each Tranche of Notes, the
relevant security identification number(s) will be specified in the relevant
Final Terms.

192819-3-22-v2.0 - 16- 70-40619915
The Notes will be [cleared/settled] through [ ]. The Notes have been
assigned the following securities identifiers: [ ].
C.2 Currency of the
Securities Issue:
U.S. dollars, euro, sterling, Swedish Krona, Swiss francs, Norwegian Krone,
Danish Krone, Yen and Singapore Dollars and/or such other currency or
currencies as may be determined at the time of issuance, subject to
compliance with all applicable legal and/or regulatory and/or central bank
requirements. Notes may, subject to such compliance with applicable laws,
be issued as dual currency Notes.
The currency of the Notes is [ ].
C.5 Free
Transferability:
This Base Prospectus contains a summary of certain selling restrictions in
the United States, the European Economic Area, the United Kingdom,
Denmark, Finland, The Netherlands, Norway, Sweden, Spain, Japan and
Singapore.
The Notes have not been and will not be registered under the United States
Securities Act of 1933 (the "Securities Act") and may not be offered and
sold within the United States or to, or for the account or benefit of U.S.
persons except in certain transactions exempt from the registration
requirements of the Securities Act.
In relation to each Member State of the European Economic Area which has
implemented the Prospectus Directive, including the Kingdom of Sweden
(each, a "Relevant Member State"), each dealer appointed in relation to the
Programme (each a "Dealer") has represented and agreed, and each further
Dealer appointed under the Programme will be required to represent and
agree, that with effect from and including the date on which the Prospectus
Directive is implemented in that Relevant Member State (the "Relevant
Implementation Date") it has not made and will not make an offer of Notes
to the public in that Relevant Member State except with the consent of the
relevant Issuer given in accordance with Element A.2 above.
Each Dealer has represented and agreed and each further Dealer appointed
under the Programme will be required to represent and agree that it has
complied and will comply with all applicable provisions of the Financial
Services and Markets Act 2000 (the "FSMA") with respect to anything done
by it in relation to any Notes in, from or otherwise involving the United
Kingdom.
Each Dealer has represented and agreed, and each further Dealer appointed
under the Programme will be required to represent and agree, that it has not
offered or sold and will not offer, sell or deliver any of the Notes directly or
indirectly in the Kingdom of Denmark by way of public offering, unless in
compliance with the Danish Securities Trading Act (Consolidated Act No.
883 of 9 August 2011, as amended) (in Danish: Værdipapirhandelsloven)
and Executive Orders issued thereunder.
Each Dealer has represented and agreed, and each further Dealer appointed
under the Programme will be required to represent and agree, in respect of
any offers or sales of Notes in Ireland, that it will comply with: the
provisions of the European Communities (Markets in Financial Instruments)
Regulations 2007 (Nos. 1 to 3) (as amended), including, without limitation,
Regulations 7 and 152 thereof or any codes of conduct used in connection
therewith and the provisions of the Investor Compensation Act 1998; the
provisions of the Companies Acts 2014, the Central Bank Acts 1942 to 2014
(as amended) and any codes of conduct rules made under Section 117(1) of
the Central Bank Act 1989; and the provisions of the Market Abuse
(Directive 2003/6/EC) Regulations 2005 (as amended) and any rules issued

192819-3-22-v2.0 - 17- 70-40619915
under Section 1370 of the Companies Act 2014.
Each Dealer has represented and agreed and each further Dealer appointed
under the Programme will be required to represent and agree that it has not
offered or sold and will not offer or sell, directly or indirectly, Notes to the
public in France and it has not distributed or caused to be distributed and
will not distribute or cause to be distributed to the public in France, the Base
Prospectus, the relevant Final Terms or any other offering material relating
to the Notes and such offers, sales and distributions have been and will be
made in France only to (a) providers of investment services relating to
portfolio management for the account of third parties (personnes fournissant
le service d'investissement de gestion de portefeuille pour compte de tiers),
and/or (b) qualified investors (investisseurs qualifiés) all as defined in, and
in accordance with, articles L.411 1, L.411 2 and D.411 1 of the French
Code monétaire et financier.
Notes which qualify as "derivative instruments" within the meaning of
Section 2 of the SMA, Directive 2004/39/EC (MiFID Directive) and
Commission Regulation No EC/1287/2006 (MiFID Implementation
Regulation), all as amended from time to time, may only be offered in
Estonia after assessment of the suitability and appropriateness of the relevant
structured instrument to the investor in accordance with applicable Estonian
and European Union law.
Each Dealer has represented and agreed, and each further Dealer appointed
under the Programme will be required to represent and agree, that the Notes
have not been offered and will not be offered in Lithuania by way of a
public offering, unless in compliance with all applicable provisions of the
laws of Lithuania and in particular in compliance with the Law on Securities
of the Republic of Lithuania of 18 January 2007 No X-1023 and any
regulation or rule made thereunder, as supplemented and amended from time
to time.
The Notes have not been registered under the Financial Instruments Market
Law of Latvia and may not be publicly offered or sold in Latvia. Neither the
relevant Issuer nor any Dealer has authorised, nor do they authorise, the
making of any offer of Notes in Latvia other than in accordance with the
laws of the Republic of Latvia.
Each Dealer has represented and agreed, and each further Dealer appointed
under the Programme will be required to represent and agree, that it has not
offered or sold and will not offer, sell or deliver any of the Notes directly or
indirectly in the Kingdom of Denmark by way of public offering, unless in
compliance with the Danish Securities Trading etc. Act
(Værdipapirhandelsloven), as amended from time to time, and Executive
Orders issued thereunder.
Each Dealer has represented and agreed and each further Dealer appointed
under the Programme will be required to represent and agree, that it will not
publicly offer the Notes or bring the Notes into general circulation in
Finland other than in compliance with all applicable provisions of the laws
of Finland and especially in compliance with the Finnish Securities Market
Act (495/1989) and any regulation or rule made thereunder, as supplemented
and amended from time to time.
Each Dealer has represented and agreed and each further Dealer appointed
under the Programme will be required to represent and agree, that it will
comply with all laws, regulations and guidelines applicable to the offering of
Notes in Norway. Notes denominated in Norwegian Krone may not be
offered or sold within Norway or to or for the account or benefit of persons
domiciled in Norway, unless the regulation relating to the offer of VPS

192819-3-22-v2.0 - 18- 70-40619915
Notes and the registration in the VPS has been complied with.
Each Dealer has represented and agreed, and each further Dealer appointed
under the Programme will be required to represent and agree, that it has only
made and will only make an offer of Notes to the public (oferta pública) in
Spain in accordance with the Recast Text of the Securities Market Law
(Texto Refundido de la Ley, del Mercado de Valores) approved by Royal
Decree Legislative 4/2015, of 23 October ("TRLMV"), Royal Decree
1310/2005, of 4 November, developing partially the Securities Market Law
as regards admission to listing on official secondary markets, public offers
and the prospectus required thereto and the regulations made thereunder.
The Notes may not be offered or sold in Spain other than by institutions
authorised under the TRLMV and Royal Decree 217/2008, of 15 February,
on the legal regime applicable to investment services companies, to provide
investment services in Spain, and in compliance with the provisions of the
TRLMV and any other applicable legislation.
The Notes have not been and will not be registered under the Financial
Instruments and Exchange Act of Japan (Act No. 25 of 1948, as amended;
the "FIEA") and each Dealer has represented and agreed and each further
Dealer appointed under the Programme will be required to represent and
agree, that it will not offer or sell any Notes, directly or indirectly, in Japan
or to, or for the benefit of, any resident of Japan, or to others for re-offering
or resale, directly or indirectly, in Japan or to, or for the benefit of, a resident
of Japan, except pursuant to an exemption from the registration requirements
of, and otherwise in compliance with, the FIEA and any other applicable
laws, regulations and ministerial guidelines of Japan.
Zero Coupon Notes in definitive form may only be transferred and accepted,
directly or indirectly, within, from or into the Netherlands through the
mediation of either the relevant Issuer or a member firm of Euronext
Amsterdam N.V. in full compliance with the Dutch Savings Certificates Act
(Wet inzake spaarbewijzen) of 21 May 1985 (as amended) and its
implementing regulations.
This Base Prospectus (including the relevant Final Terms) has not been
registered as a prospectus with the Monetary Authority of Singapore under
the Securities and Futures Act, Chapter 289 of Singapore (the "SFA").
Accordingly, this Base Prospectus (including the relevant Final Terms) and
any other document or material in connection with the offer or sale, or
invitation for subscription or purchase, of Notes may not be circulated or
distributed, nor may Notes be offered or sold, or be made the subject of an
invitation for subscription or purchase, whether directly or indirectly, to
persons in Singapore other than (i) to an institutional investor under Section
274 of the SFA, (ii) to a relevant person pursuant to Section 275(1), or any
person pursuant to Section 275(1), and in accordance with the conditions
specified in Section 275, of the SFA, or (iii) otherwise pursuant to, and in
accordance with the conditions of, any other applicable provision of the
SFA.
No Notes linked to collective investment schemes (as defined under the
SFA) may be offered or sold, or be made the subject of an invitation for
subscription or purchase, whether directly or indirectly, to persons in
Singapore.
C.8 The Rights
Attaching to the
Securities,
including Ranking
and Limitations to
Status of the Notes: The Notes constitute unsecured and unsubordinated
obligations of the relevant Issuer and rank pari passu without any preference
among themselves and at least pari passu with all other outstanding
unsecured and unsubordinated obligations of the relevant Issuer, present and
future.

192819-3-22-v2.0 - 19- 70-40619915
those Rights:
Denominations: Notes will be issued in such denominations as may be
specified in the relevant Final Terms, subject to (i) a minimum denomination
of €1,000 (or its equivalent in any other currency); and (ii) compliance with
all applicable legal and/or regulatory and/or central bank requirements.
The Notes are issued in denomination(s) of [ ].
Negative Pledge: None.
Cross Default: None.
Taxation: All payments in respect of the Notes will be made without
withholding or deduction of taxes unless required by Swedish or Finnish
laws, regulations or other rules, or decisions by Finnish or Swedish public
authorities. In the event that any of the Issuers is obliged to effect
deductions or withholdings of Finnish or Swedish tax for someone who is
not subject to taxation in Sweden or Finland, such Issuer will pay additional
amounts to ensure that, on the due date, the relevant holders of Notes receive
a net amount equal to the amount which the holders would have received but
for the deductions or withholdings, subject to customary exceptions.
Governing Law: One of English law, Finnish law, Swedish law, Danish law
or Norwegian law governs the Notes and all non-contractual obligations
arising out of or in connection with the Notes, except that (i) the registration
of VP Notes in the VP are governed by Danish law; (ii) the registration of
VPS Notes in the VPS are governed by Norwegian law; (iii) the registration
of Swedish Notes in Euroclear Sweden are governed by Swedish law; and
(iv) the registration on Finnish Notes in Euroclear Finland is governed by
Finnish law.
The Notes are governed by [English law/ Finnish law/ Danish law/ Swedish
law/ Norwegian law].
Enforcement of Notes in Global Form: In the case of Global Notes,
individual investors' rights against the relevant Issuer will be governed by a
deed of covenant dated 18 December 2015 (the "Deed of Covenant"), a
copy of which will be available for inspection at the specified office of
Citibank, N.A., London Branch as fiscal agent (the "Fiscal Agent").
C.9 The Rights
Attaching to the
Securities
(Continued),
Including
Information as to
Interest, Maturity,
Yield and the
Representative of
the Holders:
Interest: Notes may be interest bearing or non-interest bearing. Interest (if
any) may:
accrue at a fixed rate or a floating rate;
be inflation-protected, whereby the amount of interest payable is
linked to a consumer price index or other measure of inflation;
be linked to whether or not a Credit Event occurs in respect of the
debt obligations of one or more reference entities ("Credit Linked
Note" or "CLN"). A Credit Event is a corporate event which
typically makes a creditor of the Reference Entity suffer a loss (e.g.
bankruptcy or failure to pay). If a Credit Event occurs in respect of a
Reference Entity, the nominal amount used for calculation of the
interest payable may be reduced. Please refer to Element C.10 for
further details;
be cumulative provided certain performance thresholds are reached;
be linked to the performance of a specified reference rate (which
may be an interest rate or an inflation measure) during a specified

192819-3-22-v2.0 - 20- 70-40619915
period, as compared to a number of pre-determined strike/barrier
levels, with such interest amount also being subject (in certain
cases) to caps/floors;
be linked to the performance of one or more baskets of underlying
assets (each a "Reference Asset" and together a "Basket") or a
specific Reference Asset within the relevant Basket (for example,
the worst performing Reference Asset) as compared to a pre-
determined strike level; and/or
be linked to the percentage of Reference Assets within the Basket
that are above a pre-determined barrier level on each business day
up to and including the relevant interest payment date (each an
"Interest Payment Date").
The applicable interest rate or its method of calculation may differ from time
to time or be constant for any Series of Notes. Notes may have a maximum
interest rate, a minimum interest rate, or both. The length of the interest
periods for the Notes may also differ from time to time or be constant for
any Series of Notes. Notes may also bear interest on the basis of a
combination of different structures.
Interest Deferral: If Interest Deferral is specified as applicable to the Notes
then all payments of interest that would otherwise fall due in accordance
with the interest structure(s) applicable to the Notes, shall be deferred until
the earlier of the Redemption Date or the Early Redemption Date on which
the Notes are redeemed in full.
FX Components: If "FX Component (Interest)" is specified as applicable to
one or more Interest Amounts on any Interest Payment Dates then the
amount of interest for the relevant Interest Payment Date(s), as otherwise
determined in accordance with the interest rate structure applicable to the
relevant Notes, will be further multiplied by a factor which reflects the
variation in one or more foreign exchange rates during the relevant interest
period, for the purposes of determining the actual amount of interest that
will be payable to holders.
[The FX Component (Interest) is [applicable to the following Interest
Amounts payable on the following Interest Payment Dates: [ ]payable on [
]/Not Applicable] [The underlying foreign exchange rate is: [ ]]
The Notes do not bear interest./The Notes are interest-bearing:
Interest basis: [ ]
Nominal interest rate: [ ].
Interest Commencement Date: [ ].
Interest Payment Date(s): [ ].
Interest Deferral: [Applicable/Not Applicable]
Description of underlying Reference Rate/Reference Asset(s): [ ].]
Information about the past and further performance of the Reference
Rate/Reference Asset(s) can be obtained from: [ ].
[Margin: +/– [ ].]
[Maximum Rate of Interest: [ ].]
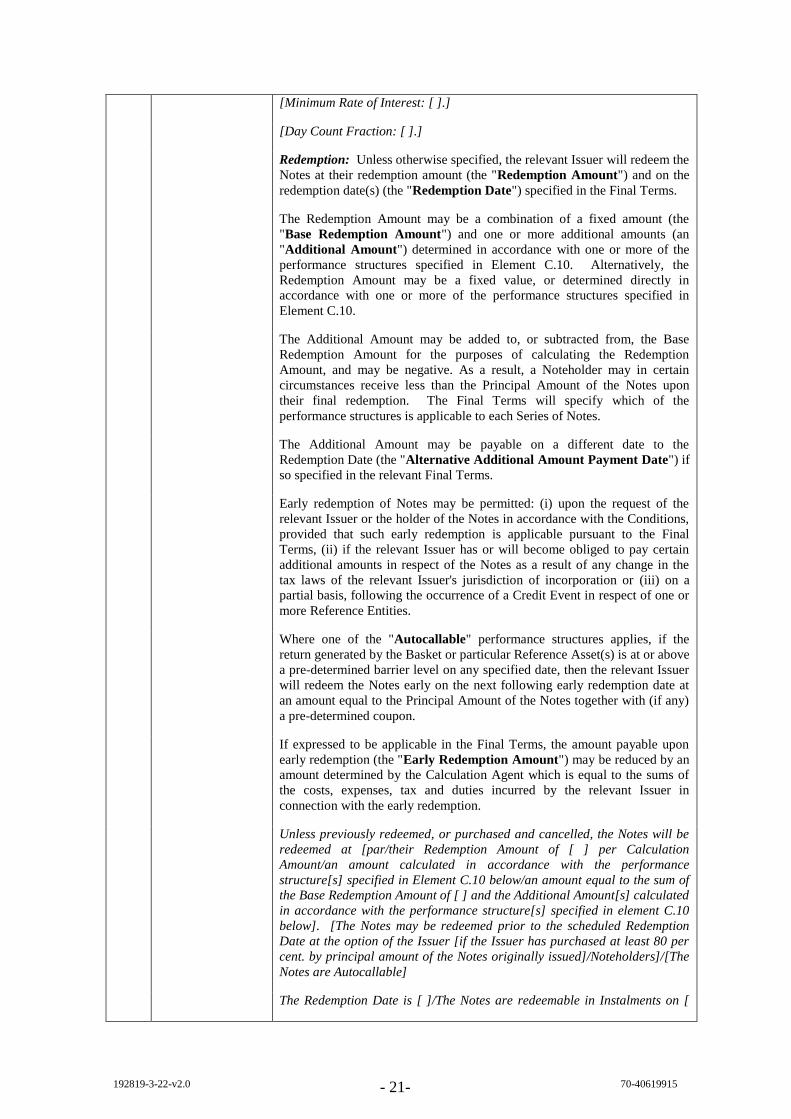
192819-3-22-v2.0 - 21- 70-40619915
[Minimum Rate of Interest: [ ].]
[Day Count Fraction: [ ].]
Redemption: Unless otherwise specified, the relevant Issuer will redeem the
Notes at their redemption amount (the "Redemption Amount") and on the
redemption date(s) (the "Redemption Date") specified in the Final Terms.
The Redemption Amount may be a combination of a fixed amount (the
"Base Redemption Amount") and one or more additional amounts (an
"Additional Amount") determined in accordance with one or more of the
performance structures specified in Element C.10. Alternatively, the
Redemption Amount may be a fixed value, or determined directly in
accordance with one or more of the performance structures specified in
Element C.10.
The Additional Amount may be added to, or subtracted from, the Base
Redemption Amount for the purposes of calculating the Redemption
Amount, and may be negative. As a result, a Noteholder may in certain
circumstances receive less than the Principal Amount of the Notes upon
their final redemption. The Final Terms will specify which of the
performance structures is applicable to each Series of Notes.
The Additional Amount may be payable on a different date to the
Redemption Date (the "Alternative Additional Amount Payment Date") if
so specified in the relevant Final Terms.
Early redemption of Notes may be permitted: (i) upon the request of the
relevant Issuer or the holder of the Notes in accordance with the Conditions,
provided that such early redemption is applicable pursuant to the Final
Terms, (ii) if the relevant Issuer has or will become obliged to pay certain
additional amounts in respect of the Notes as a result of any change in the
tax laws of the relevant Issuer's jurisdiction of incorporation or (iii) on a
partial basis, following the occurrence of a Credit Event in respect of one or
more Reference Entities.
Where one of the "Autocallable" performance structures applies, if the
return generated by the Basket or particular Reference Asset(s) is at or above
a pre-determined barrier level on any specified date, then the relevant Issuer
will redeem the Notes early on the next following early redemption date at
an amount equal to the Principal Amount of the Notes together with (if any)
a pre-determined coupon.
If expressed to be applicable in the Final Terms, the amount payable upon
early redemption (the "Early Redemption Amount") may be reduced by an
amount determined by the Calculation Agent which is equal to the sums of
the costs, expenses, tax and duties incurred by the relevant Issuer in
connection with the early redemption.
Unless previously redeemed, or purchased and cancelled, the Notes will be
redeemed at [par/their Redemption Amount of [ ] per Calculation
Amount/an amount calculated in accordance with the performance
structure[s] specified in Element C.10 below/an amount equal to the sum of
the Base Redemption Amount of [ ] and the Additional Amount[s] calculated
in accordance with the performance structure[s] specified in element C.10
below]. [The Notes may be redeemed prior to the scheduled Redemption
Date at the option of the Issuer [if the Issuer has purchased at least 80 per
cent. by principal amount of the Notes originally issued]/Noteholders]/[The
Notes are Autocallable]
The Redemption Date is [ ]/The Notes are redeemable in Instalments on [
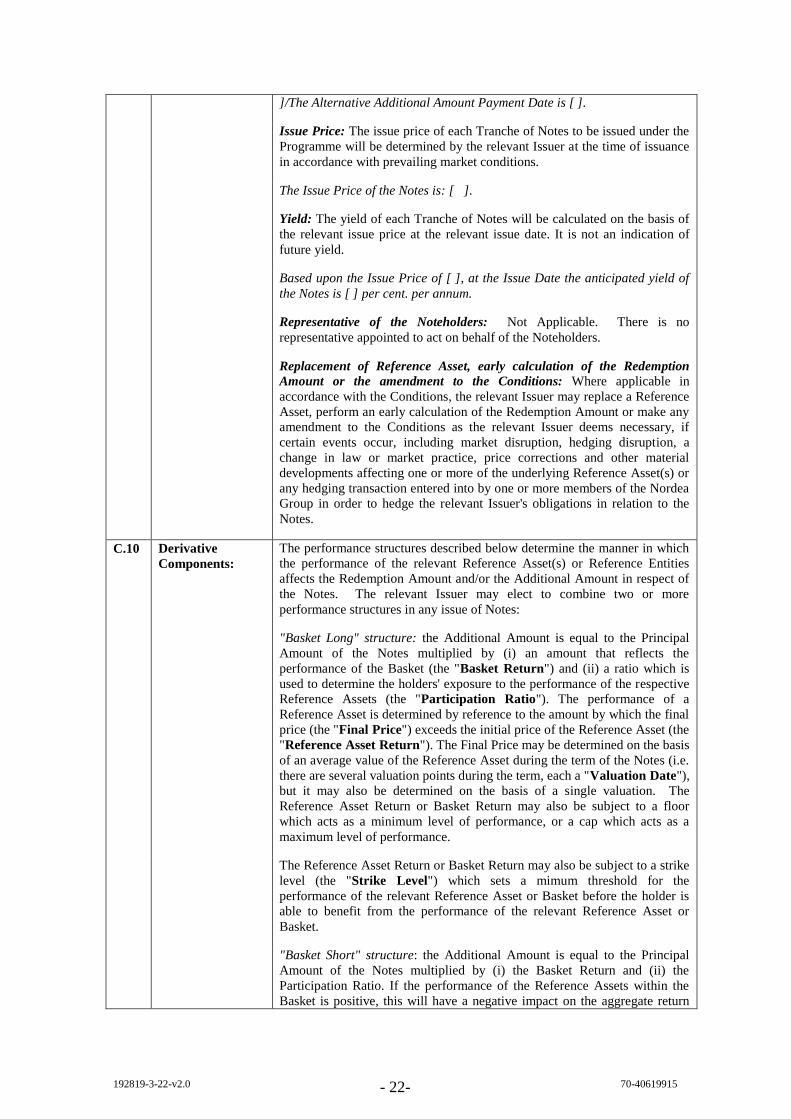
192819-3-22-v2.0 - 22- 70-40619915
]/The Alternative Additional Amount Payment Date is [ ].
Issue Price: The issue price of each Tranche of Notes to be issued under the
Programme will be determined by the relevant Issuer at the time of issuance
in accordance with prevailing market conditions.
The Issue Price of the Notes is: [ ].
Yield: The yield of each Tranche of Notes will be calculated on the basis of
the relevant issue price at the relevant issue date. It is not an indication of
future yield.
Based upon the Issue Price of [ ], at the Issue Date the anticipated yield of
the Notes is [ ] per cent. per annum.
Representative of the Noteholders: Not Applicable. There is no
representative appointed to act on behalf of the Noteholders.
Replacement of Reference Asset, early calculation of the Redemption
Amount or the amendment to the Conditions: Where applicable in
accordance with the Conditions, the relevant Issuer may replace a Reference
Asset, perform an early calculation of the Redemption Amount or make any
amendment to the Conditions as the relevant Issuer deems necessary, if
certain events occur, including market disruption, hedging disruption, a
change in law or market practice, price corrections and other material
developments affecting one or more of the underlying Reference Asset(s) or
any hedging transaction entered into by one or more members of the Nordea
Group in order to hedge the relevant Issuer's obligations in relation to the
Notes.
C.10 Derivative
Components:
The performance structures described below determine the manner in which
the performance of the relevant Reference Asset(s) or Reference Entities
affects the Redemption Amount and/or the Additional Amount in respect of
the Notes. The relevant Issuer may elect to combine two or more
performance structures in any issue of Notes:
"Basket Long" structure: the Additional Amount is equal to the Principal
Amount of the Notes multiplied by (i) an amount that reflects the
performance of the Basket (the "Basket Return") and (ii) a ratio which is
used to determine the holders' exposure to the performance of the respective
Reference Assets (the "Participation Ratio"). The performance of a
Reference Asset is determined by reference to the amount by which the final
price (the "Final Price") exceeds the initial price of the Reference Asset (the
"Reference Asset Return"). The Final Price may be determined on the basis
of an average value of the Reference Asset during the term of the Notes (i.e.
there are several valuation points during the term, each a "Valuation Date"),
but it may also be determined on the basis of a single valuation. The
Reference Asset Return or Basket Return may also be subject to a floor
which acts as a minimum level of performance, or a cap which acts as a
maximum level of performance.
The Reference Asset Return or Basket Return may also be subject to a strike
level (the "Strike Level") which sets a mimum threshold for the
performance of the relevant Reference Asset or Basket before the holder is
able to benefit from the performance of the relevant Reference Asset or
Basket.
"Basket Short" structure: the Additional Amount is equal to the Principal
Amount of the Notes multiplied by (i) the Basket Return and (ii) the
Participation Ratio. If the performance of the Reference Assets within the
Basket is positive, this will have a negative impact on the aggregate return

192819-3-22-v2.0 - 23- 70-40619915
generated by the Basket and, therefore, the return that is payable to
Noteholders. If the performance of the Reference Assets within the Basket is
negative, this will have a positive impact on the aggregate return generated
by the Basket and, therefore, the return that is payable to Noteholders. The
Reference Asset Return and/or Basket Return may also be subject to a cap or
floor as described above.
Unless otherwise specified, the "Basket Return" used in any of the other
performance structures may be calculated either on the "Basket Long" or
"Basket Short" basis, as specified in the relevant Final Terms.
[The Basket Return is determined on the ["Basket Long"/"Basket Short"]
basis/The Basket Return is Not Applicable]
"Barrier outperformance" structure: if the performance of the Basket
exceeds a specified barrier level, the Additional Amount will be a pre-
determined maximum Basket return. If the specified barrier level is not
exceeded, the Additional Amount will be zero.
"Barrier underperformance" structure: the performance of the Basket falls
below a specified barrier level, the Additional Amount will be a pre-
determined maximum Basket return. If the specified barrier level is not
breached, the Additional Amount will be zero.
"Best of/Worst of" Barrier Outperformance" Structure: This is the same as
the "Barrier Outperformance" Structure, save that the observation of the
barrier level and the calculation of the Additional Amount will be
determined by reference to the performance of the Nth best performing
Reference Asset rather than the Basket as a whole. The Nth best performing
Reference Asset will be the Reference Asset with the Nth highest Reference
Asset Return, and "N" shall be the numerical value specified in the relevant
Final Terms.
"Best of/Worst of" Barrier Underperformance" Structure: This is the same
as the "Barrier Underperformance" Structure, save that the observation of
the barrier level and the calculation of the Additional Amount will be
determined by reference to the performance of the Nth best performing
Reference Asset rather than the Basket as a whole.
"Autocallable Structure – Long": if the Basket Return is below a pre-
determined risk barrier level on any relevant observation date (a "Risk
Barrier Observation Date"), the Additional Amount will be calculated by
multiplying the Principal Amount of the Notes by the Participation Ratio
and the lower of the Basket Return and the pre-determined maximum basket
return. If the Basket Return is not below the pre-determined risk barrier level
on any Risk Barrier Observation Date, the Additional Amount will be equal
to the Principal Amount of the Notes multiplied by the Participation Ratio 2
and the higher of (i) Basket Return and (ii) a pre-determined minimum
basket return. A Coupon may also be payable (please refer to Element C.9
for details regarding the Coupon). The Notes will also be subject to early
redemption if the return generated by the Basket exceeds the relevant call
barrier level on any observation date.
"Autocallable Structure – Short": this structure is similar to the
"Autocallable Structure – Long", with the difference being that the positive
performance of the Reference Assets within the Basket will have a negative
impact on the return on the Notes.
"Replacement Basket" structure: the Additional Amount is calculated in a
similar manner to the Basket Long structure, with the difference being that
the returns generated by the best performing Reference Assets are replaced

192819-3-22-v2.0 - 24- 70-40619915
with a pre-determined value for the purposes of determining the overall
performance of the Basket.
"Locally Capped Basket" structure: the Additional Amount is calculated in a
similar manner to the Basket Long Structure or the Basket Short structure,
with the difference being that the return generated by each Reference Asset
is subject to a pre-determined maximum percentage value for the purposes
of determining the overall performance of the Basket.
"Rainbow Basket" structure: the Additional Amount is calculated in a
similar manner to the Basket Long or Basket Short structure, with the
difference being that the weightings of each Reference Asset within the
Basket are determined by reference to the relative performance of each
Reference Asset. The returns of each Reference Asset are measured
separately at maturity and ranked based on the relative performance. The
weightings for each Reference Asset will correspond to the weightings set
out against the relative ranking in the applicable Final Terms.
"Booster" structures: Booster structures have an enhanced positive or
negative return, based on the performance of the underlying Reference
Asset(s). The investor's exposure to the performance of the Reference Assets
may be increased or decreased through the application of different
participation ratios. In a "Booster Long" Structure, the positive performance
of the Reference Assets will have a positive effect on the return on the
Notes. In a "Booster Short" Structure, the positive performance of the
Reference Asset will have a negative effect on the return on the Notes.
"Booster Risk Barrier Long" structure: the Additional Amount will depend
on the return generated by the Basket as compared to a pre-determined
barrier level on any Valuation Date and the initial value of the Basket. If the
Basket Return is at or above the initial basket level on the final Valuation
Date, the Additional Amount will be calculated by multiplying the principal
amount of the Notes by the Participation Ratio and the Basket Return on the
final Valuation Date. If the Basket Return is at or above the barrier level on
each Valuation Date but below the initial basket level on the final Valuation
Date, the Additional Amount will be zero. If the Basket Return is below the
barrier level on any Valuation Date and below the initial basket level on the
final Valuation Date, the Additional Amount will be calculated by reference
to the Basket Return and a different participation ratio, which may result in a
Redemption Amount which is less than the Principal Amount. If the
performance of a Reference Asset within the Basket is positive, this will
have a positive impact on the overall return generated by the Basket. If the
performance of a Reference Asset within the Basket is negative, this will
have a negative impact on the overall return generated by the Basket and
therefore on the Additional Amount.
"Booster Risk Barrier Short" structure: the Additional Amount is calculated
in a similar matter to the "Booster Risk Barrier Long" structure. The
difference is that where the performance of the Basket is positive, this will
have a negative impact on the Additional Amount. If the performance of the
Basket is negative, this will have a positive impact on the Additional
Amount.
In respect of Notes issued on the basis of the terms and conditions of the
contained in the base prospectus dated 20 December 2013, and the
supplement to the base prospectus dated 14 February 2014 (the
"December 2013 Conditions") which are incorporated by reference in this
Base Prospectus, the Booster Risk Barrier structures shall be summarised
as follows:

192819-3-22-v2.0 - 25- 70-40619915
"Booster Risk Barrier Short" structure: the Additional Amount will
depend on the return generated by the Basket as compared to a pre-
determined barrier level on any Valuation Date and the initial value
of the Basket. If the sum of the Basket Return and 1 is at or above
the initial basket level on any Valuation Date, the Additional
Amount will be calculated by multiplying the principal amount of
the Notes by the Participation Ratio and the Basket Return. If the
sum of the Basket Return and 1 is at or above the barrier level on all
Valuation Dates but below the initial basket level on any Valuation
Date, the Additional Amount will be zero. If the sum of the Basket
Return and 1 is below the barrier level on any Valuation Date and
below the initial basket level on any Valuation Date, the Additional
Amount will be calculated by reference to the Basket Return and a
different participation ratio, which will result in a Redemption
Amount which is less than the Principal Amount. If the performance
of a Reference Asset within the Basket is positive, this will have a
negative impact on the overall return generated by the Basket. If the
performance of a Reference Asset within the Basket is negative, this
will have a positive impact on the overall return generated by the
Basket and therefore on the amount payable in respect of the
redemption of the Notes.
"Booster Risk Barrier Long" structure: the Additional Amount is
calculated in a similar matter to the "Booster Risk Barrier Short"
structure. The difference is that where the performance of a
Reference Asset within the Basket is positive, this will have a
positive impact on the overall return generated by the Basket. If the
performance of a Reference Asset within the Basket is negative, this
will have a negative impact on the overall return generated by the
Basket and therefore on the amount payable in respect of the
redemption of the Notes.
The Notes [are/are not] issued on the basis of the December 2013
Conditions
"Twin Win" structure: The Additional Amount is calculated in a manner
similar to the Basket Long Structure – if the performance of the Basket is
positive the Additional Amount will also be positive. If the performance of
the Basket is negative but above a predetermined Barrier Level, then the
Additional Amount will also be positive. If the performance of the Basket is
negative but below the relevant Barrier Level, then the Additional Amount
will also be negative and the Redemption Amount may therefore be less than
the Principal Amount of the Notes.
"Bonus Booster Short" structure: the Additional Amount is calculated in a
similar manner to the "Booster Risk Barrier Short" structure, with the
difference being that if the return generated by the Basket is not below the
barrier level on the relevant Valuation Date(s), the Additional Amount will
be the higher of (i) a pre-determined coupon level and (ii) an amount
calculated by multiplying the Principal Amount of the Notes by the
Participation Ratio and the Basket Return. The positive performance of the
Reference Assets within the Basket will have a negative impact on the
overall return generated by the Basket.
"Bonus Booster Long" structure: the Additional Amount is calculated in a
similar manner to the "Bonus Booster Short" structure. The difference is that
where the performance of the Reference Assets within the Basket is positive,
this will have a positive impact on the overall return generated by the
Basket. If the performance of the Reference Assets within the Basket is
negative, this will have a negative impact on the overall return generated by

192819-3-22-v2.0 - 26- 70-40619915
the Basket.
"Cliquet" structure: the Additional Amount will be based upon the
accumulated sum of the relative percentage changes in the underlying
Basket for a number of pre-determined valuation periods during the term of
the Notes. The following features may also be used: (i) the relative changes
in the underlying Basket can be locally capped/floored for each valuation
period; (ii) the accumulated sum of the relative changes can be subject to a
global cap/floor; and (iii) the product may have a lock-in feature which
means that if the cumulative return on any valuation date has reached a pre-
determined lock-in level, the additional return will be at least equal to the
lock-in level.
"Reverse Cliquet" structure: this is very similar to the "Cliquet" structure
but the additional return payable is calculated by subtracting the relative
percentage changes in the underlying Basket (for a number of pre-
determined valuation periods) from a pre-defined initial coupon.
"Replacement Cliquet" structure: this is very similar to the "Cliquet"
structure, the difference being that the returns generated by a certain number
of the best performing valuation periods are replaced by a pre-defined
figure.
"Reverse Replacement Cliquet" structure: this is very similar to the
"Reverse Cliquet" structure, the difference being that the returns generated
by a certain number of the best performing valuation periods are replaced by
a pre-defined figure.
"Rainbow Replacement Cliquet" structure: the performance of each
individual Reference Asset is calculated on the same basis as the "Cliquet"
structure. The difference here is that the weighting of each Reference Asset
within the basket is determined after the performance of each Reference
Asset is known, following the principle that the best performing underlying
is given the highest weight and so forth.
"Reverse Convertible" structure: if the Basket Return is at or above the
initial basket level, the Redemption Amount will be equal to the Principal
Amount of the Notes. If the Basket Return is below the initial basket level,
the Redemption Amount will be equal to the Principal Amount less an
amount calculated by multiplying the Principal Amount by the Participation
Ratio and the Basket Return, thereby producing a Redemption Amount
which is less than the Principal Amount of the Notes. A positive
performance of the Reference Assets within the Basket will have a positive
effect on the overall return on the Notes, conversely the negative
performance of the individual Reference Assets will have a negative effect
on the overall return on the Notes.
"Reverse Convertible Risk Barrier" structure: if the Basket Return is below
the Barrier Level on any Valuation Date, and on the final Valuation Date the
Basket Return is below the Initial Basket Level, the Redemption Amount
will be calculated by multiplying the Principal Amount of the Notes by the
Participation Ratio and the Basket Return and adding the resulting amount to
the Principal Amount of the Notes (in this case the Redemption Amount will
be less than the Principal Amount of the Notes). Otherwise the Redemption
Amount will be equal to the Principal Amount of the Notes.
"Best of/Worst of Reverse Convertible" structure: the Redemption Amount
is calculated in the same manner as the "Reverse Convertible Risk Barrier"
structure, except that the possible negative payout is determined by
reference to the performance of the Nth best performing Reference Asset (as

192819-3-22-v2.0 - 27- 70-40619915
opposed to the aggregate performance of the Basket).
Worst of Call Option: The Worst of Call Option Structure gives the Holder
an exposure to the worst performing Reference Asset in the Basket. The
Additional Amount payable to the Holder will be the greater of zero, and the
Reference Asset Return of the worst performing Reference Asset.
Outperformance Option: Whereas the Additional Amount in relation to a
normal Basket structure is dependent on the absolute performance of Basket
consisting of one or more Reference Assets, the pay out of an
outperformance structure is dependent on the relative performance of two
Baskets, not on the absolute performance of either Basket. The structure
may compare either two "Basket Long" structures, two "Basket Short"
structures or one "Basket Long" structure and one "Basket Short" structure.
"Non-Tranched CLN" and "Tranched CLN" structures: the Redemption
Amount and, if relevant, interest payments, are based on the weighted losses
in the same or different portfolios of Reference Entities as a result of the
occurrence of one or more Credit Events. For Tranched CLNs, the
occurrence of a Credit Event may have no impact or a more proportional
impact on the Redemption Amount and, if relevant, interest payments. The
Tranche feature is used to determined the portion of losses to which a
Holder will be exposed in the event of a Credit Event affecting one or more
Reference Entities.
"Nth to Default" and "Nth and Nth+1 to Default" structures: the
Redemption Amount and, if relevant, interest payments, are based on the
number and the order of Credit Events in the same Reference Entity
portfolio. For Nth to Default CLNs, while the occurrence of the N-1 Credit
Events has no impact on the Redemption Amount and (if any) interest
payments, the Nth Credit Event will have a more than proportional impact
on these figures. Similarly, for the Nth and Nth+1 to Default CLNs, the
impact of the Nth and Nth+1 Credit Events will have a more than
proportional impact.
Option CLN: the purpose of the structure is to provide exposure to the
development of credit risk (i.e. the risk of Credit Events occurring) in a
specific market, such as European or US investment grade entities, or high
yield borrowers). The exposure is provided through the issuance of Notes
which are linked to index CDS spreads (which represent the cost of buying
protection against Credit Events affecting the entities comprising the
relevant index). Using a single option payout, the Issuers may offer
structures whereby the investor will benefit from a directional movement in
credit spreads, e.g. either if credit spreads increase above a specified level or
decrease below a specified level over the lifetime of the CLN. By
combining two option payouts, the Issuers may offer structures where the
investor would benefit both if credit spreads increase above a specified level
and decrease below a specified level. The Issuers may also offer structures
where the investor would benefit from a directional move in credit spreads,
but where the potential benefit is limited. e.g. where the investor would
benefit if credit spreads decrease down to a certain level, but where a further
decrease below that level will not generate any incremental return. By
combining three or four option payouts, the Issuers may offer additional
structures.
Mark to Market CDS Structure: The structure provides exposure to the
mark-to-market (i.e. termination) value of one or more credit default swaps
referencing the Reference Entities, or index of Reference Entities, specified
in the applicable Final Terms.
192819-3-22-v2.0 - 28- 70-40619915
Digital Long: If the Basket Return on the final Valuation Date exceeds the
Basket Strike Level, the Additional Amount will be equal to the Principal
Amount of the Notes multiplied by the Coupon. If the Basket Return does
not exceed the Basket Strike Level on the final Valuation Date, the
Additional Amount will be zero. The positive performance of the Reference
Assets will have a positive effect on the return on the Notes.
Digital Short: If the Basket Return on the final Valuation Date is below the
Basket Strike Level, the Additional Amount will be equal to the Principal
Amount of the Notes multiplied by the Coupon. If the Basket Return on the
final Valuation Date is equal to or above the Basket Strike Level, the
Additional Amount will be zero. The positive performance of the Reference
Assets will have a negative effect on the return on the Notes.
"Best of/Worst" of digitals: The Digital Long and Digital Short structures
may also be combined with a "Best of/Worst of" feature, whereby the
Additional Amount is calculated by reference to the performance of the Nth
best performing Reference Asset rather than the Basket as a whole.
Worst of Digital Memory Coupon 1: The Worst of Digital Memory Coupon
option is a dependent strip of worst of digital options. The Additional
Amount will be equal to the Principal Amount of the Notes multiplied by the
Coupon and N. N is the greatest Valuation Date number on which the
Reference Asset Return of the worst performing Reference Asset within the
Basket is greater than or equal to the relevant barrier level on each Valuation
Date up to and including the then current Valuation Date (first valuation date
= 1, second = 2 etc).
"Series of Digitals": the Redemption Amount is determined by the
percentage of Reference Assets within the Basket that are above a pre-
determined barrier level on each Valuation Date.
"Delta 1 Structure": the Redemption Amount will be equal to the
redemption proceeds received by the relevant Issuer (or another entity within
the Nordea Group) from unwinding a hedge position designed to replicate
the risks and returns of a direct investment in the relevant Reference Assets;
less (i) a structuring fee payable to the relevant Issuer and (ii) any applicable
taxes. A Delta 1 Structure effectively replicates the gains or losses that an
investor would realise through a direct holding of the relevant Reference
Assets. If it is not possible for the hedging entity to redeem the Reference
Assets before the scheduled maturity date or if the hedging entity determines
that it will not receive the full amount of the redemption proceeds before the
scheduled maturity date, a deferred redemption will occur and the relevant
Issuer may make a partial redemption of the Notes as and when the relevant
hedging party receives a material part of the redemption proceeds, or cancel
the Notes without making any payment to the holders if the relevant Issuer
determines that the redemption proceeds will not be received prior to the
specified long-stop date.
"Inflation Linker": the Redemption Amount will be the Principal Amount of
the Notes, multiplied by the higher of a minimum redemption percentage
(expressed as a percentage of the principal amount of the Notes) and the
result obtained by dividing the Inflation Rate on the final Valuation Date by
the Inflation Rate on the initial Valuation Date.
"Barrier outperformance" structure 2: if the Basket Return on any Valuation
Date exceeds the Barrier Level, the Additional Amount will be calculated as
the Principal Amount of the Notes multiplied by the Participation Ratio and
multiplied by the higher of the Coupon and the Basket Return. If the sum or
the Basket Return and 1 does not exceed the Barrier Level on any Valuation

192819-3-22-v2.0 - 29- 70-40619915
Date, the Additional Amount will be zero.
"Barrier Underperformance" structure 2: if the Basket Return on any
Valuation Date falls below the Barrier Level, the Additional Amount will be
calculated as the Principal Amount of the Notes multiplied by the
Participation Ratio and multiplied by the higher of the Coupon and the
Basket Return. If the Basket Return does not fall below the Barrier Level on
any Valuation Date, the Additional Amount will be zero.
Target Volatility Structure: If the Target Volatility Structure is applicable to
the Notes, the deemed exposure to the underlying Reference Asset(s) or
Basket (the "Exposure") is determined by comparing:
(i) the short term historical volatility of the underlying Basket; and
(ii) a target volatility level (the "Target Volatility"),
subject to a pre-determined cap or floor.
When the short-term historical volatility of the underlying Reference
Asset(s) or Basket increases, the deemed Exposure to the underlying
Reference Asset(s) or Basket decreases, and when the short-term historical
volatility of the underlying Reference Asset(s) or Basket decreases, the
deemed exposure to the underlying Reference Asset(s) or Basket increases.
Booster Risk Barrier 2: The Booster Risk Barrier 2 structure is a
combination of an "at the money" call option, and an "out of the money" put
option. The strike price for the call option is set at the prevailing price of the
Reference Asset or Basket as at the issue date of the relevant Notes. If the
value of the Reference Assets or Basket exceeds a pre-determined barrier
level, the Additional Amount will be calculated by multiplying the Principal
Amount of the Notes by the Participation Ratio and by the Basket Return
(calculated on the "Basket Long" basis described above). The strike price for
the put option is set below the prevailing price of the Reference Asset or
Basket at the issue date of the relevant Notes, and so if the value of the
Reference Asset or Basket depreciates below the specified barrier level, the
Additional Amount will be calculated by multiplying the Principal Amount
of the Notes by the Participation Ratio 2 and the Basket Return (calculated
on the "Basket Short" basis described above).
Autocallable Rate Structure: If the value of an underlying Reference Rate
either out-performs or under-performs a pre-determined barrier level, as
specified in the relevant Final Terms (the "Autocall Condition"), the Notes
will be subject to early redemption. If the Autocall Condition is not
satisfied prior to the final Valuation Date, the Notes will be redeemed on the
Redemption Date.
In and Out Options: the "In" and "Out" option structures are barrier options,
which generate an Additional Amount depending on whether or not the
Basket Return is above or below a predetermined barrier level specified in
the Final Terms (the "Barrier Level"). The "Up and In" option structures
will generate an Additional Amount linked to the performance of the
relevant Basket if the Basket Return is at or above the relevant Barrier Level
on any Valuation Date. In a "Down and In" option structure, an Additional
Amount will be generated if the Basket Return is at or below the relevant
Barrier Level on any Valuation Date. The Additional Amount may be
positive or negative depending on whether or not the Option type is a
"bought" option or a "sold" option respectively.
The "Up and Out" option structures generate an Additional Amount linked
to the performance of the relevant Basket if the Basket return is at or below

192819-3-22-v2.0 - 30- 70-40619915
the relevant Barrier Level on all Valuation Dates. In a "Down and Out"
option structure an Additional Amount will be generated if the Basket
Return is at or above the relevant Barrier Level on all Valuation Dates. The
Additional Amount may be positive or negative depending on whether or
not the Option type is a "bought" option or a "sold" option respectively.
Each of the "In" and "Out" option structures may be based on either an
underlying "Basket Long" or "Basket Short" structure. The "In" and "Out"
option structures may also pay a fixed rate of return know as a ‘coupon’ or a
‘rebate’ in the event that they do not generate an Additional Amount linked
to the performance of the relevant Basket. In a "bought" option structure the
coupon or rebate will be payable to the Noteholder, whereas in a "sold"
option structure the coupon or rebate will be payable by the Noteholder and
may therefore result in a negative Additional Amount (which may be
deducted from the Base Redemption Amount).
"In" and "Out" Option structure: [In Option- Basket Long/In Option –
Basket Short/Out Option – Basket Long/Out Option – Basket Short/Not
Applicable]
Option Type: [Bought Up and In/Sold Up and In/Bought Down and In/Sold
Down and In/Bought up and Out/Sold Up and Out/Bought Down and
Out/Sold Down and Out/Not Applicable]
The applicable performance structure(s) is/are: [ ].
[The underlying Basket Return Structure is the Basket Long/Basket Short
Structure]/[Not applicable]
FX Components: if FX components are applied to one or more performance
structures set out above, the Reference Asset Return, the Additional Amount
or the Base Redemption Amount may be adjusted by multiplying them by a
factor which reflects the variation in one or more foreign exchange rates
during the relevant time periods being measured or observed. If "FX
Component- Composite" is specified as applicable in the relevant Final
Terms, the adjustment to reflect the relevant exchange rate will be applied
before the Strike Level is take into account when determining the relevant
Reference Asset Return.
[The FX Component [-Composite] is applicable to the Reference Asset
Return/The Additional Amount/The Base Redemption Amount] [The FX
Component is Not Applicable]
Best of/Worst of Modifier: if the Best Of/Worst Of Modifier is applied to
one or more performance structures set out above, then the relevant
observations, valuations and calculations of the Additional Amount shall be
determined by reference to the performance of the Nth best performing
Reference Asset, rather than the Basket as whole. N will be a pre-
determined value that is specified in the Final Terms.
[The Best of/Worst of Modifier is Applicable and the value of N is: [ ]/Not
Applicable]
Lookback Initial Price Modifier: if the Lookback Initial Price Modifier is
applicable to the Notes, the Additional Amount in relation to the Notes will
be calculated by reference to either the highest or the lowest initial price (at
the start of any Valuation Period) in respect of the relevant Basket or
Reference Asset, as specified in the Final Terms.
[The Lookback Initial Price Modifier is Applicable/Not Applicable]

192819-3-22-v2.0 - 31- 70-40619915
Lookback Final Price Modifier: if the Lookback Final Price Modifier is
applicable to the Notes, the Additional Amount in relation to the Notes will
be calculated by reference to either the highest or the lowest Final Price (at
the end of any Valuation Period) in respect of the relevant Basket or
Reference Asset, as specified in the Final Terms.
[The Lookback Final Price Modifier is Applicable/Not Applicable]
Lock-in Modifier: if the Lock-in Modifier is applicable to the Notes, the
Basket Return shall be replaced by the Lock-in Basket Return for the
purposes of calculating the Additional Amount in accordance with one or
more of the foregoing performance structure(s). The "Lock-in Basket
Return" will be the pre-determined percentage which corresponds to the
highest lock in level which is reached or exceeded by the Basket Return on
any Valuation Date.
[The Lock-in Modifier is Applicable/Not Applicable]
Combination of Structures: the relevant Issuer may elect to combine one or
more of the performance structures described above in relation to a
particular issue of Notes. If "Addition" is specified in the Final Terms, the
total Additional Amount payable will be equal to the sum of the various
Additional Amounts that are applicable, multiplied in each case by a
percentage which reflects the overall share of the total return which the
relevant Issuer intends each performance structure to contribute. If
"Subtraction" is specified in the Final Terms, one Additional Amount will be
subtracted from another. If "Alternative Calculation" is specified in the Final
Terms, the applicable performance structure used to determine the
Additional Amount will differ depending on whether or not the Basket
Return on a particular Valuation Date has exceeded one or more pre-
specified Barrier Levels, as set out in the relevant Final Terms.
[Not Applicable/Combination of Structures is Applicable and the relevant
Performance Structures are listed above. The method of combination is
Addition/Subtraction/Alternative Calculation.]
Maximum Redemption Amount: If a maximum Redemption Amount is
applicable, the Redemption Amount will be the lesser of: (i) the amount
calculated on the basis of one or more of the performance structures outlined
above, and (ii) a pre-determined maximum redemption amount as specified
in the Final Terms.
Not Applicable/the Maximum Redemption Amount is [ ]
"Minimum Redemption Amount": if a minimum redemption amount is
applicable, the Redemption Amount will be the greater of (i) the amount
calculated in accordance with one of the performance structures outlined
above and (ii) a pre-determined minimum redemption amount as specified in
the Final Terms.
Not Applicable/the Minimum Redemption Amount is [ ]
Maximum and Minimum Redemption Amount: If both a maximum and a
minimum Redemption Amount are applicable, the Redemption Amount will
be the greater of: (i) the Minimum Redemption Amount and (ii) the lower of
(x) the amount calculated on the basis of one or more of the performance
structures specified above and (y) the Maximum Redemption Amount.
"Inflation-Protected Principal": if specified as applicable, the Redemption
Amount determined in accordance with the performance structures and/or
Additional Amount(s) outlined above will be multiplied by the performance
of a specified inflation measure, such as the consumer price index, during

192819-3-22-v2.0 - 32- 70-40619915
the term of the Notes.
Inflation-Protected Principal is Applicable/Not Applicable
TOM Cumulative Strategy: The TOM Cumulative Strategy replicates an
investment in particular Reference Assets (the "Risky Assets") that is only
made for a limited time period in each calendar month. At other times the
Notes replicate an investment in a time deposit or other fixed income
investment. The Final Terms will specify which days in any calendar month
will be treated as an investment in the Risky Assets, and which days will be
treated as an investment in a fixed income investment (the "Non Risky
Assets"), for the purposes of calculating the overall Additional Amount
payable in relation to the Notes.
The performance of the Risky Assets only, or the performance of both the
Risky Assets and the Non Risky Assets (as applicable), may also be
averaged across a pre-specified number of calendar months leading up to the
Redemption Date in respect of the Notes, in order to reduce the Notes’
exposure to volatility in the performance of the underlying Reference Assets
towards the end of the Notes' term.
The TOM Cumulative Strategy is [Applicable/Not Applicable]
Lock-in Basket Floor: if the Lock-in Basket Floor is applicable to the Notes,
then if the Basket Return exceeds the Barrier Level on any Valuation Date,
the Basket Return will be replaced with the higher of the Basket Return and
a pre-determined minimum Basket Return for the purposes of determining
the Additional Amount in accordance with the relevant performance
structure.
The Lock-in Basket Floor is [Applicable/Not Applicable]
C.11
C.21
Listing and
Trading:
Applications have been made for Notes to be admitted during the period of
twelve months after the date hereof to listing on the official list and to
trading on the regulated market of the Irish Stock Exchange. The
Programme also permits Notes to be issued on the basis that they will not be
admitted to listing, trading and/or quotation by any competent authority,
stock exchange and/or quotation system or to be admitted to listing, trading
and/or quotation by such other or further competent authorities, stock
exchanges and/or quotation systems as may be agreed with the relevant
Issuer.
The Notes are unlisted Notes/Application will be made for the Notes to be
admitted to listing on [ ] and to trading on [ ] effective as of [ ].
C.156 Value of the Notes
and Value of the
Underlying:
The value of the Notes will be determined by reference to the value of the
underlying Reference Asset(s) and the performance structure(s) applicable to
the Notes. Details on the various performance structures and the relationship
between the value of the Notes and the value of the underlying in each case
are set out in Element C.10.
Details of the applicable performance structure(s) and the return on the
Notes are set out in Element C.10.
The structure of the Notes may contain a Participation Ratio or other
leverage or gearing factor which is used to determine the exposure to the
respective Reference Asset(s), i.e. the proportion of the change in value
which accrues to the investor in each individual Note. (The exposure to the
relevant Reference Asset(s) may also be affected by the application of the
Target Volatility Strategy, as described in element C.10 above). The
6 Elements c.15-20 (inclusive) shold be delted in the case of a straight debt issuance.

192819-3-22-v2.0 - 33- 70-40619915
Participation Ratio is set by the relevant Issuer and is determined by, among
other things, the term, volatility, market interest rate and expected return on
the Reference Asset.
The [indicative] Participation Ratio is: [ ]
C.16 Exercise Date or
Final Reference
Date:
Subject to early redemption, the exercise date (or the final Redemption Date)
will be the maturity date of the Notes.
The maturity date of the Notes is: [ ]
C.17 Settlement
Procedure:
The date(s) upon which the performance of a Reference Asset is measured
or observed ("Valuation Date(s)" or the "Observation Date(s)") will be set
out in the relevant Final Terms, and may consist of multiple dates
("Averaging Dates") on which the performance is observed and averaged
for the purchase of calculating the return on the Notes.
[The Valuation Date(s) [and the related Averaging Dates] are: [ ]]
[The Observation Date(s) [and the related Averaging Dates] are: [ ]]
Settlement of any Notes that are represented by a Global Note shall take
place on the relevant payment date and will be effected by the relevant
Issuer paying the applicable amounts of principal and/or interest to the
relevant Paying Agents for onward transmission to Euroclear and
Clearstream, Luxembourg. Investors will receive their redemption monies
through their accounts in Euroclear and Clearstream, Luxembourg in
accordance with the standard settlement procedures of Euroclear and
Clearstream, Luxembourg.
In respect of Notes that are in definitive form, payment of the Redemption
Amount (or Early Redemption Amount, if applicable) will be made against
presentation and surrender of the individual Note at the specified office of
any paying agent or registrar.
Settlement of VP Notes shall take place in accordance with the VP Rules,
settlement of VPS Notes shall take place in accordance with the VPS
Rules, settlement of Swedish Notes shall take place in accordance with the
Euroclear Sweden Rules and settlement of Finnish Notes shall take place
in accordance with the Euroclear Finland Rules.
Settlement of the Notes shall take place: [ ]
C.18 The Return: The return or Redemption Amount that is payable to investors will be
determined by reference to the performance of the underlying Reference
Assets/Entities within a particular interest structure or performance
structure that is applicable to the Notes. Details on the various interest and
performance structures are set out in elements C.9 and C.10.
Details of the applicable interest and performance structure(s) and the
return on the Notes are set out in Elements C.9 and C.10.
C.19 Exercise Price or
Final Reference
Price:
The final reference price of the relevant Reference Asset(s) will have an
impact on the Redemption Amount that is payable to investors. The final
reference price will be determined on the applicable Valuation Date(s) set
out in the relevant Final Terms.
The final reference price of the Reference Assets will be calculated as the
[closing price]/[average of the closing prices] as published by [•] on each
of the [•], [•] and [•].

192819-3-22-v2.0 - 34- 70-40619915
C.20 Type of
Underlying:
The underlying may constitute one or a combination of the following:
equities, indices, reference entities, interest rates, funds, commodities or
currencies.
The type of underlying is: [ ].
Section D - Risks
D.2 Risks Specific to
the Issuers:
In purchasing Notes, investors assume the risk that the relevant Issuer may
become insolvent or otherwise be unable to make all payments due in
respect of the Notes. There is a wide range of factors which individually or
together could result in the relevant Issuer becoming unable to make all
payments due in respect of the Notes. It is not possible to identify all such
factors or to determine which factors are most likely to occur, as the
relevant Issuer may not be aware of all relevant factors and certain factors
which it currently deems not to be material may become material as a
result of the occurrence of events outside the relevant Issuer's control. The
Issuers have identified in the Base Prospectus a number of factors which
could materially adversely affect its respective business and ability to make
payments due under the Notes. These factors include:
Risks relating to current macroeconomic conditions
Risks related to the European economic crisis and economic uncertainty
relating to China have had and, despite the recent period of moderate
stabilisation, may continue to have, a negative impact on global economic
activity and the financial markets. If these conditions continue to persist,
or should there be any further turbulence in these or other markets, this
could have a material adverse effect on the Nordea Group's ability to
access capital and liquidity on financial terms acceptable to the Nordea
Group.
Furthermore, the Nordea Group's performance is significantly influenced
by the general economic condition in the countries in which it operates, in
particular the Nordic markets (Denmark, Finland, Norway and Sweden).
Negative economic developments and conditions in the markets in which it
operates can adversely affect its business, financial condition and results of
operations, and measures implemented by the Nordea Group might not be
satisfactory to reduce any credit, market and liquidity risks.
Risks relating to the Nordea Group's credit portfolio
Adverse changes in the credit quality of the Nordea Group's borrowers and
counterparties or a decrease in collateral values are likely to affect the
recoverability and value of the Nordea Group's assets and require an
increase in its individual provisions and potentially in collective provisions
for impaired loans. A significant increase in the size of the Nordea
Group's allowance for loan losses and loan losses not covered by
allowances would have a material adverse effect on the Nordea Group's
business, financial condition and results of operations.
The Nordea Group is exposed to counterparty credit risk, settlement risk
and transfer risk on transactions executed in the financial services industry
and its transactions in financial instruments. If counterparties default on
their obligations, this could have a material adverse effect on the Nordea
Group's business, financial condition and results of operations.
Risks relating to market exposure
The value of financial instruments held by Nordea Group are sensitive to
volatility of and correlations between various market variables, including
interest rates, credit spreads, equity prices and foreign exchange rates.

192819-3-22-v2.0 - 35- 70-40619915
Write-downs or realise impairment charges may have a material adverse
effect on the Nordea Group's business, financial condition and results of
operations, while the performance of financial markets and volatile market
conditions could result in a significant decline in the Nordea Group's
trading and investment income, or result in a trading loss.
The Nordea Group is exposed to structural market risk
The Nordea Group is exposed to structural interest income risk when there
is a mismatch between the interest rate re-pricing periods, volumes or
reference rates of its assets, liabilities and derivatives. It is also exposed to
currency translation risk primarily as a result of its Swedish and
Norwegian banking businesses, as it prepares its consolidated financial
statements in its functional currency, the euro. Any mismatch in any given
period in the event of changes in interest rates, or failure to successfully
hedge currency risk exposure, could have a material adverse effect on the
Nordea Group's financial condition and results of operations.
Risks relating to liquidity and capital requirements
A substantial part of the Nordea Group's liquidity and funding
requirements is met through reliance on customer deposits, as well as
ongoing access to wholesale lending markets, including issuance of long-
term debt market instruments such as covered bonds. Turbulence in the
global financial markets and economy may adversely affect the Nordea
Group's liquidity and the willingness of certain counterparties and
customers to do business with the Nordea Group.
The Nordea Group's business performance could be affected if the capital
adequacy ratios it is required to maintain under the legislative package
comprising Directive 2013/36/EU, Regulation (EU) No. 575/2013 and any
regulatory capital rules or regulations, or other requirements, which are
applicable to the Issuers or the Nordea Group and which prescribe (alone
or in conjunction with any other rules or regulations) the requirements to
be fulfilled by financial instruments for their inclusion in the regulatory
capital of the Issuers or the Nordea Group (on a solo or consolidated basis,
as the case may be) to the extent required by Directive 2013/36/EU or
Regulation (EU) No. 575/2013, including for the avoidance of doubt any
regulatory technical standards released by the European Banking Authority
(or any successor or replacement thereof) ("CRD IV") are reduced or
perceived to be inadequate.
The Nordea Group's funding costs and its access to the debt capital
markets depend significantly on its credit ratings. A reduction in credit
ratings could adversely affect the Nordea Group's access to liquidity and its
competitive position, and therefore, have a material adverse effect on its
business, financial condition and results of operations.
Other risks relating to the Nordea Group's business
The Nordea Group's business operations are dependent on the ability to
process a large number of complex transactions across different markets in
many currencies and operations are carried out through a number of
entities. Although the Nordea Group has implemented risk controls and
taken other actions to mitigate exposures and/or losses, there can be no
assurances that such procedures will be effective in controlling each of the
operational risks faced by the Nordea Group, or that the Nordea Group's
reputation will not be damaged by the occurrence of any operational risks.
The Nordea Group's operations in Russia and the Baltic countries which
are typically more volatile and less developed economically and politically

192819-3-22-v2.0 - 36- 70-40619915
than markets in Western Europe and North America – present various risks
that do not apply, or apply to a lesser degree, to its businesses in the Nordic
markets. Additionally, some of these markets are typically more volatile
and less developed economically and politically than markets in Western
Europe and North America.
The Nordea Group's performance is, to a large extent, dependent on the
talents and efforts of highly skilled individuals, and the continued ability of
the Nordea Group to compete effectively and implement its strategy
depends on its ability to attract new employees and retain and motivate
existing employees. New regulatory restrictions, such as the recently
introduced limits on certain types of remuneration paid by credit
institutions and investment firms set forth in CRD IV, could adversely
affect the Nordea Group's ability to attract new employees and retain and
motivate existing employees. Any loss of the services of key employees,
particularly to competitors, or the inability to attract and retain highly
skilled personnel in the future could have an adverse effect on the Nordea
Group's business.
There is competition for the types of banking and other products and
services that the Nordea Group provides and there can be no assurances
that the Nordea Group can maintain its competitive position.
Risks relating to the legal and regulatory environments in which the
Nordea Group operates
The Nordea Group is subject to substantial regulation and oversight by a
number of different regulators as well as laws and regulations,
administrative actions and policies in each of the jurisdictions in which it
operates, all of which are subject to change, and compliance with which
may from time to time require significant costs.
The Nordea Group may incur substantial costs in monitoring and
complying with new capital adequacy and recovery and resolution
framework requirements, which may also impact existing business models.
In addition, there can also be no assurances that breaches of legislation or
regulations by the Nordea Group will not occur and, to the extent that such
a breach does occur, that significant liability or penalties will not be
incurred.
In the ordinary course of its business, the Nordea Group is subject to
regulatory oversight and liability risk and is involved in a variety of claims,
disputes, legal proceedings and governmental investigations in
jurisdictions where it is active. These types of claims and proceedings
expose the Nordea Group to monetary damages, direct or indirect costs
(including legal costs), direct or indirect financial loss, civil and criminal
penalties, loss of licences or authorisations, or loss of reputation, as well as
the potential for regulatory restrictions on its businesses.
The Nordea Group's activities are subject to tax at various rates around the
world computed in accordance with local legislation and practice.
Legislative changes or decisions by tax authorities may impair the present
or previous tax position of the Nordea Group.
D.3 Risks Specific to
the Notes:
There are also risks related to any issue of Notes under the Programme and
specific types of Notes, which prospective investors should carefully
consider and make sure they understand prior to making any investment
decision with respect to the Notes, including:
Complexity of the product – the performance structure for
structured Notes is sometimes complex and may contain

192819-3-22-v2.0 - 37- 70-40619915
mathematical formulae or relationships which, for an investor,
may be difficult to understand and compare with other investment
alternatives. In addition, the relationship between yield and risk
may be difficult to assess.
Notes which are not principal protected – Notes that are not
principal protected may be issued under the Programme. If the
Note is not principal protected, there is no guarantee that the
return that an investor receives on the Notes upon their redemption
will be greater than or equal to the principal amount.
Pricing of structured Notes – the pricing of structured notes is
normally decided by the relevant Issuer rather than being
determined on the basis of negotiated terms. There may, therefore,
be a conflict of interest between the relevant Issuer and the
investors, to the extent that the relevant Issuer is able to influence
pricing and is looking to make a gain or avoid a loss in relation to
the underlying Reference Assets. The relevant Issuer does not
have a fiduciary duty to act in the best interests of Noteholders.
Performance of the Reference Assets – with structured Notes, the
Noteholder's right to yield and sometimes the repayment of
principal depends on the performance of one or more Reference
Assets and the applicable performance structure. The value of a
structured Note will be affected by the value of the Reference
Assets at specific points during the term of the relevant Notes, the
intensity of the price fluctuations of the Reference Asset(s),
expectations regarding future volatility, market interests rates and
expected distributions on the Reference Asset(s).
Currency fluctuations. Foreign exchange rates may be affected by
complex political and economic factors, including relative rates of
inflation, interest rate levels, the balance of payments between
countries, the extent of any governmental surplus or deficit and the
monetary, fiscal and/or trade policies pursued by the governments
of the relevant currencies. Currency fluctuations may affect the
value or level of the Reference Assets in complex ways. If such
currency fluctuations cause the value or level of the Reference
Assets to vary, the value or level of the Notes may fall. If the
value or level of one or more Reference Asset(s) is denominated in
a currency that is different from the currency of the Notes,
investors in the Notes may be subject to increased foreign
exchange risk. Previous foreign exchange rates are not necessarily
indicative of future foreign exchange rates.
Equities as Reference Assets – equity-linked Notes are not
sponsored or promoted by the issuer of the equities. The equity
issuer does not, therefore, have an obligation to take into account
the interests of the investors in the Notes and so the actions of
such equity issuer could adversely affect the market value of the
Notes. The investor in the Notes is not entitled to receive any
dividend payments or other distributions to which a direct holder
of the underlying equities would otherwise be entitled.
Indices as Reference Assets – Notes that reference indices as
Reference Assets may receive a lower payment upon redemption
of such Notes than an investor would have received if he or she
had invested directly in the equities/assets that comprise the index.
The sponsor of any index can add, delete, substitute components
or make methodological changes that could affect the level of such
index and hence the return that is payable to investors in the

192819-3-22-v2.0 - 38- 70-40619915
Notes. The Nordea Group may also participate in creating,
structuring and maintaining index portfolios or strategies and for
which it may act as index sponsor (collectively, "Proprietary
Indices"). The Issuers may therefore face conflicts of interest
between their obligations as the Issuer of such Notes and their role
(or the role of their affiliates) as the composers, promoters,
designers or administrators of such indices.
Commodities as Reference Assets – trading in commodities is
speculative and may be extremely volatile as commodity prices
are affected by factors that are unpredictable, such as changes in
supply and demand relationships, weather patterns and
government policies. Commodity contracts may also be traded
directly between market participants "over-the-counter" in trading
facilities that are subject to minimal or no substantive regulation.
This increases the risks relating to the liquidity and price histories
of the relevant contracts. Notes that are linked to commodity
future contracts may provide a different return than Notes linked
to the relevant physical commodity, as the price of a futures
contract on a commodity will generally be at a premium or at a
discount to the spot price of the underlying commodity.
Exposure to a basket of Reference Assets – where the underlying is
to one or more baskets of Reference Assets, the investors bear the
risk of the performance of each of the basket constituents. Where
there is a high level of interdependence between the individual
basket constituents, any move in the performance of the basket
constituents will exaggerate the performance of the Notes.
Moreover, a small basket or an unequally weighted basket will
generally leave the basket more vulnerable to changes in the value
of any particular basket constituent. Any calculation or value that
involves a basket with "best of" or "worst of" features may
produce results that are very different to those that take into
account the performance of the basket as a whole.
Credit-Linked Notes – an investment in credit-linked Notes entails
exposure to the credit risk of a particular Reference Entity or
basket of Reference Entities in addition to that of the relevant
Issuer. A fall in the creditworthiness of a Reference Entity can
have a significant adverse impact on the market value of the
related Notes and any payments of principal/interest due. Upon the
occurrence of a Credit Event, the relevant Issuer's obligation to
pay principal may be replaced by an obligation to pay other
amounts calculated by reference to the value of the Reference
Entity. As none of the Reference Entities contributed to the
preparation of the Base Prospectus, there can be no assurance that
all material events or information regarding the financial
performance and creditworthiness of Reference Entities have been
disclosed at the time the Notes are issued.
Automatic early redemption – certain types of Notes will be
automatically redeemed prior to their scheduled maturity date if
certain conditions are met. In some circumstances, this may result
in a loss of part or all an investor's investment.
Notes subject to optional redemption by the Issuer – an optional
redemption feature is likely to limit the market value of the Notes.
Notes issued at a substantial discount or premium – the market
value of Notes of this type tends to fluctuate more in relation to
general changes in interest rates than do prices for conventional

192819-3-22-v2.0 - 39- 70-40619915
interest-bearing securities.
There are also certain risks relating to the Notes generally, such as
modification and waivers and change of law.
D.6 Risk Warning:7 An investment in relatively complex securities such as the Notes involves a
greater degree of risk than investing in less complex securities. In
particular, in some cases, investors may stand to lose the value of their
entire investment or part of it, as the case may be.
Section E - Offer
E.2b Reasons for the
Offer and Use of
Proceeds:
Unless otherwise specified, the net proceeds of any issue of Notes will be
used for the general banking and other corporate purposes of the Issuers
and the Nordea Group.
[The net proceeds of the issue will be used for: [ ]]
E.3 Terms and
Conditions of the
Offer:
Any investor intending to acquire or acquiring any Notes from an
Authorised Offeror will do so, and offers and sales of the Notes to an
investor by an Authorised Offeror will be made, in accordance with any
terms and other arrangements in place between such Authorised Offeror
and such Investor including as to price, allocation and settlement
arrangements. A Public Offer of the Notes will take place in the Public
Offer Jurisdiction(s) during the Offer Period. [Summarise details of the
Public Offer included in the "Distribution–Public Offer" and "Terms and
Conditions of the Offer" items in Part B of the Final Terms.]
E.4 Interests Material
to the Issue:
Dealers or Authorised Offerors may be paid fees in relation to the issue of
the Notes under the Programme.
So far as the Issuer is aware, no person involved in the issue of the Notes
has an interest material to the offer./[ ].
E.7 Estimated
Expenses:
It is not anticipated that the relevant Issuer will charge any expenses to
investors in connection with any issue of Notes. Other Authorised Offerors
may, however, charge expenses to investors. Any expenses chargeable by
an Authorised Offeror to an investor shall be charged in accordance with
any contractual arrangements agreed between the Investor and such
Authorised Offeror at the time of the relevant offer. Such expenses (if any)
will be determined on a case by case basis.
No expenses are being charged to an investor in the Notes by the Issuer [or
any Authorised Offeror]./The Authorised Offeror(s) will charge expenses
to investors. The estimated expenses chargeable to investors by the
Authorised Offeror(s) are [ ].
7 To be deleted in the case of a straight debt issuance.

192819-3-22-v2.0 - 40- 70-40619915
Denna sammanfattning är en inofficiell översättning av den sammanfattning som återfinns
omedelbart före detta avsnitt och investerare skall läsa och ta till sig den engelska versionen av
sammanfattningen då denna kan avvika från den svenska översättningen.
SAMMANFATTNING AV GRUNDPROSPEKTET
Sammanfattningar består av informationskrav vilka redogörs för i ett antal punkter. Punkterna är
numrerade i avsnitt A–E (A.1–E.7).
Denna sammanfattning innehåller alla de punkter som krävs i en sammanfattning för aktuella typer av
värdepapper och emittenter. Eftersom vissa punkter inte är tillämpliga för denna typ av värdepapper och
emittenter, kan det finnas luckor i punkternas numrering.
Även om det krävs att en punkt inkluderas i en sammanfattning för aktuella typer av värdepapper och för
den relevanta emittenten, är det möjligt att ingen relevant information kan ges rörande punkten.
Informationen har då ersatts med angivelsen "Ej tillämpligt".
Särskilt punkter i kursiv stil betecknar utrymmen för att färdigställa den emissionsspecifika
sammanfattningen för en Tranch av Lån för vilka en sådan emissionsspecifik sammanfattning ska
förberedas.
Ord och uttryck som definieras i avsnitten som kallas "Allmänna Villkor" eller på andra ställen i detta
Grundprospekt har samma betydelse i denna sammanfattning.
Avsnitt A – Inledning och varningar
A.1 Inledning Denna sammanfattning ska läsas som en inledning till detta
Grundprospekt och varje beslut om att en placering i dessa Lån ska
baseras på en bedömning av Grundprospektet i dess helhet av
investeraren. Om ett yrkande gällande informationen i detta
Grundprospekt framförs inför domstol i en Medlemsstat i det Europeiska
Ekonomiska Samarbetsområdet kan käranden enligt den nationella
lagstiftningen i Medlemsstaterna bli skyldig att stå för kostnaderna för att
översätta Grundprospektet innan de rättsliga förfarandena inleds. Inget
civilrättsligt ansvar kommer kunna göras gällande mot Emittenterna i
någon sådan Medlemsstat enbart på grund av denna sammanfattning,
inklusive alla översättningar av den, såvida den inte är vilseledande,
felaktig eller oförenlig när den läses tillsammans med de andra avsnitten
av detta Grundprospekt eller om den inte innehåller, när den läses
tillsammans med de andra avsnitten i detta Grundprospekt, relevant
information för att hjälpa investerare att fatta beslut om att investera i
Lånen.
A.2 Samtycke: Vissa Trancher av Lån med valörer om mindre än € 100 000 (eller ett
motsvarande värde i någon annan valuta) kan komma att erbjudas under
omständigheter där det inte finns något undantag från förpliktelsen enligt
Prospektdirektivet att publicera ett prospekt. Alla sådana erbjudanden
kallas ett "Erbjudande till Allmänheten".
Emittenten samtycker till användning av detta Grundprospekt i samband
med ett Erbjudanden till Allmänheten av Lånen av en finansiell
mellanhand som är behörig att lämna sådana erbjudanden enligt
direktivet om Marknader för Finansiella Instrument (direktiv
2004/39/EG) (en "Behörig Säljare") på följande förutsättningar: (a) det
relevanta Erbjudandet till Allmänheten måste inträffa under perioden
från och med [•] till men inte inklusive [ ] ("Erbjudandeperioden") i [•]
[och [•]] ("Erbjudanden till Allmänheten - Jurisdiktioner") och (b) den
relevanta Behöriga Säljaren måste ha godkänt Villkoren för Behöriga
Säljare [och uppfylla följande ytterligare villkor: [•]]./Emittenten
samtycker till användning av detta Grundprospekt i samband med ett
Erbjudande till Allmänheten av Lånen av [•] (en "Behörig Säljare") på

192819-3-22-v2.0 - 41- 70-40619915
följande förutsättningar: (a) det relevanta Erbjudandet till Allmänheten
måste inträffa under perioden från och med [•]] till men inte inklusive [ ]
("Erbjudandeperioden"")i [•] [och [•]] (Erbjudanden till Allmänheten -
Jurisdiktioner") och (b) den relevanta Behöriga Säljaren måste ha
godkänt Villkoren för Behöriga Säljare [och uppfylla följande ytterligare
villkor: [•]]
Behöriga Säljare kommer lämna information till en Investerare i
enlighet med villkoren för Erbjudandet till Allmänheten för de
relevanta Lånen vid tidpunkten för när ett sådant Erbjudande till
Allmänheten lämnas från den Behöriga Säljaren till Investeraren.
Avsnitt B – Emittenter
B.1 Registrerad firma
för Emittenterna:
Nordea Bank AB (publ)
Nordea Bank Finland Plc
Handels-
beteckning för
Emittenterna:
Nordea
B.2 Säte och
bolagsform för
Emittenterna:
NBAB är ett publikt aktiebolag med organisationsnummer 516406-0120.
Sätet är i Stockholm på följande adress: Smålandsgatan 17, 105 71
Stockholm. Den huvudsakliga lagstiftningen som reglerar NBAB:s
verksamhet är aktiebolagslagen och lagen om bank- och
finansieringsrörelse.
NBF är ett aktiebolag enligt den finska aktiebolagslagen. NBF är
registrerat i handelsregistret med registreringsnummer 1680235-8. NBF
har sitt säte i Helsingfors på följande adress: Aleksanterinkatu 36 B, SF-
00100 Helsingfors, Finland. Den huvudsakliga lagstiftningen som reglerar
NBF:s verksamhet är den finska aktiebolagslagen och den finska lagen
om affärsbanker och andra kreditinstitut i aktiebolagsform.
B.4b Kända trender: Ej tillämpligt. Det finns inte några tydliga trender som påverkar
Emittenterna eller de marknader de verkar på.
B.5 Koncern-
beskrivning:
NBAB är moderbolaget i Nordea-koncernen. Nordea-koncernen är en stor
koncern som erbjuder finansiella tjänster på den nordiska marknaden
(Danmark, Finland, Norge och Sverige), med ytterligare verksamhet i
Ryssland, de baltiska länderna och Luxemburg, samt filialer på ett antal
andra internationella platser. NBAB:s tre största dotterbolag är Nordea
Bank Danmark A/S i Danmark, NBF i Finland och Nordea Bank Norge
ASA i Norge. Nordea-koncernens organisationsstruktur är byggd kring tre
huvudaffärsområden: Retail Banking, Wholesale Banking och Wealth
Management. Utöver dessa affärsområden finns Group Corporate Centre,
Group Risk Management and Group Compliance som är de andra centrala
delarna av Nordea-koncernens organisation. Retail Banking ansvarar för
kundförhållanden med privatpersoner liksom större, mellanstora och små
företag inom Norden och Baltikum. Wholesale Banking ansvarar för
finansiella tjänster till stora nordiska och internationella företagskunder
och institutionella kunder. Wealth Management tillhandahåller produkter
inom investeringsrådgivning, sparande och riskhantering, samt hanterar
Nordea-koncernens kunders tillgångar och rådger institutionella
investerare och förmögna privatpersoner.
Per 30 september 2015 uppgick Nordea-koncernens totala tillgångar till
totalt EUR 679,9 miljarder och primärkapitalet uppgick till EUR 26,7
miljarder. Per samma datum var Nordea-koncernen den största
kapitalförvaltaren med bas i Norden med EUR 273,3 miljarder i

192819-3-22-v2.0 - 42- 70-40619915
förvaltade tillgångar.
B.9 Resultat-prognoser
och resultat-
uppskattningar:
Ej tillämpligt. Emittenterna gör inte någon resultatprognos eller
resultatuppskattning i Grundprospektet.
B.10 Eventuella
anmärkningar i
revisionsberättelse
n:
Ej tillämpligt. Det finns inte några anmärkningar för Emittenterna i deras
revisionsberättelser.
B.12 Utvald central
finansiell
information:
Tabellerna nedan visar viss utvald finansiell information i sammandrag
som, utan väsentliga ändringar har hämtats från och måste läsas
tillsammans med Emittenternas respektive reviderade koncernredovisning
för det år som slutar den 31 december 2015, som finns bilagda till detta
Tilläggsprospekt och Grundprospektet, och revisorernas rapporter och
kommentarer därtill.8
NBAB-koncernen – utvald central finansiell information:
Årsslut per 31 december
2015 2014
(Miljoner EUR)
Resultaträkning
Summa rörelseintäkter ......................................... 10 140 10 241
Kreditförluster ..................................................... -479 -534 Resultat från den löpande verksamheten9 ............ 3 662 3 357
Årets resultat ....................................................... 3 662 3 332
Balansräkning Summa tillgångar ................................................ 646 868 669 342
Summa skulder .................................................... 615 836 639 505
Summa eget kapital ............................................. 31 032 29 837 Summa skulder och eget kapital .......................... 646 868 669 342
Kassaflödesanalys
Kassaflöde från den löpande verksamheten före förändringar av den löpande verksamhetens
tillgångar och skulder .......................................... 6 472 11 456
Kassaflöde från den löpande verksamheten. ........ 196 -10 842 Kassaflöde från investeringsverksamheten .......... -522 3 254
Kassaflöde från finansieringsverksamheten ......... -1 746 -1 040
Årets kassaflöde .................................................. -2 072 -8 610 Förändring ........................................................... -2 072 -8 610
8 Genom Tilläggsprospektet daterat 7 mars 2016 har utvald central reviderad finansiell information för NBAB för det år
som slutar 31 december 2015 tillagts och reviderad finansiell information för NBAB för det år som slutar 2013 tagits
bort. Genom Tilläggsprospektet daterat 7 mars 2016 har utvald central reviderad finansiell information för NBF för det
år som slutar 31 december 2015 tillagts och oreviderad finansiell information för NBF för den sexmånadersperiod som slutar 30 juni 2015 tagits bort.
9 Genom Tilläggsprospektet daterat 5 februari 2016 har Emittenten flyttat ”Resultat från den löpande verksamheten” från
Resultaträkningen till Utvald central finansiell information.

192819-3-22-v2.0 - 43- 70-40619915
NBF-koncernen – utvald central finansiell information:
Årsslut per 31 december
2015 2014
(Miljoner EUR)
Resultaträkning
Summa rörelseintäkter .............................. 2 485 2 278 Periodens resultat ..................................... 1 055 902
Balansräkning Summa tillgångar ..................................... 301 590 346 198
Summa skulder ......................................... 289 294 336 580
Summa eget capital .................................. 12 296 9 618 Summa skulder och eget capital ............... 301 590 346 198
Kassaflödesanalys Kassaflöde från den löpande
verksamheten före förändring av den
löpande verksamhetens tillgångar och skulder ...................................................... 1 836 1 807
Kassaflöde från den löpande
verksamheten............................................
8 536 -11 520
Kassaflöde från
investeringsverksamheten .........................
-11 2 149
Kassaflöde från finansieringsverksamheten .......................
1 631 -593
Periodens kassaflöde ................................ 10 156 -9 964
Förändring ................................................ 10 156 -9 964
Det har inte inträffat några väsentliga negativa förändringar i den normala
affärsverksamheten eller i utsikterna eller i tillståndet för NBAB eller
NBF sedan den 31 december 2015,10
vilket är datumet för deras senast
publicerade reviderade årsredovisningar.
Det har inte inträffat någon betydande förändring av NBAB:s eller NBF:s
handels- eller finansiella position sedan den 31 december 2015,11
vilket är
datumet för deras senaste publicerade årsredovisningar.
B.13 Nyligen inträffade
händelser:
Ej tillämpligt för någon av Emittenterna. Det har inte förekommit några
särskilda händelser för någon av Emittenterna som väsentligen påverkar
bedömningen av respektive Emittents solvens sedan datumet för
publiceringen av respektive Emittents reviderade årsredovisning och
oreviderade rapporter.
B.14 Koncern-
beroende:
Ej tillämpligt. Vare sig NBAB eller NBF är beroende av andra enheter
inom Nordea-koncernen.
B.15 Emittenternas
huvudsakliga
verksamhet:
Nordea-koncernens organisationsstruktur är byggd kring tre
huvudaffärsområden: Retail Banking, Wholesale Banking och Wealth
Management. Utöver dessa affärsområden finns Group Corporate Centre,
Group Risk Management och Group Compliance som är de andra centrala
delarna av Nordea koncernens organisation.
NBAB utför bankverksamhet i Sverige inom ramen för Nordea-
koncernens affärsorganisation. NBAB utvecklar och marknadsför
finansiella produkter och tjänster till privatkunder, företagskunder och
10 Genom Tilläggsprospektet daterat 7 mars 2016 har datumet, sedan vilket det inte inträffat några väsentliga negativa
förändringar i den normala affärsverksamheten eller i utsikterna eller i tillståndet för NBAB eller NBF, uppdaterats till 31 december 2015, vilket är datumet för deras senast publicerade reviderade årsredovisningar
11 Genom Tilläggsprospektet daterat 7 mars 2016 har datumet, sedan vilket det inte inträffat någon betydande förändring av
NBAB:s eller NBF:s handels- eller finansiella position, uppdaterats till 31 december 2015 vilket är datumet för deras senast publicerade årsredovisningar.
192819-3-22-v2.0 - 44- 70-40619915
den offentliga sektorn.
NBF utför bankverksamhet i Finland som en del av Nordea-koncernen
och dess verksamhet är helt integrerad i Nordea-koncernens verksamhet.
NBF har tillstånd att bedriva bankverksamhet enligt den finska
kreditinstitutionslagen.
B.16 Personer med
direkt eller
indirekt ägande/
kontroll:
Ej tillämpligt. Såvitt NBAB känner till är inte Nordea-koncernen direkt
eller indirekt ägd eller kontrollerad av någon enstaka person eller grupp
av personer som agerar tillsammans. NBF är ett helägt dotterbolag till
NBAB.
B.17 Kreditvärdig-
hetsbetyg som har
tilldelats
Emittenten eller
dess skuld-
instrument:
Per datumet för detta Grundprospekt är kreditvärderingen för långfristig
skuld för var och en av Emittenterna följande:
Moody's Investors Service Limited: Aa3
Standard & Poor's Credit Market Services Europe Limited: AA-12
Fitch Ratings Limited: AA-
DBRS Ratings Limited: AA
Emittenternas kreditvärderingar återger inte alltid risken som är
förknippad med enskilda Lån under Programmet.
Lånen som ska emitteras har inte kreditvärderats.
Avsnitt C – Lånen
C.1 Beskrivning av
värdepapperens
typ och klass:
Emission i serier: Lånen utfärdas i serier (var och en benämnd som en
"Serie") och Lånen i varje Serie kommer att få identiska villkor (utom
pris, lånedatum och räntestartdatum, som kan men inte behöver vara
identiska) vad gäller valuta, valörer, ränta eller förfallodag eller annat,
förutom att en Serie kan bestå av Lån i innehavarform och i registrerad
form. Ytterligare trancher av Lån (var och en benämnd som en "Tranch")
kan emitteras som en del av en befintlig Serie.
Serienumret för Lånen är [ ]. [Tranchnumret är [ ].
Former för Lånen: Lånen kan ges ut i innehavarform eller i registrerad
form. Lån i innehavarform kommer inte att kunna bytas ut till Lån i
registrerad form och Lån i registrerad form kommer inte att kunna bytas
ut till Lån i innehavarform.
Lånen är i innehavarform/Lånen är i registrerad form.
Lån kan i de tillämpliga Slutliga Villkoren specificeras som "VP-Lån".
VP-Lån kommer att ges ut i kontoförd och dematerialiserad form, med
äganderätten bestyrkt genom införandet i registret för sådana VP-Lån
vilka förs av VP Securities A/S för den relevanta Emittentens räkning (det
"Danska Värdepappersregistret"). Äganderätten till VP-Lån kommer
inte bestyrkas av något fysiskt papper eller dokument. Definitiva Lån
kommer inte att ges ut avseende några VP-Lån. Nordea Bank Danmark
A/S kommer att agera som VP-Administrerande Institut när det gäller VP-
12 Negativ utsikt.

192819-3-22-v2.0 - 45- 70-40619915
Lån.
Lån kan specificeras i de tillämpliga Slutliga Villkoren som "VPS-Lån".
VPS-Lån ges ut enligt ett registratoravtal med Nordea Bank Norge ASA
som VPS-Betalningsagent och kommer att registreras i kontoförd och
dematerialiserad form hos norska värdepapperscentralen
(Verdipapirsentralen ASA och kallas här "VPS").
Lån kan specificeras i de tillämpliga Slutliga Villkoren som "Svenska
Lån". Svenska Lån kommer att ges ut i kontoförd och dematerialiserad
form, med äganderätten bestyrkt genom införande i registret för sådana
Svenska Lån som förs av Euroclear Sweden för den relevanta Emittentens
räkning. Äganderätten till Svenska Lån bestyrks inte av något fysiskt
värdepapper eller dokument. Definitiva Lån kommer inte att ges ut
avseende några Svenska Lån. Nordea Bank AB (publ) kommer att agera
som Svenskt Administrerande Institut när det gäller Svenska Lån.
Lån kan specificeras i de tillämpliga Slutliga Villkoren som "Finska
Lån". Finska Lån kommer att ges ut i kontoförd och dematerialiserad
form, med äganderätten bestyrkt genom införande i registret för sådana
Finska Lån som förs av Euroclear Finland för den relevanta Emittentens
räkning. Äganderätten till Finska Lån bestyrks inte av något fysiskt
värdepapper eller dokument. Definitiva Lån kommer inte att ges ut
avseende några Finska Lån. Nordea Bank Finland Plc kommer att agera
som Finskt Administrerande Institut när det gäller Finska Lån.
Lån i Schweiziska Franc: Lån kommer vara ges ut i Schweiziska Franc,
ges ut i innehavarform och representeras exklusivt av ett Permanent
Globalt Lån som deponeras hos SIX SIS AG, Olten, Schweiz, eller annan
sådan depositarie enligt vad som godkänns av SIX Regulatory Board vid
SIX Swiss Exchange. Det Permanenta Globala Lånet kommer endast att
vara utbytbart mot definitiva Lån under vissa begränsade omständigheter.
ISIN-nummer: Avseende varje Tranch av Lån kommer relevanta ISIN-
nummer att anges i de tillämpliga Slutliga Villkoren.
Lånen kommer att [clearas/avvecklas] via [ ]. Lånen har tilldelats
följande ISIN: [ ].
C.2 Valuta för
emissionen av Lån:
US dollar, euro, brittiska pund, svenska kronor, schweizerfranc, norska
kronor, danska kronor, yen och singaporianska dollar och/eller annan
sådan valuta eller andra valutor enligt beslut som fattas vid tidpunkten för
emissionen, i enlighet med alla rättsliga och/eller regulatoriska och/eller
centralbankskrav. Lånen kan, i enlighet med efterlevnaden av tillämpliga
lagar, ges ut som Lån i dubbla valutor.
Valutan för Lånen är [ ].
C.5 Fri rätt till
överlåtelse:
Detta Grundprospekt innehåller en sammanfattning av vissa
säljrestriktioner inom USA, det Europeiska Ekonomiska
Samarbetsområdet, Storbritannien, Danmark, Finland, Nederländerna,
Norge, Sverige, Spanien, Japan och Singapore.
Lånen har inte och kommer inte att registreras under United States
Securities Act of 1933 ("Securities Act") och får inte erbjudas eller säljas
inom USA eller till, eller för amerikanska medborgares räkning förutom i
vissa transaktioner som är undantagna från registreringskraven i
Securities Act.
För varje medlemsstat i det Europeiska Ekonomiska Samarbetsområdet
som har genomfört prospektdirektivet, inklusive konungariket Sverige

192819-3-22-v2.0 - 46- 70-40619915
(envar en "Relevant Medlemsstat"), har varje emissionsinstitut som
utsetts under Programmet (envar ett "Emissionsinstitut") utfäst och
godkänt, och varje ytterligare Emissionsinstitut som utses under
Programmet kommer att behöva utfästa och godkänna, att från och med
det datum då Prospektdirektivet genomförs i den Relevanta
Medlemsstaten ("Relevanta Implementeringsdatumet"), har
Emissionsinstitutet inte gjort och kommer inte att göra något erbjudande
om Lån till allmänheten i den Relevanta Medlemsstaten utom med
relevant Emittents samtycke lämnat i enlighet med avsnitt A.2 ovan.
Varje Emissionsinstitut har utfäst och godkänt, och varje ytterligare
Emissionsinstitut som utses under Programmet kommer att behöva utfästa
och godkänna, att det har uppfyllt och kommer att uppfylla alla
tillämpliga bestämmelser Financial Services and Markets Act 2000
("FSMA") avseende alla handlingar som utförs gällande Lån i, från eller
på annat sätt involverande Storbritannien.
Varje Emissionsinstitut har utfäst och godkänt, och alla ytterligare
Emissionsinstitut som utses under Programmet kommer att behöva utfästa
och godkänna, att det inte har erbjudit eller sålt och inte kommer att
erbjuda, sälja eller leverera några Lån direkt eller indirekt till
konungariket Danmark genom ett erbjudande till allmänheten, förutom
om det sker i enlighet med den danska värdepappershandelslagen
(konsoliderad lag nr 883 av den 9 augusti 2011, såsom ändrad) (på
danska: Værdipapirhandelsloven) och andra bestämmelser utfärdade
därunder.
Varje Emissionsinstitut har utfäst och godkänt, och varje ytterligare
Emissionsinstitut som utses under Programmet kommer att behöva utfästa
och godkänna, avseende erbjudanden eller försäljning av Lån i Irland, att
det kommer att uppfylla: villkoren i Europeiska Gemenskapernas
(Marknader för Finansiella Instrument) Förordning 2007 (nr 1 till 3)
(såsom ändrad), inklusive, utan begränsning, Förordning 7 och 152 därav
eller andra förhållningsregler som används i samband därmed och
villkoren i Investor Compensation Act 1998; villkoren i Companies Acts
2014, Central Bank Acts 1942 to 2014 (såsom ändrad) och varje annan
förhållningsregel som utfärdats under avsnitt 117(1) i Central Bank Act
1989; och villkoren i Market Abuse (Direktiv 2003/6/EG) Direktivet 2005
(såsom ändrad) och varje regel som utfärdats enligt avsnitt 1370 i
Companies Act 2014.
Varje Emissionsinstitut har utfäst och godkänt, och varje ytterligare
Emissionsinstitut som utses under Programmet kommer behöva utfästa
och godkänna, att de inte har erbjudit eller sålt, eller kommer erbjuda eller
sälja, direkt eller indirekt, Lån till allmänheten i Frankrike och att det inte
har distribuerat eller orsakat distribution, och att det inte kommer att
distribuera eller orsaka distribution av Grundprospektet, de relevanta
Slutliga Villkoren eller någon annan typ av erbjudandematerial relaterat
till Lånen, till allmänheten i Frankrike, och att sådant erbjudande och
sådan försäljning och distribution i Frankrike har och endast kommer
göras till (a) leverantörer av investeringstjänster relaterade till
portföljhantering för tredjeparts konton (personnes fournissant le service
d'investissement de gestion de portefeuille pour compte de tiers), och/eller
(b) kvalificerade investerare (investisseurs qualifiés), samtliga såsom
definierade, och i enlighet med, artiklarna L.411-1, L.411-2 och D.411-1 i
den franska lagen monétaire et financier.
Lån som faller in under begreppet "derivatinstrument" enligt Avsnitt 2 i
SMA, Direktivet 2004/39/EC (MiFID-direktivet) och Kommissionens
förordning Nr. EC/1287/2006 (Implementeringsföreskrifter för MiFID),
samtliga såsom ändrade från tid till annan, får endast erbjudas i Estland
192819-3-22-v2.0 - 47- 70-40619915
efter lämplighets- och vederbörlighetsbedömning av det relevanta
strukturerade instrumentet för investeraren i enlighet med tillämplig
estnisk och europeisk lagstiftning.
Varje Emissionsinstitut har utfäst och godkänt, och varje ytterligare
Emissionsinstitut som utses under Programmet kommer behöva utfästa
och godkänna, att Lånen inte har erbjudits eller kommer erbjudas i
Litauen genom erbjudande till allmänheten såvida detta inte är i enlighet
med alla tillämpliga bestämmelser under Litauens lagar och i synnerhet i
enlighet med Lagen om Värdepapper i Republiken Litauen från 18 januari
2007 Nr. X-1023 och alla föreskrifter eller regler som gjorts därunder,
såsom ändrad från tid till annan.
Lånen har inte registrerats under Lagen om Marknaden för Finansiella
Instrument i Lettland och kan således inte erbjudas eller säljas till
allmänheten i Lettland. Varken någon Emittent eller något av
Emissionsinstituten har godkänt, eller får godkänna, att Lån erbjuds i
Lettland annat än i enlighet med lagarna i Republiken Lettland.
Varje Emissionsinstitut har utfäst och godkänt, och varje ytterligare
Emissionsinstitut som utses under Programmet kommer behöva utfästa
och godkänna, att det inte har erbjudit eller sålt och ej heller kommer
erbjuda, sälja eller leverera något av Lånen direkt eller indirekt i Danmark
genom erbjudande till allmänheten, såvida detta ej sker i enlighet med den
danska Lagen om Värdepappershandel (Værdipapirhandelsloven), såsom
ändrad från tid till annan, och verkställande beslut som utfärdats därunder.
Varje Emissionsinstitut har utfäst och godkänt, och varje ytterligare
Emissionsinstitut som utses under Programmet kommer behöva utfästa
och godkänna, att det inte kommer erbjuda Lånen till allmänheten i
Finland, såvida detta inte sker i enlighet med alla tillämpliga Finska
lagbestämmelser och särskilt i enlighet med den Finska
Värdepapperslagen (495/1989) och varje bestämmelse därunder, såsom
ändrad från tid till annan.
Varje Emissionsinstitut har utfäst och godkänt, och varje ytterligare
Emissionsinstitut som utses under Programmet kommer behöva utfästa
och godkänna, att det kommer lyda alla tillämpliga lagar, bestämmelser
och riktlinjer för erbjudande av Lånen i Norge. Lån i norska Krone kan
inte erbjudas eller säljas inom Norge eller till personer med hemvist i
Norge, eller för deras vägnar, såvida inte föreskriften relaterad till
erbjudandet av VPS-Lån och registrering i VPS har åtlytts.
Varje Emissionsinstitut har utfäst och godkänt, och varje ytterligare
Emissionsinstitut som utses under Programmet kommer behöva utfästa
och godkänna, att det enbart har erbjudit och enbart kommer att erbjuda
Lån till allmänheten (oferta pública) i Spanien i enlighet med
omarbetningen av lagen om värdepappersmarknaden (Texto Refundido de
la Ley, del Mercado de Valores) godkänd genom kungligt dekret 4/2015
av den 23 October ("TRLMV"), kungligt dekret 1310/2005, av den 4
november, vilken delvis ändrar värdepappersmarknadsrätt avseende
notering på allmänna andrahandsmarknader, erbjudanden till allmänheten
och prospektet som krävs därtill och regelverken som upprättas därunder.
Lånen får inte erbjudas eller säljas i Spanien förutom av institut som är
auktoriserade i enlighet med TRLMV och kungligt dekret 217/2008 av
den 15 februari, om den rättsordning som är tillämplig på företag som
utför investeringstjänster, att erbjuda investeringstjänster i Spanien, och
med åtlydande av bestämmelserna i TRLMV och alla andra tillämpliga
lagar.

192819-3-22-v2.0 - 48- 70-40619915
Lånen har inte och kommer inte att registreras under Lagen om
Finansiella Instrument och Handel i Japan (Lag Nr. 25 från 1948, såsom
ändrad, "FIEA") och varje Emissionsinstitut har utfäst och godkänt, och
varje ytterligare Emissionsinstitut som utses under Programmet kommer
behöva utfästa och godkänna, att de inte kommer erbjuda eller sälja några
Lån, direkt eller indirekt, i Japan eller till, eller till fördel för, bofasta
personer i Japan, eller till andra för att återerbjudanden eller återsäljning,
direkt eller indirekt, i Japan eller till, eller till förmån för, bofasta personer
i Japan, förutom i enlighet med ett undantag från registreringskraven i,
och även i övrigt i enlighet med FIEA och varje annan tillämplig lag,
föreskrift och riktlinje från myndigheterna i Japan.
Nollkupongslån av definitiv form kan endast överlåtas och accepteras,
direkt eller indirekt, inom, från eller till Nederländerna genom försorgen
av antingen någon av Emittenterna eller ett medlemsföretag i Euronext
Amsterdam by N.V. Euronext i full överensstämmelse med den
Nederländska lagen om Besparingscertifikat (Wet inzake spaarbewijzen)
från 21 maj 1985 (såsom ändrad) och dess implementeringsföreskrifter.
Detta Grundprospekt (inklusive de relevanta Slutliga Villkoren) har inte
registrerats som ett prospekt hos den relevanta singaporianska
myndigheten i enlighet med kapitel 289 i den singaporianska lagen om
värdepappershandel ("SLVP"). Detta Grundprospekt (inklusive de
relevanta Slutliga Villkoren) samt varje annat dokument eller material
som används vid erbjudande eller försäljning, eller erbjudande om
teckning eller köp, av Lån får därför inte spridas eller distribueras och
Lånen får inte heller erbjudas eller säljas, eller göras tillgängliga genom
erbjudande om teckning eller köp, varken direkt eller indirekt, till
personer i Singapore annat än (i) till institutionella investerare enligt
kapitel 274 i SLVP, (ii) till en relevant person i enlighet med kapitel
275(1), eller någon annan person i enlighet med kapitel 275(1), och i
enlighet med villkoren som specificeras i kapital 275, i SLVP och (iii)
annars i enlighet med och med uppfyllande av villkoren i SLVP.
Inga Lån hänförliga till kollektiva investeringsupplägg (såsom definierat i
SLVP) får, varken direkt eller indirekt, erbjudas eller säljas, eller göras
tillgängliga för teckning eller försäljning till personer i Singapore.
C.8 Rättigheter
kopplade till
Lånen, inklusive
rangordning och
begränsningar av
sådana rättigheter
Lånens status: Lånen utgör icke-säkerställda och icke-efterställda
förpliktelser för den relevanta Emittenten och rangordnas pari passu utan
någon preferens mellan sig själva och minst pari passu gentemot alla
övriga av den relevanta Emittentens nuvarande och framtida utestående
icke-säkerställda och icke-efterställda förpliktelser.
Valörer: Lån kommer ges ut i sådana valörer som kan finnas angivna i de
relevanta Slutliga Villkoren, föremål för (i) en lägsta valör om €1 000
(eller dess motsvarighet i andra valutor), och (ii) i enlighet med alla
tillämpliga juridiska och/eller regulatoriska och/eller centralbankskrav.
Lånen är utställda i valör(erna) [ ].
Åtagande att inte ställa säkerhet: Ingen.
Korsvisa uppsägningsgrunder: Ingen.
Beskattning: Alla betalningar med hänsyn till Lånen kommer göras utan
källskatt eller avdrag för skatt såvida inte detta fordras av svensk eller
finsk lag, föreskrifter eller andra regler, eller beslut från finska eller
svenska myndigheter. I händelse av att någon av Emittenterna måste göra
avdrag för eller undanhållande av finsk eller svensk skatt för någon som

192819-3-22-v2.0 - 49- 70-40619915
inte omfattas av beskattning i Sverige eller Finland kommer Emittenten
betala ett tilläggsbelopp för att säkerställa att de relevanta innehavarna av
Lån, vid förfallodagen, kommer erhålla ett nettobelopp som är lika med
det belopp som innehavarna skulle ha erhållit om det inte vore för
avdragen eller de undanhållna beloppen, förutom i enlighet med vissa
sedvanlig undantag.
Gällande lag: Lånen och alla icke-avtalsenliga förpliktelser som uppstår
ur eller i samband med Lånen styrs av antingen brittisk lagstiftning, finsk
lagstiftning, svensk lagstiftning, dansk lagstiftning eller norsk lagstiftning,
förutom att (i) registreringen av VP-Lån i VP styrs av dansk lagstiftning,
(ii) registreringen av VPS-Lån i VPS styrs av norsk lagstiftning, (iii)
registreringen av Svenska Lån i Euroclear Sweden styrs av svensk
lagstiftning, och (iv) registreringen av Finska Lån i Euroclear Finland
styrs av finsk lagstiftning.
Lånen styrs av [brittisk lagstiftning / finsk lagstiftning / dansk lagstiftning
/ svensk lagstiftning / norsk lagstiftning].
Verkställighet av Lån i Global Form: Gällande Globala Lån kommer den
individuelle investerarens rättigheter mot den relevanta Emittenten att
styras av ett sidoavtal daterad till [*] december 2015 ("Sidoavtalet") av
vilket det kommer finnas en kopia tillgängligt för inspektion på det
angivna kontoret för Citibank, N.A., London Branch som fiscal agent
("Fiscal Agent").
C.9 Rättigheter
kopplade till
Lånen
(fortsättning),
inklusive
information
angående Ränta,
Förfallodag,
Avkastning och
Representant för
Innehavarna:
Ränta: Lån kan vara räntebärande eller icke-räntebärande. Ränta (om så
förekommer) kan:
utgå baserad på fast kurs eller rörlig kurs;
vara inflationsskyddad, varigenom det räntebelopp som ska
betalas är kopplat till ett konsumentprisindex eller annat
inflationsmått;
vara länkade till huruvida en Kredithändelse inträffar eller ej med
avseende på skuldförpliktelserna för en eller flera referensenheter
("Kreditlänkade Lån" eller "CLN"). En Kredithändelse är en
bolagshändelse som vanligtvis gör att en fordringsägare för
Referensenheten drabbas av en förlust (t.ex. konkurs eller
underlåtenhet att betala). Om en Kredithändelse inträffar för en
Referensenhet, kan det nominella belopp som används för
beräkning av ränta som ska betalas minskas. Se avsnitt C.10 för
ytterligare information;
vara kumulativa, förutsatt att vissa värdeutvecklingströsklar har
uppnåtts;
vara länkade till utvecklingen för en specificerad referenskurs
(som skulle kunna vara en räntekurs eller en inflationsåtgärd)
under en specificerad period jämfört med ett antal förbestämda
lösenpris/barriärnivåer, där ett sådant räntebelopp också kan vara
föremål (i vissa fall) för tak/golv;
vara länkade till prestationen hos en eller flera korgar med
underliggande tillgångar (envar en "Referenstillgång " och
tillsammans en "Korg") eller en specifik Referenstillgång i
relevant Korg (till exempel Referenstillgången med sämst
värdeutveckling) jämfört med en förbestämd lösenprisnivå;
och/eller

192819-3-22-v2.0 - 50- 70-40619915
vara länkade till den procentandel av Referenstillgångarna i
Korgen som är över en förbestämd barriärnivå vid varje
arbetsdag, upp till och inkluderande det relevanta
räntebetalningsdatumet (vart och ett utgörande en
"Räntebetalningsdag").
Den tillämpliga räntesatsen eller dess beräkningsmetod kan variera vid
olika tidpunkter eller vara konstant för en Serie av Lån. Lån kan ha en
maxränta, minimiränta eller både och. Ränteperiodernas längd för Lånen
kan också variera vid olika tidpunkter eller vara konstant för en Serie Lån.
Ränta på Lånen kan också utgå på grundval av en kombination av olika
strukturer.
Uppskjuten Ränta: om Uppskjuten Ränta tillämpas på Lånen ska alla
betalningar av ränta som annars hade förfallit till betalning enligt
tillämplig räntestruktur eller tillämpliga räntestrukturer uppskjutas till det
tidigare av Återbetalningsdagen eller den dag som förtida återbetalning av
hela Lånen görs.
Valutakomponenter: om Valuta-komponenter tillämpas på ett eller flera
Räntebelopp på någon Räntebetalningsdag ska det räntebelopp för den
relevanta Räntebetalningsdagen eller de relevanta
Räntebetalningsdagarna, bestämt i enlighet med de räntenivåstrukturer
som är tillämpliga på de specifika Lånen, multipliceras med en faktor som
återspeglar variationen i en eller flera utländska valutakurser för den
tillämpliga ränteperioden, för att avgöra den faktiska räntan som ska
betalas.
[Valutakomponenten (Ränta) är [tillämplig på följande Räntebelopp på
följande Räntebetalningsdag: [ ]förfaller den [ ]/Ej tillämplig]
[Underliggande utländska valutakursen är: [ ]]
Lånen har ingen ränta./Lånen är räntebärande:
Räntebas: [ ].
Nominell räntesats: [ ].
Räntans startdatum: [ ].
Räntebetalningsdag(ar): [ ].
Uppskuten Ränta: [Tillämplig/Ej tillämplig]
Beskrivning av underliggande Referenskurs/Referenstillgång(ar): [ ].]
Information om historisk och framtida utveckling av Referenskursen och
Referenstillgångar kan inhämtas från: [ ].
[Marginal: +/– [ ].]
[Högsta Räntesats: [ ].]
[Lägsta Räntesats: [ ].]
[Dagberäkningsmetod: [ ].]
Återbetalning: Om inte annat anges återbetalar den relevanta Emittenten
Lånen med deras återbetalningsbelopp ("Återbetalningsbelopp") och på
den/de återbetalningsdag(ar) ("Återbetalningsdag") som specificeras i de
Slutliga Villkoren.

192819-3-22-v2.0 - 51- 70-40619915
Återbetalningsbeloppet kan vara en kombination av ett fast belopp
("Basåterbetalningsbelopp") och ett eller flera tilläggsbelopp
("Tilläggsbelopp") vilka fastställs i enlighet med en eller flera av de
värdeutvecklingsstrukturer som specificeras i avsnitt C.10 nedan.
Återbetalningsbeloppet kan också vara ett bestämt belopp, eller
bestämmas direkt i enlighet med en eller flera av de
värdeutvecklingsstrukturerna specificerade i avsnitt C.10 nedan.
Tilläggsbeloppet kan komma att adderas till, eller subtraheras från,
Basåterbetalningsbeloppet i syfte att beräkna Återbetalningsbeloppet som
ska betalas vid förfallodagen, och kan vara negativt. Som en följd kan en
Innehavare under vissa förhållanden erhålla ett belopp lägre än Lånens
Kapitalbelopp vid dess slutliga återbetalning. De Slutliga Villkoren
specificerar vilken av värdeutvecklingsstrukturerna som är tillämplig på
respektive Serie av Lån.
Tilläggsbeloppet kan förfalla till betalning på en annan dag än
Återbetalningsdagen (den "Alternativa Betalningsdagen för
Tilläggsbelopp"), om detta har specificerats i de relevanta Slutliga
Villkoren.
Förtida återbetalning av Lån kan eventuellt bli tillåtet (i) på begäran av
den relevanta Emittenten eller innehavaren av Lån, i enlighet med
Villkoren, förutsatt att sådan förtida återbetalning tillåts enligt med de
Slutliga Villkoren, (ii) om den relevanta Emittenten har eller kommer att
bli tvungen att betala vissa tillkommande belopp med avseende på Lånen
som ett resultat av någon eventuell ändring av skattelagarna i
jurisdiktionen där den relevanta Emittenten har sitt säte eller (iii) till viss
del, efter att någon Kredithändelse inträffat i förhållande till en eller flera
Referensenheter
Där en av värdeutvecklingsstrukturerna "Autocall" gäller kommer, om
den avkastning som skapas av Korgen eller viss(a) Referenstillgång(ar) är
lika med eller över en förbestämd barriärnivå vid något specificerat
datum, den relevanta Emittenten att återbetala Lånen i förtid på
nästkommande förtida återbetalningsdag med ett belopp som är lika med
Lånens Kapitalbelopp, tillsammans med en förbestämd kupong (om sådan
finns).
Om så angivits i de Slutliga Villkoren, kan det belopp som ska betalas vid
förtida återbetalning ("Förtida Återbetalningsbelopp") reduceras med
ett belopp som fastställs av Beräkningsagenten, som är lika med
summorna av de kostnader, utgifter, skatter och tullavgifter som den
relevanta Emittenten ådragit sig i samband med den förtida
Återbetalningen.
Såvida inte dessförinnan återbetalda, eller köpta och upphävda, kommer
Lånen att bli återbetalade med [par/deras Återbetalningsbelopp om [ ]
per Beräkningsbelopp/ett belopp beräknat i enlighet med
värdeutvecklingsstrukturen[/erna] som finns specificerad i avsnitt C.10
nedan/ett belopp uppgående till summan av Basåterbetalningsbeloppet
om [ ] och Tilläggsbeloppet[/en] beräknat i enlighet med
värdeutvecklingsstrukturen(-erna) som specificeras i avsnitt C.10 nedan].
[Lån kan inlösas före den planerade Återbetalningsdagen efter val av
Emittenten [om Emittenten har förvärvat minst 80 procent av
kapitalbeloppet för de Lån som ursprunligen
emitterats]/Innehavarna]/[Lånen har Autocallstruktur]
Återbetalningsdagen är [ ]/Lånen är återbetalningsbara genom
Avbetalningar på [ ]/Den Alternativa Betalningsdagen för Tilläggsbelopp

192819-3-22-v2.0 - 52- 70-40619915
är [ ].
Pris: Priset för varje Tranch av Lån som ska ges ut under Programmet
kommer att fastställas av den relevanta Emittenten vid tiden för när Lånen
ges ut, i enlighet med rådande marknadsförhållanden.
Priset för Lånen är: [•].
Avkastning: Avkastningen på varje Tranch av Lån kommer att beräknas
på grundval av det relevanta priset på det relevanta lånedatumet. Det är
inte en indikation om framtida avkastning.
Baserat på Priset på [ ] på Lånedatumet, är den förväntade avkastningen
från Lånen [ ] procent per år.
Representant för Innehavarna: Ej tillämpligt. Det finns ingen
representant utsedd som ska agera på uppdrag av Innehavarna.
Ersättning av Referenstillgång, förtida beräkning av
Återbetalningsbeloppet eller tillägg till Villkoren: Där så är tillämpligt i
enlighet med Villkoren får den relevanta utgivaren byta ut en
Referenstillgång, utföra en förtida beräkning av Återbetalningsbeloppet
eller göra eventuellt tillägg till Villkoren i den mån relevant Emittent
bedömer detta som nödvändigt, om vissa händelser inträffar, inklusive
marknadsavbrott, avbrott i riskhantering, förändring i lagstiftning eller
marknadspraxis, priskorrigeringar och andra relevanta utvecklingar som
påverkar en eller fler av den/de underliggande Referenstillgången(-arna)
eller några hedging-arrangemang ingångna av en eller flera entiteter inom
Nordea-koncernen för att säkra den relevanta Emittentens förpliktelser i
förhållande till Lånen.
C.10 Derivat-
komponenter:
De värdeutvecklingsstrukturer som beskrivs nedan bestämmer på vilket
sätt värdeutvecklingen hos den/de relevanta Referenstillgången(-arna)
eller Referensenheterna påverkar Återbetalningsbeloppet och/eller
Tilläggsbeloppet för Lånen. Den relevanta Emittenten kan välja att
kombinera två eller fler värdeutvecklingsstrukturer när Lån ges ut:
"Basket Long" struktur: Tilläggsbeloppet är lika med Lånens
Kapitalbelopp multiplicerat med (i) ett belopp som återspeglar Korgens
avkastning ("Korgavkastningen") och (ii) en ratio som används för att
bestämma innehavarens exponering mot utvecklingen för de olika
Referenstillgångarna ("Deltagandegrad"). Utvecklingen för en
Referenstillgång bestäms med hänvisning till det belopp med vilket
slutkursen ("Slutkursen") överstiger Referenstillgångens startkurs
("Referenstillgångsavkastning"). Slutkursen kan bestämmas på grundval
av ett genomsnittsvärde på Referenstillgången under Lånens giltighetstid
(dvs. det finns flera värderingstidpunkter under giltighetstiden, varje
sådan ett "Värderingsdatum"), men det kan även bestämmas på grundval
av en enda värdering. Referenstillgångsavkastningen eller
Korgavkastningen kan dessutom bli föremål för ett golv, vilket agerar
som en lägsta nivå för utveckling, eller ett tak, vilket agerar som en
högsta nivå för utvecckling.
Referenstillgångsavkastningen eller Korgavkastningen kan också bli
föremål för en "strike level" ("Strike Level") som anger ett lägsta
tröskelbelopp för avkastningen på den relevanta Referenstillgången eller
Korgen som behöver uppnås innan innehavaren får ta del av avkastningen
för den Referenstillgången eller Korgen.
"Basket Short" struktur: Tilläggsbeloppet är lika med Lånens
Kapitalbelopp multiplicerat med (i) Korgavkastningen och (ii)

192819-3-22-v2.0 - 53- 70-40619915
Deltagandegraden. Om Referenstillgångarnas utveckling inom Korgen är
positiv kommer detta att få en negativ inverkan på den sammantagna
avkastning som skapats av Korgen och därför den avkastning som ska
betalas till Innehavarna. Om Referenstillgångarnas prestation inom
Korgen är negativ kommer detta att få en positiv inverkan på den
sammantagna avkastning som skapats av Korgen och därför den
avkastning som ska betalas till Innehavarna.
Referenstillgångsavkastningen och/eller Korgavkastningen kan också
vara föremål för ett golv eller ett tak, såsom beskrivet ovan.
Om inte annat stadgas kan Korgavkastningen som används i någon av
värdeutvecklingsstrukturerna beräknas antingen med utgångspunkt från
"Basket Long" eller "Basket Short"-strukturerna, såsom framgår i de
tillämpliga Slutliga Villkoren.
[Korgavkastningen bestäms i enlighet med "Basket Long"/"Basket
Short"-strukturen]/[Korgavkastning ej tillämpligt]
"Barriär Outperformance" struktur: om Korgens utveckling överstiger en
specificerad barriärnivå, kommer Tilläggsbeloppet att utgöra en
förbestämd maximal Korgavkastning. Om den specificerade barriärnivån
inte överskrids kommer Tilläggsbeloppet att vara noll.
"Barriär Underperformance" struktur: om Korgens utveckling faller
under en specificerad barriärnivå, kommer Tilläggsbeloppet att utgöra en
förbestämd maximal Korgavkastning. Om den specificerade barriärnivån
inte överskrids kommer Tilläggsbeloppet att vara noll.
"Best of/Worst of" Barriär" struktur: Detta är detsamma som "Barriär
Outperformance" strukturen, förutom att observationen av barriärnivån
och beräkningen av Tilläggsbeloppet kommer att bestämmas med
hänvisning till värdeutvecklingen hos Referenstillgången med den Nth
bästa värdeutvecklingen snarare än Korgen som helhet.
Referenstillgången med den Nth bästa värdeutvecklingen kommer vara
Referenstillgången med den Nth högsta Referenstillgångsavkastningen,
där "N" ska vara den siffra som anges i Slutliga Villkor.
"Best of/Worst of" Barriär Underperformance" struktur: Detta är
detsamma som "Barriär Underperformance" strukturen, förutom att
observationen av barriärnivån och beräkningen av Tilläggsbeloppet
kommer att bestämmas med hänvisning till värdeutvecklingen hos den
Referenstillgång med den Nth bästa värdeutvecklingen snarare än Korgen
som helhet.
"Autocallstruktur Long": Om Korgavkastningen understiger en
förbestämd riskbarriärnivå på en relevant observationsdag
("Riskbarriärobservationsdag"), kommer Tilläggsbeloppet beräknas
genom att multiplicera Lånens Kapitalbelopp med Deltagandegraden och
det lägre av Korgavkastningen och den på förhand bestämda högsta
Korgavkastningen. Om Korgavkastningen på en
Riskbarriärobservationsdag inte understiger den förbestämda
riskbarriärnivån, kommer Tilläggsbeloppet att vara lika med Lånens
Kapitalbelopp multiplicerat med Deltagandegraden 2 och det högre av (i)
Korgavkastningen och (ii) en förbestämd lägsta Korgavkastning. En
Kupong kan också vara förfallen till betalning (se avsnitt C.9 för
detaljerad information angående Kupongen). Lånen kommer dessutom att
vara föremål för förtida återbetalning om den avkastning som genereras
av Korgen överstiger den relevanta inlösenbarriärnivån på någon
observationsdag.

192819-3-22-v2.0 - 54- 70-40619915
"Autocallstruktur Kort": denna struktur liknar "Autocallstruktur Long"
med den skillnaden att den positiva utvecklingen för Referenstillgångarna
inom Korgen kommer att ha en negativ inverkan på Lånens avkastning.
"Replacement Basket" struktur: Tilläggsbeloppet beräknas på liknande
sätt som för Basket Long-strukturen, med skillnaden att de avkastningar
som genereras av Referenstillgångarna med bäst värdeutveckling ersätts
med ett förbestämt värde för syftet att bestämma Korgens totala
värdeutveckling.
"Locally Capped Basket" struktur: Tilläggsbeloppet beräknas på liknande
sätt som för Basket Long-strukturen eller Basket Short-strukturen, med
skillnaden att den avkastning som genereras av varje Referenstillgång är
föremål för ett förbestämt maximalt procentvärde för syftet att bestämma
Korgens totala värdeutveckling.
"Rainbow" struktur: Tilläggsbeloppet beräknas på liknande sätt som
Basket Long eller Basket Short-strukturen, med skillnaden att
Referenstillgångarnas viktning inom Korgen bestäms med hänvisning till
tillgångarnas relativa värdeutveckling. Varje Referenstillgång mäts
separat på förfallodagen och rangordnas beroende på respektive enskild
tillgångs värdeutveckling. Referenstillgångens vikt i Korgen bestäms av
vad som framgår i Slutliga Villkor.
"Booster" strukturer: Boosterstrukturer har en förbättrad positiv eller
negativ avkastning som baseras på utvecklingen i den underliggande
Referenstillgången eller de underliggande Referenstillgångarna.
Investerarens exponering mot utvecklingen i Referenstillgången kan öka
eller minska genom tillämpning av olika deltagandegrader. Inom en
"Booster Long"-struktur kommer den positiva utvecklingen för
Referenstillgångarna ha en positiv effekt på avkastningen på Lånen. I en
"Booster Short"-struktur kommer en positiv utveckling i för
Referenstillgångarna ha en negativ effekt på avkastningen på Lånen.
"Booster Riskbarriär Long" struktur: Tilläggsbeloppet kommer bero på
den avkastning som genererats av Korgen i jämförelse med en förbestämd
barriärnivå för en Värderingsdag och Korgens startvärde. Om
Korgavkastningen motsvarar eller överstiger Korgens startvärde på den
slutliga Värderingsdagen kommer Tilläggsbeloppet beräknas genom att
multiplicera Lånens Kapitalbelopp med Deltagandegraden och
Korgavkastningen på den slutliga Värderingsdagen. Om
Korgavkastningen motsvarar eller överstiger barriärnivån på alla
Värderingsdagar men under Korgens startvärde på den slutliga
Värderingsdagen kommer Tilläggsbeloppet vara noll. Om
Korgavkastningen understiger barriärnivån på någon Värderingsdag och
under Korgens startvärde på den slutliga Värderingsdagen kommer
Tilläggsbeloppet beräknas med referens till Korgavkastningen och en
annan deltagandegrad, vilket kan resultera i ett Återbetalningsbelopp som
är lägre än Kapitalbeloppet. Om utvecklingen för en Referenstillgång
inom Korgen är positiv kommer detta ha en positiv inverkan på den totala
avkastningen som genereras av Korgen. Om utvecklingen i en
Referenstillgång inom Korgen är negativ kommer detta ha en negativ
inverkan på den totala avkastningen som genereras av Korgen och således
på Tilläggsbeloppet.
"Booster Riskbarriär Short" struktur: Tilläggsbeloppet beräknas på ett
liknande sätt som för "Booster Riskbarriär Long"-strukturen. Skillnaden
är att när utvecklingen för Korgen är positiv kommer detta ha en negativ
inverkan på Tilläggsbeloppet. Om utvecklingen för Korgen är negativ
kommer detta ha en positiv inverkan på Tilläggsbeloppet.

192819-3-22-v2.0 - 55- 70-40619915
I förhållande till Lån som emitterats i enlighet med villkoren i
grundprospektet daterat 20 december 2013, samt de tillägg till samma
grundprospekt daterade 14 februari 2014 ("December 2013-villkoren"),
vilka införlivas genom hänvisning i detta Grundprospekt, ska Booster
Riskbarriär-strukturerna summeras enligt följande:
"Booster Riskbarriär Short"-struktur: Tilläggsbeloppet är
beroende av avkastningen av Korgen jämfört med en förbestämd
barriärnivå för varje Värderingsdatum samt det initiala värdet av
Korgen. Om summan av Korgavkastningen och 1 är lika med
eller högre än det intiala värdet på något Värderingsdatum ska
Tilläggsbeloppet beräknas genom att multiplicera kapitalbeloppet
för Lånen med Deltagandegraden och Korgavkastningen. Om
summan av Korgavkastningen och 1 är lika med eller högre än
barriärnivån på alla Värderingsdatum men lägre än det initiala
värdet på något Värderingsdatum ska Tilläggsbeloppet vara noll.
Om summan av Korgavkastningen och 1 är lägre än barriärnivån
på något Värderingsdatum och lägre än det initiala värdet på
något Värderingsdatum, ska Tilläggsbeloppet beräkas med
hänvisning till Korgavkastningen och en annan deltagandegrad,
vilket resultar i ett Återbetalningsbelopp som är lägre än
Kapitalbeloppet. Om avkastningen på en Referenstillgång i
Korgen är positiv kommer detta att ha en negativ inverkan på
avkastningen på Korgen som helhet. Om avkastningen på en
Referenstillgång i Korgen är negativ kommer detta att ha en
positiv inverkan på avkastningen på Korgen som helhet och
därmed på det belopp som ska betalas vid inlösen av Lånen.
"Booster Riskbarriär Long"-struktur: Tilläggsbeloppet beräknas
på ett liknande sätt som för "Booster Riskbarriär Short"-
strukturen. Skillnaden är att när avkastningen av en
Referenstillgång är positiv, detta kommer att ha en positiv
inverkan på avkastningen på Korgen som helhet. Om
avkastningen på en Referenstillgång i Korgen är negativ kommer
detta i stället att ha en negativ inverkan på avkastningen av
Korgen som helhet och därmed på det belopp som ska återbetalas
vid inlösen av Lånen.
Lånen [är/är inte] emitterade i enlighet med December 2013-villkoren
"Twin Win"-struktur: Tilläggsbeloppet beräknas på ett liknande sätt som
för "Basket Long"-strukturen – om utvecklingen av Korgen är positiv så
kommer Tilläggsbeloppet också att vara positivt. Om utvecklingen av
Korgen är negativ men över en förutbestämd Barriärnivå kommer
Tilläggsbeloppet också att vara positivt. Om utvecklingen för Korgen är
negativ men under den relevanta Barriärnivån kommer Tilläggsbeloppet
också att vara negativt och Återbetalningsbeloppet kan därför komma att
understiga Lånens Kapitalbelopp.
"Bonus Booster Short" struktur: Tilläggsbeloppet beräknas på ett liknande
sätt som för "Booster Riskbarriär Short"-strukturen med skillnaden att om
avkastningen som genereras av Korgen inte ligger under barriärnivån på
de(n) relevanta Värderingsdagen(/arna), kommer Tilläggsbeloppet vara
det högre av (i) en förbestämd kupongnivå och (ii) ett belopp som
beräknas genom att multiplicera Kapitalbeloppet med Deltagandegraden
och Korgavkastningen. En positiv utveckling för Referenstillgångarna
inom Korgen kommer ha en negativ inverkan på den totala avkastningen
som genereras av Korgen.
"Bonus Booster Long" struktur: Tilläggsbeloppet beräknas på ett liknande
sätt som för "Bonus Booster Short"-strukturen. Skillnaden är att när

192819-3-22-v2.0 - 56- 70-40619915
utvecklingen för Referenstillgångarna inom Korgen är positiv kommer
detta ha en positiv inverkan på den totala avkastningen som genereras av
Korgen. Om utvecklingen i Referenstillgångarna inom Korgen är negativ
kommer detta ha en negativ inverkan på den totala avkastningen som
genereras av Korgen.
"Periodsumme"-struktur Tilläggsbeloppet kommer baseras på den
ackumulerade summan av de relativa procentuella ändringarna i den
underliggande Korgen för ett antal förbestämda värderingsperioder under
löptiden för Lånen. Följande funktioner kan även användas: (i) de relativa
ändringarna i den underliggande Korgen kan lokalt tilldelas tak/golv-
nivåer för varje värderingsperiod, (ii) den ackumulerade summan av de
relativa ändringarna kan bli föremål för ett globalt tak/golv, och (iii)
produkten kan ha en lock-in-funktion som innebär att den ytterligare
avkastningen minst kommer vara lika med lock-in-nivån om den
ackumulerade avkastningen på någon värderingsdag har nått en
förbestämd lock-in-nivå.
"Omvänd Periodsumme" struktur: denna är väldigt lik "Periodsumme"-
strukturen, men den ytterligare avkastningen beräknas genom att
subtrahera de relativa procentuella ändringarna i den underliggande
Korgen (för ett antal förbestämda värderingsperioder) från en förbestämd
startkupong.
"Ersättande Periodsumme" struktur: denna är väldigt lik "Periodsumme"-
strukturen där skillnaden ligger i att avkastningarna som genereras av ett
visst antal av värderingsperioderna med bäst utveckling byts ut mot ett
förbestämt belopp.
"Omvänd Ersättande Periodsumme" struktur: denna är väldigt lik
"Omvänd Periodsumme"-strukturen där skillnaden är att avkastningarna
som genereras av ett visst antal av värderingsperioderna med bäst
utveckling byts ut mot ett förbestämt belopp.
"Rainbow Ersättande Periodsumme" struktur: utvecklingen i varje
individuell Referenstillgång beräknas på samma grund som
"Periodsumme"-strukturen. Skillnaden här är att vägningen av varje
Referenstillgång inom Korgen bestäms efter det att utvecklingen i varje
Referenstillgång är känd, enligt principen att den bäst presterande
underliggande ges högst vikt och så vidare.
"Omvänd konvertibel" struktur: om Korgavkastningen ligger på eller över
Korgens startnivå, kommer Återbetalningsbeloppet vara lika med Lånens
Kapitalbelopp. Om Korgens avkastning ligger under Korgens startnivå
kommer Återbetalningsbeloppet att vara lika med Kapitalbeloppet minus
ett belopp som beräknas genom att multiplicera Kapitalbeloppet med
Deltagandegraden och Korgavkastningen och därmed få fram ett
Återbetalningsbelopp som är lägre än Lånens Kapitalbelopp. En positiv
utveckling i Referenstillgångarna inom Korgen kommer ha en positiv
inverkan på den totala avkastningen på Lånen och tvärtom kommer en
negativ utveckling i de individuella Referenstillgångarna ha en negativ
inverkan på den totala avkastningen på Lånen.
"Omvänd Konvertibel Riskbarriär" struktur: om Korgens avkastning
ligger under Barriärnivån på någon Värderingsdag, och om
Korgavkastningen vid den slutliga Värderingsdagen ligger under Korgens
Startnivå kommer Återbetalningsbeloppet beräknas genom att
multiplicera Lånens Kapitalbelopp med Deltagandegraden och
Korgavkastningen och beloppet som ges kommer att adderas till Lånens
Kapitalbelopp (i det här fallet kommer Återbetalningsbeloppet vara lägre
än Kapitalbeloppet). Annars är Återbetalningsbeloppet lika med Lånens
192819-3-22-v2.0 - 57- 70-40619915
Kapitalbelopp.
"Best of/Worst of Omvänd Konvertibel"-struktur: Återbetalningsbeloppet
beräknas på samma sätt som i "Omvänd Konvertibel Riskbarriär"-
strukturen, förutom att den möjliga negativa utbetalningen bestäms med
referens till utvecklingen för Referenstillgången med Nth bäst
värdeutveckling (i motsats till den totala utvecklingen i Korgen).
Worst of Call Option: Worst of Call Option-strukturen exponerar
Innehavaren mot den sämst avkastande Referenstillgången i Korgen.
Tilläggsbeloppet som Innehavaren har rätt att erhålla kommer att vara det
större av noll och Referenstillgångsavkastningen av den sämst avkastande
Referenstillgången.
Outperformance Option: Medan Tilläggsbeloppet avseende en vanlig
Korgstruktur är beroende av den absoluta utvecklingen för en Korg som
består av en eller flera Referenstillgångar beror utbetalningen i en
Outperformancessstruktur på den relativa utvecklingen för två Korgar,
inte på den absoluta utvecklingen för varje Korg. Strukturen kan baseras
på antingen två "Basket Long"-strukturer, två "Basket Short"-strukturer
eller en "Basket Long"-struktur och en "Basket Short"-struktur.
"Non-Tranched CLN" och "Tranched CLN" strukturer:
Återbetalningsbeloppet och, om tillämpligt, ränteutbetalningarna, baseras
på de viktade förlusterna i samma eller olika portföljer av Referensenheter
som ett resultat av att en eller flera Kredithändelser inträffar. För
Tranched CLN:er kan det förekomma att en Kredithändelse inte har
någon inverkan eller en mer proportionerlig inverkan på
Återbetalningsbeloppet och, om relevant, ränteutbetalningar.
Tranchfunktionen används för att bestämma andelen av förluster som en
Innehavare kommer vara exponerad mot i händelse av att en
Kredithändelse som påverkar en eller flera Referensenheter.
"Nth to Default" och "Nth och N:te+1 to Default"-strukturer:
Återbetalningsbeloppet och, om tillämpligt, ränteutbetalningarna, baseras
på antalet och ordningsföljden av Kredithändelser i samma
Referensenhetsportfölj. Gällande Nth to Default-CLN:er, har inträffandet
av N-1 Kredithändelser inte någon inverkan på Återbetalningsbeloppet
och (om några) ränteutbetalningar, samtidigt som Nth Kredithändelsen
kommer ha en mer än proportionerlig inverkan på dessa siffror. På samma
sätt gällande Nth och Nth+1 to Default-CLN:erna kommer inverkan från
den Nth och Nth+1 Kredithändelsen ha en mer än proportionerlig
inverkan.
Option CLN: syftet med strukturen är att ge en investerare exponering
mot kreditrisker (d.v.s. risken för att en Kredithändelse ska inträffa) inom
en specifik marknad såsom europeiska eller amerikanska "investment
grade" bolag, eller högavkastande låntagare. Exponeringen uppstår genom
utgivandet av Lån kopplade till index CDS-spreadar som motsvarar
kostnaden för riskhantering avseende Kredithändelser som påverkar de
bolag som ingår i ett index. Genom att använda en single option-
värdeutvecklingsstruktur kan Emittenterna erbjuda strukturer varigenom
investerare får fördelar av förändringar i kredit-spreadar, t.ex. om kredit-
spreadar ökar till att överstiga eller sjunker till att understiga givna nivåer.
Emittenterna kan också erbjuda strukturer där en investerare får fördelar
av förändringar i kredit-spreadar men där den potentiella intjäningen är
begränsad, t.ex. där en investerare får fördelar om kredit-spreadar sjunker
till att understiga en viss given nivå, men inte ytterligare genom att
spreadarna sjunker ytterligare under denna nivå. Genom att kombinera tre
eller fyra utbetalningar kan Emittenterna erbjuda ytterligare strukturer.

192819-3-22-v2.0 - 58- 70-40619915
"Mark to Market CDS"-struktur: Denna struktur ger exponering mot
"mark-to-market"-värdet på en eller flera kreditswappar med hänvisning
till Referensenheterna, eller ett index av Referensenheterna, som
specificeras i de tillämpliga Slutliga Villkoren.
Digital Long
Om Korgavkastningen vid den slutliga Värderingsdagen överstiger
Korgenlösennivån kommer Tilläggsbeloppet vara lika med Lånens
Kapitalbelopp multiplicerat med Kupongen.
Om Korgavkastningen inte överstiger Korgenlösennivån vid den slutliga
Värderingsdagen kommer Tilläggsbeloppet vara noll. Positiv utveckling i
Referenstillgångarna kommer ha en positiv inverkan på avkastningen på
Lånen.
Digital Short
Om Korgavkastningen vid den slutliga Värderingsdagen understiger
Korglösennivån kommer Tilläggsbeloppet vara lika med Lånens
Kapitalbelopp multiplicerat med Kupongen.
Om Korgavkastningen är lika med eller överstiger Korglösennivån vid
den slutliga Värderingsdagen kommer Tilläggsbeloppet vara noll. Positiv
utveckling i Referenstillgångarna kommer ha en negativ inverkan på
avkastningen på Lånen.
"Best of/Worst of" Digitals: Digital Long- och Digital Short-strukturerna
kan också kombineras med ett "Best of/Worst of"-inslag, varvid
Tilläggsbeloppet beräknas med hänvisning till värdeutvecklingen hos
Referenstillgången med den Nth bästa värdeutvecklingen snarare än
Korgen som helhet.
Worst of Digital Memory Coupon 1: Worst of Digital Memory Coupon-
optionen är en remsa av villkorade "sämsta av" digitala val.
Tilläggsbeloppet motsvarar Lånens Kapitalbelopp multiplicerat med
Kupongerna och K. K är numret i ordningen av Värderingsdagar som
Referenstillgångsavkastningen för den Referenstillgång med sämst
utveckling är lika med eller överstiger den relevanta barriärnivån på varje
Värderingsdag, upp till och med den aktuella Värderingsdagen (första
värderingsdagen = 1, andra = 2 etc).
"Series of Digitala": Återbetalningsbeloppet avgörs av den procentandel
av Referenstillgångarna inom Korgen som ligger över en förbestämd
barriärnivå på varje Värderingsdag.
"Delta 1 struktur": Återbetalningsbeloppet kommer vara lika med det
återbetalningsbelopp som mottagits av den relevanta Emittenten (eller
annan entitet inom Nordea-koncernen) genom att sådan Emittent eller
entitet avvecklar ett hedging-arrangemang satt i plats för att efterlikna
riskerna och fördelarna av en direktinvestering i Referenstillgångarna,
minus (i) en betalbar struktureringsavgift till relevant Emittent och (ii)
alla tillämpliga skatter. En Delta 1-struktur speglar i praktiken vinsterna
eller förlusterna som en investerare skulle göra genom ett direkt ägande
av de relevanta Referenstillgångarna. Om hedgingparten inte kan inlösa
Referenstillgångarna innan det planenliga förfallodatumet, eller om
hedgingparten fastställer att den inte kommer mottaga det totala beloppet
av återbetalningsbeloppen innan det planenliga förfallodatumet, kommer
en uppskjuten återbetalning ske och den relevanta Emittenten kan göra en
delvis inlösen av Lånen när och som den relevanta hedgingparten mottar
en väsentlig del av återbetalningsbeloppen, eller upphäva Lånen utan att

192819-3-22-v2.0 - 59- 70-40619915
göra någon betalning till innehavarna om den relevanta Emittenten
fastställer att återbetalningsbeloppen inte kommer mottagas tidigare än
det specificerade long stop-datumet.
"Inflation Linker": Återbetalningsbeloppet är Lånens Kapitalbelopp
multiplicerat med det högsta av en lägsta återbetalningsprocent (angiven
som en procentsats av Lånens kapitalbelopp) och kvoten som erhålls
genom att dividera Inflationstakten på den slutliga Värderingsdagen med
Inflationstakten på Startdagen.
"Barriär Outperformance"-struktur 2: om Korgavkastningen på någon
Värderingsdag överstiger Barriärnivån kommer Tilläggsbeloppet
beräknas som Lånens Kapitalbelopp multiplicerat med Deltagandegraden
och multiplicerat med det högre av Kupongen och Korgavkastningen. Om
summan av Korgavkastningen och 1 inte överstiger Barriärnivån på
någon Värderingsdag kommer Tilläggsbeloppet vara noll.
"Barriär Underperformance"-struktur 2: om Korgavkastningen på någon
Värderingsdag understiger Barriärnivån kommer Tilläggsbeloppet
beräknas som Lånens Kapitalbelopp multiplicerat med Deltagandegraden
och multiplicerat med det högre av Kupongen och Korgavkastningen. Om
Korgavkastningen inder understiger Barriärnivån på någon Värderingsdag
kommer Tilläggsbeloppet vara noll.
Eftersträvad Volatilitetstrategi: Om Eftersträvad Volatilitetstrategi är
tillämplig på Lånen, fastställs den avsedda exponeringen mot
underliggande Referenstillgång(ar) eller Korg ("Exponeringen") genom
att jämföra:
(i) den kortfristiga historiska volatiliteten för underliggande Korg,
och
(ii) en eftersträvad volatilitetsnivå ("Eftersträvad Volatilitet"),
med förbehåll för ett på förhand bestämt tak eller golv.
När underliggande Referenstillgång(ar)s eller Korgs kortfristiga historiska
volatilitet ökar, minskar den avsedda Exponeringen mot underliggande
Referenstillgång(ar) eller Korg och när underliggande
Referenstillgång(ar)s eller Korgs kortfristiga historiska volatilitet
minskar, ökar den avsedda exponeringen mot underliggande
Referenstillgång(ar) eller Korg.
"Booster Riskbarriär"-struktur 2: är en kombination av en "at the money"
call-option och en "out of the money" put-option. Strike-priset för call-
optionen är satt till det rådande priset på Referenstillgången eller Korgen
vid tidpunkten för emissionen av Lånen. Om värdet på
Referenstillgångarna eller Korgen överstiger ett förutbestämt
tröskelvärde, koller ett Tilläggsbelopp att beräknas genom att multiplicera
Lånens Kapitalbelopp med Deltagandegraden och Korgavkastningen
(beräknad enligt "Basket Long" som beskrivits ovan). Strike-priset för
put-optionen kommer att sättas lägre än den rådande priset på
Referenstillgångarna eller Korgen vid tidpunkten för emissionen av de
relevanta Lånen och om värdet på Referenstillgången eller Korgen
understiger ett specificerat tröskelvärde kommer Tilläggsbeloppet att
beräknas genom att multiplicera Lånens Kapitalbelopp med
Deltagandegraden 2 och Korgavkastningen (beräknad enligt "Basket
Short" som beskrivits ovan).
Booster Risk Barrier 2: Booster Risk Barriär 2-strukturen är en
kombination av en "at the money" call-option och en "out of the money"

192819-3-22-v2.0 - 60- 70-40619915
put-option. Lösenprisnivån för call-optionen sätts till det gällande priset
för en Referenstillgång eller Korg vid datumet för utgivande av de
relevanta Lånen. Om Referenstillgångens eller Korgens värde överstiger
en förutbestämd barriärnivå bestäms Tilläggsbeloppet genom att
multiplicera Lånens Kapitalbelopp med Deltagandegraden och
Korgavkastningen (beräknat enligt metoden för att beräkna "Basket
Long" enligt ovan). Lösenprisnivån för put-optionen sätts till ett belopp
understigande gällande pris för en Referenstillgång eller Korg vid
datumet för utgivande av relevant Lån. Om värdet på sådan
Referenstillgång eller Korg sjunker till att understiga den specificerade
barriärnivån bestäms Tilläggsbeloppet genom att multiplicera Lånens
Kapitalbelopp med Deltagandegraden 2 och Korgavkastningen (beräknat
enligt metoden för att beräkna "Basket Short" enligt ovan)
"Autocall"-struktur: Om värdet på en underliggande Referenskurs
antingen överstiger eller understiger en förutbestämd barriärnivå bestämd
i de relevanta Slutliga Villkoren ("Autocall-händelsen") kommer Lånen
att inlösas i förtid. Om Autocall-händelsen inte inträffar före den slutliga
Värderingsdagen kommer Lånen att inlösas på Återbetalningsdagen.
"In och Out Option"-struktur: "In och Out Options"-struktur är
tröskelvärdesval som ger ett Tilläggsbelopp beroende på om
Korgavkastningen har varit högre eller lägre än en viss förutbestämd
tröskelnivå specificerad i de Slutliga Villkoren ("Barriärnivån"). "Up
and In Option"-strukturen ger ett Tilläggsbelopp kopplat till avkastningen
för den relevanta Korgen om Korgavkastningen är lika med eller högre än
den relevanta Barriärnivån på något Värderingsdatum. Tilläggsbeloppet
kan vara positivt eller negativt beroende på om Options-typen är en
"bought"-option eller en "sold"-option.
"Up and Out Option"-struktur ger ett Tilläggsbeloppet kopplat till
avkastningen för den relevanta Korgen om Korgavkastningen är lika med
eller lägre än den relevanta Barriärnivån på varje Värderingsdatum. I en
"Down and Out Option"-struktur kommer ett Tilläggsbeloppet att utfalla
om Korgavkastningen är lika med eller högre än den relevanta
Barriärnivån på varje Värderingsdatum. Tilläggsbeloppet kan vara
positivt eller negativt beroende på om Options-typen är en "bought"-
option eller en "sold"-option.
Varje "In and Out Option"-struktur kan baseras på antingen en
underliggande "Basket Long"- eller "Basket Short"-struktur. "In and Out
Option"-strukturer kan också utbetala en fast ränta kallad kupong eller
"rabatt" för de fall att de inte genererar ett Tilläggsbelopp baserat på
avkastningen på den relevanta Korgen. I en "bought"-optionstruktur ska
kupongen eller rabatten betalas till Fordringshavarna och kan därför
medföra ett negativt Tilläggsbelopp (vilken kan dras av från
Basåterbetalningsbeloppet).
"In and Out Option"-struktur: [In Option – Basket Long/In Option –
Basket Short/Out Option – Basket Long/Out Option – Basket Short/Inte
tillämpligt]
Options-typ: [Bought Up and Sold/Sold Up and In/ Bought Down and
In/Sold Down and In/Bought up and Out/Sold Up and Out/Bought Down
and Out/Sold Down and Out/Inte tillämpligt]
Tillämpliga värdeutvecklingsstruktur(er) är:[ ]
[Underliggande Korgavkastningsstruktur är Basket Long/Basket Short-
strukturerna]/[Ej tillämpligt]

192819-3-22-v2.0 - 61- 70-40619915
Valutakomponenter: om Valuta-komponenterna tillämpas på en eller flera
värdeutvecklingsstrukturer angivna ovan kan
Referenstillgångsavkastningen, Tilläggsbeloppet eller
Basåterbetalningsbeloppet justeras genom att de multipliceras med en
faktor som återspeglar variationen i en eller flera utländska valutakurser
under de relevanta tidsperioderna som mäts eller observeras. Om
"Valutakomponenten Sammansatt" specificeras som tillämplig i de
relevanta Slutliga Villkoren ska justering för att reflektera den relevanta
valutakursen tillämpas före det att Strike Level tas med i beräkningen när
Referenstillgångsavkastningen ska bestämmas.
[Valutakomponenten [Sammansatt] är tillämplig på Referenstillgångs-
avkastningen/Tilläggsbeloppet/Basåterbetalningsbeloppet]
[Valutakomponenten är ej tillämplig]
Best of/Worst of Modifier: om Best of/Worst of Modifier tillämpas på en
eller flera värdeutvecklingsstrukturer angivna ovan ska de relevanta
iakttagelserna, värderingarna och beräkningarna av Tilläggsbeloppet
fastställas med referens till utvecklingen av den Nth bäst presterande
Referenstillgången, istället för till Korgen som helhet. N kommer att vara
ett förbestämt värde som finns angivet i de Slutliga Villkoren.
[Best of/Worst of Modifierare är tillämpligt och värdet av N är: [ ]/Ej
tillämpligt]
Lookback Startkurs Modifierare: om Lookback Startkurs Modifierare är
tillämpligt beräknas Lånens Tilläggsbelopp baserat på antingen den
högsta eller den lägsta Startkursen (vid ingången till en Värderingsperiod)
för relevant Korg eller Referenstillgång, såsom närmare anges i Slutliga
Villkor.
[Lookback Startkurs Modifierare är Tillämpligt/ej Tillämpligt]
Lookback Slutkurs Modifierare: om Lookback Slutkurs Modifierare är
tillämpligt beräknas Lånens Tilläggsbelopp baserat på antingen den
högsta eller den lägsta Slutkursen (vid utgången av en Värderingsperiod)
för relevant Korg eller Referenstillgång, såsom närmare anges i Slutliga
Villkor.
[Lookback Slutkurs Modifierare är Tillämpligt/ej Tillämpligt]
Lock-In Modifier: om Lock-In Modifier tillämpas på Lånen ska
Korgavkastningen ersättas med Lock-In Korgavkastningen för att beräkna
Tilläggsbeloppet i enlighet med en eller flera av de ovanstående
värdeutvecklingsstrukturerna. "Lock-In-Korgavkastningen" är den
förutbestämda procentsats vilken korresponderar mot den högsta lock-in-
nivån som uppnås eller eller överskrids av Korgavkastningen på en
Värderingsdag.
[Lock-In Modifierare är Tillämplig/ej Tillämplig]
Kombination av Strukturer: Relevant Emittent kan välja att kombinera en
eller flera av värdeutvecklingsstrukturerna som beskrivs ovan i samband
med ett utgivande av Lån. Om "Sammanslagning" är specificerat i
Slutliga Villkor kommer det totala betalbara Tilläggsbeloppet vara lika
med summan av de olika tillämpliga Tilläggsbeloppen i varje fall
multiplicerat med procenttal som reflekterar den totala andelen av den
sammanlagda avkastningen som den relevanta Emittenten avser att varje
värdeutvecklingsstruktur bidrar. Om "Subtraktion" är angivet i Slutliga
Villkor kommer ett Tilläggsbelopp subtraheras från ett annat. Om
"Alternativ Uträkning" är angiven i Slutliga Villkor kommer den
192819-3-22-v2.0 - 62- 70-40619915
värdeutvecklingsstruktur som används för att bestämma Tilläggsbeloppet
avvika beroende på huruvida Korgavkastningen på en viss Värderingsdag
har överstigit en eller flera förutbestämda Barriärnivåer eller ej, såsom
framgår av relevanta Slutliga Villkor.
[Ej Tillämpligt/Kombination av Strukturer är tillämpligt och de relevanta
Värdeutvecklingsstrukturerna finns angivna ovan. Kombinationsmetoden
är Sammanslagning/Subtraktion/Alternativ Uträkning]
"Högsta Återbetalningsbelopp": om ett högsta Återbetalningsbelopp är
tillämpligt kommer Återbetalningsbeloppet vara det lägre av (i) det
beräknade beloppet i enlighet med en av värdeutvecklingsstrukturerna
angivna ovan, och (ii) ett förutbestämt högsta återbetalningsbelopp såsom
specificerat i relevanta Slutliga Villkor.
Ej Tillämpligt/Högsta Återbetalningsbeloppet är [ ]
"Lägsta Återbetalningsbelopp": om ett lägsta Återbetalningsbelopp är
tillämpligt kommer Återbetalningsbeloppet vara det högre av (i) det
beräknade beloppet i enlighet med en av värdeutvecklingsstrukturerna
angivna ovan och (ii) ett förutbestämt lägsta återbetalningsbelopp såsom
specificerat i relevanta Slutliga Villkor.
Ej Tillämpligt/Lägsta Återbetalningsbeloppet är [ ]
Högsta och Lägsta Återbetalningsbelopp: Om både ett högsta och lägsta
Återbetalningsbelopp är tillämpligt ska Återbetalningsbeloppet motsvara
det högsta av: (i) det Lägsta Återbetalningsbeloppet och (ii) det lägre av
(x) det belopp som beräknats efter avkastningen för en eller flera av de
strukturer som beskrivits ovan och (y) det Högsta Återbetalningsbeloppet.
"Inflationsskyddat Kapitalbelopp": om detta är tillämpligt kommer
Återbetalningsbeloppet som fastställts i enlighet med de angivna
värdeutvecklingsstrukturerna och/eller Tilläggsbeloppet/Tilläggsbeloppen
ovan att multipliceras med utvecklingen i ett angivet inflationsmått,
såsom konsumentprisindex, under Lånens löptid.
Inflationsskyddat Kapitalbelopp är [Tillämpligt/ej Tillämpligt]
TOM Ackumulerande Strategi: TOM Ackumulerande Strategi speglar att
en investering görs i särskilda Referenstillgångar ("Risktillgångar") men
enbart för en begränsad period varje månad. Vid övriga tidpunkter speglar
Lånen ett bundet sparande eller annan investering med fast avkastning. I
Slutliga Villkoren anges vilka dagar i vilken månad som helst där dagar
behandlas såsom en investering i en bestämd inkomst-investering
("Övriga Tillgångar{xe {"Övriga Tillgångar"}"), i syfte att beräkna
Lånens totala betalbara Tilläggsbelopp.
Endast Risktillgångarnas utveckling, eller de Övriga Tillgångarnas
utveckling sammanräknat med Risktillgångarnas utveckling (som
tillämpligt) kan också beräknas som ett genomsnitt av ett förutbestämt
antal kalendermånader som föregår Lånens Återbetalningsdag, i syfte att
begränsa Lånens utsatthet för volatilitet i förhållande till
Referenstillgångarnas utveckling vid slutet av Lånens löptid.
TOM Ackumulerande Strategi är [Tillämplig/ej Tillämplig]
"Lock-in Korggolv: Om Lock-in Korggolv är tillämpligt i förhållande till
Lånen, och om Korgavkastningen överstiger Barriärnivån på en
Värderingsdag, ska Korgavkastningen ersättas med det högre av
Korgavkastningen och en förutbestämd lägsta Korgavkastningsnivå för att
bestämma Tilläggsbeloppet i enlighet med relevant

192819-3-22-v2.0 - 63- 70-40619915
värdeutvecklingsstruktur.
Lock-in Korggolv är [Tillämplig/ej Tillämplig]
C.11
C.21
Upptagande till
handel på en
reglerad marknad:
Ansökningar har gjorts för att Lånen inom en period av tolv månader från
detta datum ska bli godkända för notering på den officiella listan och för
handel på den reglerade marknaden Irish Stock Market Exchange.
Programmet tillåter även att Lån utfärdas på förutsättningen att de inte
kommer bli godkända för notering, handel och/eller notering av någon
behörig myndighet, aktiebörs och/eller marknadssystem eller godkännas
för notering, handel och/eller notering på sådan annan eller ytterligare
behörig myndighet, aktiebörs och/eller marknadssystem som kan avtalas
om med den relevanta Emittenten.
Lånen är icke-noterade Lån/Ansökan kommer göras för Lånen för att
godkännas för notering på [ ] och för handel på [ ] med verkan från [ ].
C.1513
Lånens värde och
värdet för det
underliggande:
Värdet på Lånen kommer att bestämmas genom hänvisning till värdet av
de(n) underliggande Referenstillgång(-ar) och de(n)
värdeutvecklingsstruktur(er) som tillämpas på Lånen. Uppgifter om de
olika värdeutvecklingsstrukturerna och förhållandet mellan Lånens värde
och värdet av det underliggande finns angivet i avsnitt C.10.
Detaljer om de(n) tillämpliga värdeutvecklingsstrukturen(-erna) och
avkastningen på Lånen finns angivet i avsnitt C.10.
Lånens struktur kan innehålla en deltagandegrad eller annan hävstångs-
eller gearingfaktor som används för att fastställa exponeringen mot
respektive Referenstillgång(ar), dvs. proportionen av ändring i värdet som
tillfaller investeraren i varje individuellt Lån. (Exponeringen mot
relevant(a) Referenstillgång(ar) kan dessutom påverkas vid tillämpning av
Eftersträvad Volatilitetstrategi som beskrivs i avsnitt C.10 ovan).
Deltagandegraden bestäms av den relevanta Emittenten och fastställs
genom, bland annat, löptiden, volatiliteten, marknadsräntan och den
förväntade Referenstillgångsavkastningen.
Den [indikativa] Deltagandegraden är: [ ]
C.16 Inlösen- eller
förfallodag:
Med förbehåll för en förtida återbetalning, kommer inlösendagen (eller
den slutliga Återbetalningsdagen) vara Lånens förfallodag.
Lånens återbetalningsdag är: [ ]
C.17 Avräknings-
förfarande:
Dagen eller dagarna då värdeutvecklingen i en Referenstillgång mäts eller
observeras ("Värderingsdag(ar)" eller Observationsdag(ar)") kommer
anges i de relevanta Slutliga Villkoren, och kan bestå av flera datum
("Medelvärdesberäkningsdagar") på vilka genomsnittet av
värdeutvecklingen beräknas och ligger till grund för avkastningen på
Lånen.
[Värderingsdagen(-arna) [och de relaterade
Medelvärdesberäkningsdagarna] är: [ ]]
[Observationsdagen(-arna) [och de relaterade
Medelvärdesberäkningsdagarna] är:[ ]]
Avräkning av Lån som representeras av ett Globalt Lån ska ske på den
relevanta betalningsdagen och kommer att genomföras genom att den
relevanta Emittenten betalar, om tillämpligt, kapitalbelopp och/eller ränta
till de relevanta Betalningsagenterna för vidare överföring till Euroclear
och Clearstream, Luxemburg. Investerare kommer motta sina
13 Avsnitt c.15 till och med 20 bör avlägsnas när det gäller utgivande av enkelt lån.

192819-3-22-v2.0 - 64- 70-40619915
återbetalningssummor till sina konton i Euroclear och Clearstream,
Luxemburg, i enlighet med sedvanliga avräkningsförfaranden hos
Euroclear och Clearstream, Luxemburg.
Med hänsyn till Lån av definitiv typ kommer betalning av
Återbetalningsbeloppet (eller Förtida Återbetalningsbelopp, om
tillämpligt) göras mot presentation och överlämnande det individuella
Lånet vid det angivna betalningsagent- eller registratorkontoret.
Avräkning av VP-Lån ska ske i enlighet med VP-reglerna, avräkning av
VPS-Lån ska ge i enlighet med VPS-reglerna, avräkning av Svenska Lån
ska ske i enlighet med Euroclear Swedens regler och avräkning av Finska
Lån ska ske i enlighet med Euroclear Finlands regler.
Avräkning av Lån ska ske: [ ]
C.18 Avkastning: Avkastningen eller Återbetalningsbeloppet som ska betalas till
Investerarna kommer fastställas med referens till värdeutvecklingen för de
underliggande Referenstillgångarna/-enheterna inom en specifik
räntestruktur eller värdeutvecklingsstruktur som är tillämplig för Lånen.
Detaljer om olika ränte- och värdeutvecklingsstrukturer finns angivna i
avsnitt C.9 och C.10.
Detaljer kring de(n) tillämpliga ränte- och utvecklingsstrukturen(-erna)
och avkastningen på Lånen finns angivna i avsnitt C.9 och C.10.
C.19 Optionskurs eller
Slutligt
Referenspris:
Det slutliga referenspriset på de(n) relevanta Referenstillgången(-arna)
kommer ha en inverkan på Återbetalningsbeloppet som ska betalas till
Investerare. Det slutliga referenspriset kommer fastställas på de(n)
tillämpliga Värderingsdagen(-arna) som anges i de relevanta Slutliga
Villkoren.
Det slutliga referenspriset på Referenstillgångarna kommer att beräknas
som [stängningskurs]/[genomsnittliga slutkurser] som publicerats av [•]
på vardera av [•], [•] och [•].
C.20 Typ av
underliggande:
Det underliggande kan utgöra en, eller en kombination, av följande:
aktier, tillgångar, index, referensenheter, räntesatser, fonder, råvaror eller
valutor.
Typ av underliggande är: [ ].
Avsnitt D - Risker
D.2 Risker specifika
för Emittenterna:
Vid förvärv av Lån påtar sig investerarna risken att den relevanta
Emittenten kan bli insolvent eller på annat sätt bli oförmögen att betala
förfallna belopp hänförliga till Lånen. Det finns ett stort antal faktorer
som var för sig eller tillsammans kan leda till att den relevanta Emittenten
blir oförmögen att betala förfallna belopp hänförliga till Lånen. Det är inte
möjligt att identifiera alla sådana faktorer eller fastställa vilka faktorer
som är mest troliga att inträffa, eftersom den relevanta Emittenten kan
vara ovetande om alla relevanta faktorer sant att vissa faktorer som denne
för närvarande inte anser vara relevanta kan komma att bli relevanta till
följd av händelser som inträffar och som befinner sig utanför den
relevanta Emittentens kontroll. Emittenterna har i Grundprospektet
identifierat ett antal faktorer som avsevärt skulle kunna inverka negativt
på dess respektive verksamhet och förmåga att under Lånen betala
förfallna belopp. Dessa faktorer innefattar:
Risker med anknytning till aktuella makroekonomiska förhållanden

192819-3-22-v2.0 - 65- 70-40619915
Risker med anknytning till den europeiska ekonomiska krisen samt
osäkerhet kring Kinas ekonomiska situation har haft och kan, trots den
senaste periodens stabilisering, även i fortsättningen komma att ha, en
negativ påverkan på den globala ekonomin och finansmarknaderna. Om
förhållandena kvarstår, eller om turbulens uppstår på dessa eller andra
marknader, kan det på ett betydande sätt negativt påverka Nordea-
koncernens förmåga att få tillgång till kapital och likviditet på
ekonomiska villkor som Nordea-koncernen kan acceptera.
Vidare påverkas Nordea-koncernens resultat på ett betydande sätt av det
allmänna ekonomiska läget i de länder där den bedriver verksamhet, i
synnerhet på de nordiska marknaderna (Danmark, Finland, Norge och
Sverige). En negativ utveckling för ekonomin och marknadsförhållanden
där koncernen bedriver verksamhet, kan negativt påverka koncernens
verksamhet, finansiella tillstånd och verksamhetsresultat och det åtgärder
som Nordea-koncernen vidtar kan visa sig otillräckliga för att minska
kredit-, marknads- och likviditetsrisker.
Risker med anknytning till Nordea-koncernens kreditportfölj
Negativa ändringar i kreditvärdigheten hos Nordea-koncernens låntagare
och motparter, eller en minskning i värdet för säkerheter, kommer
sannolikt påverka Nordea-koncernens återhämtningsmöjligheter och
värdet av dess tillgångar, vilket kan kräva en ökning av företagets
enskilda regler och eventuellt i de kollektiva reglerna för dåliga lån. En
betydande ökning i storleken på Nordeas avsättningar för låneförluster
och låneförluster som inte täcks av avsättningar, skulle på ett betydande
sätt negativt påverka Nordea-koncernens verksamhet, finansiella läge och
verksamhetsresultat.
Nordea-koncernen är exponerad för motparters kreditrisker,
förlikningsrisker och överlåtelserisker i förhållande till transaktioner som
genomförs inom sektorn för finansiella tjänster och denna sektors handel
med finansiella instrument. Om motparterna inte klarar att fullgöra sina
åtaganden kan detta på ett betydande sätt negativt påverka Nordea-
koncernens verksamhet, ekonomiska läge och verksamhetsresultat.
Risker med anknytning till marknadsexponering
Värdet på finansiella instrument som ägs av Nordea-koncernen är
känsliga för volatiliteten i, och korrelationer mellan, olika
marknadsvariabler, bland annat räntor, kreditspridningar, aktiepriser och
utländska valutakurser. Nedskrivningar eller avskrivningar som
kostnadsförts kan på ett betydande sätt negativt påverka Nordea-
koncernens verksamhet, ekonomiska läge och verksamhetsresultat, medan
finansmarknadens resultat och volatila marknadsförhållanden kan
resultera i en betydande minskning i Nordea-koncernens handels- och
investeringsinkomster, eller leda till en handelsförlust.
Nordea-koncernen är utsatt för strukturella marknadsrisker
Nordea-koncernen är utsatt för strukturell ränteinkomstrisk när det råder
ett missförhållande mellan perioder då räntesatser förändras, volymer
eller referensräntor för sina tillgångar, skulder och derivat. Nordea-
koncernen är även utsatt för valutakonverteringsrisk som uppstår genom
företagets svenska och norska bankverksamheter när den sammanställer
koncernens konsoliderade årsredovisning i sin funktionella valuta, euron.
Om ett missförhållande råder under en viss period, vid ändringar i räntan,
eller om valutariskexponeringen inte hedgas tillräckligt, kan det på ett
betydande sätt få en negativ påverkan för Nordea-koncernens ekonomiska
192819-3-22-v2.0 - 66- 70-40619915
läge och verksamhetsresultat.
Risker med anknytning till likviditets- och kapitalkrav
En betydande andel av Nordea-koncernens likviditets- och
finansieringskrav uppfylls genom insättningar från kunder, samt även en
kontinuerlig tillgång till marknader för storskaliga lån, bland annat
utfärdandet av långfristiga skuldebrev, t.ex. säkerställda obligationer.
Turbulens på de globala finansmarknaderna och ekonomin kan negativt
påverka Nordea-koncernens likviditet och villigheten hos vissa motparter
och kunder att göra affärer med Nordea-koncernen.
Nordea-koncernens verksamhetsresultat kan påverkas om de
kapitaltäckningsnivåer som måste upprätthållas enligt tillämpligt
regelverk, innefattandes europaparlamentets och rådets direktiv
2013/36/EU, europarlamentets och rådets förordning nr. 575/2013 och de
andra regler som reglerar kapitaltäckning, eller andra krav som är
tillämpliga på någon Emittent eller Nordea-koncernen och som medför
(ensamt eller tillsammans med andra regler och förordningar) krav för att
finansiella instrument ska kunna inräknas i någon Emittents eller Nordea-
koncernens regulatoriska kapital (var för sig eller på konsoliderad basis,
som tillämpligt) i den utsträckning som krävs enligt direktiv 2013/36/EU,
förordning nr. 575/2013, inklusive de tekniska standarder släppta av
europeiska bankmyndigheten (EBA) (eller dess efterträdare eller
ersättare) ("CRD IV"), minskar eller anses otillräckliga.
Nordea-koncernens finansieringskostnader och företagets tillgång till
skuldkapitalmarknader påverkas på ett betydande sätt av dess kreditbetyg.
En sänkning av kreditbetyget kan negativt påverka Nordea-koncernens
tillgång till likviditet och dess konkurrensläge, och därför på ett
betydande sätt negativt påverka företagets verksamhet, ekonomiska
tillstånd och verksamhetsresultat.
Andra risker med anknytning till Nordea-koncernens verksamhet
För att Nordea-koncernens verksamhet ska fungera måste företaget kunna
genomföra ett stort antal komplexa transaktioner på olika marknader i
många valutor. Transaktioner genomförs genom många olika enheter.
Trots att Nordea-koncernen har implementerat riskkontroller och vidtagit
andra åtgärder för att minska exponeringen och/eller förlusterna, finns
inga garantier för att sådana procedurer kommer att vara effektiva i att
hantera de olika verksamhetsrisker som Nordea-koncernen står inför, eller
att Nordea-koncernens rykte inte skadas genom förekomsten av
operationell risk.
Nordea-koncernens verksamheter i Ryssland och Baltikum – marknader
som vanligen är mer volatila och mindre ekonomiskt och politiskt
utvecklade än marknaderna i Västeuropa och Nordamerika – innebär
olika risker som inte gäller, eller gäller i mindre grad, för företagets
verksamheter i Norden. Vidare är vissa av dessa marknader vanligtvis
mer volatila och mindre utvecklade rent ekonomiskt och politisk än
marknader i Västeuropa och Nordamerika.
Nordea-koncernens resultat bygger till stor del på dess anställdas höga
kompetens och yrkesskicklighet. Nordea-koncernens fortsatta förmåga att
konkurrera effektivt och implementera sin strategi är beroende av
förmågan att dra till sig nya anställda och att behålla och motivera
befintliga anställda. Nya regulatoriska begränsningar, såsom nyligen
införda begränsningar på vissa typer av ersättningar som får betalas av
kreditinstitut och värdepappersbolag som följer av CRD IV, kan negativt
inverka på Nordea-koncernens förmåga att attrahera ny personal och att

192819-3-22-v2.0 - 67- 70-40619915
behålla och motivera nuvarande personal. Förluster av vissa
nyckelpersoner, särskilt om de går över till konkurrenter, eller en
oförmåga att dra till sig och behålla högkompetent personal i framtiden,
kan få en negativ effekt på Nordea-koncernens verksamhet.
Det råder konkurrens om de olika typer av banktjänster och produkter
som Nordea-koncernen erbjuder. Det finns inga garantier för att Nordea-
koncernen kommer att behålla sin konkurrensposition.
Risker med anknytning till lagar och regulatoriska krav på området där
Nordea-koncernen bedriver sin verksamhet
Nordea Group måste följa ett stort antal regler och kontrolleras av olika
myndigheter, såväl som lagar och bestämmelser, administrativa påbud
och policyer i de olika jurisdiktioner som företaget verkar, vilka alla kan
ändras. Detta kan vid var tid för förändring innebära betydande utgifter.
Nordea-koncernen kan ådra sig betydande kostnader för kontroller och
uppfyllandet av nya kapitalkrav, samt krav på återvinning och upplösning,
vilket även kan påverka befintliga affärsmodeller. Vidare finns inga
garantier om att brott mot lagar och bestämmelser av Nordea-koncernen
inte sker eller att, om ett sådant brott sker, företaget inte får betala stora
skadestånd eller böter.
Under normal drift av verksamheten gäller för Nordea-koncernen att det
förekommer risker med anknytning till myndigheters kontroller och
skadestånd. Nordea-koncernen är föremål för många olika anspråk,
tvister, processer och statliga utredningar i jurisdiktioner där företaget är
aktivt. Dessa slags anspråk och processer utsätter Nordea-koncernen för
risker för monetära skadestånd, direkta eller indirekta förluster (bl.a.
rättskostnader), direkt eller indirekt ekonomisk förlust, civilrättsliga och
straffrättsliga sanktioner, förlust av licenser eller goodwill-skada, samt
även risken för restriktioner för verksamhetens fortsatta drift.
Nordea-koncernens verksamhet beskattas olika runt om i världen i
enlighet med lokala lagar och praxis. Lagändringar eller beslut av
skattemyndigheterna kan skada Nordea-koncernens nuvarande eller
tidigare skatteläge.
D.3 Risker specifika
för Lånen:
Risker finns även i samband med emission av Lånen under Programmet
och särskilda typer av Lån, vilka potentiella investerare noga ska beakta,
så att de är införstådda i dessa risker innan ett investeringsbeslut fattas
avseende Lånen, bland annat följande:
Produktens komplexitet – avkastningsstrukturen för strukturerade
Lån är ibland komplex och kan innehålla matematiska formler
eller samband som, för en investerare, kan vara svåra att förstå
och jämföra med andra investeringsalternativ. Noteras bör att
relationen mellan avkastning och risk kan vara svår att utvärdera.
Lån vars kapitalbelopp inte är garanterat – Lån vars
kapitalbelopp inte är garanterade får emitteras enligt Programmet.
Om Lånens kapitalbelopp inte är garanterade, finns ingen garanti
för att avkastningen som en investerare får på Lånen vid inlösen
kommer att överstiga eller vara lika med kapitalbeloppet.
Prissättning av strukturerade Lån – Prissättningen av
strukturerade Lån bestäms vanligen av Emittenten ifråga, och inte
utifrån förhandlade villkor. Det kan därför uppstå en
intressekonflikt mellan Emittenten ifråga och investerarna, i det
att Emittenten ifråga kan påverka prissättningen och försöker

192819-3-22-v2.0 - 68- 70-40619915
generera en vinst eller undvika en förlust i relation till de
underliggande referenstillgångarna. Emittenterna har ingen
skyldighet att agera i Innehavarnas intresse.
Referenstillgångarnas värdeutveckling – Med strukturerade Lån
är Innehavarnas rätt till avkastning och ibland återbetalningen av
kapitalbeloppet, beroende av hur bra värdeutvecklingen är för en
eller flera referenstillgångar och den gällande
avkastningsstrukturen. Värdet på strukturerade tillgångar
påverkas av värdet på referenstillgångarna vid vissa tidpunkter
under värdepapprens löptid, hur starkt priserna hos
referenstillgångarna varierar, förväntningarna angående den
framtida volatiliteten, marknadsräntorna och förväntade
utdelningar på referenstillgångarna.
Valutafluktuationer. Växelkurserna för utländska valutor kan
påverkas av komplexa politiska och ekonomiska faktorer,
inklusive relativa inflationstakter, betalningsbalansen mellan
länder, storleken på regeringars budgetöverskott eller
budgetunderskott och den monetära, skatte- och/eller
handelspolitiska policy som följs av de relevanta valutornas
regeringar. Valutafluktuationer kan påverka värdet eller nivån
hos Referenstillgångarna på komplexa sätt. Om sådana
valutafluktuationer får värdet eller nivån hos
Referenstillgångarna att variera, så kan värdet eller nivån på
Lånen falla. Om värdet eller nivån hos en eller flera
Referenstillgång(ar) är utfärdad(e) i en valuta som är annan än
valutan i vilken Lånen är utfärdade, så kan investerarna vara
utsatta för en ökad risk som kommer från växelkurser för
främmande valutor. Tidigare växelkurser för utländska valutor är
inte nödvändigtvis indikationer beträffande framtida växelkurser
för utländska valutor.
Aktier som Referenstillgångar – aktielänkade Lån är inte
sponsrade eller främjade av Emittenten av aktierna. Emittenten
av aktierna har därför inte någon skyldighet att beakta intresset
för dem som investerat i Lånen varför åtgärder tagna av en sådan
emittent av aktier skulle kunna negativt påverka Lånens
marknadsvärde. Den som investerat i Lånen har inte rätt att få
några utbetalningar eller andra utdelningar till vilka en direkt
ägare av de underliggande aktierna annars skulle ha rätt.
Index som Referenstillgångar – Lån som baserar sig på index
som Referenstillgångar kan få lägre betalning vid inlösen av
sådana Lån än om han eller hon hade investerat direkt i de
aktier/tillgångar som utgör indexet. Sponsorn av vilket som helst
index kan lägga till, ta bort eller ersätta komponenter eller göra
metodändringar som kan påverka nivån på sådant index och
därmed den avkastning som skall betalas till investerare i Lånen.
Nordea-koncernen kan också ta del i att skapa, strukturera och
underhålla indexportföljer och indexstrategier (och kan även
agera indexsponsor i förhållande därtill) (gemensamt "Egna
Sammansatta Index"). Det kan därför uppstå intressekonflikter
för Emittenterna i deras roll som Emittent av sådana Lån och i
deras ställning i att upprätta, marknadsföra, främja eller
administrera sådana index.
Råvaror som Referenstillgångar – att handla i råvaror är
spekulativt och kan vara extremt volatilt eftersom råvarupriser
påverkas av faktorer som är oförutsägbara, såsom ändringar i

192819-3-22-v2.0 - 69- 70-40619915
relationerna mellan tillgång och efterfrågan, vädermönster och
regeringars politik. Råvarukontrakt kan även handlas direkt
mellan marknadsaktörer "over-the-counter" på handelsplatser
som är föremål för minimal eller ingen substantiell reglering.
Detta ökar riskerna som sammanhänger med likviditets- och
prishistorik för de relevanta kontrakten. Lån som är länkade till
terminskontrakt för råvaror kan ge en annan avkastning än Lån
som är länkade till den relevanta fysiska råvaran, eftersom priset
på ett terminskontrakt för en råvara allmänt innefattar en premie
eller en rabatt jämfört med dagspriset för den underliggande
råvaran.
Exponering mot en korg av Referenstillgångar – där det
underliggande är en eller flera korgar av Referenstillgångar, bär
investerarna risken för värdeutvecklingen för var och en av
delarna som korgen innehåller. Där det är en hög nivå av
ömsesidigt beroende mellan de individuella delarna av korgens
innehåll, så kan en ändring i värdeutvecklingen hos korgens delar
överdriva värdeutvecklingen i Lånen. Dessutom kan en liten korg
eller en olikartat viktad korg göra korgen sårbar för ändringar i
värdet hos vilken som helst av de specifika korgkomponenterna.
Varje beräkning eller värde som berör en korg med "bästa av"
eller "sämsta av"-inslag kan producera resultat som skiljer sig
mycket från dem som tar hänsyn till korgens värdeutveckling i
dess helhet.
Kreditlänkade Lån – en investering i kreditlänkade Lån för med
sig en exponering mot kreditrisken hos en specifik
Referenstillgång eller korg av Referensenheter utöver i
förhållande till den relevanta Emittenten. En reduktion av
kreditvärdigheten hos en Referensenhet kan ha en väsentlig
negativ effekt på marknadsvärdet för de relevanta Lånen och
betalningarna av kapitalbeloppet och upplupen ränta. När en
Kredithändelse inträffar, så kan den relevanta Emittentens
skyldighet att betala kapitalbeloppet ersättas av en skyldighet att
betala andra belopp beräknade med referens till värdet hos
Referensenheten. Eftersom inga av Referensenheterna bidrog till
framställandet av Grundprospektet, så finns ingen garanti för att
alla väsentliga händelser eller informationer som relaterar till
finansiell värdeutveckling eller kreditvärdigheten hos
Referensenheterna har offentliggjorts vid den tidpunkt då Lånen
emitterades.
Automatisk Förtida Återbetalning – vissa typer av Lån kan
automatiskt återbetalas före deras planerade förfallodatum om
vissa villkor är uppfyllda. I en del fall kan detta resultera i en
förlust av en del eller hela investerarens investering.
Lån som är föremål för valfri återbetalning av Emittenten – en
valfri återbetalning kan sannolikt minska Lånens marknadsvärde.
Lån emitterade med väsentlig rabatt eller premie –
marknadsvärdet av Lånen av denna typ tenderar att fluktuera mer
i relation till allmänna ändringar i räntesatser än priser för
konventionella räntebärande värdepapper.
Det finns också vissa risker rörande Lånen i allmänhet, såsom
modifikationer och undantag och lagändringar.
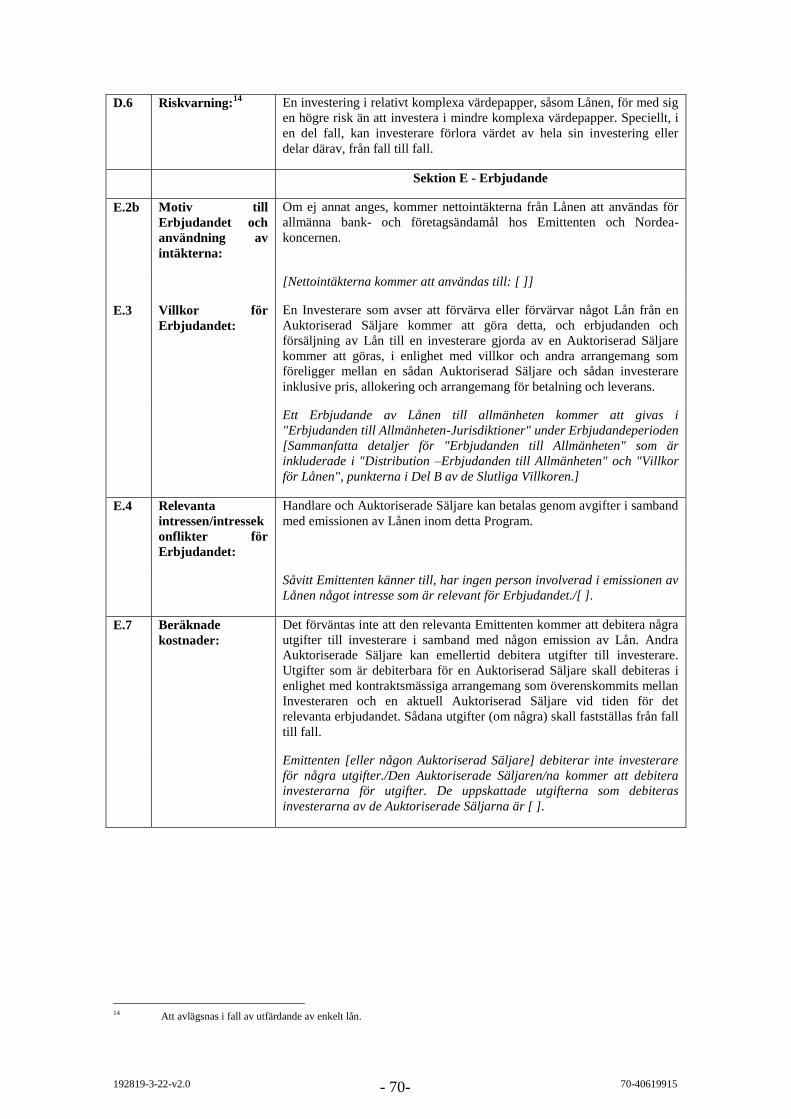
192819-3-22-v2.0 - 70- 70-40619915
D.6 Riskvarning:14
En investering i relativt komplexa värdepapper, såsom Lånen, för med sig
en högre risk än att investera i mindre komplexa värdepapper. Speciellt, i
en del fall, kan investerare förlora värdet av hela sin investering eller
delar därav, från fall till fall.
Sektion E - Erbjudande
E.2b Motiv till
Erbjudandet och
användning av
intäkterna:
Om ej annat anges, kommer nettointäkterna från Lånen att användas för
allmänna bank- och företagsändamål hos Emittenten och Nordea-
koncernen.
[Nettointäkterna kommer att användas till: [ ]]
E.3 Villkor för
Erbjudandet:
En Investerare som avser att förvärva eller förvärvar något Lån från en
Auktoriserad Säljare kommer att göra detta, och erbjudanden och
försäljning av Lån till en investerare gjorda av en Auktoriserad Säljare
kommer att göras, i enlighet med villkor och andra arrangemang som
föreligger mellan en sådan Auktoriserad Säljare och sådan investerare
inklusive pris, allokering och arrangemang för betalning och leverans.
Ett Erbjudande av Lånen till allmänheten kommer att givas i
"Erbjudanden till Allmänheten-Jurisdiktioner" under Erbjudandeperioden
[Sammanfatta detaljer för "Erbjudanden till Allmänheten" som är
inkluderade i "Distribution –Erbjudanden till Allmänheten" och "Villkor
för Lånen", punkterna i Del B av de Slutliga Villkoren.]
E.4 Relevanta
intressen/intressek
onflikter för
Erbjudandet:
Handlare och Auktoriserade Säljare kan betalas genom avgifter i samband
med emissionen av Lånen inom detta Program.
Såvitt Emittenten känner till, har ingen person involverad i emissionen av
Lånen något intresse som är relevant för Erbjudandet./[ ].
E.7 Beräknade
kostnader:
Det förväntas inte att den relevanta Emittenten kommer att debitera några
utgifter till investerare i samband med någon emission av Lån. Andra
Auktoriserade Säljare kan emellertid debitera utgifter till investerare.
Utgifter som är debiterbara för en Auktoriserad Säljare skall debiteras i
enlighet med kontraktsmässiga arrangemang som överenskommits mellan
Investeraren och en aktuell Auktoriserad Säljare vid tiden för det
relevanta erbjudandet. Sådana utgifter (om några) skall fastställas från fall
till fall.
Emittenten [eller någon Auktoriserad Säljare] debiterar inte investerare
för några utgifter./Den Auktoriserade Säljaren/na kommer att debitera
investerarna för utgifter. De uppskattade utgifterna som debiteras
investerarna av de Auktoriserade Säljarna är [ ].
14 Att avlägsnas i fall av utfärdande av enkelt lån.
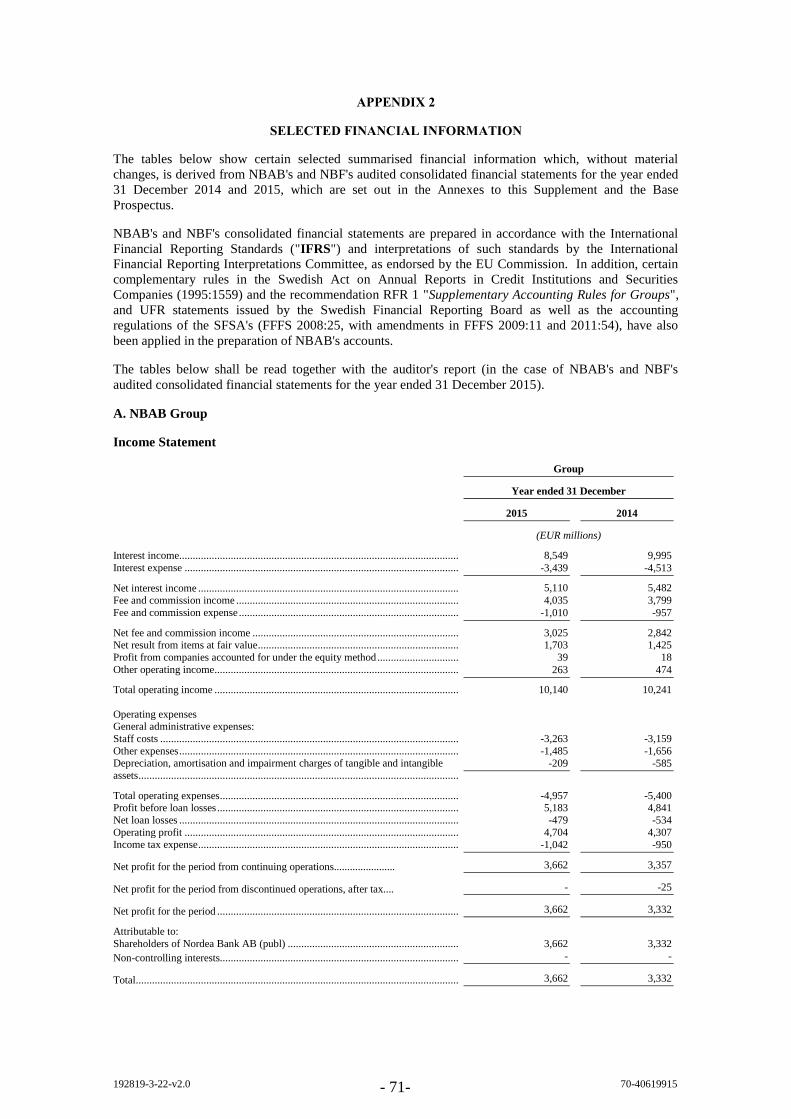
192819-3-22-v2.0 - 71- 70-40619915
APPENDIX 2
SELECTED FINANCIAL INFORMATION
The tables below show certain selected summarised financial information which, without material
changes, is derived from NBAB's and NBF's audited consolidated financial statements for the year ended
31 December 2014 and 2015, which are set out in the Annexes to this Supplement and the Base
Prospectus.
NBAB's and NBF's consolidated financial statements are prepared in accordance with the International
Financial Reporting Standards ("IFRS") and interpretations of such standards by the International
Financial Reporting Interpretations Committee, as endorsed by the EU Commission. In addition, certain
complementary rules in the Swedish Act on Annual Reports in Credit Institutions and Securities
Companies (1995:1559) and the recommendation RFR 1 "Supplementary Accounting Rules for Groups",
and UFR statements issued by the Swedish Financial Reporting Board as well as the accounting
regulations of the SFSA's (FFFS 2008:25, with amendments in FFFS 2009:11 and 2011:54), have also
been applied in the preparation of NBAB's accounts.
The tables below shall be read together with the auditor's report (in the case of NBAB's and NBF's
audited consolidated financial statements for the year ended 31 December 2015).
A. NBAB Group
Income Statement
Group
Year ended 31 December
2015 2014
(EUR millions)
Interest income...................................................................................................................................... 8,549 9,995
Interest expense .................................................................................................................................... -3,439 -4,513
Net interest income ............................................................................................................................... 5,110 5,482
Fee and commission income ................................................................................................................. 4,035 3,799
Fee and commission expense ................................................................................................................ -1,010 -957
Net fee and commission income ........................................................................................................... 3,025 2,842 Net result from items at fair value ......................................................................................................... 1,703 1,425
Profit from companies accounted for under the equity method ............................................................. 39 18
Other operating income ......................................................................................................................... 263 474
Total operating income ......................................................................................................................... 10,140 10,241
Operating expenses General administrative expenses:
Staff costs ............................................................................................................................................. -3,263 -3,159
Other expenses ...................................................................................................................................... -1,485 -1,656 Depreciation, amortisation and impairment charges of tangible and intangible
assets ..................................................................................................................................................... -209 -585
Total operating expenses ....................................................................................................................... -4,957 -5,400 Profit before loan losses ........................................................................................................................ 5,183 4,841
Net loan losses ...................................................................................................................................... -479 -534
Operating profit .................................................................................................................................... 4,704 4,307 Income tax expense ............................................................................................................................... -1,042 -950
Net profit for the period from continuing operations....................... 3,662 3,357
Net profit for the period from discontinued operations, after tax.... - -25
Net profit for the period ........................................................................................................................ 3,662 3,332
Attributable to:
Shareholders of Nordea Bank AB (publ) .............................................................................................. 3,662 3,332
Non-controlling interests....................................................................................................................... - -
Total................................................................................................................................................... 3,662 3,332

192819-3-22-v2.0 - 72- 70-40619915
Balance Sheet
Group
31 December
2015 2014
(EUR millions)
Assets
Cash and balances with central banks ................................................................................................... 35,500 31,067 Loans to central banks .......................................................................................................................... 13,224 6,958
Loans to credit institutions .................................................................................................................... 10,959 12,217
Loans to the public ................................................................................................................................ 340,920 348,085 Interest-bearing securities ..................................................................................................................... 88,176 87,110
Financial instruments pledged as collateral ........................................................................................... 8,341 12,151
Shares ................................................................................................................................................... 40,745 39,749 Derivatives ............................................................................................................................................ 80,741 105,119
Fair value changes of the hedged items in portfolio hedge of interest rate risk ..................................... 151 256
Investments in associated undertakings................................................................................................. 515 487 Intangible assets .................................................................................................................................... 3,208 2,908
Property and equipment ........................................................................................................................ 557 509
Investment property .............................................................................................................................. 3,165 3,227 Deferred tax assets ................................................................................................................................ 76 130
Current tax assets .................................................................................................................................. 87 132
Retirement benefit assets ...................................................................................................................... 377 42 Other assets ........................................................................................................................................... 18,600 17,581
Prepaid expenses and accrued income .................................................................................................. 1,526 1,614
Assets held for sale ............................................................................................................................... - -
Total assets ........................................................................................................................................... 646,868 669,342
Liabilities
Deposits by credit institutions ............................................................................................................... 44,209 56,322
Deposits and borrowings from the public ............................................................................................. 193,342 197,254 Liabilities to policyholders .................................................................................................................... 55,491 51,843
Debt securities in issue.......................................................................................................................... 201,937 194,274
Derivatives ............................................................................................................................................ 79,505 97,340 Fair value changes of the hedged items in portfolio hedge of interest rate risk ..................................... 2,594 3,418
Current tax liabilities ............................................................................................................................ 225 368
Other liabilities ..................................................................................................................................... 25,756 26,973 Accrued expenses and prepaid income ................................................................................................. 1,805 1,943
Deferred tax liabilities........................................................................................................................... 1,028 983
Provisions ............................................................................................................................................. 415 305 Retirement benefit obligations .............................................................................................................. 329 540
Subordinated liabilities ......................................................................................................................... 9,200 7,942
Liabilities held for sale.......................................................................................................................... - -
Total liabilities ...................................................................................................................................... 615,836 639,505
Equity
Non-controlling interests....................................................................................................................... 1 2 Share capital ......................................................................................................................................... 4,050 4,050
Share premium reserve ......................................................................................................................... 1,080 1,080
Other reserves ....................................................................................................................................... -1,188 -1,201 Retained earnings .................................................................................................................................. 27,089 25,906
Total equity ........................................................................................................................................... 31,032 29,837
Total liabilities and equity..................................................................................................................... 646,868 669,342
Assets pledged as security for own liabilities ........................................................................................ 184,795 163,041
Other assets pledged ............................................................................................................................. 9,038 11,265 Contingent liabilities ............................................................................................................................. 22,569 22,017
Credit commitments .............................................................................................................................. 71,340 74,291
Other commitments ............................................................................................................................... 3,323 1,644

192819-3-22-v2.0 - 73- 70-40619915
Cash Flow Statement
Group
Year ended 31 December
2015 2014
(EUR millions)
Operating activities
Operating profit ..................................................................................................................... 4,704 4,307
Profit for the period from discontinued operations, after tax .................................................. - -25 Adjustment for items not included in cash flow ..................................................................... 2,824 8,140
Income taxes paid ...................................................................................................... -1,056 -966
Cash flow from operating activities before changes in operating assets and
liabilities .................................................................................................................... 6,472 11,456
Cash flow from operating activities ....................................................................................... 196 -10,824 Cash flow from investing activities ........................................................................................ -522 3,254
Cash flow from financing activities ....................................................................................... -1,746 -1,040
Cash flow for the period ........................................................................................................ -2,072 -8,610
Cash and cash equivalents at the beginning of period ............................................................ 39,683 45,670
Translation differences ........................................................................................................... 2,589 2,623 Cash and cash equivalents at the end of period ...................................................................... 40,200 39,683
Change ................................................................................................................................... -2,072 -8,610
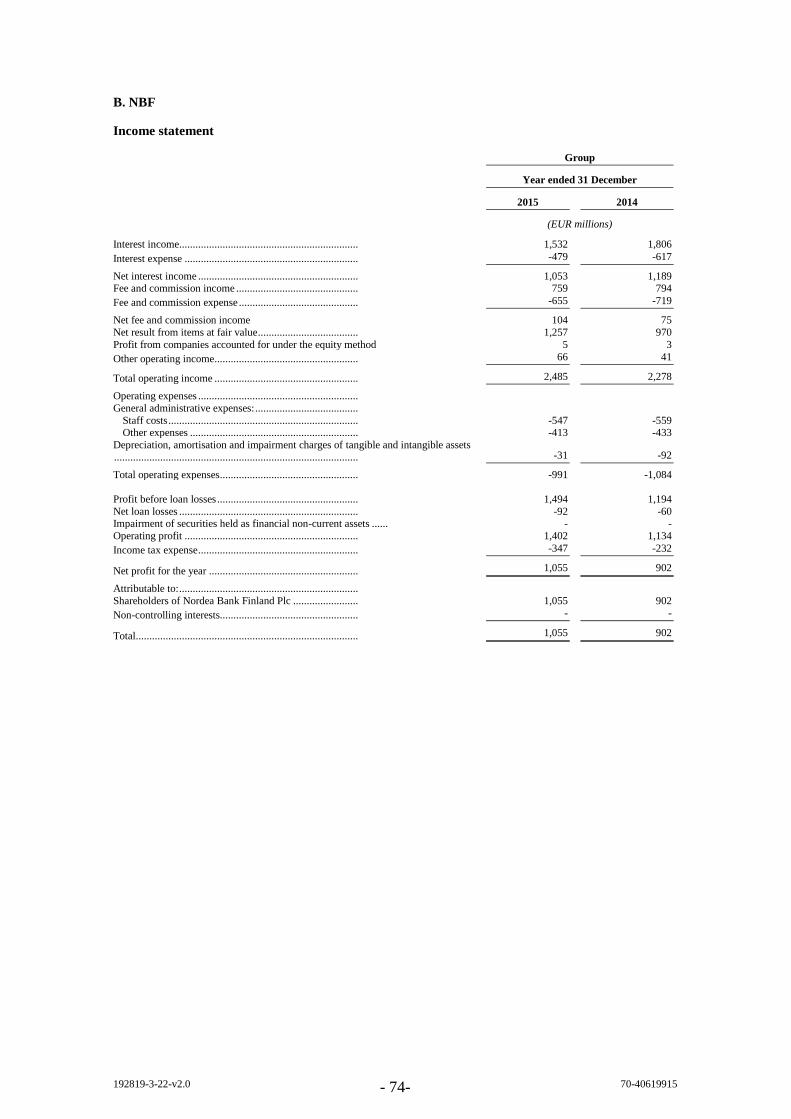
192819-3-22-v2.0 - 74- 70-40619915
B. NBF
Income statement
Group
Year ended 31 December
2015 2014
(EUR millions)
Interest income.................................................................. 1,532 1,806
Interest expense ................................................................ -479 -617
Net interest income ........................................................... 1,053 1,189 Fee and commission income ............................................. 759 794
Fee and commission expense ............................................ -655 -719
Net fee and commission income 104 75
Net result from items at fair value ..................................... 1,257 970
Profit from companies accounted for under the equity method 5 3
Other operating income ..................................................... 66 41
Total operating income ..................................................... 2,485 2,278
Operating expenses ...........................................................
General administrative expenses: ......................................
Staff costs ...................................................................... -547 -559 Other expenses .............................................................. -413 -433
Depreciation, amortisation and impairment charges of tangible and intangible assets
.......................................................................................... -31 -92
Total operating expenses ................................................... -991 -1,084
Profit before loan losses .................................................... 1,494 1,194
Net loan losses .................................................................. -92 -60 Impairment of securities held as financial non-current assets ...... - -
Operating profit ................................................................ 1,402 1,134
Income tax expense ........................................................... -347 -232
Net profit for the year ....................................................... 1,055 902
Attributable to: ..................................................................
Shareholders of Nordea Bank Finland Plc ........................ 1,055 902
Non-controlling interests................................................... - -
Total.................................................................................. 1,055 902

192819-3-22-v2.0 - 75- 70-40619915
Balance sheet
Group
31 December
2015 2014
(EUR millions)
Assets
Cash and balances with central banks ............................ 32,613 28,846
Loans to central banks ................................................... 5,328 300 Loans to credit institutions ............................................. 27,089 35,051
Loans to the public ......................................................... 101,447 113,748
Interest-bearing securities .............................................. 30,143 34,643 Financial instruments pledged as collateral .................... 4,627 11,058
Shares ............................................................................ 2,020 1,918
Derivatives ..................................................................... 80,557 105,254 Fair value changes of the hedged items in portfolio hedge of interest rate risk 51 76
Investments in group undertakings ................................ - -
Investments in associated undertakings.......................... 42 39 Intangible assets ............................................................. 44 47
Property and equipment ................................................. 76 84
Investment property ....................................................... 1 2 Deferred tax assets ......................................................... 14 43
Current tax assets ........................................................... 1 0
Retirement benefit assets ............................................... 90 25 Other assets .................................................................... 17,015 14,624
Prepaid expenses and accrued income ........................... 432 440
Total assets .................................................................... 301,590 346,198
Liabilities
Deposits by credit institutions ........................................ 78,162 87,368 Deposits and borrowings from the public ...................... 62,153 76,879
Debt securities in issue................................................... 43,407 48,472
Derivatives ..................................................................... 83,538 102,876 Fair value changes of the hedged items in portfolio hedge of interest rate risk 557 773
Current tax liabilities ..................................................... 77 41
Other liabilities .............................................................. 20,066 18,577 Accrued expenses and prepaid income .......................... 567 804
Deferred tax liabilities.................................................... 54 57
Provisions ...................................................................... 81 85
Retirement benefit obligations ....................................... 4 28
Subordinated liabilities .................................................. 628 620
Total liabilities ............................................................... 289,294 336,580
Equity
Non-controlling interests................................................ - - Share capital .................................................................. 2,319 2,319
Share premium reserve .................................................. 599 599
Other reserves ................................................................ 4,897 2,824
Retained earnings ........................................................... 4,481 3,876
Total equity .................................................................... 12,296 9,618
Total liabilities and equity.............................................. 301,590 346,198
Assets pledged as security for own liabilities ................. 40,932 43,426
Other assets pledged ...................................................... 4,811 5,017
Contingent liabilities ...................................................... 12,432 14,906 Credit commitments ....................................................... 13,613 16,021
Other commitments ........................................................ 359 769
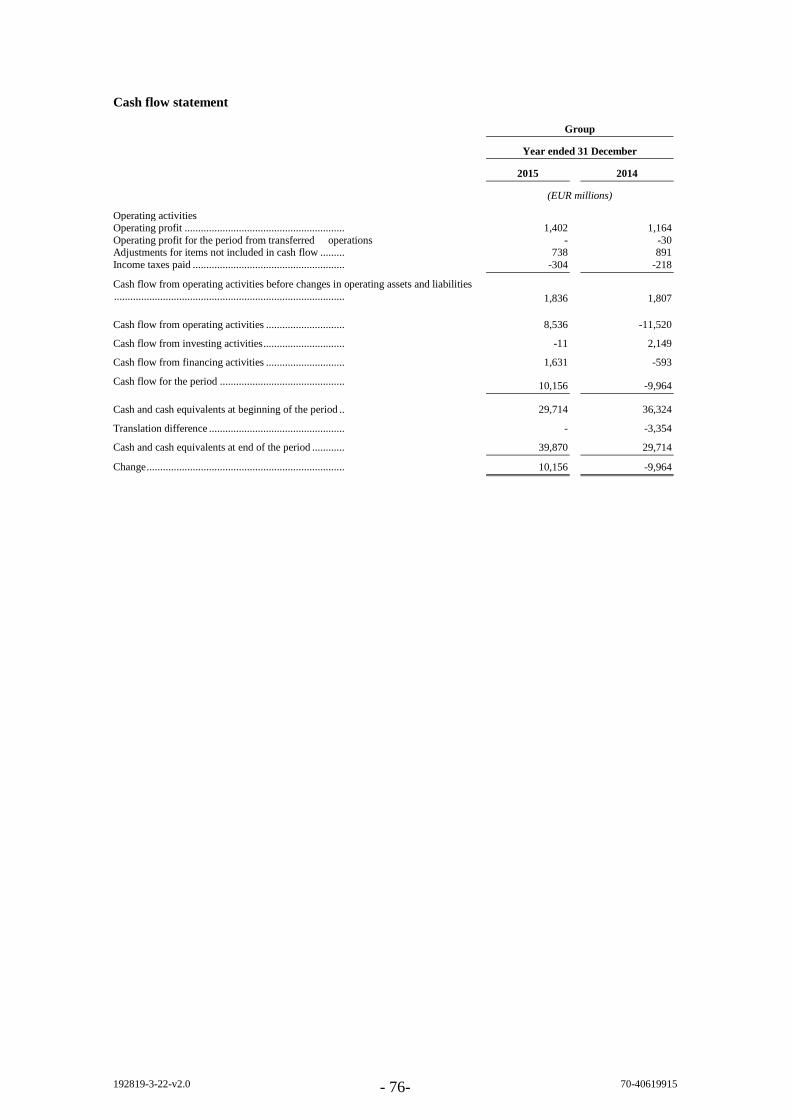
192819-3-22-v2.0 - 76- 70-40619915
Cash flow statement
Group
Year ended 31 December
2015 2014
(EUR millions)
Operating activities
Operating profit ........................................................... 1,402 1,164
Operating profit for the period from transferred operations - -30 Adjustments for items not included in cash flow ......... 738 891
Income taxes paid ........................................................ -304 -218
Cash flow from operating activities before changes in operating assets and liabilities
..................................................................................... 1,836 1,807
Cash flow from operating activities ............................. 8,536 -11,520
Cash flow from investing activities .............................. -11 2,149
Cash flow from financing activities ............................. 1,631 -593
Cash flow for the period .............................................. 10,156 -9,964
Cash and cash equivalents at beginning of the period .. 29,714 36,324
Translation difference .................................................. - -3,354
Cash and cash equivalents at end of the period ............ 39,870 29,714
Change ......................................................................... 10,156 -9,964

192819-3-22-v2.0 - 77- 70-40619915
UTVALD FINANSIELL INFORMATION
Den beskrivning av utvald finansiell information som återfinns nedan är en inofficiell översättning av
den engelska texten som återfinns omedelbart före detta avsnitt och investerare rekommenderas att
även läsa och ta till sig de engelska beskrivningarna då dessa kan avvika från den svenska
översättningen.
Nedanstående tabeller visar viss, utvald, finansiell information i sammandrag som, utan väsentliga
ändringar, hämtats från NBAB och NBF:s reviderade redovisningar för de år som slutar den 31 december
2014 och 2015, vilka återfinns som bilagor till detta Tilläggsprospekt och Grundprospektet.
NBAB och NBF:s konsoliderade redovisning upprättas i enlighet med International Financial Reporting
Standards (IFRS), med tillhörande tolkningar från International Financial Reporting Interpretations
Committee (IFRIC), godkända av EU-kommissionen. Vidare har vissa kompletterande regler i enlighet
med lag (1995:1559) om årsredovisning i kreditinstitut och värdepappersbolag (ÅRKL), rekommendation
RFR 1 "Kompletterande redovisningsregler för koncerner" och uttalanden från Rådet för finansiell
rapportering (UFR) samt Finansinspektionens föreskrifter (FFFS 2008:25 med ändringar i FFFS 2009:11
och 2011:54) tillämpats för framställningen av NBAB:s räkenskaper.
Nedanstående tabeller skall läsas tillsammans med revisionsberättelsen (i förhållande till NBAB:s och
NBF:s reviderade konsoliderade årsredovisningar för det år som slutar den 31 december 2014).
A. NBAB Group
Resultaträkning, Koncernen
Koncernen
Årsslut per den 31 december
2015 2014
(Miljoner EUR)
Ränteintäkter ......................................................................................................................................... 8 549 9 995 Räntekostnader ..................................................................................................................................... -3 439 -4 513
Räntenetto ............................................................................................................................................. 5 110 5 482
Avgifts- och provisionsintäkter ............................................................................................................. 4 035 3 799
Avgifts- och provisionskostnader.......................................................................................................... -1 010 -957
Avgifts- och provisionsnetto ................................................................................................................. 3 025 2 842
Nettoresultat av poster till verkligt värde .............................................................................................. 1 703 1 425
Andelar i intresseföretags resultat ......................................................................................................... 39 18 Övriga rörelseintäkter ........................................................................................................................... 263 474
Summa rörelseintäkter .......................................................................................................................... 10 140 10 241
Rörelsekostnader
Allmänna administrationskostnader:
Personalkostnader ................................................................................................................................. -3 263 -3 159 Övriga administrationskostnader........................................................................................................... -1 485 -1 656
Av- och nedskrivningar av materiella och immateriella tillgångar .................................................... -209 -585
Summa rörelsekostnader ....................................................................................................................... -4 957 -5 400 Resultat före kreditförluster .................................................................................................................. 5 183 4 841
Kreditförluster, netto ............................................................................................................................. -479 -534
Rörelseresultat ...................................................................................................................................... 4 704 4 307 Skatt ...................................................................................................................................................... -1 042 -950
Nettoresultat för perioden från kvarvarande verksamhet...................................... 3 662 3 357
Nettoresultat för perioden från avvecklad verksamhet, efter skatt ......................................................... - -25
Resultat för perioden ............................................................................................................................. 3 662 3 332
Hänförligt till:
Aktieägare i Nordea Bank AB (publ) .................................................................................................... 3 662 3 332
Minoritetsintressen................................................................................................................................ - -
Summa ............................................................................................................................................... 3 662 3 332

192819-3-22-v2.0 - 78- 70-40619915
Balansräkning, Koncernen
Koncernen
Årsslut per den 31 december
2015 2014
(Miljoner EUR)
Tillgångar Kassa och tillgodohavanden hos centralbanker .................................................................................. 35 500 31 067
Utlåning till centralbanker ................................................................................................................. 13 224 6 958
Utlåning till kreditinstitut ................................................................................................................... 10 959 12 217 Utlåning till allmänheten .................................................................................................................... 340 920 348 085
Räntebärande värdepapper ................................................................................................................. 88 176 87 110
Pantsatta finansiella instrument .......................................................................................................... 8 341 12 151 Aktier och andelar .............................................................................................................................. 40 745 39 749
Derivatinstrument .............................................................................................................................. 80 741 105 119
Förändringar av verkligt värde för räntesäkrade poster i säkringsportföljer ....................................... 151 256 Aktier och andelar i intresseföretag.................................................................................................... 515 487
Immateriella tillgångar ....................................................................................................................... 3 208 2 908
Materiella tillgångar ........................................................................................................................... 557 509 Förvaltningsfastigheter ...................................................................................................................... 3 165 3 227
Uppskjutna skattefordringar ............................................................................................................... 76 130
Skattefordringar ................................................................................................................................. 87 132 Pensionstillgångar .............................................................................................................................. 377 42
Övriga tillgångar ................................................................................................................................ 18 600 17 581
Förutbetalda kostnader och upplupna intäkter .................................................................................... 1 526 1 614
Tillgånga för försäljning ....................................................................................................................... - -
Summa tillgångar .................................................................................................................................. 646 868 669 342
Skulder Skulder till kreditinstitut .................................................................................................................... 44 209 56 322
In- och upplåning från allmänheten.................................................................................................... 193 342 197 254
Skulder till försäkringstagare ............................................................................................................. 55 491 51 843 Emitterade värdepapper ..................................................................................................................... 201 937 194 274
Derivatinstrument .............................................................................................................................. 79 505 97 340
Förändringar av verkligt värde för räntesäkrade poster i säkringsportföljer ....................................... 2 594 3 418 Skatteskulder ..................................................................................................................................... 225 368
Övriga skulder ................................................................................................................................... 25 756 26 973
Upplupna kostnader och förutbetalda intäkter .................................................................................... 1 805 1 943
Uppskjutna skatteskulder ................................................................................................................... 1 028 983
Avsättningar ....................................................................................................................................... 415 305
Pensionsförpliktelser .......................................................................................................................... 329 540 Efterställda skulder ............................................................................................................................ 9 200 7 942
Skulder för försäljning .......................................................................................................................... - -
Summa skulder ..................................................................................................................................... 615 836 639 505
Eget kapital
Minoritetsintressen............................................................................................................................. 1 2 Aktiekapital ....................................................................................................................................... 4 050 4 050
Överkursfond ..................................................................................................................................... 1 080 1 080
Övriga reserver .................................................................................................................................. -1 188 -1 201 Balanserade vinstmedel ..................................................................................................................... 27 089 25 906
Summa eget kapital ............................................................................................................................ 31 032 29 837
Summa skulder och eget kapital............................................................................................................ 646 868 669 342
För egna skulder ställda säkerheter .................................................................................................... 184 795 163 041
Övriga ställda säkerheter .................................................................................................................... 9 038 11 265
Ansvarsförbindelser ........................................................................................................................... 22 569 22 017 Kreditåtaganden ................................................................................................................................. 71 340 74 291
Övriga åtaganden ............................................................................................................................... 3 323 1 644

192819-3-22-v2.0 - 79- 70-40619915
Kassaflödesanalys, Koncernen
Koncernen
Årsslut per den 31 december
2015 2014
(Miljoner EUR)
Den löpande verksamheten
Rörelseresultat ...................................................................................................................................... 4 704 4 307 Resultat från perioden från avvecklad verksamhet efter skatt ............................................................... - -25
Justering för poster som inte ingår i kassaflödet ................................................................................... 2 824 8 140
Betalda inkomstskatter .......................................................................................................... -1 056 -966
Kassaflöde från den löpande verksamheten före förändring av den löpande
verksamhetens tillgångar och skulder ............................................................................ 6 472 11 456 Kassaflöde från den löpande verksamheten .......................................................................................... 196 -10 824
Kassaflöde från investeringsverksamheten ........................................................................................... -522 3 254
Kassaflöde från finansieringsverksamheten .......................................................................................... -1 746 -1 040 Periodens kassaflöde ............................................................................................................................. -2 072 -8 610
Likvida medel vid periodens början ...................................................................................................... 39 683 45 670 Omräkningsdifferens ............................................................................................................................ 2 589 2 623
Likvida medel vid periodens slut .......................................................................................................... 40 200 39 683
Förändring ......................................................................................................................................... -2 072 -8 610

192819-3-22-v2.0 - 80- 70-40619915
B. NBF
Resultaträkning, Koncernen
Koncernen
År som slutade 31 december
2015 2014
(EUR miljoner)
Rörelseintäkter
Ränteintäkter ................................................................................................................................... 1 532 1 806
Räntekostnader ............................................................................................................................... -479 -617
Räntenetto ..................................................................................................................................... 1 053 1 189
Avgifts- och provisionsintäkter ....................................................................................................... 759 794
Avgifts- och provisionskostnader.................................................................................................... -655 -719
Avgifts- och provisionsnetto ......................................................................................................... 104 75
Nettoresultat av poster till verkligt värde ........................................................................................ 1 257 970
Andelar i intresseföretags resultat ................................................................................................... 5 3
Övriga rörelseintäkter ..................................................................................................................... 66 41
Summa rörelseintäkter ................................................................................................................. 2 485 2 278
Rörelsekostnader
Allmänna administrationskostnader:
Personalkostnader ........................................................................................................................... -547 -559
Övriga administrationskostnader..................................................................................................... -413 -433 Av- och nedskrivningar av materiella och
immateriella tillgångar .................................................................................................................... -31 -92
Summa rörelsekostnader .............................................................................................................. -991 -1 084
Resultat före kreditförluster ........................................................................................................ 1 494 1 194
Kreditförluster, netto ....................................................................................................................... -92 -60
Nedskrivning av värdepapper som innehas som finansiella anläggningstillgångar ......................... - -
Rörelseresultat .............................................................................................................................. 1 402 1 134
Skatt ................................................................................................................................................ 347 -232
Resultat för perioden .................................................................................................................... 1 055 902
Hänförligt till:
Aktieägare i Nordea Bank AB (publ) .............................................................................................. 1 055 902
Minoritetsintressen.......................................................................................................................... - -
Summa 1 055 902
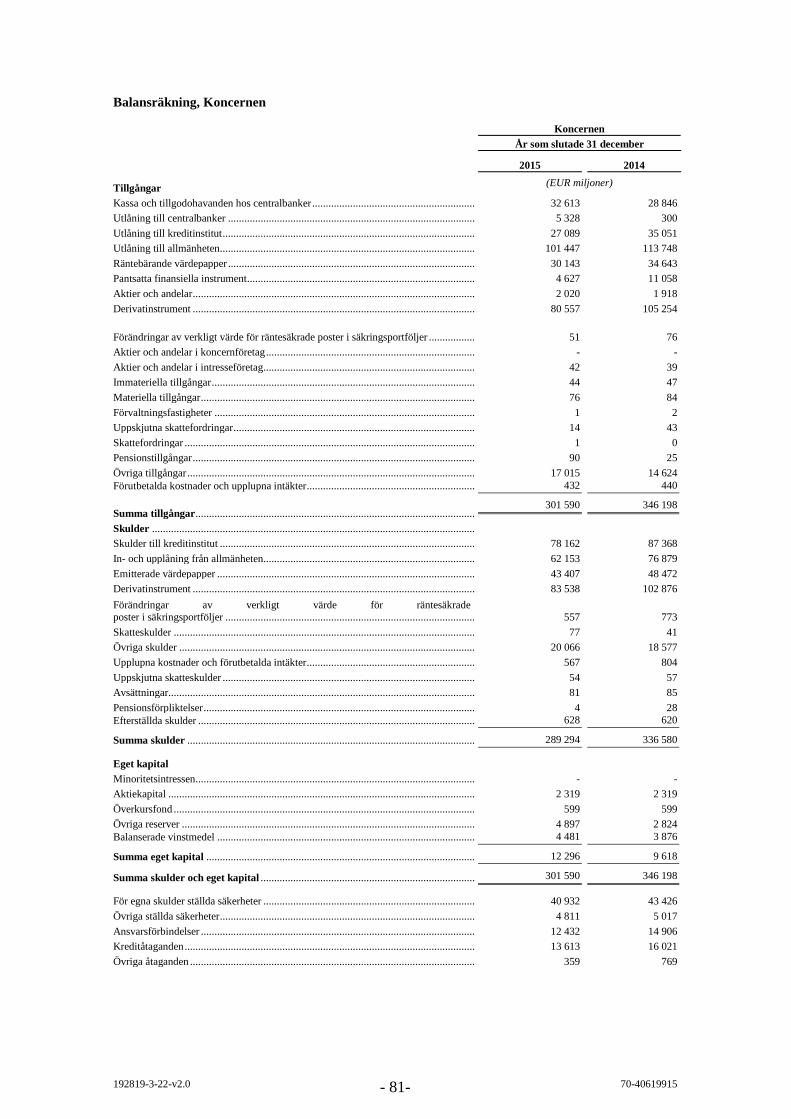
192819-3-22-v2.0 - 81- 70-40619915
Balansräkning, Koncernen
Koncernen
År som slutade 31 december
2015 2014
Tillgångar (EUR miljoner)
Kassa och tillgodohavanden hos centralbanker .................................................................................. 32 613 28 846
Utlåning till centralbanker ................................................................................................................. 5 328 300
Utlåning till kreditinstitut ................................................................................................................... 27 089 35 051
Utlåning till allmänheten .................................................................................................................... 101 447 113 748
Räntebärande värdepapper ................................................................................................................. 30 143 34 643
Pantsatta finansiella instrument .......................................................................................................... 4 627 11 058
Aktier och andelar .............................................................................................................................. 2 020 1 918
Derivatinstrument .............................................................................................................................. 80 557 105 254
Förändringar av verkligt värde för räntesäkrade poster i säkringsportföljer .................................... 51 76
Aktier och andelar i koncernföretag ................................................................................................ - -
Aktier och andelar i intresseföretag.................................................................................................... 42 39
Immateriella tillgångar ....................................................................................................................... 44 47
Materiella tillgångar ........................................................................................................................... 76 84
Förvaltningsfastigheter ...................................................................................................................... 1 2
Uppskjutna skattefordringar ............................................................................................................... 14 43
Skattefordringar ................................................................................................................................. 1 0
Pensionstillgångar .............................................................................................................................. 90 25
Övriga tillgångar ................................................................................................................................ 17 015 14 624
Förutbetalda kostnader och upplupna intäkter .................................................................................... 432 440
Summa tillgångar .......................................................................................................................... 301 590 346 198
Skulder ..........................................................................................................................................
Skulder till kreditinstitut .................................................................................................................... 78 162 87 368
In- och upplåning från allmänheten.................................................................................................... 62 153 76 879
Emitterade värdepapper ..................................................................................................................... 43 407 48 472
Derivatinstrument .............................................................................................................................. 83 538 102 876
Förändringar av verkligt värde för räntesäkrade poster i säkringsportföljer .................................................................................................................. 557 773
Skatteskulder ..................................................................................................................................... 77 41
Övriga skulder ................................................................................................................................... 20 066 18 577
Upplupna kostnader och förutbetalda intäkter .................................................................................... 567 804
Uppskjutna skatteskulder ................................................................................................................... 54 57
Avsättningar ....................................................................................................................................... 81 85
Pensionsförpliktelser .......................................................................................................................... 4 28
Efterställda skulder ............................................................................................................................ 628 620
Summa skulder ................................................................................................................................ 289 294 336 580
Eget kapital
Minoritetsintressen............................................................................................................................. - -
Aktiekapital ....................................................................................................................................... 2 319 2 319
Överkursfond ..................................................................................................................................... 599 599
Övriga reserver .................................................................................................................................. 4 897 2 824
Balanserade vinstmedel ..................................................................................................................... 4 481 3 876
Summa eget kapital ......................................................................................................................... 12 296 9 618
Summa skulder och eget kapital ..................................................................................................... 301 590 346 198
För egna skulder ställda säkerheter .................................................................................................... 40 932 43 426
Övriga ställda säkerheter .................................................................................................................... 4 811 5 017
Ansvarsförbindelser ........................................................................................................................... 12 432 14 906
Kreditåtaganden ................................................................................................................................. 13 613 16 021
Övriga åtaganden ............................................................................................................................... 359 769

192819-3-22-v2.0 - 82- 70-40619915
Kassaflödesanalys, Koncernen
Koncernen
År som slutade 31 december
................................................................................................................................. 2015 2014
Löpande verksamheten ................................................................................................................ (EUR miljoner)
Rörelseresultat ................................................................................................................................ 1 402 1 164
Justering för poster som inte ingår i kassaflödet ............................................................................. - -30
Betalda inkomstskatter .................................................................................................................... 738 891
Kassaflöde från den löpande verksamheten före förändring
av den löpande verksamhetens tillgångar och skulder ............................................................... 1 836 1 807
Kassaflöde från den löpande verksamheten ............................................................................... 8 536 -11 520
Kassaflöde från investeringsverksamheten ................................................................................. -11 2 149
Kassaflöde från finansieringsverksamheten .................................................................................. 1 631 -593
Periodens kassaflöde ........................................................................................................................ 10 156 -9 964
Likvida medel vid periodens början ................................................................................................... 29 714 36 324
Omräkningsdifferens ......................................................................................................................... - -3 354
Likvida medel vid periodens slut ....................................................................................................... 39 870 29 714
Förändring ....................................................................................................................................... 10 156 -9 964
Koncernen
År som slutade
31 december
Sex månader som
slutar 30 juni
................................................................................................................................. 2014 2013 2015 2014
Löpande verksamheten ................................................................................................................ (EUR miljoner)
Rörelseresultat ................................................................................................................................ 1 073 1 079 854 619
Justering för poster som inte ingår i kassaflödet ............................................................................. 61 34 - 13
Betalda inkomstskatter .................................................................................................................... 891 658 1 270 722
Kassaflöde från den löpande verksamheten före förändring
av den löpande verksamhetens tillgångar och skulder ............................................................... -218 -282 -158 -137
Ändring i verksamhetens tillgångar och skulder 1 807 1 489 1 966 1 217
Kassaflöde från den löpande verksamheten ............................................................................... -11 520 5 686 14 274 -10 857
2 149 85 -18 1 603
Investeringsverksamhet -593 -615 -306 -767
Förvärv och avyttring av verksamheter -9 964 5 156 13 950 -10 021
Egendom och utrustning 36 324 32 859 29 714 36 324
Immateriella tillgångar -3 354 1 691 -1,910 -312
Nettoinvesteringar i värdepapper (innehav till förfallodag) 29 714 36 324 45 574 26 615
Andra finansiella anläggningstillgångar -9 964 5 156 13 950 -10 021
Kassaflöde från investeringsverksamheten ................................................................................. 1 073 1 079 854 619
Finansieringsaktiviteter 61 34 - 13
Utgivna/amorterade efterställda skulder 891 658 1 270 722
Genomförda utdelningar -218 -282 -158 -137
Andra förändringar 1 807 1 489 1 966 1 217
Kassaflöde från finansieringsverksamheten .................................................................................. -11 520 5 686 14 274 -10 857
Periodens kassaflöde ........................................................................................................................ 2 149 85 -18 1 603
-593 -615 -306 -767
-9 964 5 156 13 950 -10 021
36 324 32 859 29 714 36 324
Likvida medel vid periodens början ................................................................................................... -3 354 1 691 -1 910 -312
Omräkningsdifferens ......................................................................................................................... 29 714 36 324 45 574 26 615
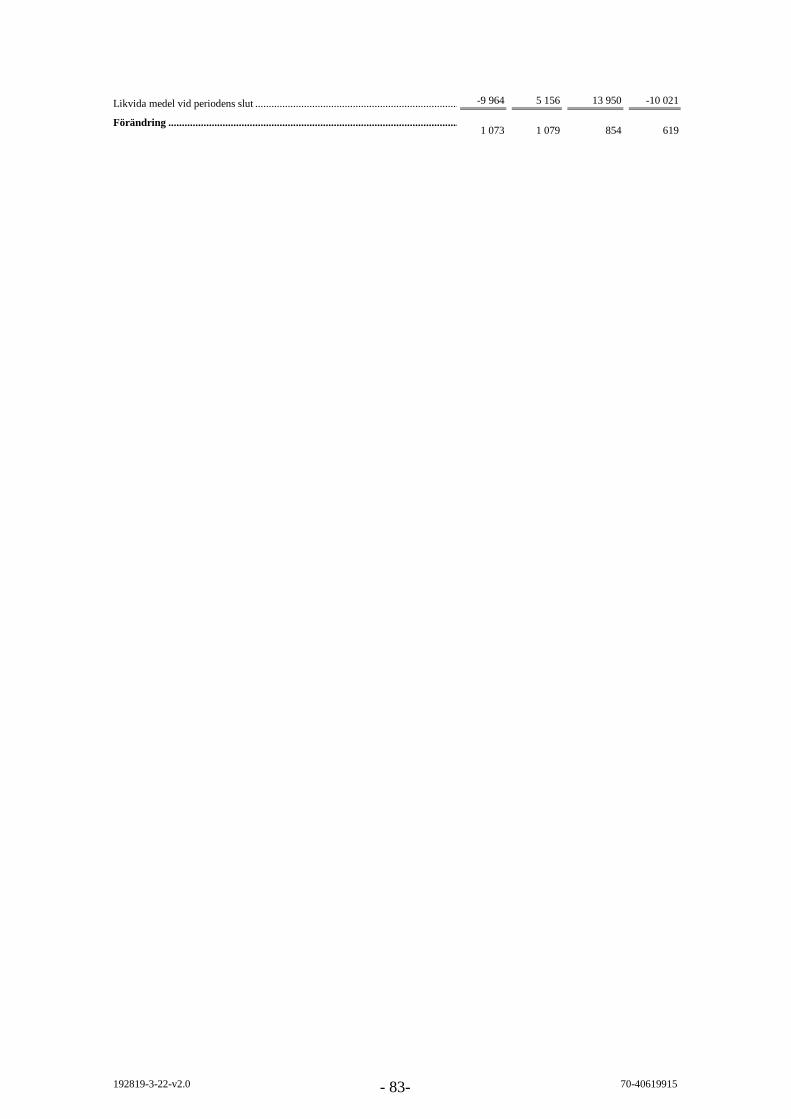
192819-3-22-v2.0 - 83- 70-40619915
Likvida medel vid periodens slut ....................................................................................................... -9 964 5 156 13 950 -10 021
Förändring ....................................................................................................................................... 1 073 1 079 854 619