improving the signal-to-noise ratio of single-pixel ... · single-pixel imaging using digital...
TRANSCRIPT

Improving the signal-to-noise ratio ofsingle-pixel imaging using digital
microscanning
Ming-Jie Sun,1,2,∗ Matthew P. Edgar,2 and David B. Phillips,2Graham M. Gibson,2 and Miles J. Padgett2,3
1Department of Opto-Electronic Engineering, Beihang University, Beijing, 100191, China2SUPA, School of Physics and Astronomy, University of Glasgow, Glasgow, G12 8QQ, UK
[email protected]∗[email protected]
Abstract: Single-pixel cameras provide a means to perform imaging atwavelengths where pixelated detector arrays are expensive or limited. Theimage is reconstructed from measurements of the correlation between thescene and a series of masks. Although there has been much research in thefield in recent years, the fact that the signal-to-noise ratio (SNR) scalespoorly with increasing resolution has been one of the main limitationsprohibiting the uptake of such systems. Microscanning is a technique thatprovides a final higher resolution image by combining multiple imagesof a lower resolution. Each of these low resolution images is subject toa sub-pixel sized lateral displacement. In this work we apply a digitalmicroscanning approach to an infrared single-pixel camera. Our approachrequires no additional hardware, but is achieved simply by using a modifiedset of masks. Compared to the conventional Hadamard based single-pixelimaging scheme, our proposed framework improves the SNR of recon-structed images by ∼ 50 % for the same acquisition time. In addition, thisstrategy also provides access to a stream of low-resolution ‘preview’ imagesthroughout each high-resolution acquisition.
© 2016 Optical Society of America
OCIS codes: (110.1758) Computational imaging; (110.3010) Image reconstruction tech-niques.
References and links1. K. Nasrollahi, and T. B. Moeslund, “Super-resolution: a comprehensive survey,” Mach. Vision Appl. 25, 1423–
1468 (2014).2. P. Milanfar, Super-Resolution Imaging (CRC, 2010), Ch. 1, pp. 2-4.3. R. C. Hardie, K. J. Barnard, and R. Ordonez, “Fast super-resolution with affine motion using an adaptive wiener
filter and its application to airborne imaging,” Opt. Express 19, 26208–26231 (2011).4. R. C. Hardie, and K. J. Barnard, “Fast super-resolution using an adaptive wiener filter with robustness to local
motion,” Opt. Express 20, 21053–21073 (2012).5. M. Sun, and K. Yu, “A sur-pixel scan method for super-resolution reconstruction,” Optik 124, 6905–6909 (2013).6. G. Carles, J. Downing, and A. R. Harvey, “Super-resolution imaging using a camera array,” Opt. Lett. 39,
1889–1892 (2014).7. P. Sen, B. Chen, G. Garg, S. R. Marschner, M. Horowitz, M. Levoy, and H. Lensch, “Dual photography,” ACM
Transactions on Graphics (TOG), 24, 745–755 (2005).8. M. F. Duarte, M. A. Davenport, D. Takhar, J. N. Laska, T. Sun, K. Kelly, and B. G. Baraniuk, “Single-pixel
imaging via compressive sampling,” IEEE Signal Process. Mag. 25, 83–91 (2008).
#260309 Received 2 Mar 2016; revised 7 Apr 2016; accepted 18 Apr 2016; published 4 May 2016 © 2016 OSA 16 May 2016 | Vol. 24, No. 10 | DOI:10.1364/OE.24.010476 | OPTICS EXPRESS 10476
9. J. H. Shapiro, “Computational ghost imaging,” Phys. Rev. A 78, 061802 (2008).10. A. C. Sankaranarayanan, C. Studer, and R. G. Baraniuk, “Cs-muvi: Video compressive sensing for spatial-
multiplexing cameras,” in Proceedings of IEEE International Conference on Computational Photography (IEEE2012), pp. 1–10 .
11. N. Radwell, K. J. Mitchell, G. M. Gibson, M. P. Edgar, R. W. Bowman, and M. J. Padgett, “Single-pixel infraredand visible microscope,” Optica 1, 285–289 (2014).
12. M. P. Edgar, G. M. Gibson, R. W. Bowman, B. Sun, N. Radwell, K. J. Mitchell, S. S. Welsh, and M. J. Padgett,“Simultaneous real-time visible and infrared video with single-pixel detectors,” Sci. Rep. 5, 10669 (2015).
13. F. Ferri, D. Magatii,, L. A. Lugiato, and A. Gatti, “Differential ghost imaging,” Phys. Rev. A 104, 253603 (2010).14. B. Sun, S. S. Welsh, M. P. Edgar, J. H. Shapiro, and M. J. Padgett, “Normalized ghost imaging,” Opt. Express
20, 16892–16901 (2012).15. K.-H. Luo, B.-Q. Huang, W.-M. Zheng, and L.-A. Wu, “Nonlocal imaging by conditional averaging of random
reference measurements,” Chin. Phys. Lett. 29, 074216 (2012).16. B. Sun, M. P. Edgar, R. W. Bowman, L. E. Vittert, S. S. Welsh, A. Bowman, and M. J. Padgett, “Differential
computational ghost imaging,” in Computational Optical Sensing and Imaging Conference (Optical Society ofAmerica, 2013), paper CTu1C–4.
17. M.-J. Sun, M.-F. Li, and L.-A. Wu, “Nonlocal imaging of a reflective object using positive and negative correla-tions,” Appl. Opt. 54, 7494–7499 (2015).
18. S.-C. Song, M.-J. Sun, and L.-A. Wu, “Improving the signal-to-noise ratio of thermal ghost imaging based onpositive-negative intensity correlation,” Opt. Commun. 366, 8–12 (2016).
19. D. Shi, J. Huang, F. Wang, K. Cao, K. Yuan, S. Hu, and Y. Wang, “Enhancing resolution of single-pixel imagingsystem,” Opt. Rev. 22, 802–808 (2015).
20. B. Sun, M. P. Edgar, R. W. Bowman, L. E. Vittert, S. S. Welsh, A. Bowman, and M. J. Padgett, “3D computationalimaging with single-pixel detectors,” Science 340, 844–847 (2013).
21. Z. Zhang, X. Ma, and J. Zhong, “Single-pixel imaging by means of fourier spectrum acquisition,” Nat. Comm.6, 6225(2015).
22. E. J. Candes, “Compressive sampling,” in Proceedings of the International Congress of Mathematicians (Inter-national Mathematical Union, 2006) 3, pp. 1433–1452.
23. D. L. Donoho, “Compressed sensing,” IEEE T. Inform. Theory 52, 1289–1306 (2006).24. W. K. Pratt, J. Kane, and H. C. Andrews, “Hadamard transform image coding,” in Proceedings of the IEEE
(IEEE, 1969) 57, pp. 58–68.25. N. J. Sloane, and M. Harwit, “Masks for Hadamard transform optics, and weighing designs,” Appl. Opt. 15,
107–114 (1976).26. L. Streeter, G. R. Burling-Claridge, M. J. Cree, and R. Knnemeyer, “Optical full Hadamard matrix multiplexing
and noise effects,” Appl. Opt. 48, 2078–2085 (2009).27. W. Wallace, L. H. Schaefer, and J. R. Swedlow, “A working person’s guide to deconvolution in light microscopy,”
Biotechniques 31, 1076–1097 (2001).28. N. Dey. L. Blanc-Feraud, C. Zimmer, P. Roux, Z. Kam, J. C. Olivo-Marin, and J. Zerubia, “Richardson–lucy
algorithm with total variation regularization for 3d confocal microscope deconvolution,” Microsc. Res. Tech. 69,260–266 (2006).
29. R. N. Bryan, Introduction to the Science of Medical Imaging (Cambridge University, 2009), Chap. 3, pp. 85–88.30. B. Redding, M. A. Choma, and H. Cao, “Speckle-free laser imaging using random laser illumination,” Nat.
Photonics 6, 355–359 (2012).
1. Introduction
Conventional digital cameras use a lens system to form an image of a scene onto a detectorarray. The spatial resolution of the recorded image can be limited either by the point spreadfunction of the optical system, or by the pitch of the pixels in the detector array. If the resolutionis limited by the pixel pitch, the most common method to improve this is to increase the numberof pixels per unit area by reducing their physical size. However, apart from the technologicalchallenges associated with this approach, smaller pixels detect less light, which degrades imagequality [1]. An alternative approach to increase the pixel resolution is microscanning [2–6].In this approach, multiple images of the same scene are recorded, and the pixelated detectoris displaced by sub-pixel sized translations between each images. Data from these images isthen combined to reconstruct a composite image with a spatial resolution exceeding that of thedetector array.
While there has been a global drive to increase the number of pixels in camera sensors,
#260309 Received 2 Mar 2016; revised 7 Apr 2016; accepted 18 Apr 2016; published 4 May 2016 © 2016 OSA 16 May 2016 | Vol. 24, No. 10 | DOI:10.1364/OE.24.010476 | OPTICS EXPRESS 10477

there has also been significant developments in camera technology that records images usingjust a single-pixel detector [7–9]. These techniques require a means for sampling the spatialdistribution of scene intensity, which can be achieved using a series of masks. The single-pixeldetector is then used to measure the correlation between the scene and each mask. Knowledgeof the transmitted intensities and the corresponding masks enables reconstruction of the image.Two of the earliest examples of single-pixel imaging were the flying-spot camera patented byPaul Nipkow in 1884 and the ‘Televisor’ (television) pioneered by John Logie Baird in 1926,both of which provided a method for encoding and transmitting image information using arotating Nipkow disk.
At visible wavelengths, the advent of pixelated detector arrays such as charge-coupled device(CCD), which offered better signal-to-noise performance, superseded single-pixel techniques.However, at spectral regions where detector arrays are prohibitively expensive or unavailable,single-pixel imaging still has applications. In particular, the advent of MicroElectroMechanicalSystems (MEMS) devices, which have been made affordable due to huge consumer demand,provides a digital means for spatial light modulation and perhaps most importantly, doing so athigh-speed. In addition to reconstructing individual image frames [7, 8], single pixel camerashave also been demonstrated at near video-rates by employing efficient image reconstructionalgorithms [10–12].
Within the single-pixel camera approach, it is the spatial resolution of the masking patternsthat is equivalent to the pixel resolution. The number of masks required to reconstruct a fullysampled image increases with the square of the resolution (i.e. in proportion to the total numberof pixels in the reconstructed image). However, in single-pixel imaging systems there is also afurther restriction: the signal-to-noise ratio (SNR) of the reconstructed image decreases as theresolution is increased. There are two main sources of noise: fluctuations in the ambient illumi-nation level between different mask pattern displays (illumination noise) and noise associatedwith the photodiode measurement itself (detector noise). In addition there are also sources ofnoise correlated with some aspects of the system, such as stray light rejected by the digital mi-cromirror device (DMD) bouncing around the camera housing back into the photodiode. Theratio of illumination to detector noise is dependent upon the light level. At low light levels thedetector noise tends to dominate, whilst at higher light levels, the illumination noise tends todominate. However, both illumination and detector noise scale in the same way with increasedresolution, and so the SNR is inversely proportional to the square root of the number of imagepixels, regardless of illumination level. This trade-off between the image resolution and its SNRis a key drawback limiting applications of single-pixel camera technology. To improve SNR,schemes such as differential ghost imaging [13–18], have been developed to reduce the noisewithout jeopardizing resolution.
In this work, we show that it is possible to further enhance the pixel resolution of asingle-pixel camera, while maintaining its SNR, by adopting a digital microscanning approach.We obtain multiple low-resolution images, each laterally shifted by sub-pixel steps. Theseimages are then co-registered on a higher resolution grid to give a single high-resolutionimage. We demonstrate that by sampling with the same number of masks, and thereforein the same acquisition time, this methodology results in a reduced noise level in the finalhigh-resolution reconstructed image for only a slight reduction in resolution. In addition,our method simultaneously delivers a sequence of low-resolution ‘preview’ images duringthe high-resolution image acquisition. We note that the concept of digital microscanning inthe context of single-pixel imaging was recently considered theoretically in [19]. Our digitalmicroscanning technique is applicable to all single-pixel imaging systems, both those based onprojected light fields and those based on image masking, the latter of which is demonstratedhere. More importantly, digital microscanning in the single-pixel camera context requires no
#260309 Received 2 Mar 2016; revised 7 Apr 2016; accepted 18 Apr 2016; published 4 May 2016 © 2016 OSA 16 May 2016 | Vol. 24, No. 10 | DOI:10.1364/OE.24.010476 | OPTICS EXPRESS 10478

extra hardware and only a trivial increment in algorithm complexity. Therefore, our method canbe deployed as a complement to existing single-pixel camera schemes [8, 9, 20, 21], includingthose utilising compressive sensing [8, 22, 23].
DMD
Heat lamp
Camera lens
Collection lens
PhotodiodeADC
Computer
Object
Mirror
Fig. 1. Experimental set-up. A heat reflector lamp illuminates the object, which is a100mm×100mm grey-scale target located at a distance of ∼ 0.5 m from the imaging sys-tem. A 50 mm camera lens collects the reflected near-infrared light and images the objectonto a high-speed digital micro-mirror device (DMD). The DMD is placed at the imageplane and applies rapidly changing binary masks to the transmitted image. An InGaAs de-tector measures the total intensity transmitted through the masks. An analogue-to-digitalconverter (ADC), triggered by the synchronisation TTL signals from the DMD, acquiresand transfers the light intensities data to a computer for image reconstruction.
2. Experimental setup
Figure 1 illustrates our infrared single-pixel camera set-up, which is a modified and compactedversion of the system in our previous work [12]. We test our system by imaging a grey-scalepicture, which is located ∼ 0.5 m from the single-pixel camera and illuminated with a heat re-flector lamp (Philips PAR38 IR 175C, wavelength: 400nm−1200nm). The camera lens (NikonAF Nikkor, f/1.8D) images the scene onto a high-speed DMD (Texas Instruments Discovery4100, 1024× 768, wavelength: 350nm− 2500nm, operating at 22kHz) which is used to se-quentially mask the image of the scene with a preloaded sequence of binary masks. The totalintensity of light transmitted through each mask is detected by a InGaAs detector (ThorlabsPDA20CS InGaAs, 800 nm to 1800 nm, 0 dB-70 dB gain). A high dynamic range analogue-to-digital converter (ADC, National Instruments DAQ USB-6221 BNC, sampling at 250kSs−1),synchronised with the DMD, acquires and transfers the intensity data to a computer for im-age reconstruction. A photograph of our integrated single-pixel camera prototype is shown inFig. 1.
As in our previous work, we make use of Hadamard matrices to form our DMD maskingpatterns [24,25]. This is a convenient basis, as the rows (or columns) of the Hadamard matrices
#260309 Received 2 Mar 2016; revised 7 Apr 2016; accepted 18 Apr 2016; published 4 May 2016 © 2016 OSA 16 May 2016 | Vol. 24, No. 10 | DOI:10.1364/OE.24.010476 | OPTICS EXPRESS 10479

form a complete orthogonal set, enabling efficient sampling of the image at a well definedresolution using a given set of patterns [10, 12]. We note that in all images shown in this work,the end-to-end framework is limited by Gaussian sensor noise, and thus Hadamard mask setswere the optimal basis (chosen over pixel scanning, for example) [26]. The elements of theHadamard matrices take values of ‘1’ or ‘-1’, and each row is reformatted into a 2D grid anddisplayed as a 2D binary mask on the DMD, where ‘1’ and ‘-1’ denote micromirrors states ‘On’and ‘Off’ respectively. Therefore, the intensity signal Sp associated with a particular maskingpattern Mp is given by:
Sp = ∑i
∑j(Mp,i j ·Di j), (1)
where i and j index the x and y coordinates of the binary mask respectively, and D is the intensitydistribution on the image plane that we wish to reconstruct, also discretized by the mask pixels.After performing n independent DMD measurements, the image I can be reconstructed as
I =n
∑p=1
(Mp ·Sp). (2)
In order to reduce sources of noise such as fluctuations in ambient light levels, we obtain differ-ential signals by displaying each Hadamard mask immediately followed by its inverse (wherethe micromirror status ‘On’ and ‘Off’ are reversed), and taking the difference in the meas-ured intensities [13, 14, 16]. This scheme also ensures that each difference measurement is lin-early independent from the others, and so the image is critically sampled (the same number ofmeasurements as pixels), and Eq. (2) is equivalent to a linear sum of orthogonal measurements.
In our experiments, we utilise the square central region of our DMD, which consistsof 768× 768 micromirrors. The DMD micromirrors are grouped together to display thereformatted Hadamard masks. For example, if displaying an 8× 8 pixel Hadamard mask,each Hadamard pixel comprises of 96× 96 adjacent micromirrors. In order to apply digitalmicroscanning to single-pixel imaging, it is the position of the Hadamard masks on the DMDthat must be laterally displaced by sub-Hadamard-pixel sized translations. In our results,we compare two different microscanning approaches, based on the percentage of activemicromirrors used within each pixel, which are detailed below. We contrast both of thesedigital microscanning methods with the standard technique of increasing the image resolutionby simply increasing the resolution of the Hadamard mask set, which we refer to here as‘normal’ high-resolution (NHR) imaging.
3. Results
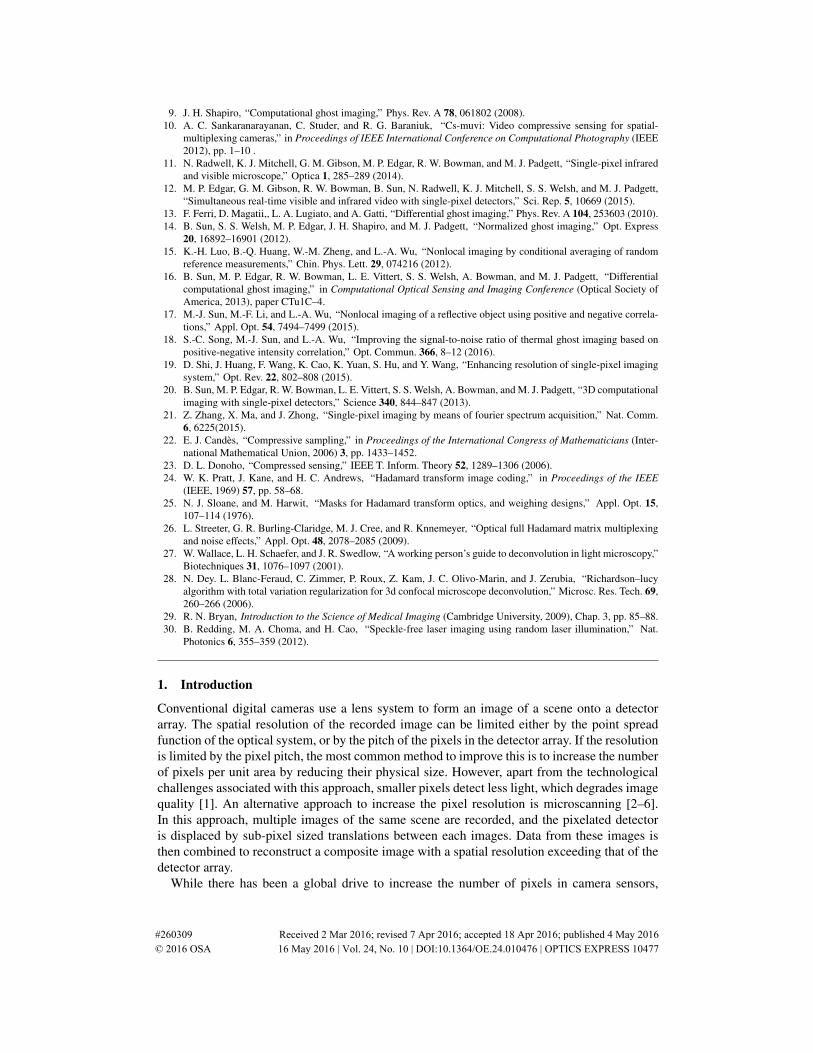
The complete microscanning (CM) method uses lower resolution masks which utilise allof micromirrors within each Hadamard pixel. Figure 2 illustrates the reconstruction of a 16×16 pixel image from four 8× 8 pixel images of the equivalent field-of-view. A set of 8× 8pixel Hadamard masks (each pixel comprising of 96×96 DMD micromirrors, except along theedges of the shifted images as shown in Fig. 2(b). In these cases the edge pixels are 96× 48micromirrors for x shifted patterns, 48× 96 micromirrors for y shifted patterns, and 48× 48micromirrors for the bottom right pixel of the patterns shifted in both x and y) is displayed fourtimes, with a lateral shift in x and/or y of half a pixel width (i.e. 48 DMD micromirrors) appliedbetween each set (Fig. 2(b)). This operation yields four 8×8 pixel images (Fig. 2(c)), using thesame number of masks as required to obtain a 16× 16 pixel NHR image. Each of these 8× 8pixel images contains different spatial information. A 16×16 pixel image is then reconstructedby co-registering each 8×8 pixel image in its laterally shifted location on a 16×16 grid, and
#260309 Received 2 Mar 2016; revised 7 Apr 2016; accepted 18 Apr 2016; published 4 May 2016 © 2016 OSA 16 May 2016 | Vol. 24, No. 10 | DOI:10.1364/OE.24.010476 | OPTICS EXPRESS 10480
....
....
....
....
....
....
....
....
....
....
....
....
....
....
....
....
....
....
....
....
....
....
....
....
16x16 HR image8x8 LR images8x8 Hadamard masksSub-pixel shift
None
Object
a b c d
x
y
x and y
Fig. 2. The complete microscanning method. (a) Binary object to be imaged. (b) A setof low-resolution (LR) Hadamard masks is displayed four times, with a lateral shift in xand/or y of half a pixel width applied between each mask set. (c) This operation yields fourlow-resolution ‘preview’ images, each of which contains different spatial information. (d)This allows a high-resolution (HR) image to be reconstructed by co-registering each imagein its laterally shifted location on a higher resolution grid.
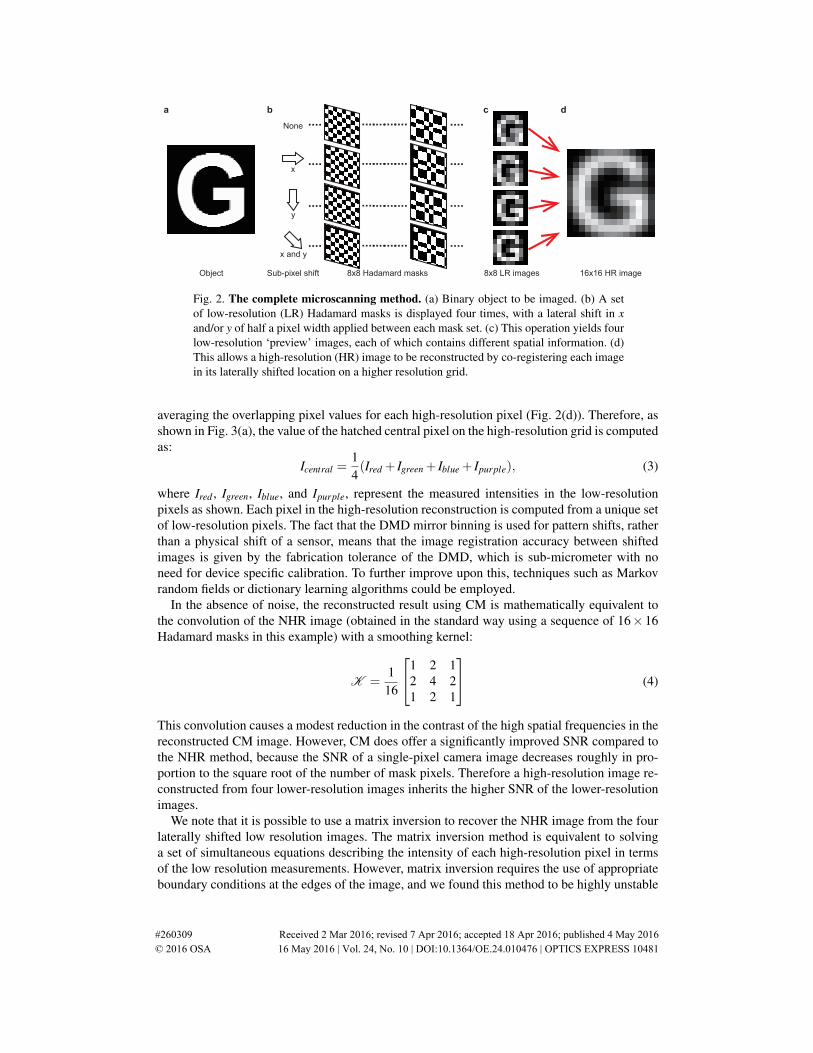
averaging the overlapping pixel values for each high-resolution pixel (Fig. 2(d)). Therefore, asshown in Fig. 3(a), the value of the hatched central pixel on the high-resolution grid is computedas:
Icentral =14(Ired + Igreen + Iblue + Ipurple), (3)
where Ired , Igreen, Iblue, and Ipurple, represent the measured intensities in the low-resolutionpixels as shown. Each pixel in the high-resolution reconstruction is computed from a unique setof low-resolution pixels. The fact that the DMD mirror binning is used for pattern shifts, ratherthan a physical shift of a sensor, means that the image registration accuracy between shiftedimages is given by the fabrication tolerance of the DMD, which is sub-micrometer with noneed for device specific calibration. To further improve upon this, techniques such as Markovrandom fields or dictionary learning algorithms could be employed.
In the absence of noise, the reconstructed result using CM is mathematically equivalent tothe convolution of the NHR image (obtained in the standard way using a sequence of 16× 16Hadamard masks in this example) with a smoothing kernel:
K =1
16
1 2 12 4 21 2 1
(4)
This convolution causes a modest reduction in the contrast of the high spatial frequencies in thereconstructed CM image. However, CM does offer a significantly improved SNR compared tothe NHR method, because the SNR of a single-pixel camera image decreases roughly in pro-portion to the square root of the number of mask pixels. Therefore a high-resolution image re-constructed from four lower-resolution images inherits the higher SNR of the lower-resolutionimages.
We note that it is possible to use a matrix inversion to recover the NHR image from the fourlaterally shifted low resolution images. The matrix inversion method is equivalent to solvinga set of simultaneous equations describing the intensity of each high-resolution pixel in termsof the low resolution measurements. However, matrix inversion requires the use of appropriateboundary conditions at the edges of the image, and we found this method to be highly unstable
#260309 Received 2 Mar 2016; revised 7 Apr 2016; accepted 18 Apr 2016; published 4 May 2016 © 2016 OSA 16 May 2016 | Vol. 24, No. 10 | DOI:10.1364/OE.24.010476 | OPTICS EXPRESS 10481
with respect to small levels of noise in the measurements. Deconvolution algorithms such asWeiner deconvolution [27, 28] could also be used to restore the high resolution image from theCM image.
None
co-registration inHR image gridSub-pixel shiftSub-pixel shift
a bNone
Location of one LR pixelin HR image grid
co-registration inHR image grid
Location of one LR pixelin HR image grid
x
y
x and y
x
y
x and y
Fig. 3. Schematics of two microscanning strategies. (a) Complete microscanning. (b)Quarter microscanning.
The quarter microscanning (QM) method again allows reconstruction of a higher res-olution image from four half-pixel laterally shifted images. However, in this case each lowerresolution image is recorded with only one quarter of the micromirrors active within each pixel,as shown in Fig. 3(b). The four quadrants of the pixel are sequentially utilised, and each quad-rant corresponds to a half-pixel shift in x and/or y. This ensures that each low-resolution imagesamples a non-overlapping region of the scene. Therefore, the four low-resolution images ob-tained using QM can simply be co-registered accordingly on a high-resolution image grid, withno need for averaging. Consequently, the resolution of the QM image is identical to that ofthe NHR image in the absence of noise. As with CM, QM also delivers low-resolution imageswithin each high-resolution image acquisition. However, as only a quarter of the micromirrorswithin each pixel are active during the acquisition, QM suffers from a reduced SNR comparedto CM and NHR.
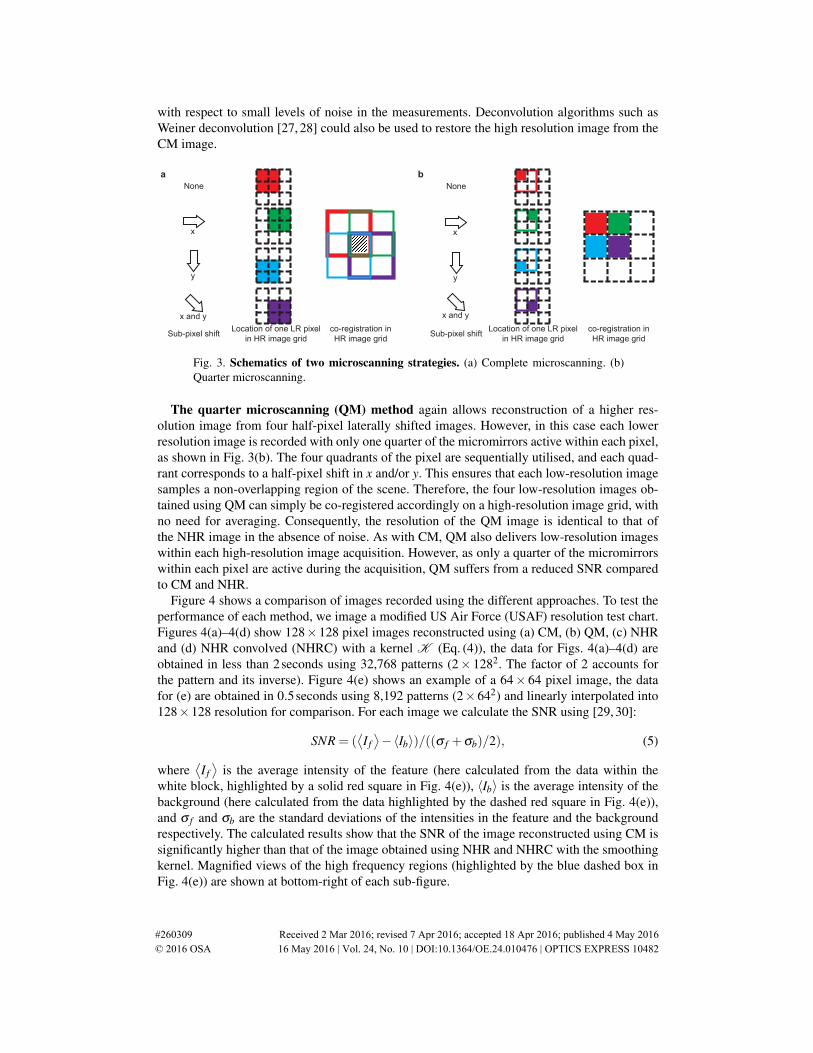
Figure 4 shows a comparison of images recorded using the different approaches. To test theperformance of each method, we image a modified US Air Force (USAF) resolution test chart.Figures 4(a)–4(d) show 128×128 pixel images reconstructed using (a) CM, (b) QM, (c) NHRand (d) NHR convolved (NHRC) with a kernel K (Eq. (4)), the data for Figs. 4(a)–4(d) areobtained in less than 2seconds using 32,768 patterns (2× 1282. The factor of 2 accounts forthe pattern and its inverse). Figure 4(e) shows an example of a 64× 64 pixel image, the datafor (e) are obtained in 0.5seconds using 8,192 patterns (2×642) and linearly interpolated into128×128 resolution for comparison. For each image we calculate the SNR using [29, 30]:
SNR = (⟨I f⟩−〈Ib〉)/((σ f +σb)/2), (5)
where⟨I f⟩
is the average intensity of the feature (here calculated from the data within thewhite block, highlighted by a solid red square in Fig. 4(e)), 〈Ib〉 is the average intensity of thebackground (here calculated from the data highlighted by the dashed red square in Fig. 4(e)),and σ f and σb are the standard deviations of the intensities in the feature and the backgroundrespectively. The calculated results show that the SNR of the image reconstructed using CM issignificantly higher than that of the image obtained using NHR and NHRC with the smoothingkernel. Magnified views of the high frequency regions (highlighted by the blue dashed box inFig. 4(e)) are shown at bottom-right of each sub-figure.
#260309 Received 2 Mar 2016; revised 7 Apr 2016; accepted 18 Apr 2016; published 4 May 2016 © 2016 OSA 16 May 2016 | Vol. 24, No. 10 | DOI:10.1364/OE.24.010476 | OPTICS EXPRESS 10482
CMSNR=118.54
QMSNR=39.05
ILRSNR=111.49
NHRSNR=73.57
a b c d
Pixel5 10 15 20
Gre
ysca
le
25
50
75
00
100
Pixel10 20 30 40
Gre
ysca
le
60
120
180
00
240e
NHRCSNR=97.87
gf
CM QM NHR ILRNHRC
Fig. 4. Experimental images of a modified USAF resolution test chart. Images recon-structed using (a) complete microscanning (CM), (b) quarter microscanning (QM), (c) nor-mal high-resolution (NHR) method, (d) NHR method convolved (NHRC) with kernel K ,and (e) low-resolution (LR) method. In (e) a 64×64 pixel image has been interpolated uptoa 128×128 pixel image for comparison. The data for (a)-(d) are obtained in 2 seconds, (e)is obtained in 0.5 seconds. The experimentally measured SNR and magnified view of highfrequency feature is quoted beneath each image. (f) Greyscale distribution highlighted bythe solid blue line. (f) Greyscale distribution highlighted by the dashed blue line.
CM QM ILRa b c d
NHR
SNR 94.94 92.8343.18 68.27
NHRC
82.58
e
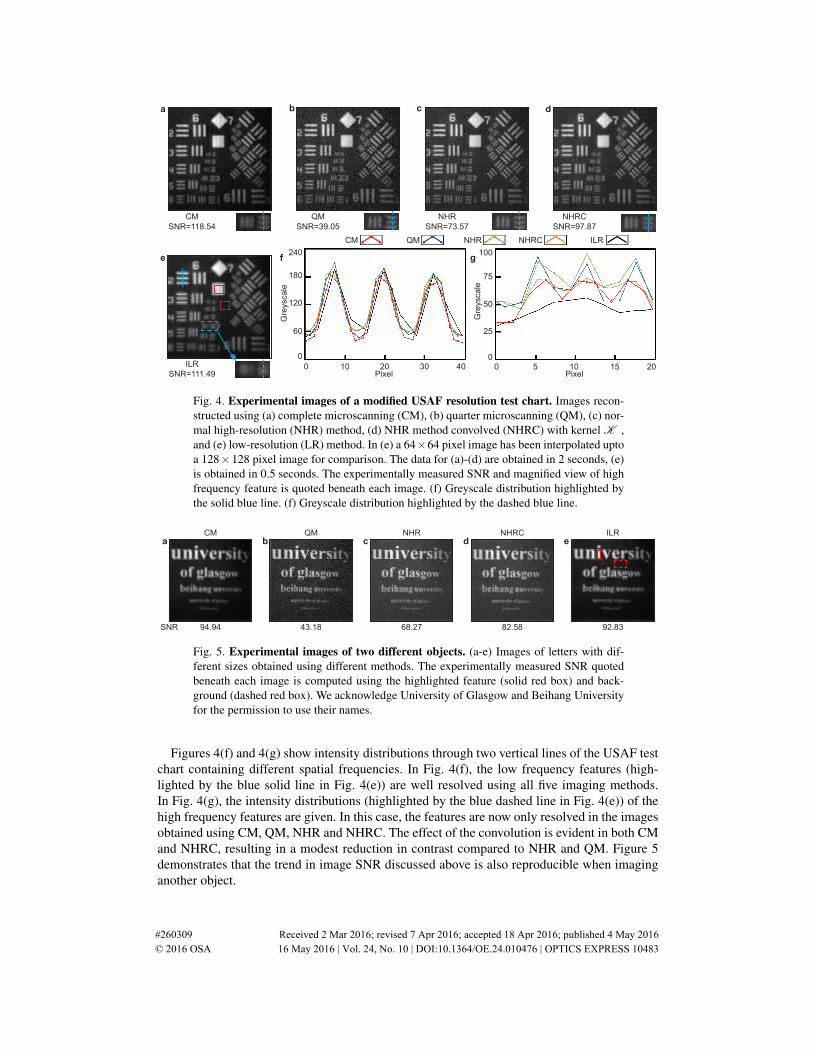
Fig. 5. Experimental images of two different objects. (a-e) Images of letters with dif-ferent sizes obtained using different methods. The experimentally measured SNR quotedbeneath each image is computed using the highlighted feature (solid red box) and back-ground (dashed red box). We acknowledge University of Glasgow and Beihang Universityfor the permission to use their names.
Figures 4(f) and 4(g) show intensity distributions through two vertical lines of the USAF testchart containing different spatial frequencies. In Fig. 4(f), the low frequency features (high-lighted by the blue solid line in Fig. 4(e)) are well resolved using all five imaging methods.In Fig. 4(g), the intensity distributions (highlighted by the blue dashed line in Fig. 4(e)) of thehigh frequency features are given. In this case, the features are now only resolved in the imagesobtained using CM, QM, NHR and NHRC. The effect of the convolution is evident in both CMand NHRC, resulting in a modest reduction in contrast compared to NHR and QM. Figure 5demonstrates that the trend in image SNR discussed above is also reproducible when imaginganother object.
#260309 Received 2 Mar 2016; revised 7 Apr 2016; accepted 18 Apr 2016; published 4 May 2016 © 2016 OSA 16 May 2016 | Vol. 24, No. 10 | DOI:10.1364/OE.24.010476 | OPTICS EXPRESS 10483

6.42
a
b
c
4.27
NHR
9.17d
e
f
5.14
NHRC
SNR
SNR
36.63
26.32
CM
Fig. 6. Comparison of images obtained in a high noise situation. (a-b) Images obtainedusing NHR. (c-d) Images shown in (a-b) are NHR convolved (NHRC) with kernel K . (e-f) Images obtained under identical conditions using CM. The measured SNR (using thesame features and background as before) is quoted beneath each image, demonstrating thesuperior performance of CM in this situation. We acknowledge University of Glasgow andBeihang University for the permission to use its name as experimental subjects.
In low light levels, the advantage of improved SNR using CM becomes more significant.For example, in Figs. 6(a)–6(b) the noise is so severe when using the NHR method that partsof the image are unidentifiable. However, under identical illumination conditions, CM enablesa dramatic improvement in image quality, as shown in Figs. 6(e)–6(f). As discussed above, inthe absence of noise CM is mathematically equivalent to NHR convolved with the smoothingkernel K . However even when the NHR images are themselves smoothed with kernel K , theSNRs of the resulting images (Figs. 6(c)–6(d)) are still far lower than the images obtained usingCM.
39.05
a b
43.18 76.83 92.75QM with 40dB
SNR SNRQM with 50dB
Fig. 7. Comparison of images obtained using QM with different gains. (a) 40 dB gain.(d) 50 dB gain. Experimentally measured SNR (using the same features and background asbefore) is quoted beneath each image. We acknowledge University of Glasgow and BeihangUniversity for the permission to use its name as experimental subjects.
#260309 Received 2 Mar 2016; revised 7 Apr 2016; accepted 18 Apr 2016; published 4 May 2016 © 2016 OSA 16 May 2016 | Vol. 24, No. 10 | DOI:10.1364/OE.24.010476 | OPTICS EXPRESS 10484
While CM offers advantages at low light levels, the QM may find more use operating inhigh light conditions. For example, in our experiments the photodiode gain is set in order tomaximise the dynamic range of the ADC. As the QM method reduces the amount of lightarriving at the photodiode, the gain can be increased to improve the QM image quality. Thisis demonstrated in Fig. 7 where Fig. 7(a) shows images obtained using QM with a 40 dB gain(equivalent to the gains used in all images shown in Figs. 4 and 5), while Figs. 7(b) showsthe improvement in SNR when using a gain of 50 dB with the QM method. However, thesame improvement cannot be achieved in NHR and CM, because increasing the detector gainsaturates the photodiode outputs, resulting in inaccurate meansurements and distorted imagereconstructions.
4. Discussion
We have demonstrated two image reconstruction strategies based on a digital microscanningapproach applied to an infrared single-pixel camera. Both of these strategies deliver a sequenceof low-resolution ‘preview’ images throughout the high-resolution image acquisition. For ex-ample we obtain 128× 128 pixel images at a rate of ∼0.5 Hz. During the high-resolution ac-quisition our method delivers 64×64 pixel ‘preview’ images at a rate of ∼2 Hz. Compared toconventional sampling, the complete microscanning strategy improves the SNR of images, atthe expense of a modest reduction in the contrast of high spatial frequencies. The quarter mi-croscanning strategy suffers from reduced SNR, which under certain situations can be improvedby optimising the photodiode gain. These techniques are applicable to all single-pixel imagingsystems, both those based on structured illumination and those based on masked detection. Im-portantly, our approach requires no additional hardware and can be utilised as a complementto existing single-pixel imaging schemes, such as compressive sensing. Our work demonstratesan additional degree of flexibility in the trade-off between SNR and spatial resolution in single-pixel imaging techniques, which can be optimized as the case demands.
Acknowledgments
MS and DBP thank Dr. Jonathan Taylor for helpful discussion. MS acknowledges the supportfrom National Natural Science Foundation of China (Grant No. 61307021) and China Scholar-ship Council (Grant No. 201306025016). DBP is grateful for support from the Royal Academyof Engineering. MJP acknowledges financial support from the Wolfson foundation, EPSRCQuantIC (EP/M01326X/1) and the Royal Society. MS and MJP conceived the concept of theexperiment. MS, MPE and GMG conducted the experiments. MS, DBP and MJP designedthe reconstruction algorithm and analysed the results. All authors contributed to writing themanuscript. The authors declare no competing financial interests.
#260309 Received 2 Mar 2016; revised 7 Apr 2016; accepted 18 Apr 2016; published 4 May 2016 © 2016 OSA 16 May 2016 | Vol. 24, No. 10 | DOI:10.1364/OE.24.010476 | OPTICS EXPRESS 10485