validation of iasi nh3 columns at the single-pixel scale
TRANSCRIPT
Validation of IASI NH3 columns at the single-pixel scale
from airborne- and ground-based measurements
Mark A. Zondlo1
Lieven Clarisse,2 Martin Van Damme,2 Simon Whitburn,2 Cathy Clerbaux,2,3 and
Pierre-François Coheur2
1 - Dept. of Civil and Environmental Engineering, Ctr. for Mid-IR Technologies for Health and the Environment, Princeton University
2 – Chimie Quantique et Photophysique, Université Libre de Bruxelles
3 - Laboratoire Atmosphères, Milieux, Observations Spatiales (LATMOS) / IPSL, CNRS
Field data: Armin Wisthaler (P3-B NH3, Innsbruck)
John Nowak (C-130 NH3, Aerodyne)
Da Pan, Kang Sun, Lei Tao, Levi Golston, Lars Wendt (mobile NH3, Princeton)
Cody Fleishcer (mobile NH3, Aerodyne)
Rainer Volkamer (mobile FTIR NH3, Univ. Colorado)
Anne Thompson, Bill Brune (sondes, Penn State)
Steve Brown (BAO tall tower, NOAA CSD)
Jennifer Murphy (NH3 BAO tower, Univ. Toronto)
Erik Olson (sondes, Univ. Wisc.)
NASA DISCOVER-AQ, NSF FRAPPE science teams
Funding
NASA NNX-NNX14AT36G
NSF EEC-0540832
O3MSAF Visiting Scientist

Why NH3?
• human health: key precursor for PM2.5
• ecological: nitrogen deposition, eutrophication
• chemistry: aerosol nucleation, growth, composition
• climate: ammoniated aerosols cool locally
Challenges
• NH3 incredibly difficult to measure
- low mole fractions (~ pptv-ppbv)
- large dynamic range
- adsorption to inlets/instruments
- gas/aerosol phase partitioning
Limited datasets in which to validate recent advances in satellite NH3
Molecular composition (assuming MOM = 100
g/mol)
Ammonium (42%)
Sulfate (26%) Nitrate (3%)
Organics (30%)
Houston, USA

satellite NH3 validation advances
IASI:
in-situ: m=0.18, r=0.82, ±1 hour in [NH3] (Van Damme et al., AMT, 2015)
FTIR NDAAC: m=0.74, r=0.7 at 90 min., 25 km (Dammers et al., ACPD, 2016)
NASA TES:
15% with in-situ @ select pixels but at high NH3 (mid 1016 molec NH3 cm-2)
(Sun et al., JGR-A, 2015)
NOAA CrIS:
simulated profiles, qualitative agreement
at pixel (Shephard & Cady-Pereira, AMT, 2015)
NASA AIRS:
qualitative comparisons with aircraft (Warner, ACPD, 2015)
Validation limited to spatial/monthly averaging, chemical transport
model simulations, or in regions of very high-concentrations
To what extent do NH3 columns intercompare with in-situ at pixel scales?
… at moderate mole fractions?
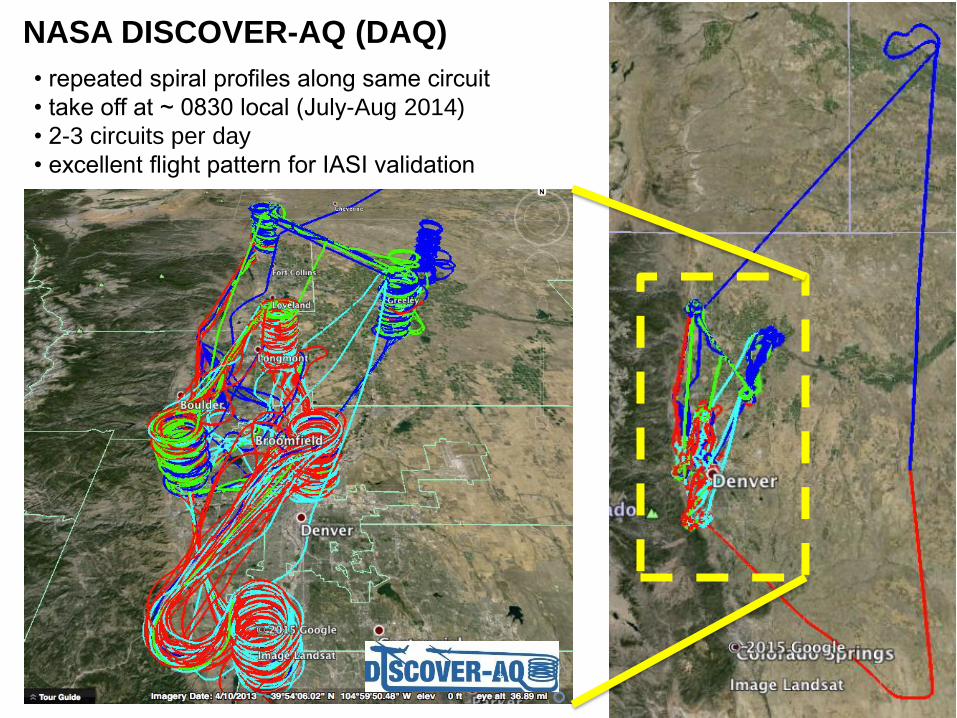
NASA DISCOVER-AQ (DAQ)
• repeated spiral profiles along same circuit
• take off at ~ 0830 local (July-Aug 2014)
• 2-3 circuits per day
• excellent flight pattern for IASI validation

NSF FRAPPE • focus on (largely) horizontal gradients and temporal evolution of the gradients
• takeoff ~ 0900 local
• constant altitude legs (some vertical profiles)

Additional in-situ NH3 measurements
NH3 measurements during DISCOVER-AQ/FRAPPE in Colorado:
platform avg. uncertainty method PI
P3-B 30% PTRMS A. Wisthaler (Innsbruck)
C-130 34% + 0.39 ppbv TDL J. Nowak (Aerodyne)
Aerodyne mob. 34% + 0.39 ppbv TDL C. Floerchinger (Aerodyne)
Princeton mob. 20% + 0.4 ppbv Open-path M. Zondlo (Princeton)
CU column 10% FTIR R. Volkamer (CU)
NOAA/CSD 20% + 0.3 ppbv Picarro A. Neuman (NOAA CSD)
NOAA/BAO 20% + 0.3 ppbv Picarro J. Murphy (Univ. Toronto)
/ S. Brown (NOAA CSD)
aircraft
mobile
labs

IASI MetOp/A NH3 during DAQ/FRAPPE Time: 7/14/14-8/18/14
Spatial: 38-42ºN to 101-109.5ºW
IASI Neural Network (Whitburn et al., JGR-A, 2016)
N=11,760 IASI NH3 measurements (AM only)
N=6,371 filtered IASI NH3
(cloud < 25%, sand < 50%, Tskin > 265.15 K; error<200%)
N=64 (±60 min, ±15 km with in-situ profiles)
100 km
all IASI NH3, all P-3B aircraft
5
4
3
2
1
0
NH
3 mole
c c
m-2

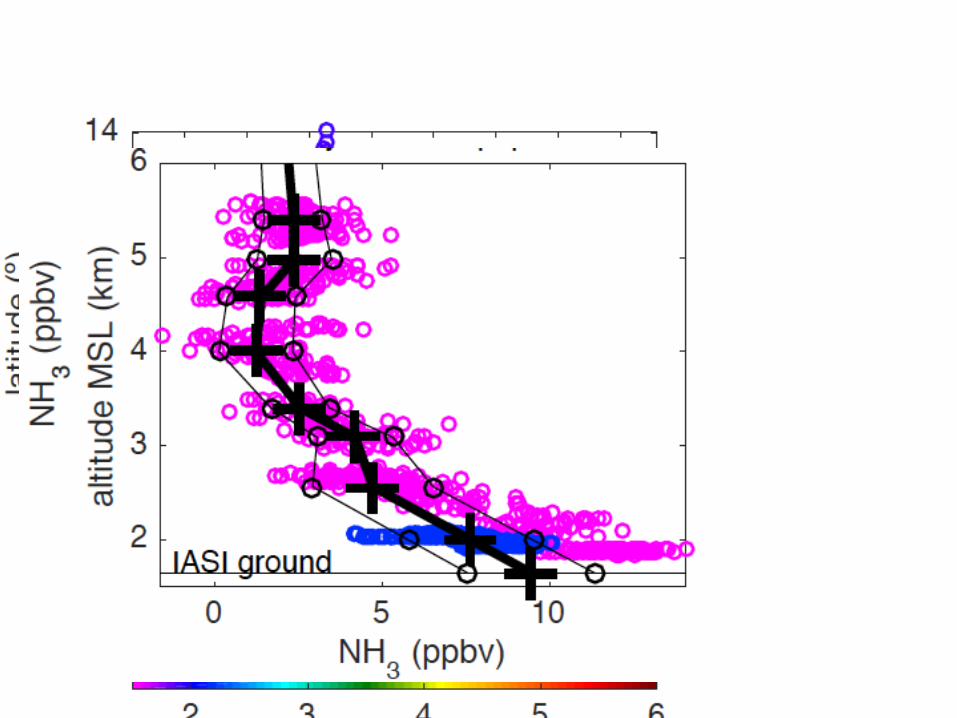
in-situ-derived column comparison method
• identify all in-situ data within space / time window of ±15 km, 60 min.
(consistent with 4 m s-1 mean wind speed in boundary layer)
• data binned within ±100 m of ground and at 500 m bins above
• NH3 molecular density derived from nearly sonde
• trapezoidal integration of column
• “profile”: in-situ data < 500 m of ground and at least >1.5 km altitude
• profile uncertainties derived from in-situ measurement uncertainties
15:16:43 sonde
red=P-3B purple = C-130
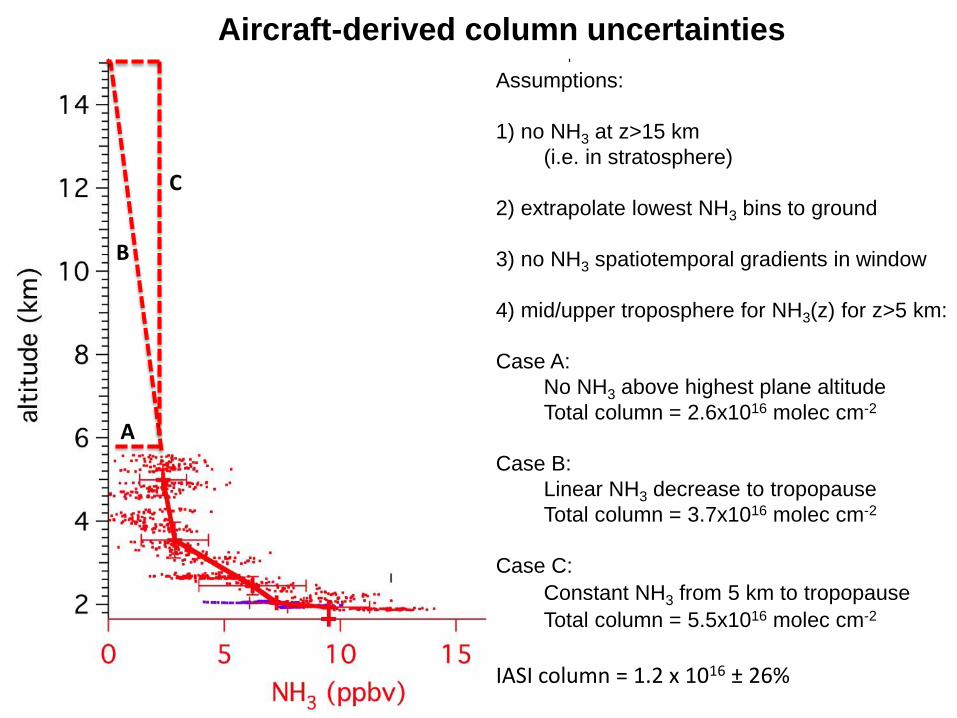
Aircraft-derived column uncertainties
Assumptions:
1) no NH3 at z>15 km
(i.e. in stratosphere)
2) extrapolate lowest NH3 bins to ground
3) no NH3 spatiotemporal gradients in window
4) mid/upper troposphere for NH3(z) for z>5 km:
Case A:
No NH3 above highest plane altitude
Total column = 2.6x10¹⁶ molec cm-2
Case B:
Linear NH3 decrease to tropopause
Total column = 3.7x10¹⁶ molec cm-2
Case C:
Constant NH3 from 5 km to tropopause
Total column = 5.5x10¹⁶ molec cm-2
IASI column = 1.2 x 10¹⁶ ± 26%
A
B
C

r=15 km
C-130 NH3 P-3B NH3
Moderate column case study

All DAQ-CO data ±1 hr, ±15 km of IASI centroid (N=64)
orthogonal regression slope=0.53±0.10 intercept=3(±2)x1015
r=0.54
previous example

NH3 concentration decreases significanyly from NW SE
Most of the profile is taken much further west and slightly north of IASI centroid
Lower NH3 air to the E/S may help to explain lower IASI column than aircraft
IASI centroid
Revisit spatial gradient assumption
Restrict to 2.0±0.1 km altitude range where large # data available
N/S transect nearly 50 min. after IASI
NE-SW transect ~ 20 min. after IASI

Revisit NH3 in-situ sampling issues
• NH3 is very “sticky” to instrument surfaces, degrades accuracy
• inlet problems create poorly-constrained (highly variable) uncertainties
Aircraft comparison Mobile lab intercomparison
open-path (Princeton) closed-path (Picarro, NOAA CSD)
closed-path PTRMS (Innsbruk) closed-path (Aerodyne TDL)
PTRMS responds faster upon spiraling from the
polluted boundary layer to the clean, free
troposphere but is more imprecise overall than TDL
Open-path shows rapid changes while Picarro
lags behind due to outgassing
NH3 (ppbv)
distance (km)
In the presence of strong
spatiotemporal gradients, need
to be careful with the in-situ data

Sensitivity to space (∆s) and time (∆t) windows
± ∆ s (km)
5 15 45
20 8 28 31
60 18 64 101
180 31 229 344
• At 45 km spatial window, correlation degrades significantly at all time windows
Time window is less sensitive but emissions are strongly temp.-dependent:
± ∆
t (
min
.)
± ∆ s (km)
5 15 45
20 0.75 0.63 0.19
60 0.59 0.54 0.14
180 0.60 0.53 0.27
N correlation (r)
± ∆
t (
min
.)
diurnal NH3 fluxes at CO feedlot feedlot ∆NH3/∆CH4 diurnal cycle
Sun et al., AFM, 2015
courtesy A. Neuman

Summary / implications • individual IASI NH3 columns agree well with in-situ-derived columns (m=0.60 ± 0.10, r ~0.60, b=1x10¹⁵), especially given the strong gradients
• first validations at low/moderate NH3 abundances (1015 - 1016 molec cm-2)
(one order of magnitude lower than previously shown)
• IASI NH3 can be used with confidence to capture
spatial gradients on daily timescales and at
moderate column abundances for DAQ-CO
Future validation needs
• uncertainties of free tropospheric NH3 are
significant at low column abundances
• in-situ measurement hystereses and biases
problematic for columns
• sensitivity to variations in thermal contrast (ocean, night)


r=15 km
C-130 NH3 P-3B NH3

Validation at low columns; in-situ likely suffering from sampling biases
Low column (low 1015) example

±15km, ±20 min

Case study of July 28, 2014
Extensive set of aircraft/ground measurements:
N=261 IASI; N=149 (filtered); N=8 for ±1 hour, ±15 km of aircraft data
(comparable scales of ∆s, ∆t with wind of 4 m s-1)
(colors here represent ~ altitude (dk. blue = ground; red=5 km)

CU FTIR = 1.01 x 10¹⁶ mean but shows large variability on 30 km transect
Intrapixel variability:
Field experiments
NASA DISCOVER-AQ (Colorado): Deriving Information on Surface Conditions from
Column and Vertically Resolved Observations Relevant to Air Quality
• focus on vertical profiles, satellite validation, air quality modeling
• July 17 - Aug. 12, 2014
• P3-B and B200 aircraft, mobile labs, tower, ground sites, soundings
(16 P3-B flight days)
NSF FRAPPE: Front Range Air Pollution and Photochemistry Experiment
• focus on photochemistry, spatiotemporal gradients
• July 26 – Aug. 18, 2014
• separate but coordinated study on NSF C-130, mobile labs, tower
(15 C-130 flight days)

Sensitivity to space (∆s) and time (∆t) windows
± ∆ s (km)
5 15 45
20 0.62 0.74 0.04
60 0.16 0.53 0.14
180 0.66 0.99 0.14
• At 45 km spatial window, correlation degrades significantly at all time windows
Time window is less sensitive but one must be careful:
± ∆
t (
min
.)
± ∆ s (km)
5 15 45
20 0.75 0.63 0.19
60 0.59 0.54 0.14
180 0.60 0.53 0.27
slope (m) correlation (r)
± ∆
t (
min
.)

072814: ∆s=±15 km, ∆t=±1 hr (mean wind 4 m s-1 @ one hour = 14.4 km) (autoscaled color here, so disregard)
N=8 cases with in-situ data ±1 hr, ±15 km of an IASI centroid for July 28 (respective IASI labeled ‘Point 1’ in each graph below)

Sensitivity spatiotemporal window