improving smoke alarm performance - justification for … · 2014-08-13 · and flaming...
TRANSCRIPT
This publication is available free of charge from: http://dx.doi.org/10.6028/NIST.TN.1837
NIST Technical Note 1837
Improving Smoke Alarm
Performance – Justification for
New Smoldering and Flaming Test
Performance Criteria
Thomas G. Cleary
http://dx.doi.org/10.6028/NIST.TN.1837
This publication is available free of charge from: http://dx.doi.org/10.6028/NIST.TN.1837
NIST Technical Note 1837
Improving Smoke Alarm
Performance – Justification for
New Smoldering and Flaming Test
Performance Criteria
Thomas G. Cleary
Fire Research Division
Engineering Laboratory
This publication is available free of charge from:
http://dx.doi.org/10.6028/NIST.TN.1837
July 2014
U.S. Department of Commerce Penny Pritzker, Secretary
National Institute of Standards and Technology
Willie May, Acting Under Secretary of Commerce for Standards and Technology and Acting Director
This publication is available free of charge from: http://dx.doi.org/10.6028/NIST.TN.1837
Certain commercial entities, equipment, or materials may be identified in this
document in order to describe an experimental procedure or concept adequately.
Such identification is not intended to imply recommendation or endorsement by the
National Institute of Standards and Technology, nor is it intended to imply that the
entities, materials, or equipment are necessarily the best available for the purpose.
National Institute of Standards and Technology Technical Note 1837
Natl. Inst. Stand. Technol. Tech. Note 1837, 27 pages (July 2014)
CODEN: NTNOEF
This publication is available free of charge from:
http://dx.doi.org/10.6028/NIST.TN.1837

This publication is available free of charge from: http://dx.doi.org/10.6028/NIST.TN.1837
iii
ABSTRACT Although smoke alarms provide a substantial level of safety to households, reducing the risk of
dying in reported fires by 50 % in homes with working smoke alarms, improved smoke alarm
performance could further reduce fire risk. Earlier alarm activation by increasing the sensitivity
of smoke alarms to risk-significant fire scenarios is one approach to improving performance.
Flaming and smoldering upholstered furniture fires have been identified as risk-significant
scenarios that are not adequately addressed in current standards. New polyurethane foam
smoldering and flaming fire tests have been suggested to address this shortcoming, but need
scientifically sound performance criteria to be complete.
An analysis methodology, based on the available safe egress time/required safe egress time
(ASET/RSET) concept, is used to estimate the probability of escape given smoke alarm activation
at specific smoke concentrations in flaming and smoldering polyurethane foam chair mock-up
fire experiments to provide guidance in selecting new smoldering and flaming fire test
performance criteria. The tenability limits were defined by a fractional effective dose value of
0.3 for toxic gas and heat exposure, and two smoke optical density limits used in previous
studies, 0.25 m-1 and 0.43 m-1, were considered. Analysis assumptions and limitations included:
interconnected smoke alarms that alert occupants regardless of initial fire location,
occupant pre-movement time treated as a distribution for distinct populations,
travel speed as a function of smoke density,
occupants traversing a range of equally frequent pre-determined egress routes,
considering only one apartment-sized residential space,
one location for the responsive smoke alarm, and
three flaming and three smoldering scenarios, and a total of 18 full-scale tests.
Results are presented to provide guidance in selecting performance criteria for new smoldering
and flaming polyurethane foam fire tests proposed for ANSI/UL 217 and ANSI/UL 268. This
study provides a rationale for how to strengthen the requirements in a manner that considers
commensurate improvement for flaming and smoldering alarm performance. Ultimately, the
Standards Technical panel for ANSI/UL 217 and ANSI/UL 268, other regulatory bodies and/or
standards development organizations need to make a judgment on the addition of any new
tests or performance requirements.
This publication is available free of charge from: http://dx.doi.org/10.6028/NIST.TN.1837
iv
Table of Contents
ABSTRACT ................................................................................................ iii
1 INTRODUCTION ................................................................................... 1
2 DESCRIPTION OF EXPERIMENTS .......................................................... 4
3 ASET/RSET MODEL ............................................................................ 11
3.1 Egress Scenarios ............................................................................ 12
3.2 Tenability Criteria .......................................................................... 12
3.3 Occupant Characteristics ............................................................... 14
4 MODEL IMPLEMENTATION ................................................................ 16
5 SIMULATION RESULTS ....................................................................... 17
6 CONCLUSIONS ................................................................................... 25
7 REFERENCES ...................................................................................... 26

This publication is available free of charge from: http://dx.doi.org/10.6028/NIST.TN.1837
1
1 INTRODUCTION In the United States, NFPA 72, The National Fire Alarm and Signaling Code [1] requires that all
installed smoke alarms and detectors be assessed for compliance to the minimum performance
requirements as specified in ANSI/UL 217, Single and Multiple Station Smoke Alarms [2] and
ANSI/UL 268, Smoke Detectors for Fire Alarm Systems [3].
Analysis of US fire statistics for home structure fires from 2007-2011 shows the risk of dying in
reported fires is less than 50 % lower in homes with working smoke alarms [4]. This indicates the
benefits of working smoke alarms. Even with this benefit, the national fire statistics show that
between 2007 and 2011, smoke alarms were deemed to have operated in 37 % of fatal home
structure fires with installed working smoke alarms, and in those cases, analysis of victim
activities showed that at the time of the fatal injury, one-third of victims were attempting to
escape or rescue others [4]. This begs the question: what can be done to improve smoke alarm
performance?
Several factors influence the risk of dying in fires when working smoke alarms are present.
Some examples include victims that do not respond to an operating smoke alarm while sleeping
or incapacitated, and very rapid fire growth. Interconnected smoke alarms that activate all
smoke alarms when any one smoke alarm senses fire conditions improves alerting, especially for
sleeping occupants when interconnected alarms are located in all sleeping areas. Additionally,
smoke alarms or notification devices with the low frequency 520 Hz alarm signal output provide
improved alerting for occupants with mild to severe hearing loss. The current NFPA 72 Code
requires interconnected alarms and alarm coverage on every level and in all sleeping areas for
household fire alarms [1]. The number of homes protected at the level of the current Code,
however, is uncertain. A 2010 survey found that approximately 40 % of households had smoke
alarms in all bedrooms, but only 25 % of households had interconnected smoke alarms [4].
Some victims may be unable to respond due to alcohol or drug impairment, and other victims
may be disabled and immobile, thus incapable of self-rescue. Between 2007 and 2011, in cases
in which smoke alarms were present and operated, it was estimated that 11 % of fatal victims
were possibly alcohol or drug impaired and 17 % were possibly physically or mentally disabled
[4]. Finally, because of rapid fire growth and spread in contemporary furnishings containing
flexible polyurethane foams, occupants may not have sufficient egress time even when alerted
by a smoke alarm [5].
The National Institute of Standards and Technology (NIST) has conducted research on smoke
alarm performance, including the Home Smoke Alarm Study [5] and the Smoke Alarm Sensitivity
Study [6] that focused on fires involving modern upholstered furniture and mattress materials
containing flexible polyurethane foams. Smoke alarm technologies examined included
contemporary photoelectric, ionization, and dual-sensor combination photoelectric/ionization
alarms. Both studies showed that properly installed ionization or photoelectric alarms provide
enough time for most occupants to successfully egress for many fire scenarios. It was observed
in both studies, however, that ionization alarms tended to react much slower to slowly growing

This publication is available free of charge from: http://dx.doi.org/10.6028/NIST.TN.1837
2
extended smoldering fires than photoelectric alarms, and that photoelectric alarms tended to
react somewhat slower to quickly growing flaming fires than ionization alarms. Analysis of
initially flaming and initially smoldering fires in full-scale experiments revealed hypothetical
situations involving both types of photoelectric and ionization alarms for which not all occupants
would have sufficient time to escape before experiencing thick smoke and potentially
succumbing to toxic gases and/or heat exposure. Thus, depending on the fire scenario, a
particular sensing technology and/or increased detection sensitivity could provide additional
time for escape, which may be necessary for some occupants, especially slower population
groups (elderly or mobility impaired) and those with some level of cognitive impairment.
Analysis of the performance of smoke alarms in full-scale experiments showed that dual sensor
photoelectric/ionization alarms with equivalent or more sensitive settings than individual
photoelectric or ionization alarms performed better over a range of flaming and smoldering fire
scenarios [7, 8].
In an effort to increase available escape time, consideration of the national fire statistics and
smoke alarm research [4-8] has led to the recommendation that consumers install both
photoelectric and ionization alarms, or combination alarms by several fire safety and research
organizations including the US Fire Administration, the US Consumer Products Safety
Commission, the National Institute of Standards and Technology, the National Fire Protection
Association, Underwriters Laboratories, Inc., the International Association of Fire Chiefs, and the
National Association of State Fire Marshals. This recommendation is also made in the 2013
Edition of NFPA 72: ”The use of both technologies generally offers the advantage of providing a
faster response to both flaming and smoldering fires, and is recommended for those who desire
a higher level of protection than the minimum requirements of this Code” [1]. The concern with
this recommendation is the identification of specific technologies as surrogates for the desired
performance level. The desired solution is to identify a minimum set of performance
requirements for ANSI/UL 217 and ANSI/UL 268 that are technology-independent and increase
escape times, yet enable innovation in smoke alarm design including use of new and emerging
technologies.
It can be concluded prima facie that an improvement in smoke alarm fire test performance
requirements necessitates earlier alarm activation and warning for both initially smoldering and
initially flaming fires. Simply requiring smoke alarms to activate at a lower smoke concentration
in only an initially smoldering test fire or an initially flaming test fire could bias the requirements
to favor one stand-alone technology (photoelectric or ionization) over the other. The preferred
situation, consistent with the recommendations of the organizations listed above, would be
performance requirements that challenge the current generation of discrete photoelectric and
discrete ionization alarms, leading to improved detection performance for both flaming and
smoldering fires.
An increase in the sensitivity of smoke alarms designed to account for risk-significant fire
scenarios (that is, fire scenarios for which the consequences of the fire are serious and most-
likely life-threatening, and the likelihood is deemed high relative to other serious fires) not

This publication is available free of charge from: http://dx.doi.org/10.6028/NIST.TN.1837
3
covered in the current ANSI/UL 217 and ANSI/UL 268 fire tests would provide earlier alarm
activation and increased time to escape for those occupants alerted by such alarms. Additional
fire tests tailored to replicate the early stages of risk-significant fire scenarios, in conjunction
with detection sensitivity thresholds that increase egress time and therefore, the likelihood of
escape, would refine the ANSI/UL 217 and ANSI/UL 268 Standard’s requirements towards
improved smoke alarm performance.
Fire loss statistics identify fires involving upholstered furniture and mattresses and bedding as
risk-significant scenarios. Between 2007 and 2011, upholstered furniture and mattresses and
bedding were the two leading categories of items first ignited in home structure fires with
fatalities, totaling 31 % of the average 2570 deaths per year [9]. Upholstered furniture
accounted for 2 % of the reported fires, but 18 % of the fire deaths, and mattresses and bedding
accounted for 3 % of the reported fires, but 13 % of the fire deaths. Between 2005 and 2009,
smoking materials were listed as the leading cause of upholstered furniture, and mattresses and
bedding fire deaths, accounting for 58 % and 51 % respectively, while candles, matches and
lighters accounted for about 12 % of both upholstered furniture, and mattresses and bedding
fire deaths [10, 11].
A common underlying component of contemporary upholstered furniture and mattresses is
flexible polyurethane foam. It can rapidly burn from an initial flaming ignition source or smolder
for long periods of time, and then transition to a flaming fire. This material is not currently
represented in the smoldering or flaming fire test protocols of ANSI/UL 217 or ANSI/UL 268.
Requiring detection of flaming and smoldering polyurethane foam materials representing the
earliest stages of upholstered furniture fires may result in earlier alarm activations, which should
provide additional time for escape or rescue. This might be achieved by revising the minimum
smoke alarm/detector performance requirements to address flaming and smoldering
polyurethane foam in ANSI/UL 217 and ANSI/UL 268. A task group was formed to make
recommendations to the Standards Technical Panel of ANSI/UL 217 and ANSI/UL 268, regarding
the addition of fire tests with the goal of increasing available egress time for non-specific fires
(both flaming and smoldering fires) by “expanding alarm responsiveness”. Previous research,
detailed in the UL-Fire Protection Research Foundation’s Smoke Characterization Project,
identified differences in the smoke properties of flaming and smoldering fire smokes from
polyurethane foam as compared to flaming and smoldering fire smokes from the current UL test
fires [12]. Based on the fact that polyurethane foam is a major fuel component in risk-significant
fire scenarios, and that smokes from polyurethane foam combustion differ from the smokes in
the current UL fire tests, the task group chose to focus on developing flaming and smoldering
polyurethane foam tests in the UL fire test room to complement the existing tests.
Suitable full-scale fire experiments can be used to guide scientifically sound selection of the
performance criteria for new smoke sources. Such experiments include the Smoke Alarm
Sensitivity Study, a series of 24 full-scale experiments NIST conducted during the summer of
2008 to examine the effects of alarm type (photoelectric, ionization, and dual sensor), alarm
location, fabric type (100 % cotton and 100 % polyester), polyurethane foam density, ignition
This publication is available free of charge from: http://dx.doi.org/10.6028/NIST.TN.1837
4
scenario, and room configuration, on smoke alarm performance [6]. The experimental results
were used in an egress analysis to examine the effects of pre-movement time, reduced travel
speeds through smoke, and smoke optical density limits on occupant survivability given
different smoke alarm installations and multiple egress paths [8]. The data from those
experiments is used here in a similar available safe egress time/required safe egress time
(ASET/RSET) analysis to identify ceiling smoke concentration ranges, for which alarm activations
would produce a high percentage of successful escape outcomes in some very challenging
smoldering and flaming fire egress scenarios. The objective of this analysis is to develop a
framework to guide the performance criteria specifications for new flaming and smoldering
polyurethane foam fire test standards.
2 DESCRIPTION OF EXPERIMENTS
The fire experiments were conducted in a building mock-up, designed to represent a portion of
an apartment or small home, constructed inside the National Fire Research Laboratory at NIST
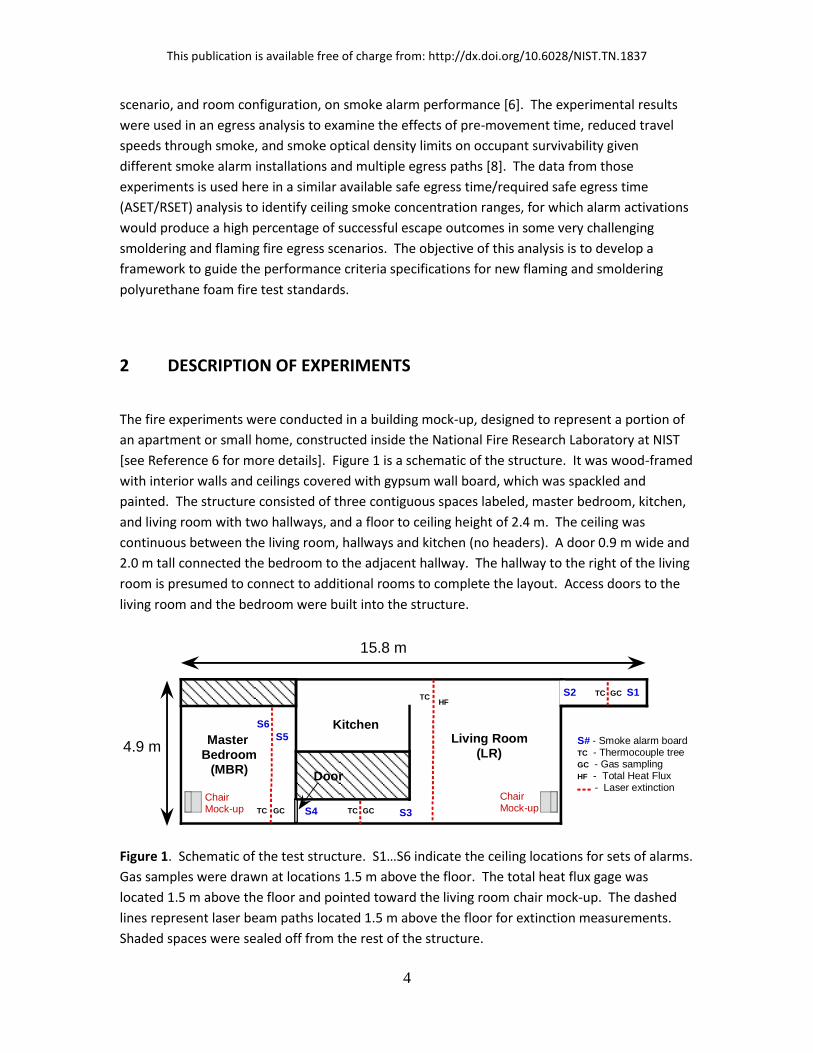
[see Reference 6 for more details]. Figure 1 is a schematic of the structure. It was wood-framed
with interior walls and ceilings covered with gypsum wall board, which was spackled and
painted. The structure consisted of three contiguous spaces labeled, master bedroom, kitchen,
and living room with two hallways, and a floor to ceiling height of 2.4 m. The ceiling was
continuous between the living room, hallways and kitchen (no headers). A door 0.9 m wide and
2.0 m tall connected the bedroom to the adjacent hallway. The hallway to the right of the living
room is presumed to connect to additional rooms to complete the layout. Access doors to the
living room and the bedroom were built into the structure.
Master
Bedroom(MBR)
Living Room
(LR)
Kitchen
15.8 m
4.9 m
S3
S6
S5
S4
S1S2
TC GC TC GC
TCTC GC
HF
ChairMock-up
S# - Smoke alarm boardTC - Thermocouple treeGC - Gas samplingHF - Total Heat Flux - Laser extinction
Door
ChairMock-up
Figure 1. Schematic of the test structure. S1…S6 indicate the ceiling locations for sets of alarms.
Gas samples were drawn at locations 1.5 m above the floor. The total heat flux gage was
located 1.5 m above the floor and pointed toward the living room chair mock-up. The dashed
lines represent laser beam paths located 1.5 m above the floor for extinction measurements.
Shaded spaces were sealed off from the rest of the structure.
This publication is available free of charge from: http://dx.doi.org/10.6028/NIST.TN.1837
5
Groups of four smoke alarms were installed on the ceiling at various fixed locations shown in
Figure 1. Smoke alarms were pre-mounted side-by-side on a 0.3 m by 0.6 m by 6 mm thick
paneling sheet in random order. All smoke alarms were purchased from retail establishments
and consisted of two photoelectric alarms (P1 and P2), two ionization alarms (I1 and I2), and
two dual alarms (D1 and D2). Smoke alarm groupings consisted of P1, I1, D1, and D2 in set 1
and P1, P2, I1, and I2 in set 2. There were six fixed locations for smoke alarms as indicated in
Figure 1. The alarms in Set 1 were placed at locations 1, 3, and 6, and the alarms in Set 2 alarms
were placed at locations 2, 4, and 5. Not all locations were populated with alarms during every
experiment.
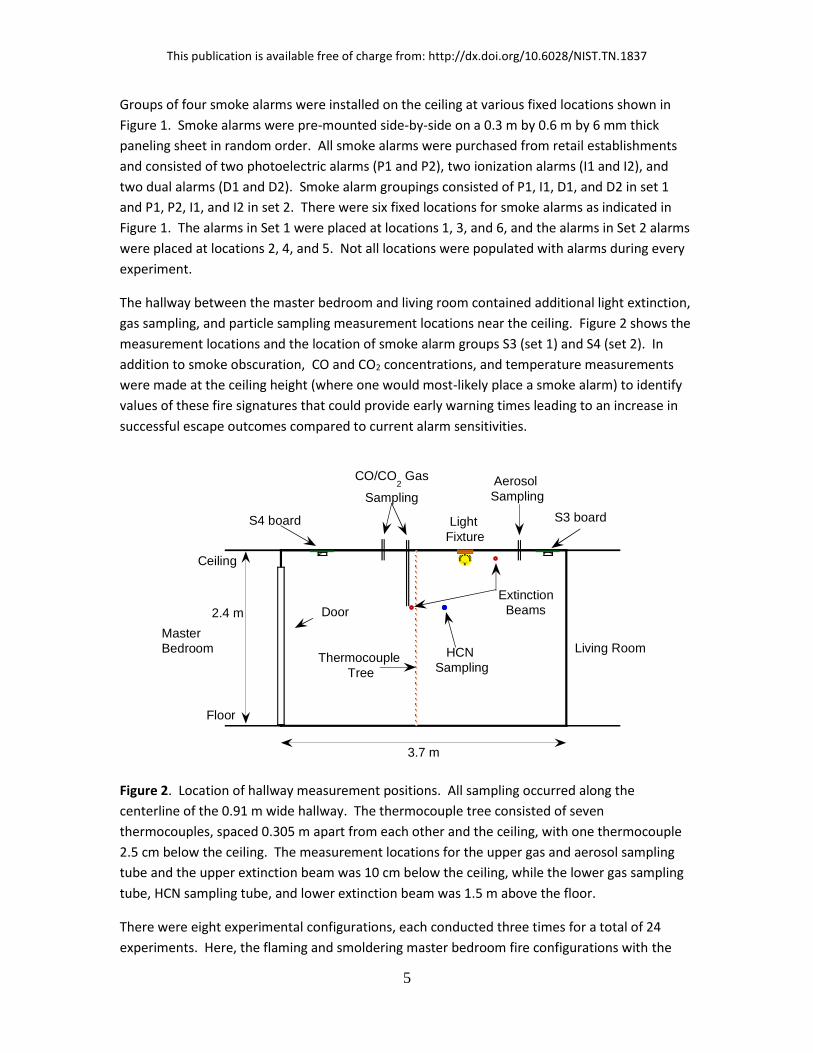
The hallway between the master bedroom and living room contained additional light extinction,
gas sampling, and particle sampling measurement locations near the ceiling. Figure 2 shows the
measurement locations and the location of smoke alarm groups S3 (set 1) and S4 (set 2). In
addition to smoke obscuration, CO and CO2 concentrations, and temperature measurements
were made at the ceiling height (where one would most-likely place a smoke alarm) to identify
values of these fire signatures that could provide early warning times leading to an increase in
successful escape outcomes compared to current alarm sensitivities.
Master
Bedroom Living Room
S4 board S3 board
Door
Extinction
Beams
Aerosol
Sampling
CO/CO2 Gas
Sampling
Light
Fixture
Thermocouple
Tree
3.7 m
HCN
Sampling
2.4 m
Ceiling
Floor
Figure 2. Location of hallway measurement positions. All sampling occurred along the
centerline of the 0.91 m wide hallway. The thermocouple tree consisted of seven
thermocouples, spaced 0.305 m apart from each other and the ceiling, with one thermocouple
2.5 cm below the ceiling. The measurement locations for the upper gas and aerosol sampling
tube and the upper extinction beam was 10 cm below the ceiling, while the lower gas sampling
tube, HCN sampling tube, and lower extinction beam was 1.5 m above the floor.
There were eight experimental configurations, each conducted three times for a total of 24
experiments. Here, the flaming and smoldering master bedroom fire configurations with the

This publication is available free of charge from: http://dx.doi.org/10.6028/NIST.TN.1837
6
door to the master bedroom closed were not considered due to significant alarm activation
delay for alarms located outside the master bedroom.
A chair mock-up was used as the fire source for each experiment. Each mock-up was
constructed from non-fire-retarded, flexible polyurethane foam slabs of low or high density (low
density – 21 kg/m3 {1.3 lb/ft3}, high density - 29 kg/m3 {1.8 lb/ft3}) covered by a matching
zippered seat cushion (90 cm by 70 cm by 20 cm) and seat back covers (90 cm by 50 cm by 20
cm) of either cotton (CT) or polyester (PET) fabric. The foam cushions and fabric covers were
obtained from retail sources. Mock-up cushion pairs weighed between 5.5 kg and 8.3 kg. The
cushions rested on a steel frame sitting in a sheet metal pan, which in turn was supported by a
load cell for mass loss measurements.
One fabric type was selected that would smolder when subjected to a small ignition source like
a cigarette. In his extensive study of cigarette ignition propensity of furniture fabrics, Hirschler
examined smoldering ignition propensity of a set of 500 upholstery fabrics (chosen at random
among typical upholstery fabrics) assumed to be a representative cross-section of the
upholstery fabrics available in the early 1990s [13]. He found that of the 500 fabrics tested, only
145 fabrics were ignitable by cigarettes, all of them predominantly (or completely) cellulosic
(cotton, or other plant-based cellulosic fibers). Therefore, a cotton covering fabric (CT) was
selected, reflecting the upholstered furniture market and likely to exhibit smoldering ignition
from cigarette-like sources.
The ignition sources in the Smoke Alarm Sensitivity Study were designed to be controlled and
repeatable since it was important that variations in ignition strength be limited to reduce the
uncertainty associated with the ignition process. Additionally, the sources were placed in a
manner that could be considered representative of common ignition modes implicated in
residential fires, which compared to the Home Smoke Alarm Study ignition sources [5] should
produce slower growing flaming fires and longer duration smoldering before transition to
flaming.
For each flaming experiment, the chair seat cushion was ignited by a gas-flame ignition tube
(similar to the flaming ignition source described in British Standard 5852 [14]) with a propane
fuel flow of 0.75 cm3/sec. This burner tube flame is similar to a match-like small flame or candle
flame, with a flame length of approximately 4 cm. The ignition tube flame was allowed to burn
for two minutes before placing it next to the chair. To ignite the chair, the tube was placed near
the front side of the seat cushion, approximately one-third down from the top of the seat and
within 3 mm of the fabric surface. The rationale for positioning the burner tube flame near the
upper edge of the seat cushion and away from the back cushion was to produce an initially slow
fire growth rate. A pneumatic piston attached to a lever arm lowered the ignition tube into
position. After 40 s (20 s for one test) of flame exposure, the arm was raised and the ignition
flame extinguished.

This publication is available free of charge from: http://dx.doi.org/10.6028/NIST.TN.1837
7
A comparison of results from the two NIST studies shows that the flaming fires in the Smoke
Alarm Sensitivity Study [15] were characterized by generally slower fire growth relative to the
Home Smoke Alarm Study [5] experiments as indicated by the times to reach the optical density
limit of 0.25 m-1 in the room of fire origin for similar fire scenarios. For example, the average
time to reach the optical density limit in the Home Smoke Alarm Study flaming chair
experiments (single-story home tests 2, 10, 15, 33, and 35) was 164 s, while the average time to
reach the optical density limit in the Smoke Alarm Sensitivity Study’s flaming chair in the living
room experiments (polyester-covered cushion tests 4, 17, 19) was 217 s, a difference of 53 s (or
about 30 %) on average.
The smoldering initiation source was developed to provide a controlled low-temperature heat
source, to induce a smolder process that looks and behaves close to a cigarette-type ignition
event (a cigarette sized heat source inducing smoldering of a fabric capable of initiating
smoldering and propagating the smolder front down into the polyurethane foam). For each
experiment, smoldering was initiated by a 50 W cylindrical electric cartridge heater 50 mm long
and 10 mm in diameter. The cartridge heater rested on a 15 cm by 15 cm square of cotton duck
fabric that was placed on the seat cushion to ensure a sustained smoldering fire. Electrical
power to the cartridge heater was applied in a controlled fashion to achieve an external
temperature sufficient to produce sustained smoldering. A thermocouple was attached to the
exterior of the cartridge heater and the temperature controller set point was fixed at 425 o C.
After about 6 min of total contact time, the cartridge heater was removed. The cotton cushion
covers were used during the smoldering tests. (Cushion covers made from polyester, the other
fabric cover used in the Smoke Alarm Sensitivity Study, melts when exposed to a heat source
like a cigarette or small power cartridge heater, instead of charring and propagating the smolder
front into the foam (like a cotton cover fabric will allow.) Others have used cartridge heaters to
initiate foam smoldering [16] and as a potential replacement for a standardized cigarette in
smoldering tests [17]. Smoldering was initiated in the front corner of the seat cushion, so that
the smolder front had to travel the length of the seat cushion to reach the back cushion and
develop conditions favorable for transition to flaming. The intent was to maximize the in-depth
polyurethane foam smoldering phase to the extent possible. The bulk of the smoke produced
during smoldering was from the smoldering polyurethane foam. Smoldering fires were allowed
to progress until they naturally transitioned to flaming fires except for one experiment that was
stopped prior to the flaming transition.
A comparison of the living room fire alarm activation times to the bedroom fire alarm activation
times (with identical smoldering sources) showed that the difference between photoelectric and
ionization alarms was much greater for the living room tests than the bedroom tests. This
observation re-emphasizes the fact that smoke alarm activation depends on a number of factors
and not just what is burning. For instance, the room size and the distance of the smoke alarms
from the fire source affect smoke aerosol aging as it reaches and enters the smoke alarm. This
is relevant because smoke aging affects smoke particle sizes which in turn influences smoke
alarm activation. Additionally, the local air flows induced from a smoldering source are usually

This publication is available free of charge from: http://dx.doi.org/10.6028/NIST.TN.1837
8
low velocity, and it is well established that smoke alarms, when exposed to smoke in low
velocity flows, can experience long activation delay times even when the smoke concentration
in the surroundings is well above the alarm point [18].
The fire growth rate of the burning chair mock-up determined, to a great extent, the hazard
development in the test enclosure [6]. Due to differences in foam density and cover fabric,
variation in the burning rate of different chair mock-up configurations was expected. One chair
mock-up constructed from high-density foam and polyester cushion covers was burned in the
NIST furniture calorimeter to determine the average heat of combustion of the mock-up. The
mock-up was ignited with the flame tube in the same manner as the full-scale tests. A peak heat
release rate of approximately 700 kW was achieved, with a test-average heat of combustion
(obtained by dividing the total heat released by the total mass loss) of 25 MJ/kg.1 The combined
standard uncertainty of the average heat of combustion was estimated as ± 3 MJ/kg.
A heat release rate estimate of most chair mock-ups was determined by differentiating the mass
loss curve for each test to obtain the mass loss rate, and multiplying that curve by the test-
average heat of combustion. In order to characterize the heat release rate results for each
chair mock-up, the heat release rate curve was fitted to a “t-squared” power law fire growth
curve, following an initial linear growth phase. This functional form fits the heat release rate of
many common materials, and is used extensively for design fires in fire hazard analysis [19].
Annex B, Engineering Design Guide for Automatic Fire Detector Spacing, in the 13 ed. of NFPA 72
specifies a design fire range as slow being a time to reach 1055 kW in a period greater than or
equal to 400 s, medium for growth times between 150 s to 400 s, and fast for growth times less
than 150 s [1]. Figure 3 shows two fitted heat release rate curves for an initially flaming and an
initially smoldering chair mock-up fire. The linear portion spanned from ignition to the time to
reach a fixed value (typically 25 kW for initially flaming fires, and 10 kW for initially smoldering
fires). Table 1 shows the linear time span for each fit, the fitting parameter, the expected fire
growth time to reach 1055 kW (after the linear growth phase), and the fire growth category. All
but one of the chair mock-up fires fall within the medium “t-squared” fire category after the
linear growth phase, and the linear growth phase was estimated to be at least 150 s for initially
flaming fires and 4840 s or greater for initially smoldering fires. The combination of the linear
growth phase and the “t-squared” fire growth rate suggests that these fire sources were not so
fast developing as to render smoke detection inconsequential, but that alarm activation during
the linear growth phase could provide substantial available safe egress times.
1 The heat of combustion for the smoldering phase is expected to be lower than the specified 25 MJ/kg, but the transition to flaming occurred before significant mass loss rate was measured.

This publication is available free of charge from: http://dx.doi.org/10.6028/NIST.TN.1837
9
Figure 3. Experimental heat release rate curves for an initially flaming fire (Exp. 10, left figure)
and initially smoldering fire (Exp. 5, right figure). Dashed lines are fitted curves consisting of a
linear segment and a “t-squared” segment. Fitting parameters are listed in Table 1.
Data on hydrogen cyanide (HCN) was not included in previous analysis of the Smoke Alarm
Sensitivity Study [6, 8 and 15], but is included here with conservative HCN estimates used in the
following tenability calculations. The HCN sampling in the hallway was accomplished by drawing
a fixed flow of hallway air through soda lime HCN sorbent tubes for a fixed time. The sorbent
tubes were located inside the hallway at the centerline. A rigid metal pipe terminating at the
center of the hallway supported the sorbent tube, and the flow tube attached to it. The flow
tube led from the structure connecting to a mass flow controller and then to a vacuum pump.
Multiple sorbent tubes could be switched out during individual tests. The samples were
analyzed for adsorbed HCN mass using the NIOSH 6010 method [20]. The HCN mass was
converted to a mean volume fraction (at room conditions) over the sampling time (sampling
times restricted to smoldering phase or flaming phase) and scaled by the volume fraction of
carbon monoxide. HCN has been shown to correlate with CO in combustion gas yields of
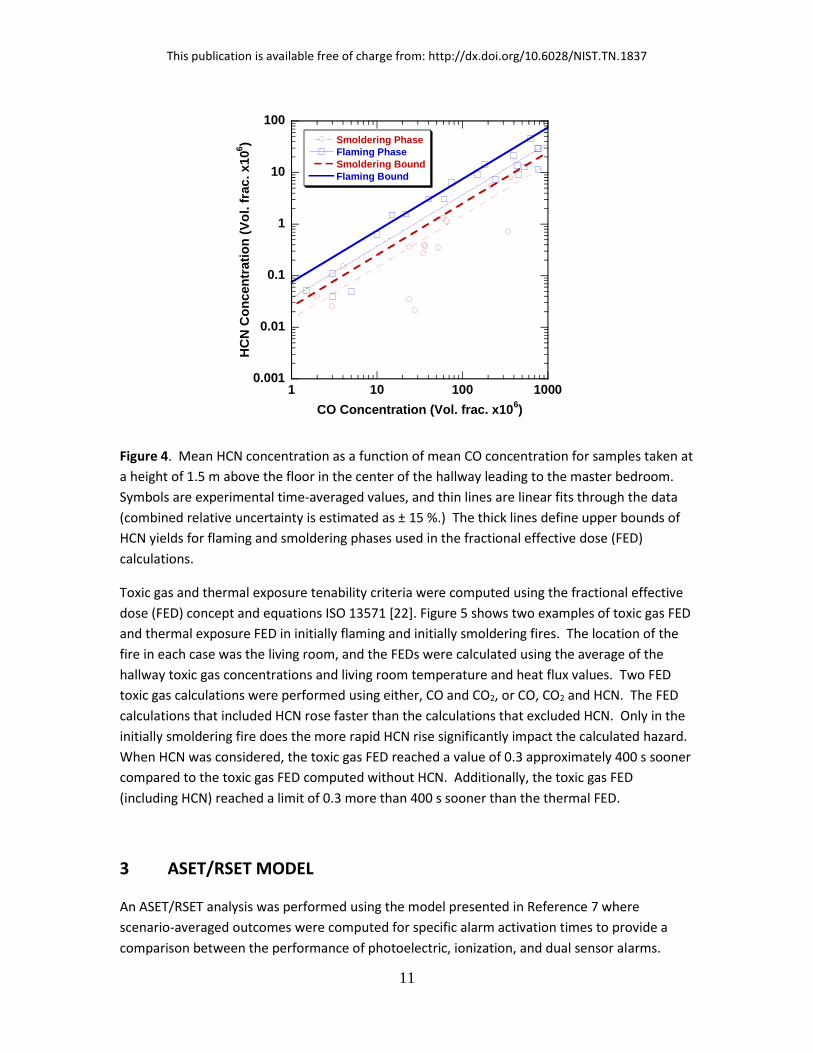
furnishing materials [21]. Figure 4 shows the HCN yield values for samples taken during flaming
and smoldering phases of combustion. The combined relative uncertainty is estimated as ±
15 %. Also shown are best fit lines through all of the flaming mode and smoldering mode data
points. In order to compute toxic gas tenability limits using HCN along with CO in a conservative
manner, fixed values of HCN yields of 0.075 and 0.025 (approximately double the best fit lines)
were specified for flaming and smoldering phases of combustion.
0
100
200
300
400
500
600
700
0 100 200 300 400
ExperimentFitted Curve
Hea
t R
ele
ase R
ate
(k
W)
Time (s)
0
100
200
300
400
5900 6000 6100 6200 6300
ExperimentFitted Curve
Hea
t R
ele
ase R
ate
(k
W)
Time (s)

This publication is available free of charge from: http://dx.doi.org/10.6028/NIST.TN.1837
10
Table 1. Fire growth rate fitting parameters2 for chair mock-up fires based on mass loss rate
and an average effective heat of combustion.
Material*, Exp. No. Ignition Mode, Location#
Linear Phase 𝒕𝑳 (s),
�̇�𝑳(kW)
𝒂 (kW/s2)
R%
Time to 1055
kW (s)
Category+
PET fabric, LD foam, 4 Flaming, LR 150, 10 0.0142 0.995 271 Medium
PET fabric, LD foam, 17 Flaming, LR 200, 25 0.0229 0.983 212 Medium
PET fabric, LD foam, 19 Flaming, LR 175, 25 0.0256 0.970 201 Medium
PET fabric, HD foam, 8 Flaming, BR 260, 30 0.0207 0.977 223 Medium
PET fabric, HD foam, 10 Flaming, BR 280, 30 0.0397 0.986 161 Medium
PET fabric, HD foam, 24 Flaming, BR 240, 25 0.0241 0.972 207 Medium
PET fabric, LD foam, 7 Flaming, BR 180, 25 0.0246 0.990 205 Medium
PET fabric, LD foam, 11 Flaming, BR 160, 10 0.0315 0.973 182 Medium
CT fabric, LD foam, 1 Flaming, LR 1200, 25 0.0106 0.987 312 Medium
CT fabric, LD foam, 6 Flaming, LR 220, 25 0.0127 0.975 285 Medium
CT fabric, LD foam, 18 Flaming, LR 800, 25 0.0284 0.954 190 Medium
CT fabric, LD foam, 5 Smoldering, LR 6180, 10 0.0285 0.991 191 Medium
CT fabric, LD foam, 22 Smoldering, LR 5790, 10 0.0333 0.980 177 Medium
CT fabric, HD foam, 16 Smoldering, LR 5240, 10 0.0334 0.976 177 Medium
CT fabric, HD foam, 21 Smoldering, LR 6210, 10 0.0401 0.995 160 Medium
CT fabric, HD foam, 23 Smoldering, LR 5180, 10 0.0395 0.980 163 Medium
CT fabric, LD foam, 12 Smoldering, BR 4840, 10 0.0344 0.983 174 Medium
CT fabric, LD foam, 15 Smoldering, BR 10910, 20 0.0579 0.986 131 Fast
CT fabric, LD foam, 2 Smoldering, BR 6125, 10 0.0118 0.963 298 Medium
CT fabric, LD foam, 9 Smoldering, BR 6790, 10 0.0201 0.986 228 Medium *PET – Polyester, CT – Cotton, LD – low density, HD – high density #LR – living room, BR – bedroom % Correlation coefficient R +NFPA 72 Annex B definition
2 Fitting equations given below, where �̇�(t) is the heat release rate at time 𝑡, �̇�𝐿is the heat release rate maximum during the linear growth phase, 𝑡𝑙 is the linear growth phase time and 𝑎 is the pre-exponential.
�̇�(𝑡) = �̇�𝐿
𝑡𝐿 𝑡 𝑡 < 𝑡𝑙
�̇�(𝑡) = 𝑎 (𝑡 − 𝑡𝐿)2 + �̇�𝐿 𝑡 ≥ 𝑡𝐿
This publication is available free of charge from: http://dx.doi.org/10.6028/NIST.TN.1837
11
0.001
0.01
0.1
1
10
100
1 10 100 1000
Smoldering Phase
Flaming Phase
Smoldering Bound
Flaming Bound
HC
N C
on
cen
trati
on
(V
ol. f
rac
. x
10
6)
CO Concentration (Vol. frac. x106)
Figure 4. Mean HCN concentration as a function of mean CO concentration for samples taken at
a height of 1.5 m above the floor in the center of the hallway leading to the master bedroom.
Symbols are experimental time-averaged values, and thin lines are linear fits through the data
(combined relative uncertainty is estimated as ± 15 %.) The thick lines define upper bounds of
HCN yields for flaming and smoldering phases used in the fractional effective dose (FED)
calculations.
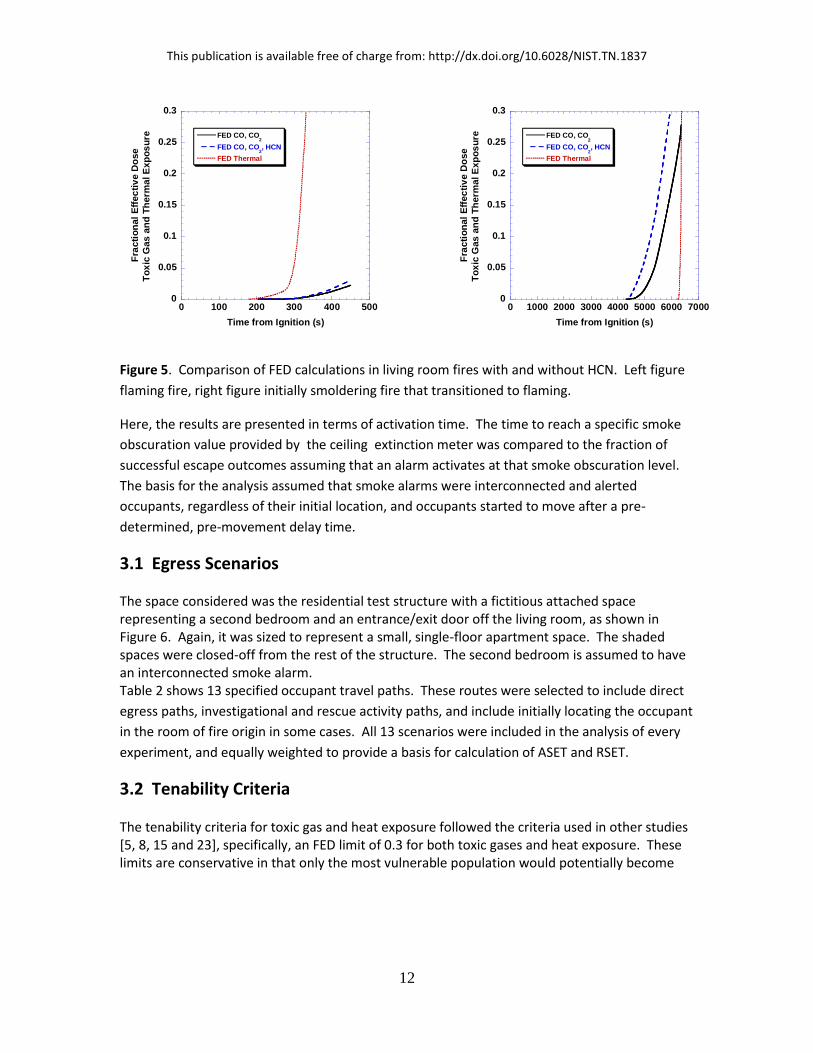
Toxic gas and thermal exposure tenability criteria were computed using the fractional effective
dose (FED) concept and equations ISO 13571 [22]. Figure 5 shows two examples of toxic gas FED
and thermal exposure FED in initially flaming and initially smoldering fires. The location of the
fire in each case was the living room, and the FEDs were calculated using the average of the
hallway toxic gas concentrations and living room temperature and heat flux values. Two FED
toxic gas calculations were performed using either, CO and CO2, or CO, CO2 and HCN. The FED
calculations that included HCN rose faster than the calculations that excluded HCN. Only in the
initially smoldering fire does the more rapid HCN rise significantly impact the calculated hazard.
When HCN was considered, the toxic gas FED reached a value of 0.3 approximately 400 s sooner
compared to the toxic gas FED computed without HCN. Additionally, the toxic gas FED
(including HCN) reached a limit of 0.3 more than 400 s sooner than the thermal FED.
3 ASET/RSET MODEL An ASET/RSET analysis was performed using the model presented in Reference 7 where
scenario-averaged outcomes were computed for specific alarm activation times to provide a
comparison between the performance of photoelectric, ionization, and dual sensor alarms.
This publication is available free of charge from: http://dx.doi.org/10.6028/NIST.TN.1837
12
Figure 5. Comparison of FED calculations in living room fires with and without HCN. Left figure
flaming fire, right figure initially smoldering fire that transitioned to flaming.
Here, the results are presented in terms of activation time. The time to reach a specific smoke
obscuration value provided by the ceiling extinction meter was compared to the fraction of
successful escape outcomes assuming that an alarm activates at that smoke obscuration level.
The basis for the analysis assumed that smoke alarms were interconnected and alerted
occupants, regardless of their initial location, and occupants started to move after a pre-
determined, pre-movement delay time.
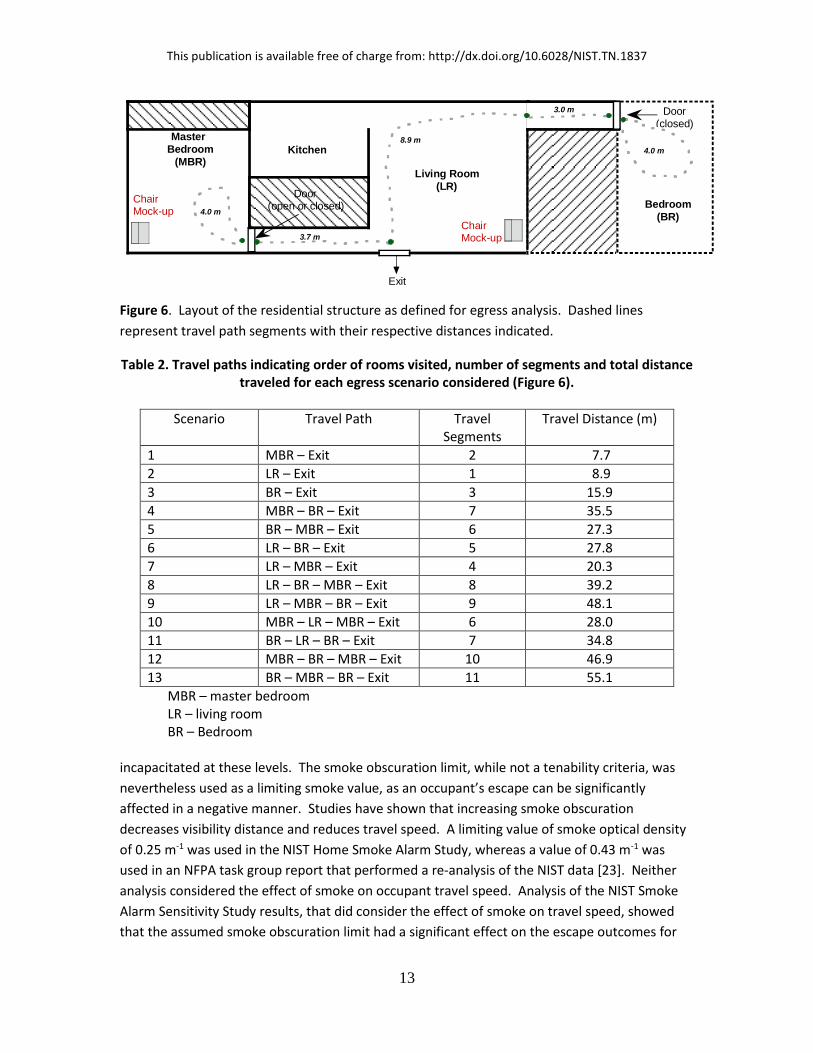
3.1 Egress Scenarios The space considered was the residential test structure with a fictitious attached space representing a second bedroom and an entrance/exit door off the living room, as shown in Figure 6. Again, it was sized to represent a small, single-floor apartment space. The shaded spaces were closed-off from the rest of the structure. The second bedroom is assumed to have an interconnected smoke alarm. Table 2 shows 13 specified occupant travel paths. These routes were selected to include direct
egress paths, investigational and rescue activity paths, and include initially locating the occupant
in the room of fire origin in some cases. All 13 scenarios were included in the analysis of every
experiment, and equally weighted to provide a basis for calculation of ASET and RSET.
3.2 Tenability Criteria The tenability criteria for toxic gas and heat exposure followed the criteria used in other studies [5, 8, 15 and 23], specifically, an FED limit of 0.3 for both toxic gases and heat exposure. These limits are conservative in that only the most vulnerable population would potentially become
0
0.05
0.1
0.15
0.2
0.25
0.3
0 100 200 300 400 500
FED CO, CO2
FED CO, CO2, HCN
FED Thermal
Fra
cti
on
al
Eff
ec
tiv
e D
ose
To
xic
Gas
an
d T
herm
al E
xp
os
ure
Time from Ignition (s)
0
0.05
0.1
0.15
0.2
0.25
0.3
0 1000 2000 3000 4000 5000 6000 7000
FED CO, CO2
FED CO, CO2, HCN
FED Thermal
Fra
cti
on
al
Eff
ec
tiv
e D
ose
To
xic
Gas
an
d T
herm
al E
xp
os
ure
Time from Ignition (s)
This publication is available free of charge from: http://dx.doi.org/10.6028/NIST.TN.1837
13
Master
Bedroom
(MBR)Living Room
(LR)
Kitchen
Bedroom
(BR)
Door(closed)
Door(open or closed)
Exit
3.7 m
8.9 m
3.0 m
4.0 m
ChairMock-up
ChairMock-up
4.0 m
Figure 6. Layout of the residential structure as defined for egress analysis. Dashed lines
represent travel path segments with their respective distances indicated.
Table 2. Travel paths indicating order of rooms visited, number of segments and total distance traveled for each egress scenario considered (Figure 6).
Scenario Travel Path Travel Segments
Travel Distance (m)
1 MBR – Exit 2 7.7
2 LR – Exit 1 8.9
3 BR – Exit 3 15.9
4 MBR – BR – Exit 7 35.5
5 BR – MBR – Exit 6 27.3
6 LR – BR – Exit 5 27.8
7 LR – MBR – Exit 4 20.3
8 LR – BR – MBR – Exit 8 39.2
9 LR – MBR – BR – Exit 9 48.1
10 MBR – LR – MBR – Exit 6 28.0
11 BR – LR – BR – Exit 7 34.8
12 MBR – BR – MBR – Exit 10 46.9
13 BR – MBR – BR – Exit 11 55.1
MBR – master bedroom LR – living room BR – Bedroom
incapacitated at these levels. The smoke obscuration limit, while not a tenability criteria, was
nevertheless used as a limiting smoke value, as an occupant’s escape can be significantly
affected in a negative manner. Studies have shown that increasing smoke obscuration
decreases visibility distance and reduces travel speed. A limiting value of smoke optical density
of 0.25 m-1 was used in the NIST Home Smoke Alarm Study, whereas a value of 0.43 m-1 was
used in an NFPA task group report that performed a re-analysis of the NIST data [23]. Neither
analysis considered the effect of smoke on occupant travel speed. Analysis of the NIST Smoke
Alarm Sensitivity Study results, that did consider the effect of smoke on travel speed, showed
that the assumed smoke obscuration limit had a significant effect on the escape outcomes for

This publication is available free of charge from: http://dx.doi.org/10.6028/NIST.TN.1837
14
flaming and smoldering fire scenarios over a range of 0.25 m-1 to 1.0 m-1 [8]. In the analysis
below, the results are presented for four smoke limits (0.20 m-1, 0.25 m-1, 0.30 m-1, and 0.43 m-1)
and when the smoke limit is not enforced (“no smoke” limit). The 0.20 m-1 and 0.30 m-1 limits
represent ± 20 % differences from the 0.25 m-1 value and are included to show the sensitivity of
the results about the nominal uncertainty of the optical density measurement at 0.25 m-1. The
“no smoke” limit results force either the heat or toxic gas tenability limits to become the limiting
condition. The “no smoke” limit conveys a relative urgency for a given scenario, whereas a small
time difference between a smoke limit and “no smoke” limit implies little time for alternate
outcomes like being rescued.
3.3 Occupant Characteristics In each egress simulation, the occupant is alerted at some time from an interconnected smoke
alarm. Since the ceiling smoke obscuration was only measured in the south hallway (leading
from the master bedroom, and next to the exit door), it was defined as the location of the
initiating alarm; the actual recorded alarm times throughout the structure were ignored. After
receiving the alarm, the occupant remained at their initial location for a specified time before
moving, designated as the pre-movement time. Pre-movement times are represented as a
probability distribution in the model. In previous work, three probability distributions were
proposed to characterize a fast reacting, “primed” group, a more measured normal-reacting
group, and a slower-to-react group characteristic of elderly or mobility-impaired occupants [8].
Here, these distributions are postulated from discrete pre-movement activities tied to similar
activities considered in the NIST Home Smoke Alarm Report [5].
The Home Smoke Alarm Report considered the following pre-movement activities: calling the
fire department, getting dressed, gathering belongings, and waking/rescuing two individuals.
Waking to the alarm was not included. This omission is contradicted by research that showed
waking to an alarm is not instantaneous, but may take 30 s or longer in some cases [24]. The
action of calling the fire department was included in human response studies conducted in the
1980’s. However, here, it is speculated that with the prevalence of cell phones presently, an
individual would not make a call to the fire department from inside the home. Therefore, in this
analysis, calling fire department was dropped and waking/arising was added as pre-movement
activities. The Home Smoke Alarm Study used estimated mean values for the pre-movement
times obtained from previous research [25]. Here, a distribution was associated with each pre-
movement activity. The “awaken and arise” pre-movement distribution was postulated given
the experimental results of Duncan [26] and Ashley [27]. The fast-responding “primed”
occupants are described as responding sooner and with less spread in their responses. This
group represents the response of test subjects who were expecting an alarm, i.e. “primed”, as
part of a study. This group does not alert others as defined to represent the quickest expected
individual occupant response and this group is not included in the following analysis. Both the
normal-responding mobile occupants and the slower-to-react occupants take somewhat longer
to arise, awaken, and accomplish pre-movement activities on average.

This publication is available free of charge from: http://dx.doi.org/10.6028/NIST.TN.1837
15
As described in [8], the total pre-movement time was characterized by a median time and a
geometric standard deviation (g) with a log-normal distribution. The Fenton-Wilkinson method
was used to estimate a single log-normal distribution that approximates the sum of the
individual pre-movement activity distributions [28]. Table 3 details the individual contributions
and the final distribution for three separate populations which, as it turns out, are the same as
those considered previously [8]. Response times for 84.1 % of a group to complete individual
tasks are presented to show how long it would take a large portion of the population to
complete each task (for a log-normal distribution, the median time multiplied by the geometric
standard deviation defines the 84.1 % response time, thus, it is a convenient way to compare
different distributions ). For the normal-responding occupants group (median = 35 s, g = 1.6),
84.1 % accomplished all pre-movement tasks in 56 s. Whereas for slower-to-react occupants
group (median = 55 s, g = 1.6), 84.1 % accomplished all pre-movement tasks in 88 s. This
compares with the cumulative worst-case pre-movement times of 55 s for the young family at
night and 80 s for the elderly family at night estimated in the NIST Home Smoke Alarm Study [5].
Table 3. Pre-movement activities and the corresponding log-normal distribution that
approximates the sum of the individual pre-movement activities for three populations.
Population Pre-movement
Activity
Mean
Time
(s)
Median
Time
(s)
Geometric
Standard
Deviation (g)
Time for 84.1 %
of Population to
complete task(s)
Fast-responding,
primed occupants
Awaken and arise 8.0 6.1 2.1 12.8
Dress or don robe 5.0 3.8 2.1 8.0
Gather belongings 5.0 3.8 2.1 8.0
Distribution
representing the sum 18 16 1.6 26
Normal-
responding, mobile
occupants
Awaken and arise 12 8.2 2.4 17.2
Dress or don robe 8 5.5 2.4 11.5
Gather belongings 8 5.5 2.4 11.5
Awaken occupant 1 6 4.1 2.4 8.6
Awaken occupant 2 6 4.1 2.4 8.6
Distribution
representing the sum 40 35 1.6 56
Elderly, mobility
impaired, slower-
to-react occupants
Awaken and arise 15 10.2 2.4 21.5
Dress or don robe 15 10.2 2.4 21.5
Gather belongings 12 8.2 2.4 17.2
Awaken occupant 1 10 6.8 2.4 14.3
Awaken occupant 2 10 6.8 2.4 14.3
Distribution
representing the sum 62 55 1.6 88
Travel speed was treated as a function of the smoke optical density along the travel path in the
model. The NIST Home Smoke Alarm Study analysis used fixed floor travel speeds of 1.2 m/s for
young occupants and 0.75 m/s for elderly occupants [5]. Here, the initial travel speed for all
occupants was an intermediate value of 1.05 m/s and, as the smoke optical density increased,
the occupant travel speed was assumed to decrease from 1.05 m/s to a limiting speed of 0.1
m/s [8]. Figure 7 shows the travel speed along with an estimated visibility range for various

This publication is available free of charge from: http://dx.doi.org/10.6028/NIST.TN.1837
16
reflective surfaces (walls, doors, furniture objects, etc. under normal lighting conditions) as a
function of optical density. The visibility was estimated by a dimensionless constant divided by
the optical density. Here, the constants were 0.9 and 1.7 for the lower and upper range of
visibility for reflective surfaces [29]. For an optical density of 0.5 m-1 in Figure 7, the travel speed
drops by about 85 %, whereas the visibility is estimated to be between 3.5 m and 7.0 m.
0.1
1
10
1
10
0 0.25 0.5 0.75 1
Vis
ibil
ity
(m
) a
nd
Walk
ing
Sp
ee
d (
m/s
)
Vis
ibil
ity
(ft
) an
d W
alk
ing
Sp
ee
d (
ft/s
)
Optical Density (m-1
)
Walking Speed
Lower Range Visibility
Upper Range Visibility
Figure 7. The walking speed as a function of the optical density correlation used in the model
[8], and the estimated upper and low reflective surface visibility range as a function of optical
density [29].
4 MODEL IMPLEMENTATION
The start of each experiment (application of heat source or flame to the seat cushion) was
considered time zero. At some time well before non-tenable conditions, a fictitious hallway
alarm was assumed to activate. From this alarm activation time, egress calculations were
conducted for 41 pre-movement times from 0 s to 200 s in 5 s intervals, which covered more
than 99 % and 97 % of the normal-responding occupants and the slower-to-react occupants
distributions, respectively. If egress was deemed unsuccessful, because a tenability or smoke
limit was reached for a given pre-movement time, then the fraction of the population deemed
to successfully escape was estimated by the integral of the pre-movement frequency
distribution from zero to the last successful pre-movement time step (and normalized by 0.99 or
0.97, depending on the occupancy group.) The fraction of successful escapes was calculated for
each of the 13 egress scenarios, and those values were averaged to represent a single fraction of
successful escapes for the presumed alarm time of a given fire experiment. The initial alarm

This publication is available free of charge from: http://dx.doi.org/10.6028/NIST.TN.1837
17
time was then increased by 10 s in the case of initially flaming fires and 30 s in the case of
initially smoldering fires and the fraction of successful escapes re-calculated. The alarm time
was increased and the calculations repeated until essentially all egress attempts were
unsuccessful. This process was conducted for the two characteristic occupant groups
considered here, the normal-responding occupants and the slower-to-react occupants.
5 SIMULATION RESULTS
There were a total of six fire scenarios considered: two flaming fires located in the living room
(with different cover fabrics, either cotton or polyester) and one located in the master bedroom,
and two initially smoldering fires located in the living room (with different foam densities) and
one located in the master bedroom. Each fire scenario experiment was conducted three times,
to quantify the variability in the ignition, fire growth, and time to alarm, for a total of 18
individual experimental fires used for the simulations considered in this analysis.
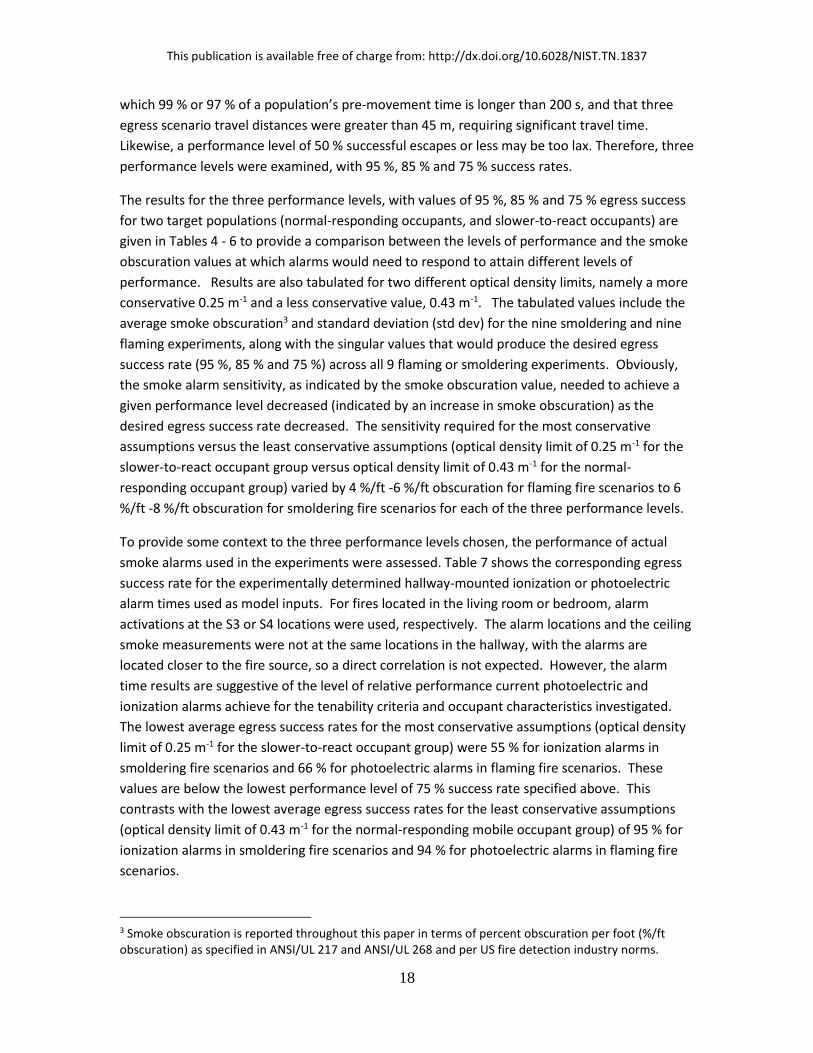
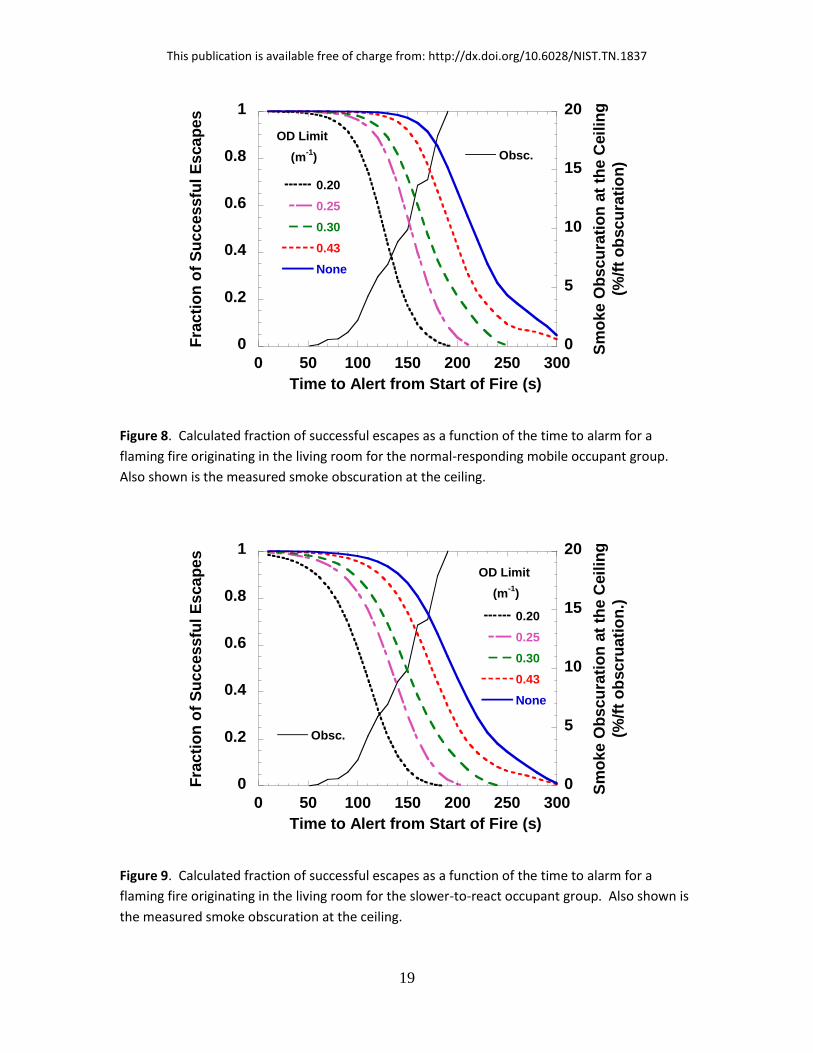
Figures 8-11 are sample plots showing the results for flaming and smoldering fire experiments in
the living room and master bedroom, respectively. For each experiment, the fraction of
successful escapes is plotted versus the presumed alarm time. In addition, the smoke
obscuration at the ceiling is plotted. In the analysis presented, results are given for four
hypothetical smoke limit criteria (0.20 m-1, 0.25 m-1, 0.30 m-1, and 0.43 m-1) and when “no
smoke” limit is enforced. Figures 8 and 9 show the results of a flaming fire in the living room
with occupant pre-movement distributions representing the normal-responding occupant group
and the slower-to-react occupant group, respectively. Figures 10 and 11 show the results for a
smoldering fire in the master bedroom with occupant pre-movement distributions representing
the normal-responding occupant group, and the slower-to-react occupant group, respectively.
There are significant differences in egress outcomes for the various smoke limit criteria that
define smoke alarm performance. For the smoldering cases, there were long time differences
for different smoke limits in the slowly developing smoldering fire, whereas in the flaming fire
case, the egress outcomes for the different smoke limits were relatively close together,
indicating rapid smoke development. The flat portion of some curves at approximately 31 % in
Figures 10 and 11 was due to the fact that 4 of the 13 egress scenarios that did not include
traversing the south hallway nor the master bedroom, and combined with the relatively long
time for the smolder smoke to fill the living room as it traveled from the master bedroom, led to
extended safe egress time for those scenarios.
The surrogate for smoke alarm performance is the ceiling smoke obscuration measurement at
the desired smoke alarm activation time which would be considered as the target alarm
criterion for new polyurethane foam smoldering and flaming fire sensitivity tests in ANSI/UL 217
and ANSI/UL 268. A performance level of 100 % successful escapes may be a target that is too
challenging to achieve given that the continuous pre-movement frequency distributions for
This publication is available free of charge from: http://dx.doi.org/10.6028/NIST.TN.1837
18
which 99 % or 97 % of a population’s pre-movement time is longer than 200 s, and that three
egress scenario travel distances were greater than 45 m, requiring significant travel time.
Likewise, a performance level of 50 % successful escapes or less may be too lax. Therefore, three
performance levels were examined, with 95 %, 85 % and 75 % success rates.
The results for the three performance levels, with values of 95 %, 85 % and 75 % egress success
for two target populations (normal-responding occupants, and slower-to-react occupants) are
given in Tables 4 - 6 to provide a comparison between the levels of performance and the smoke
obscuration values at which alarms would need to respond to attain different levels of
performance. Results are also tabulated for two different optical density limits, namely a more
conservative 0.25 m-1 and a less conservative value, 0.43 m-1. The tabulated values include the
average smoke obscuration3 and standard deviation (std dev) for the nine smoldering and nine
flaming experiments, along with the singular values that would produce the desired egress
success rate (95 %, 85 % and 75 %) across all 9 flaming or smoldering experiments. Obviously,
the smoke alarm sensitivity, as indicated by the smoke obscuration value, needed to achieve a
given performance level decreased (indicated by an increase in smoke obscuration) as the
desired egress success rate decreased. The sensitivity required for the most conservative
assumptions versus the least conservative assumptions (optical density limit of 0.25 m-1 for the
slower-to-react occupant group versus optical density limit of 0.43 m-1 for the normal-
responding occupant group) varied by 4 %/ft -6 %/ft obscuration for flaming fire scenarios to 6
%/ft -8 %/ft obscuration for smoldering fire scenarios for each of the three performance levels.
To provide some context to the three performance levels chosen, the performance of actual
smoke alarms used in the experiments were assessed. Table 7 shows the corresponding egress
success rate for the experimentally determined hallway-mounted ionization or photoelectric
alarm times used as model inputs. For fires located in the living room or bedroom, alarm
activations at the S3 or S4 locations were used, respectively. The alarm locations and the ceiling
smoke measurements were not at the same locations in the hallway, with the alarms are
located closer to the fire source, so a direct correlation is not expected. However, the alarm
time results are suggestive of the level of relative performance current photoelectric and
ionization alarms achieve for the tenability criteria and occupant characteristics investigated.
The lowest average egress success rates for the most conservative assumptions (optical density
limit of 0.25 m-1 for the slower-to-react occupant group) were 55 % for ionization alarms in
smoldering fire scenarios and 66 % for photoelectric alarms in flaming fire scenarios. These
values are below the lowest performance level of 75 % success rate specified above. This
contrasts with the lowest average egress success rates for the least conservative assumptions
(optical density limit of 0.43 m-1 for the normal-responding mobile occupant group) of 95 % for
ionization alarms in smoldering fire scenarios and 94 % for photoelectric alarms in flaming fire
scenarios.
3 Smoke obscuration is reported throughout this paper in terms of percent obscuration per foot (%/ft obscuration) as specified in ANSI/UL 217 and ANSI/UL 268 and per US fire detection industry norms.
This publication is available free of charge from: http://dx.doi.org/10.6028/NIST.TN.1837
19
0
0.2
0.4
0.6
0.8
1
0
5
10
15
20
0 50 100 150 200 250 300
0.20
0.25
0.30
0.43
None
Obsc.
Fra
cti
on
of
Su
ccessfu
l E
scap
es
Sm
oke O
bscu
rati
on
at
the C
eil
ing
(%/f
t o
bscu
rati
on
)
Time to Alert from Start of Fire (s)
OD Limit
(m-1
)
Figure 8. Calculated fraction of successful escapes as a function of the time to alarm for a
flaming fire originating in the living room for the normal-responding mobile occupant group.
Also shown is the measured smoke obscuration at the ceiling.
0
0.2
0.4
0.6
0.8
1
0
5
10
15
20
0 50 100 150 200 250 300
0.20
0.25
0.30
0.43
None
Obsc.
Fra
cti
on
of
Su
ccessfu
l E
scap
es
Sm
oke O
bscu
rati
on
at
the C
eil
ing
(%/f
t o
bscru
ati
on
.)
Time to Alert from Start of Fire (s)
OD Limit
(m-1
)
Figure 9. Calculated fraction of successful escapes as a function of the time to alarm for a
flaming fire originating in the living room for the slower-to-react occupant group. Also shown is
the measured smoke obscuration at the ceiling.

This publication is available free of charge from: http://dx.doi.org/10.6028/NIST.TN.1837
20
0
0.2
0.4
0.6
0.8
1
0
5
10
15
20
25
30
35
40
2000 2500 3000 3500 4000 4500 5000
0.20
0.25
0.30
0.43
None
Obsc.
Fra
cti
on
of
Su
ccessfu
l E
scap
es
Sm
oke O
bscu
rati
on
at
the C
eil
ing
(%/f
t O
bsc.)
Time to Alert from Start of Fire (s)
OD Limit
(m-1
)
Figure 10. Calculated fraction of successful escapes as a function of the time to alarm for a
smoldering fire originating in the master bedroom for the normal-responding mobile occupant
group. Also shown is the measured smoke obscuration at the ceiling.
0
0.2
0.4
0.6
0.8
1
0
5
10
15
20
25
30
35
40
2000 2500 3000 3500 4000 4500 5000
0.20
025
0.30
0.43
None
Obsc.
Fra
cti
on
of
Su
ccessfu
l E
scap
es
Sm
oke O
bscu
rati
on
at
the C
eil
ing
(%/f
t O
bsc.)
Time to Alert from Start of Fire (s)
OD Limit
(m-1
)
Figure 11. Calculated fraction of successful escapes as a function of the time to alarm for a
smoldering fire originating in the master bedroom for the slower-to-react occupant group. Also
shown is the measured smoke obscuration at the ceiling.

This publication is available free of charge from: http://dx.doi.org/10.6028/NIST.TN.1837
21
Table 4. Ceiling smoke obscuration required to achieve a calculated 95 % egress success rate
for the target populations and optical density limits.
Optical
Density
Limit (m-1)
Pre-movement
Distribution
(median (s) /g)
Initially smoldering fire scenario
ceiling smoke obscuration to
achieve 95 % egress success rate
(%/ft obsc.)
Flaming fire scenario
ceiling smoke obscuration to
achieve 95 % egress success rate
(%/ft obsc.)
Average of 9
experiments
± std dev
Value to
achieve 95 %
success rate
across all 9
experiments
Average of 9
experiments
± std dev
Value to
achieve 95 %
success rate
across all 9
experiments
0.25 35/1.6 17.2 ± 5.2 11.3 3.1 ± 1.7 2.5
55/1.6 16.7 ± 5.1 10.7 0.9 ± 0.8 0.4
0.43 35/1.6 23.3 ± 7.6 18.3 5.6 ± 2.2 4.7
55/1.6 22.3 ± 7.2 13.3 2.5 ± 1.7 2.0
Table 5. Ceiling smoke obscuration required to achieve a calculated 85 % egress success rate
for the target populations and optical density limits.
Optical
Density
Limit (m-1)
Pre-movement
Distribution
(median (s) /g)
Initially smoldering fire scenario
ceiling smoke obscuration to
achieve 85 % egress success rate
(%/ft obsc.)
Flaming fire scenario
ceiling smoke obscuration to
achieve 85 % egress success rate
(%/ft obsc.)
Average of 9
experiments
± std dev
Value to
achieve 85 %
success rate
across all 9
experiments
Average of 9
experiments
± std dev
Value to
achieve 85 %
success rate
across all 9
experiments
0.25 35/1.6 17.5 ± 5.3 12.7 5.0 ± 1.6 4.5
55/1.6 17.1 ± 5.2 12.5 2.3 ± 1.5 2.1
0.43 35/1.6 24.6 ± 8.9 19.9 8.6 ± 3.2 7.5
55/1.6 23.3 ± 7.8 18.9 5.5 ± 2.1 4.5
Table 6. Ceiling smoke obscuration required to achieve a calculated 75 % egress success rate
for the target populations and optical density limits.
Optical
Density
Limit (m-1)
Pre-movement
Distribution
(median (s) /g)
Initially smoldering fire scenario
ceiling smoke obscuration to
achieve 75 % egress success rate
(%/ft obsc.)
Flaming fire scenario
ceiling smoke obscuration to
(%/ft obsc.)achieve 75 % egress
success rate
Average of 9
experiments
± std dev
Value to
achieve 75 %
success rate
across all 9
experiments
Average of 9
experiments
± std dev
Value to
achieve 75 %
success rate
across all 9
experiments
0.25 35/1.6 17.7 ± 5.3 14.0 5.9 ± 1.7 5.5
55/1.6 17.4 ± 5.3 13.9 3.7 ± 1.6 3.4
0.43 35/1.6 25.3 ± 9.0 22.4 9.9 ± 3.2 9.7
55/1.6 24.3 ± 8.6 21.5 7.1 ± 2.5 6.2

This publication is available free of charge from: http://dx.doi.org/10.6028/NIST.TN.1837
22
Table 7. Calculated relative egress performance using experimental activation times for
photoelectric and ionization alarms in the hallway where the ceiling smoke obscuration was
measured.
Optical
Density
Limit (m-1)
Pre-movement
Distribution
(median (s) /g)
Initially smoldering fire scenario
egress success rate percentage
using local (hallway) alarm times
Flaming fire scenario
egress success rate percentage
using local (hallway) alarm times
Ionization
Alarms
(average of 9
experiments
± std dev)
Photoelectric
Alarms
(average of 9
experiments
± std dev)
Ionization
Alarms
(average of 9
experiments
± std dev)
Photoelectric
Alarms
(average of 9
experiments
± std dev)
0.25 35/1.6 59 ± 40 100 ± 0 95 ± 13 83 ± 18
55/1.6 55 ± 44 100 ± 0 89 ± 18 66 ± 23
0.43 35/1.6 95 ± 16 100 ± 0 100 ± 1 94 ± 13
55/1.6 94 ± 21 100 ± 0 97 ± 4 85 ± 20
Another way to examine the results is to tabulate the egress success rate as a function of alarm
activation at a given smoke obscuration. Table 8 shows the corresponding egress success rate
for flaming fire scenarios with smoke obscuration ranging from 2 %/ft obscuration to 10 %/ft
obscuration. Table 9 shows the corresponding success rate for smoldering fire scenarios with
smoke obscuration ranging from 8 %/ft obscuration to 24 %/ft obscuration. Additional columns
are shown for the egress success rate for a given smoke obscuration plus a 30 s delay (dwell
time, which has been suggested by some manufacturers as part of the fire test performance
criteria).
Table 8. Calculated relative egress performance for an alarm activated at a prescribed ceiling
smoke obscuration for flaming fires.
Smoke
Obscuration
(%/ft obsc.)
Success Rate (%)
Normal-responding occupants
(Pre-movement distribution – 35 s, g 1.6)
Success Rate (%)
Slower-to-react occupants
(Pre-movement distribution – 55 s, g 1.6)
Optical density limit
0.25 m-1
Optical density limit
0.43 m-1
Optical density limit
0.25 m-1
Optical density limit
0.43 m-1
Delay 0
s
Delay
30s
Delay 0
s
Delay
30s
Delay 0
s
Delay
30s
Delay 0
s
Delay
30s
2 97 85 99 97 86 65 95 86
3 94 73 98 91 78 55 91 78
4 89 63 97 87 70 43 88 71
5 80 50 94 80 60 33 82 62
6 70 40 91 71 50 26 76 52
7 62 32 87 63 42 20 70 44
8 55 28 83 56 37 17 64 38
9 49 23 79 49 32 13 59 33
10 44 19 73 42 27 11 52 27
This publication is available free of charge from: http://dx.doi.org/10.6028/NIST.TN.1837
23
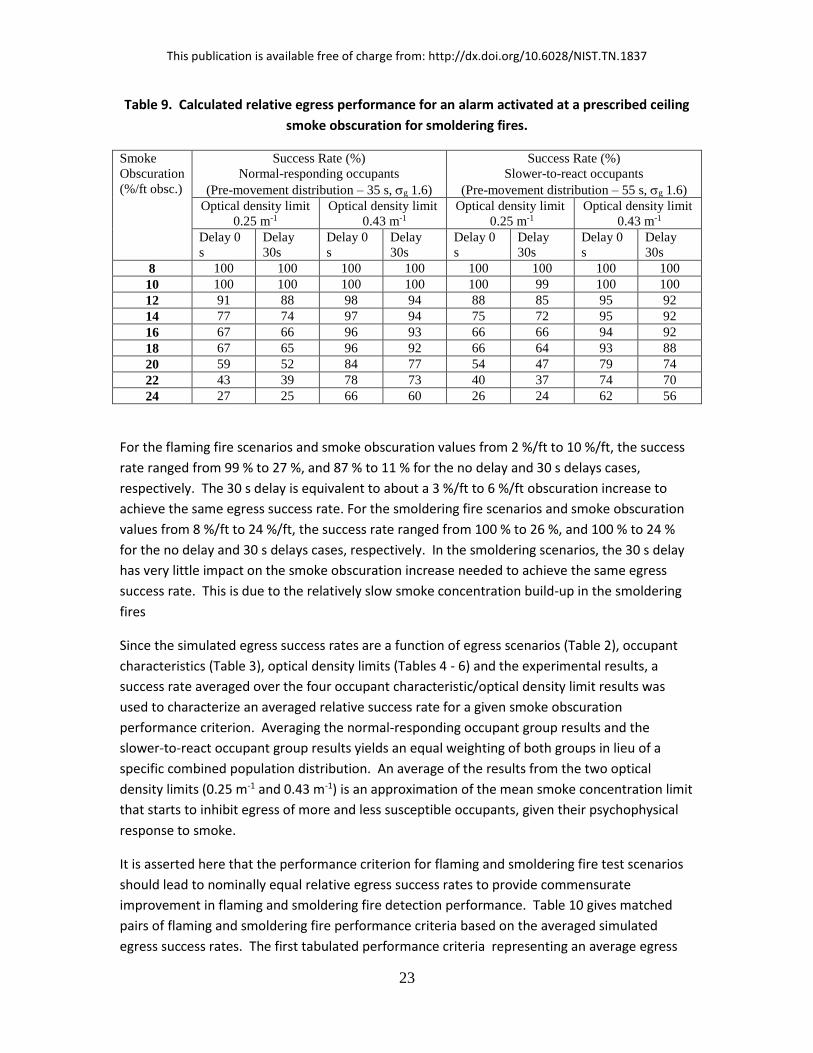
Table 9. Calculated relative egress performance for an alarm activated at a prescribed ceiling
smoke obscuration for smoldering fires.
Smoke
Obscuration
(%/ft obsc.)
Success Rate (%)
Normal-responding occupants
(Pre-movement distribution – 35 s, g 1.6)
Success Rate (%)
Slower-to-react occupants
(Pre-movement distribution – 55 s, g 1.6)
Optical density limit
0.25 m-1
Optical density limit
0.43 m-1
Optical density limit
0.25 m-1
Optical density limit
0.43 m-1
Delay 0
s
Delay
30s
Delay 0
s
Delay
30s
Delay 0
s
Delay
30s
Delay 0
s
Delay
30s
8 100 100 100 100 100 100 100 100
10 100 100 100 100 100 99 100 100
12 91 88 98 94 88 85 95 92
14 77 74 97 94 75 72 95 92
16 67 66 96 93 66 66 94 92
18 67 65 96 92 66 64 93 88
20 59 52 84 77 54 47 79 74
22 43 39 78 73 40 37 74 70
24 27 25 66 60 26 24 62 56
For the flaming fire scenarios and smoke obscuration values from 2 %/ft to 10 %/ft, the success
rate ranged from 99 % to 27 %, and 87 % to 11 % for the no delay and 30 s delays cases,
respectively. The 30 s delay is equivalent to about a 3 %/ft to 6 %/ft obscuration increase to
achieve the same egress success rate. For the smoldering fire scenarios and smoke obscuration
values from 8 %/ft to 24 %/ft, the success rate ranged from 100 % to 26 %, and 100 % to 24 %
for the no delay and 30 s delays cases, respectively. In the smoldering scenarios, the 30 s delay
has very little impact on the smoke obscuration increase needed to achieve the same egress
success rate. This is due to the relatively slow smoke concentration build-up in the smoldering
fires
Since the simulated egress success rates are a function of egress scenarios (Table 2), occupant
characteristics (Table 3), optical density limits (Tables 4 - 6) and the experimental results, a
success rate averaged over the four occupant characteristic/optical density limit results was
used to characterize an averaged relative success rate for a given smoke obscuration
performance criterion. Averaging the normal-responding occupant group results and the
slower-to-react occupant group results yields an equal weighting of both groups in lieu of a
specific combined population distribution. An average of the results from the two optical
density limits (0.25 m-1 and 0.43 m-1) is an approximation of the mean smoke concentration limit
that starts to inhibit egress of more and less susceptible occupants, given their psychophysical
response to smoke.
It is asserted here that the performance criterion for flaming and smoldering fire test scenarios
should lead to nominally equal relative egress success rates to provide commensurate
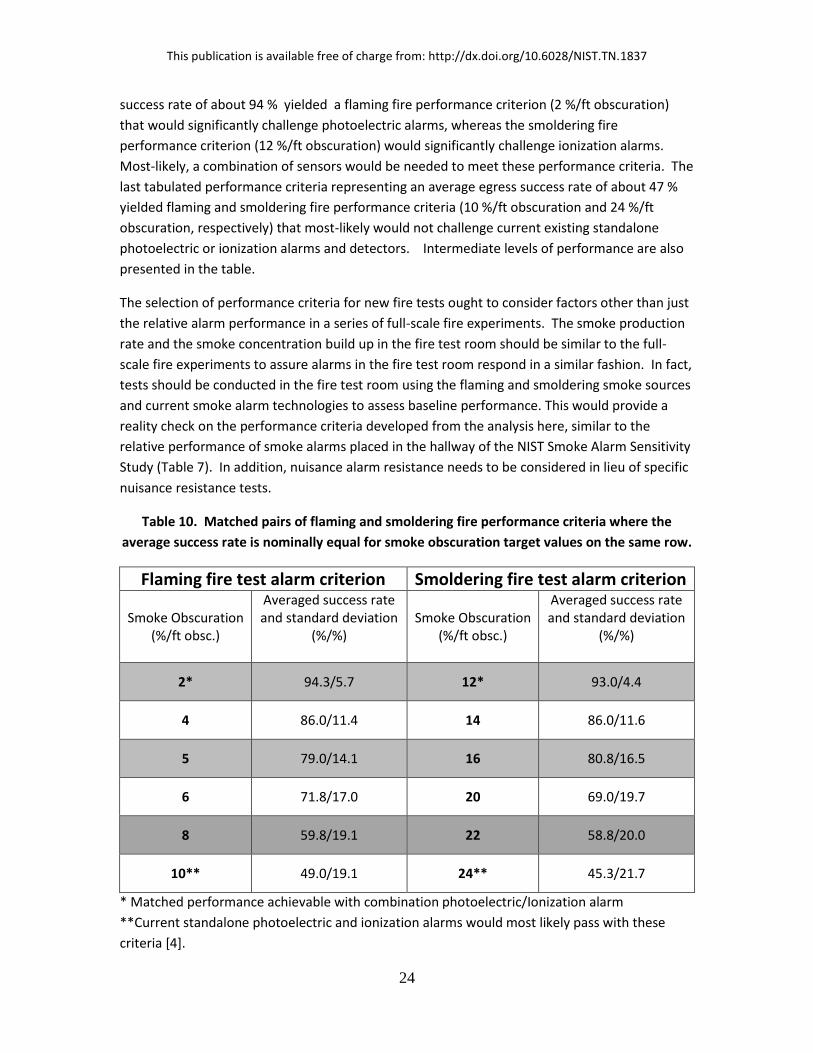
improvement in flaming and smoldering fire detection performance. Table 10 gives matched
pairs of flaming and smoldering fire performance criteria based on the averaged simulated
egress success rates. The first tabulated performance criteria representing an average egress
This publication is available free of charge from: http://dx.doi.org/10.6028/NIST.TN.1837
24
success rate of about 94 % yielded a flaming fire performance criterion (2 %/ft obscuration)
that would significantly challenge photoelectric alarms, whereas the smoldering fire
performance criterion (12 %/ft obscuration) would significantly challenge ionization alarms.
Most-likely, a combination of sensors would be needed to meet these performance criteria. The
last tabulated performance criteria representing an average egress success rate of about 47 %
yielded flaming and smoldering fire performance criteria (10 %/ft obscuration and 24 %/ft
obscuration, respectively) that most-likely would not challenge current existing standalone
photoelectric or ionization alarms and detectors. Intermediate levels of performance are also
presented in the table.
The selection of performance criteria for new fire tests ought to consider factors other than just
the relative alarm performance in a series of full-scale fire experiments. The smoke production
rate and the smoke concentration build up in the fire test room should be similar to the full-
scale fire experiments to assure alarms in the fire test room respond in a similar fashion. In fact,
tests should be conducted in the fire test room using the flaming and smoldering smoke sources
and current smoke alarm technologies to assess baseline performance. This would provide a
reality check on the performance criteria developed from the analysis here, similar to the
relative performance of smoke alarms placed in the hallway of the NIST Smoke Alarm Sensitivity
Study (Table 7). In addition, nuisance alarm resistance needs to be considered in lieu of specific
nuisance resistance tests.
Table 10. Matched pairs of flaming and smoldering fire performance criteria where the
average success rate is nominally equal for smoke obscuration target values on the same row.
Flaming fire test alarm criterion Smoldering fire test alarm criterion
Smoke Obscuration (%/ft obsc.)
Averaged success rate and standard deviation
(%/%)
Smoke Obscuration (%/ft obsc.)
Averaged success rate and standard deviation
(%/%)
2* 94.3/5.7 12* 93.0/4.4
4 86.0/11.4 14 86.0/11.6
5 79.0/14.1 16 80.8/16.5
6 71.8/17.0 20 69.0/19.7
8 59.8/19.1 22 58.8/20.0
10** 49.0/19.1 24** 45.3/21.7
* Matched performance achievable with combination photoelectric/Ionization alarm
**Current standalone photoelectric and ionization alarms would most likely pass with these
criteria [4].

This publication is available free of charge from: http://dx.doi.org/10.6028/NIST.TN.1837
25
6 CONCLUSIONS
An analysis methodology based on the ASET/RSET concept was used to estimate the relative
performance of smoke alarms designed to alarm at specific smoke concentrations in flaming and
smoldering polyurethane foam chair mock-up fires. The tenability limits were defined by a
fractional effective dose value of 0.3 for toxic gas and heat exposure, and two smoke optical
density limits used in previous studies, 0.25 m-1 and 0.43 m-1, were considered. Analysis
limitations and modeling assumptions included:
interconnected smoke alarms that alert occupants regardless of initial fire location,
occupant pre-movement time treated as a distribution for distinct populations,
travel speed as a function of smoke density,
occupants traversing a range of equally frequent pre-determined egress routes,
considering only one apartment-sized residential space,
one location for the responsive smoke alarm, and
three flaming and three smoldering scenarios, and a total of 18 full-scale tests.
Results were presented to provide guidance in selecting performance criteria for new
polyurethane foam fire tests proposed for ANSI/UL 217 and ANSI/UL 268. Averaged
performance criteria for flaming and smoldering fire tests were specified in matched pairs of
smoke concentrations representing commensurate relative performance improvements. The
matched pairs ranged from an egress success rate of about 47 % with little to no expected
improvement achieved by adding tests with these criteria to an egress success rate of about 94
%, representing the potential performance of combination photoelectric/ionization sensor
alarms. Other considerations including the smoke production rate of the smoldering and flaming
test samples and smoke transport in the fire test room may also likely affect the final
performance criteria for the new proposed tests. In addition, some level of resistance to
sources of nuisance alarms needs to be factored into the fire performance criteria.
Ultimately, the ANSI/UL 217 Standards Technical Panel or other regulatory bodies or standards
development organizations needs to make a judgment on the performance it would like to
achieve with the addition of the new tests.

This publication is available free of charge from: http://dx.doi.org/10.6028/NIST.TN.1837
26
7 REFERENCES
1 NFPA 72, National Fire Alarm and Signaling Code, 2013 Edition, National Fire Protection
Association, Quincy, MA (August, 2012).
2 ANSI/UL 217: Standard for Safety Single and Multiple Station Smoke Alarms,
Underwriters Laboratories Inc., Northbrook, IL, 2006.
3 ANSI/UL 268: Standard for Smoke Detectors for Fire Protective Signaling Systems, 6th
ed., Underwriters Laboratories Inc., Northbrook, IL, 2006.
4 Ahrens, Marty, “Smoke Alarms in U.S. Home Fires,” National Fire Protection Association,
1 Batterymarch Park, Quincy, MA 02169-7471, March 2014.
5 Bukowski, R. W., Peacock, R. D., Averill, J. D., Cleary, T. G., Bryner, N. P., Walton W. D.,
Reneke, P. A., and Kuligowski, E. D. Performance of Home Smoke Alarms, Analysis of the
Response of Several Available Technologies in Residential Fire Settings, Natl. Inst. Stand.
Technol., Tech. Note 1455-1 (2008).
6 Cleary, T.G., Results from a Full-Scale Smoke Alarm Sensitivity Study, Fire Technology,
May 2014, Vol. 50, Issue 3, pp 775-790 doi.org/10.1007/s10694-010-0152-2
7 Cleary, T.G., Performance of Dual Photoelectric/Ionization Smoke Alarms in Full-Scale
Fire Tests, Fire Technology, May 2014, Vol. 50, Issue 3, pp 753-773 doi.org/
10.1007/s10694-010-0147-z
8 Cleary, T.G., An Analysis of the Performance of Smoke Alarms, Fire Safety Science 10:
823-836, 2010. doi.org/10.3801/IAFSS.FSS.10-823
9 Ahrens, Marty, “U.S. Home Structure Fires,” National Fire Protection Association, 1
Batterymarch Park, Quincy, MA 02169-7471, April 2013.
10 Ahrens, Marty, “Home Fires that Began with Upholstered Furniture,” National Fire
Protection Association, 1 Batterymarch Park, Quincy, MA 02169-7471, August 2011
11 Evarts, B., “Home Fires That Began With Mattresses and Bedding,” National Fire
Protection Association, 1 Batterymarch Park, Quincy, MA 02169-7471, October 2011
12 Fabian, T.Z., and Gandhi, P.D., “Smoke Characterization Project: Technical Report," UL,
Northbrook, IL, April 2007.
13 Hirschler, M., “Comparison of the Propensity of Cigarettes to Ignite Upholstered
Furniture Fabrics and Cotton Ducks (500 Fabric Study),” Fire and Materials, Vol. 21, 123-
141, 1997.
14 BS 5852:2006 Methods of test for assessment of the ignitability of upholstered seating
by smouldering and flaming ignition sources, British Standards Institute.
15 Cleary, T.G., “Full-scale Residential Smoke Alarm Performance,” 14th International
Conference on Automatic Fire Detection, University of Duisburg-Essen, Duisburg,
Germany, 2009.
16 Kellogg, D. S., Waymack, B. E., McRae, D. D., Chen, P., and Dwyer, R. W., “Initiation of
Smoldering Combustion in Cellulosic Fabrics,” J. Fire Sciences, 16, 90-104 (1998)
This publication is available free of charge from: http://dx.doi.org/10.6028/NIST.TN.1837
27
17 Ohlemiller, T., “On the Criteria for Smoldering Ignition in the CFR 1632 Cigarette Test for
Mattresses,” NIST Technical Note 1601, 2008.
18 Cleary, T., Chernovsky, A., Grosshandler, W., and Anderson, M., Particulate Entry Lag in
Spot-type Smoke Alarms’ Fire Safety Science 6: 779-790. doi:10.3801/IAFSS.FSS.6-779
19 Fire Protection Handbook 20th Ed., A.E. Cote Ed., National Fire Protection Association,
Quincy, MA 2008.
20 HYDROGEN CYANIDE: METHOD 6010, Issue 2, NIOSH Manual of Analytical Methods
(NMAM), Fourth Edition, 8/15/94
21 Wang, Z., Jia, F. and Galea, E. R. (2011), A generalized relationship between the
normalized yields of carbon monoxide and hydrogen cyanide. Fire Mater., 35: 577–591.
doi: 10.1002/fam.1076
22 ISO 13571:2007, Life-threatening components of fire -- Guidelines for the estimation of
time available for escape using fire data.
23 Task Group on Smoke Detection Follow-up, a task group of the NFPA 72 Technical
Committee on Single- and Multiple-Station Alarms and Household Fire Alarm System,
July 1, 2009,
http://www.nfpa.org/~/media/Files/Research/NFPA%20reports/Fire%20Protection%20
Systems/Task%20Group%20on%20Smoke%20Detection%20Follow-
up%20Final%20Report%20July%202009.pdf
24 Bruck, D., and Horasan, M., “Non-arousal and Non-action of Normal Sleepers in
Response to a Smoke Detector Alarm,” Fire Safety Journal, 25, pp. 125-139,(1995).
25 Pearson, R. G., and Joost, M. G., “Egress Behavior Response Time of Handicapped and
Elderly Subjects to Simulated Residential Fire Situations.” National Bureau of Standards
(U. S.), NBS GCR 83-429, 1983.
26 Duncan, C., “The Effectiveness of the Domestic Smoke Alarm Signal,” School of
Engineering, University of Canterbury, Fire Engineering Research Report 99/5,
Christchurch, NZ, 1999.
27 Ashley, E., (2007) “Waking Effectiveness of Emergency Alerting Devices for the Hearing
Able, Hard of Hearing, and Deaf Populations” Dissertation, University of Maryland,
College Park, 25-Apr-2007 http://hdl.handle.net/1903/6802
28 Beaulieu, Norman C., Adnan A. Abu-Dayya, and Peter J. McLane., "Estimating the
distribution of a sum of independent lognormal random variables." Communications,
IEEE Transactions on Communications 43.12 (1995): 2869.
29 Jin, T., and Yamada, T., “Irritating Effects of Fire Smoke on Visibility”, Fire Science and
Technology, 5:1, pp. 79-89, 1985.