improving reliability by combining focused field studies
TRANSCRIPT

Improving Reliability by
Combining Focused Field
Studies and Advanced Modeling
Copyright © exida.com LLC 2000-2015 1

Abstract
• The performance of valves and other final elements have a significant impact on the operations and safety performance of a process plant. Establishing effective programs based on realistic performance expectations is necessary to balance both cost and risk. Cost drivers include equipment cost and maintenance cost while risk can come from health and safety concerns as well as equipment availability. Gathering trusted information that can help inform decisions related to these factors can prove challenging.
• This presentation will review the current methods available and present a comparison of the relative strengths and weaknesses. An analysis of functional failure modes, field studies, and the impact of application dependent stresses will be discussed. A proposed hybrid approach will be presented along with example data results and key learnings that can be drawn from them.
March 10, 2015 Copyright © exida.com LLC 2000-2015 2

Chris O’Brien
Chris O'Brien is a Partner with Exida Consulting. He has
over 25 years experience in the design, manufacturing and
marketing of process automation, reserve power systems,
and safety related equipment. He focuses on supporting
new and existing customers with their implementation of
the IEC 61508 and IEC 61511 functional safety standards
as well as reliability analysis for mechanical devices.
He was formerly Vice President of the Power Systems
Business Unit of C&D Technologies, a business that
specialized in the design and implementation of high
reliability back up power systems. Prior to that, he was
with Moore Products/Siemens Energy and Automation
where he held several positions including General
Manager of the Instrumentation Division.
Chris is the author of Final Elements and the IEC 61508
and IEC 61511 Functional Safety Standards and has been
awarded 5 patents, including a patent of the industry's first
safety rated pressure transmitter. He has a Bachelors of
Mechanical Engineering from Villanova University.
March 10, 2015 Copyright © exida.com LLC 2000-2015 3

Topics
• Getting Failure Rate Data
• Functional Failure Modes
• Field Reliability Studies
• Application Stress Considerations
• Proposed Hybrid Approach
March 10, 2015 Copyright © exida.com LLC 2000-2015 4

Getting Failure Data
• Industry Databases – OREDA Offshore Reliability Equipment Data Association
• Company / Group Failure Data Estimates – Committee meets and agrees of numbers to use
– What is included?
• Manufacturer Field Return Data Studies – Cannot know what percentage of actual failures are returned
– Different definition of “FAILURE” (Not a problem scenario)
• B10 Data – Based on cycle testing for mechanical / electro-mechanical products
– Assumes application has constant dynamic operation
• End User Field Failure Data Studies – A quality data gathering system can provide excellent site specific data
– Many existing systems are weak
• FMEDA – A predictive technique
– Uses a component database that accounts for design strength
5 Copyright © exida.com LLC 2000-2015

Industry Databases
• OREDA – Consortium of offshore companies, North Sea – Operated by DNV in Norway
– Data Analysis by SINTEF in Norway
• Provides useful data on process equipment
• SINTEF publishes PDS Data Handbook, a set of failure rate, failure mode and common cause factor estimates for use in Safety Instrumented Function verification calculations
• Kept up to date with latest public release in 2009 / 2010
• All realistic failures are included, Site and Product
6 Copyright © exida.com LLC 2000-2015

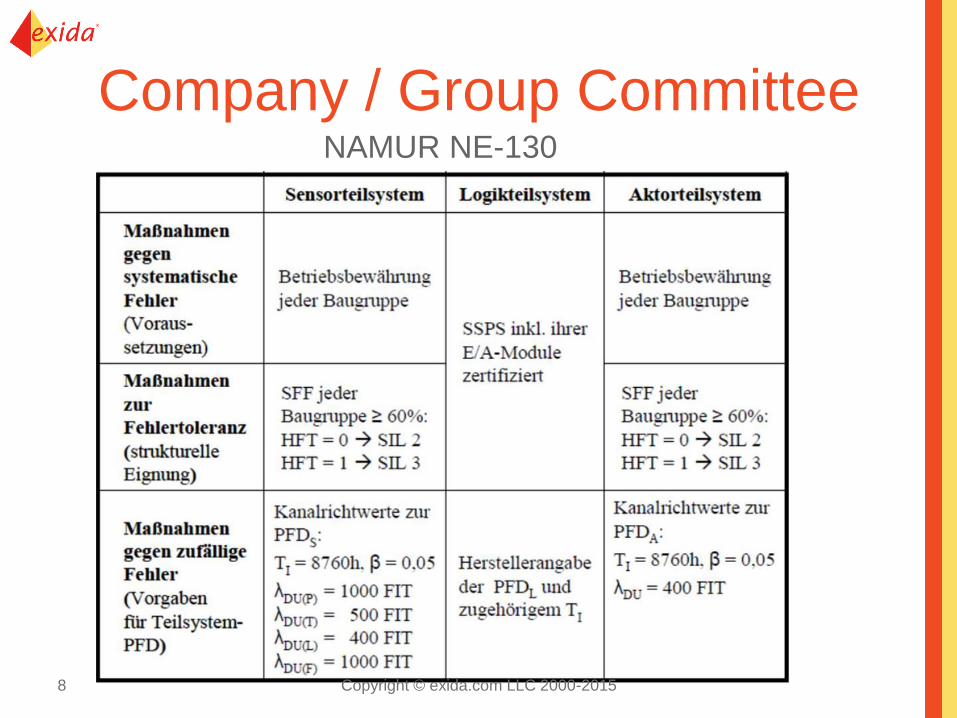
Company / Group Committee
• Typically experienced experts share their
memories of failure events and estimate
failure rates.
• Results may vary depending on specific
experience.
• But results can be valuable as an indicator
of opinion especially for comparison
purposes.
7 Copyright © exida.com LLC 2000-2015
Company / Group Committee
8
NAMUR NE-130
Copyright © exida.com LLC 2000-2015

Manufacturer Field Return Studies
• Manufacturer Field Return Data Studies – PLUS: Real Data
– MINUS:
– Cannot know what percentage of actual failures are returned
– Different definitions of “FAILURE” (Not a problem scenario)
• Many manufacturers classify returned items as a “failure” only if a manufacturing defect is found.
• Many returned items are marked “no problem found.”
• In some calculations operational hours are estimated based on shipping records and it is assumed that all failures are returned.
• The data can be valuable to identify root causes and compare to establish upper/lower bounds on failure rates.
9 Copyright © exida.com LLC 2000-2015

B10 Data
• Not suitable for all uses of failure rate information.
• B10 data is derived from a cycle test of a mechanical / electro-mechanical product.
• Failure rate is calculated based on 10% failures in the B10 time period.
• B10d (dangerous failure rate) is half that number based on the assumption that 50% of the failures are dangerous.
• The B10 method assumes that the constant failure rate during the useful life is due to premature wear-out where other failure modes are insignificant.
• Research shows other failure modes become significant when these products do not move frequently – some failure modes become significant if a product is static for 24 hours.
Copyright © exida.com LLC 2000-2015 10

End User Field Failure Studies
• MINUS: Variations of amount of data collected: – Different definitions of “FAILURE”
– Categorizing and Merging Technologies
– Lack of fault isolation
• After performing dozens of studies exida experience recognized that the data collection process varies by an order of magnitude or more! – When is a failure report written?
– What is the definition of failure?
– Are "as found" conditions recorded during a proof test?
– What were the operating conditions?
– Use of new data collection software can improve failure data availability
11 Copyright © exida.com LLC 2000-2015
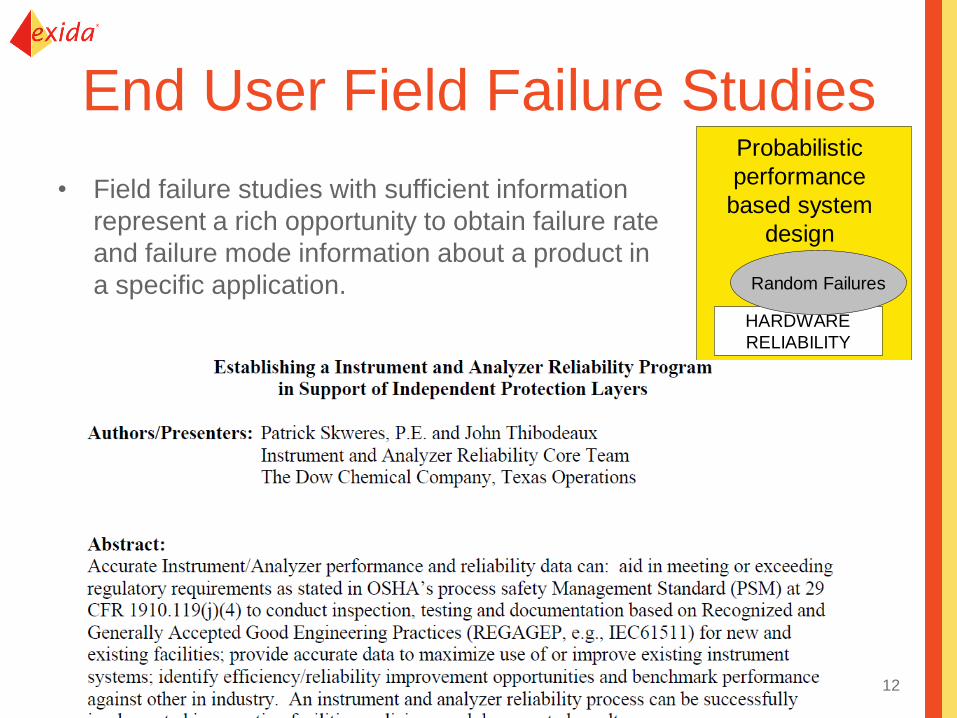
End User Field Failure Studies
• Field failure studies with sufficient information
represent a rich opportunity to obtain failure rate
and failure mode information about a product in
a specific application.
12
Probabilistic
performance
based system
design
HARDWARE
RELIABILITY
Random Failures

Getting Failure Data
• Industry Databases – OREDA Offshore Reliability Equipment Data Association
• Company / Group Failure Data Estimates – Committee meets and agrees of numbers to use
– What is included?
• Manufacturer Field Return Data Studies – Cannot know what percentage of actual failures are returned
– Different definition of “FAILURE” (Not a problem scenario)
• B10 Data – Based on cycle testing for mechanical / electro-mechanical products
– Assumes application has constant dynamic operation
• End User Field Failure Data Studies – A quality data gathering system can provide excellent site specific data
– Many existing systems are weak
• FMEDA – A predictive technique
– Uses a component database that accounts for design strength
13 Copyright © exida.com LLC 2000-2015

Getting Failure Data
• Industry Databases – OREDA Offshore Reliability Equipment Data Association
• Company / Group Failure Data Estimates – Committee meets and agrees of numbers to use
– What is included?
• Manufacturer Field Return Data Studies – Cannot know what percentage of actual failures are
returned
– Different definition of “FAILURE” (Not a problem scenario)
• End User Field Failure Data Studies – A quality data gathering system can provide excellent site
specific data
– Many existing systems are weak
14 Copyright © exida.com LLC 2000-2015

FMEDA Approach
• Failure Modes, Effects, & Diagnostics Analysis (FMEDA) Concept
• Gathering enough failure statistics at the product level has not
happened – failure causes, failure modes, etc. are mixed together in
failure reports.
• Therefore – Develop a predictive model that analyzes a product
design strength to predict field failure performance.
15 Copyright © exida.com LLC 2000-2015

FMEDA
• Using a component database, failure rates and failure modes for a product (transmitter, I/O module, solenoid, actuator, valve) can be determined for any given design as a function of operating environment.
16
FMEDA
COMPONENT
DATABASE
Component
λ’ s
Failure Mode
Distribution
Product
Failure
Modes
Product λ
Diagnostic
Coverage
Study of Design
Strength
Copyright © exida.com LLC 2000-2015

FMEDA Results
• Detailed
• Specific
• All failure modes
17 Copyright © exida.com LLC 2000-2015

FMEDA – Biggest Negative
The accuracy of the FMEDA method depends of the accuracy of the component database. It must include failure rates and failure mode distributions of each component as a function of operating profile. The useful life of each component should also be listed as a function of operating profile.
18
FMEDA
COMPONENT
DATABASE
Component
λ’ s
Failure Mode
Distribution
Product
Failure
Modes
Product λ
Diagnostic
Coverage
Copyright © exida.com LLC 2000-2015

Calibrates
Detail Design
Information •Components Used
•Stress Factors
•Application Environment
Field
Failure
Data
FMEDA
Analysis Used In
FMEDA
Results
ls lD
Compare Product
Level Failure
Rates per Mode
Public Component
Failure Database
Explain Differences Adjust as needed
Root Cause
Analysis
150 billion unit hours of field
failure data from process
industries
Useful Life
Therefore the component database must be based on and
calibrated by FIELD FAILURE DATA.
19 Copyright © exida.com LLC 2000-2015

Functional Failure Modes
Copyright © exida.com LLC 2000-2015 20

Field Reliability Studies
• Random Failures
– A failure occurring at a random time, which results
from one or more degradation mechanisms.
• Systematic Failures
– A failure related in a deterministic way to a certain
cause, which can only be eliminated by a modification
of the design or of the manufacturing process,
operational procedures, documentation, or other
relevant factors.
Consistent Interpretation?
Copyright © exida.com LLC 2000-2015
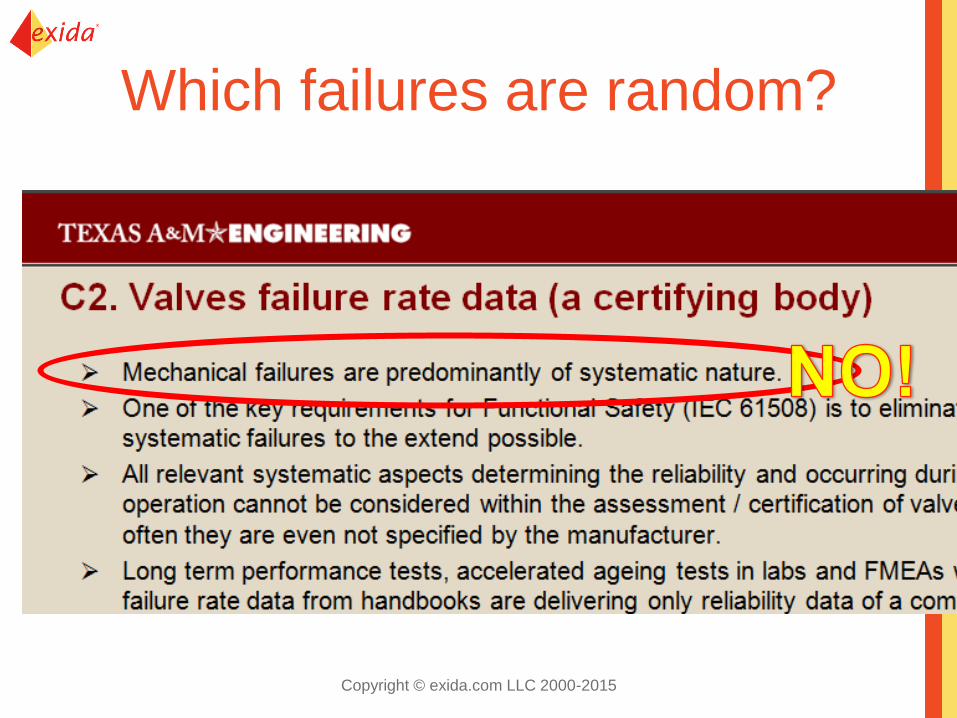
Which failures are random?
Copyright © exida.com LLC 2000-2015
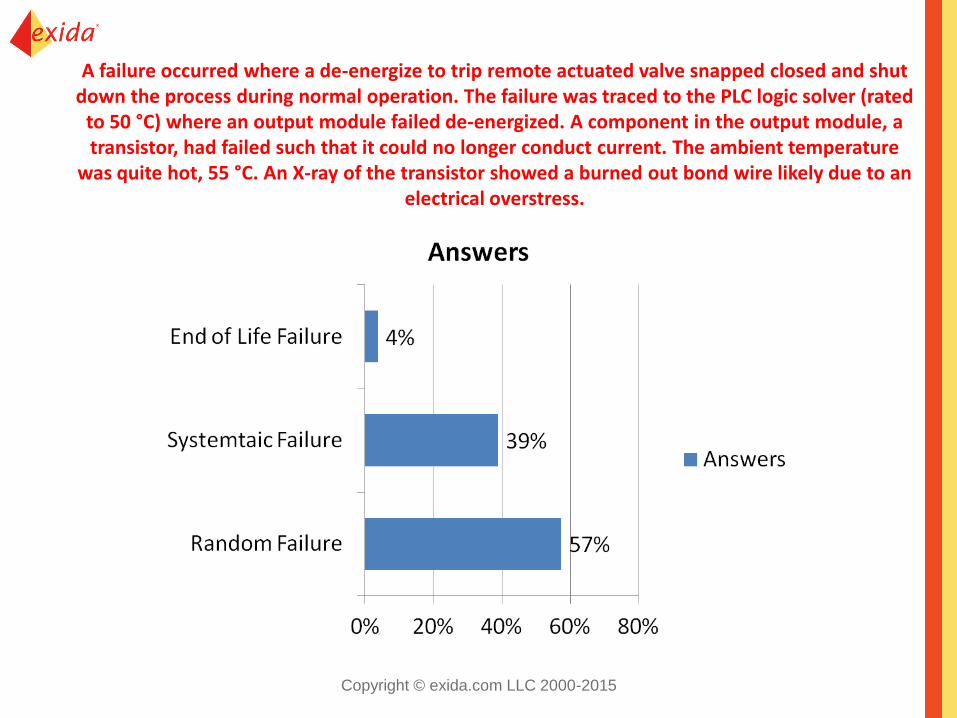
A failure occurred where a de-energize to trip remote actuated valve snapped closed and shut down the process during normal operation. The failure was traced to the PLC logic solver (rated
to 50 °C) where an output module failed de-energized. A component in the output module, a transistor, had failed such that it could no longer conduct current. The ambient temperature
was quite hot, 55 °C. An X-ray of the transistor showed a burned out bond wire likely due to an electrical overstress.
Copyright © exida.com LLC 2000-2015
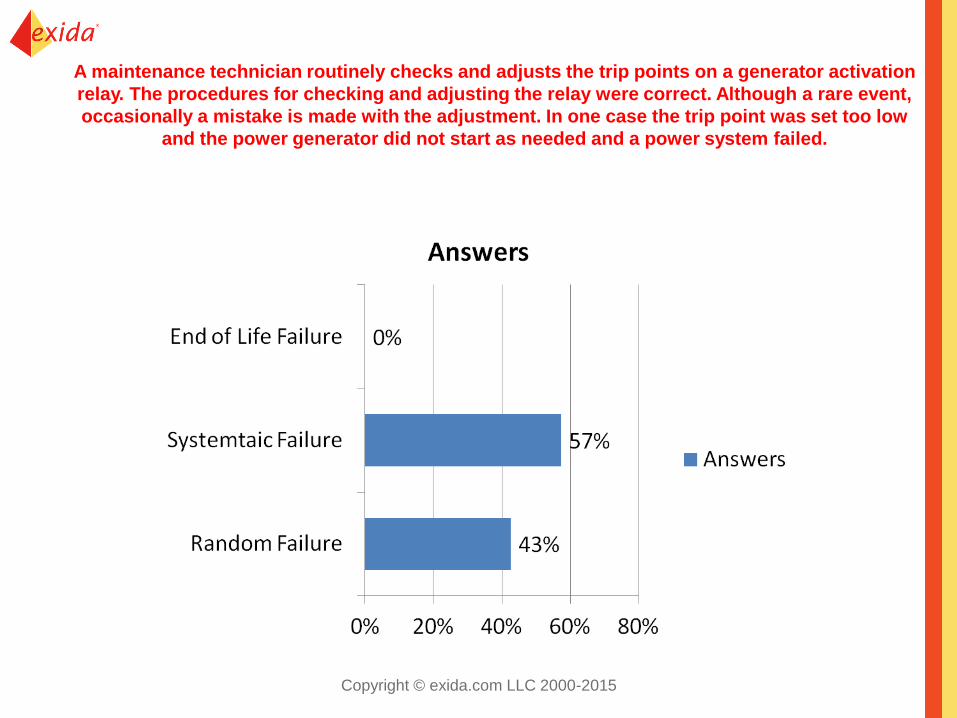
A maintenance technician routinely checks and adjusts the trip points on a generator activation
relay. The procedures for checking and adjusting the relay were correct. Although a rare event,
occasionally a mistake is made with the adjustment. In one case the trip point was set too low
and the power generator did not start as needed and a power system failed.
Copyright © exida.com LLC 2000-2015

After four years in a hot environment (35 °C), a solenoid valve burned out. The
solenoid coil was continuously energized and designed as de-energize to trip. The
valve which was open during normal process operation closed as a result of the
solenoid coil burnout causing a process unit to shut down.
Is this
spelling
error a
systematic
failure or a
random
failure?
Copyright © exida.com LLC 2000-2015

Application Stress Considerations
Copyright © exida.com LLC 2000-2015 26

Failures: Product vs. Site
• During a detailed study of field returns at Moore Products in the late 1980s we discovered that the return rate for the same module type was 4X different from one site to another!
• Why? Some failures result from product attributes and some failures result from site specific attributes.
• After a visit to the worst site, two clear systematic issues were identified. After resolution, the ratio of best to worst almost 2X.
Copyright © exida.com LLC 2000-2015

Failures: Product vs. Site
Product Failures A failure due to:
Site Specific Failures A failure due to:
• design flaw
• documentation error
• manufacturing process flaw
• etc.
RANDOM SYSTEMATIC
• product selection process
• product test procedure flaw
• product calibration procedure error
• etc.
• maintenance error
• testing, calibration error
• unexpected stress event
• etc.
RANDOM? SYSTEMATIC
• manufacturing defect
• unexpected stress event
• random support equipment failure
• etc.
Copyright © exida.com LLC 2000-2015

Product Failures A failure due to:
Site Specific Failures A failure due to:
• design flaw
• documentation error
• manufacturing process flaw
• etc.
• manufacturing defect
• unexpected stress event
• random support equipment failure
• etc.
RANDOM SYSTEMATIC
• product selection process
• product test procedure flaw
• product calibration procedure error
• etc.
• maintenance error
• testing, calibration error
• unexpected stress event
• etc.
RANDOM SYSTEMATIC
NOT A FAILURE
Typical Manufacturer View – not all failures are due to product
attributes and should not be part of a product failure rate.
Failures: Product vs. Site
Copyright © exida.com LLC 2000-2015

Failures: Product vs. Site
Product Failures A failure due to:
Site Specific Failures A failure due to:
• design flaw
• documentation error
• manufacturing process flaw
• etc.
• manufacturing defect
• unexpected stress event
• random support equipment failure
• etc.
RANDOM SYSTEMATIC
• product selection process
• product test procedure flaw
• product calibration procedure error
• etc.
• maintenance error
• testing, calibration error
• unexpected stress event
• etc.
RANDOM SYSTEMATIC
exida View – while exida agrees that all real failures must be included
in a PFH/PFDavg calculation, these are modeled differently.
FMEDA
Maintenance Capability Copyright © exida.com LLC 2000-2015

Proposed Hybrid Approach
Copyright © exida.com LLC 2000-2015 31

Proposed Hybrid Approach
• FMEDA sets base failure rate for “typical”
– Publish minimum, maximum rates
• Publish failures according to Functional
Failure Modes
• Develop factors for application stress, site
capability
• Refine with actual plant data after it is
collected and analyzed
32 Copyright © exida.com LLC 2000-2015

•USE DESIGN STRENGTH KNOWLEDGE from actual products
and
•Accumulated/Validated Field Failure History
Field
Failure
Data
FMEDA ELEC./MECH.
COMPONENT
DATABASE
FMEDA
FMEDA
FMEDA
FMEDA
FMEDA
FMEDA
Design
Knowledge
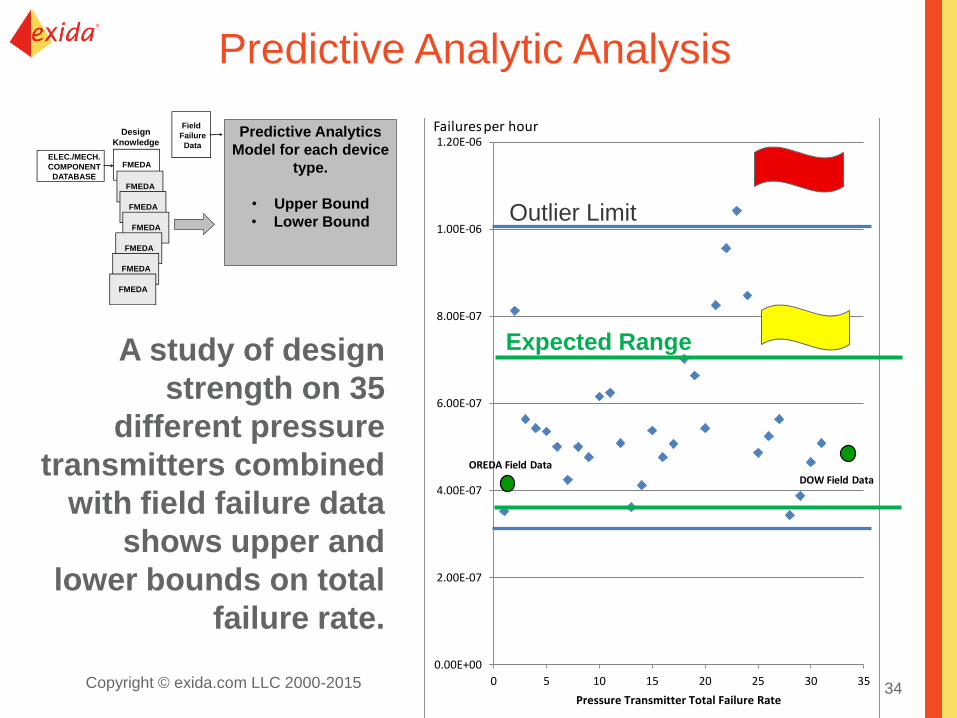
Predictive Analytics Model
for each device type.
• Upper Bound
• Lower Bound
Predictive Analytic Analysis
Copyright © exida.com LLC 2000-2015 33
Field
Failure
Data
FMEDAELEC./MECH.
COMPONENT
DATABASE
FMEDA
FMEDA
FMEDA
FMEDA
FMEDA
FMEDA
Design
KnowledgePredictive Analytics
Model for each device
type.
• Upper Bound
• Lower Bound
0.00E+00
2.00E-07
4.00E-07
6.00E-07
8.00E-07
1.00E-06
1.20E-06
0 5 10 15 20 25 30 35
Pressure Transmitter Total Failure Rate
Failures per hour
OREDA Field Data
DOW Field Data
A study of design
strength on 35
different pressure
transmitters combined
with field failure data
shows upper and
lower bounds on total
failure rate.
Expected Range
Outlier Limit
Predictive Analytic Analysis
Copyright © exida.com LLC 2000-2015 34
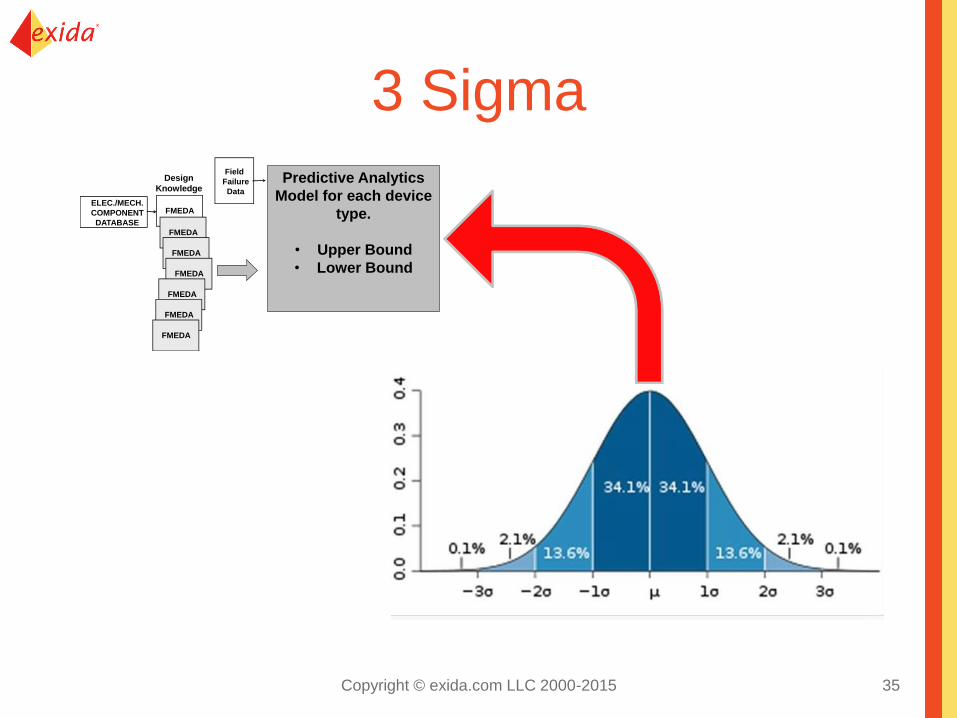
3 Sigma
35
Field
Failure
Data
FMEDAELEC./MECH.
COMPONENT
DATABASE
FMEDA
FMEDA
FMEDA
FMEDA
FMEDA
FMEDA
Design
KnowledgePredictive Analytics
Model for each device
type.
• Upper Bound
• Lower Bound
Copyright © exida.com LLC 2000-2015

Predictive Analytics
Model for each device
type.
• Upper Bound
• Lower Bound
Field
Failure
Data
Statistical
Analysis (1) Compare
Results
Study Data
Collection
Process and
Failure
Categories
OK
?
Out of
Range
(1) Statistical Signature Analysis:
Modeling Complex λd(t) from
Proof Test Data and the Effects on
Computing PFDavg, Julia V.
Bukowski, Ph. D., www.exida.com
Issues in the data collection
process can be detected and
resolved.
The predicted l bounds are used to compare estimated l
from a set of field failure data. Results that are out of range
indicate further analysis is needed.
Field Failure
Database
Predictive Analytic Analysis
Copyright © exida.com LLC 2000-2015 36
Key Takeaways
• The source and method used to generate data is necessary to make informed decisions on how to use it.
• The intended application of the data should impact the method and rigor applied.
• Increased adherence to standards such as IEC 61511 will make more data available.
• The ability to test the fit of smaller sets of data against a large data set will increase analysis speed.
• These smaller sample sizes can provide valuable information on application issues to further improve the data model.
37 Copyright © exida.com LLC 2000-2015

excellence in dependable automation
March 10, 2015 Copyright © exida.com LLC 2000-2015 38