improving pedestrian access across arterial...
TRANSCRIPT

IMPROVING PEDESTRIAN ACCESS ACROSS ARTERIALROADS
Neil HutchinsonDepartment of Transport, Victoria, Australia
INTRODUCTIONA critical building block of a functional successful city is the presence of vibrant streets; streets that encouragewalking. The level of pedestrian activity is an indicator of a great street as well as economic viability and isoften used in determining rental values for retail premises. Walking creates a healthy population and isreflective of a liveable city. Walking is also critical to the overall effectiveness of a transport system, supportingevery public transport trip and a lot of private vehicle trips.
For decades traffic engineering and planning in Australian cities has focused on and invested inimprovements to roadways, with the singular objective of moving vehicle traffic. An incremental shift towardsthe implementation of broader integrated transport objectives has started to occur. This shift is partly inrecognition that building roads can not solve traffic congestion and that roads have a large influence on theoverall fabric and function of cities. The complex challenge of balancing the needs of different road users willbecome more complicated as Australia continues to become more urbanised (Vallyon, et al 2009).
Even with policy beginning to shift in support of walking, it is still under-represented in transport projects anddesigns are still leading to poor outcomes for pedestrians (Hess, 2009). While this is partly due to the size ofthe task to assess and modify roads to support all modes, there is more that can be done to provide goodeffective examples of interventions to support walking to help this process. These ideas are not new in termsof urban design and town planning (Jacobs J., 1961 and Utermann R, 1984) but more comprehensive changecould be achieved if they were incorporated into traffic engineering practices.
This challenge has started to be reflected in the changing terminology in traffic engineering practice.Recognition of the wider role of streets is evidenced in the UK Manual for Street (DFT, 2007) and locally inSmartRoads (VicRoads, 2010). Frameworks such as level of service have started to evolve and expand intoideas around streets providing a dual role as a Link for through movement and a Place as a destination in itsown right (Jones et al, 2007), or broader provision for all users in Complete Streets(http://www.completestreets.org/). The link between transport and land use has also been recognised and isa major input into Network Operating Plans under the VicRoads SmartRoads framework.
Creating direct and connected local walking network is the basic building block to start to increase walking.Physical barriers such as rivers, freeways and even railway lines are well recognised as impeding levels ofwalking activity. However, walking levels are more likely to be constrained by the ‘barrier effect’ resulting from“the delays and reduced access that vehicle traffic imposes on pedestrians’ (PWC, 2011). It is often causedby arterial roads which are prevalent in urban areas.
PAPER STRUCTURE AND METHODSThe barrier effect is the focus of this paper. This paper starts with a short discussion of the lessons learnt fromproject interventions that sought to improve access across arterial roads through grade separation(underpasses) and the provision of wide raised traffic medians. Following this discussion the paper considershow signalised intersections (segregation of pedestrian and vehicles in time to provide safe crossing) can beimproved to increase access. A range of metropolitan Melbourne projects are examined to contribute to theunderstanding of the effectiveness of these three interventions to encourage walking by improving safety andcomfort.
This paper builds on literature through the review of project experiences in metropolitan Melbourne deliveredas part of the Victorian Department of Transport’s Local Area Access Program (LAAP). As part of the LAAPgrants, successful applicants’ were required to complete pre and post evaluation. This evaluation was often amixture of quantitative and qualitative activities that were focused on project outcomes. Table 1 presents theevaluation undertaken for each of the projects discussed in the body of the paper.
As each of the individual projects was evaluated separately the results are difficult to compare. While someprojects were evaluated rigorously, including the use of statistical techniques, other evaluation data can onlyprovide an indication of outcomes that are likely to have been achieved. The small size of these projects andtheir isolated nature these indicative results are helpful in validating some conventional wisdom and provide
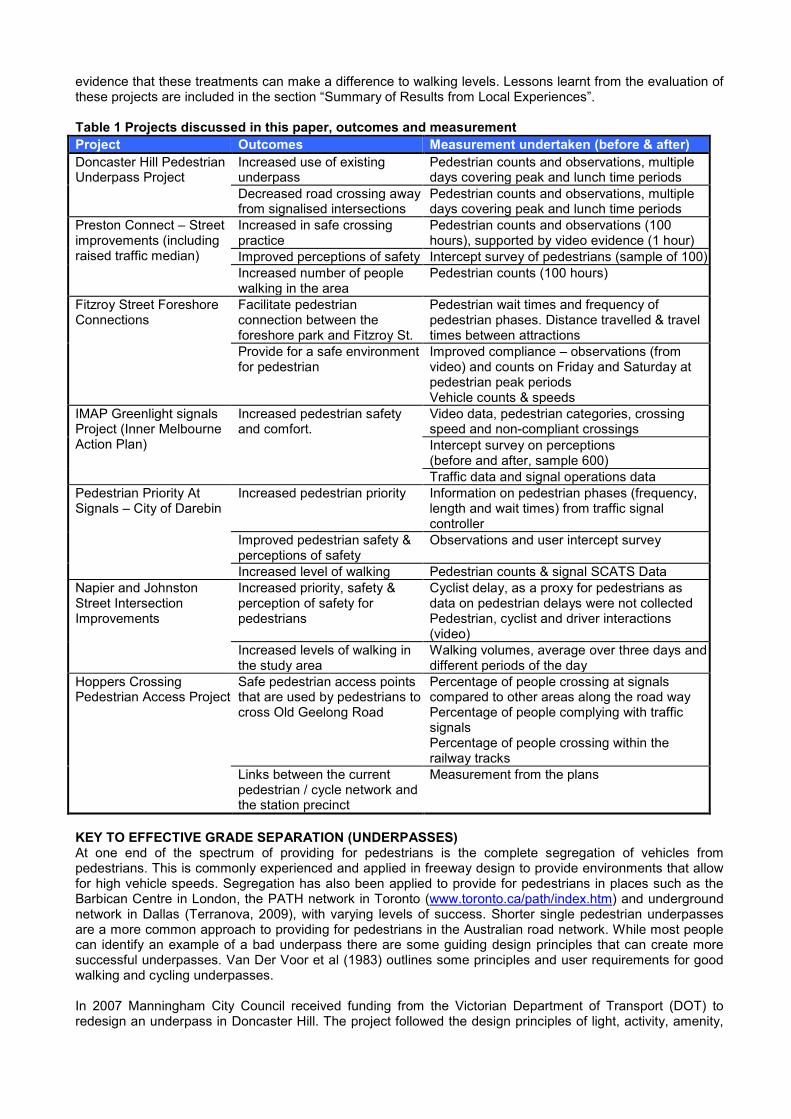
evidence that these treatments can make a difference to walking levels. Lessons learnt from the evaluation ofthese projects are included in the section “Summary of Results from Local Experiences”.
Table 1 Projects discussed in this paper, outcomes and measurementProject Outcomes Measurement undertaken (before & after)Doncaster Hill PedestrianUnderpass Project
Increased use of existingunderpass
Pedestrian counts and observations, multipledays covering peak and lunch time periods
Decreased road crossing awayfrom signalised intersections
Pedestrian counts and observations, multipledays covering peak and lunch time periods
Preston Connect – Streetimprovements (includingraised traffic median)
Increased in safe crossingpractice
Pedestrian counts and observations (100hours), supported by video evidence (1 hour)
Improved perceptions of safety Intercept survey of pedestrians (sample of 100)Increased number of peoplewalking in the area
Pedestrian counts (100 hours)
Fitzroy Street ForeshoreConnections
Facilitate pedestrianconnection between theforeshore park and Fitzroy St.
Pedestrian wait times and frequency ofpedestrian phases. Distance travelled & traveltimes between attractions
Provide for a safe environmentfor pedestrian
Improved compliance – observations (fromvideo) and counts on Friday and Saturday atpedestrian peak periodsVehicle counts & speeds
IMAP Greenlight signalsProject (Inner MelbourneAction Plan)
Increased pedestrian safetyand comfort.
Video data, pedestrian categories, crossingspeed and non-compliant crossingsIntercept survey on perceptions(before and after, sample 600)Traffic data and signal operations data
Pedestrian Priority AtSignals – City of Darebin
Increased pedestrian priority Information on pedestrian phases (frequency,length and wait times) from traffic signalcontroller
Improved pedestrian safety &perceptions of safety
Observations and user intercept survey
Increased level of walking Pedestrian counts & signal SCATS DataNapier and JohnstonStreet IntersectionImprovements
Increased priority, safety &perception of safety forpedestrians
Cyclist delay, as a proxy for pedestrians asdata on pedestrian delays were not collectedPedestrian, cyclist and driver interactions(video)
Increased levels of walking inthe study area
Walking volumes, average over three days anddifferent periods of the day
Hoppers CrossingPedestrian Access Project
Safe pedestrian access pointsthat are used by pedestrians tocross Old Geelong Road
Percentage of people crossing at signalscompared to other areas along the road wayPercentage of people complying with trafficsignalsPercentage of people crossing within therailway tracks
Links between the currentpedestrian / cycle network andthe station precinct
Measurement from the plans
KEY TO EFFECTIVE GRADE SEPARATION (UNDERPASSES)At one end of the spectrum of providing for pedestrians is the complete segregation of vehicles frompedestrians. This is commonly experienced and applied in freeway design to provide environments that allowfor high vehicle speeds. Segregation has also been applied to provide for pedestrians in places such as theBarbican Centre in London, the PATH network in Toronto (www.toronto.ca/path/index.htm) and undergroundnetwork in Dallas (Terranova, 2009), with varying levels of success. Shorter single pedestrian underpassesare a more common approach to providing for pedestrians in the Australian road network. While most peoplecan identify an example of a bad underpass there are some guiding design principles that can create moresuccessful underpasses. Van Der Voor et al (1983) outlines some principles and user requirements for goodwalking and cycling underpasses.
In 2007 Manningham City Council received funding from the Victorian Department of Transport (DOT) toredesign an underpass in Doncaster Hill. The project followed the design principles of light, activity, amenity,

clearer access lines, and visibility. The project changed the layout of the entrance on the northern side andadded canopies to highlight the underpass’s existence. Within the underpass an art-based lighting projectwas installed to improve the amenity and visibility (Fig. 1).
Figure 1 Inside the Doncaster Hill underpass before and after photos
Council reported that the post implementation counts indicated an overall increase in the number of peopleusing the underpass, particularly primary school children, mostly accompanied by parents, in the morning andafternoons. However, counts also recorded an increase in the number of pedestrians crossing at ground leveloutside of the signalised pedestrian crossings throughout the days. Much of this increase was attributed toworkers’ 'coffee-runs'. Council concluded that it will be necessary to look at landscaping (or other) barriertreatments along the centre median in this location, to encourage greater use of the underpass and thesignalised pedestrian crossing.
This example illustrates that in an urban arterial road environment there are often many local destinations andmany opportunities to cross (created by down stream traffic signals) for an underpass to be extensively used.An underpass option should therefore only be considered in urban arterial road environments where;
traffic volumes are very high and flow is continuous its presence is supported by topography there are large numbers of young children there is only a singular destination or path there are existing street level barriers to reinforce the underpasses use.
RAISED TRAFFIC MEDIANS AS A SAFE CROSSINGRaised traffic medians are often provided to support traffic flow (through the removal of U turns) and provideincreased safety through segregation of oncoming traffic (Leong, 1970). Traffic medians can also providebetter access for pedestrians by making crossing easier. This is because traffic medians allow people to breaktheir crossing into two parts and therefore focus on one direction of traffic at a time. This increases their abilityidentify safe breaks in traffic and shortens crossing distances.
DOT funded the Preston Connect Project to provide 3.8 wide raised traffic medians to facilitate improvedaccess for pedestrians. These wide medians were installed in combination with wider bike lanes anddedicated turning lanes on Cramer Street, Preston. These treatments were intended to increase safety forpedestrians and cyclist while increasing access to the many local destinations, including the Preston Market.Post-implementation observations showed that on average 63% of pedestrians crossing Cramer Street usedthe medians. The rate of use varied significantly from location to location and was lower than desired. On theother hand, on a sliding scale of 0 to 10, where 10 is very unsafe, pedestrians rated Cramer Street an averageof 6.7 prior to improvements and 4.9 after improvements. Fig 2 shows the range of the responses to thisquestion before and after the works. This distribution of respondents highlights the significant achievement ofthis project in terms of perceived improvements to the pedestrian safety, even if not all pedestrians used themedians. Perceived improvements are also supported by an increase in pedestrian activity along CramerStreet of 288 people or 10% over a year. Not all of this increase can be attributed to the raised traffic mediansas other works were completed at the same time.

Pedestrians
0%
5%
10%
15%
20%
25%
30%
0 1 2 3 4 5 6 7 8 9 10 Can'tSay
Scale (0 not at all dangerous - 10 extremely dangerous)
% o
f res
pons
es
Pre survey
Post survey
Figure 2 Pedestrians’ perceptions of safety on Cramer Street (Pre N= 192 post N= 183)
This project demonstrated that traffic medians should be designed to accommodate pedestrians andincorporating pram crossings as they can improve pedestrian access and safety. The provision of mediansneeds to balance against the needs of other road users. The introduction of wide medians in Cramer StreetPreston did reduce the number of traffic lanes from 4 to 2 (plus dedicated turning lanes) and drivers haveexperienced some increases in congestion and travel time. Also it is important not to trade-off other, possiblymore important, pedestrian and cyclist facilities like wider footpaths or bicycle lanes which improve safety andconnectivity. While raised traffic medians may not be applicable in all cases they certainly have greaterpotential in areas where multiple attractors exist on either side of the road, such as in strip shopping centres.
SIGNAL BASED PROJECTS
Summary of Local Projects that Involved Signal ChangesThrough DOT’s Local Area Access Program five projects were funded that aimed to improve safety andconvenience for pedestrians at identified signalised crossings. The IMAP (Inner Melbourne Action Plan)Greenlight Project was the biggest of the four projects. This project looked at changes in pedestrian behaviourand perceptions at 24 study sites, 20 of which had changes to signal operations while four were used ascontrol sites. The range of initiatives for the IMAP project is summarised in Table 2.
Table 2 Description of signal treatments completed as part of the IMAP Greenlight Project
Source: Booz and Co, 2011

A similar project, Pedestrian Priority at Signals, was undertaken by the City of Darebin with DOT funding,where a further 5 sites had signal modifications. The Darebin project implemented many of the sametreatments as the IMAP Greenlight Project except in Darebin pedestrian head-starts were also implemented.This treatment allows pedestrians to get established in the intersection before the green phase for vehicles.This treatment is believed to increase pedestrian safety, especially against turning vehicle movements, asvisibility of pedestrians is enhanced. This section of the paper focuses on the combined results from the IMAPGreenlight and Pedestrian Priority at Signals (Darebin) projects. For both projects a full list of sites and thetreatments that were implemented is included in Appendix 1.
Three individual intersections projects were funded by DOT and are also discussed in this section: Fitzroy Street Foreshore Connections Project - major changes were made to traffic movements to
reduce traffic volume and speed around a very highly patronised tram stop in the heart of the FitzroyStreet shopping and entertainment precinct.
Napier Street and Johnston Street Intersection Project - a mid block pedestrian operated signal wasmoved to a nearby side street.
Hoppers Crossing Pedestrian Access Project - signals were installed either side of the train line tocreate safer movement of people to the train station. This project involved moving a pedestrianoperated signal 80m, to a location parallel with the level crossing.
Effects of Individual Changes to Signal OperationsFrom the IMAP Greenlight project the strongest and statistically proven finding was the relationship betweenclearance time given to pedestrians and their walking speed. Pedestrian speed was suggested to be inverselyrelated to clearance time. On average every one-second increase in clearance time led to a 0.02m/s decreasein pedestrian speed on average (Booz and Co, 2011). Increases to clearance times helped to make peoplefeel safer crossing the intersections. Intersections receiving this treatment as part of the IMAP GreenlightProject showed respondents’ feeling of safety increasing by 24%. None of the sites in the Darebin project hadclearance times increased.
A study of walking speeds in Canada found that crossing speeds are faster than normal walking speeds andthat there is significant difference in walking speeds amongst different age groups (Montufar et al 2007). Thisis supported by the IMAP Greenlight finding where the median walking speed of adults was 1.57m/s andthose using mobility aids were as low as 1.1m/s. As Fig. 3 illustrates, this is important when setting standardgreen time and clearance time. It is worth noting that even if the 10th slowest percentile walking speed foradults is used, most people with mobility aids (other than wheel chairs) will not be able to complete thecrossing in the allocated time. Montufar et al (2007) suggests that, based on the normal walking speeds ofpeople over the age of 65, design speeds should be set at 0.91m/s, thereby increasing the proportion ofpedestrians who would complete the crossing to 80%. Currently the Victorian standards use a design speedof 1.2m/s for calculating the green time and 1.5m/s to calculate the clearance time. Clearance times shouldtherefore be adjusted to be based on slower walking speeds where pedestrians are prioritised.
Figure 3 Crossing Speeds by Category (Source: Booz and Co, 2011)
PUFFINS were specifically developed to help reduce the instances of a person not completing the crossingwithin the allocated time. PUFFINS work by identifying people within the crossing by using infrared rays. If aperson is still in the crossing the signal controller extends the clearance time. Based on Fig. 3, PUFFINSshould be installed wherever high numbers of elderly, or people with mobility aids, are expected. They canalso help in locations where large groups of people are wishing to cross together in the one signal phase,such as schools and Walking School Buses routes or around major attractions that have high group-visitornumbers. PUFFINS were installed at three locations in the IMAP Greenlight Project and at one other site aspart of Darebin project. The sites that were evaluated as part of the IMAP Greenlight Project showed a 12%decrease in non-compliant crossing. However, average wait time was significantly increased, by 5.5 seconds.Unfortunately counts were not collected for the number of people that did not manage to complete thecrossing in the allocated time.
‘Late’ and ‘auto introduction’ are hypothesised to reduce the time a pedestrian has to wait at an intersection.Auto introduction is often argued for by pedestrians on the basis that they should not have to ask permissionto cross (Henman, 2010). However, from a traffic-flow perspective they can decrease the movement ofvehicles, especially turning vehicles. Evaluation of the IMAP Greenlight Project showed that the provision oflate introduction for pedestrian phases decreased the instances of people crossing against the red man by16%, and the proportion of people who reported feeling safe increased by 21%. Decreased crossing speedswere also experienced, while wait times increased slightly, by 1.8 seconds on average. Surprisingly, similarresults were not experienced at locations where auto introduction was employed. However, the provision ofauto introduction could have had some impact on improved compliance at the Darebin intersection of Edwardand Spring Streer. This is discussed in the next section.
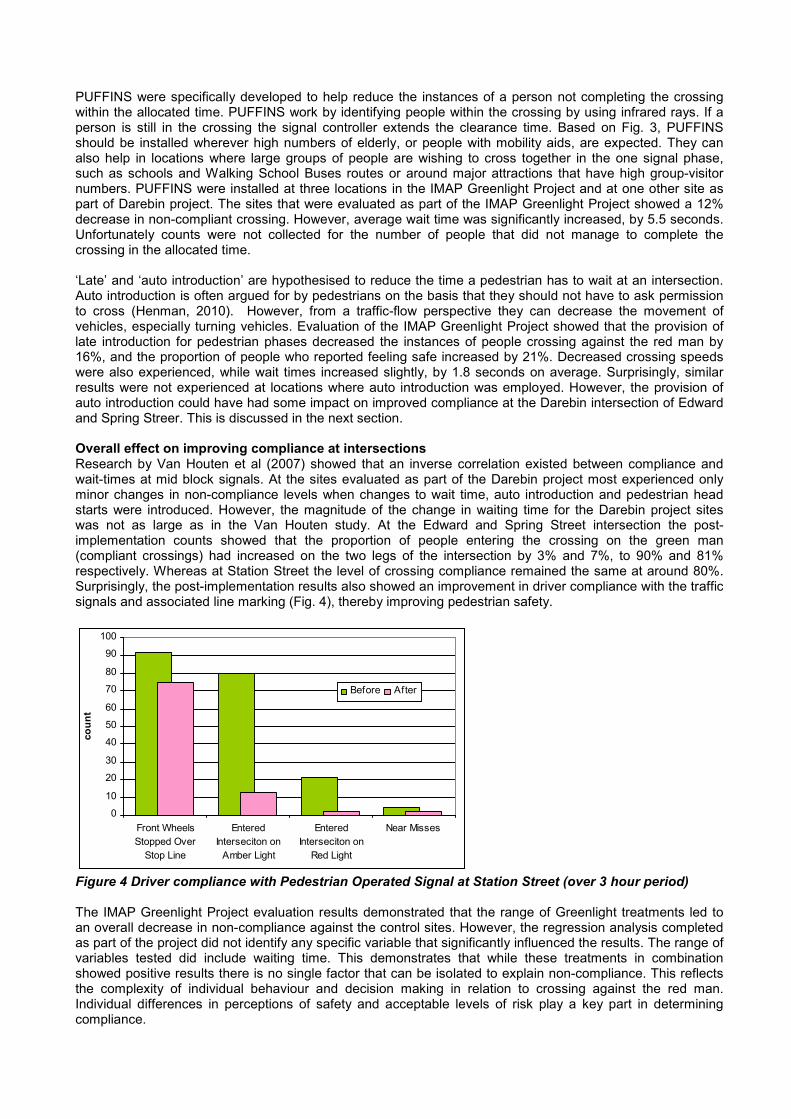
Overall effect on improving compliance at intersectionsResearch by Van Houten et al (2007) showed that an inverse correlation existed between compliance andwait-times at mid block signals. At the sites evaluated as part of the Darebin project most experienced onlyminor changes in non-compliance levels when changes to wait time, auto introduction and pedestrian headstarts were introduced. However, the magnitude of the change in waiting time for the Darebin project siteswas not as large as in the Van Houten study. At the Edward and Spring Street intersection the post-implementation counts showed that the proportion of people entering the crossing on the green man(compliant crossings) had increased on the two legs of the intersection by 3% and 7%, to 90% and 81%respectively. Whereas at Station Street the level of crossing compliance remained the same at around 80%.Surprisingly, the post-implementation results also showed an improvement in driver compliance with the trafficsignals and associated line marking (Fig. 4), thereby improving pedestrian safety.
0
10
20
30
40
50
60
70
80
90
100
Front WheelsStopped Over
Stop Line
EnteredInterseciton on
Amber Light
EnteredInterseciton on
Red Light
Near Misses
coun
t
Before After
Figure 4 Driver compliance with Pedestrian Operated Signal at Station Street (over 3 hour period)
The IMAP Greenlight Project evaluation results demonstrated that the range of Greenlight treatments led toan overall decrease in non-compliance against the control sites. However, the regression analysis completedas part of the project did not identify any specific variable that significantly influenced the results. The range ofvariables tested did include waiting time. This demonstrates that while these treatments in combinationshowed positive results there is no single factor that can be isolated to explain non-compliance. This reflectsthe complexity of individual behaviour and decision making in relation to crossing against the red man.Individual differences in perceptions of safety and acceptable levels of risk play a key part in determiningcompliance.
Physical Factors Found to Influence Pedestrian Experience at Signalised CrossingsThrough the IMAP Greenlight Project regression analysis, a number of physical factors that exist at trafficsignals were tested against the intercept survey information. This section highlights the areas of intersectiondesign that had a relationship with either walking speed or pedestrians’ perceptions of comfort and safety. Acomprehensive assessment of physical variables was not completed but a number of easy to measurevariables were included in the analysis. These were distance, traffic volume, existence of a tramway andtraffic island.
Time between before and after surveys was shown to have the most significant correlation with data from theintercept survey. There was a significant worsening of results in the post-implementation intercept survey bothat sites that received treatments and those that did not. This is one of the reasons that a more robustconclusion could not be drawn. Regardless of this weakness, there are a number of trends and relationshipsthat can be inferred from the regression analysis.
In relation to pedestrian speed, a very strong positive relationship between pedestrian speed and crossingdistance was found. With every 1m increase in crossing distance there was a 0.03m/s increase in averagepedestrian speed. This suggests that pedestrians walk faster when they have a greater distance to cover inthe crossing.
Tramways were shown by the regression analysis to have a positive effect on pedestrians’ reports of feelingrushed, and ‘waiting too long’. Specifically, the presence of a tramway is suggested to lead to an improvementof 0.24 on a scale out of 5 for feelings of being rushed; and an improvement of 0.1 on a scale out of 5 inreports of ‘waiting too long’. This finding may be due to a number of factors, including change in SCATScaused by the Trams, as well as increased cycle times, and the auto and late introductions delivered as partof the project in proximity to Tramways. This is counter to anecdotal evidence of people rushing to get toindividual trams and warrants further examination.
The regression analysis identified the presence of a traffic island is related to a worsening of pedestrianperceptions of safety. Namely, there is a worsening of 0.34 out of 5 when pedestrians are required to traversea traffic island. This is a counterintuitive finding as raised traffic islands provides a safe space for pedestrians(Leong, 1970) and in Preston were proved to increase perceptions of safety. In reviewing VicRoads TrafficEngineering Manual, an idea of why this may occur becomes apparent. For a divided road the calculation ofthe pedestrian walk time is based on the distance of the widest road section plus the median and 1m, and notthe full width of the road. This can lead to higher level of interaction with turning vehicles and pedestrianshaving to complete the crossing of the intersection in two legs. Also for the intersections included in this studyin general the crossing distance is longer and this was shown to increase walking speed and lower the level ofcomfort.
As part of the Darebin signal project, Council identified a location at Murray Road, Preston, where it was feltthat an existing fence was not effective and they would prefer to have it removed. Pedestrian fencing hadpreviously been installed to reduce people crossing at locations other than at a designated crossing. This typeof fencing can become a maintenance issue as well as taking away from the amenity of the area. The resultsof the post-removal evaluation showed a 3% increase (4% to 7%) in pedestrian crossings at points other thanthe designated crossing. However, the number of people who perceived the intersection as being ‘very safe’increased, as shown in Fig. 5. Even with this increase in perceptions of safety, survey respondents oftencomplained (21 respondents, or 20%) about the level of vehicle non-compliance. One respondent stated, “[I]noticed that some drivers seem to forget it’s a crossing and drive through it without stopping on a red light”.Unfortunately vehicle movements were not recorded as part of the evaluation. However, at a similar site,Station Street, Fairfield, over a period of nine hours on three different days only two cars entered the midblock intersection on red signal and in the same period 12 cars entered the crossing during the yellow signal.At this site a similar percentage of intercept survey respondents (24%) identified red light running in theirgeneral comments on pedestrian safety at the intersection. While not at the same intersection these statisticshighlight the difference that often exist between perceived and real safety issues which can impact on thelevels of pedestrian activity in any area.

0%
10%
20%
30%
40%
50%
Not at all safe Not very safe Somewhatsafe
Reasonablysafe
Very safe
Before After
Figure 5 Perceptions of safety proportional response (before N=25, after N=106)
Location of SignalsAt Hoppers Crossing Station two pedestrian signals were installed on Old Geelong Road parallel with at thelevel crossing. Previously, pedestrian operated signals existed on the northern side of the railway line near thelocal shops. These existing signals were approximately 80m from the level crossing on Old Geelong Roadand some distance from the station entrance and closer to an intersection with a local road further north. Aspart of the Hoopers Crossing Pedestrian Access Project, these signals were removed and replaced bypedestrian signals at the level crossing closer to the train station entrance. The post-evaluation showed thaton the northern side of the level crossing 50 people still continued to cross the road without using thepedestrian signals. However, in the evening period all but 10 people use the signalised crossing, down from40 people who didn’t use the crossing before the changes. This is interesting as it illustrates that pedestrianschange where they walk based on the direction of their approach, and how ease of navigation can impact oncrossing choices. With the addition of the second crossing adjoining the railway line on the south, theevaluation showed a number of other interesting results. Firstly, a noticeable reduction in the number ofpeople who crossed the railway line where there is no pedestrian level crossing. Secondly, people were notcrossing between the boom barriers as previously observed. This illustrates that the treatment significantlyincreased safety and reduced the risk of an accident between a pedestrian and a train.
Another project involving relocation of signals focussed on improving the north-south movement of cyclistalong Napier Street in Melbourne’s inner north. This project removed an existing pedestrian operated signalon Johnston Street (10m to the east of the intersection) and replaced it with full signalisation of theintersection of Napier and Johnston Street. Before the installation of the signals in the north-south direction anaverage of 206 people were observed crossing Johnston Street over 6 hours. After installation of the signalsan average of 290 people were observed making the same crossing over the same period of time. Thisrepresented a 35% increase in pedestrians crossing Johnston Street after the signals were moved. The lunchperiod saw the largest increase from an average of 53 people to an average of 101 people. This was quitesignificant and an unexpected result of the project. Moving of the crossing to the cross street allowed betterconnectivity with adjoining street. The change also meant that cyclist and cars could trigger calls for a greensignal to cross Johnston Street. The combination of these factors led to a decrease in crossing wait times. Inthe case of cyclists, this is illustrated in Fig. 6. These results are being used as a proxy for pedestrian waitingtimes as this data was not collected.
Figure 6 Cyclist delay at Johnston Street, before and after
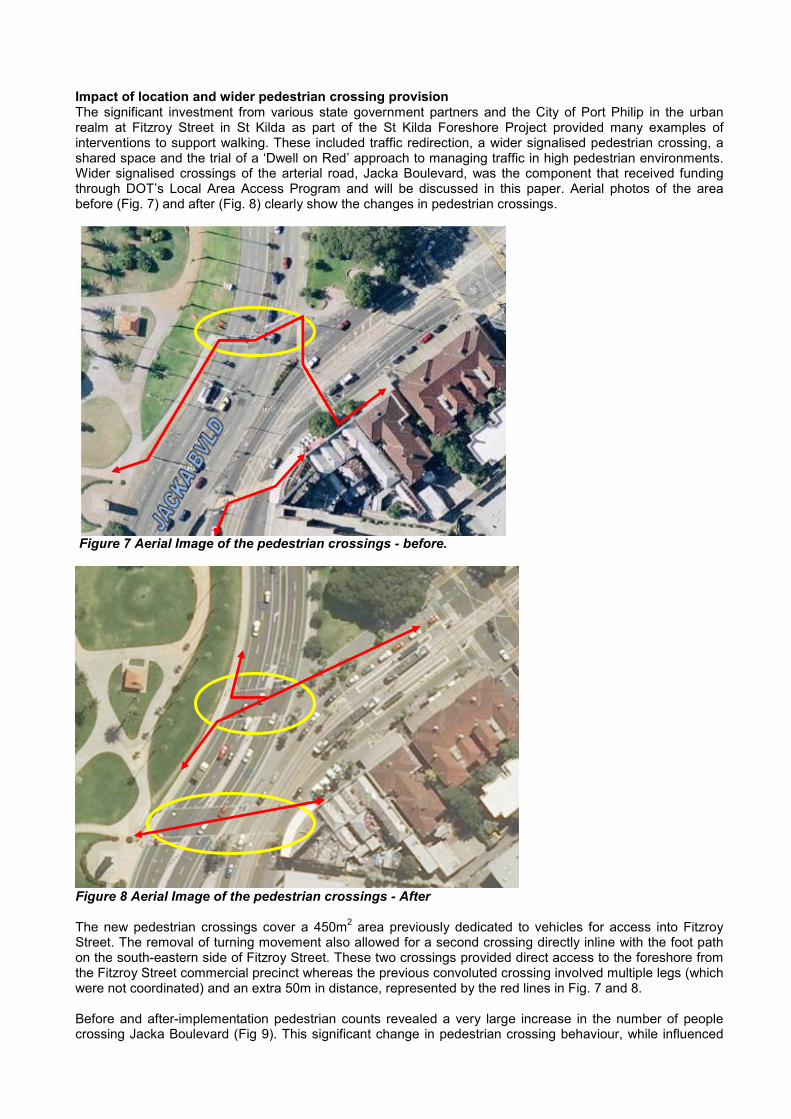
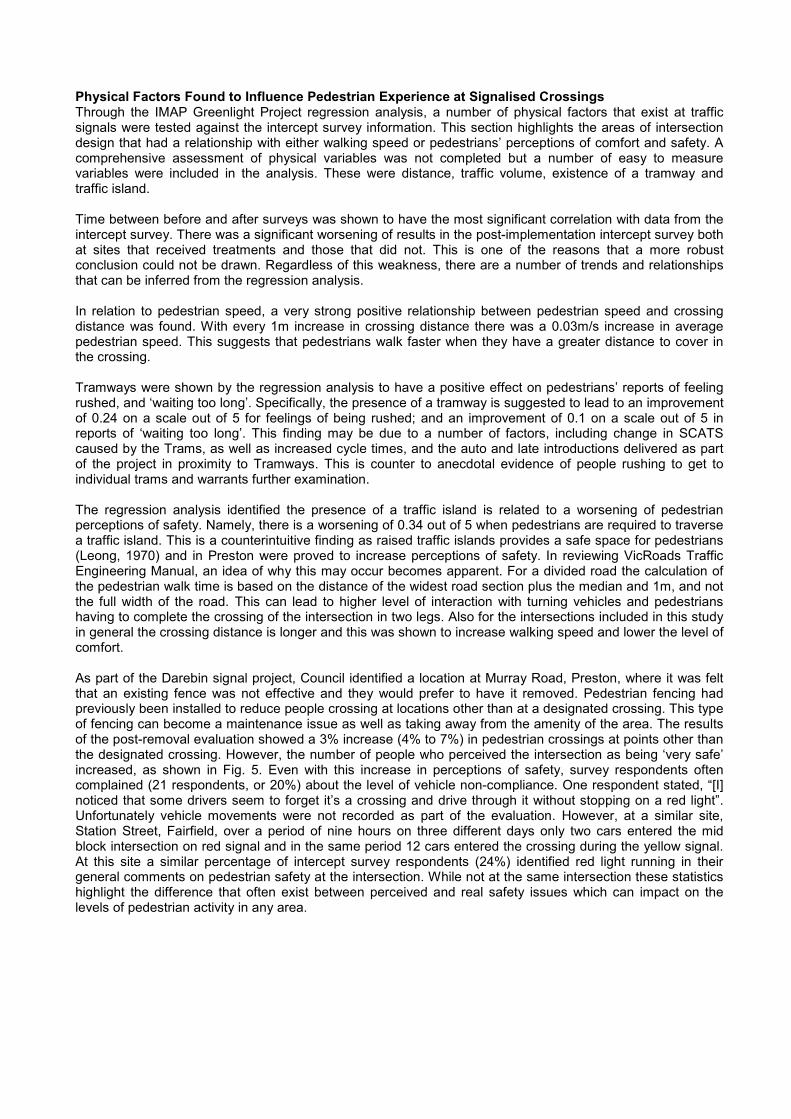
Impact of location and wider pedestrian crossing provisionThe significant investment from various state government partners and the City of Port Philip in the urbanrealm at Fitzroy Street in St Kilda as part of the St Kilda Foreshore Project provided many examples ofinterventions to support walking. These included traffic redirection, a wider signalised pedestrian crossing, ashared space and the trial of a ‘Dwell on Red’ approach to managing traffic in high pedestrian environments.Wider signalised crossings of the arterial road, Jacka Boulevard, was the component that received fundingthrough DOT’s Local Area Access Program and will be discussed in this paper. Aerial photos of the areabefore (Fig. 7) and after (Fig. 8) clearly show the changes in pedestrian crossings.
Figure 7 Aerial Image of the pedestrian crossings - before.
Figure 8 Aerial Image of the pedestrian crossings - After
The new pedestrian crossings cover a 450m2 area previously dedicated to vehicles for access into FitzroyStreet. The removal of turning movement also allowed for a second crossing directly inline with the foot pathon the south-eastern side of Fitzroy Street. These two crossings provided direct access to the foreshore fromthe Fitzroy Street commercial precinct whereas the previous convoluted crossing involved multiple legs (whichwere not coordinated) and an extra 50m in distance, represented by the red lines in Fig. 7 and 8.
Before and after-implementation pedestrian counts revealed a very large increase in the number of peoplecrossing Jacka Boulevard (Fig 9). This significant change in pedestrian crossing behaviour, while influenced
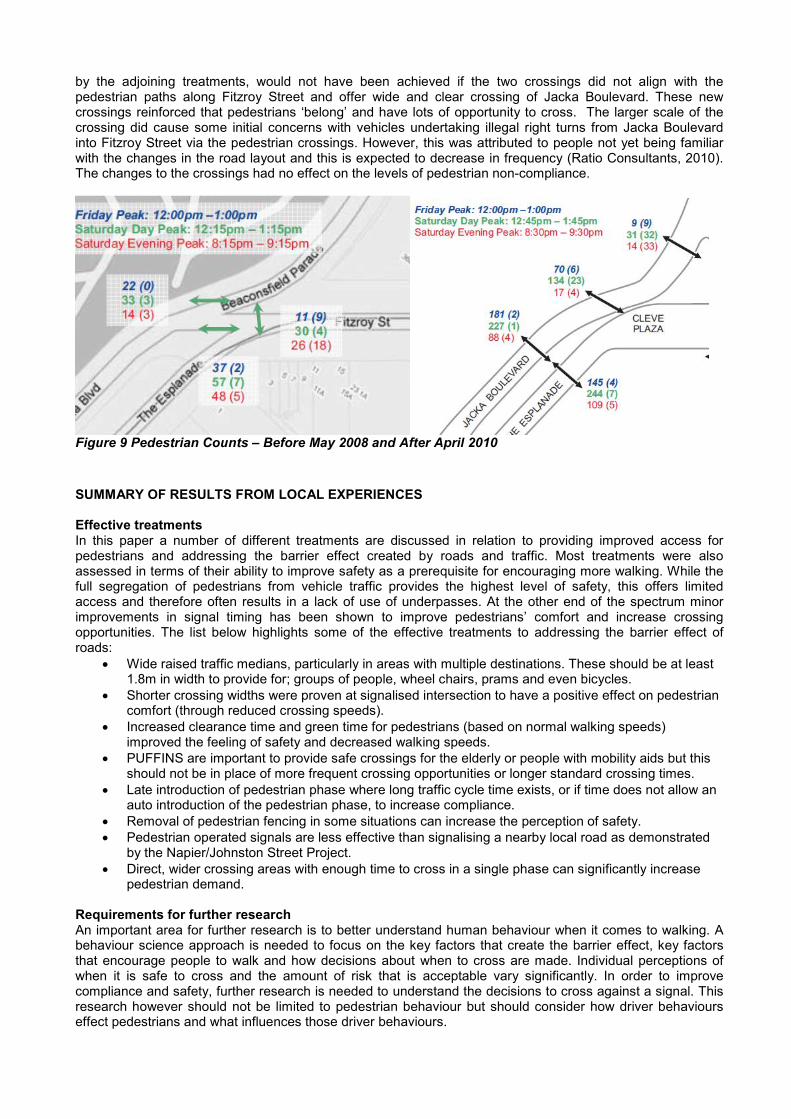
by the adjoining treatments, would not have been achieved if the two crossings did not align with thepedestrian paths along Fitzroy Street and offer wide and clear crossing of Jacka Boulevard. These newcrossings reinforced that pedestrians ‘belong’ and have lots of opportunity to cross. The larger scale of thecrossing did cause some initial concerns with vehicles undertaking illegal right turns from Jacka Boulevardinto Fitzroy Street via the pedestrian crossings. However, this was attributed to people not yet being familiarwith the changes in the road layout and this is expected to decrease in frequency (Ratio Consultants, 2010).The changes to the crossings had no effect on the levels of pedestrian non-compliance.
Figure 9 Pedestrian Counts – Before May 2008 and After April 2010
SUMMARY OF RESULTS FROM LOCAL EXPERIENCES
Effective treatmentsIn this paper a number of different treatments are discussed in relation to providing improved access forpedestrians and addressing the barrier effect created by roads and traffic. Most treatments were alsoassessed in terms of their ability to improve safety as a prerequisite for encouraging more walking. While thefull segregation of pedestrians from vehicle traffic provides the highest level of safety, this offers limitedaccess and therefore often results in a lack of use of underpasses. At the other end of the spectrum minorimprovements in signal timing has been shown to improve pedestrians’ comfort and increase crossingopportunities. The list below highlights some of the effective treatments to addressing the barrier effect ofroads:
Wide raised traffic medians, particularly in areas with multiple destinations. These should be at least1.8m in width to provide for; groups of people, wheel chairs, prams and even bicycles.
Shorter crossing widths were proven at signalised intersection to have a positive effect on pedestriancomfort (through reduced crossing speeds).
Increased clearance time and green time for pedestrians (based on normal walking speeds)improved the feeling of safety and decreased walking speeds.
PUFFINS are important to provide safe crossings for the elderly or people with mobility aids but thisshould not be in place of more frequent crossing opportunities or longer standard crossing times.
Late introduction of pedestrian phase where long traffic cycle time exists, or if time does not allow anauto introduction of the pedestrian phase, to increase compliance.
Removal of pedestrian fencing in some situations can increase the perception of safety. Pedestrian operated signals are less effective than signalising a nearby local road as demonstrated
by the Napier/Johnston Street Project. Direct, wider crossing areas with enough time to cross in a single phase can significantly increase
pedestrian demand.
Requirements for further researchAn important area for further research is to better understand human behaviour when it comes to walking. Abehaviour science approach is needed to focus on the key factors that create the barrier effect, key factorsthat encourage people to walk and how decisions about when to cross are made. Individual perceptions ofwhen it is safe to cross and the amount of risk that is acceptable vary significantly. In order to improvecompliance and safety, further research is needed to understand the decisions to cross against a signal. Thisresearch however should not be limited to pedestrian behaviour but should consider how driver behaviourseffect pedestrians and what influences those driver behaviours.

Consistent and systematic project evaluation should also form a component of every project completed bygovernment in the area of improving provisions for cyclists or pedestrians. It is only through this continualevaluation of projects that investment decisions can be improved and better outcomes achieved. Theseevaluations are critical to continue to develop a broader evidence base about which projects work and whatthe critical success factors are.
Lesson for effective evaluationThe evaluation result of these projects, particularly signal projects, was limited by the mix of differenttreatments that were implemented at each site as well as environmental factors. This made it very difficult todetermine what impacts were attributable to which treatment. The reality of working in a live trafficenvironment and trying to seek the best outcomes for the dollars invested means that a controlled experimentwill always be difficult to achieve. However, here are some simple ideas that can help in future evaluations:
Consistent before and after surveys are required as a minimum. Evaluation measures should be based on what you would like to see change (outcomes) and specific
enough to be effected by the project - For example if you are installing head starts for pedestrians,you need to measure how many people enter the intersection, and if the behaviour of drivers havechanged and if avoidance manoeuvrers decrease.
Before-implementation data is critical as it can not be collected again. If in doubt collect a broadrange of information that you expect the project to influence - this can include other modes oftransport and observations of behaviour.
Asking people if they like particular changes can lead to biased results. Also it may be difficult forpeople to recognise or perceive very small changes, especially in signal operations.
How the data is going to be analysed is very important in designing data collection, especially forquestionnaires.
Pedestrian and cyclist counts are more likely to change based on day of the week, time of year andlocal weather. Therefore counts should be conducted over multiple days and before and after countsat similar times of year.
Survey results are significantly affected by time. Therefore before-implementation counts should beconducted just weeks before works commence, even if this means repeating a count that wasundertaken to inform the design. Post-implementation counts and surveys should take placebetween 2 and 6 months from completion. It is difficult to find a balance between letting the treatment‘settle in’ and not being able to attribute impacts to the project. This is where longitudinal is data isimportant.
CONCLUSIONSThis paper presents a range of ideas, lessons and evidence on how to improve pedestrian access andcrossings through a series of Victorian projects funded through the DOT’s Local Area Access Program.Through this experience it has become clear that it is not always easy to measure and attribute the impacts tothese small scale projects, especially given the many factors that influence walking and people’s behaviour.However, these projects have demonstrated that minor steps can be achieved towards the objective ofincrease walking levels. They have also demonstrated that traffic signals can play a role in better balancingthe needs of pedestrians and vehicles at intersections and in reducing the barrier effects caused by arterialroads.
The most effective projects in providing for pedestrians, such as Fitzroy Street Foreshore Connections andPreston Connect, combine the professional skills of both traffic engineering and urban design. These twoprojects along with the Napier and Johnston Street Intersection Project created direct, clear and connectedwalking links demonstrating that increasing access can lead to increased levels of walking locally. It will onlybe through continuing these small steps of delivering, evaluating and sharing the lessons from pedestrianprojects that the broader objective of increasing walking can occur.
ACKNOWLEDGEMENTSThe author would like to acknowledge the efforts of all the council staff who managed these projects fromManningham City Council, City of Port Phillip, City of Yarra, Wyndham City Council, Darebin City Council andthe IMAP Group of Councils. Staff from partner organisations such as VicRoads and YarraTrams are alsogratefully acknowledged. This paper would not have been possible without the information that has beenprovided to DOT in formal project reports as well as through open and honest feedback. The author wouldalso like to acknowledge Booz & Co, SKM and Ratio Consultants for their work as consultants on theevaluation of these projects.
REFERENCES
Agrawal, A. W., Schlossberg, M. and Irvin, K. (2008), How Far, by Which Route and Why? A Spatial Analysisof Pedestrian Preference, Journal of Urban Design,13(1), 81-98.
Booz and Co (2011), Final Report IMAP Greenlight Project Evaluation, for the Victorian Department ofTransport (unpublished).
Burke, M. and Brown, A.L. (2007), Distances people walk for transport, Road and Transport Research, 16(3):16-29.
Department for Transport (UK) (2007), Manual for streets, Thomas Telford Publishing, London.Henman M. (2011), All the Small Things: How the Accumulation of Minor Factors Discourages Walking,
Proceedings of the Healthy Cities Conference, Brisbane, 115-121.Hess, P. M. (2009), Avenues or Arterials: The Struggle to Change Street Building Practices in Toronto,
Canada', Journal of Urban Design, 14(1),1-28.Jacobs, J. (1961), The death and life of great American cities, Vintage Books, New York.Jones, P., Boujenko, N. and Marshall, S. (2007), Link & Place: A guide to street planning and design,
Transport for London Institution of Highways and Transportation (Great Britain) Local Transport Today,250.
Leong, H.J.W. (1970), The Effect of Kerbed Median Strips on Accidents on Urban Roads. Proceedings of the5th Australian Road Research Board Conference, 5(3), 338-364.
Montufar J., Arango, J., Porter, M., and Nakagawa, S. (2007), Pedestrians’ Normal Walking Speed andSpeed When Crossing a Street, Transport Research Record, No 2002, 90-97.
Ogilvie D., Foster C.E., Rothnie H., Cavill N., Hamilton V., Fitzsimons C.F. and Mutrie N. (2007) Interventionsto promote walking: systematic review, British Medical Journal (BMJ online)http://www.bmj.com/content/334/7605/1204.full?sid=0b819b6b-0e67-4285-a9b1-cd0f55c4d48c, aScottish Physical Activity Research Collaboration (SPARColl)
PriceWaterhouseCoopers (2011), Assessing the Economic Benefits of Walking, prepared for PCAL andDECCW (NSW).
Ratio Consultants (2010), Traffic, Transport and Public Space Review: Fitzroy Street Foreshore Connections,St Kilda, prepared for the City of Port Philip (unpublished).
SKM Consulting (2009), Evaluation of Johnston Street/Napier Street Intersection Treatments - Before andAfter Report, produced for the City of Yarra and the Department of Transport (unpublished).
Terranova C.N. (2009), Ultramodern Underground Dallas: Vincent Ponte’s Pedestrian-Way as SystematicSolution to the Declining Downtown, Urban History Review / Revue d'histoire urbaine, 37(2), 18-29.
Utermann, R. K., (1984), Accommodating the Pedestrian, Adapting Towns and Neighbourhoods for Walkingand Bicycling, 232.
Vallyon C., Turner S., and Hodgson S. (2009), Reducing Pedestrian Delays at Traffic Signals, BECA, 12 July2009.
Van Der Voordt, D.J.M. and Van Wegen, H.B.R. (1983), Underpasses for pedestrians and cyclists,Transportation Planning and Technology, 8(1), 1-14.
Van Houten, R., Ellis, R., and Kim, J.l. (2007), Effects of Various Minimum Green Times on Percentage ofPedestrian Waiting for Midblock “Walk” Signal, Transport Research Record, No 2002, 78-83.
VicRoads (2010), SmartRoads, State Government of Victoria.

Appendix 1: Intersection treatments by site for IMAP Greenlight and Darebin Intersection Project.
AddressIntersection
Type Treatment 1 Treatment 2 Treatment 3 Evaluation Showed
Edwards St andSpring St,Reservior
Auto Introduction ofpedestrian call-up
Head-start forpedestrians
PUFFIN Slight increase in safe behaviour bypedestrians but also significantimprovement in driver behaviour.
Station Street,Fairfeild
Mid-block
Max green time forvehicles set at 30sec= increased crossingopportunities
Queue detection Slight increase in safe behaviour bypedestrians but also significantimprovement in driver behaviour.
Murray Rd,Preston
Mid-block
Maximum pedestrianwait time set at 30sec (after call)
Removal offencing
7% decrease in the legal use of thecrossing – mostly people now crossingnearby. But increase in perceptions ofsafety.