analyzing the impact of median treatments on pedestrian ... · pdf fileanalyzing the impact of...
TRANSCRIPT
MARYLAND DEPARTMENT OF TRANSPORTATION STATE HIGHWAY ADMINISTRATION
Research Report
ANALYZING THE IMPACT OF MEDIAN TREATMENTS ON PEDESTRIAN/BICYCLIST SAFETY
Lei Zhang, Sepehr Ghader, Arash Asadabadi, Mark Franz, Chenfeng Xiong, and Julia Litchford
National Transportation Center Department of Civil and Environmental Engineering
University of Maryland
FINAL REPORT May 2017
MD-17-SHA/UM/4-28
II
The contents of this report reflect the views of the author who is responsible for the facts and the accuracy of the data presented herein. The contents do not necessarily reflect the official views or policies of the Maryland State Highway Administration. This report does not constitute a standard, specification, or regulation.
III
Technical Report Documentation Page 1. Report No.
MD-17-SHA/UM/4-28 2. Government Accession No. 3. Recipient's Catalog No.
4. Title and Subtitle ANALYZING THE IMPACT OF MEDIAN TREATMENTS ON PEDESTRIAN/BICYCLIST SAFETY
5. Report Date May, 2017 6. Performing Organization Code
7. Author/s Lei Zhang, Herbert Rabin Distinguished Professor and Project PI Sepehr Ghader, Ph.D. Candidate; Arash Asadabadi, Graduate Research Assistant; Mark Franz, Faculty Specialist; Chenfeng Xiong, Assistant Research Professor, Julia Litchford, Graduate Research Assistant
8. Performing Organization Report No.
9. Performing Organization Name and Address National Transportation Center University of Maryland College Park, MD, 20742
10. Work Unit No. (TRAIS) 11. Contract or Grant No.
SP509B4A 12. Sponsoring Organization Name and Address Maryland State Highway Administration Office of Policy & Research 707 North Calvert Street Baltimore MD 21202
13. Type of Report and Period Covered Final Report
14. Sponsoring Agency Code (7120) STMD -
MDOT/MDOT SHA
15. Supplementary Notes 16. Abstract To improve pedestrian/bicyclist safety, the Maryland Department of Transportation State Highway Administration (MDOT SHA) has identified several high-frequency pedestrian/bicyclist crash locations through the Pedestrian Roadway Safety Audit (PRSA) Program. Recognizing an over-representation of pedestrian crashes related to illegal mid-block crossings, various median treatments have been implemented at target locations. While these countermeasures are generally perceived as effective and beneficial, this study seeks to quantify their impact. The research team applied trend and statistical analyses to assess the effectiveness of installed safety countermeasures. To investigate public opinions on median treatments, on-site surveys of pedestrians, bicyclists, and local businesses were conducted at the identified study locations. Trend analysis showed that median treatments helped reduce rates of various types of crashes at treatment sites, while increased rates were observed at control sites. Statistical analysis showed that median treatments had a significant, positive effect on the reduction total number of crashes and fatalities. Results from the surveys showed that the public believed that treatments were effective at discouraging mid-block crossings. Statistical analysis, trend analysis, and survey results supported the effectiveness of median treatments in decreasing crash rates and saving lives.
17. Key Words Pedestrian; bicyclist; safety; median treatment; safety countermeasure; before-after study; trend analysis; Empirical Bayes method, mid-block crossing
18. Distribution Statement: No restrictions This document is available from the Research Division upon request.
19. Security Classification (of this report) None
20. Security Classification (of this page) None
21. No. Of Pages 29
22. Price
Form DOT F 1700.7 (8-72) Reproduction of form and completed page is authorized.
IV
TABLE OF CONTENT TABLE OF CONTENT ................................................................................................................ IV LIST OF FIGURES ....................................................................................................................... V LIST OF TABLES ........................................................................................................................ VI EXECUTIVE SUMMARY ......................................................................................................... VII 1. INTRODUCTION ...................................................................................................................... 1
1.1. Problem Statement ........................................................................................................... 1 1.2. Research Objectives ......................................................................................................... 1 1.3. Research Approach .......................................................................................................... 2
2. LITERATURE REVIEW ......................................................................................................... 2 3. STUDY LOCATIONS AND STUDY PERIOD ..................................................................... 4
3.1. Treatment Sites ................................................................................................................. 4 3.2. Control Sites ..................................................................................................................... 6 3.3. Study Period ..................................................................................................................... 7
4. DATA ....................................................................................................................................... 8 4.1. Crash Data ........................................................................................................................ 8 4.2. AADT ............................................................................................................................. 10 4.3. Pedestrian/Bicyclist Counts ........................................................................................... 10 4.4. Geometric Design Data .................................................................................................. 11
5. PEDESTRIAN/BICYCLIST SURVEY ................................................................................. 12 5.1. Pedestrian/Bicyclist Surveys .......................................................................................... 12 5.2. Local Business Surveys .................................................................................................. 16
6. TREND ANALYSIS .............................................................................................................. 20 7. STATISTICAL ANALYSIS .................................................................................................. 23
7.1. Empirical Bayes Model .................................................................................................. 23 7.2. Statistical Analysis Results ............................................................................................ 25
8. SUMMARY AND CONCLUSIONS .................................................................................... 27 REFERENCES ............................................................................................................................. 29 APPENDIX A ............................................................................................................................... 30
Surveys ...................................................................................................................................... 30 APPENDIX B ............................................................................................................................... 39
Sample Aerial Photos ................................................................................................................ 40 Street View of Different Median types...................................................................................... 42
V
LIST OF FIGURES
Figure 1: Pedestrian Fatality Rates ................................................................................................. 1 Figure 2: Research Approach Diagram........................................................................................... 2 Figure 3: Location of Treatment and Control Sites ........................................................................ 7 Figure 4: Pedestrian/Bicyclist Opinion about Their Desired Improvement ................................. 12 Figure 5: Desired Type of Median Treatment .............................................................................. 13 Figure 6: Opinions about Effectiveness of Median Treatment at Each Site ................................. 14 Figure 7: Likeliness of Mid-Block Crossing ................................................................................ 15 Figure 8: Factors Influencing Mid-Block Crossing ...................................................................... 15 Figure 9: Local Businesses Opinion about Ped/Bike Safety Problems ........................................ 16 Figure 10: Local Businesses Answers about Observing Mid-Block Crossing ............................. 17 Figure 11: Local Businesses Opinion about Impact of Median Treatment on Ped/Bike Traffic . 18 Figure 12: Local Businesses Opinion about Effectiveness of Median Treatments ...................... 19 Figure 13: Normalized Total Crash Trend .................................................................................... 20 Figure 14: Normalized Severe Crash Trend ................................................................................. 21 Figure 15: Normalized Ped/Bike Crash Trend.............................................................................. 21 Figure 16: Normalized Fatal Ped/Bike Crash Trend..................................................................... 22 Figure 17: Empirical Bayes Method Steps ................................................................................... 23 Figure 18: MD 650 and MD 193 (Site # 2) - Year 2016 .............................................................. 40 Figure 19: MD 650 and MD 193 (Site # 2) - Year 2002 .............................................................. 40 Figure 20: US 40 and MD 152 (Site # 13) - Year 2013 ................................................................ 41 Figure 21: US 40 and MD 152 (Site # 13) - Year 2004 ................................................................ 41 Figure 22: Fencing College Park- US 1 ........................................................................................ 42 Figure 23: Planter Riverdale- MD 201 ......................................................................................... 42 Figure 24: Rounded Catonsville- US 40 ....................................................................................... 43 Figure 25: Signage Glen Burnie- MD 2 ........................................................................................ 43
VI
LIST OF TABLES
Table 1: Treatment Site Information ............................................................................................... 4 Table 2: Before/After Treatment Median Condition from Aerial Photos....................................... 5 Table 3: Corresponding Control Site for Each Treatment Site ....................................................... 6 Table 4: Crash Counts for Each Crash Type Before and After the Treatment ............................... 9 Table 5: Percent Change in Crash Counts After the Treatment for Each Crash Type ................. 10 Table 6: Statistical Analysis Results ............................................................................................. 25
VII
EXECUTIVE SUMMARY The Maryland Department of Transportation State Highway Administration (MDOT SHA) identified several high-frequency pedestrian/bicyclist crash locations through the Pedestrian Roadway Safety Audit (PRSA) Program. Recognizing an over-representation of pedestrian and bicyclist crashes related to illegal mid-block crossings, various median treatments (e.g., fencing, vegetation planter) and safety enhancement countermeasures were implemented at target locations. While median treatments are generally perceived as effective, this study seeks to quantify their impact and compare the effectiveness of different types of median treatments.
Before and after data were collected at 30 treatment and control sites. Data collected included: vehicle, pedestrian, and bicycle volumes; site geometry; before and after crash counts and severity; and business/community and pedestrian/bicyclist assessment of safety countermeasures. The research team applied trend analysis and statistical analysis to assess the effectiveness of installed countermeasures. The trend analysis focused on the general crash trend. Statistical modeling methods were employed to link bicycle and pedestrian crashes to median treatments and other influencing variables, such as site geometry, traffic volume, truck percentages, pedestrian/bicyclist volumes, traffic control devices, street lighting, and sight distance. The Empirical Bayes methods separated the effect of median treatments from effects of other factors.
To investigate public opinion on median treatments and pedestrian/bicyclist safety, on-site pedestrian and bicyclist surveys were conducted at study locations. The results of these surveys offered valuable insights on (1) pedestrian/cyclist opinions on the existing median treatments; (2) reasons for engaging in illegal mid-block crossing; (3) alternative treatments at the study locations; and (4) other considerations regarding pedestrian/bicyclist safety improvement. The surveys were supplemented with business and community interest group interviews. The results shed light on the socio-demographic factors that may influence attitudes toward the installed median treatments.
Results of the trend analysis showed that treatment sites (where median treatments have been installed) experienced lower or similar crash rates for all crash types after the treatment, while control sites (no median treatments) experience higher crash rates during the same time period. The statistical analysis showed a significant reduction in total crash rates and fatalities because of the treatments. The median treatments installed at the 16 sites have reduced the number of total crashes by 122 (14%), the number of severe crashes by 33 (9%), and the number of fatal crashes by 24 (86%). Survey results showed that more than 50% of pedestrians and bicyclists are likely to cross roads mid-block, but median treatments are effective in discouraging it.
An in-depth examination of high pedestrian/bicyclist crash sites can be the subject of a future study to supplement the PRSA program. Utilizing new technologies to collect pedestrian and bicycle data may also help support the PRSA program and other pedestrian/bicyclist safety programs in Maryland.
1
1. INTRODUCTION
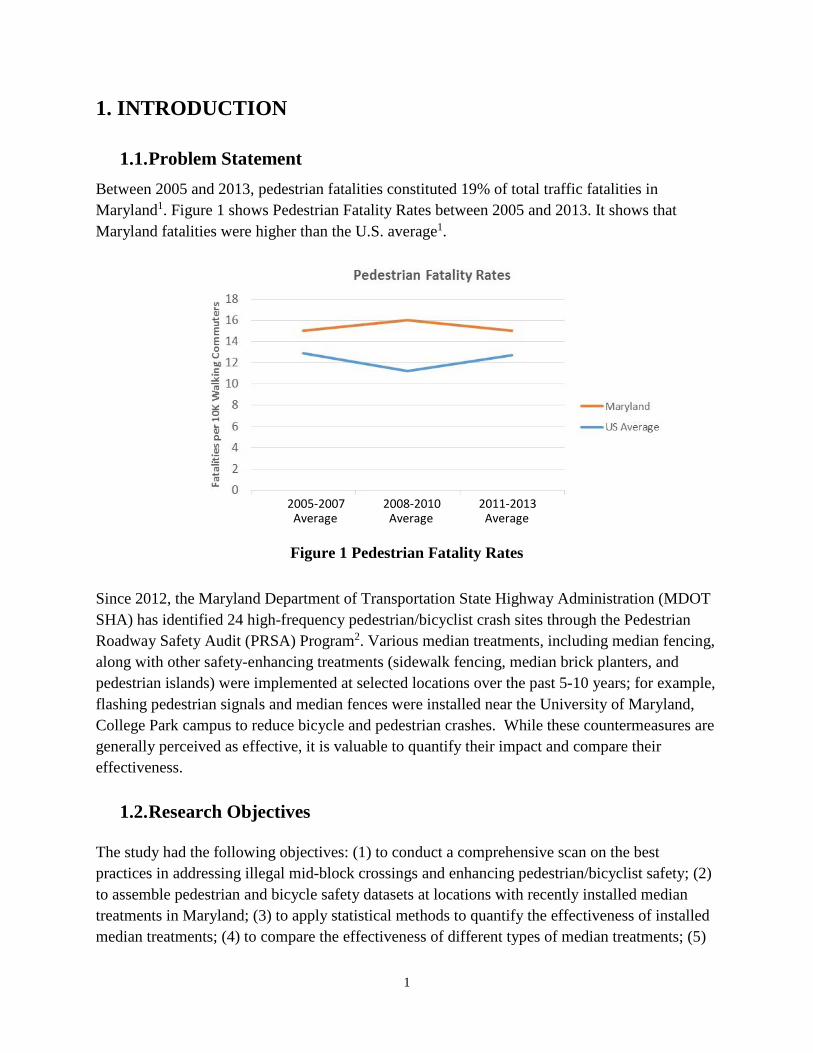
1.1. Problem Statement Between 2005 and 2013, pedestrian fatalities constituted 19% of total traffic fatalities in Maryland1. Figure 1 shows Pedestrian Fatality Rates between 2005 and 2013. It shows that Maryland fatalities were higher than the U.S. average1.
2005-2007 2008-2010 2011-2013 Average Average Average
Figure 1 Pedestrian Fatality Rates
Since 2012, the Maryland Department of Transportation State Highway Administration (MDOT SHA) has identified 24 high-frequency pedestrian/bicyclist crash sites through the Pedestrian Roadway Safety Audit (PRSA) Program2. Various median treatments, including median fencing, along with other safety-enhancing treatments (sidewalk fencing, median brick planters, and pedestrian islands) were implemented at selected locations over the past 5-10 years; for example, flashing pedestrian signals and median fences were installed near the University of Maryland, College Park campus to reduce bicycle and pedestrian crashes. While these countermeasures are generally perceived as effective, it is valuable to quantify their impact and compare their effectiveness.
1.2. Research Objectives The study had the following objectives: (1) to conduct a comprehensive scan on the best practices in addressing illegal mid-block crossings and enhancing pedestrian/bicyclist safety; (2) to assemble pedestrian and bicycle safety datasets at locations with recently installed median treatments in Maryland; (3) to apply statistical methods to quantify the effectiveness of installed median treatments; (4) to compare the effectiveness of different types of median treatments; (5)
2
to investigate human and socio-demographic factors of the illegal mid-block crossing behavior; and (6) to identify methods that can further improve the effectiveness of pedestrian/bicyclist safety countermeasures.
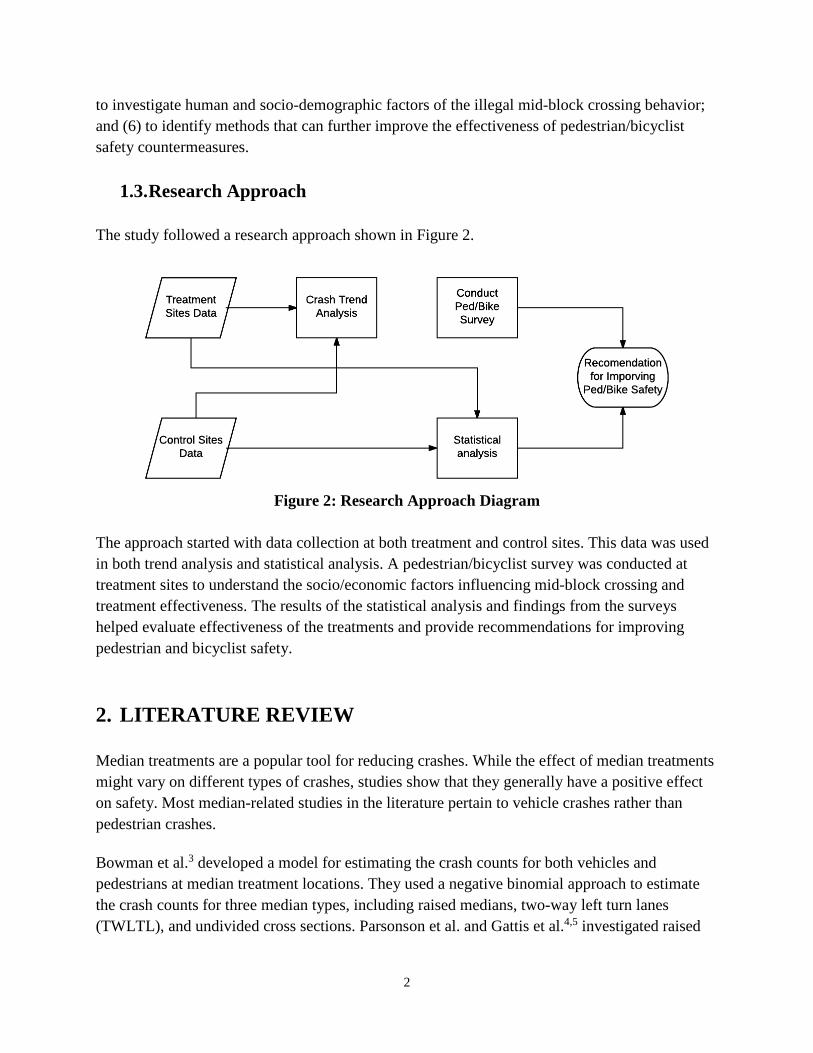
1.3. Research Approach The study followed a research approach shown in Figure 2.
Figure 2: Research Approach Diagram
The approach started with data collection at both treatment and control sites. This data was used in both trend analysis and statistical analysis. A pedestrian/bicyclist survey was conducted at treatment sites to understand the socio/economic factors influencing mid-block crossing and treatment effectiveness. The results of the statistical analysis and findings from the surveys helped evaluate effectiveness of the treatments and provide recommendations for improving pedestrian and bicyclist safety.
2. LITERATURE REVIEW Median treatments are a popular tool for reducing crashes. While the effect of median treatments might vary on different types of crashes, studies show that they generally have a positive effect on safety. Most median-related studies in the literature pertain to vehicle crashes rather than pedestrian crashes. Bowman et al.3 developed a model for estimating the crash counts for both vehicles and pedestrians at median treatment locations. They used a negative binomial approach to estimate the crash counts for three median types, including raised medians, two-way left turn lanes (TWLTL), and undivided cross sections. Parsonson et al. and Gattis et al.4,5 investigated raised
3
medians and TWLTL types. In general, roadways with raised medians experienced a lower crash rate in comparison with TWLTL. Many researchers conducted studies on pedestrian behavior and incentives for preventing mid-block crossing. Chu et al.6 showed that the built environment plays an important role on pedestrian choice for crossing locations. The study also demonstrated that pedestrians are less likely to cross the street illegally when the traffic volume and the crossing distance increase. King et al.7 showed that the main incentive for illegal mid-block crossing by pedestrians is the potential time savings. Eisele and Frawley8 investigated the operational and safety effects of median treatments, specifically raised medians and TWLTL cross sections. The results showed that speed, volume, and delays are affected by median treatment installation, and crash rates decreased after the installation. Before and after studies were conducted to measure the safety effectiveness of various treatments. In these studies, statistics during before and after periods were compared, such as crash counts9. The main weakness of these methods is that they neglected other factors affecting crashes that might vary between before and after periods. The effectiveness measures might be inaccurately reported without controlling for these factors. Another deficiency is the fact that they are prone to regression-to-mean bias. To control the bias, the data needs to be collected for a longer period; however, many variables, such as road conditions, traffic volume, and weather conditions may change over time. Therefore, statistical modeling is required to control for these variables. Generalized linear models (GLM)10 can be used for that purpose. GLM has many applications in various fields, but applying it to crash modeling needs a special consideration: the crash count is always a non-negative integer. Poisson and negative binomial models are specific types of GLM that generally work well with non-negative integers. Poisson models assume the equality of mean and variance. Studies showed that crash counts are over-dispersed, i.e., variance is generally bigger than mean. Negative binomial models are a more favorable choice when modeling crash counts11,12. The Empirical Bayes (EB) method was used recently for safety studies. The method considers crash data both observed at a site and predicted by its safety performance function (SPF). Hauer9 showed that the best way to model crash counts is by using a multivariate statistical model. Annual Average Daily Traffic (AADT) and geometric features of the roadway are usually used for estimating the SPF. Persaud et al.13 investigated the effectiveness of roundabouts on reducing crashes by applying the EB method. Fitzpatrick and Park14 conducted a study for the Federal Highway Administration (FHWA) to measure the effectiveness of the HAWK (High intensity Activated crossWalK) signal on reducing pedestrian crashes. This study used the EB method for several crash types and helped distinguish the treatment effects on different types of crashes.
4
3. STUDY LOCATIONS AND STUDY PERIOD
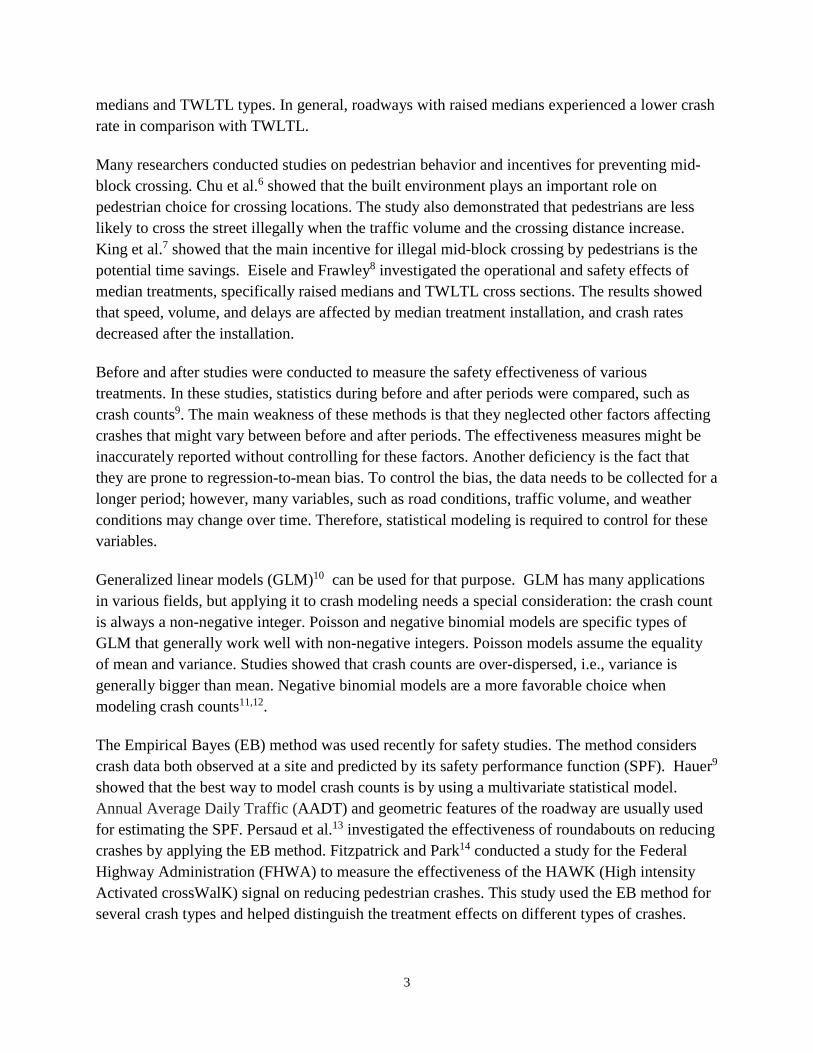
3.1. Treatment Sites The MDOT SHA identified 24 critical high-frequency pedestrian/bicyclist crash locations through the PRSA program. In 18 of these locations, some type of median treatment (fencing, brick planters, pedestrian islands, etc.) was installed. Table 1 summarizes the treatment site information. Sample street views of the median treatment types are available in Appendix B.
Table 1: Treatment Site Information ID # District County Route Limit 1 Limit 2 Treatment Installation
Date Included in
Study
1 3 Prince Georges US 1 Hartwick
Road Knox Road Median Fencing Summer 2014 Yes
2 3 Prince Georges
MD 193 MD 650 1st signal to
east Median Fencing
Summer 2010 (approximate) Yes
3 3 Prince Georges
MD 650 MD 193 1st signal to
south Median Fencing
Summer 2010 (approximate) Yes
4 3 Prince Georges
MD 201
Riverdale Road
Edmonston Road
Sloped Median Planter
Summer 2007 (approximate) Yes
5 3 Prince Georges
MD 410
Belcrest Road
PG Plaza Entrance
Median Fencing
Summer 2007 (approximate) Yes
6 7 Frederick US 40 Waverly Drive
Willowdale Drive
Median Fencing Spring 2011 Yes
7 7 Frederick US 40 Willowdale Drive Hoke Place
Large Landscaped
Median
Done in phases since
Summer 2005 Yes
8 3 Montgomery MD 355 MD 410 MD 191
Sloped Median Planter
2003 Yes
9 3 Montgomery US 29 NB MD 410 Wayne
Avenue Sidewalk Planters Fall 2013 Yes
10 3 Montgomery MD 650
Lockwood Drive
1st entr. to south
Median Fencing 2005 Yes
11 1 Worcester MD 528 13th Street 21st Street Median
Planters Completed
Summer 2014 Yes
12 4 Harford US 40 Joppa Farm Road Joppa Road Raised Brick
Planters Completed in
2005 Yes
13 4 Harford US 40 MD 152 MD 24 Overpass
Raised Brick Planters
Completed in 2009 Yes
14 4 Baltimore MD 26 Baltimore City line
Brenbrook Drive TWLTL December
2007 No
5
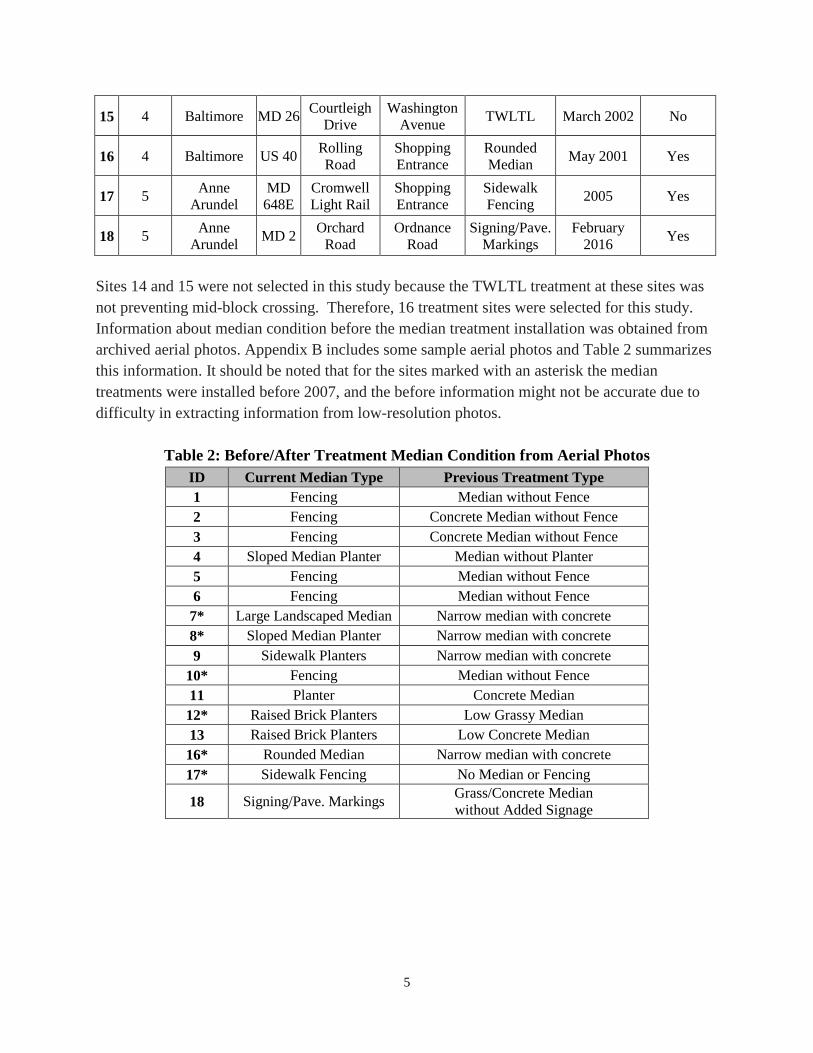
15 4 Baltimore MD 26 Courtleigh Drive
Washington Avenue TWLTL March 2002 No
16 4 Baltimore US 40 Rolling Road
Shopping Entrance
Rounded Median May 2001 Yes
17 5 Anne Arundel
MD 648E
Cromwell Light Rail
Shopping Entrance
Sidewalk Fencing 2005 Yes
18 5 Anne Arundel MD 2 Orchard
Road Ordnance
Road Signing/Pave.
Markings February
2016 Yes
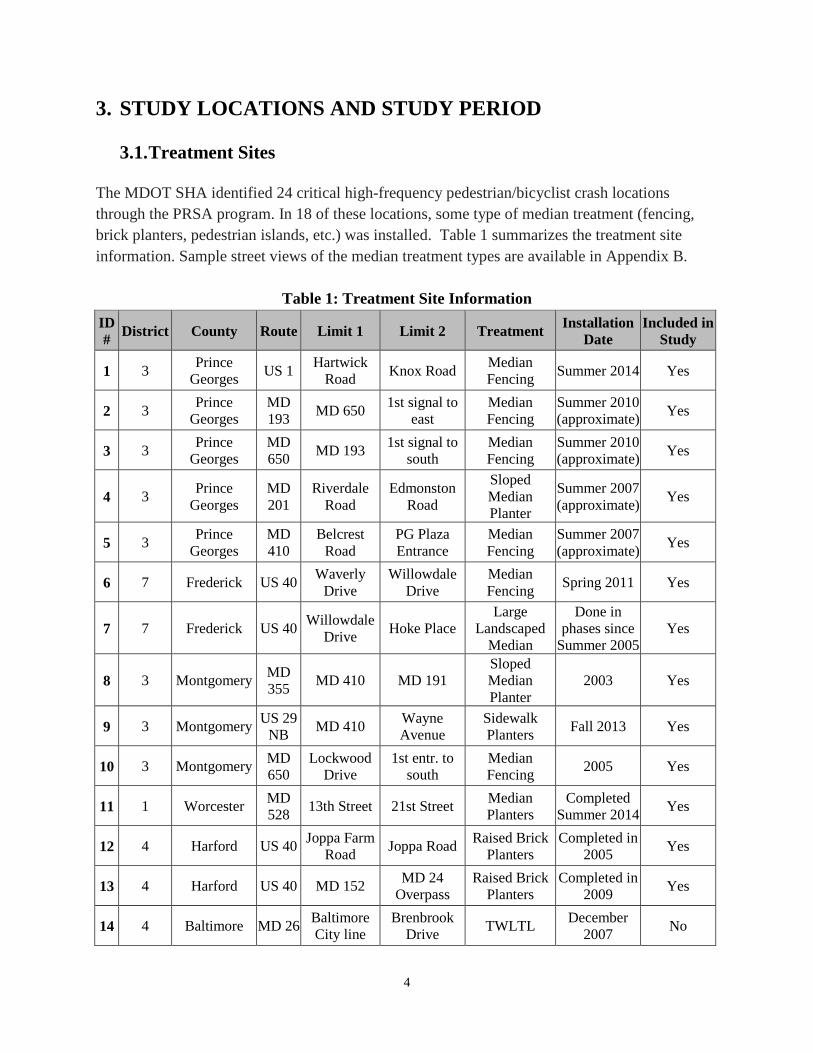
Sites 14 and 15 were not selected in this study because the TWLTL treatment at these sites was not preventing mid-block crossing. Therefore, 16 treatment sites were selected for this study. Information about median condition before the median treatment installation was obtained from archived aerial photos. Appendix B includes some sample aerial photos and Table 2 summarizes this information. It should be noted that for the sites marked with an asterisk the median treatments were installed before 2007, and the before information might not be accurate due to difficulty in extracting information from low-resolution photos.
Table 2: Before/After Treatment Median Condition from Aerial Photos ID Current Median Type Previous Treatment Type 1 Fencing Median without Fence 2 Fencing Concrete Median without Fence 3 Fencing Concrete Median without Fence 4 Sloped Median Planter Median without Planter 5 Fencing Median without Fence 6 Fencing Median without Fence
7* Large Landscaped Median Narrow median with concrete 8* Sloped Median Planter Narrow median with concrete 9 Sidewalk Planters Narrow median with concrete
10* Fencing Median without Fence 11 Planter Concrete Median 12* Raised Brick Planters Low Grassy Median 13 Raised Brick Planters Low Concrete Median 16* Rounded Median Narrow median with concrete 17* Sidewalk Fencing No Median or Fencing
18 Signing/Pave. Markings Grass/Concrete Median without Added Signage
6
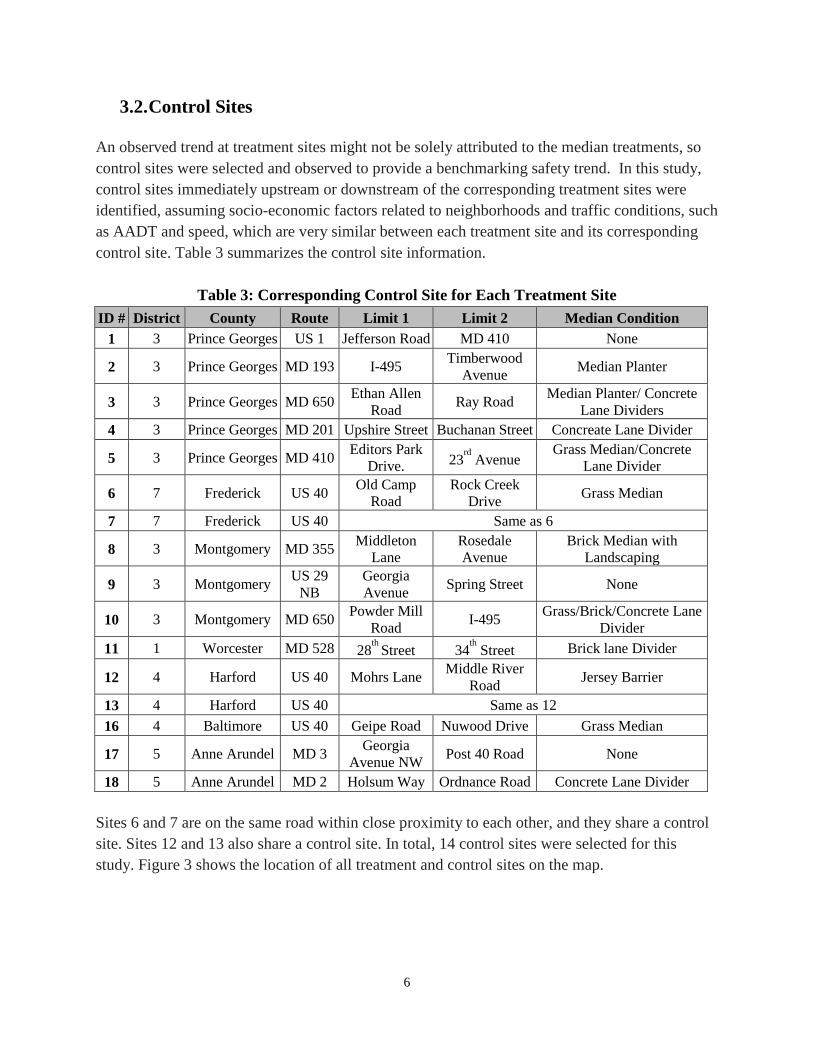
3.2. Control Sites An observed trend at treatment sites might not be solely attributed to the median treatments, so control sites were selected and observed to provide a benchmarking safety trend. In this study, control sites immediately upstream or downstream of the corresponding treatment sites were identified, assuming socio-economic factors related to neighborhoods and traffic conditions, such as AADT and speed, which are very similar between each treatment site and its corresponding control site. Table 3 summarizes the control site information.
Table 3: Corresponding Control Site for Each Treatment Site ID # District County Route Limit 1 Limit 2 Median Condition
1 3 Prince Georges US 1 Jefferson Road MD 410 None
2 3 Prince Georges MD 193 I-495 Timberwood Avenue Median Planter
3 3 Prince Georges MD 650 Ethan Allen Road Ray Road Median Planter/ Concrete
Lane Dividers 4 3 Prince Georges MD 201 Upshire Street Buchanan Street Concreate Lane Divider
5 3 Prince Georges MD 410 Editors Park Drive. 23rd Avenue
Grass Median/Concrete Lane Divider
6 7 Frederick US 40 Old Camp Road
Rock Creek Drive Grass Median
7 7 Frederick US 40 Same as 6
8 3 Montgomery MD 355 Middleton Lane
Rosedale Avenue
Brick Median with Landscaping
9 3 Montgomery US 29 NB
Georgia Avenue Spring Street None
10 3 Montgomery MD 650 Powder Mill Road I-495 Grass/Brick/Concrete Lane
Divider 11 1 Worcester MD 528 28th Street 34th Street Brick lane Divider
12 4 Harford US 40 Mohrs Lane Middle River Road Jersey Barrier
13 4 Harford US 40 Same as 12 16 4 Baltimore US 40 Geipe Road Nuwood Drive Grass Median
17 5 Anne Arundel MD 3 Georgia Avenue NW Post 40 Road None
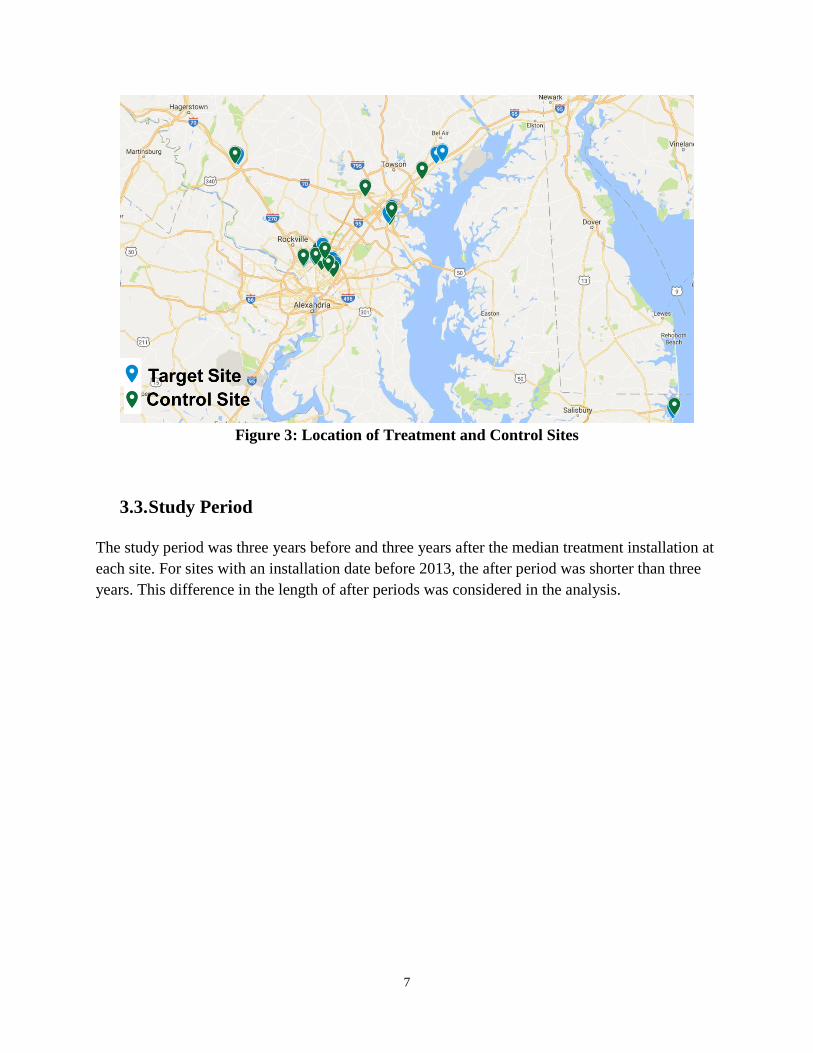
18 5 Anne Arundel MD 2 Holsum Way Ordnance Road Concrete Lane Divider Sites 6 and 7 are on the same road within close proximity to each other, and they share a control site. Sites 12 and 13 also share a control site. In total, 14 control sites were selected for this study. Figure 3 shows the location of all treatment and control sites on the map.
7
Figure 3: Location of Treatment and Control Sites
3.3. Study Period The study period was three years before and three years after the median treatment installation at each site. For sites with an installation date before 2013, the after period was shorter than three years. This difference in the length of after periods was considered in the analysis.
8
4. DATA Crash data, AADT, pedestrian/bicyclist counts, and design characteristics were among the datasets that had to be collected. This section describes these datasets and their sources in detail.
4.1. Crash Data Safety improvement can be defined in terms of crash frequency or crash severity. An effective treatment should reduce crash frequency, decrease average crash severity, or a combination of both. Crash data for three years before the installation and each year after the installation was requested from MDOT SHA. Two separate datasets were provided for each site, one with the detailed information of total crashes, and one with the detailed information of pedestrian/bicyclist crashes. Each crash record has detailed information regarding time, location, severity, etc. This study focused on four different crash statistics:
• Total Crashes: Total crashes include total crashes regardless if they involved a pedestrian.
• Severe Crashes: Severe crashes are total crashes with injuries, including fatal crashes. It was obtained by removing property damage-only crashes from total crashes.
• Pedestrian/Bicyclist Crashes: Pedestrian/bicyclist crashes are total crashes involving a pedestrian or bicyclist.
• Pedestrian/Bicyclist Fatal Crashes: Pedestrian/bicyclist fatal crashes are all pedestrian/bicyclist crashes that resulted in a pedestrian or bicyclist death.
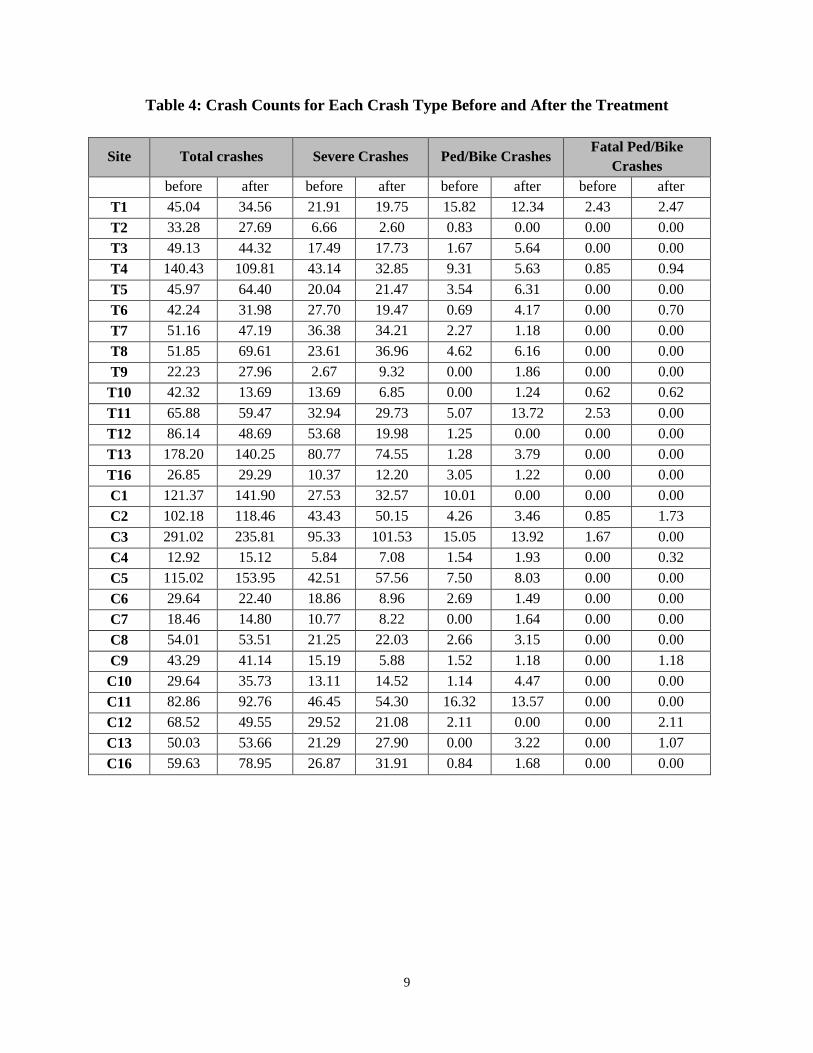
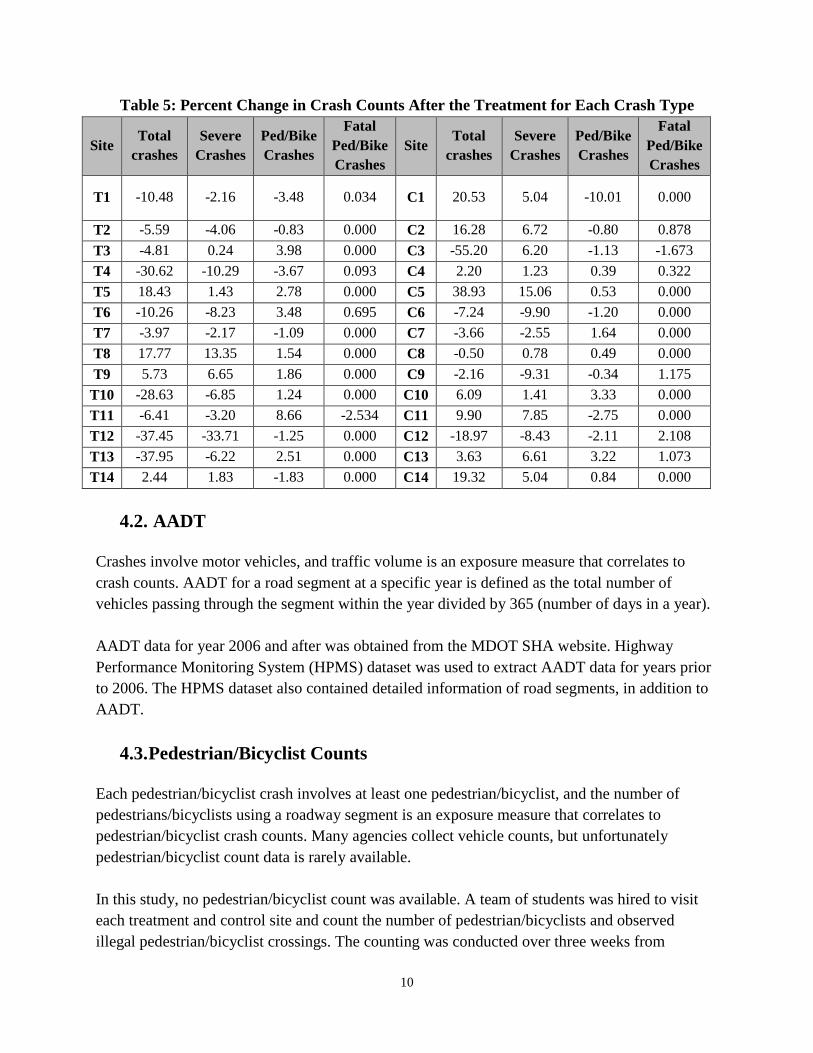
Table 4 includes crash counts for both before and after periods. Site 17 is not shown because crash counts were zero both before and after the treatment for all crash types. Site 18 is also not shown because the installation date was 2016 and no after period data existed. “T” sites are the target sites, and “C” sites are the corresponding control sites. Table 5 shows the percent change information. Details of the trend in before-after data is presented in the trend analysis section.
9
Table 4: Crash Counts for Each Crash Type Before and After the Treatment
Site Total crashes Severe Crashes Ped/Bike Crashes Fatal Ped/Bike
Crashes
before after before after before after before after
T1 45.04 34.56 21.91 19.75 15.82 12.34 2.43 2.47 T2 33.28 27.69 6.66 2.60 0.83 0.00 0.00 0.00 T3 49.13 44.32 17.49 17.73 1.67 5.64 0.00 0.00 T4 140.43 109.81 43.14 32.85 9.31 5.63 0.85 0.94 T5 45.97 64.40 20.04 21.47 3.54 6.31 0.00 0.00 T6 42.24 31.98 27.70 19.47 0.69 4.17 0.00 0.70 T7 51.16 47.19 36.38 34.21 2.27 1.18 0.00 0.00 T8 51.85 69.61 23.61 36.96 4.62 6.16 0.00 0.00 T9 22.23 27.96 2.67 9.32 0.00 1.86 0.00 0.00
T10 42.32 13.69 13.69 6.85 0.00 1.24 0.62 0.62 T11 65.88 59.47 32.94 29.73 5.07 13.72 2.53 0.00 T12 86.14 48.69 53.68 19.98 1.25 0.00 0.00 0.00 T13 178.20 140.25 80.77 74.55 1.28 3.79 0.00 0.00 T16 26.85 29.29 10.37 12.20 3.05 1.22 0.00 0.00 C1 121.37 141.90 27.53 32.57 10.01 0.00 0.00 0.00 C2 102.18 118.46 43.43 50.15 4.26 3.46 0.85 1.73 C3 291.02 235.81 95.33 101.53 15.05 13.92 1.67 0.00 C4 12.92 15.12 5.84 7.08 1.54 1.93 0.00 0.32 C5 115.02 153.95 42.51 57.56 7.50 8.03 0.00 0.00 C6 29.64 22.40 18.86 8.96 2.69 1.49 0.00 0.00 C7 18.46 14.80 10.77 8.22 0.00 1.64 0.00 0.00 C8 54.01 53.51 21.25 22.03 2.66 3.15 0.00 0.00 C9 43.29 41.14 15.19 5.88 1.52 1.18 0.00 1.18 C10 29.64 35.73 13.11 14.52 1.14 4.47 0.00 0.00 C11 82.86 92.76 46.45 54.30 16.32 13.57 0.00 0.00 C12 68.52 49.55 29.52 21.08 2.11 0.00 0.00 2.11 C13 50.03 53.66 21.29 27.90 0.00 3.22 0.00 1.07 C16 59.63 78.95 26.87 31.91 0.84 1.68 0.00 0.00
10
Table 5: Percent Change in Crash Counts After the Treatment for Each Crash Type
Site Total
crashes Severe
Crashes Ped/Bike Crashes
Fatal Ped/Bike Crashes
Site Total
crashes Severe
Crashes Ped/Bike Crashes
Fatal Ped/Bike Crashes
T1 -10.48 -2.16 -3.48 0.034 C1 20.53 5.04 -10.01 0.000
T2 -5.59 -4.06 -0.83 0.000 C2 16.28 6.72 -0.80 0.878 T3 -4.81 0.24 3.98 0.000 C3 -55.20 6.20 -1.13 -1.673 T4 -30.62 -10.29 -3.67 0.093 C4 2.20 1.23 0.39 0.322 T5 18.43 1.43 2.78 0.000 C5 38.93 15.06 0.53 0.000 T6 -10.26 -8.23 3.48 0.695 C6 -7.24 -9.90 -1.20 0.000 T7 -3.97 -2.17 -1.09 0.000 C7 -3.66 -2.55 1.64 0.000 T8 17.77 13.35 1.54 0.000 C8 -0.50 0.78 0.49 0.000 T9 5.73 6.65 1.86 0.000 C9 -2.16 -9.31 -0.34 1.175 T10 -28.63 -6.85 1.24 0.000 C10 6.09 1.41 3.33 0.000 T11 -6.41 -3.20 8.66 -2.534 C11 9.90 7.85 -2.75 0.000 T12 -37.45 -33.71 -1.25 0.000 C12 -18.97 -8.43 -2.11 2.108 T13 -37.95 -6.22 2.51 0.000 C13 3.63 6.61 3.22 1.073 T14 2.44 1.83 -1.83 0.000 C14 19.32 5.04 0.84 0.000
4.2. AADT Crashes involve motor vehicles, and traffic volume is an exposure measure that correlates to crash counts. AADT for a road segment at a specific year is defined as the total number of vehicles passing through the segment within the year divided by 365 (number of days in a year). AADT data for year 2006 and after was obtained from the MDOT SHA website. Highway Performance Monitoring System (HPMS) dataset was used to extract AADT data for years prior to 2006. The HPMS dataset also contained detailed information of road segments, in addition to AADT.
4.3. Pedestrian/Bicyclist Counts Each pedestrian/bicyclist crash involves at least one pedestrian/bicyclist, and the number of pedestrians/bicyclists using a roadway segment is an exposure measure that correlates to pedestrian/bicyclist crash counts. Many agencies collect vehicle counts, but unfortunately pedestrian/bicyclist count data is rarely available. In this study, no pedestrian/bicyclist count was available. A team of students was hired to visit each treatment and control site and count the number of pedestrian/bicyclists and observed illegal pedestrian/bicyclist crossings. The counting was conducted over three weeks from
11
Tuesday to Thursday in September and October of 2016. The team collected data for a minimum of two hours at each site. These counts were converted into average annual counts. The National Bicycle and Pedestrian Documentation Project 15 findings were used to convert hourly pedestrian/bicyclist counts to daily and annual counts. This conversion was done using hourly, weekly, and monthly adjustment factors.
4.4. Geometric Design Data A review of literature shows that geometric design has significant influence on crashes. Information such as the number of lanes, lane width, and speed limit is required in the development of safety performance functions (SPF). The Empirical Bayes method used in this study predicts the number of crashes using SPFs. Geometric design data such as the number of lanes, lane width, speed limit, and the distance to transit stations was collected during the site visits.
12
5. PEDESTRIAN/BICYCLIST SURVEY Surveys reveal public opinion about the success of treatments and socio-economic factors impacting mid-block crossing. The research team designed three different surveys for pedestrians, bicyclists, and local business owners (see Appendix A), and conducted the surveys at all treatment sites during September and October of 2016. Pedestrians and bicyclists passing through the segment with median treatment installation were surveyed about their socio-demographics, opinion about the success of the treatment, and suggestions for further improvements.
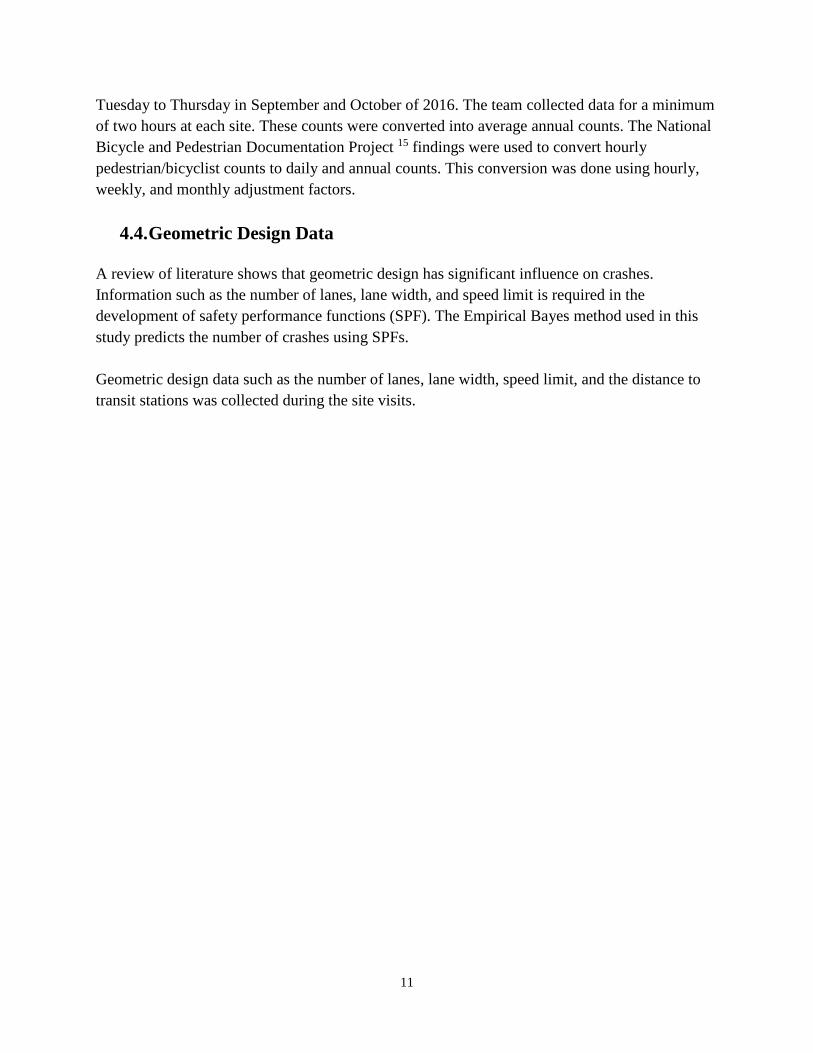
5.1. Pedestrian/Bicyclist Surveys A total of 63 responses from pedestrians/bicyclists were collected. The surveys include questions about age, gender, and other socio-demographic characteristics of the pedestrian/bicyclist. Pedestrians/bicyclists were asked about the type of improvement they would like to see along the route they were walking/biking. Figure 4 summarizes their answers.
Figure 4: Pedestrian/Bicyclist Opinion about Their Desired Improvement
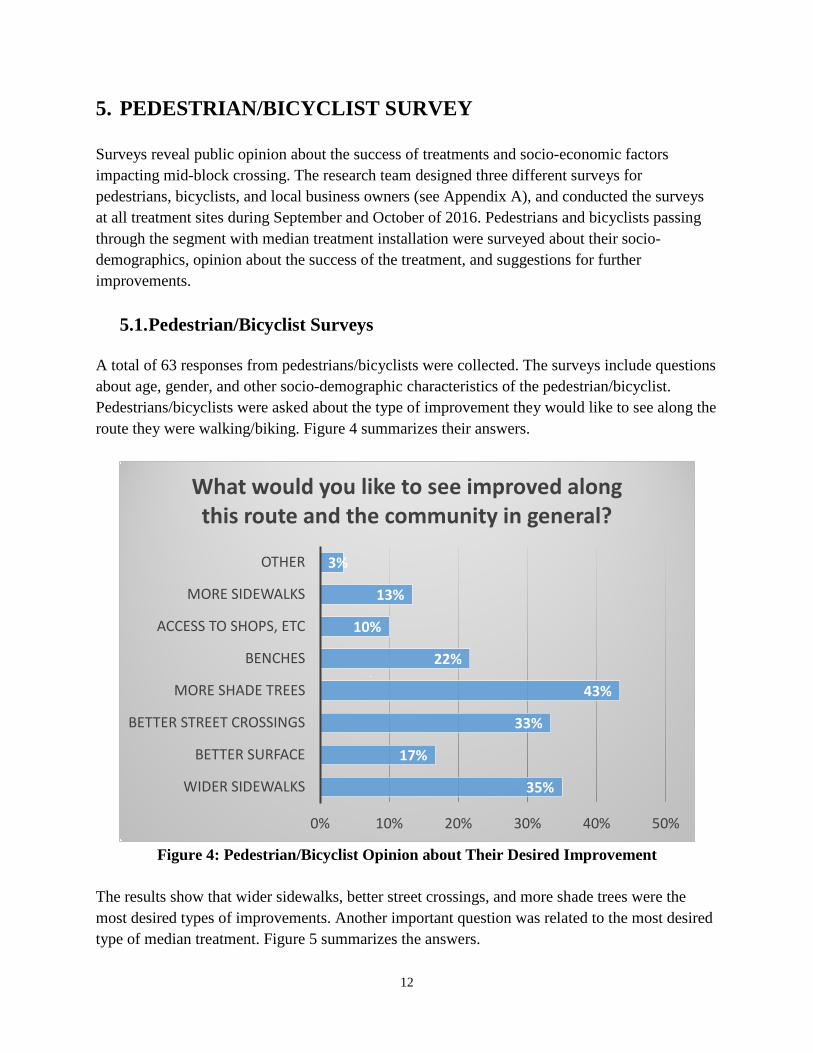
The results show that wider sidewalks, better street crossings, and more shade trees were the most desired types of improvements. Another important question was related to the most desired type of median treatment. Figure 5 summarizes the answers.
35%
17%
33%
43%
22%
10%
13%
3%
0% 10% 20% 30% 40% 50%
WIDER SIDEWALKS
BETTER SURFACE
BETTER STREET CROSSINGS
MORE SHADE TREES
BENCHES
ACCESS TO SHOPS, ETC
MORE SIDEWALKS
OTHER
What would you like to see improved along this route and the community in general?
13
Figure 5: Desired Type of Median Treatment
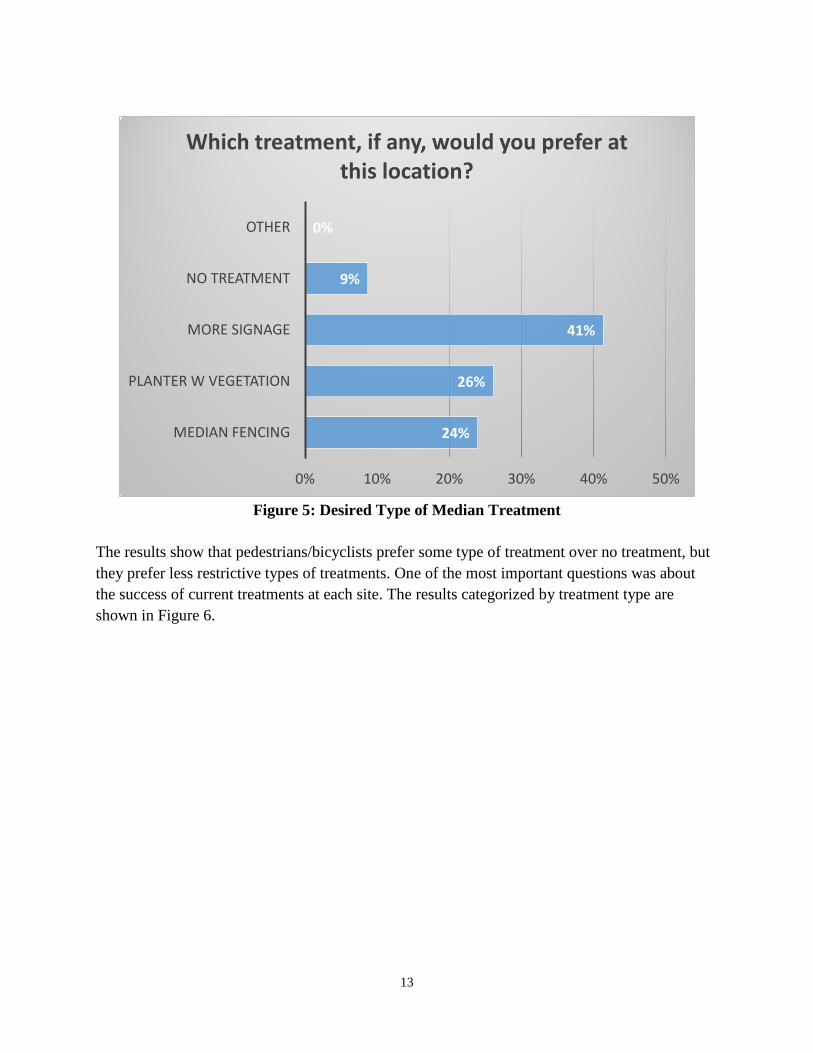
The results show that pedestrians/bicyclists prefer some type of treatment over no treatment, but they prefer less restrictive types of treatments. One of the most important questions was about the success of current treatments at each site. The results categorized by treatment type are shown in Figure 6.
24%
26%
41%
9%
0%
0% 10% 20% 30% 40% 50%
MEDIAN FENCING
PLANTER W VEGETATION
MORE SIGNAGE
NO TREATMENT
OTHER
Which treatment, if any, would you prefer at this location?
14
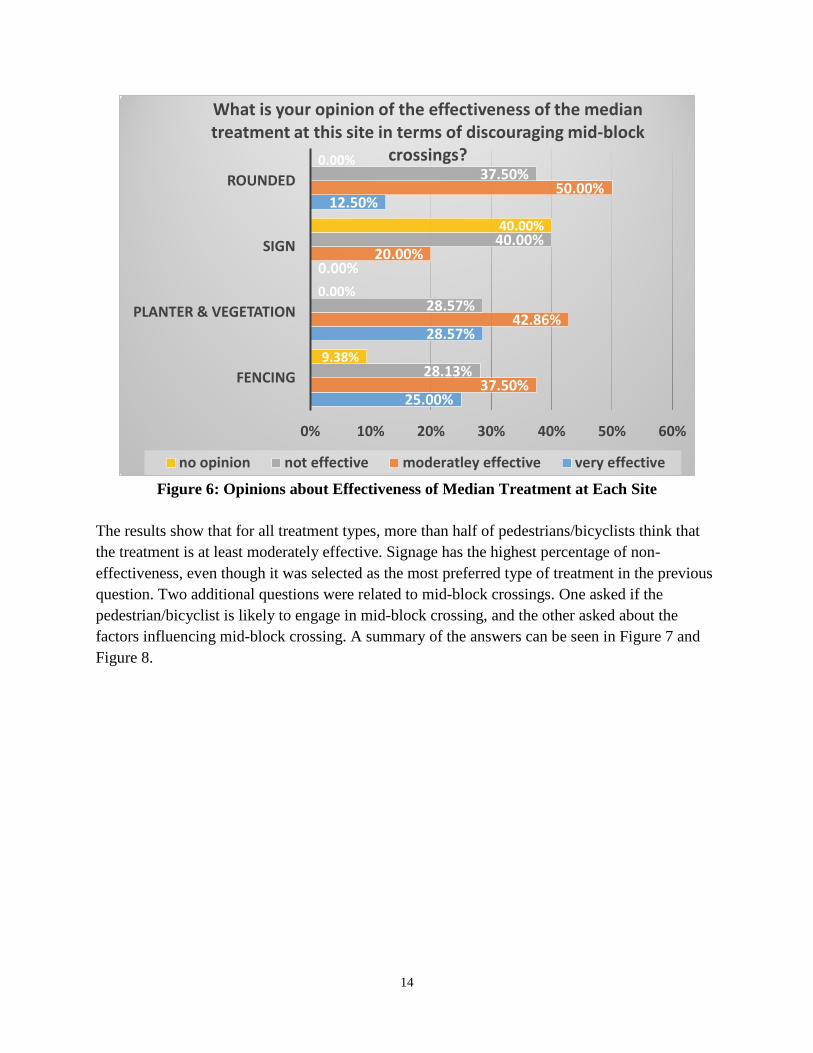
Figure 6: Opinions about Effectiveness of Median Treatment at Each Site
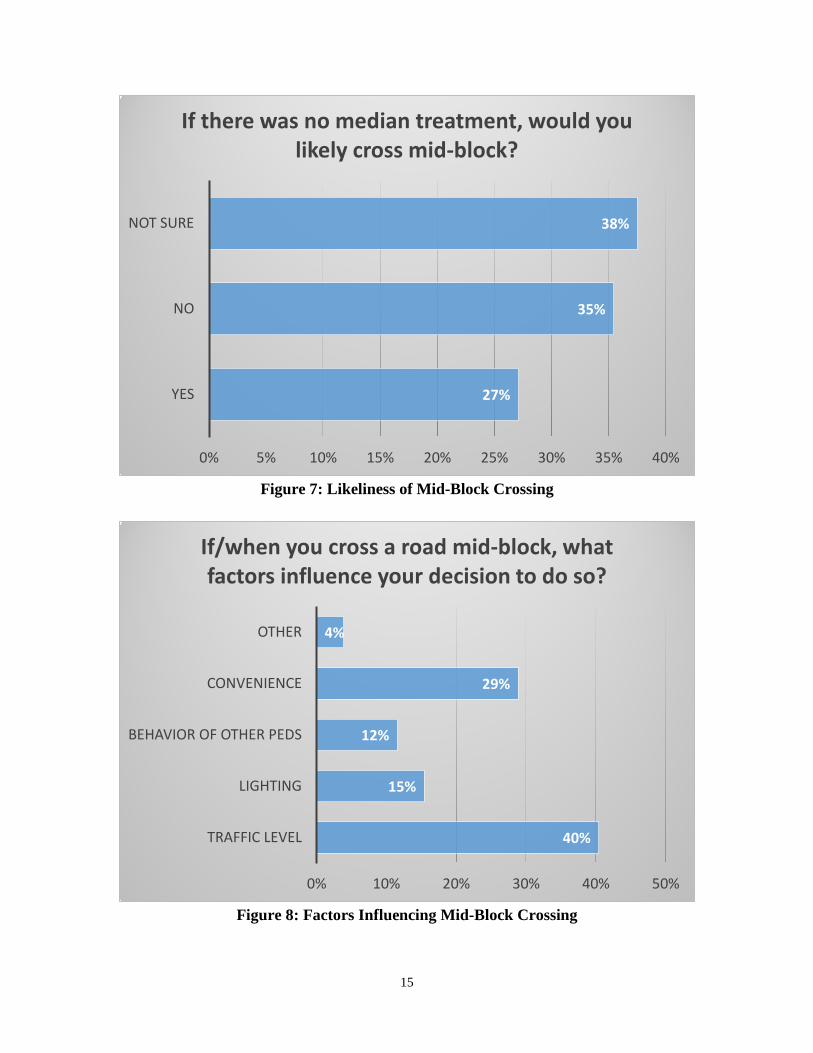
The results show that for all treatment types, more than half of pedestrians/bicyclists think that the treatment is at least moderately effective. Signage has the highest percentage of non-effectiveness, even though it was selected as the most preferred type of treatment in the previous question. Two additional questions were related to mid-block crossings. One asked if the pedestrian/bicyclist is likely to engage in mid-block crossing, and the other asked about the factors influencing mid-block crossing. A summary of the answers can be seen in Figure 7 and Figure 8.
25.00%
28.57%
0.00%
12.50%
37.50%
42.86%
20.00%
50.00%
28.13%
28.57%
40.00%
37.50%
9.38%
0.00%
40.00%
0.00%
0% 10% 20% 30% 40% 50% 60%
FENCING
PLANTER & VEGETATION
SIGN
ROUNDED
What is your opinion of the effectiveness of the median treatment at this site in terms of discouraging mid-block
crossings?
no opinion not effective moderatley effective very effective
15
Figure 7: Likeliness of Mid-Block Crossing
Figure 8: Factors Influencing Mid-Block Crossing
27%
35%
38%
0% 5% 10% 15% 20% 25% 30% 35% 40%
YES
NO
NOT SURE
If there was no median treatment, would you likely cross mid-block?
40%
15%
12%
29%
4%
0% 10% 20% 30% 40% 50%
TRAFFIC LEVEL
LIGHTING
BEHAVIOR OF OTHER PEDS
CONVENIENCE
OTHER
If/when you cross a road mid-block, what factors influence your decision to do so?
16
Figure 7 shows that only about 35% of pedestrians/cyclists were sure that they would not cross mid-block. This shows the widespread mid-block crossing behavior among pedestrians/bicyclists, and highlights the importance of discouraging such behaviors by either a treatment installation or education. Figure 8 shows that the main factors influencing the mid-block crossing are traffic level and convenience. Gaker et. al 16 focused on social influences and named the behavior of others as one of the most important factors influencing mid-block crossings. Figure 8 shows a contradicting result that these pedestrians/bicyclists are either not affected by others, or unaware of the significance of others’ behavior impact.
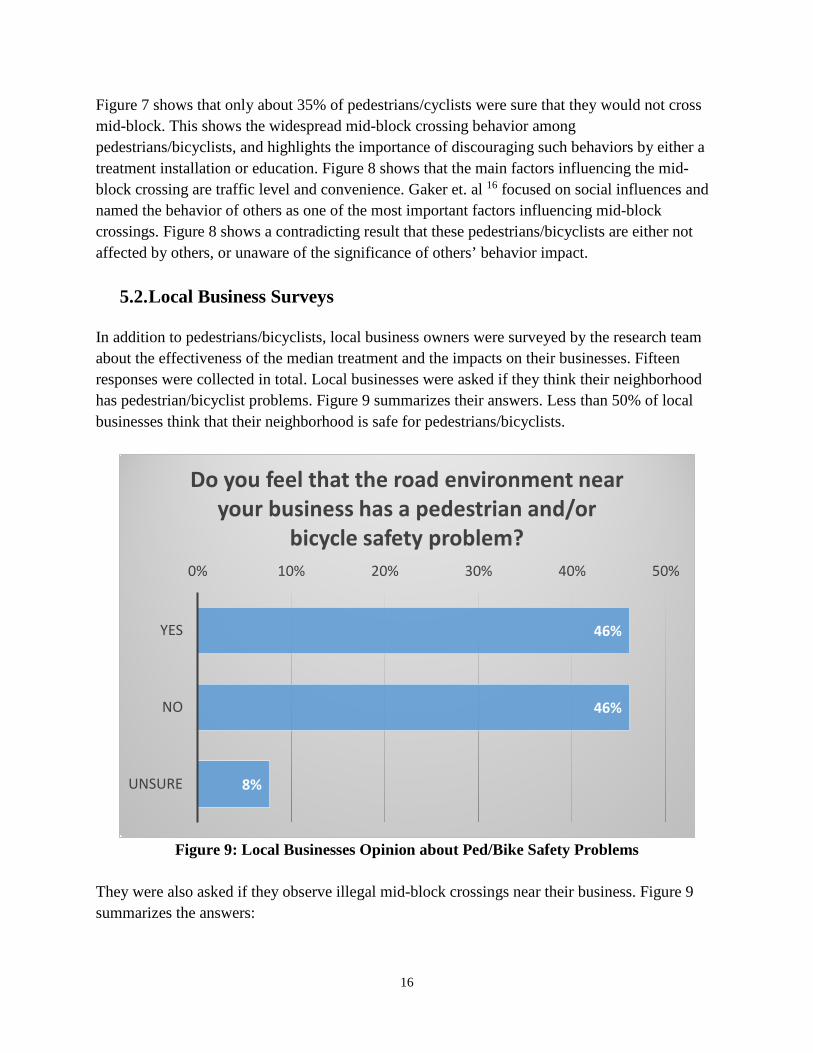
5.2. Local Business Surveys In addition to pedestrians/bicyclists, local business owners were surveyed by the research team about the effectiveness of the median treatment and the impacts on their businesses. Fifteen responses were collected in total. Local businesses were asked if they think their neighborhood has pedestrian/bicyclist problems. Figure 9 summarizes their answers. Less than 50% of local businesses think that their neighborhood is safe for pedestrians/bicyclists.
Figure 9: Local Businesses Opinion about Ped/Bike Safety Problems
They were also asked if they observe illegal mid-block crossings near their business. Figure 9 summarizes the answers:
46%
46%
8%
0% 10% 20% 30% 40% 50%
YES
NO
UNSURE
Do you feel that the road environment near your business has a pedestrian and/or
bicycle safety problem?
17
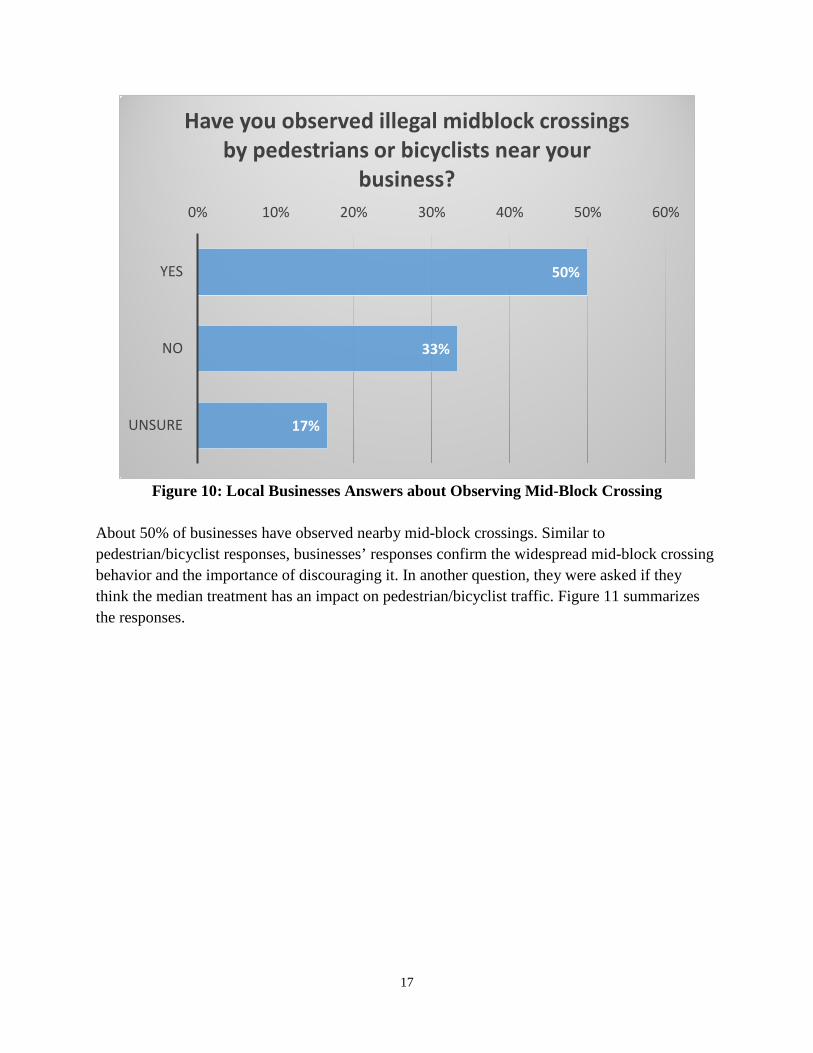
Figure 10: Local Businesses Answers about Observing Mid-Block Crossing
About 50% of businesses have observed nearby mid-block crossings. Similar to pedestrian/bicyclist responses, businesses’ responses confirm the widespread mid-block crossing behavior and the importance of discouraging it. In another question, they were asked if they think the median treatment has an impact on pedestrian/bicyclist traffic. Figure 11 summarizes the responses.
50%
33%
17%
0% 10% 20% 30% 40% 50% 60%
YES
NO
UNSURE
Have you observed illegal midblock crossings by pedestrians or bicyclists near your
business?
18
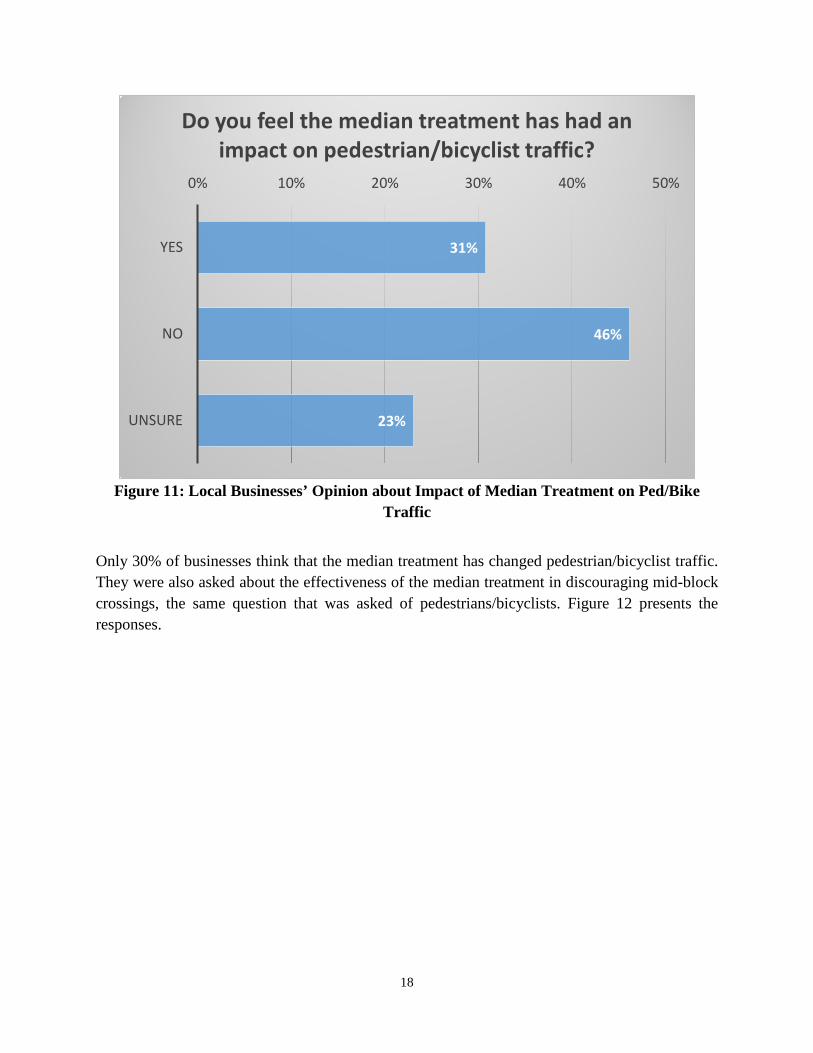
Figure 11: Local Businesses’ Opinion about Impact of Median Treatment on Ped/Bike
Traffic Only 30% of businesses think that the median treatment has changed pedestrian/bicyclist traffic. They were also asked about the effectiveness of the median treatment in discouraging mid-block crossings, the same question that was asked of pedestrians/bicyclists. Figure 12 presents the responses.
31%
46%
23%
0% 10% 20% 30% 40% 50%
YES
NO
UNSURE
Do you feel the median treatment has had an impact on pedestrian/bicyclist traffic?
19
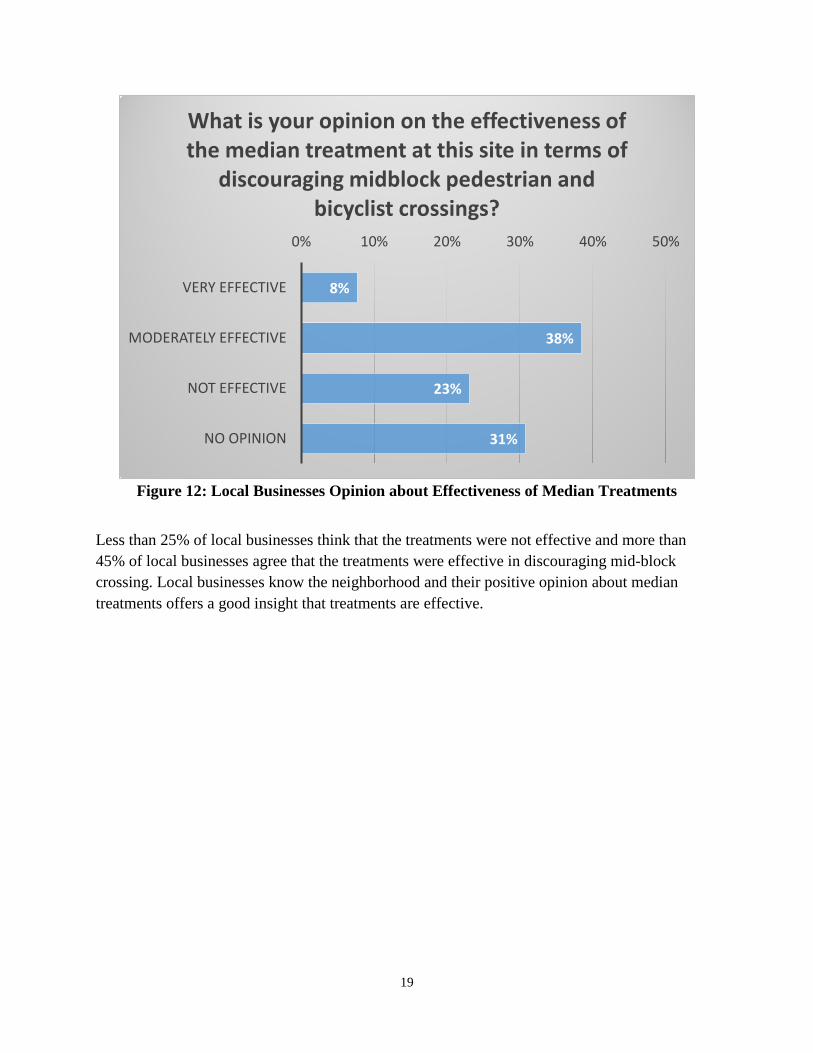
Figure 12: Local Businesses Opinion about Effectiveness of Median Treatments
Less than 25% of local businesses think that the treatments were not effective and more than 45% of local businesses agree that the treatments were effective in discouraging mid-block crossing. Local businesses know the neighborhood and their positive opinion about median treatments offers a good insight that treatments are effective.
8%
38%
23%
31%
0% 10% 20% 30% 40% 50%
VERY EFFECTIVE
MODERATELY EFFECTIVE
NOT EFFECTIVE
NO OPINION
What is your opinion on the effectiveness of the median treatment at this site in terms of
discouraging midblock pedestrian and bicyclist crossings?
20
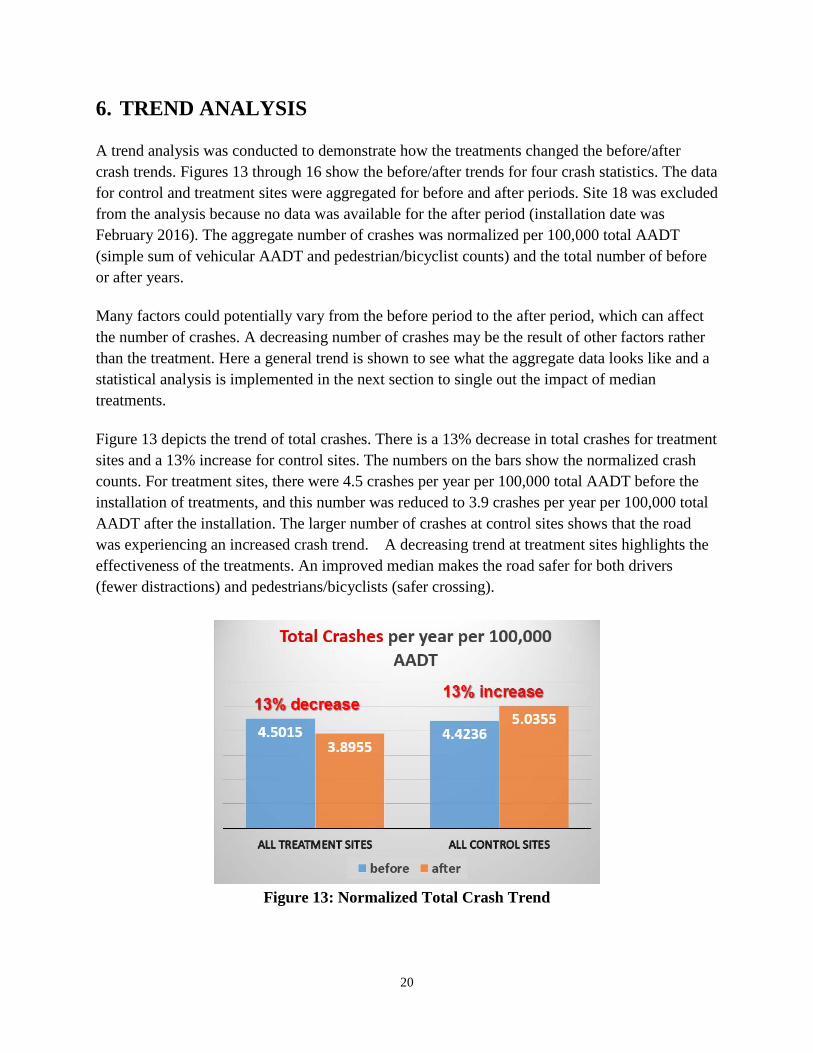
6. TREND ANALYSIS A trend analysis was conducted to demonstrate how the treatments changed the before/after crash trends. Figures 13 through 16 show the before/after trends for four crash statistics. The data for control and treatment sites were aggregated for before and after periods. Site 18 was excluded from the analysis because no data was available for the after period (installation date was February 2016). The aggregate number of crashes was normalized per 100,000 total AADT (simple sum of vehicular AADT and pedestrian/bicyclist counts) and the total number of before or after years. Many factors could potentially vary from the before period to the after period, which can affect the number of crashes. A decreasing number of crashes may be the result of other factors rather than the treatment. Here a general trend is shown to see what the aggregate data looks like and a statistical analysis is implemented in the next section to single out the impact of median treatments. Figure 13 depicts the trend of total crashes. There is a 13% decrease in total crashes for treatment sites and a 13% increase for control sites. The numbers on the bars show the normalized crash counts. For treatment sites, there were 4.5 crashes per year per 100,000 total AADT before the installation of treatments, and this number was reduced to 3.9 crashes per year per 100,000 total AADT after the installation. The larger number of crashes at control sites shows that the road was experiencing an increased crash trend. A decreasing trend at treatment sites highlights the effectiveness of the treatments. An improved median makes the road safer for both drivers (fewer distractions) and pedestrians/bicyclists (safer crossing).
Figure 13: Normalized Total Crash Trend
21
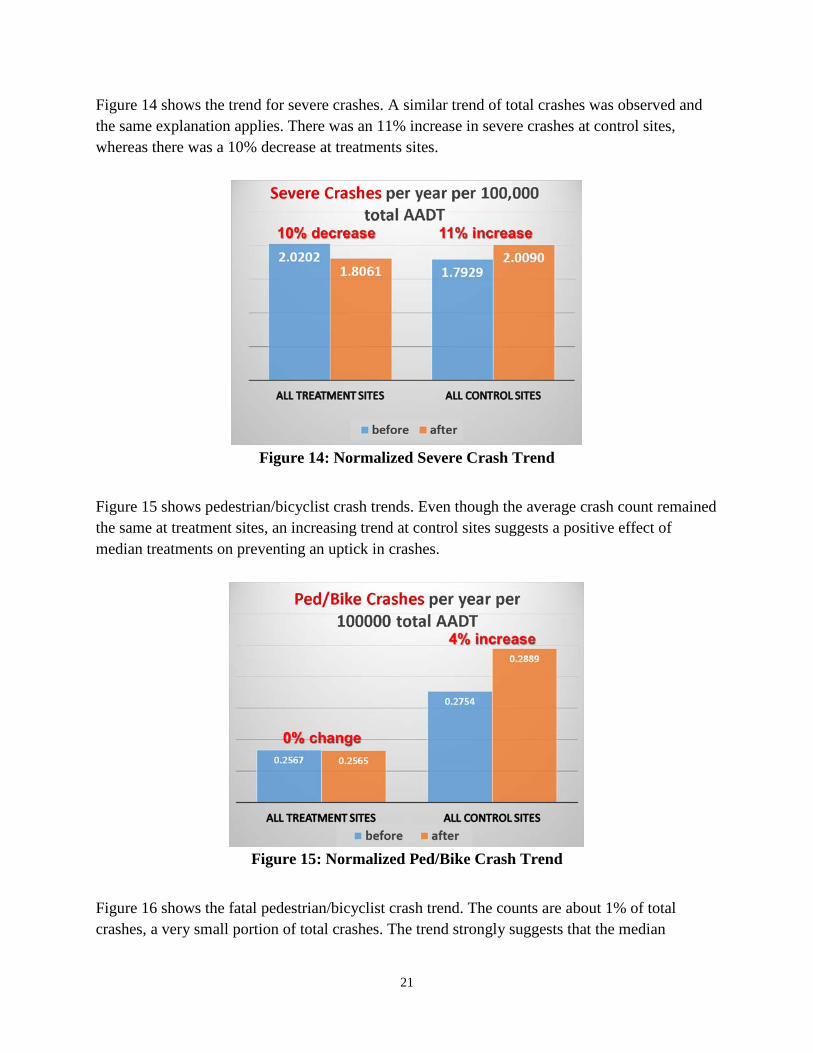
Figure 14 shows the trend for severe crashes. A similar trend of total crashes was observed and the same explanation applies. There was an 11% increase in severe crashes at control sites, whereas there was a 10% decrease at treatments sites.
Figure 14: Normalized Severe Crash Trend
Figure 15 shows pedestrian/bicyclist crash trends. Even though the average crash count remained the same at treatment sites, an increasing trend at control sites suggests a positive effect of median treatments on preventing an uptick in crashes.
Figure 15: Normalized Ped/Bike Crash Trend
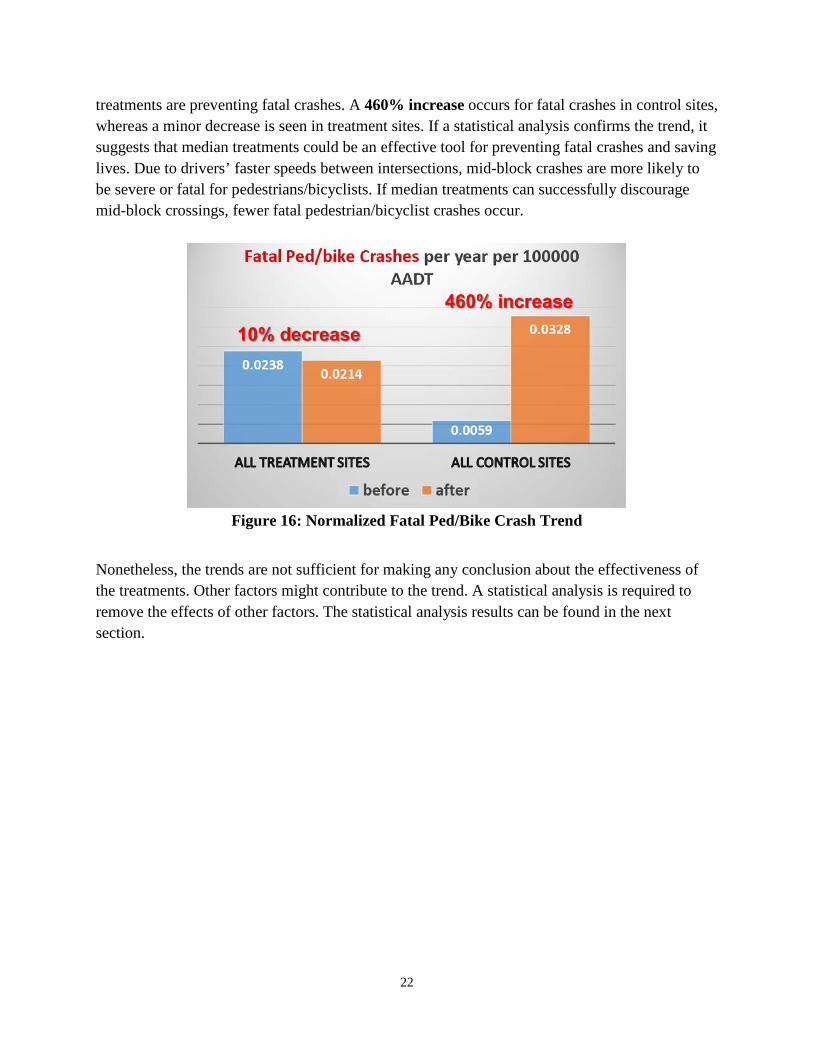
Figure 16 shows the fatal pedestrian/bicyclist crash trend. The counts are about 1% of total crashes, a very small portion of total crashes. The trend strongly suggests that the median
22
treatments are preventing fatal crashes. A 460% increase occurs for fatal crashes in control sites, whereas a minor decrease is seen in treatment sites. If a statistical analysis confirms the trend, it suggests that median treatments could be an effective tool for preventing fatal crashes and saving lives. Due to drivers’ faster speeds between intersections, mid-block crashes are more likely to be severe or fatal for pedestrians/bicyclists. If median treatments can successfully discourage mid-block crossings, fewer fatal pedestrian/bicyclist crashes occur.
Figure 16: Normalized Fatal Ped/Bike Crash Trend
Nonetheless, the trends are not sufficient for making any conclusion about the effectiveness of the treatments. Other factors might contribute to the trend. A statistical analysis is required to remove the effects of other factors. The statistical analysis results can be found in the next section.
23
7. STATISTICAL ANALYSIS The purpose of the statistical analysis is to separate the effect of median treatments from the effect of other influencing factors. The Empirical Bayes (EB) method was found to be the most appropriate method for a before/after treatment effectiveness analysis, especially when the sample size is small. Section 7.1 describes the EB method and section 7.2 presents the results of the statistical analysis.
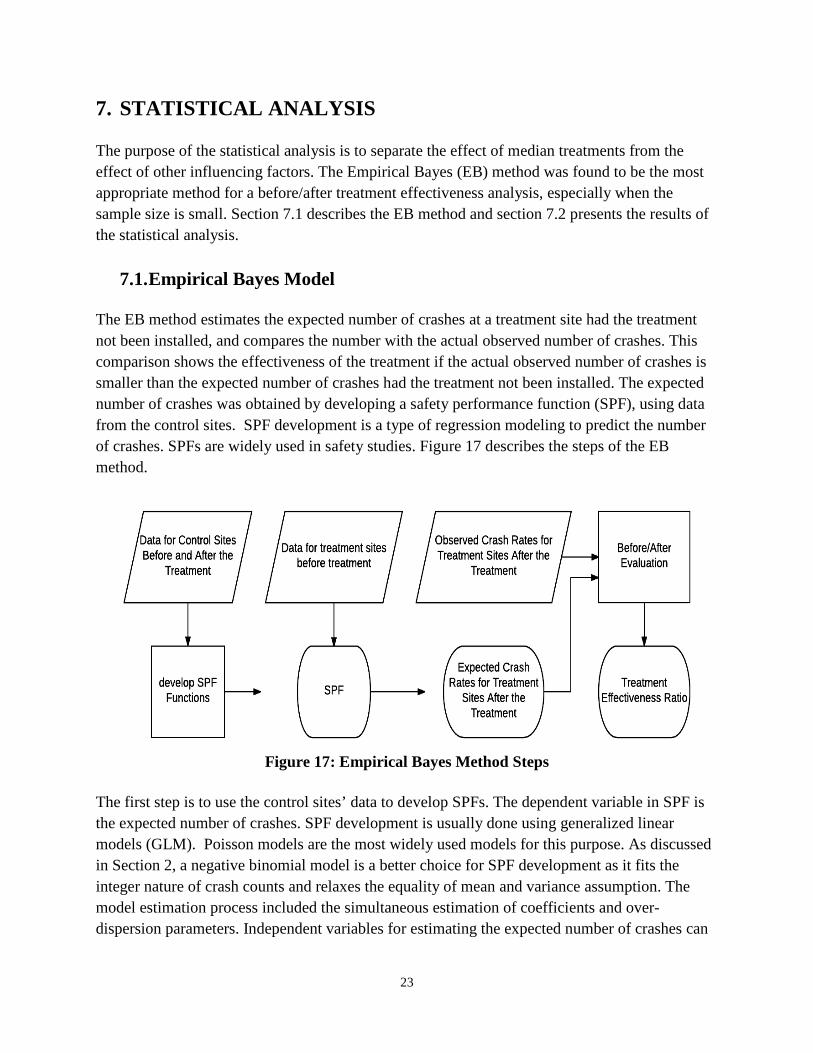
7.1. Empirical Bayes Model The EB method estimates the expected number of crashes at a treatment site had the treatment not been installed, and compares the number with the actual observed number of crashes. This comparison shows the effectiveness of the treatment if the actual observed number of crashes is smaller than the expected number of crashes had the treatment not been installed. The expected number of crashes was obtained by developing a safety performance function (SPF), using data from the control sites. SPF development is a type of regression modeling to predict the number of crashes. SPFs are widely used in safety studies. Figure 17 describes the steps of the EB method.
Figure 17: Empirical Bayes Method Steps
The first step is to use the control sites’ data to develop SPFs. The dependent variable in SPF is the expected number of crashes. SPF development is usually done using generalized linear models (GLM). Poisson models are the most widely used models for this purpose. As discussed in Section 2, a negative binomial model is a better choice for SPF development as it fits the integer nature of crash counts and relaxes the equality of mean and variance assumption. The model estimation process included the simultaneous estimation of coefficients and over-dispersion parameters. Independent variables for estimating the expected number of crashes can
24
be any known relevant variable. AADT, pedestrian counts, pedestrian illegal crossings, bicycle counts, bicyclist illegal crossings, speed limit, number of lanes, lane width, and near-bars location were selected as the independent variables used for this study. The SPF estimates are per-day crash frequency with number of days used as an offset variable. Expected number of crashes for the entire before-after period can be obtained by multiplying the expected number of crashes per day by the number of days in the period. Once SPF development is completed, before-treatment data from treatment sites can be inserted into SPF to obtain the expected number of crashes before treatment installations. For each site i, the observed before-treatment crashes were combined with the expected crashes using Equation 1.
𝑩𝑩𝒊𝒊 = 𝒘𝒘𝒊𝒊 ∗ 𝑬𝑬(𝒄𝒄𝒊𝒊) + (𝟏𝟏 − 𝒘𝒘𝒊𝒊) ∗ 𝒄𝒄𝒊𝒊 Equation 1 In Equation 1, 𝐵𝐵𝑖𝑖, is the combined crashes, 𝑐𝑐𝑖𝑖 is the observed crashes, and 𝐸𝐸(𝑐𝑐𝑖𝑖) is the expected number of crashes from SPF prediction. 𝑤𝑤𝑖𝑖 is the weight, obtained by Equation 2.
𝒘𝒘𝒊𝒊 = 𝟏𝟏𝟏𝟏+𝒌𝒌∗𝑬𝑬(𝒄𝒄𝒊𝒊)
Equation 2
In Equation 2, k is the over-dispersion parameter of the negative binomial regression. After obtaining the estimate for before-treatment number of crashes, after-treatment number of crashes can be obtained using the adjustment factor of Equation 3.
𝑭𝑭𝒊𝒊 = 𝒓𝒓𝑫𝑫,𝒊𝒊 ∗ 𝒓𝒓𝑪𝑪,𝒊𝒊 Equation 3 In Equation 3, 𝑟𝑟𝐷𝐷,𝑖𝑖 is the ratio between number of days in the after period and number of days in the before period. 𝑟𝑟𝐶𝐶,𝑖𝑖is the ratio between SPF prediction for the after period and SPF prediction for the before period. The predicted number of crashes for the after period can be obtained from Equation 4.
𝑨𝑨𝒊𝒊 = 𝑭𝑭𝒊𝒊 ∗ 𝑩𝑩𝒊𝒊 Equation 4 In Equation 4, 𝐴𝐴𝑖𝑖 is the predicted number of crashes for the after period. The variance of this prediction can be calculated using Equation 5.
𝑽𝑽𝑽𝑽𝒓𝒓(𝑨𝑨𝒊𝒊) = 𝑭𝑭𝒊𝒊𝟐𝟐 ∗ 𝑩𝑩𝒊𝒊 ∗ (𝟏𝟏 − 𝒘𝒘𝒊𝒊) Equation 5 After calculating the predictions and variances at each site, the total index of effectiveness can be obtained from Equation 6.
25
𝜽𝜽 = ∑ 𝒐𝒐𝒊𝒊𝒏𝒏𝒊𝒊=𝟏𝟏
∑ 𝑨𝑨𝒊𝒊𝒏𝒏𝒊𝒊=𝟏𝟏 (𝟏𝟏+
∑ 𝑽𝑽𝑽𝑽𝒓𝒓(𝑨𝑨𝒊𝒊)𝒏𝒏𝒊𝒊=𝟏𝟏
�∑ 𝑨𝑨𝒊𝒊𝒏𝒏𝒊𝒊=𝟏𝟏 �𝟐𝟐
� ) Equation 6
In Equation 6, i indicates the sites, n is the total number of sites, and 𝑜𝑜𝑖𝑖 is the observed number of crashes at site i after the treatment. If θ is less than 1, the treatment has a positive effect on safety. Percent change in number of crashes can be obtained by Equation 7.
𝑷𝑷𝑷𝑷𝒓𝒓𝒄𝒄𝑷𝑷𝒏𝒏𝑷𝑷 𝑪𝑪𝑪𝑪𝑽𝑽𝒏𝒏𝑪𝑪𝑷𝑷 𝒊𝒊𝒏𝒏 𝑵𝑵𝑵𝑵𝑵𝑵𝑵𝑵𝑷𝑷𝒓𝒓 𝒐𝒐𝒐𝒐 𝑪𝑪𝒓𝒓𝑽𝑽𝑪𝑪𝑪𝑪𝑷𝑷𝑪𝑪 = 𝟏𝟏𝟏𝟏𝟏𝟏 ∗ (𝟏𝟏 − 𝜽𝜽) Equation 7 The variance of this estimated θ can be obtained by Equation 8.
𝑽𝑽𝑽𝑽𝒓𝒓(𝜽𝜽) = 𝜽𝜽𝟐𝟐 ∗ ( 𝟏𝟏∑ 𝒐𝒐𝒊𝒊𝒏𝒏𝒊𝒊=𝟏𝟏
+∑ 𝑽𝑽𝑽𝑽𝒓𝒓(𝑨𝑨𝒊𝒊)𝒏𝒏𝒊𝒊=𝟏𝟏
�∑ 𝑨𝑨𝒊𝒊𝒏𝒏𝒊𝒊=𝟏𝟏 �𝟐𝟐
� )
(𝟏𝟏+∑ 𝑽𝑽𝑽𝑽𝒓𝒓(𝑨𝑨𝒊𝒊)𝒏𝒏𝒊𝒊=𝟏𝟏
�∑ 𝑨𝑨𝒊𝒊𝒏𝒏𝒊𝒊=𝟏𝟏 �𝟐𝟐
� )𝟐𝟐 Equation 8
7.2. Statistical Analysis Results
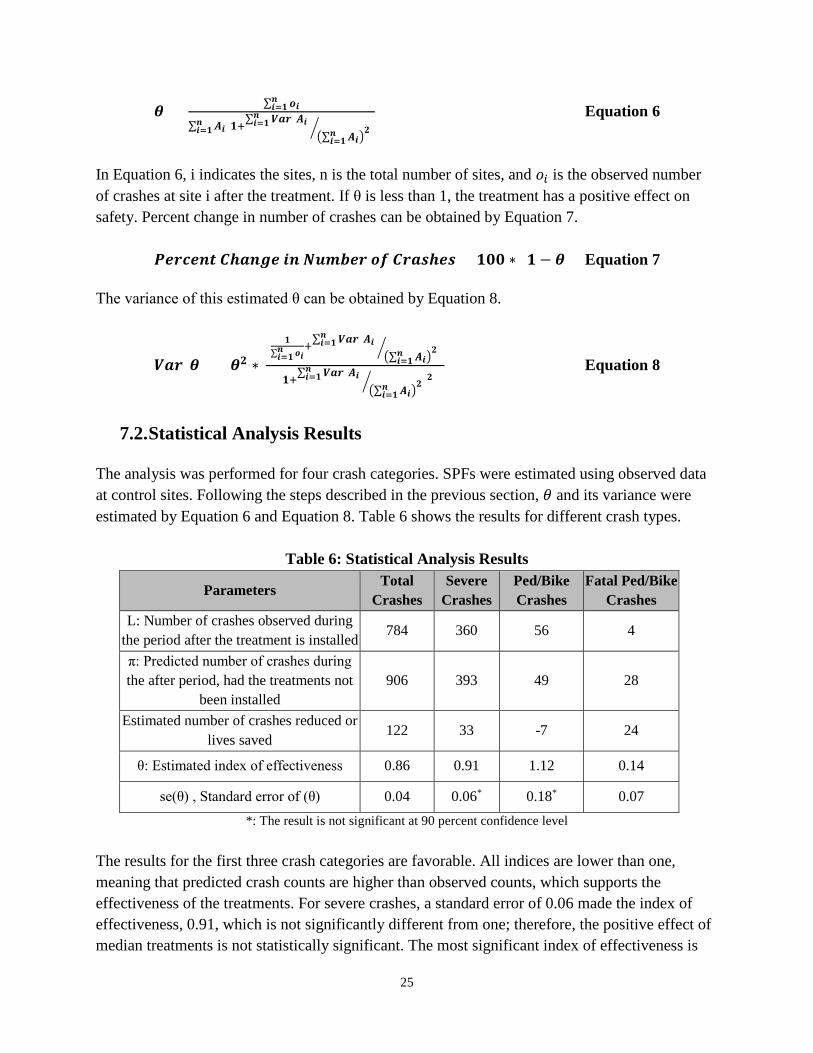
The analysis was performed for four crash categories. SPFs were estimated using observed data at control sites. Following the steps described in the previous section, 𝜃𝜃 and its variance were estimated by Equation 6 and Equation 8. Table 6 shows the results for different crash types.
Table 6: Statistical Analysis Results
Parameters Total Crashes
Severe Crashes
Ped/Bike Crashes
Fatal Ped/Bike Crashes
L: Number of crashes observed during the period after the treatment is installed 784 360 56 4
π: Predicted number of crashes during the after period, had the treatments not
been installed 906 393 49 28
Estimated number of crashes reduced or lives saved
122 33 -7 24
θ: Estimated index of effectiveness 0.86 0.91 1.12 0.14
se(θ) , Standard error of (θ) 0.04 0.06* 0.18* 0.07 *: The result is not significant at 90 percent confidence level
The results for the first three crash categories are favorable. All indices are lower than one, meaning that predicted crash counts are higher than observed counts, which supports the effectiveness of the treatments. For severe crashes, a standard error of 0.06 made the index of effectiveness, 0.91, which is not significantly different from one; therefore, the positive effect of median treatments is not statistically significant. The most significant index of effectiveness is

26
observed in fatal pedestrian/bicyclist crashes. The index is 0.14, which indicates a sharp 86% decrease in fatal crashes, and the improvement is statically significant, even at 99% confidence level. Based on the statistical estimation, the median treatments installed at the 16 sites have reduced the number of total crashes by 122 (14%), the number of severe crashes by 33 (9%), and the number of fatal crashes by 24 (86%). The result for the last category, pedestrian/bicyclist crashes, is not statistically significant. These results show that the treatment has significantly reduced the total number of total crashes (vehicle and pedestrian/bicyclist) and fatal pedestrian/bicyclist crashes, but it has not significantly affected the total number of pedestrian/bicyclist crashes. The significant positive effect of the median treatment on total crashes is consistent with the expectation and findings of the literature. In terms of pedestrian crashes, trend and statistical analysis showed that median treatment does not decrease crash frequency, but it makes the severe and fatal crashes less probable (i.e. lower fatal crashes). The analysis and survey results made the authors suspect that the median treatment shifts pedestrian crashes from mid-block to intersections. While pedestrians need to observe only one direction of movement at mid-blocks to prevent a crash, they need to pay attention to various turning movements at intersections. However, drivers are more attentive at intersections, and they usually travel at slower speeds. Therefore, improvements are not observed in terms of reduced crash frequency, but in terms of fewer fatal crashes.
27
8. SUMMARY AND CONCLUSIONS Median treatments are believed to improve safety for pedestrians/bicyclists. Previous studies showed benefits for both vehicles and pedestrians/bicyclists, but the statistical analysis of such benefits is lacking in the literature. This study seeks to quantify the benefits using trend and statistical analysis to compare crash data before and after median treatments at 16 sites within Maryland. In order to perform before and after statistical analysis, one site immediately upstream or downstream of each treatment site was selected as a control site. In total, 14 control sites were selected, where two pairs of treatment sites share control sites. The crash data for all 30 sites was provided by MDOT SHA. The study period was three years before and three years after the installation. Pedestrian counts, bicyclist counts, and geometric design data were collected at each site. Pedestrian/bicyclist counts were collected for a minimum of two hours and included the count of legal and illegal crossings. In addition, geometric design information was gathered and pedestrian/bicyclist and local business surveys were distributed. The surveys were designed to understand social factors influencing mid-block crossings and the public opinion about the effectiveness of median treatments. These surveys were distributed at all treatment sites. In total, 63 pedestrian/bicyclist survey responses and 15 local business survey responses were collected. The analysis of survey results showed that more than 60% of pedestrians/bicyclists were likely to engage in a mid-block crossing. It also showed that more than 50% of pedestrians/bicyclists and local businesses believe that median treatments were effective in preventing or discouraging mid-block crossings. The trend analysis was conducted to observe the crash trend before and after the median treatment installation. The trend analysis showed that the crash frequency of total crashes, severe crashes, and fatal pedestrian/bicyclist crashes decreased in treatment sites after the treatment, while the same crash statistics increased at control sites. For the total pedestrian/bicyclist crashes, crash frequency stayed the same at treatment sites after the treatment, while it increased at control sites. These observations gave insight on the effectiveness of the treatments, but a statistical analysis is required to confirm it. Statistical analysis was conducted using the Empirical Bayes (EB) method. The EB method compares the expected number of crashes had the treatments not been installed with the actual observed number of crashes to evaluate the effectiveness of the treatments. In order to predict the number of crashes, safety performance functions (SPF) were developed using generalized linear model (GLM) regression. SPF development involves regressing crash frequencies on observed variables such as AADT, pedestrian counts, speed limit, etc., using data from control sites. Once SPFs were developed, the EB method used the data at treatment sites to obtain the index of effectiveness. Index of effectiveness shows how effective the treatments were in terms of
28
improving safety. The results of statistical analysis showed that the rate of total crashes and pedestrian/bicyclist fatalities had a statistically significant decrease after the treatments. The index of effectiveness for pedestrian/bicyclist fatalities was 0.14 and was significant at a 99% confidence level. This result showed a promising positive effect of median treatments on pedestrian/bicyclist fatalities. The effect on severe crashes and total pedestrian/bicyclist crashes was not significant. The results of trend and statistical analysis, in combination with findings from surveys, showed that median treatments have a positive effect on total crashes and fatalities. While it demonstrated that median treatments do not decrease the pedestrian/bicyclist crashes, it makes pedestrian/ bicyclist fatal crashes less probable. The authors suspect that median treatments move the location of pedestrian/bicyclist crashes from mid-block to intersections. Crashes at intersections are more likely to happen because of varying turn movements, but they are less likely to be fatal because of lower speeds and higher drivers’ attentiveness.
29
REFERENCES 1. Bicycling And Walking In The United States 2016 Benchmarking Report. 2016.
2. FHWA Road Safety Audit Guidelines. Federal Highway Adminstration. 3. Bowman BL, Vecellio RL, Miao J. Vehicle and pedestrian accident models for median
locations. Journal of transportation engineering. 1995;121(6): 531-537.
4. Parsonson PS, Waters III M, Fincher J. Georgia study confirms the continuing safety advantage of raised medians over two-way left-turn lanes. Paper presented at: Fourth National Access Management Conference2000.
5. Gattis J, Balakumar R, Duncan L. Effects of rural highway median treatments and access. Transportation Research Record: Journal of the Transportation Research Board. 2005(1931): 99-107.
6. Chu X, Guttenplan M, Baltes M. Why people cross where they do: the role of street environment. Transportation Research Record: Journal of the Transportation Research Board. 2004(1878): 3-10.
7. King MJ, Soole D, Ghafourian A. Illegal pedestrian crossing at signalised intersections: incidence and relative risk. Accident Analysis & Prevention. 2009;41(3): 485-490.
8. Eisele W, Frawley W. Estimating the safety and operational impact of raised medians and driveway density: experiences from Texas and Oklahoma case studies. Transportation Research Record: Journal of the Transportation Research Board. 2005(1931): 108-116.
9. Hauer E. Observational Before-After Studies In Road Safety--Estimating The Effect Of Highway And Traffic Engineering Measures On Road Safety. 1997.
10. Nelder JA, Baker RJ. Generalized linear models. Encyclopedia of statistical sciences. 1972.
11. Miranda-Moreno L, Fu L, Saccomanno F, Labbe A. Alternative risk models for ranking locations for safety improvement. Transportation Research Record: Journal of the Transportation Research Board. 2005(1908): 1-8.
12. Bolstad WM. Understanding computational Bayesian statistics. Vol 644: John Wiley & Sons; 2010.
13. Persaud BN, Retting RA, Garder PE, Lord D. Observational Before-After Study of the Safety Effect of TRB ID: 01-0562 US Roundabout Conversions Using the Empirical Bayes Method.
14. Fitzpatrick K, Park ES. Safety Effectiveness of the HAWK Pedestrian Crossing Treatment. 2010.
15. Jones M. National bicycle and pedestrian documentation project. Transportation Research Board, Washington, DC. 2009.
16. Gaker D, Zheng Y, Walker J. Experimental economics in transportation: focus on social influences and provision of information. Transportation Research Record: Journal of the Transportation Research Board. 2010(2156): 47-55.

30
APPENDIX A SURVEYS
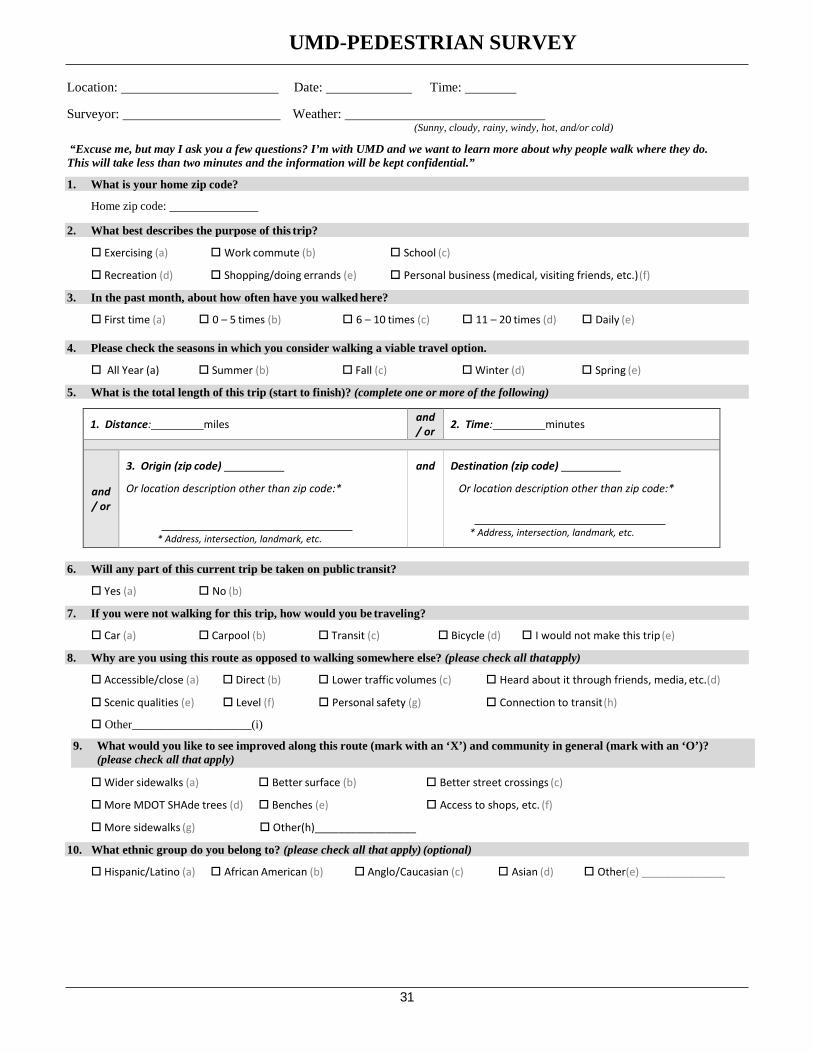
UMD-PEDESTRIAN SURVEY
31
Location: Date: Time:
Surveyor: Weather: (Sunny, cloudy, rainy, windy, hot, and/or cold)
“Excuse me, but may I ask you a few questions? I’m with UMD and we want to learn more about why people walk where they do. This will take less than two minutes and the information will be kept confidential.”
1. What is your home zip code?
Home zip code:
2. What best describes the purpose of this trip?
Exercising (a) Work commute (b) School (c)
Recreation (d) Shopping/doing errands (e) Personal business (medical, visiting friends, etc.) (f)
3. In the past month, about how often have you walked here?
First time (a) 0 – 5 times (b) 6 – 10 times (c) 11 – 20 times (d) Daily (e)
4. Please check the seasons in which you consider walking a viable travel option.
All Year (a) Summer (b) Fall (c) Winter (d) Spring (e)
5. What is the total length of this trip (start to finish)? (complete one or more of the following)
1. Distance: miles and / or 2. Time: minutes
and / or
3. Origin (zip code)
Or location description other than zip code:*
* Address, intersection, landmark, etc.
and Destination (zip code)
Or location description other than zip code:*
* Address, intersection, landmark, etc.
6. Will any part of this current trip be taken on public transit?
Yes (a) No (b)
7. If you were not walking for this trip, how would you be traveling?
Car (a) Carpool (b) Transit (c) Bicycle (d) I would not make this trip (e)
8. Why are you using this route as opposed to walking somewhere else? (please check all that apply)
Accessible/close (a) Direct (b) Lower traffic volumes (c) Heard about it through friends, media, etc.(d)
Scenic qualities (e) Level (f) Personal safety (g) Connection to transit (h)
Other____________________(i)
Wider sidewalks (a) Better surface (b) Better street crossings (c)
More MDOT SHAde trees (d) Benches (e) Access to shops, etc. (f)
More sidewalks (g) Other(h)_________________
10. What ethnic group do you belong to? (please check all that apply) (optional)
Hispanic/Latino (a) African American (b) Anglo/Caucasian (c) Asian (d) Other(e) ______________
9. What would you like to see improved along this route (mark with an ‘X’) and community in general (mark with an ‘O’)? (please check all that apply)
UMD-PEDESTRIAN SURVEY
32
________________years 12. What is your opinion on the effectiveness of the median treatment at this site in terms of discouraging/preventing mid-block
pedestrian crossings?
Very Effective(a) Moderately Effective (b) Not Effective (c) No Opinion (d)
13. If there was no median treatment, would you likely cross mid-block?
Yes (a) No (b) Not Sure (c)
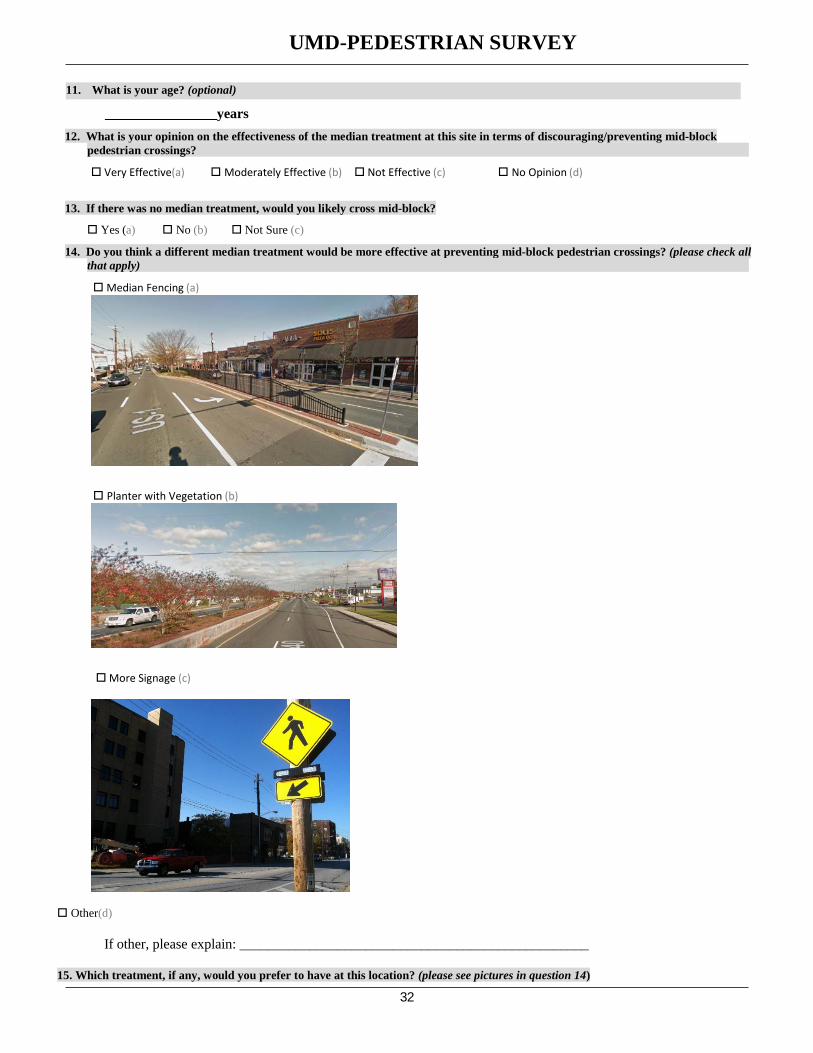
14. Do you think a different median treatment would be more effective at preventing mid-block pedestrian crossings? (please check all that apply)
Median Fencing (a)
Planter with Vegetation (b)
More Signage (c)
Other(d)
If other, please explain: __________________________________________________ 15. Which treatment, if any, would you prefer to have at this location? (please see pictures in question 14)
11. What is your age? (optional)
UMD-PEDESTRIAN SURVEY
33
Median Fencing (a) Planter with Vegetation (b) More Signage (c) No treatment (d) Other(e) If other, please explain: __________________________________________________
15. If/when you cross a road mid-block, what factors influence your decision to do so? (please check all that apply)
Traffic Level (a) Lighting (b) Behavior of other pedestrians (c) Convenience (d) Other(e) If other, please explain: __________________________________________________
Thank you for your participation!
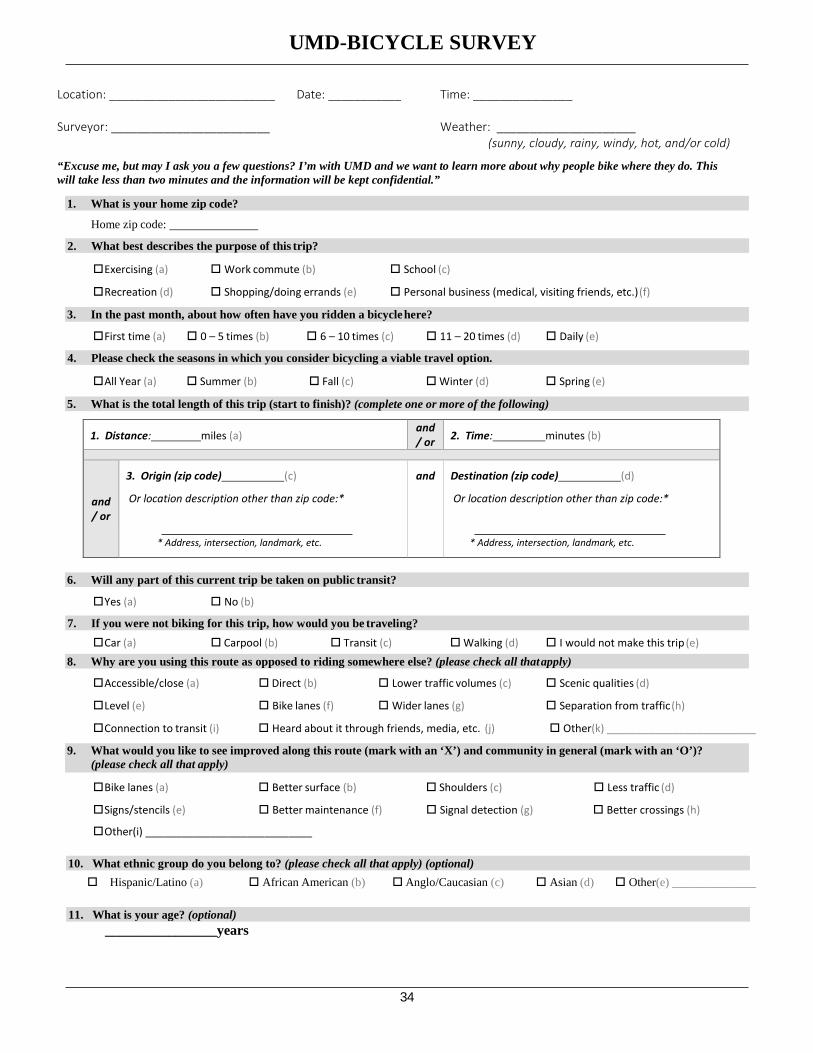
UMD-BICYCLE SURVEY
34
Location: _________________________ Date: ___________ Time: _______________
Surveyor: ________________________ Weather: _____________________ (sunny, cloudy, rainy, windy, hot, and/or cold)
“Excuse me, but may I ask you a few questions? I’m with UMD and we want to learn more about why people bike where they do. This will take less than two minutes and the information will be kept confidential.”
Home zip code:
Exercising (a) Work commute (b) School (c)
Recreation (d) Shopping/doing errands (e) Personal business (medical, visiting friends, etc.) (f)
First time (a) 0 – 5 times (b) 6 – 10 times (c) 11 – 20 times (d) Daily (e)
All Year (a) Summer (b) Fall (c) Winter (d) Spring (e)
1. Distance: miles (a) and / or 2. Time: minutes (b)
and / or
3. Origin (zip code) (c)
Or location description other than zip code:*
* Address, intersection, landmark, etc.
and Destination (zip code) (d)
Or location description other than zip code:*
* Address, intersection, landmark, etc.
Yes (a) No (b)
Car (a) Carpool (b) Transit (c) Walking (d) I would not make this trip (e)
Accessible/close (a) Direct (b) Lower traffic volumes (c) Scenic qualities (d)
Level (e) Bike lanes (f) Wider lanes (g) Separation from traffic (h)
Connection to transit (i) Heard about it through friends, media, etc. (j) Other(k) _________________________
Bike lanes (a) Better surface (b) Shoulders (c) Less traffic (d)
Signs/stencils (e) Better maintenance (f) Signal detection (g) Better crossings (h)
Other(i) ____________________________
Hispanic/Latino (a) African American (b) Anglo/Caucasian (c) Asian (d) Other(e) ______________
________________years
2. What best describes the purpose of this trip?
4. Please check the seasons in which you consider bicycling a viable travel option.
7. If you were not biking for this trip, how would you be traveling?
1. What is your home zip code?
3. In the past month, about how often have you ridden a bicycle here?
5. What is the total length of this trip (start to finish)? (complete one or more of the following)
6. Will any part of this current trip be taken on public transit?
8. Why are you using this route as opposed to riding somewhere else? (please check all that apply)
9. What would you like to see improved along this route (mark with an ‘X’) and community in general (mark with an ‘O’)? (please check all that apply)
10. What ethnic group do you belong to? (please check all that apply) (optional)
11. What is your age? (optional)
UMD-BICYCLE SURVEY
35
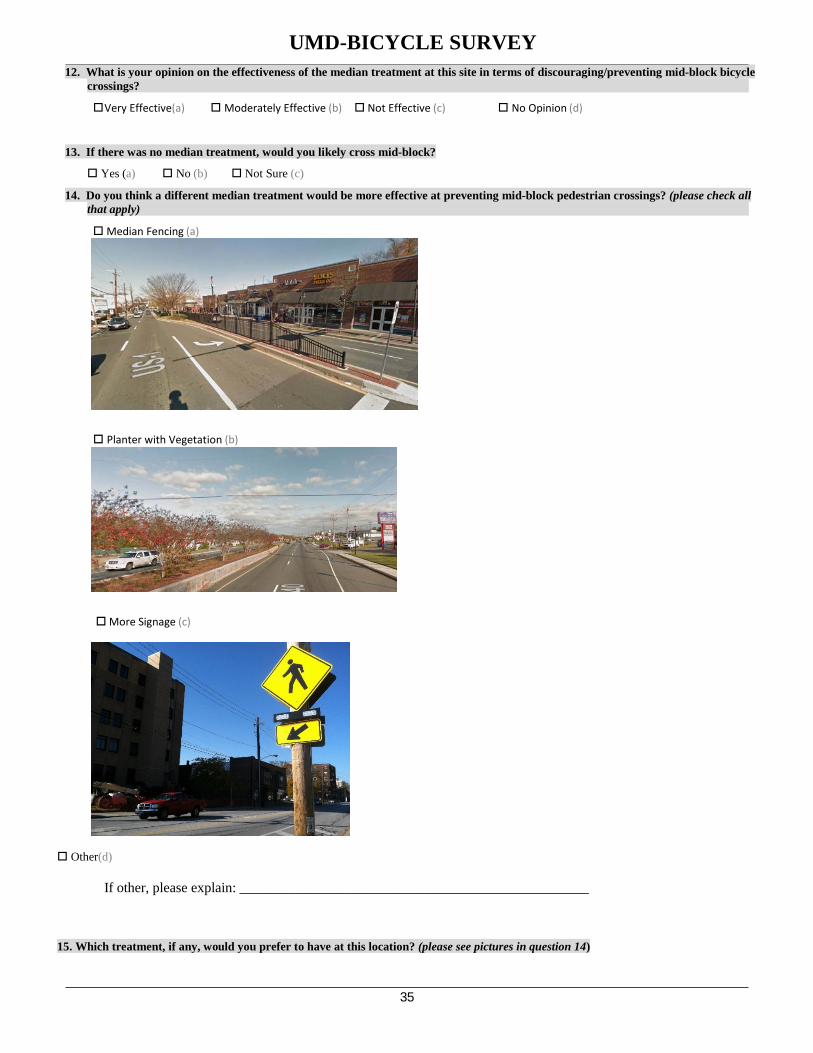
12. What is your opinion on the effectiveness of the median treatment at this site in terms of discouraging/preventing mid-block bicycle crossings?
Very Effective(a) Moderately Effective (b) Not Effective (c) No Opinion (d)
13. If there was no median treatment, would you likely cross mid-block?
Yes (a) No (b) Not Sure (c)
14. Do you think a different median treatment would be more effective at preventing mid-block pedestrian crossings? (please check all that apply)
Median Fencing (a)
Planter with Vegetation (b)
More Signage (c)
Other(d)
If other, please explain: __________________________________________________ 15. Which treatment, if any, would you prefer to have at this location? (please see pictures in question 14)
UMD-BICYCLE SURVEY
36
Median Fencing (a) Planter with Vegetation (b) More Signage (c) No treatment (d) Other(e) If other, please explain: __________________________________________________
15. If/when you cross a road mid-block, what factors influence your decision to do so? (please check all that apply)
Traffic Level (a) Lighting (b) Behavior of other pedestrians (c) Convenience (d) Other(e) If other, please explain: __________________________________________________
Thank you for your participation!
UMD-LOCAL BUSINESS SURVEY
37
Location: _________________________ Date: ___________ Time: _______________
Surveyor: ________________________ Business Name: _____________________
“Excuse me, but may I ask you a few questions? I’m with UMD and we want to learn more about why people bike where they do. This will take less than two minutes and the information will be kept confidential.”
Years
Yes (a) No b) Unsure (c)
If yes, please explain: ______________________________________________________________________
Yes (a) No b) Unsure (c)
If yes, please explain how frequently__________________________________________________________
Yes (a) No b) Unsure (c)
If yes, please explain: ______________________________________________________________________
Very Effective(a) Moderately Effective (b) Not Effective (c) No Opinion (d)\
Median Fencing (a)
Planter with Vegetation (b)
3. Have you ever observed illegal mid-block crossings by pedestrians or bicyclists (i.e. jaywalking) near your business l ti ?
4. Do you feel the median treatment has had an impact on pedestrian/bicyclist traffic (i.e. the number pedestrian/bicyclist in using this road)?
5. What is your opinion on the effectiveness of the median treatment at this site in terms of discouraging/preventing mid-block bicycle crossings? (please check all that apply
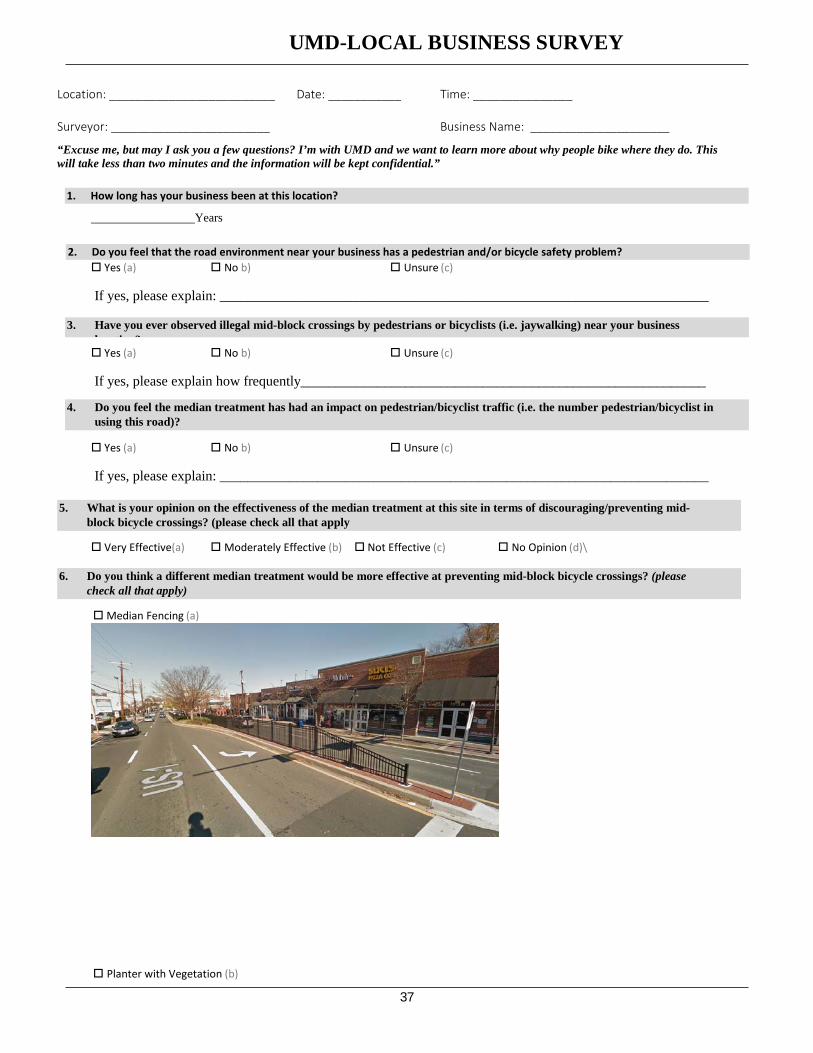
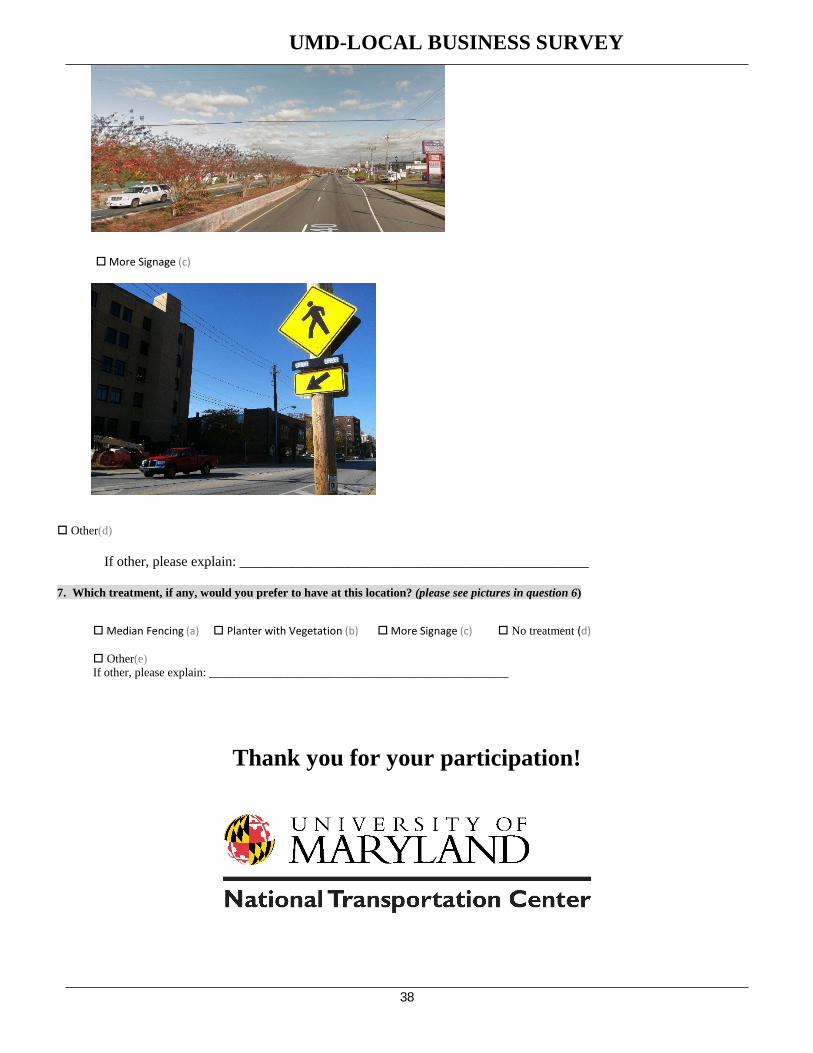
6. Do you think a different median treatment would be more effective at preventing mid-block bicycle crossings? (please check all that apply)
1. How long has your business been at this location?
2. Do you feel that the road environment near your business has a pedestrian and/or bicycle safety problem?
UMD-LOCAL BUSINESS SURVEY
38
More Signage (c)
Other(d)
If other, please explain: __________________________________________________
7. Which treatment, if any, would you prefer to have at this location? (please see pictures in question 6)
Median Fencing (a) Planter with Vegetation (b) More Signage (c) No treatment (d) Other(e) If other, please explain: __________________________________________________
Thank you for your participation!

39
APPENDIX B SAMPLE AEREAL PHOTOS
40
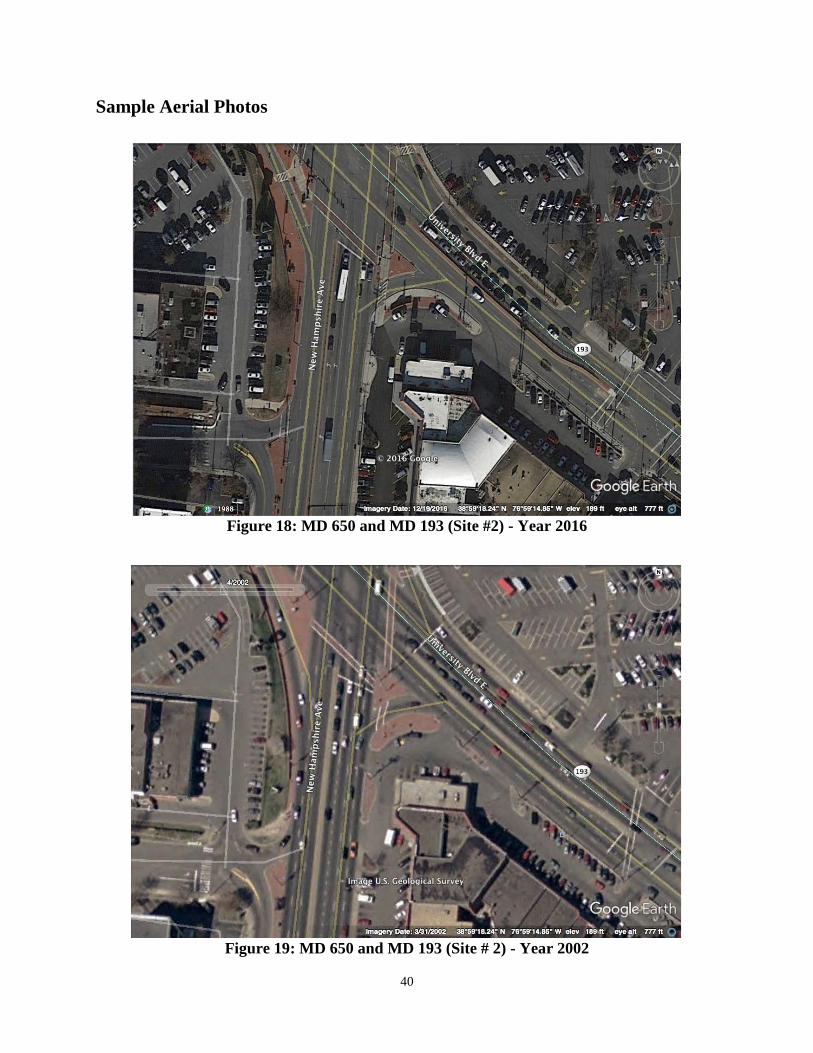
Sample Aerial Photos
Figure 18: MD 650 and MD 193 (Site #2) - Year 2016
Figure 19: MD 650 and MD 193 (Site # 2) - Year 2002
41
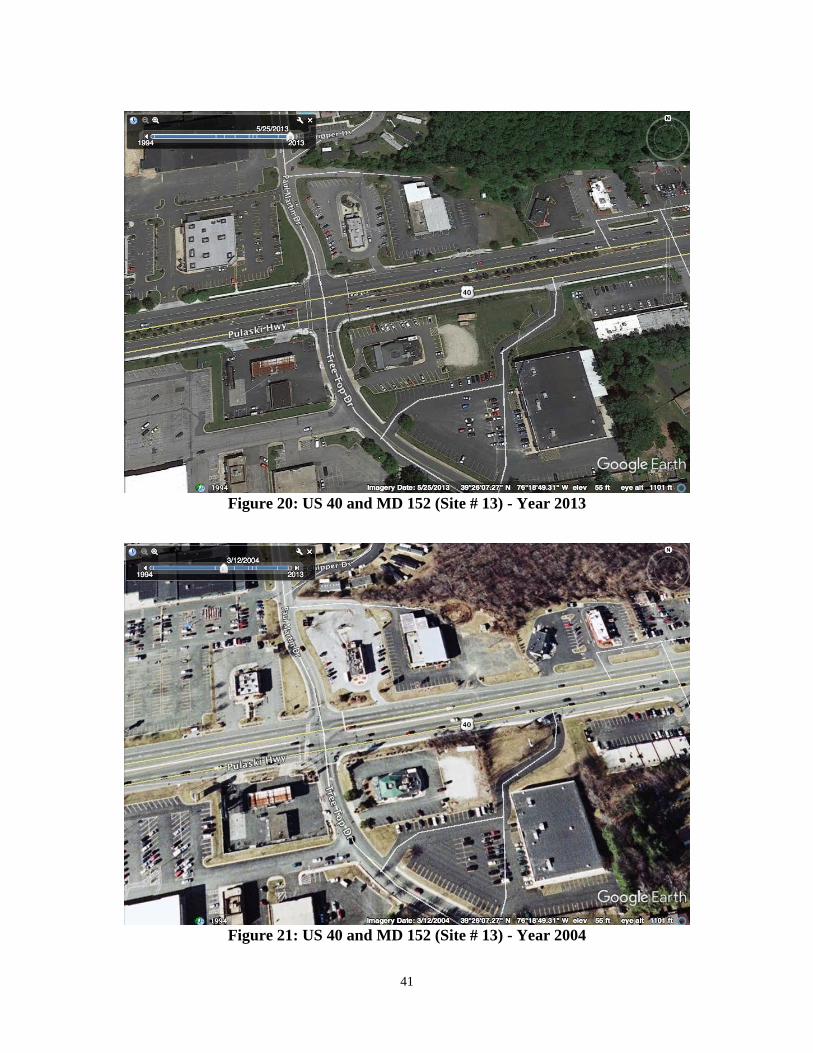
Figure 20: US 40 and MD 152 (Site # 13) - Year 2013
Figure 21: US 40 and MD 152 (Site # 13) - Year 2004
42
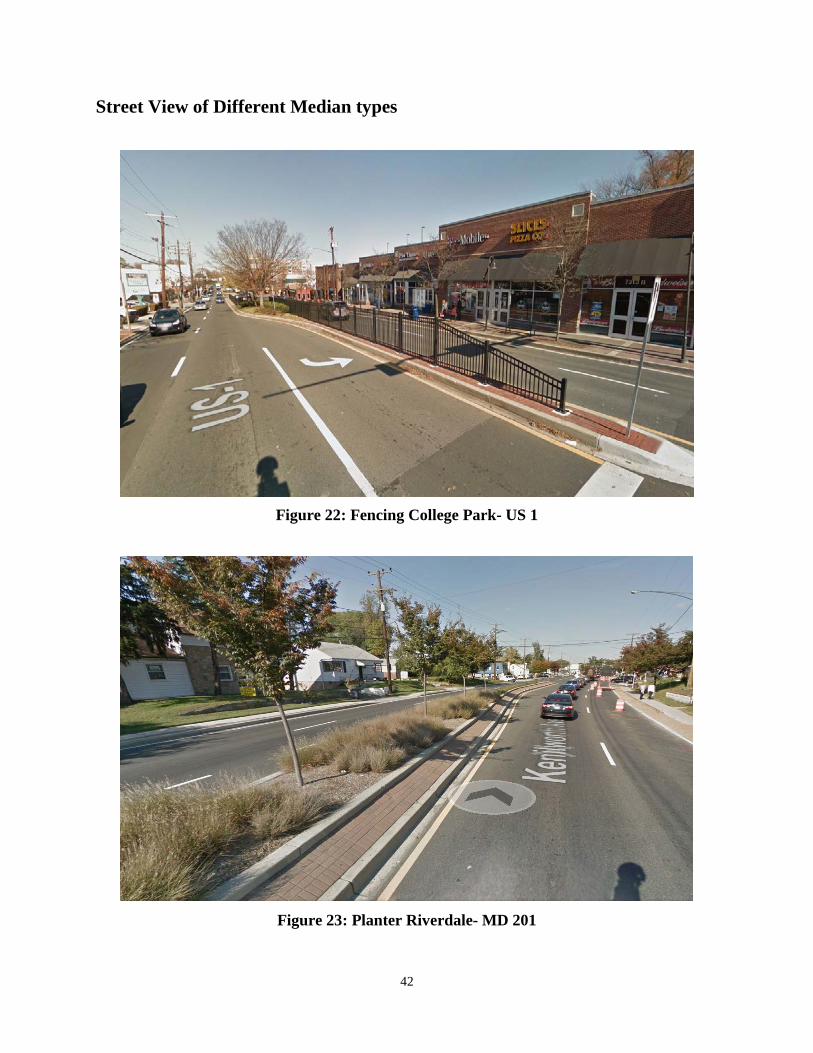
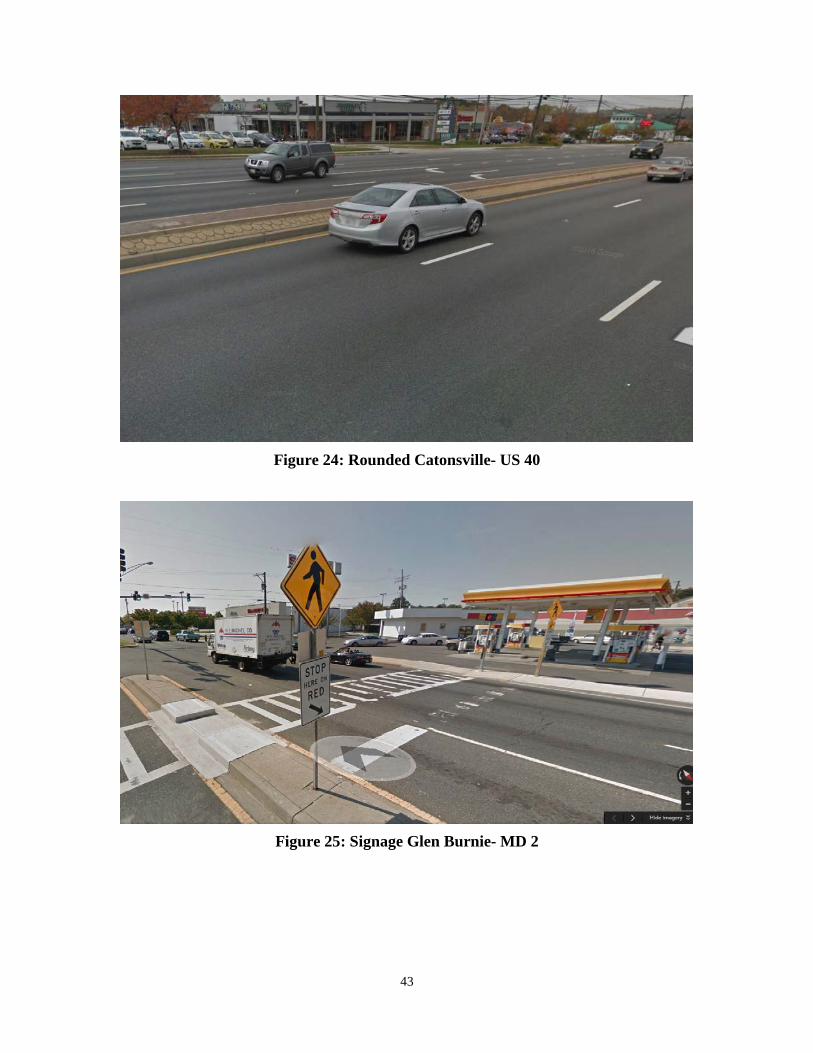
Street View of Different Median types
Figure 22: Fencing College Park- US 1
Figure 23: Planter Riverdale- MD 201
43
Figure 24: Rounded Catonsville- US 40
Figure 25: Signage Glen Burnie- MD 2