improving iodine status of children at rural area in west
TRANSCRIPT

ISBN : 978-602-440-253-2
SocialPT Penerbit IPB PressIPB Science Park Taman KencanaJl. Taman Kencana No. 3, Bogor 16128Telp. 0251 - 8355 158 E-mail: [email protected]
@IPBpressPenerbit IPB Press
at Rural Area in West Java, Indonesia
Leily Amalia • Karina R EkawidyaniAli Khomsan • Dodik Briawan
IMPRO
VIN
G IO
DIN
E STATUS O
F CHILD
REN AT RU
RAL A
REA IN
WEST JAVA
, IND
ON
ESIA
IMPROVING IODINE STATUS OF CHILDREN
at Rural Area in West Java, Indonesia
IMPROVING IODINE STATUS OF CHILDREN
Iodine deficiency is a major global public health problem, particularly for young children and pregnant women. Iodine has significant roles in developing immunity and cognitive function, especially among children, who were still in the growth period. The most important effect of iodine deficiency is irreversible impairment of neurocognitive development; and the most serious one is mental retardation and brain damage. This study was aimed to analyse effectiveness of nutrition promotion in improving iodine status of children at iodine endemic area. Subjects involved were elementary school children, teachers, and mothers of school children, salt producers, salt traders, and District Governmental Offices Staffs. Nutrition promotions delivered were nutrition education, focus group discussion, seminar, and intensive advocation. This book discusses the root problem and solutions of iodine deficiency, including the impact of the nutrition promotion in tackling iodine deficiency problems comprehensively from supply side until consumption. Furthermore, it also discusses the sustainability of the nutrition promotion program.

IMPROVING IODINE STATUS OF CHILDREN AT RURAL AREA
IN WEST JAVA, INDONESIA
Leily Amalia • Karina R EkawidyaniAli Khomsan • Dodik Briawan


Penerbit IPB PressIPB Science Park Taman Kencana,
Kota Bogor - Indonesia
C.01/06.2018
IMPROVING IODINE STATUS OF CHILDREN AT RURAL AREA
IN WEST JAVA, INDONESIA
Leily Amalia • Karina R EkawidyaniAli Khomsan • Dodik Briawan

Judul Buku:Improving Iodine Status of Children at Rural Area in West Java, Indonesia
Penyusun:Leily Amalia Karina R EkawidyaniAli Khomsan Dodik Briawan
Desain Sampul Ardhya Pratama
Penata Isi:Ahmad Syahrul FakhriArdhya Pratama
Korektor:Dwi M Nastiti
Ilustrasi Sampul:Sani Etyarsah
Jumlah Halaman: 90 + 18 halaman romawi
Edisi/Cetakan:Cetakan 1, Juni 2018
PT Penerbit IPB PressAnggota IKAPIIPB Science Park Taman KencanaJl. Taman Kencana No. 3, Bogor 16128Telp. 0251 - 8355 158 E-mail: [email protected]
ISBN: 978-602-440-253-2
Dicetak oleh Percetakan IPB, Bogor - IndonesiaIsi di Luar Tanggung Jawab Percetakan
© 2018, HAK CIPTA DILINDUNGI OLEH UNDANG-UNDANG
Dilarang mengutip atau memperbanyak sebagian atau seluruh isi buku tanpa izin tertulis dari penerbit

SUMMARY
Iodine deficiency is a major global public health problem, particularly for young children and pregnant women. According to WHO (2010), around 16 million people in Indonesia suffered from iodine deficiency. Iodine has significant roles in developing immunity and cognitive function, especially among children, who were still in the growth period. Study in Indonesia revealed that iodine deficiency disturbed intelligence growth, mainly on the school age children and caused lower learning output and school performance (Mutalazimah & Asyanti 2009). Out of 20 million people suffering from Iodine Deficiency Disorder (IDD) in Indonesia, the IQ loss is equivalent to 140 million points (Bappenas 2004).
The general objective of this study was to analyse effectiveness of nutrition promotion in improving iodine status of children at iodine endemic area. Specifically, the objectives of this study were: (1) to analyse the iodine content of salt circulated in markets and consumed by households, (2) to identify the root problems of unstandardized iodized salt circulated in markets, (3) to analyse nutritional knowledge, attitude, and practice of school children, mothers, and teachers, especially related to iodine, (4) to analyse iodine and other nutrients intake of children, and (5) to analyse the effects of nutrition promotion on iodine status of children, nutritional knowledge, attitude and practice related to iodine of children, mothers, and teachers.
The design of this study was pre-post test and control experimental design. The study was conducted at 8 sub-districts in Bogor District. From every sub-district, one elementary school with high iodine deficiency prevalence were selected. In total, the study was conducted at 8 elementary schools. This study

vi
Improving Iodine Status of Children at Rural Area in West Java, Indonesia
was conducted for 23 months, starting from October 2015 until August 2017. Simple random sampling technique was used to select the samples. Early on, there were 196 students, 192 mothers, 39 teachers, and 37 salt traders selected for this action research. However, due to several incomplete data, at the end of the baseline and endline study the samples consisted of 181 students and mothers, 38 teachers, and 32 salt traders.
The data collected were students’ characteristics, nutritional status, food consumption, nutritional knowledge, attitude, practice (KAP), Urinary Iodine Concentration (on spot and 24-hour collection); socio-economic characteristics of family, mothers’ nutritional status, food consumption, and KAP; teachers’ characteristics and KAP; salt producers’ and salt traders’ characteristics; and iodized salt distribution and monitoring. Intervention of nutrition promotion were done in three major activities, namely nutrition education, Focus Group Discussion (FGD), and Seminar. To analyse the effect of intervention (nutritional education), several data were collected before and after nutritional education. The data consisted of urinary iodine excretion of children, nutrition knowledge, attitude, and practice of children, mothers, and teachers.
Statistical data analysis was based on the aims of the research and available data to answer the research problem objectively. This includes predictions of mean, standard deviation, minimum value, maximum value and proportion. The first four statistics (mean, standard deviation, minimum value, and maximum value) were calculated for all continuous variables and the estimation of proportion is made for all categorical variables. The estimation results were then presented in tables and diagrams. Difference test was done to analyse the effect of intervention on iodine status of children, and on nutritional knowledge, attitude, and practice, among subjects of children, mothers, and teachers. The research results are:
Most of salts sold by traders (75.0%) had an iodine content <30 ppm, 1. while the rest of salt sold by traders (25%) had sufficient iodine content (30–80 ppm). Most of households (78.8%) consumed salt with iodine content <30 ppm, 20.1% of households consumed salt with sufficient iodine content based on SNI (30–80 ppm), and a few households (1.1%) consumed salt with iodine content more than SNI recommendation (>80 ppm).

vii
SUMMARY
The root problems of unstandardized iodized salt circulated in markets were 2. lack of monitoring and supervision on the salt for consumption. Most of salt circulated in the market were produced by home industry. Although there is regulation that iodized salt must meet the SNI requirement and be registered in the National Agency of Drug and Food Control, there is no punishment for those who produce and sell unstandardized iodized salt.
Before nutrition education, the majority of students had poor nutrition 3. knowledge and attitude and moderate nutrition practice. The majority of mothers had poor nutrition knowledge and practice and moderate nutrition attitude. The teachers’ nutrition knowledge, attitudes, and practices had been relatively good.
The children’s average intake of iodine was not adequate (less than 77% of 4. RDA). The average intakes of energy, carbohydrate and fat were adequate (almost or more than 90% of RDA). However, the average protein intake was below the adequacy level (less than 90% of RDA). The average intake of minerals (calcium, phosphorus, and iron), vitamin B1 and vitamin C among these children was also inadequate (less than 77% of RDA). On the other hand, the average intake of vitamin A was adequate.
Independent t-test comparing the increase in students’ nutrition knowledge 5. score of the control group versus the intervention group showed a very significant difference (p<0.01) and also for students’ nutrition attitude (p<0.05). It meant that intervention activities conducted in the form of nutrition education had succeeded in increasing nutrition knowledge and attitude of the elementary students. However, independent t-test showed no significant difference (p>0.05) in the increase of students’ nutrition practice scores in the control group and the intervention group.
Independent t-test showed that changes in baseline-endline mothers’ nutrition knowledge and attitude scores in the intervention group were significantly much higher (p<0.01) than the control group. However, independent t-test showed that the changes in nutrition practice score in the control group were not significantly different (p>0.05) from the changes in nutrition practice score in the intervention group.
Independent t-test showed that changes in teachers’ nutrition knowledge scores in the intervention group were significantly higher (p<0.01) than

viii
Improving Iodine Status of Children at Rural Area in West Java, Indonesia
the ones in the control group but not significant in nutrition attitudes and practices (p>0.05).
After the intervention, in the form of 2-month public education, there were changes in median values of urinary iodine of on spot urine collection. In the control group, there was a slight decrease in median value of UIC to 191 µg/l although this number (-0.6 µg/l) was not significant (p>0.05). Meanwhile, in the intervention group the UIC increased to 184 µg/l after the intervention. Eventhough there was an increase of 7.6 µg/l, but it was not significant (p>0.05).
After the intervention, there was an increase in UIC at 24-hour urine collection, either in the control group or the intervention group; i.e. 3.9 µg/l and 15.7 µg/l, respectively. There was no significant difference in the increase in UICs between the two groups (p>0.05). And according to independent t-test, there was not significant difference between the UIC of on-spot urine and 24-hour urine (p>0.05).
In this study, we found that the root problem of the unstandardized iodized salt circulated in the market is lack of monitoring and supervision from the government. Therefore, Industrial and Trade Office should increase monitoring and supervision to the salt industry and salt trader. There also should be a severe sanction for those who still produce or sell unstandardized iodized salt. It is better if this office also work together with other related offices, such as Health Office, the District Police Unit, and Regional Development Planning, Research and Expansion Agency (RDPREA) and form an IDD team.
We also found that with nutrition education, the nutrition knowledge and attitude of children and mothers significantly increase but not the nutrition practice. Teachers have opportunity to deliver nutrition education through various courses (e.g. biology, science, and sport).

This project consumed huge amount of work and dedication. Still, the research would not have been possible if we did not have support from many individuals and organizations. Therefore we would like to extend our sincere gratitude to all of them.
First of all, we are really grateful to the Nestle Foundation, Switzerland for funding this research and for providing necessary guidance concerning the research activities.
We are also thankful to the headmasters, teachers, students and mothers of the students of SDN Barengkok 2, SDN Nanggung 1, SDN Ciangger 1, SDN Singabraja 2, SDN Cibodas 2, SDN Bojong Sempu 2, SDN Jasinga 7, and SDN Parung Panjang 5 who have allowed us to carry out the research in their school and for participating in this research.
Appreciation to Dean of Faculty of Human Ecology and Chairman of Department of Community Nutrition, Bogor Agricultural University for granting us the opportunity to carry out the joint research as a mean of making cooperation with foreign agencies and enriching the dimension of research at Bogor Agricultural University.
We would like to express our sincere thanks to the enumerators who have worked with an extraordinary patience in the fields. Nevertheless, we would also like to give the highest appreciation to the research assistant (Puspita Dewi, SGz) who showed extraordinary dedication during the research.
We would also like to give our highest appreciation to the late Mrs. Leily Amalia Furkon, STP, MSi who passed away during this study because of chronic sickness.
ACKNOWLEDGMENT


SUMMARY ................................................................................................ v
ACKNOWLEDGMENT .......................................................................... ix
LIST OF CONTENTS ............................................................................. xi
LIST OF TABLES ................................................................................... xiii
LIST OF APPENDICES .........................................................................xvii
1. INTRODUCTION ............................................................................. 1
1.1 Background .................................................................................. 1
1.2 Objectives ..................................................................................... 4
2. METHOD ........................................................................................... 5
2.1 Research Design, Location and Time ............................................ 5
2.2 Sampling ...................................................................................... 5
2.3 Data Collection ............................................................................ 6
2.4 Implementation of Intervention .................................................... 9
2.5 Data Analysis and Management .................................................. 12
3. DESCRIPTION OF THE STUDY SITES ........................................ 15
4. SOCIOECONOMIC CHARACTERISTICS .................................... 19
4.1 Characteristics of Mothers .......................................................... 19
4.2 Income and Expenditure ............................................................. 21
LIST OF CONTENTS

xii
Improving Iodine Status of Children at Rural Area in West Java, Indonesia
4.3 Characteristics of School Children .............................................. 22
4.4 Characteristics of Teachers .......................................................... 24
5. CHARACTERISTIC OF SALT FOR CONSUMPTION ................. 27
5.1 Characteristics of Iodized Salt from Household .......................... 27
5.2 Characteristics of Iodized Salt from Salt Traders ......................... 28
5.3 Characteristics of Iodized Salt from Salt Producers ..................... 31
6. FOOD CONSUMPTION ................................................................. 33
6.1 Consumption of Iodine Food Source in School Children ........... 33
6.2 Energy and Nutrients Intake of School Children ........................ 35
6.3 Energy and Nutrients Intake of Mothers..................................... 41
7. NUTRITIONAL STATUS ................................................................ 47
7.1 Nutritional Status of School Children ......................................... 47
7.2 Anthropometric Status of Mothers.............................................. 49
8. IMPACT OF INTERVENTION ...................................................... 51
8.1 Nutrition Knowledge, Attitude, and Practice of School Children ...................................................................... 51
8.2 Nutrition Knowledge, Attitude, and Practice of Mothers ............ 54
8.3 Nutrition Knowledge, Attitude, and Practice of Teachers ........... 58
8.4 Iodine Status of School Children ................................................ 61
9. Nutrition Promotion to Stakeholders .................................................. 65
9.1 Nutrition to Optimize Children’s Health and Intelligence .......... 65
9.2 Problem and Solution of Iodized Salt Implementation in The Community ..................................................................... 69
9.3 Sustainability of the Program ...................................................... 74
10. CONCLUSIONS AND RECOMMENDATIONS .......................... 75
11. BIBLIOGRAPHY ............................................................................... 79
1. Type of data collected and the method of data collection from everysubject .................................................................................................. 6
2. Type of data and processing ................................................................ 12
3. Distribution of mother’s characteristics ............................................... 20
4. Distribution of subjects based on monthly family income (IDR) ........ 21
5. Mean per capita expenditure (IDR/month) ........................................ 22
6. Distribution of school children based on sex and age .......................... 23
7. Distribution of school children based on birth order and numberof siblings ........................................................................................... 24
8. Distribution of school children based on the pocket money for snacks ............................................................................................ 24
9. Distribution of teachers based on sex, education history, and nutritiontraining ............................................................................................... 25
10. Distribution of iodized salt from household based on iodinecontent ............................................................................................... 27
11. Iodine content of salt at the trader level .............................................. 28
12. Distribution of traders based on characteristics of salt sold in the lastone year .............................................................................................. 29
13. Distribution of traders based on the amount of salt sold per month .... 31
LIST OF TABLES

xiv
Improving Iodine Status of Children at Rural Area in West Java, Indonesia
14. Iodine content of the salt brands originating from factory................... 32
15. Average consumption frequency of iodine food source (times/week) ... 34
16. Average consumption of iodine food source (grams/week) .................. 35
17. Average energy and macronutrients intake, RDA and % RDAof school children ............................................................................... 36
18. Average intake of minerals (calcium, phosphor, iron and iodine), RDA, and % RDA of school children ................................................. 37
19. Median (min-maks) school children iodine density ............................. 38
20. Average intake of vitamins (A, B1, and C), RDA, and % RDAof school children ............................................................................... 38
21. Proportion of school children based on energy and macronutrientsadequacy level ..................................................................................... 39
22. Proportion of school children based on mineral (calcium, phosphor,iron, and iodine) adequacy level .......................................................... 40
23. Proportion of school children based on vitamin (A, B1, and C)adequacy level ..................................................................................... 41
24. Average energy and macronutrients intake, RDA, and % RDAof mothers .......................................................................................... 42
25. Average intake of minerals (calcium, phosphor, and iron), RDA, and % RDA of mothers ...................................................................... 43
26. Average intake of vitamins (A, B1, and C), RDA, and % RDAof mothers .......................................................................................... 43
27. Proportion of mothers based on energy and macronutrients adequacy level..................................................................................... 44
28. Proportion of mothers based on mineral (calcium, phosphor, and iron) adequacy level ..................................................................... 45
29. Proportion of mothers based on vitamin (A, B1, and C) adequacylevel .................................................................................................... 46
30. Distribution of school children by anthropometric nutritional status .. 48
xv
LIST OF TABLES
31. Distribution of the mothers based on anthropometric nutritionalstatus .................................................................................................. 49
32. Distribution of subjects based on nutrition knowledge of the schoolchildren .............................................................................................. 52
33. Distribution of subjects based on nutrition attitudes of the schoolchildren .............................................................................................. 53
34. Percentage of subjects based on nutrition practices of the schoolchildren .............................................................................................. 54
35. Distribution of mothers based on maternal nutrition knowledge ........ 55
36. Distribution of mothers based on maternal nutrition attitude ............. 57
37. Distribution of mothers based on maternal nutrition practices ........... 57
38. Distribution of teachers based on nutrition knowledge ....................... 59
39. Distribution of teachers based on nutrition attitudes .......................... 59
40. Distribution of teachers based on nutrition practices .......................... 61
41. Iodine status of school children based on on-spot urine collection ...... 62
42. Iodine status of school children based on 24-hour urine collection ..... 63
43. Independent t-test between on spot and 24-hour Urine Iodine Concentration (UIC) of school children ............................................. 63


1. Map of Bogor District Area ................................................................ 16
2. Interviewing the mother of school children ........................................ 85
3. Anthropometry measurement ............................................................ 86
4. Nutrition education ........................................................................... 86
5. Iodized salt factories visitation ............................................................ 87
6. Focus Group Discussion .................................................................... 87
7. Half day seminar ................................................................................ 88
8. Advocation at Health Office of Bogor Distric .................................... 88
LIST OF FIGURES


1
INTRODUCTION
1.1 BackgroundIodine deficiency is a major global public health problem, particularly for
young children and pregnant women. Iodine is required for the synthesis of thyroid hormones, which in turn are needed for the regulation of metabolic activities of all cells throughout the life cycle. They are also required to ensure normal growth, especially of the brain, which occurs from foetal life to the end of the third postnatal year (Delange 1994). The most important effect of iodine deficiency is irreversible impairment of neurocognitive development; and the most serious one is mental retardation and brain damage. Lack of iodine resulting in hypothyroidism during the vulnerable period of brain development, that is, at foetal life and the first year, can cause irreversible impairment in brain structure and function (Zimmermann 2007). Mild and severe iodine deficiency cause low motivation in taking classes, and also weaken mental and motoric functions. Meta-analysis of 18 studies revealed that IQ score decreased by 13.5 point among children with iodine deficiency (WHO 2001).
Extensive studies throughout the world over the last 20 years have revealed that 130 countries are affected by iodine deficiency, with a total population of 2.2 billion at risk of the occurrence of varying degrees of brain damage (WHO/UNICEF/ICCIDD 1999). Zimmermann (2003) also mentioned that from Urinary Iodine Excretion (UIE) test, there were 2 billion people all over the world suffered from iodine deficiency, and around 285 million of them were school children.

2
Improving Iodine Status of Children at Rural Area in West Java, Indonesia
Around 16 million people in Indonesia suffered from iodine deficiency. Iodine has significant roles in developing immunity and cognitive function, especially among children, who were still in the growth period. Study in Indonesia revealed that iodine deficiency disturbed intelligence growth, mainly on the school age children and caused lower learning output and school performance (Mutalazimah & Asyanti, 2009). Out of 20 million people suffering from Iodine Deficiency Disorder (IDD) in Indonesia, the IQ loss is equivalent to 140 million points (Bappenas 2004).
According to Harahap (2004), next to low in iodine intake from food, the other cause of iodine deficiency is due to several kinds of foods consumed in the developing countries that contain goitrogenic substance, which inhibits the iodine absorption by thyroid. The goitrogenic substance can be found in some kinds of foods, such as cassava, and vegetables belonging to various kinds of cabbages. In Sarawak (Malaysia), the consumption of cassava was found correlated with goitre and cretin prevalence.
IDD mapping in 1982 and 1998 have shown an encouraging decrease in prevalence rate, namely from 27.7% to be 9.8%. Although there was a significant drop, IDD was still considered as the society’s health problem, because in general the prevalence was still above 5%. From the results of a national survey conducted in 2003, it was known that IDD prevalence as indicated by TGR (Total Goitre Rate) of the school children was still around 11.1%. The survey also showed that 35.8% of the districts in Indonesia was slightly endemic, 13.1% of them was moderately endemic, and 8.2% of them was severely endemic (Bappenas 2004).
To overcome iodine deficiency, Indonesian government has already implemented salt iodization as mandatory fortification since 1975 to eliminate iodine deficiency among the people. A National Action Plan on IDD 2005-2010 stated that indicators used to monitor and evaluate IDD were the household consumption of iodized salt and the median of the people UIE as much as 100-299 µg/L. Meanwhile, TGR was not applied anymore due to its low sensitivity and specificity as well as the change of TGR occurrence requiring a long time. In 2005, one of the National nutrition programs of universal salt iodization (USI) was to increase the number of households consuming iodized salt to be 90%. However, the results of Indonesia Basic Health Research (IBHR) (MoH 2013a) showed that the program is still less
3
1. INTRODUCTION
successful, indicated by only 77.1% households at national level and 68.6% in West Java Province consuming salt with adequate amount of iodine. Indeed,the achievement is lower than expected, whereas the iodized salt consumption is one of the main channels that can be utilized to overcome the IDD problem.
Coverage of households with adequate iodized salt consumption varied among provinces in Indonesia, namely ranged from 27.9% (province of West Nusa Tenggara) and 98.7% (province of Bangka Belitung). Provinces with low coverage consisted of West Nusa Tenggara (27.9%), East Nusa Tenggara (31%), and West Sulawesi (34.2%). Provinces with moderate iodized salt coverage were West Java (58.3%), DKI Jakarta (68.7%), and Bengkulu (69.7%), whereas provinces with high iodized salt coverage were West Kalimantan (84.4%), North Sulawesi (89.2%), and Bangka Belitung (98.7%) (MoH 2009).
Our previous study in 2 districts of iodine endemic areas (Amalia et al. 2012) showed that the coverage of household consuming iodized salt adequately (30-80 ppm) was only 14.8% in highland and 8.8% in lowland areas. In addition, the average amount of iodine content in salt consumed by households in the highland and lowland areas was still lower than recommended, namely 21.8 ppm and 13.0 ppm respectively. This could indicate that salt distributed in community and consumed by people was mostly containing iodine lower than recommended amount. Other related studies also show the similar result. Other study in Minahasa (North Sulawesi), Bukittingi (West Sumatera), and Gunungkidul (Central Java) in 2007 indicated that the average iodine content of salt consumed by subjects were only 17.7 ppm, 16.8 ppm, and 21.6 ppm, respectively (Budiman & Sumarno 2007). In addition, Rasidi (2008) stated that 62.5% salt circulated in Temanggung city contained less than 30 ppm of iodine.
There are several factors that might be affecting this failure, such as low control of government on salt production and distribution with adequate amount of iodine, and low awareness of people on the importance of iodine for health so that low desire in selecting and purchasing iodized salt rather than non-iodized salt, etc. Our previous study also found that only 50% mothers knew the importance of iodized salt and only 75.2% mothers realized that iodine deficiency will impair cognitive development of children.
4
Improving Iodine Status of Children at Rural Area in West Java, Indonesia
Regarding those previous studies, this study is aimed to improve nutrition knowledge, attitude and practice related to iodine among children, mothers, and teachers by nutrition education intervention. The intervention is expected to improve the iodine status. Since the vulnerable people of iodine deficiency are children, the subjects selected for the indicator of iodine status in this study are elementary school (ES) students. Attention to school children needs emphasizing as school children are still in growth phase and really need good intelligence. Children are easily affected by the iodine status in their body. In addition, the study is also intended to increase awareness of related stakeholders to control salt distributed in community.
1.2 ObjectivesThe general objective of this study was to analyse effectiveness of nutrition
promotion in improving iodine status of children at iodine endemic area. Specifically, the objectives of this study are:
to analyse the iodine content of salt circulated in markets and consumed 1. by households
to identify the root problems of unstandardized iodized salt circulated in 2. markets
to analyse nutritional knowledge, attitude, and practice of school children, 3. mothers, and teachers, especially related to iodine
to analyse iodine and other nutrients intake of children 4.
to analyse the effects of nutrition promotion on iodine status of children, 5. nutritional knowledge, attitude and practice related to iodine of children, mothers, and teachers.

2
METHOD
2.1 Research Design, Location and TimeThe design of this study was pre-post test and control experimental design.
The design was chosen because this study was aimed at analysing effectiveness of nutrition promotion to increase nutritional knowledge, attitude, and practice related to iodine among subjects and to improve iodine status of children. The study was conducted at 8 sub-districts in Bogor District, which were categorized as low coverage of iodized salt consumption, based on data and information obtained from Health Office of Bogor District. From every sub-district, one elementary school with high iodine deficiency prevalence were selected, based on information from Education Office of Bogor District. Hence, in the total, the study was conducted at 8 elementary schools. This study was conducted for 23 months, starting from October 2015 until August 2017.
2.2 SamplingThe sample populations from eight elementary schools were 423 students.
Sampling was done based on the sampling frame obtained from the schools. Simple random sampling technique was used to select the samples. Early on, there were 196 students, 192 mothers, 39 teachers, and 37 salt traders selected for this action research. However, due to several incomplete data, at the end of the baseline and endline study the samples consisted of 181 students and mothers, 38 teachers, and 32 salt traders.

6
Improving Iodine Status of Children at Rural Area in West Java, Indonesia
2.3 Data CollectionThe data collected were primary data. The detail data that were collected
from every subject and the methods of data collection are presented in Table 1.
Table 1. Type of data collected and the method of data collection from every subject
No Subjects Variable of DataMethod of Data
CollectionInstrument Required
1. Elementary school children
Individual characteristics (sex, pocket money, order of child in family)
Interview Questionnaire
Body Weight (BW) Weighing Digital weighing scale
Body Height (BH) Direct assessment
Stature meter
Food consumption Interview Questionnaire, with technique of 2 days 24 hour recalls
Food consumption of iodine source
Interview Questionnaire, with technique of SQ-FFQ containing the list of iodine food source
Nutritional Knowledge, Attitude, Practice (KAP) (pre- & post- intervention)
Interview Questionnaire
Urinary iodine excretion (pre- & post- intervention)
on spot urine collection, collected in the morning
Small tube
24-hour urinary iodine excretion (pre- & post- intervention) of the low iodine urine status based on UIE analysis result of on spot method
24 hour urine collection (sub sample)
Urine plastic bag

7
2. METHOD
No Subjects Variable of DataMethod of Data
CollectionInstrument Required
2 Mothers of children
Socio-economic characteristics of family (education, occupation, income)
Interview Questionnaire
Body Weight (BW) Weighing Digital weighing scaleBody Height (BH) Direct
assessment Stature meter
Food consumption Interview Questionnaire, technique of 2 days 24 hour-recall
Nutritional Knowledge, Attitude, Practice (KAP)
(pre- & post- intervention)
Interview Questionnaire
3 Teachers of elementary schools
Characteristics of teachers (education, length of teaching)
Interview Questionnaire
Nutritional Knowledge, Attitude, Practice (KAP)
(pre- & post- intervention)
Interview Questionnaire
4 Salt producers
Salt production, iodine requirement, fortification technique, constrain/problems during production & distribution
Interview at visit time
Questionnaire
5 Salt traders - Number of salt sold per month and price of salt.
- Iodine content on salt
- Interview
- Sampling
- Questionnaire.
- Container for salt6 Staffs of
District Industrial Office
Mechanism and constrain on production and supervision of iodized salt production
FGD Form FGD
7 Staffs of District Trade Office
Mechanism and constrain on distribution and supervision of iodized salt trading
FGD Form FGD
Table 1. Type of data collected and the method of data collection from every subject (Continued)

8
Improving Iodine Status of Children at Rural Area in West Java, Indonesia
No Subjects Variable of DataMethod of Data
CollectionInstrument Required
8 Staffs of District Health Office
- Mechanism of handling/storing iodized salt
- Mechanism of supervision of iodized salt utilisation at household level, to obtain data on household coverage
FGD Form FGD
9 Staffs of District Education Office
Material enrichment with teaching tools related to salt and iodized salt
FGD Form FGD
Before implemented, the questionnaire were tested on specified persons that represented subjects of this study to confirm the validity of the data collected. Data on nutritional knowledge, attitude, and practice (KAP) related to iodine and iodized salt were collected from subjects of children, mothers, and teachers. The data of pre intervention were collected before the initial nutrition education started, whereas the data of post-intervention will be collected one or two day after completion of nutrition education. The data were collected by interview using a questionnaire. The questions and statement written on questionnaire to examine the nutritional knowledge, attitude, and practice of the subjects were in line with the material presented at nutrition education intervention.
Salt sample were obtained from salt traders and households of the subjects. The salt sample and the urine sample were analysed at a specific laboratory, namely Laboratory of IDD research in Magelang, Central Java.
The urine sample were collected and further analysed for iodine level and the iodine status of the children. The urine sample collection were conducted by on spot method and 24-hour method. The on spot method were done for all subjects (181 children). The 24-hour collection method were applied to half of the subjects. We chose 2 control schools and 2 intervention schools which were nearer and more accessible from campus to collect the 24 hour urine. The urine of pre-intervention were collected before the first meeting of nutrition education intervention, whereas the urine sample of post-intervention were collected at one or two days after the final session of
Table 1. Type of data collected and the method of data collection from every subject (Continued)

9
2. METHOD
nutrition education completed. The urine sample were put in a small tube (for on spot method) and in urine plastic bag (for 24-hour method), be sealed, and be coded according to the subject identity. The urine sample were collected in the morning.
To analyse the effect of intervention, several data were collected before and after intervention. The data consisted of urinary iodine excretion of children, nutrition knowledge, attitude, and practice of children, mothers, and teachers.
2.4 Implementation of InterventionIntervention of nutrition promotion were done in three major activities,
namely nutrition education, Focus Group Discussion (FGD), and Seminar. Focus group discussion and seminar were intended for salt producers, staffs of local government of ministry of industry, ministry of trade, ministry of health, and ministry of education. To prepare and to enrich the pre-material for FGD, visit to several salt producers was needed in advance. Then, to monitor the application of ideal universal salt iodization (USI) as were discussed on FGD and seminar, the follow up activity such as advocation was required.
A. Nutrition EducationNutrition education was delivered to 94 students, 94 mothers, and 21
teachers of intervention group. Nutrition education for students, mothers and teachers were conducted separately. The nutrition education was consisted of four topics related to nutrition and iodine, namely 1) Macronutrients, 2) Micronutrients, 3) Balanced Nutrition, and 4) Iodine and Iodized Salt. Degree of participation along with 4 sessions of nutrition education was:
Students : 93% - 100% (87-94 participants)a. Mothers : 87% - 94% (82-88 participants)b. Teachers : 95% - 100% (20-21 participants)c.
The media used for nutrition education for every subject were:
Students : powerpoint (slide), leaflet, poster, and bookleta. Mothers : powerpoint (slide), leaflet, bookletb. Teachers : powerpoint (slide), leaflet, poster, and bookletc.

10
Improving Iodine Status of Children at Rural Area in West Java, Indonesia
The topics of nutrition education were given in four non-consecutive days, approximately every two weeks. The participants’ enthusiasm was relatively high. This can be seen from the high degree of participation.
B. FGD for StakeholdersPrior to focus group discussion, the researchers made visitation to several
salt industries which were iodized salt suppliers in Bogor District as the area of this study. The producers were located in Bogor, Karawang and Tangerang. The visitation were accompanied by Staffs of District Industrial Office. The result of the visitation had been discussed on the FGD.
Focus group discussion (FGD) was designed and intended to improve the awareness of the stakeholders. The FGD deeply discussed any aspects related to iodized salt utilization on community.
Focus group discussion were conducted one time in Bogor District. FGD were held in Fave Hotel Bogor on November 15th 2016 and were participated by Food and Drug Administration, Province and District Industrial and Trade Office, District Health Office, and District Education Office. Through FGD, the data that had been collected were:
Mechanism and constraint on iodized salt production1.
Mechanism and constraint on iodized salt distribution2.
Mechanism of supervision on iodized salt production3.
Mechanism of supervision on iodized salt distribution4.
Mechanism of handling and storage of iodized salt 5.
Enrichment of curricula containing material of nutrition and iodized 6. salt
Mechanism of supervision on iodized salt utilization at household 7. level, to obtain data on coverage of iodized salt
C. Half-day Seminar The half-day seminar were conducted once, in Bogor District, on February
9th 2017. The seminar was intended to socialize and convince the importance of iodized salt for health and cognitive, which must be supported by every related aspect, starting from production, distribution, consumption; and to

11
2. METHOD
succeed the Universal Salt Iodization program in Indonesia. The speakers were: District Health Office, Psychologist, and academician. The participants were: District Industrial and Trade Office of Bogor District, District Education Office of Bogor District, District Health Office of Bogor District, and School Teachers who participated as subjects in this study.
D. Intensive Advocation As the following of the result of the FGD and the half seminar above,
the researchers conducted an intensive advocation to assure that the government will change the monitoring process of iodized salt which is produced (containing minimum 30 ppm), distributed (well packaged), and consumed in the community. The intensive advocation is intended to and was participated by District Government, Regional Development Planning Agency, the District Industrial Office, District Trade Office, District Health Office, District Education Office, and District Legislative of Bogor. In their formal function, the District Legislative has an apparent role in controling the related stakeholder performance and implementation.
Before starting the advocation, on February 3rd 2017 the research team had a discussion with Mr. Rozy Afrial Jafar, Program Officer of Iodine Deficiency Disorders Program for Micronutrient Initiative (MI) in Indonesia. The discussion was to plan the strategy for intensive advocation and how to approach the District Government to establish an IDD team.
The first approach was to have a meeting with District Health Office. After that, a staff from District Health Office was assigned to help the team in approaching the Regional Development Planning Agency.
In the meetings several issue were discussed:
Monitoring process of iodized salt at production, distribution, and •consumption level.
The importance of law enforcement for violations related to the •production and distribution of iodized salt in the community.
Proposing and initiating local/district regulation to support Universal •Salt Iodization (USI).

12
Improving Iodine Status of Children at Rural Area in West Java, Indonesia
2.5 Data Analysis and ManagementA. Data Cleaning
The data collected will be checked to see whether it is complete and clean. If it is incomplete, the data must be completed and cleaned immediately.
B. Data ProcessingProcessing will include coding, entry, editing, combining sheets,
and generating variables. For the data entry, a sheet structure is formerly prepared, containing names of variables, types, and decimal. After the data entry is done, editing begins, i.e. checking the data already entered with the data obtained from the questionnaire. A correction is made if there are some differences. For the purpose of analysis, the data in the form of sheets (using Excel) is imported to SPSS files.
Table 2. Type of data and processing
No Type of Data Data Processing 1 Iodine content of salt Classifying
a) <30 ppm b) 30-80 ppm c) >80 ppm
2 Individual characteristics (age, sex, pocket money) Descriptive
3 Anthropometry (BW,BH) &age of children
BMI/A
4 Anthropometry (BW,BH) & age of mothers and teachers
BMI = BW (kg)/BH2 (m2)
5 Food consumption of children
Processed using Food Composition Table to be intakes data of energy, carbohydrate, protein, fat, vitamin A, vitamin C, calcium, Fe
6 Nutrient intake of children
Compare with RDA to be adequacy nutrition level
7 Food consumption of iodine source, excludes salt
Processed using Food Composition Table to be intakes data of iodine
8 KAP of children, mothers, teachers
Low : score<60Moderate : score>60-79High : score >80

13
2. METHOD
No Type of Data Data Processing 9 Urine of children Determining median value10 Socio-economics
characteristics of family- Education : Elementary school, junior high school, senior high school, universities- Occupation : private, government, fisherman, trader, labourer, farmer
11 Characteristics of teachers Education, length of teaching12 Teaching material
enrichment with nutrient and iodine, aided by teaching tools
Descriptive
13 Salt production, iodine requirement, constrain/problems during production, distribution
Input, process, output analysis
14 Mechanism and constrain during supervision of iodized salt production
Descriptive
15 Mechanism and constrain on distribution and supervision for iodized salt distribution
Descriptive (Input, process, output analysis)
16 Mechanism on handling/storage of iodized salt
Input, process, output analysis
17 Mechanismon supervision and usage of iodized salt at household level,to obtain data on household coverage using iodized salt
Input, process, output analysis
C. Data AnalysisThis includes predictions of mean, standard deviation, minimum value,
maximum value and proportion. The first four statistics (mean, standard deviation, minimum value, and maximum value) were calculated for all continuous variables and the estimation of proportion was made for all categorical variables. The estimation results were then presented in tables and diagrams. Difference test was done to analyse the effect of intervention on iodine status of children, and on nutritional knowledge, attitude, and practice, among subjects of children, mothers, and teachers.
Table 2. Type of data and processing (continued)


3
DESCRIPTION OF THE STUDY SITES
3.1 Geographic Condition of Bogor DistrictBogor District has a diverse morphological type of area, ranging from the
relatively low plains in the north to the highlands in the south. Approximately 29.28% of Bogor District areas are at an altitude of 15-100 m above sea level (a.s.l), 42.62% at an altitude of 100-500 m a.s.l, 19.53% at an altitude of 500-1,000 m a.s.l, 8.43% at an altitude of 1,000-2,000 m a.s.l and 0.22% at an altitude of 2,000-2,500 m a.s.l (BPS 2016a).
Bogor District is geographically located at position of latitude 6019’N and 6047’S, as well as longitude 106001’E and 1070103’E. It is a very strategic area because it is adjacent to the capital city of Republic of Indonesia (Jakarta); thus, it becomes the buffer area of Jakarta. The total area of Bogor District is 2,663.81 km2. At the end of 2015, its administrative area consisted of 40 sub-districts. Based on the total area, Jasinga Sub-district is the largest (208.06 km2) and the second largest area is Cigudeg Sub-district (158.89 km2). Meanwhile, the sub-district with the smallest area is Ciomas Sub-district (16.30 km2) (BPS 2016a).

16
Improving Iodine Status of Children at Rural Area in West Java, Indonesia
Figure 1. Map of Bogor District Area
3.2 EducationGood-quality human resource (HR) is one of the main factors of
successful development in a region. Therefore, through education channels, the government consistently strives to improve the human resources of the population through various programs. One of the indicators used to see the success in the field of education is illiteracy rate; meaning that low illiteracy rate indicates the success of illiteracy alleviation program, and it must be supported by adequate educational facilities to achieve this program’s goal. The number of elementary schools in various sub-districts in Bogor District in 2015 were as follows: 47 schools in Nanggung Sub-district, 60 in Leuwiliang Sub-district, 35 in Parung Sub-district, 64 in Rumpin Sub-district, 54 in

17
3. DESCRIPTION OFTHE STUDY SITES
Cigudeg Sub-district, 60 in Jasinga Sub-district, 36 in Tenjo Sub-district, and 49 in Parungpanjang Sub-district (BPS 2016a).
In Bogor District, there are still 2.05% of people at the age of 15 and above who are illiterate and one-third (33.57%) of people aged 7-24 years are no longer attending school. In Bogor District, education level of the people is still very low. Based on National Socio-Economic Survey in 2015, almost two thirds (73.80%) of the people aged 15 years and above in Bogor District had a maximum education as junior high school graduates/equivalent. Only 4.88% of people aged 15 years and above in Bogor District who were diploma/university graduates. The level of education completed is an indicator of the quality of human resources in a region (BPS 2016b).
3.3 Health Facilities and StatusHealth is one of the important parts in order to improve human resources
of the people in Bogor District. Therefore, health programs have been initiated or prioritized on future generations. With the program, a good degree of community health is expected to be achieved that will eventually increase productivity. One of the efforts to improve the degree of public health is by the addition of medical personnel. Puskesmas (public health center) is the closest health facility to the community (BPS 2016a).
The number of Puskesmas in Bogor District in 2015 were 101 Puskesmas, 117 health outposts (Pustu) and 37 mobile public health centers (Pusling). The number of health workers in Bogor District in 2015 consisted of 279 medical personnels, 835 midwives and 492 nurses (BPS 2016a).
Most (94.25%) of the children under two years of age (0-23 months) have been breastfed. Based on sex, the percentage of male children under two years who have been breastfed is lower than the female ones. Of the breastfed children under two years, half of them (56.40%) were breastfed for less than 12 months and 14.22% of them were breasfted until 20-23 months. Mean duration of breastfeeding in male children under two is lower than the female ones (BPS 2016b).


4
SOCIOECONOMIC DEMOGRAPHY
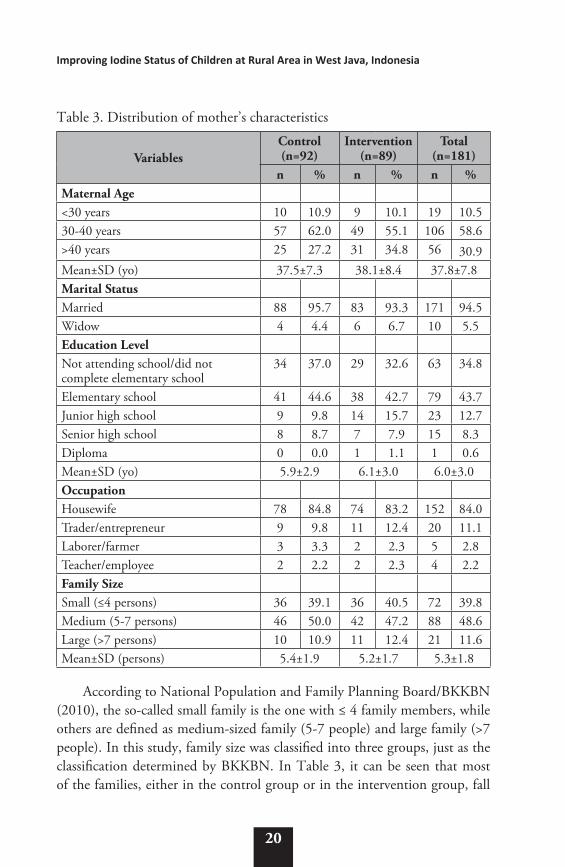
4.1 Characteristics of MothersTable 3 shows that most of the mothers aged around 30-40 years with
mean maternal age of 37.5 years in the control group and 38.1 years in the intervention group. In both groups, it can be seen that 5.5% of the mothers are widows.
In this study, most of the maternal education were still relatively low. It can be seen in Table 3 which shows that 43.7% of the mothers were elementary-school graduates and 34.8% of them did not complete the elementary education. This shows that most of the mothers did not fulfill the basic education level, because basic education level – according to Law No. 20 Year 2003 Article 17 – is the education level that underlies the level of secondary education. Basic education is in the form of elementary school and junior high school or other equal forms.
Table 3 shows that most of the mothers, either in the control group (84.8%) or the intervention group (83.2%) worked as housewives. Meanwhile, 15.2% of the mothers in the control group and 16.8% of the mothers in the intervention group worked as traders/entrepreneurs, laborers/farmers, or teachers/employees.
20
Improving Iodine Status of Children at Rural Area in West Java, Indonesia
Table 3. Distribution of mother’s characteristics
VariablesControl (n=92)
Intervention (n=89)
Total (n=181)
n % n % n %Maternal Age<30 years 10 10.9 9 10.1 19 10.530-40 years 57 62.0 49 55.1 106 58.6>40 years 25 27.2 31 34.8 56 30.9Mean±SD (yo) 37.5±7.3 38.1±8.4 37.8±7.8Marital StatusMarried 88 95.7 83 93.3 171 94.5Widow 4 4.4 6 6.7 10 5.5Education LevelNot attending school/did not complete elementary school
34 37.0 29 32.6 63 34.8
Elementary school 41 44.6 38 42.7 79 43.7Junior high school 9 9.8 14 15.7 23 12.7Senior high school 8 8.7 7 7.9 15 8.3Diploma 0 0.0 1 1.1 1 0.6Mean±SD (yo) 5.9±2.9 6.1±3.0 6.0±3.0OccupationHousewife 78 84.8 74 83.2 152 84.0Trader/entrepreneur 9 9.8 11 12.4 20 11.1Laborer/farmer 3 3.3 2 2.3 5 2.8Teacher/employee 2 2.2 2 2.3 4 2.2Family Size Small (≤4 persons) 36 39.1 36 40.5 72 39.8Medium (5-7 persons) 46 50.0 42 47.2 88 48.6Large (>7 persons) 10 10.9 11 12.4 21 11.6Mean±SD (persons) 5.4±1.9 5.2±1.7 5.3±1.8
According to National Population and Family Planning Board/BKKBN (2010), the so-called small family is the one with ≤ 4 family members, while others are defined as medium-sized family (5-7 people) and large family (>7 people). In this study, family size was classified into three groups, just as the classification determined by BKKBN. In Table 3, it can be seen that most of the families, either in the control group or in the intervention group, fall

21
4. SOCIOECONOMICDEMOGRAPHY
into “medium-sized family” category with a total of 5-7 family members. The proportion of small family in the intervention group (40.5%) was almost similar to the control group (39.1%). In general, the mean number of family members was 5.3 people (fell into “medium-sized family” category).
4.2 Income and ExpenditureIncome is one of the indicators that determines the social class of a family
in the community. The higher the income, the higher the social class of the family. The results showed that the majority of monthly family income (<IDR 2.5 million) in both groups remained below the Minimum Wage of Bogor District (IDR 2,975,000). However, mean monthly family income in the intervention group was higher than the control group (Table 4).
Table 4. Distribution of subjects based on monthly family income (IDR)
IncomeControl (n=92) Intervention (n=89) Total (n=181)n % n % n %
<2.5 million 62 67.4 59 66.3 121 66.92.5-5 million 27 29.4 18 20.2 45 24.9>5 million 3 3.3 12 13.5 15 8.3Mean±SD 2,229,088±1,644,697 2,906,318±3,408,947 2,562,090±2,676,592
According to MoH (2014), if the percentage of expenditure used to fulfill non-food needs is lower than the food expenditure, then this condition reflects the characteristics of developing country. In this study, monthly per capita of non-food expenditure in both groups was higher than monthly per capita of food expenditure (Table 5). The expenditure for side dishes was the largest food expenditure in both groups.
The largest non-food expenditure between the control and the intervention groups was different. The expenditure for installments/credit/arisan was the largest expense (IDR 85,759) in the control group, while the largest expenditure in the intervention group was cigarette expenditure (IDR 64,226). However, the cigarette expenditure in the control group (IDR 64,723) was almost similar to the intervention group.

22
Improving Iodine Status of Children at Rural Area in West Java, Indonesia
Table 5. Mean per capita expenditure (IDR/month)
No. Types of expenditureControl (n=92) Intervention (n=89) Total (n=181)Mean % Mean % Mean %
1 Food 242,679 39.3 298,419 44.8 270,087 42.1 1. Staple food 60,188 9.7 63,736 9.6 61,933 9.6 2. Side dishes 85,728 13.9 103,176 15.5 94,307 14.7 3. Vegetable 25,361 4.1 37,123 5.6 31,145 4.9 4. Fruit 11,304 1.8 25,913 3.9 18,487 2.9 5. Snack 60,098 9.7 68,471 10.3 64,215 10.0
2 Non-food 375,081 60.7 368,255 55.2 371,724 57.9 1. Health/treatment 2,376 0.4 3,109 0.5 2,737 0.4 2. Cigarettes 64,723 10.5 64,226 9.6 64,479 10.0 3. Hygiene 21,142 3.4 26,778 4.0 23,914 3.7 4. Gas 10,199 1.7 14,684 2.2 12,404 1.9 5. Electricity 16,596 2.7 16,230 2.4 16,416 2.6 6. Water 2,138 0.3 734 0.1 1,448 0.2 7. Transportation 50,710 8.2 46,084 6.9 48,435 7.5 8. School books 1,567 0.3 1,145 0.2 1,360 0.2 9. Books-stationery 2,026 0.3 2,491 0.4 2,254 0.4 10. Uniform 2,803 0.5 4,301 0.6 3,539 0.6 11. School activities 865 0.1 2,496 0.4 1,667 0.3 12. Pocket money 68,767 11.1 76,517 11.5 72,578 11.3
13. Other educational
activities 5,280 0.9 3,085 0.5 4,200 0.7
14. Clothing 20,996 3.4 21,309 3.2 21,150 3.3 15. Phone credit 16,313 2.6 21,719 3.3 18,971 3.0
16.Installment/credit/
arisan 85,759 13.9 61,988 9.3 74,070 11.5
17. Others 2,821 0.5 1,361 0.2 2,103 0.3 Total Expenditure 617,760 100.0 666,674 100.0 641,812 100.0
4.3 Characteristics of School ChildrenIn this study, most of the school children in the control and intervention
groups were girls. Mean age of the school children who became the study subjects was 11 years, and all of them were in the 5th grade (Table 6).

23
4. SOCIOECONOMICDEMOGRAPHY
Table 6. Distribution of school children based on sex and age
VariablesControl (n=92) Intervention (n=89) Total (n=181)
n % n % n %Sex Boys 41 44.6 42 47.2 83 45.9Girls 51 55.4 47 52.8 98 54.1Age9-10 years 11 12.0 4 4.5 15 8.311-12 years 75 81.5 80 89.9 155 85.613-14 years 5 5.4 5 5.6 10 5.5Mean±SD (yo) 11.29±0.78 11.43±0.68 11.36±0.74
According to MoH (2014), School Participation Rate (SPR) can be generally categorized into three age groups; i.e. 7-12 years old that represents elementary school age, 13-15 years old representing the age of junior high school students, and 16-18 years old representing the age of senior high school/vocational high school students. The data in Table 6 shows that 5.4% of school children in the control group and 5.6% in the intervention group were in the age range of 13-14 years, the same level of junior high school age. It probably happened because the students were at the late school age when attending the elementary school or they had repeated a grade (grade retention).
Most of the school children, either in the control group or the intervention group, were the 3rd child with mean number of siblings 3.7 people in the control group and 3.8 people in the intervention group (Table 7). However, there were still school children with ≥ 7 siblings; i.e. 13.0% in the control group and 11.2% in the intervention group. It probably happened because the parents did not participate in Family Planning (FP) program. Whereas according to MoH (2014), family planning program is a strategy to prevent mothers from giving birth too often or to decrease maternal mortality due to childbirth at an extremely young age (under the age of 20), short interdelivery interval, and giving birth at an extremely old age (over the age of 35). FP is also one of the most effective ways to improve family resilience, health, as well as the health of the mothers, children and women.

24
Improving Iodine Status of Children at Rural Area in West Java, Indonesia
Table 7. Distribution of school children based on birth order and number of siblings
VariablesControl (n=92) Intervention (n=89) Total (n=181)
n % n % n %Birth Order 1st child 26 28.3 20 22.5 46 25.42nd child 26 28.3 23 25.8 49 27.13rd child and so on 40 43.5 46 51.7 86 47.5Number of Siblings 1-3 54 58.7 47 52.8 101 55.84-6 26 28.3 32 36.0 58 32.0≥7 12 13.0 10 11.2 22 12.2
In this study, most of the school children in both groups were given pocket money of ≤IDR 5,000 by their parents (Table 8). Mean pocket money of the school children given by the parents in the control group (IDR 5,049) was slightly greater than the intervention group (IDR 4,820). The school children needs to be given good guidance from their parents, especially in terms of using pocket money to buy snacks at school.
Table 8. Distribution of school children based on the pocket money for snacks
Pocket moneyControl (n=92) Intervention (n=89) Total (n=181)
n % n % n %≤ IDR 5,000 73 79.3 73 82.0 146 80.7> IDR 5,000 19 20.7 16 18.0 35 19.3Mean±SD (IDR) 5,049±1,970 4,820±2,015 4,936±1,990
4.4 Characteristics of TeachersMost of the teachers who were subjects in this study aged more than 40
years old, with mean age of 39.1 years in the control group and 40.2 years in the intervention group (Table 9). In this study, it could also be seen that most of the teachers were university graduates.
Table 9 shows that some teachers who became the subjects in this study also served as headmasters. Most of the teachers in the control group have

25
4. SOCIOECONOMICDEMOGRAPHY
been teaching for 10-20 years, while most of the teachers in the intervention group have been teaching for more than 20 years. However, the teachers’ mean duration of teaching in both groups were similar; i.e. 16.8 years in the control group and 16.7 years in the intervention group. There were more teachers in the intervention group who had attended nutrition training compared to the ones in the control group. In the control group, only one teacher (5.6%) that had attended nutrition training.
Table 9. Distribution of teachers based on sex, education history, and nutrition training
VariablesControl (n=18)
Intervention (n=20) Total
n % n % n %Age <30 years 6 33.3 7 35.0 13 34.230-40 years 4 22.2 2 10.0 6 15.8>40 years 8 44.4 11 55.0 19 50.0Mean±SD 39.1±13.2 40.2±12.5 39.7±12.7Education LevelSenior high school/equivalent 3 16.7 2 10.0 5 13.22-year diploma 0 0.0 3 15.0 3 7.9University 15 83.3 15 75.0 30 78.9PositionHeadmaster 4 22.2 4 20.0 8 18.4Teacher 14 77.8 16 80.0 30 81.6Teaching Duration<10 years 5 27.8 7 35.0 12 31.610-20 years 7 38.9 5 25.0 12 31.6>20 years 6 33.3 8 40.0 14 36.8Mean±SD 16.8±11.9 16.7±12.2 16.7±11.9Participation in Nutrition TrainingYes 1 5.6 10 50.0 11 28.9No 17 94.4 10 50.0 27 71.1


5
CHARACTERISTICS OF SALT FOR CONSUMPTION
5.1 Characteristics of Iodized Salt from Household
Iodized salt used as “salt for consumption” is product of food that had sodium chloride (NaCl) as the key component and had been fortified with potassium iodate (KIO3) minimum 30 ppm (Indonesia National Standard/SNI 2010). Based on Table 10, it is known that only 20.1% of the total households (27.1% of control households and 12.9% of intervention households) consumed salt with iodine content according to SNI (30-80 ppm), while most of the households (78.8% of households; i.e. 71.9% of the control households and 86.0% of the intervention households) consumed salt with iodine content of <30 ppm, and the rest (1.1% households; i.e. 1.0% of the control households and 1.1% of intervention households) consumed salt with iodine content of >80 ppm.
Table 10. Distribution of iodized salt from household based on iodine content
CategoryControl (n=96)
Intervention (n=93)
Total (n=189)
n % n % n %<30 ppm 69 71.9 80 86.0 149 78.830-80 ppm 26 27.1 12 12.9 38 20.1>80 ppm 1 1.0 1 1.1 2 1.1Mean±SD (ppm) 23.61±17.26 20.40±16.57 22.03±17.00

28
Improving Iodine Status of Children at Rural Area in West Java, Indonesia
If compared with the Basic Health Research (Riskesdas) data in 2013 (MoH 2013a), the number of households consuming salt with sufficient iodine content in this study was still very low (20.1%) because the percentage at the national level reached 77.1%. Similarly, it is still considered very low when compared with the target of Universal Salt Iodization (USI) or “iodized salt for all” programs, which require that at least 90% of households consume salt with sufficient iodine content.
5.2 Characteristics of Iodized Salt from Salt Traders
Based on Table 11, it is known that 75% of salts sold by traders had an iodine content of <30 ppm. The rest of the salt (25%) sold by traders had sufficient iodine content (30-80 ppm). There is still a large number of salt that does not meet the requirement for iodine content, and it may become a problem for alleviating iodine deficiency disorders (IDDs). People will have difficulty accessing good-quality salts (sufficient iodine content).
Table 11. Iodine content of salt at the trader level
Salt’s iodine content n (brand of salt) %<30 ppm 15 75.030-80 ppm 5 25.0>80 ppm 0 0.0Total 20 100.0Mean±SD (ppm) 23.13±18.19
Characteristics’ distribution of the salts sold in the last one year can be seen in Table 12. The characteristics include types of the salt sold, consideration in choosing the brand of the salt sold, frequency of salt purchased in a month, the amount of salt purchased at one time, the storage place for salt to be sold, and salt storage duration before sale.
Based on Table 12, all traders (100%) interviewed at the research sites claimed that the salt they sold contained iodine, and the type of salt most sold by salt traders in this study was fine salt (43.8%). There were also salt traders (37.5%) selling two types of salt (i.e. fine salt and bricket salt), and the rest of them (18.8%) only sold bricket salt. According to Ministry of Health (MoH),

29
5. CHARACTERISTICS OF SALT FOR CONSUMPTION
Republic of Indoesia (2005), 68.8% of salt in Indonesia are fine-type salts. In addition, fine salt has a better quality in terms of iodine content and texture than bricket salt and coarse salt.
Table 12. Distribution of traders based on characteristics of salt sold in the last one year
Variables n %Selling iodized saltYes 32 100.0No 0 0.0Types of salt soldFine 14 43.8Bricket 6 18.8Both 12 37.5Considerations in choosing the brand of salt soldCheap price 2 6.3Contains iodine 4 12.5Available brand 12 37.5Saltier taste 1 3.1Mostly sold in the market 13 40.6Frequency of salt purchased in a month (mean±SD) 1.63±0.79Once 17 53.1Twice 11 34.4Thrice 3 9.44 times 1 3.1Amount of salt purchased at one time< 5 kg 15 46.95-10 kg 12 37.5>10 kg 5 15.6The storage place for salt to be soldExposed to sunlight 21 65.6Not exposed to sunlight 11 34.4Salt storage duration before sale< 2 weeks 5 15.6> 2 weeks 15 46.9> 1 month 12 37.5

30
Improving Iodine Status of Children at Rural Area in West Java, Indonesia
Traders have various considerations in choosing the salt brand that will be sold. They choose to sell a particular brand of salt because the brand was mostly sold in the market (40.6%), or the brand was available in their regions (37.5%). The availability of iodized salt varies in each region.
Table 12 also shows that most of the traders buy the salt for sale only once a month (53.1%), and there are some traders who bought salt up to 4 times a month (3.1%) with amount of salt purchased at one time ranging from <5 kg (46.9%), 5-10 kg (37.5%) and >10 kg (15.6%). Most of the traders stored the salt that they would sell in the sunlight-exposed places (65.6%) and the rest (34.4%) stored the salt in places not exposed to sunlight.
Frequency of purchase will affect the storage duration of iodized salt. The more rare they buy iodized salt, it will affect the storage duration of the salt. Saputri & Moesijanti (2006) stated that storage duration can affect iodine content in iodized salt. The iodine content in salt also depends on the storage place. The good storage place is the sealed and opaque container, so that the stability of iodine in salt is not disrupted.
Most of the traders (46.9%) stored the salt before sale for more than 2 weeks. The rest (37.5%) stored the salt for more than one month, and a small number of them stored the salt for less than 2 weeks (15.6%). In their study, Singh & Rita (2014) stated that iodized salt stored for 15 days would have a decrease in iodine content by 2.24%, the one stored for 30 days would have a decrease in iodine content by 8.9%.
Based on Table 13, 40.9% of traders could sell more than 25 packs of salt in a month, 43.2% of traders could only sell ≤ 10 packs of salt, and the rest of them (15.9%) could sell more than 10-25 packs. The average amount of salt that could be sold by traders were 38.9±46.1 packs/month.
Mean salt weight that could be sold by traders in one month was 12.1±17.0 kg. Nearly half of traders (47.7%) only managed to sell ≤10 kg salt in a month, the other half (18.2% of traders) sold more than 10 kg to 25 kg of salt, and the rest could sell up to more than 25 kg. The price per pack of the salt sold by traders was IDR 1,659±914.

31
5. CHARACTERISTICS OF SALT FOR CONSUMPTION
Table 13. Distribution of traders based on the amount of salt sold per month
Variables n %The amount of salt sold (mean±SD) 38.9±46.1 packs≤ 10 packs 19 43.2>10-25 packs 7 15.9>25 packs 18 40.9Weight of the salt sold (mean±SD) 12.1±17.0 kg≤ 10 kg 21 47.7>10-25 kg 8 18.2>25 kg 5 11.4Price/pack (mean±SD) IDR 1,659±914
5.3 Characteristics of Iodized Salt from Salt Producers
Based on the analysis of iodized salt conducted by Testing Laboratory of Agro Industry Center – Ministry of Industry, Bogor on the samples of the brands of salt derived from the factory (Table 14), it was found that 84.6% of salt did not meet SNI and only 15.4% that met the requirement of iodine content; i.e above 30 ppm (30-80 ppm). This finding shows that the quality of salts widely circulated at this time is still very far from the quality the salts should have. It happens because the production of salt is still traditional, the supervision system has not been effective and the sanctions has not firmly enacted because approximately 90% of the salt producers are small entrepreneurs/home industry (Sudarmadji 2010 in Haitami 2015). According to MoH RI in Kapantow et al. (2013), the companies that have not applied the SNI are generally small industries, in which the instruments for iodization used by the producers are still simple; thus, the iodine content in the salt is not homogeneous.

32
Improving Iodine Status of Children at Rural Area in West Java, Indonesia
Table 14. Iodine content of the salt brands sampled from factory
Category n %<30 ppm 11 84.630-80 ppm 2 15.4>80 ppm 0 0Total 13 100.0Mean±SD 12.56±10.12 ppm
6
FOOD CONSUMPTION
6.1 Consumption of Iodine Food Source in School Children
The most frequently consumed iodine food source among school children in this study was fried chicken egg (Table 15). It was consumed 3.1 times a week both in control and intervention groups. The other iodine food sources that were consumed more than 2 times a week were sweetened condensed milk, fish, and sweet bread.
Major source of iodine is seafood. The other source is vegetables grown on iodine containing soil. Bread can contain iodine because some bakery industry uses iodine salts as dough conditioners. Milk also may contain iodine due to most dairies feed cows iodine-containing medications and use iodine to disinfect milking equipment (Rolfes et al. 2009).
Seafood contain various amount of iodine, for example 60 g of prawns contains 6 mcg of iodine, 100 g of canned tuna contain 12 mcg of iodine, 100 g of salmon fillet contain 14 mcg of iodine, 120 g of cod fish contain 230 mcg of iodine, and 120 g of haddock fish contain 390 mcg of iodine (Bath & Rayman, 2016). As recommended intake of iodine for school children is a little, only 120 mcg (MoH 2013b), it can be easily met by consuming seafood, vegetables grown in iodine-rich soil and iodized salt. However, in this study, fish is only consumed 2 times a week and mostly are freshwater fish. The study location is far from coastal area and seafood price is relatively expensive so it is not affordable by the subjects whose socioeconomy background are from

34
Improving Iodine Status of Children at Rural Area in West Java, Indonesia
lower middle income family. Egg which is the most frequently consumed is more affordable than seafood and it contain 25 mcg of iodine per serving (50 g) (Bath & Rayman, 2016).
Table 15. Average consumption frequency of iodine food source (times/week)
No Type of Food Control (n=96)
Intervention (n=93)
Total (n=189)
1 Fried rice with egg 1.5±1.2 1.9±1.9 1.7±1.62 White bread 1.4±2.6 1.3±1.5 1.4±2.13 Sweet bread 2.3±2.4 1.8±1.6 2.1±2.04 French bean 0.7±1.0 1.1±1.3 0.9±1.25 Fish 1.8±1.4 2.6±3.1 2.2±2.46 Scallops 0.2±0.4 0.4±1.2 0.3±0.97 Crab 0.1±0.3 0.1±0.2 0.1±0.38 Sardines 0.9±1.4 1.2±1.2 1.1±1.39 Boiled chicken egg 1.7±1.9 1.8±1.4 1.7±1.710 Boiled duck egg 0.2±0.5 0.2±0.4 0.2±0.511 Fried chicken egg 3.1±3.0 3.1±2.5 3.1±2.812 Boiled egg yolk 0.0±0.1 0.0±0.0 0.0±0.113 Cow’s milk 1.1±2.0 1.2±1.8 1.1±1.914 Powdered milk 0.5±1.2 0.5±1.2 0.5±1.215 Sweetened condensed milk 2.2±2.9 2.4±2.1 2.3±2.516 Yoghurt 0.8±1.6 1.4±2.8 1.1±2.3
Table 16 shows that iodine food source that was mostly consumed every week was fried rice with egg. In total, it was consumed 507.2 grams/week. The second mostly consumed iodine food source was fried chicken egg. It was consumed as much as 238.6 grams/week. The other food source that was consumed more than 100 grams per week were fish, sweet bread, sweetened condensed milk, cow’s milk, white bread and boiled chicken egg. It can be seen that the highest consumption of iodine food source (in frequency and amount) among these subjects were from chicken egg which is relatively affordable. Chicken egg is a good source of iodine as the iodine content per serving is 20.8% of iodine RDA for children aged 10-12 years old (MoH 2013b; Bath & Rayman, 2016).

35
6. FOOD CONSUMPTION
Table 16. Average consumption of iodine food source (grams/week)
No Type of Food Control (n=96)
Intervention (n=93)
Total (n=189)
1 Fried rice with egg 480.7±537.6 534.6±728.5 507.2±637.62 White bread 101.6±172.7 120.7±175.7 111.0±174.03 Sweet bread 164.9±213.0 159.0±229.8 162.0±220.84 French bean 27.0±49.5 64.3±118.8 45.3±92.25 Fish 162.2±265.6 206.1±327.7 183.8±297.86 Scallops 21.6±85.7 47.9±135.1 34.6±113.27 Crab 1.7±8.7 4.8±20.5 3.2±15.78 Sardines 24. 4±42.9 28.7±38.9 26.5±40.99 Boiled chicken egg 115.0±160.5 102.7±124.5 108.9±143.710 Boiled duck egg 10.3±42.2 4.6±27.9 7.5±35.911 Fried chicken egg 218.7±204.1 259.2±256.1 238.6±231.412 Boiled egg yolk 7.0±17.9 9.8±28.7 8.4±23.813 Cow’s milk 126.5±288.1 106.1±244.8 116.5±267.214 Powdered milk 13.6±62.5 17.0±52.8 15.3±57.815 Sweetened condensed milk 126.7±182.1 140.6±160.7 133.6±171.616 Yoghurt 36.1±89.1 79.4±215.9 57.4±165.2
6.2 Energy and Nutrients Intake of School Children
Based on Table 17, the average energy, carbohydrate and protein intakes of the intervention group were significantly higher than the control group. On the other hand, the fat intake of both groups were quite similar. The average intakes of energy, carbohydrate and fat were adequate for both groups (almost or more than 90% of RDA). However, the average protein intake hadn’t met the adequacy level for both groups (less than 90% of RDA).
Protein food source mostly consumed by the school children are chicken, fried tempeh, fried tofu, egg (sunny side up and omelet), and fish (fresh and salted), respectively. Rice also greatly contributed to protein intake since it is consumed three times a day and has protein content higher than other staple food.

36
Improving Iodine Status of Children at Rural Area in West Java, Indonesia
Picauly & Toy (2013) stated that one of determinant factors of stunting is protein intake. They found that children with low intake of protein had higher risk to become stunting than those who had good protein intake. Iodine has a role in linear growth. Iodine is the component of thyroid hormone which is required to produce sufficient growth hormone (Widmaier et al., 2008). Furthermore, thyroid hormone has a role in metabolism of macronutrients including protein. Adequate amounts of thyroid hormone are fundamental for the protein synthesis required for normal bodily growth (Sherwood 2010). Thus, deficiency of iodine with or without protein deficiency can contributed to decline in linear growth and resulted in stunting. A study in an endemic IDD area in North Sumatra, Indonesia showed that the growth of school children in an endemic IDD area tend to be poorer than children of the same age living in non-endemic IDD area (Aritonang & Evinaria, 2005).
Table 17 Average energy and macronutrients intake, RDA and % RDA of school children
Nutrients Control (n=92)
Intervention (n=89)
Total (n=181) p-value
Energy (kcal)Intake (kcal) 1,504±513 1,713±596 1,607±564 0.012*RDA (kcal) 1,775±420 1,807±306 1,791±368% RDA 87.6±31.3 96.6±35.2 92.0±33.5 0.071
Carbohydrate (g)Intake (g) 222.9±77.4 260.0±91.3 241.1±86.3 0.004*RDA (g) 244.1±57.8 248.6±42.1 246.3±50.6% RDA 94.3±34.1 106.4±38.6 100.2±36.8 0.026*
Protein (g)Intake (g) 30.7 (11.3-70.0) 35.0 (8.1-91.9) 32.9 (8.1-91.9) 0.025*RDA (g) 50.7±11.9 51.5±8.6 51.1±10.4% RDA 67.4±25.8 76.0±32.0 71.7±29.2 0.048*
Fat (g)Intake (g) 45.0 (17.4-214.8) 48.8 14.7-236.6) 47.1 (14.7-236.6) 0.781RDA (g) 59.3±14.0 60.4±10.2 59.9±12.3% RDA 77.9 (31.7-421.2) 79.0 (27.4-385.3) 78.4 (27.4-421.2) 0.823
*significant at p<0.05

37
6. FOOD CONSUMPTION
Table 18 shows that the average intake of phosphor and iodine in the intervention group was significantly higher than in the control group. The average intakes of calcium and iron were not significantly different between both groups. The average intakes of these four minerals were not adequate (less than 77% of RDA) in both groups.
Table 18 Average intake of minerals (calcium, phosphor, iron and iodine), RDA, and % RDA of school children
Mineral Intake Control (n=92) Intervention (n=89) Total (n=181) p-value
Calcium (mg)
Intake (mg) 148.9 (31.4-1219.1) 143.7 (15.4-1702.1) 145.5 (15.4-1702.1) 0.340RDA (mg) 1,200±0 1,200±0 1,200±0% RDA 12.4 (2.6-101.6) 12.0 (1.3-141.8) 12.1 (1.3-141.8) 0.340
Phosphor (mg)
Intake (mg) 273.9 (31.0-873.6) 362.6 (47.3-1206.1) 321.2 (31.0-1206.1) 0.001*RDA (mg) 1,200±0 1,200±0 1,200±0% RDA 22.8 (2.6-72.8) 30.2 (3.9-100.5) 26.8 (2.6-100.5) 0.001*
Iron (mg)
Intake (mg) 7.2 (1.3-26.1) 7.6 (1.4-35.8) 7.4 (1.3-35.8) 0.512RDA (mg) 17.2±3.8 17.0±3.6 17.1±3.7% RDA 42.8 (10.3-200.6) 45.7 (7.2-275.2) 44.1 (7.2-275.2) 0.485
Iodine (mcg)
Intake (mcg)
54.0 (5.2-275.1) 69.7 (17.0-245.0) 59.7 (5.2-275.1)0.037*
RDA (mcg) 121.6±6.8 121.7±7.0 121.7±6.9% RDA 44.8 (4.4-198.9) 58.1 (14.2-204.2) 48.6 (4.4-204.2) 0.043*
*significant at p<0.05
Calsium food source mostly consumed by the school children are sweetened condensed milk, salted achovy, and jelly. Milk and anchovy are good source of calcium. However, they only consumed anchovy in small amount (in average 25 grams each time) and the milk they consumed wasn’t fresh milk which contain higher calcium.
Phosphorus is commonly found in almost all food, therefore deficiency of this nutrient is quite uncommon. The best food souce of phosphorus are foods rich in protein, especially from animal (Rolfes et al., 2009). However, since these school children also had low protein intake, phosphorus intake was also low.

38
Improving Iodine Status of Children at Rural Area in West Java, Indonesia
Table 19 shows that the iodine density of the school children was not different between control and intervention group. The median iodine density of total school children at baseline was 43.0 µg per 1,000 kcal while it decreased at endline to 39.9 µg per 1,000 kcal. If compared to the Indonesian RDA (2013) of iodine (120 µg) and energy (2,100 kcal for boys and 2,000 kcal for girls) for children aged 10-12 years old, the iodine density should be 60 µg per 1,000 kcal. Therefore, the iodine density within these subjects was low and that contributed to the low intake of iodine among them. This might be caused by the food that frequently consumed was not iodine food source.
Table 19. Median (min-max) school children iodine density
Control Intervention Total mann whitney p-value
Baseline 42.6 (8.2-225.9)
45.7 (3.0-263.3)
43.0 (3.0-263.3) 0.396
Endline 39.5 (2.8-145.6)
40.1 (9.2-127.6)
39.9 (2.8-145.6) 0.642
In Table 20, it is shown that the average intakes of vitamin A, B1 and C were not significantly different between both groups. The average intakes of vitamin A was adequate in both groups but the average intake of vitamin B1 and C were not adequate.
Table 20 Average intake of vitamins (A, B1, and C), RDA, and % RDA of school children
Vitamin Intake Control (n=92) Intervention (n=89) Total (n=181) p-value
Vitamin A (RE)
Intake (RE) 683 ± 484 842 ± 633 761 ± 566 0.060RDA (RE) 600±0 600±0 600±0% RDA 114±81 140±105 127±94 0.060
Vitamin B1 (mg)
Intake (mg) 0.6 (0.1-2.8) 0.7 (0.0-3.8) 0.6 (0.0-3.8) 0.409RDA (mg) 1.1±0.1 0.7 (0.0-3.8) 0.6 (0.0-3.8)% RDA 56.1 (5.8-279.6) 64.4 (1.9-378.8) 59.3 (1.9-378.8) 0.434
Vitamin C (mg)
Intake (mg) 5.4 (0.0-112.5) 9.4 (0.0-229.4) 7.0 (0.0-229.4) 0.216RDA (mg) 51±4 51±5 51±5% RDA 10.9 (0.0-225.1) 17.4 (0.0-458.7) 14.1 (0.0-458.7) 0.202

39
6. FOOD CONSUMPTION
Based on Table 21, the energy and fat adequacy level between both groups was not significantly different. However, the carbohydrate and protein adequacy level were significantly different, i.e. the intervention group had higher carbohydrate and protein adequacy level than the control group.
Table 21 Proportion of school children based on energy and macronutrients adequacy level
Energy and Macronutrients Adequacy Level
Control (n=92) Intervention (n=89) Total (n=181)
p-valuen % n % n %
Energy adequacy levelSevere deficiency (<70%) 29 31.5 24 27.0 53 29.3Medium deficiency (70-79%) 12 13.0 12 13.5 24 13.3
Mild deficiency (80-89%) 15 16.3 7 7.9 22 12.2Normal (90-119%) 25 27.2 23 25.8 48 26.5In Excess (≥120%) 11 12.0 23 25.8 34 18.8Mean±SD 87.6±31.3 96.6±35.2 92.0±33.5 0.071Carbohydrate adequacy levelSevere deficiency (<70%) 29 31.5 17 19.1 46 25.4Medium deficiency (70-79%) 4 4.3 9 10.1 13 7.2
Mild deficiency (80-89%) 12 13.0 8 9.0 20 11.0Normal (90-119%) 28 30.4 28 31.5 56 30.9In Excess (≥120%) 19 20.7 27 30.3 46 25.4Mean±SD 94.3±34.1 106.4±38.6 100.2±36.8 0.026*Protein adequacy levelSevere deficiency (<70%) 56 60.9 45 50.6 101 55.8Medium deficiency (70-79%) 12 13.0 12 13.5 24 13.3
Mild deficiency (80-89%) 9 9.8 8 9.0 17 9.4Normal (90-119%) 11 12.0 12 13.5 23 12.7In Excess (≥120%) 4 4.3 12 13.5 16 8.8Mean±SD 67.4±25.8 76.0±32.0 71.7±29.2 0.048*Fat adequacy levelSevere deficiency (<70%) 32 34.8 38 42.7 70 38.7Medium deficiency (70-79%) 17 18.5 9 10.1 26 14.4
Mild deficiency (80-89%) 7 7.6 7 7.9 14 7.7Normal (90-119%) 18 19.6 17 19.1 35 19.3In Excess (≥120%) 18 19.6 18 20.2 36 19.9Median (min-max) 77.9 (31.7-421.2) 79.0 (27.4-385.3) 78.4 (27.4-421.2) 0.823
*significant at p<0.05

40
Improving Iodine Status of Children at Rural Area in West Java, Indonesia
The protein adequacy level of school children in this study were poor. More than half of the children in both groups had severely deficient protein adequacy level.
In Table 22, it is shown that almost all subjects in control and intervention groups had deficit intake of calcium and phosphor. Most subjects also had deficit iron and iodine adequacy level.
Calcium deficiency will cause stunted growth in children. Moreover, a low calcium intake during childhood restricts the bones’ ability to reach their optimal mass and density (Rolfes et al., 2009). This might put them at risk of suffering from osteoporosis in later life.
Phosphorus is important for mineralization of bones and teeth and also necessary for growth. Phosphorus deficiency may cause muscular weakness and bone pain (Rolfes et al., 2009).
Table 22 Proportion of school children based on mineral (calcium, phosphor, iron, and iodine) adequacy level
Mineral Adequacy LevelControl (n=92) Intervention (n=89) Total (n=181)
p-valuen % n % n %
Calcium adequacy level
Deficient (<77%) 90 97.8 88 98.9 178 98.3Adequate (≥=77%) 2 2.2 1 1.1 3 1.7Median (min-max) 12.4 (2.6-101.6) 12.0 (1.3-141.8) 12.1 (1.3-141.8) 0.340Phosphor adequacy level
Deficient (<77%) 92 100.0 85 95.5 177 97.8Adequate (≥77%) 0 0.0 4 4.5 4 2.2Median (min-max) 22.8 (2.6-72.8) 30.2 (3.9-100.5) 26.8 (2.6-100.5) 0.001*Iron adequacy level
Deficient (<77%) 80 87.0 72 80.9 152 84.0Adequate (≥77%) 12 13.0 17 19.1 29 16.0Median (min-max) 42.8 (10.3-200.6) 45.7 (7.2-275.2) 44.1 (7.2-275.2) 0.485Iodine adequacy level
Deficient (<77%) 77 83.7 64 71.9 62 34.3Adequate (≥77%) 15 16.3 25 28.1 119 65.7Median (min-max) 44.8 (4.4-198.9) 58.1 (14.2-204.2) 126.8±94.3 0.043*
*significant at p<0.05

41
6. FOOD CONSUMPTION
Table 23 shows that the adequacy level of vitamin A and B1 in both groups were good but vitamin C was deficit. Two-third of school children had adequate vitamin A intake. Conversely, almost two-third had deficit vitamin B1 intake and almost all school children had deficient vitamin C intake. This may be due to lack of vegetables and fruits consumption among school children.
Table 23 Proportion of school children based on vitamin (A, B1, and C) adequacy level
Vitamin Adequacy LevelControl (n=92) Intervention (n=89) Total (n=181)
p-valuen % n % n %
Vitamin A adequacy level
Deficient (<77%) 32 34.8 30 33.7 62 34.3Adequate (≥77%) 60 65.2 59 66.3 119 65.7Mean±SD 113.7±80.6 140.2±105.4 126.8±94.3 0.060Vitamin B1 adequacy level
Deficient (<77%) 59 64.1 52 58.4 111 61.3Adequate (≥77%) 33 35.9 37 41.6 70 38.7Median (min-max) 56.1 (5.8-279.6) 64.4 (1.9-378.8) 59.3 (1.9-378.8) 0.434Vitamin C adequacy level
Deficient (<77%) 88 95.7 80 89.9 168 92.8Adequate (≥77%) 4 4.3 9 10.1 13 7.2Median (min-max) 10.9 (0.0-225.1) 17.4 (0.0-458.7) 14.1 (0.0-458.7) 0.202
6.3 Energy and Nutrients Intake of Mothers The average energy, carbohydrate and protein intake of mothers in the
intervention group was significantly higher than those in the control group (Table 24). Mother’s fat intake was similar between both groups. However, the intake of energy and macronutrients were still below RDA, only fulfill about 60-70% of RDA for energy, carbohydrate, protein and fat intake.
Alhough, difference test was not conducted, the average energy and carbohydrate intake of mothers were lower compared to their children’s intake in Table 17, while protein and fat intake were quite similar. As these subjects were from middle lower socioeconomy families, this might be caused by mothers tend to compromise their intake in order to feed more to their children. Besides, usually the priority of food is for the children and the father as the breadwinner. A study in Canada among 141 low-income lone

42
Improving Iodine Status of Children at Rural Area in West Java, Indonesia
mothers reported that dietary and the adequacy level of mothers’ intakes were consistently poorer than their children’s intake in general and throughout the course of a month (McIntyre et al., 2003).
Protein and fat intake which were quite similar between mothers and children and also were lower than RDA might be related to the socioeconomy status of these subjects. Intake of low socioeconomy families tend to be dominated with carbohydrate sources. Protein intake is usually much lower than RDA in the low socioeconomy families because protein food sources are relatively less affordable to these families. Liberona et al (2010) conclude that children in higher socioeconomic levels had a higher intake of protein and fat, while a higher intake of carbohydrate was found among children in lower socioeconomic levels.
Table 24 Average energy and macronutrients intake, RDA, and % RDA of mothers
Energy and Macronutrients Intake Control (n=92) Intervention (n=89) Total (n=181) p-value
Energy (kcal)
Intake (kcal) 1374±458 1575±482 1473±479 0.005*RDA (kcal) 2293±485 2257±415 2275±451% RDA 62.7±25.7 72.4±26.8 67.4±26.7 0.013*
Carbohydrate (g)
Intake (g) 196.2±64.3 226.6±70.6 211.2±69.0 0.003*RDA (g) 340.9±71.3 335.9±61.3 338.4±66.4% RDA 60.3±25.0 70.2±27.3 65.2±26.5 0.012*
Protein (g)
Intake (g) 35.8±16.0 40.9±14.1 38.3±15.3 0.026*RDA (g) 60.8±12.3 60.0±11.1 60.4±11.7% RDA 53.8 (6.2-183.5) 66.0 (21.6-148.3) 59.5 (6.2-183.5) 0.005*
Fat (g)
Intake (g) 42.5 (4.3-383.8) 48.3 (11.6-186.8) 46.6 (4.3-383.8) 0.103RDA (g) 65.5±15.2 64.3±12.9 64.9±14.1% RDA 66.6 (7.2-781.8) 77.6 (18.8-350.0) 72.6 (7.2-781.8) 0.091
*significant at p<0.05
In general, micronutrients intake of mothers are inadequate, except for vitamin A and vitamin B1 (Table 25 and 26). The average calcium, phosphor and iron intake of mothers in the intervention group were significantly higher than mothers in the control group.

43
6. FOOD CONSUMPTION
The average intake of vitamin A and B1 between mothers in intervention and control groups were not significantly different. On the other hand, the average intake and %RDA of vitamin C were significantly higher among mothers in intervention group compared to those in control group. However, the average intake of vitamin C in both groups were very low, as it was only less than 77% of vitamin C RDA.
Table 25 Average intake of minerals (calcium, phosphor, and iron), RDA, and % RDA of mothers
Mineral Intake Control (n=92) Intervention (n=89) Total (n=181) p-value
Calcium (mg)
Intake (mg) 172.7 (24.9-987.0) 221.6 (39.5-1024.0) 185.8 (24.9-1024.0) 0.010*RDA (mg) 1011±31 1010±30 1010±31% RDA 17.3 (2.5-98.7) 22.2 (4.0-102.4) 18.6 (2.5-102.4) 0.010*
Phosphor (mg)
Intake (mg) 336±181 427±230 381±211 0.003*RDA (mg) 700±0 700±0 700±0% RDA 48±26 61±33 54±30 0.003*
Iron (mg)
Intake (mg) 9.5±4.1 11.5±5.2 10.5±4.7 0.005*RDA (mg) 24.9±3.7 24.9±3.8 24.9±3.8% RDA 39.4±18.5 47.4±23.5 43.4±21.4 0.012*
*significant at p<0.05
Table 26 Average intake of vitamins (A, B1, and C), RDA, and % RDA of mothers
Vitamin Intake Control (n=92) Intervention (n=89) Total (n=181) p-value
Vitamin A (RE)
Intake (RE) 753±476 901±646 826±569 0.081RDA (RE) 500±0 500±0 500±0% RDA 151±95 180±129 165±114 0.081
Vitamin B1 (mg)
Intake (mg) 1.0 (0.1-3.8) 1.0 (0.0-4.1) 1.0 (0.0-4.1) 0.919RDA (mg) 1.1±0.0 1.1±0.0 1.1±0.0% RDA 94.0 (6.8-341.6) 90.5 (2.0-369.1) 90.7 (2.0-369.1) 0.916
Vitamin C (mg)
Intake (mg) 11.6 (0.0-84.8) 23.4 (0.0-208.1) 17.0 (0.0-208.1) 0.000*RDA (mg) 75±0 75±0 75±0% RDA 15.5 (0.0-113.0) 31.2 (0-277.5) 22.6 (0-277.5) 0.000*
*significant at p<0.05

44
Improving Iodine Status of Children at Rural Area in West Java, Indonesia
Approximately, most mothers’ energy, carbohydrate, protein and fat adequacy levels were categorized as severe deficiency. The energy and carbohydrate adequacy levels of mothers in the intervention group were significantly higher than those in the control group. Accordingly, the proportion of mothers with inadequate energy and carbohydrate intake is lower in the intervention group.
Table 27 Proportion of mothers based on energy and macronutrients adequacy level
Energy and Macronutrients Adequacy Level
Control (n=92) Intervention (n=89) Total (n=181)
p-valuen % n % n %
Energy adequacy levelSevere deficiency (<70%) 63 68.5 45 50.6 108 59.7Medium deficiency (70-79%) 12 13.0 17 19.1 29 16.0Mild deficiency (80-89%) 4 4.3 5 5.6 9 5.0Normal (90-119%) 10 10.9 17 19.1 27 14.9In Excess (≥120%) 3 3.3 5 5.6 8 4.4Mean±SD 62.7±25.7 72.4±26.8 67.4±26.7 0.013*Carbohydrate adequacy levelSevere deficiency (<70%) 64 69.6 53 59.6 117 64.6Medium deficiency (70-79%) 11 12.0 11 12.4 22 12.2Mild deficiency (80-89%) 9 9.8 5 5.6 14 7.7Normal (90-119%) 5 5.4 14 15.7 19 10.5In Excess (≥120%) 3 3.3 6 6.7 9 5.0Mean±SD 60.3±25.0 70.2±27.3 65.2±26.5 0.012*Protein adequacy levelSevere deficiency (<70%) 67 72.8 51 57.3 118 65.2Medium deficiency (70-79%) 8 8.7 9 10.1 17 9.4Mild deficiency (80-89%) 4 4.3 10 11.2 14 7.7Normal (90-119%) 7 7.6 14 15.7 21 11.6In Excess (≥120%) 6 6.5 5 5.6 11 6.1Median (min-max) 53.8 (6.2-183.5) 66.0 (21.6-148.3) 59.5 (6.2-183.5) 0.005*Fat adequacy levelSevere deficiency (<70%) 48 52.2 36 40.4 84 46.4Medium deficiency (70-79%) 11 12.0 10 11.2 21 11.6Mild deficiency (80-89%) 5 5.4 9 10.1 14 7.7Normal (90-119%) 9 9.8 15 16.9 24 13.3In Excess (≥120%) 19 20.7 19 21.3 38 21.0Median (min-max) 66.6 (7.2-781.8) 77.6 (18.8-350.0) 72.6 (7.2-781.8) 0.091
*significant at p<0.05

45
6. FOOD CONSUMPTION
The protein adequacy level of mothers in intervention group was significantly higher than those in the control group (70.2% vs 60.3%). The fat adequacy level was similar and deficient in both groups.
The minerals (calcium, phosphor, and iron) adequacy level of mothers in the intervention group were significantly higher than those in the control group (Table 28). However, most mothers in both groups (75.3% - 98.9%) had inadequate intake of calcium, phosphor and iron.
Table 28 Proportion of mothers based on mineral (calcium, phosphor, and iron) adequacy level
Mineral Adequacy LevelControl (n=92) Intervention (n=89) Total (n=181)
p-valuen % n % n %
Calcium adequacy levelDeficient (<77%) 91 98.9 86 96.6 177 97.8Adequate (≥77%) 1 1.1 3 3.4 4 2.2Median (min-max) 17.3 (2.5-98.7) 22.2 (4.0-102.4) 18.6 (2.5-102.4) 0.010*Phosphor adequacy level
Deficient (<77%) 79 85.9 67 75.3 146 80.7Adequate (≥77%) 13 14.1 22 24.7 35 19.3Mean±SD 48.0±25.8 61.1±32.8 54.4±30.1 0.003*Iron adequacy level
Deficient (<77%) 88 95.7 81 91.0 169 93.4Adequate (≥77%) 4 4.3 8 9.0 12 6.6Mean±SD 39.4±18.5 47.4±23.5 43.4±21.4 0.012*
*significant at p<0.05
The adequacy level of vitamin A and B1 in both groups were quite similar (Table 29). Most mothers in both groups had adequate intake of vitamin A and B1. Alternatingly, the vitamin C adequacy level was significantly higher among mothers in the intervention group. Almost all mothers in the control group (97.8%) and about three-quarter of mothers in the intervention group (79.8%) had inadequate intake of vitamin C.

46
Improving Iodine Status of Children at Rural Area in West Java, Indonesia
Table 29 Proportion of mothers based on vitamin (A, B1, and C) adequacy level
Vitamin Adequacy Level
Control (n=92)
Intervention (n=89)
Total (n=181) p-value
n % n % n %
Vitamin A adequacy level
Deficient (<77%) 25 27.2 16 18.0 41 22.7Adequate (≥77%) 67 72.8 73 82.0 140 77.3Mean±SD 150.6±95.2 180.1±129.2 165.1±113.8 0.081Vitamin B1 adequacy level
Deficient (<77%) 40 43.5 37 41.6 77 42.5Adequate (≥77%) 52 56.5 52 58.4 104 57.5Median (min-max) 94.0 (6.8-341.6) 90.5 (2.0-369.1) 90.7 (2.0-369.1) 0.916Vitamin C adequacy level
Deficient (<77%) 90 97.8 71 79.8 161 89.0Adequate (≥77%) 2 2.2 18 20.2 20 11.0Median (min-max) 15.5 (0.0-113.0) 31.2 (0-277.5) 22.6 (0-277.5) 0.000*
*significant at p<0.05

7
NUTRITIONAL STATUS
7.1 Nutritional Status of School ChildrenNutritional status is the physiological state of an individual that results
from the relationship between nutrient intake and requirements and from the body’s ability to digest, absorb and use these nutrients (FAO/IFAD/WFP 2014). Anthropometric nutritional status in this study was assessed based on body mass index for age. Before the intervention (Table 30), nutritional status of most elementary school children in eight sub-districts of study sites fell under the normal category (83%), while small number of them fell into the thin/severely thin category (8%). On the other hand, the signs of children with overnutrition were also seen from some children who fell into overweight (6%) and obese (3%) categories. In this study area, the prevalence of thin and severely thin school children were lower than the national prevalence (11.2%). Nutritional status of overweight and obese children were still lower than the national prevalence (10.8%) and the prevalence in urban area (8%) (MoH 2013a).

48
Improving Iodine Status of Children at Rural Area in West Java, Indonesia
Table 30 Distribution of school children by anthropometric nutritional status
Nutritional status (BMI
for age)
Control (n=92) Intervention (n=89) Total (n=181)
baseline endline baseline endline baseline endline
n % n % n % n % n % n %
Severely thin (<-3 SD) 0 0 1 1 0 0.00 0 0 0 0.00 1 1
Thin (-3 s/d <-2 SD)
11 12 7 8 4 4 4 4 15 8 11 6
Normal (-2 s/d +1 SD) 70 76 69 75 80 90 77 87 150 83 146 81
Overweight (>+1 s/d +2 SD)
6 7 9 10 4 4 7 8 10 6 16 9
Obese (>+2 SD) 5 5 6 7 1 1 1 1 6 3 7 4
Mean±SD1 -0.53±1.23 -0.31±1.27 -0.64±0.95 -0.29±0.95 -0.58±1.10 -0.30±1.12
Delta2 0.22±0.49 0.35±0.35 0.29±0.43
Description: 1 t-test before and after the program showed no significant difference (p>0.05) in the control group, whereas the ones in the intervention group showed significant difference (p<0.05)
2 Mann-Whitney test, the difference in median BMI-for-age changes was significant
Note: there was an abnormal data of student’s nutritional status in the baseline.
After the intervention, mean anthropometric nutritional status (z score) increased by 0.22 in the control group and 0.35 in the intervention group. The increase in nutritional status in the control group was not significantly different (p>0.05), while the students in the intervention group was significantly different before and after the intervention (p<0.05). Although this program focused on improving iodine status, but the balanced nutrition topic was also presented in the education program. Therefore, there might be changes in children’s behaviors (i.e. improving food consumption) so that it had an impact on the anthropometric nutritional status.
The results of correlation test showed that students’ BMI-for-age Z scores were positively related to maternal BMI, maternal education level, maternal nutrition knowledge, and household expenditures.

49
7. NUTRITIONAL STATUS
7.2 Anthropometric Status of MothersMaternal anthropometric nutritional status was assessed using BMI
indicator. The ratio of body weight and height indicates weight in relation to height and is useful for measuring overweight and obesity in adults (Gibson 2005). Although this study sites were in rural areas, it was seen from the total distribution of nutritional status at baseline (Table 31) that the number of mothers with overweight status was quite high (16.6%), as were the obese mothers (38.1%). It turned out that the prevalence of obese mothers in this area was higher than the national average of 32.9% (MoH 2013a). Obese women had a higher risk of developing diabetes and coronary heart disease, cancer diseases such as endometrial cancer, cervical cancer, breast cancer, and ovarian cancer (Kulie et al. 2011).
Table 31 Distribution of the mothers based on anthropometric nutritional status
Maternal BMI
Control (n=92) Intervention (n=89) Total (n=181)
baseline endline baseline endline baseline endline
n % n % n % n % n % n %
Thin (<18.50) 5 5.4 4 4.3 4 4.5 3 3.4 9 5.0 7 3.9
Normal (18.50-24.99)
37 40.2 40 43.5 36 40.4 38 42.7 73 40.3 78 43.1
Overweight (25.00-26.99)
13 14.1 9 9.8 17 19.1 15 16.9 30 16.6 24 13.3
Obese (≥27.00) 37 40.2 39 42.4 32 36.0 33 37.1 69 38.1 72 39.8
Mean±SD1 25.93±4.75 26.07±4.95 25.49±4.45 25.51±4.26 25.71±4.60 25.79±4.62
Delta2 0.14±1.89 0.02±1.56 0.08±1.73
Description: 1 t-test before and after the program in both groups showed no significant differences (p>0.05)
2 t-test showed that the difference in mean BMI changes was not significant (p>0.05)
Nevertheless, on the other hand, mothers with thin nutritional status (5.0%) were still found and this prevalence was lower than the national prevalence (8.7%) (MoH 2013a). Differences in mean and proportion of nutritional status between the control and intervention groups were not significant (p>0.05). The main target of this program was the school children, thereby the impact actually was not expected to occur to their parents.

50
Improving Iodine Status of Children at Rural Area in West Java, Indonesia
Results of correlation test showed that maternal BMI was related to the mother’s education, total family income, maternal nutrition behaviors, and % RDA of energy, protein, fat and carbohydrates.

8
IMPACT OF INTERVENTION
8.1. Nutrition Knowledge, Attitude, and Practice of School Children
Nutrition knowledge becomes an important foundation for nutrition attitude changes. In this study, nutrition knowledge was measured by a number of true-false questions because elementary school-aged children would understand easier what was meant in the instruments of this study.
Table 32 shows the distribution of nutrition knowledge of the school children in the control and intervention group. In both groups, the majority of school children had poor nutrition knowledge (score <60), either at baseline or endline. It indicated that many school children did not understand the nutritional and food aspects in relation to health, as well as the things related to the benefits of iodine for health or intelligence.
After the intervention, there was no significant increase in nutrition knowledge score in the control group (p>0.05); i.e. the mean score at baseline was 43.04 and it slightly increased to 45.82 at the endline. It was different from the intervention group, in which the mean score of nutrition knowledge at baseline was 42.30 and then increased significantly (p<0.01) to 51.29 at the endline.
Independent t-test comparing the increase in nutrition knowledge score of the control group (2.77±14.05) versus the intervention group (8.99±13.02) showed a very significant difference (p<0.01). It meant that intervention activities conducted -- in the form of nutrition education -- had succeeded

52
Improving Iodine Status of Children at Rural Area in West Java, Indonesia
in increasing nutrition knowledge of the elementary students. According to Notoatmodjo (2003), knowledge about health is the result of investment in health education in the short term. Increased nutrition knowledge will be a good provision for the elementary students involved in this study to improve food consumption pattern, particularly the one related to food sources of iodine.
Table 32. Distribution of subjects based on nutrition knowledge of the school children
Nutrition knowledge
(score)
Control (n=92) Intervention (n=89) Total (n=181)
Baseline Endline Baseline Endline Baseline Endline
n % n % n % n % n % n %
Poor (<60) 84 91.3 79 85.9 85 95.5 60 67.4 169 93.4 139 76.8Moderate (60-79) 7 7.6 11 12.0 4 4.5 27 30.3 11 6.1 38 21.0
Good (≥80) 1 1.1 2 2.2 0 0.0 2 2.2 1 0.6 4 2.2
Mean±SD 43.04±12.38 45.82±13.08 42.30±10.93 51.29±14.49 42.68±11.66 48.51±14.02
p 0.062 0.000* 0.000*
Delta Score 2.77±14.05 8.99±13.02 5.83±13.87
p 0.002*
*significant at p<0.05
Nutrition attitude is the tendency of a person (student) to have good nutrition practices according to the positive stimulus given. After the school children get nutrition knowledge through nutrition education activities, it is expected that they will also develop positive nutrition attitudes which eventually will be able to change their nutrition practices for the better.
Table 33 below shows the distribution of school children based on their nutrition attitudes. It appears that the nutrition attitudes in general (most of the elementary students) spreads among poor (score <60) and moderate (score between 60-79) categories. Very few elementary students in the control and intervention groups that had good nutrition attitudes.

53
8. IMPACT OF INTERVENTION
Table 33. Distribution of subjects based on nutrition attitudes of the school children
Nutrition attitudes (score)
Control (n=92) Intervention (n=89) Total (n=181)Baseline Endline Baseline Endline Baseline Endline
n % n % n % n % n % n %Poor (<60) 42 45.7 53 57.6 41 46.1 34 38.2 83 45.9 87 48.1Moderate (60-79) 44 47.8 34 37.0 41 46.1 40 44.9 85 47.0 74 40.9
Good (≥80) 6 6.5 5 5.4 7 7.9 15 16.9 13 7.2 20 11.0Mean±SD 58.10±12.53 53.86±15.08 58.71±14.70 60.62±16.87 58.40±13.61 57.18±16.30p 0.003* 0.250 0.271Delta Score -4.24±13.42 1.91±15.57 -1.22±14.80p 0.005*
*significant at p<0.05
In the control group, the nutrition attitude actually worsened or the score dropped from 58.10 (baseline) to 53.86 (endline). This decrease was very significant (p<0.01) and it showed that nutrition attitude was unstable and volatile. In the intervention group, there was an increase in the score of nutrition attitude after nutrition education was completed (58.71 at baseline became 60.62 at endline) but the increase was not significant (p>0.05).
Independent t-test showed that the increase in scores in the intervention group (1.91±15.57) was significantly higher (p<0.05) than the control group (-4.24±13.42). This study proved that nutrition attitude could be improved by providing nutrition education intervention. The improvement in nutrition attitude is expected to improve students’ nutrition practices towards a better direction.
Table 34 shows the distribution of nutrition practices of school children that was relatively similar to the nutrition attitudes; i.e. there were more students whose nutrition practices fell into poor (score <60) and moderate (score between 60-79) categories, and only few that fell under the “good nutrition practices” category. Baseline (57.88) and endline (56.96) scores in the control group showed a slight decrease, while there was an increase in nutrition practice scores in the intervention group (57.13 at baseline became 58.93 at endline).
Mann-Whitney test showed no significant difference (p>0.05) in the increase of nutrition practice scores in the control group (-0.92±16.03) and the intervention group (1.80±17.89). Changes in nutrition practices need

54
Improving Iodine Status of Children at Rural Area in West Java, Indonesia
longer duration than the changes in nutrition knowledge. Besides, there are other additional factors that can encourage changes in practices such as economic factors, food availability, etc. Good-quality foods or nutrients derived from animal food or seafood are generally expensive. Therefore, the improvement of family economy is necessary to change the practices related to good-quality foods.
In broad terms, it can be said that the action-research activities performed have been able to improve nutrition knowledge and attitudes of the school children, but not yet able to improve nutrition practices. It is expected that the improved economic life supported by improved policies in the distribution of iodized salt will encourage the changes in nutrition practices.
Table 34. Distribution of subjects based on nutrition practices of the school children
Nutrition practices(score)
Control (n=92) Intervention (n=89) Total (n=181)Baseline Endline Baseline Endline Baseline Endline
n % n % n % n % n % n %Poor (<60) 49 53.3 46 50.0 43 48.3 36 40.4 92 50.8 82 45.3Moderate (60-79) 34 37.0 40 43.5 39 43.8 47 52.8 73 40.3 87 48.1
Good (≥80) 9 9.8 6 6.5 7 7.9 6 6.7 16 8.8 12 6.6
Mean±SD(Median)
57.88±14.09(55.0)
56.96±14.58(57.5)
57.13±14.50(60.0)
58.93±14.05(60.0)
57.51±14.26(55.0)
57.93±14.32(60.0)
Wilcoxon p-value 0.498 0.339 0.842
Delta Score -0.92±16.03 1.80±17.89 0.41±16.98Mann- Whitney p-value
0.363
8.2. Maternal Nutrition Knowledge, Attitude, and Practice
Table 35 shows the distribution of maternal nutrition knowledge scores. Similar to the knowledge of the elementary students, there were still many mothers with poor nutrition knowledge (82.6% in the control group and 83.2% in the intervention group) at the time of baseline data collected. It might be related to formal education of the mothers in rural areas that was generally also low (only elementary-school graduate); thus, the access to information on

55
8. IMPACT OF INTERVENTION
nutrition knowledge was limited. Suhardjo (1996) stated that poor nutrition knowledge led to decreased ability of a person to put the information into practice in everyday life, and was one of the causes of nutrition disorders. The results of study by Madanijah & Hirmawan (2007) indicated that maternal knowledge about Iodine Deficiency Disorders (IDDs) had a very significant association with the quality of iodine content in the salt used by the family. It showed that the quality of iodine in salt used by the family was also good if the mothers had good IDDs knowledge. De Vriendt et al. (2009) stated that education level, age, and types of women’s occupation were important factors affecting nutrition knowledge.
After nutrition education activities were conducted, there was an improvement in nutrition knowledge among mothers in the intervention group. The nutrition knowledge score increased from 44.66 (baseline) to 52.81 (endline), and the increase of this score was very significant (p<0.01). Meanwhile, there was no significant increase in the control group (p>0.05).
Table 35. Distribution of mothers based on maternal nutrition knowledge
Nutrition knowledge
(score)
Control (n=92) Intervention (n=89) Total (n=181)
Baseline Endline Baseline Endline Baseline Endline
n % n % n % n % n % n %
Poor (<60) 76 82.6 78 84.8 74 83.2 52 58.4 150 82.9 130 71.8
Moderate (60-79) 16 17.4 14 15.2 15 16.9 34 38.2 31 17.1 48 26.5
Good (≥80) 0 0.0 0 0.0 0 0.0 3 3.4 0 0.0 3 1.7
Mean±SD(Median)
43.75±14.31(45.0)
43.59±13.43(45.0)
44.66±12.54(45.0)
52.81±14.77(55.0)
44.20±13.44(45.0)
48.12±14.81(50.0)
Wilcoxon p-value 0.994 0.000* 0.000*
Delta Score -0.16±12.81 8.15±13.02 3.92±13.53
Mann- Whitney p-value
0.000*
*significant at p<0.05
Mann-Whitney test showed that changes in baseline-endline knowledge scores in the intervention group (8.15±13.02) were significantly much higher (p<0.01) than the control group (-0.16±12.81). Nutrition knowledge is included in cognitive domains, in which its improvement may occur when a

56
Improving Iodine Status of Children at Rural Area in West Java, Indonesia
person is able to remember the nutritional information given during nutrition education. Retention to remember this nutritional information may last for a long time after a person receives nutrition knowledge intervention. In this study, the interval between baseline and endline data collection was about five months. It means that the mothers involved in this intervention study are still able to remember well the nutritional information provided within the previous five-months range.
Table 36 shows the distribution of maternal nutrition attitudes that mostly fell into poor (score <60) and moderate (score between 60-79) categories. Only a few mothers (10.9% in the control group and 7.9% in the intervention group) had good nutrition attitudes. Good nutrition knowledge (cognitive) sometimes has not been able to encourage good nutrition attitudes because nutrition attitudes are manifestation of the tendency to act. The tendency will lead to positive things if the mothers have the resources to make it happen.
Baseline-endline data showed a decrease in maternal nutrition attitude scores in the control group (a score of 63.97 at baseline became 61.20 at endline), but there was an increase in the intervention group (a score of 64.49 at baseline became 69.33 at endline). Mann-Whitney test to analyze the occurrence of changes in baseline-endline scores showed that the change in maternal nutrition attitude scores in the intervention group (4.83±15.86) was higher (p<0.01) than the control group (-2.77±12.63). In conclusion, either in the elementary students or the mothers, nutrition education activities can significantly improve their nutrition attitudes.
Table 37 shows the distribution of maternal nutrition practices, found either in the control group or intervention group fell into poor (score <60) and moderate (score between 60-79) categories. Nutrition education activities in the intervention group succeeded in improving maternal nutrition practice scores significantly (baseline-endline). In the control group, there were no changes in baseline-endline scores (p>0.05).

57
8. IMPACT OF INTERVENTION
Table 36. Distribution of mothers based on maternal nutrition attitude
Nutrition attitudes
score
Control (n=92) Intervention (n=89) Total (n=181)
Baseline Endline Baseline Baseline Endline Baseline
n % n % n % n % n % n %
Poor (<60) 23 25.0 34 37.0 18 20.2 12 13.5 41 22.7 46 25.4
Moderate (60-79) 59 64.1 49 53.3 64 71.9 50 56.2 123 68.0 99 54.7
Good (≥80) 10 10.9 9 9.8 7 7.9 27 30.3 17 9.4 36 19.9
Mean±SD(Median)
63.97±10.60(65.0)
61.20±13.88(60.0)
64.49±10.92(65.0)
69.33±13.64(70.0)
64.23±10.74(65.0)
65.19±14.31(65.0)
Wilcoxon p-value 0.046* 0.002* 0.309
Delta Score -2.77±12.63 4.83±15.86 0.97±14.77
Mann- Whitney p-value
0.000*
*significant at p<0.05
Table 37. Distribution of mothers based on maternal nutrition practices
Nutrition practices (score)
Control (n=92) Intervention (n=89) Total (n=181)
Baseline Endline Baseline Baseline Endline Baseline
n % n % n % n % n % n %
Poor (<60) 52 56.5 59 64.1 38 42.7 30 33.7 90 49.7 89 49.2
Moderate (60-79) 32 34.8 24 26.1 47 52.8 43 48.3 79 43.7 67 37.0
Good (≥80) 8 8.7 9 9.8 4 4.5 16 18.0 12 6.6 25 13.8
Mean±SD(Median)
54.02±16.65(52.5)
53.70±15.55(50.0)
59.72±12.76(60.0)
63.37±13.63(65.0)
56.82±15.09(60.0)
58.45±15.38(60.0)
Wilcoxon p-value 0.947 0.029* 0.127
Delta Score -0.33±17.88 3.65±14.14 1.63±16.23
Mann- Whitney p-value
0.207
*significant at p<0.05
Mann-Whitney test showed that the changes in nutrition practice score in the control group (-0.33±17.88) were not significantly different (p>0.05) from the changes in nutrition practice score in the intervention group (3.65±14.14). It indicates that -- similar to nutrition practices of the elementary students that also have not changed after the intervention activities -- it still needs a

58
Improving Iodine Status of Children at Rural Area in West Java, Indonesia
longer duration accompanied by improvements in welfare that allows mothers to access good-quality foods, as well as better policies regarding iodized-salt distribution so that the families in rural areas are more aware and willing to choose iodized salt as good food for consumption.
8.3. Nutrition Knowledge, Attitude, and Practice of Teachers
In this study, nutrition knowledge intervention was given to three groups of subjects; i.e. elementary students, mothers, and teachers. This holistic intervention is expected to foster a more comprehensive awareness of nutrition on all targets. It is because the nutrition knowledge is one of the variables affecting a person’s lifestyle besides other variables such as health knowledge, income, occupation, education, ethnicity, location or residence, religion and psychological characteristics. This lifestyle will then determine the individuals’ practices in consuming food (Suharjo 1989).
Table 38 shows the distribution of teachers’ nutrition knowledge scores. Most of the teachers, either in the control group or intervention group, fell in moderate (score between 60-79) and good (≥80) nutrition knowledge categories. It is understandable because teachers generally have higher education than the general population. Access to nutritional information and interest in reading may also be higher among teachers.
Baseline-endline data showed that the endline scores of nutrition knowledge (76.00) in the intervention group increased considerably higher than the baseline data (66.75). The increase in nutrition knowledge scores in the intervention group was very significant (p<0.01). Meanwhile, there was no increase in nutrition knowledge scores in the control group (p>0.05). Independent t-test showed that changes in nutrition knowledge scores in the intervention group (9.25±11.27) were significantly higher (p<0.01) than the ones in the control group (-1.39±8.19).

59
8. IMPACT OF INTERVENTION
Table 38. Distribution of teachers based on nutrition knowledge
Nutrition knowledge
(score)
Control (n=18) Intervention (n=20) Total (n=38)
Baseline Endline Baseline Endline Baseline Endline
n % n % n % n % n % n %
Poor (<60) 1 5.6 1 5.6 2 10.0 2 10.0 3 7.9 3 7.9Moderate (60-79) 13 72.2 11 61.1 16 80.0 9 45.0 29 76.3 20 52.6
Good (≥80) 4 22.2 6 33.3 2 10.0 9 45.0 6 15.8 15 39.5Mean±SD 72.78±9.11 71.39±12.81 66.75±8.47 76.00±13.04 69.61±9.18 73.82±12.38p 0.482 0.002* 0.026*
Delta Score -1.39±8.19 9.25±11.27 4.21±11.18p 0.002*
*significant at p<0.05
Table 39 shows the distribution of teachers’ nutrition attitudes. Similar to teachers’ nutrition knowledge, most of the teachers’ nutrition attitudes fell under the moderate (score between 60-79) and good (score ≥80) categories. Nutrition attitude score in the intervention group increased significantly (p<0.05) at the endline (71.25) compared to the baseline score (66.00). The increased score also occurred in the control group but not significant (p>0.05). Furthermore, independent t-test showed that the changes in baseline-endline scores between the control group and the intervention group were relatively similar (p>0.05).
Table 39. Distribution of teachers based on nutrition attitudes
Nutrition attitudes (score)
Control (n=18) Intervention (n=20) Total (n=38)
Baseline Endline Baseline Endline Baseline Endline
n % n % n % n % n % n %
Poor (<60) 4 22.2 4 22.2 3 15.0 4 20.0 7 18.4 8 21.1Moderate (60-79) 7 38.9 5 27.8 15 75.0 7 35.0 22 57.9 12 31.6
Good (≥80) 7 38.9 9 50.0 2 10.0 9 45.0 9 23.7 18 47.4Mean±SD 68.61±13.15 71.39±12.81 66.00±10.59 71.25±16.37 67.24±11.78 71.32±14.60p 0.326 0.039* 0.028*
Delta Score 2.78±11.66 5.25±10.57 4.08±11.02p 0.497
*significant at p<0.05
60
Improving Iodine Status of Children at Rural Area in West Java, Indonesia
The teachers’ nutrition attitudes that have been relatively good, as well as their nutrition knowledge, are expected to be implemented in their families. In addition, the teachers as agents of change are expected to disseminate these nutrition knowledge and attitudes to their students. Teachers have more opportunities and better power to instill important aspects related to dietary pattern improvement (including choosing iodine food resource) to their students. In many ways, students are sometimes more obedient to their teachers than their families. Therefore, nutrition education intervention to the teachers can be an important entry point for nutrition improvement among students and their families.
Table 40 shows teachers’ nutrition practices. There were no poor nutrition practices found in the control group, while poor nutrition practices were found in the intervention group at baseline (5.00%) and became 0.00% at the endline. By comparing the baseline and endline data, it was found that there was a significant increase (p<0.01) in the control group between the baseline (78.06) and endline (85.28) nutrition practice scores; and likewise in the intervention group (p<0.05), baseline score of 75.25 became 82.25 at the endline.
Independent t-test showed that there were no differences (p>0.05) between the changes in nutrition practice scores in the control group (7.22±7.90) and the intervention group (7.00±13.71). It meant that the changes in nutrition practice scores that led to a better thing were equally happening, either in the intervention group or in the control group. These changes (in both groups of teachers) could occur due to teachers’ abilities to access nutritional information from various sources.
In rural areas, teachers generally have better economic position than the general population. It facilitates them to get good-quality foods (including food sources of iodine), which are more more expensive than other types of food. Thus, nutrition improvement can be achieved if synergistic efforts are continuously done through nutrition knowledge and economic improvements to the target groups (elementary students, mothers and teachers in this study).

61
8. IMPACT OF INTERVENTION
Table 40. Distribution of teachers based on nutrition practices
Nutrition practices (score)
Control (n=18) Intervention (n=20) Total (n=38)
Baseline Endline Baseline Endline Baseline Endline
n % n % n % n % n % n %
Poor (<60) 0 0.0 0 0.0 1 5.0 0 0.0 1 2.6 0 0.0Moderate (60-79) 9 50.0 1 5.6 10 50.0 6 30.0 19 50.0 7 18.4Good (≥80) 9 50.0 17 94.4 9 45.0 14 70.0 18 47.4 31 81.6Mean±SD 78.06±7.30 85.28±5.81 75.25±11.53 82.25±8.35 76.58±9.73 83.68±7.32p 0.001* 0.034* 0.000*
Delta Score 7.22±7.90 7.00±13.71 7.11±11.19p 0.222
*significant at p<0.05
8.4. Iodine Status of School ChildrenAccording to WHO (2007), iodine deficiency occurs when iodine intake
falls below the recommended levels. When iodine intake falls below the recommended levels, the thyroid may no longer be able to synthesize sufficient amounts of thyroid hormone. The resulting low level of thyroid hormones in the blood (hypothyroidism) is the principal factor responsible for damage to the developing brain and other harmful effects known collectively as “Iodine Deficiency Disorders (IDD)”. Iodine deficiency, through its effects on the developing brain, has condemned millions of people to a life of few prospects and continued underdevelopment. On a worldwide basis, iodine deficiency is the single most important preventable cause of brain damage.
According to Andersson et al. (2012), the most recent data on Urinary Iodine Concentration (UIC) cover 96.1% of the world’s population of school-age children (SAC), and since 2007, new national data are available for 58 countries. At the national level, there has been major progress: from 2003 to 2011, the number of iodine-deficient countries decreased from 54 to 32 and the number of countries with adequate iodine intake increased from 67 to 105. However, globally, 29.8% of SAC (241 million) are estimated to have insufficient iodine intakes. Southeast Asia has the largest number of SAC with low iodine intakes (76 million). Thus, although iodine nutrition has been improving since 2003, global progress may be slowing. Intervention programs need to be extended to reach the nearly one-third of the global population that still has inadequate iodine intakes.

62
Improving Iodine Status of Children at Rural Area in West Java, Indonesia
In the total population of this study, the median value of UIC before the intervention was 180 µg/l. This median value fell into the normal category, although it was lower than the analysis result of the Indonesia Basic Health Research (IBHR) data in 2013 which showed that mean value among school children in rural areas was 198 µg/l (Kartono et al. 2016). At the baseline (Table 41), before the program was conducted, the median value of UIC in the control group was higher (199 µg/l) than the intervention group (166 µg/l). According to WHO (2007), median UIC value of 100-199 µg/l fell under the “sufficient” category; thus, children’s iodine status in both groups before the intervention was sufficient (no iodine deficiency). However, before the program, the number of children below the standard (<100 µg/l) were 2.2% in the control group and 9.0% in the intervention group.
Table 41. Iodine status of school children based on on-spot urine collection
On-spot Urine Iodine
Concentration (UIC)
Control (n=92)1 Intervention (n=89)1 Total (n=181)
baseline endline baseline Endline baseline endline
n % n % n % n % n % n %
mean±SD (median) 1
189.6±53.7 (199)
189.0±74.1 (191)
169.3±54.9 (166)
176.8±55.6 (184)
179.6±55.1 (180)
183.0±65.8 (186)
Subject’s UIC < 100 µg/l< 100 µg/l
2 2.2 13 14.1 8 9.0 11 12.4 10 5.5 24 13.3
Delta UIC2 -0.6±79.9 7.6±66.9 3.43±73.7
Description: 1 t-test before and after the program in both groups showed no significant differences (p>0.05)
2 t-test showed that the difference in mean UIC changes was not significant (p>0.05)
After the intervention, in the form of 2-month public education, there were changes in median values of urinary iodine. In the control group, there was a slight decrease in median value of UIC to 191 µg/l although this number (-0.6 µg/l) was not significant (p>0.05). Meanwhile, in the intervention group the UIC increased to 184 µg/l after the intervention. Eventhough there was an increase of 7.6 µg/l, but it was not significant (p>0.05). Based on the t-test, the difference in UIC value changes between the two groups after the intervention was not significant (p>0.05). After the intervention, the number of children below the standard were 14.1% in the control group and 12.4% in the intervention group. It seems that the program undertaken in these

63
8. IMPACT OF INTERVENTION
activities has not fully affected the changes of iodine biomarkers in urine. It is possibly caused by the still widely circulating salt with SNI label on the market, but the iodine content is evidently below the standard.
Besides on-spot urine parameter, assessment of iodine status was also done by 24-hour urine collection. It was intended to see the possibility of difference in the outcomes between the two methods. With the 24-hour urine method, median value of UIC was seen lower than the on-spot urine. Median values in both groups were 160 µg/l in the control group and 154 µg/l in the intervention group (Table 42). Thus, the number of children with UIC below the standard (<100 µg/l) in the control and intervention groups before the program were 15.6% and 20.0%, respectively.
Table 42. Iodine status of school children based on 24-hour urine collection
24-hour Urine Iodine
Concentration (UIC)
Control (n=45) Intervention (n=45) Total (n=90)
baseline endline baseline Endline baseline endline
n % n % n % n % n % n %
mean±SD (median) 1
163.5±58.8 (160)
167.4±60.7 (166)
158.8±65.8 (154)
174.4±63.8 (174)
161.1±62.1 (160)
170.9±62.0 (169)
Delta UIC2 3.9±54.9 15.7±63.0 9.8±59.1
Subjects’ UICs < 100 µg/l 7 15.6 6 13.3 9 20.0 7 15.6 16 17.8 13 14.4
Description: 1 t-test before and after the program in both groups showed no significant differences (p>0.05)
2 t-test showed that the difference in mean UIC changes was not significant (p>0.05)
Table 43. Independent t-test between on spot and 24-hour Urine Iodine Concentration (UIC) of school children
Urine Iodine Concentration (UIC)
Baseline EndlineOn Spot 24-hour On Spot 24-hour
Mean±SD (Median)
179.6±55.1 (180)
161.1±62.1 (160)
183.0±65.8 (186)
170.9±62.0 (169)
p-value of independent t-test 0.083 0.980

64
Improving Iodine Status of Children at Rural Area in West Java, Indonesia
After the intervention, there was an increase in UIC at 24-hour urine collection, either in the control group or the intervention group; i.e. 3.9 µg/l and 15.7 µg/l, respectively. There was no significant difference in the increase of UICs between the two groups (p>0.05). The percentage of children with UIC below 100 µg/l decreased to 13.3% in the control group and 15.6% in the intervention group. There was a tendency that UIC of the urine collected using 24-hour method had lower value than on-spot urine. Table 43 showed that according to independent t-test, there was no significant difference between the UIC of on-spot urine and 24-hour urine (p>0.05).
The correlation test also showed a correlation between iodine intake and on-spot UIC (r=0.174; p=0.016), but no correlation with 24-hour UIC (r=0.047; p=0.654). Those results were not in line with the results of study conducted by Rizqiawan (2015), which showed that there was no correlation between iodine intake and students’ on-spot UICs. In addition, the validation of 24-hour and on-spot urine collections in this study did not show different conclusions, i.e.: a) UICs increased after the program in both groups; b) the improvement of UIC in the intervention group was higher than the control group although the difference was not significant.

9
NUTRITION PROMOTION TO STAKEHOLDERS
9.1. Nutrition to Optimize Children’s Health and Intelligence
A seminar entitled “Nutrition to Optimize Children’s Health and Intelligence” was conducted at Amaris Hotel - Bogor District on February 9, 2017. The seminar was intended to socialize and convince the importance of iodized salt for health and cognitive, and to succeed the Universal Salt Iodization Program in Indonesia.
The speakers were Dede Agung Priatna, MD (Head of Family Health and Nutrition Section, Health Office of Bogor District), Dr. Risatianti Kolopaking (psychologist at child clinic, Hermina Maternity and Children Hospital, Bekasi; Pertamedika Sentul City Hospital, Bogor; and lecturer at Syarif Hidayatullah State Islamic University, Jakarta), Karina Rahmadia Ekawidyani, MD, MSc, and Leily Amalia, STP, MSi (research team and lecturers at Department of Community Nutrition, Bogor Agricultural University). The participants were staffs of Regional Secretariat of Bogor District; Regional Development Planning Board of Bogor District; Health Office of Bogor District; Education Office of Bogor District; Office of Cooperatives, Small and Medium Enterprises, Industry and Trading of Bogor District; Puskesmas’ Head and Nutritionist from 8 sub-districts of study sites; principals and teachers from 8 sub-districts of study sites.
The materials presented by Dede Agung Priatna was Profile of Nutrition and Health of Elementary School Children in Bogor District. The nutrition problems due to macronutrient deficiencies that occur among elementary

66
Improving Iodine Status of Children at Rural Area in West Java, Indonesia
school children in Indonesia are underweight (chronic energy malnutrition/CEM), stunting and obesity. The percentage of boys aged 6-12 years who are thin (CEM), stunted and obese were higher than girls of the same age range. Boys aged 6-12 years who are thin (CEM), stunted and obese are 13.2%, 36.5% and 10.7%, respectively. Meanwhile, the girls aged 6-12 years who are thin (CEM), stunted, and obese are 11.2%, 24.5% and 7.7%, respectively. In addition to macronutrient deficiencies, the school children also have nutrition problems due to micronutrient deficiencies; i.e. iron deficiency anemia (26.4% among children aged 5-14 years). The impact of iron deficiency anemia is decreased concentration and academic achievement.
One of the causes of nutrition problems is poor eating behaviors of the school children, such as breakfast skipping, irregular eating, likes to eat snacks, choosing a particular food based on preference and trends, and avoiding certain foods due to fear of being fat (the view of school children about body image). The prevalence of sweet, salty, and fatty foods consumed by children aged ≥ 10 years ranges between 45% and 51%. Two of 10 children aged ≥ 10 years eat noodle products ≥ 1 times a day.
The most common disease in the school children is acute respiratory infection (ARI); i.e. 25.42% in 2015. This health problem can be overcomed by 1) improving health education through extracurricular activities such as “Little Doctor” Program, Junior Red Cross (JRC), and Scout Program, as well as “My Health Report” Program; 2) improving health services by conducting periodical health screening, immunization month for school children, giving iron tablets to adolescent girls, and giving referral to Puskesmas/hospitals; and 3) conducting the development of healthy school environment such as providing clean water, healthy latrines, non-smoking school environment, healthy canteen/stalls, utilization of school yard, etc.
The second material about Balanced Nutrition Guidelines for Children and Adolescents was delivered by Karina Rahmadia Ekawidyani. Children and adolescents need to be accustomed to eating three times a day with their families, because eating together with family can prevent the children from consuming unhealthy and non-nutritious foods or make them reduce eating those foods. In Indonesia, almost half of the children have a habit of eating low-quality nutrition breakfast. Children and adolescents also need to be accustomed to eating fish and other protein sources. In Indonesia, its people only consume 32 kg/capita/year of fish, 1.75 kg/capita/year of beef, 8.9 kg/

67
9. NUTRITION PROMOTION TO STAKEHOLDERS
capita/year of eggs, and 13.5 liters/capita/year of milk. The amount is still far behind the protein consumption of people from other countries such as Malaysia, Singapore, and India. Children and adolescents should also increase the consumption of vegetables and fruits. MoH of Republic of Indonesia recommends to consume at least 250 g of fruits and 150 g of vegetables in a day. In Indonesia, 63.3% of children aged more than 10 years consume less vegetables and 62.1% do not consume fruits.
In order to prevent or restrict the children from consuming unhealthy foods such as fast food, street food and sweet, salty and fatty snacks, the school children should be accustomed to bringing packed meals and plain water from home. It should be done because high sodium foods that will be responsible to high blood pressure, and high calorie foods will cause overweight or obesity. Central obesity becomes more common in Indonesia. It may cause heart attack, diabetes, hypertension, and cancer.
The third material on Nutrition and Intelligence was delivered by Leily Amalia. The children whose nutrient requirements are well-fulfilled will also have good intelligence, because nutrients have a very important role in intelligence; i.e. for growth and development of nerve cells, formation of glial cells, and chemical processes of the nerves (neurotransmitter synthesis and receptor synthesis). Nutrients that play a role in intelligence are energy, protein, iron, zinc, polyunsaturated fatty acids, vitamin A, copper (Cu) and iodine. The roles of iron in intelligence are for the formation of myelin that occurs during brain formation (fetal stage and infancy), producing neurotransmitter (fetal stage and infancy), and energy metabolism to make the nerve cells work (entire lifetime). If iron deficiency occurs, the brain cannot get the energy to carry out its function, causing the thinking process to be inhibited.
The roles of iodine in intelligence are to accelerate myelination that occurs during the brain formation, improve the cell differentiation and maturation processes, and the formation of synapses. All of these processes occur during fetal stage and infancy, thus the iodine deficiency in these periods may inhibit brain growth which is irreversible and make the child’s IQ low.
In Indonesia, the causes of IDDs include: 1) low iodine intake. Iodine is commonly found in seafood that is expensive so that it is rarely consumed; 2) reduced iodine content in food (including salt) due to improper storage (iodine is volatile); and 3) excessive consumption of goitrogens. Goitrogens

68
Improving Iodine Status of Children at Rural Area in West Java, Indonesia
are substances that can inhibit the production or the use of thyroid hormones. The reduction of iodine content in iodized salt can be prevented by storing it in a dry place, in a dark glass container, and avoiding it from direct exposure to sunlight. Besides that, the characteristics of a good iodized salt also need to be known; i.e. the ones labeled as “containing iodine”, had a clean-white color, dry and the packaging is tightly closed.
The last material presented at the half-day seminar was about Intelligence Stimulation for Elementary School Children, delivered by Risatianti Kolopaking. Educators, either the parents at home or teachers at school, should give stimulation of intelligence to children by stimulating and giving a guidance to improve the children’s abilities in understanding, analyzing and solving problems. Elementary school children experience different stages of development. In the 1st-2nd grade (age 6-8 years), the children experience a transition period from children under five; thus, they only know about the concept at this period. In the 3rd-4th grade (age 9-10 years), they have experienced school maturity period; thus, they can sharpen the logic. In the 5th-6th grade (age 11-12 years), they undergo a transition period to adolescence; thus, they starts to learn in groups at this time.
There are three aspects of intelligence that need to be known: understanding (concentration and memory), analyzing (language and numeracy), and solving problems (motor and social-emotions). The category of intelligence is also divided into 3; i.e. with special needs (there is a delay in some aspects of intelligence), normal (intelligence appropriate for the age of development), and gifted (prominent in some aspects of intelligence). Intelligence quotient (IQ) is a unit used to measure intelligence. Intelligence is measured using psychological test instruments performed by trained psychologists.
There are 4 types of parenting (guiding the children) method; i.e. 1) democratic (the control lies in the parents according to the child’s needs), 2) authoritarian (the control is in the parents), 3) permissive (the control is in the child), and 4) neglecting (no attachment between parents and children). When guiding the children to become smart, there must be a balance between the fulfillment of parents’ demands and the understanding of children’s needs. It can be done with positive discipline such as consistently managing, correcting and appreciating the child, and guiding the child in facing the difficulties/problems. Besides that, mutual communication is also required by listening carefully, understanding the childs’ wishes, and sharing stories.

69
9. NUTRITION PROMOTION TO STAKEHOLDERS
Stimulating the intelligence of children can be done by talking about everything with children, reading the book for them, teaching how to calculate in everyday activities, playing creative games with friends, exploring the surrounding environment/nature, and utilizing the digital technology. In order to be able to find out whether our children are healthy, intelligent and happy, the parents need to observe children’s physical, mental and social development; assess child’s weaknesses and strengths; organize the daily activities (eating, sleeping/resting, learning and playing); develop various aspects of intelligence in the digital age; do a collaboration between parents and teachers or between the activities at home and at school; and express our love to the child by saying “my love” or “my pride”.
9.2. Problem and Solution of Iodized Salt Implementation in The Community
Iodine status improvement program recently conducted by Indonesia government focuses more on monitoring and evaluating the coverage of iodized salt consumption of the community (consumer side). Universal Salt Iodization (USI) activities conducted since 1990 have begun to slacken in the guidance of salt industry and supervision of iodized salt distribution (supply side). Based on 2013 IBHR data, 50.8% of the iodized salt marketed in the community are below the standard. It was reported that only 22.9% of households consume iodized salt (MoH 2013a).
As for the improvement of iodine status in Bogor District, it was reported from this study that most of the salt in the market was below SNI; i.e. 75%. The households consuming salt that meets the standard were only 2.1%. Not all households have sufficient knowledge, thus the economic limitations cause them to consume non-SNI salt which is cheaper. According to Presidential Decree No. 69 Year 1994, the tradable salt for human or livestock consumption, fish salting, or auxiliary materials for food industry is iodized salt that has met Indonesian Industrial Standard (SSI)/Indonesian National Standard (SNI). According to SNI No. 3556 Year 2010, iodized salt for consumption is a foodstuff product which the main component is sodium chloride (NaCl) with the addition of potassium iodate (KIO3) of at least 30 mg/kg. However, recently the control of salt distribution in the market is still very weak or even absent. There is no penalty on the distribution of salt that does not meet SNI requirements in the market.

70
Improving Iodine Status of Children at Rural Area in West Java, Indonesia
The salt distribution in the market area of Bogor mostly comes from other regions. From about 11 salt industries in Bogor area, only one that was registered in Industry and Trade Office. In the FGD we held in November 2016, it was concluded that the governments, either the district or provincial governments, acknowledged the weakening of government’s concern to USI programs. As noted that in the mid-1990s, the government actively guided and supervised the salt producers.
The current development system allows a district/city to initiate a certain program. Local governments are given the necessary policy autonomy according to the local issues. Based on the above problems, just like the other areas (e.g. Pati District and East Lombok District), revitalization of USI program is required. The strategy required is an integrated approach from upstream (producer) to downstream (consumer). The steps we have done for it were:
I. Socialization of Study Results and Focus Group Discussion (FGD)Socialization and FGD activities were conducted on November 15,
2016 in Fave Hotel, Bogor City. The aim was to disseminate the results of this study to the relevant stakeholders, who then agreed on the alternative solutions that must be undertaken by local government of Bogor District. Discussion participants were from legislative (Regional House of People’s Representatives), executive (various related offices at the Bogor District of West Java Province), Food and Drug Administration, salt industry, national salt industry association, and non-governmental organizations.
The results of the socialization and FGD were all participants understood and agreed on the following matters:
a. The understanding on the negative impact of iodine deficiency disorder (IDD) on the decline in quality of human resources.
b. The understanding among stakeholders about the existing problems in the community related to low consumption of standardized iodized salt.
c. Realize the lack of supervision of salt for consumption on the market that mostly do not meet SNI requirements.

71
9. NUTRITION PROMOTION TO STAKEHOLDERS
d. Realize that there has been a decline in the process of fostering the salt industry by government.
e. Understand the need to revitalize USI program.
f. Agree that the key success factors for achieving and sustaining optimal iodine nutrition are: 1) Government’s commitment to USI, 2) Salt industry support, 3) Regular monitoring of iodine status, 4) Awareness of the consequences of iodine deficiency, 5) Recognition that USI program is compatible with the other health policies.
II. Advocacy Material DevelopmentThis activity was conducted through intensive discussion between
research team and the Micronutrient Initiative Indonesia (MII) organization experienced in assisting USI program in other region in Indonesia. This discussion was intended to prepare advocacy materials to be presented to stakeholders in Bogor District. Among the key points of the discussion results was the proposal concerning the formation of IDD Response Team (IDDRT) in Bogor District. This team is expected to reincrease the attention of local government on USI programs. Formation of this team refers to Regulation of Ministry of Home Affairs No. 63 Year 2010. Meanwhile, the IDDRT’s strategies in the implementation of the proposed activities are as follows:
1) Regulation of salt marketing in Bogor District, salt must be iodized according to SNI.
2) Guiding, monitoring and supervising the local salt industry/producers.
3) Providing education to people concerning “Village Free of Stupid Salt Movement” or non-iodized salt or sub-standard iodized salt.
III. Advocacy with Health Office of Bogor DistrictThe advocacy activity was conducted at the Health Office, i.e. the local
government institution responsible for iodine status improvement in the community. The research team was received by the Head of Health Office, Head of Health Service Division, Head of Family Welfare and Nutrition Section, and staffs of the Health Office. The research team presented the proposal regarding the background, study findings and alternative solutions for

72
Improving Iodine Status of Children at Rural Area in West Java, Indonesia
iodine status improvement in Bogor. One of the suggestions was to coordinate the technical activities of USI program through IDDRT. The discussion result obtained was that the Health Office did not recommend to form a new team (IDDRT) because it was feared not to run well due to too many teams formed in Bogor District. Therefore, the Health Office recommended that the activities in IDDRT be incorporated to the existing teams such as Healthy District Forum. However, the research team considered that the institution such as this “Healthy District Forum” was lack of sufficient authority and resources to implement the three strategies of USI program we suggested.
IV. Advocacy with Regional Development Planning, Research and Expansion Agency (RDPREA) of Bogor DistrictThe next advocacy implementation was to RDPREA, as an institution in
district level in charge of coordinating between Local Government Working Units (LGWUs)/agencies. As the legal basis, it is mentioned in Regulation of Minister of Home Affairs No. 63 Year 2010 that the head of IDDRT is Regional Development Planning Agency (RDPA).
Advocacy to RDPREA represented by the Head of Social Welfare Division began with the presentation of study results and proposal regarding IDDRT formation. The result was that RDPREA would perform internal coordination to discuss this proposal, and they would plan to conduct cross-sector coordination meeting.
V. Advocacy to various related offices in Bogor DistrictThis advocacy was facilitated by RDPREA by inviting relevant agencies
in Bogor District. The participants invited and attended were the Health Office, the Industry and Trade Office, the Education Office, the Village and Community Empowerment Office, the District Police Unit, the Investment and One Stop Integrated Service Office, and the Tohaga Market Regional Company. In addition, it was also attended by Head of People’s Welfare Division of the Regional Secretariat, RDPREA’s Head of Government and Development Funding Division, RDPREA’s Head of Facilities and Infrastructure Division, RDPREA’s Head of Economic Division, and RDPREA’s Head of Research and Development Division.

73
9. NUTRITION PROMOTION TO STAKEHOLDERS
Half-day working meeting on the Prevention of IDDs was conducted at RDPA office. The agenda discussed the possibility of IDDRT formation based on the input from related institutions.
The results of the meeting consisted of:
1) Industry and Trade Office of Bogor District would coordinate with Industry and Trade Office of West Java Province to discuss regarding the authority related to the supervision of iodized salt. Most of the salt in Bogor District comes from outside district. Based on Law No. 23 Year 2014 on the Distribution of Regional Government Affairs, it is stated that obligatory matters related to basic services – including the strategic foods located across district/city – is the authority of provincial instead of district government. Therefore, in relation to the circulation of salt as a strategic food, it is necessary to do coordination between the governments in the province and district.
2) The data on the coverage of iodized salt in households collected by Health Office of Bogor District should be informed to the Head of RDPREA, Industry and Commerce Office, as well as RDPREA’s Head of Economic Division. It is intended so that the data are not only static but also can be dynamic, which can be input for other agencies for their program implementation.
3) The commodity, i.e. salt for consumption, is included in basic-need and important commodity; thus, the supervision can be performed by Industry and Trade Office of Bogor District and West Java Province.
4) The responsible party for the plan of next IDDRT formation is from the RDPREA’s Head of Economic Division. It is considered more appropriate than the RDPREA’s Head of Social Welfare, because the problems are more commonly found in the supply side (salt production/distribution). For the next meeting, each agency will carry out internal coordination, including the certainty about the authority distribution in the supervision of salt circulation.

74
Improving Iodine Status of Children at Rural Area in West Java, Indonesia
9.3 Sustainability of The ProgramIntervention of the nutritional education for the students, mothers, and
teachers have an important and potential effect in changing the knowledge, attitude and practice of nutrition especially related to iodine among students, mothers, and teachers in order to improve the iodine and nutritional status of students. Mothers hold a crucial role in improving their children’s nutritional status. Teachers also hold a crucial role because students also listen to what their teacher said to them. In fact, the food patterns of the students depend on the capability of the mothers and also the teachers to transfer their nutritional knowledge into their attitude and good eating practice at home as well as at school.
The involvement of institutions responsible in production and distribution of iodized salt will further empower all stakeholders so that awareness on the quality of iodized salt that meets the requirement become important goal that need to be achieved. Therefore, at the end of the last advocation meeting, Regional Development Planning, Research and Expansion Agency (RDPREA) suggested there will be next meeting after they meet with the provincial government. The RDPREA asked the research team to participate in the monitoring of iodized salt in Bogor District, despite there will be an IDD team or not. The role of the research team is as consultant.

10
CONCLUSIONS AND RECOMMENDATIONS
10.1. Conclusions1. Most of salts sold by traders (75.0%) had an iodine content <30 ppm,
while the rest of salt sold by traders (25%) had sufficient iodine content (30-80 ppm). Most of households (78.8%) consumed salt with iodine content <30 ppm, 20.1% of households consumed salt with sufficient iodine content based on SNI (30-80 ppm), and a few households (1.1 %) consumed salt with iodine content more than SNI recommendation (>80 ppm).
2. The root problems of unstandardized iodized salt circulated in markets were lack of monitoring and supervision on the salt for consumption. Most of salt circulated in the market were produced by home industry. Although there is regulation that iodized salt must meet the SNI requirement and be registered in the National Agency of Drug and Food Control, there is no punishment for those who produce and sell unstandardized iodized salt.
3. Before nutrition education, the majority of students had poor nutrition knowledge and attitude and moderate nutrition practice. The majority of mothers had poor nutrition knowledge and practice and moderate nutrition attitude. The teachers’ nutrition knowledge, attitudes, and practices had been relatively good.
4. The children’s average intake of iodine was not adequate (less than 77% of RDA). The average intakes of energy, carbohydrate and fat were adequate (almost or more than 90% of RDA). However, the average
76
Improving Iodine Status of Children at Rural Area in West Java, Indonesia
protein intake was below the adequacy level (less than 90% of RDA). The average intake of minerals (calcium, phosphorus, and iron), vitamin B1 and vitamin C among these children was also inadequate (less than 77% of RDA). On the other hand, the average intake of vitamin A was adequate.
5. Independent t-test comparing the increase in students’ nutrition knowledge score of the control group versus the intervention group showed a very significant difference (p<0.01) and also for students’ nutrition attitude (p<005). It meant that intervention activities conducted in the form of nutrition education had succeeded in increasing nutrition knowledge and attitude of the elementary students. However, independent t-test showed no significant difference (p>0.05) in the increase of students’ nutrition practice scores in the control group and the intervention group.
Independent t-test showed that changes in baseline-endline mothers’ nutrition knowledge and attitude scores in the intervention group were significantly much higher (p<0.01) than the control group. However, independent t-test showed that the changes in nutrition practice score in the control group were not significantly different (p>0.05) from the changes in nutrition practice score in the intervention group.
Independent t-test showed that changes in teachers’ nutrition knowledge scores in the intervention group were significantly higher (p<0.01) than the ones in the control group but not significant in nutrition attitudes and practices (p>0.05).
After the intervention, in the form of 2-month public education, there were changes in median values of urinary iodine of on spot urine collection. In the control group, there was a slight decrease in median value of UIC to 191 µg/l although this number (-0.6 µg/l) was not significant (p>0.05). Meanwhile, in the intervention group the UIC increased to 184 µg/l after the intervention. Eventhough there was an increase of 7.6 µg/l, but it was not significant (p>0.05).
After the intervention, there was an increase in UIC at 24-hour urine collection, either in the control group or the intervention group; i.e. 3.9 µg/l and 15.7 µg/l, respectively. There was no significant difference in the increase in UICs between the two groups (p>0.05). And according to independent t-test, there was not significant difference between the UIC of on-spot urine and 24-hour urine (p>0.05).

77
10. CONCLUSIONS AND RECOMMENDATIONS
10.2. RecommendationsIn this study, we found that the root problem of the unstandardized
iodized salt circulated in the market is lack of monitoring and supervision from the government. Therefore, Industrial and Trade Office should increase monitoring and supervision to the salt industry and salt trader. There also should be a severe sanction for those who still produce or sell unstandardized iodized salt. It is better if this office also work together with other related offices, such as Health Office, the District Police Unit, and Regional Development Planning, Research and Expansion Agency (RDPREA) and form an IDD team.
We also found that with nutrition education, the nutrition knowledge and attitude of children and mothers significantly increase but not the nutrition practice. Teachers have opportunity to deliver nutrition education through various courses (e.g. biology, science, and sport).


11
BIBLIOGRAPHY
Amalia L, Riyadi H, Herawati T, Tiurmauly V. 2012. Iodine Deficiency Disorders among Children in Different Agroecological Zones: Study on Food Availability, Food Consumption, Socio-cultural Aspects, and Academic Achievement. Bogor: Bogor Agricultural University
Andersson M, Karumbunathan V, Zimmermann MB. 2012. Global Iodine Status in 2011 and Trends over the Past Decade. J Nutr. 142 : 744–750.
Aritonang E and Evinaria. 2005. Food Consumption Pattern, Its Relation with Nutritional Status and Academic Performance among Elementary School Children in IDD Endemic Area Kuta Dame Village, Kerajaan Sub-district, Dairi District, North Sumatera Province (Pola Konsumsi Pangan, Hubungannya dengan Status Gizi dan Prestasi Belajar pada Pelajar SD di Daerah Endemik GAKI Desa Kuta Dame Kecamatan Kerajaan Kabupaten Dairi Propinsi Sumatera Utara). USU Digital Library. Available at: http://library.usu.ac.id/download/fkm/fkmgizi-evawany2.pdf [August 24, 2017].
Bath S and Rayman M. 2016. Food Fact Sheet: Iodine. UK: British Dietetic Association. Available at: www.bda.uk.com/foodfacts.
Budiman B and Sumarno I. 2007. The relations between iodine consumption and goiter on students 15-17 years old (Hubungan antara konsumsi iodium dan gondok pada siswi berusia 15-17 tahun). Universa Medicina 26(2):80-89.

80
Improving Iodine Status of Children at Rural Area in West Java, Indonesia
[BPS] Central Bureau of Statistics. 2016a. Bogor District in Figures 2016 (Kabupaten Bogor dalam Angka 2016). ISSN: 0215-4250. Bogor: BPS Kabupaten Bogor.
[BPS] Central Bureau of Statistics. 2016b. Community Welfare Statistics of Bogor District 2016 (Statistik Kesejahteraan Rakyat Kabupaten Bogor 2016). Bogor: BPS Kabupaten Bogor.
Delange F. 1994. The Disorders Induced by Iodine Deficiency. Thyroid 4(1):107-128.
De Vriendt T, Mattys C, Verbeke W, Pynaert I, De Henauw S. 2009. Determinants of nutrition knowledge in young and middle-aged Belgian women and the association with their dietary behavior. Appetite 52 (2009) 788–792. doi:10.1016/j.appet.2009.02.014.
[FAO/IFAD/WFP] Food and Agriculture Organization, International Fund for Agricultural Development, World Food Programme. 2014. The State of Food Insecurity in the World 2014: Strengthening the enabling environment for food security and nutrition. Rome: Food and Agriculture Organization.
Gibson RS. 2005. Principles of Nutritional Assessment. Second edition. New York : Oxford University Press.
Haitami. 2015. Iodine Content in Table Salt in Batuah Market, Martapura in March 2014 (Kandungan Iodium Pada Garam Dapur di Pasar Batuah Martapura Maret 2014). Medical Laboratory Technology Journal, vol 1(1):14-18.
Harahap H. 2004. Masalah Gizi Mikro Utama dan Tumbuh Kembang Anak Di Indonesia (Main Micronutrient Problems and Children Growth and Development in Indonesia). Makalah Pribadi Falsafah Sains. Sekolah Pasca Sarjana. Institut Pertanian Bogor.
[SNI] Indonesian National Standard. 2010. Iodized Salt for Consumption No. 3556:2010. Jakarta: National Standardization Agency of Indonesia.
Kapantow AN, Fatimawali, Yudistira A. 2013. Identification and Stipulation of Potassium Iodate in Table Salt Circulating in Bitung City Market with UV-Vis Specthrophotometric Method (Identifikasi dan Penetapan Kalium Iodat dalam Garam Dapur yang Beredar di Pasar Kota Bitung dengan Metode Spektrofotometri UV-Vis). Manado: FMIPA UNSRAT.

81
11. BIBLIOGRAPHY
Kartono Dj, Atmarita, Jahari AB, Soekirman, Izwardy D. 2016. The situation of urinary iodine concentration (UIC) among school age children, women at reproducitive age and pregnant women in Indonesia: the analysis of Riskesdas 2013. Gizi Indon. 39(1) : 49–58.
Kulie T, Slattengren A, Redmer J, Counts H, Eglash A, Schrager S. 2011. Obesity and women’s health: An Evidence-based review. J Am Board Fam Med 2011;24:75-85. doi:10.3122/jabfm.2011.01.100076.
Law No. 20 Year 2003 Article 17 about National Education System (Sistem Pendidikan Nasional).http://pendis.kemenag.go.id/file/dokumen/uuno20th2003ttgsisdiknas.pdf.
Law No. 23 Year 2014 on Distribution of Regional Government Affairs. Jakarta: Ministry of Justice and Human Rights.
Liberona Y, Castillo O, Engler V, Villarroel L, and Rozowski J. 2010. Nutritional profile of schoolchildren from different socio-economic levels in Santiago, Chile. Public Health Nutrition: 14(1), 142–149. doi:10.1017/S1368980010001540
Madanijah S, Hirmawan AB. 2007. The Socio-economic Factors of Family in Relation to Goiter among Elementary School Students (Faktor-Faktor Sosial Ekonomi Keluarga yang Berhubungan dengan Kejadian Gondok pada Murid SD). Jurnal Gizi dan Pangan, Maret 2007 2(1): 47-55.
McIntyre L, Glanville NT, Raine KD, Dayle JB, Anderson B, and Battaglia N. 2003. Do low-income lone mothers compromise their nutrition to feed their children? Canadian Medical Association Journal, Mar 2003; 168 (6):686-691.
[MoH] Ministry of Health of Indonesia. 2009.. Health Profile of Indonesia in 2009 (Profil Kesehatan Indonesia Tahun 2009). Jakarta: Ministry of Health of Indonesia. http://www.depkes.go.id/resources/download/pusdatin/profil-kesehatan-Indonesia/ profil-kesehatan-indonesia-2009.pdf
[MoH] Ministry of Health of Indonesia. 2013a. Result of 2013 Basic Health Reseach (Riset Kesehatan Dasar 2013). Jakarta: National Institute of Health Research and Development (Badan Penelitian dan Pengembangan Kesehatan).

82
Improving Iodine Status of Children at Rural Area in West Java, Indonesia
[MoH] Ministry of Health Republic of Indonesia. 2013b. Regulation of Minister of Health Republic of Indonesia No. 75 Year 2013 on Recommended Dietary Allowance for Indonesian People (Peraturan Menteri Kesehatan Republik Indonesia Nomor 75 Tahun 2013 Tentang Angka Kecukupan Gizi Yang Dianjurkan Bagi Bangsa Indonesia). Jakarta: Ministry of Health Republic of Indonesia. Available at: http://gizi.depkes.go.id/download/Kebijakan%20Gizi/Tabel%20AKG.pdf [August 28, 2017].
[MoH] Ministry of Health. 2014. Health Profile of Indonesia in 2013 (Profil Kesehatan Indonesia Tahun 2013). Jakarta: Ministry of Health of Indonesia. http://www.depkes.go.id/resources/download/pusdatin/profil-kesehatan-indonesia/profil-kesehatan-indonesia-2013.pdf.
Mutalazimah and Asyanti S. 2009. Status Yodium dan Fungsi Kognitif Anak Sekolah Dasar di SDN Kiyaran I Kecamatan angkringan Kabupaten Sleman.Jurnal Penelitian Sains & Teknologi, Vol. 10, No. 1, 2009: 50 – 60.
[Bappenas] National Development Planning Agency. 2004. Natinal Action Plan, Sustainability of Alleviation IDD Program (Rencana Aksi Nasional, Kesinambungan Program Penanggulangan Gaky). RAN KPP GAKY-21 Oktober 2004. Jakarta.
[BKKBN] National Population and Family Planning Board. 2010. The maturation of marriage age and reproductive rights of adolescents (Pendewasaan usia perkawinan dan hak-hak reproduksi remaja). Jakarta.
Notoatmodjo S. 2003. Public Health Science (Ilmu Kesehatan Masyarakat). Jakarta: Rineka Cipta.
Saputri L, Moesijanti. 2006. Description of the iodized-salt’s characteristics, storage, place for purchasing salt, and amount of consumption in poor families in Kalideres Sub-district, West Jakarta (Gambaran karakteristik garam beriodium, penyimpanan, tempat membeli garam, dan jumlah konsumsi pada keluarga miskin di Kecamatan Kalideres, Jakarta Barat). Gizi Indon. 1.
Sherwood L. 2010. Human Physiology: From Cells to Systems. Belmont, USA: Brooks/Cole, Cengage Learning.

83
11. BIBLIOGRAPHY
Singh R, Rita SR. 2014. Effect of household practices on iodine content of iodized salt. Asian J of Home Science. 9(2): 481-483. Doi: 10.15740/HAS/AJHS/9.2/481-483.
Suhardjo. 1989. Various Ways of Nutrition Education (Berbagai Cara Pendidikan Gizi). Petunjuk Laboratorium Pusat Antar Universitas Pangan dan Gizi. Bogor: PAU-IPB.
Suhardjo. 1996. Food and Nutrition Planning (Perencanaan Pangan dan Gizi). Jakarta: Bumi Aksara.
Picauly I and Toy SM. The Determinant Analysis and the Impact of Stunting for School Children School Performance in Kupang and Sumba Timur, West Nusa Tenggara (Analisis Determinan dan Pengaruh Stunting terhadap Prestasi Belajar Anak Sekolah di Kupang Dan Sumba Timur, NTT). Jurnal Gizi dan Pangan, Maret 2013, 8(1): 55—62.
Presidential Decree No. 69 Year 1994 on the Procurement of Iodized Salt. Jakarta: Bureau of Law and Legislation.
Rasidi A. 2008. The relations between mother’s knowledge related iodized salt and the availability of salt on household level at Krajan Village Tembarak Subdistrict Temanggung District (Hubungan tingkat pengetahuan ibu tentang garam beryodium dengan ketersediaan garam pada tingkat rumahtang ga di desa Krajan Kecamatan Tembarak Kabupaten Temanggung). JKP 1(2):67-79.
Regulation of the Minister of Home Affairs No. 63 Year 2010 on Guidelines for the Control of Iodine Deficiency Disorders in the Region. Jakarta: Ministry of Home Affairs.
Rizqiawan A. 2015. The Correlation of Goitrogenic Substance and Iodine Sources Food Consumption Patterns with Iodine Status and Stunting among Elementary Students in Kroya Subdistrict, Cilacap District (Hubungan Pola Konsumsi Pangan Sumber Iodium dan Zat Goitrogenik dengan Status Iodium dan Stunting pada Siswa SD di Kecamatan Kroya Kabupaten Cilacap) [skripsi]. Bogor: Departemen Gizi Masyarakat, Fakultas Ekologi Manusia, Institut Pertanian Bogor.
Rolfes SR, Pinna K, and Whitney E. 2009. Understanding Normal and Clinical Nutrition. Belmont, USA: Wadsworth, Cengage Learning.

84
Improving Iodine Status of Children at Rural Area in West Java, Indonesia
Widmaier EP, Raff H, and Strang KT. 2008. Vander’s Human Physiology: The Mechanisms of Body Function. Eleventh Edition. New York, USA: McGraw Hill Higher Education.
WHO/UNICEF/ICCIDD. 1999. Progress towards the elimination of Iodine Deficiency Disorders (IDD). Geneva: WHO.
[WHO] World Health Organization. 2007. Assessment of iodine deficiency disorders and monitoring their elimination : a guide for programme managers. – 3rd ed. Geneva: WHO Press.
[WHO] World Health Organization. 2001. Assessment of IDD and monitoring their elimination. 2nd edition. WHO. Geneva.
Zimmermann MB. 2003. Assessing Iodine Status and Monitoring Progress of Iodized Salt Programs. Laboratory for Human Nutrition, Institute for Food Science and Nutrition. Swiss Federal Instititute of Tecnology Zurich. CH 8803 Ruschlikon. Switzerland.
Zimmermann MB. 2007. Key Barriers to Global Iodine Deficiency Disorder Control: A Summsry. Human Nutrition Laboratory, Swiss Federal Institute of Technology Zürich (ETHZ).

85
Improving Iodine Status of Children at Rural Area in West Java, Indonesia
APPENDICES
Figure 2. Interviewing the mothers of school children

86
Improving Iodine Status of Children at Rural Area in West Java, Indonesia
Figure 3. Anthropometry measurement
Figure 4. Nutrition education

87
Improving Iodine Status of Children at Rural Area in West Java, Indonesia
Figure 5. Iodized salt factories visitation
Figure 6. Focus Group Discussion

88
Improving Iodine Status of Children at Rural Area in West Java, Indonesia
Figure 7. Half day seminar
Figure 8. Advocation at Health Office of Bogor District

ABOUT AUTHORS
Name : Leily Amalia, STP, MSi (deceased)
Place/Date of Birth : Tasikmalaya, December 9th, 1972
Education : Master of Science in Community Nutrition, Bogor Agricultural University, 2001
Office : Dept. of Community Nutrition, IPB
Name : dr. Karina R Ekawidyani, MGizi
Place/Date of Birth : Bogor, December 10th 1986
Education : - Medical Doctor, University of Indonesia, 2010
- Master of Science in Community Nutrition,
University of Indonesia, 2012
Office : Dept. of Community Nutrition, IPB
Email : [email protected]

90
Improving Iodine Status of Children at Rural Area in West Java, Indonesia
Name : Prof. Ali Khomsan
Place/Date of Birth : Ambarawa, February 2nd 1960
Education : PhD in Home Economics Education, Iowa State University, USA, 1991
Office : Dept. of Community Nutrition, IPB
Email : [email protected]
Name : Prof. Dodik Briawan
Place/Date of Birth : Trenggalek, 1st July 1966
Education : PhD in Community Nutrition, Bogor Agricultural University, 2008
Office : Dept. of Community Nutrition, IPB
Email : [email protected]