improving construction processes by …improving construction processes by integrating lean, green,...
TRANSCRIPT

IMPROVING CONSTRUCTION PROCESSES BY INTEGRATING LEAN, GREEN, AND SIX-SIGMA
by
Abdulaziz Ali Banawi
Bachelor of Science, King Abdulaziz University, Saudi Arabia, 2003
Master of Science, Florida Institute of Technology, USA, 2008
Submitted to the Graduate Faculty of
Swanson School of Engineering in partial fulfillment
of the requirements for the degree of
Doctor of Philosophy
University of Pittsburgh
2013

ii
UNIVERSITY OF PITTSBURGH
SWANSON SCHOOL OF ENGINEERING
This dissertation was presented
by
Abdulaziz Ali Banawi
It was defended on
March 20, 2013
and approved by
Vikas Khanna, PhD, Assistant Professor, Civil and Environmental Engineering Department
Jeen-Shang Lin, PhD, Associate Professor, Civil and Environmental Engineering Department
Natasa Vidic, PhD, Assistant Professor, Industrial Engineering Department
Joseph Beck, P.E., Adjunct Professor, Civil and Environmental Engineering Department
Dissertation Director: Melissa Bilec, PhD, Assistant Professor, Civil and Environmental
Engineering Department

iii
Copyright © by Abdulaziz Ali Banawi
2013

iv
The overall goal of this research was to develop and implement methods to improve the
performance and the efficiency of construction processes prior to and during the construction
phase in Design-Bid-Build (DBB) projects. In order to accomplish these goals, the three methods
Lean, Green, and Six-Sigma were implemented in two different scenarios and validated by case
studies.
First, a framework was developed that integrated the three methods - Lean, Green, and
Six-Sigma with an overall layout of the Define, Measure, Analyze, Improve, and Control
(DMAIC) improvement model. The framework was then validated through the construction
process of installation of pile caps for an educational institute during the construction phase in
Pittsburgh. The framework highlighted two issues with the pile caps construction process. First,
disparate quantities of materials (purchased and installed) were determined. Second, the pile caps
construction process took a total time of 54 business days while it could have been completed in
30 business days. Using life cycle assessment, environmental impacts of the pile cap
construction process were analyzed and results showed that major environmental impacts
including global warming potential, release of carcinogenics, negative respiratory effects, ozone
depletion, and ecotoxcity could result from the materials used for the process. Next, the root
causes behind waste generation were determined via developing and administrating a
questionnaire to a local construction company.
IMPROVING CONSTRUCTION PROCESSES BY INTEGRATING LEAN, GREEN
AND SIX-SIGMA
Abdulaziz Ali Banawi, PhD
University of Pittsburgh, 2013

v
Second, the previously developed framework was further validated and applied to a
residential development project in Saudi Arabia. The construction sector has been growing
rapidly in Saudi Arabia; however, the quality of Saudi Arabian construction is decreasing,
resulting in excess waste generation and associated environmental impacts. This case study
examined a project with 53 residential units overall but only 10 units acceptable at final
inspection. The largest quality issue was determined to be exterior paint blistering. Using the
developed framework, defective units were investigated through a field examination, narrowing
down the causes of the blistering applying the Pareto method as follows: Inadequate method,
untrained workers, weather, and others. Next, the Process improvement tool was applied to
reduce the blistering causes and to improve the current process. A new method was designed
and applied to a separate residential unit for validation. The modified method showed a great
improvement and in the end the unit was able to pass inspection.
Finally, building on the previous case studies, the framework was later refined with the
goal of applying it earlier in a project, prior to construction, to further reduce potential waste
generation and associated environmental impacts. Using Lean Green, and Six-Sigma (LG6) and
adopting the same improvement model, DMAIC, the owner can evaluate all steps separately in
the process, addressing all resources consumed and analyzing environmental impacts which
might be generated; this highlights potential waste and so can help the owner avoid waste
occurrence by indicating where the process needs to be amended to create less environmental
impact and more efficiency. For this research, the model was used to help evaluate the
construction process for the installation of 160 woodpiles. The model identified that four steps
out of eight were considered as non-adding value steps or waste. Three steps out of four non-
adding value steps were involved with mobilization and demobilization of the equipment. The

vi
remaining wasteful step was cutting to length all installed woodpiles. The model showed that if
these steps were replaced, eliminated or planned well, environmental impacts would be reduced
by 9%.

vii
TABLE OF CONTENTS
PREFACE ................................................................................................................................... XV
1.0 INTRODUCTION ........................................................................................................ 1
1.1 WHY LEAN, GREEN, AND SIX-SIGMA?.............................................................. 2
1.2 RESEARCH GOALS AND OBJECTIVES .............................................................. 2
1.3 INTELLECTUAL MERIT ......................................................................................... 5
1.4 BROADER IMPACT .................................................................................................. 6
2.0 BACKGROUND AND LITERATURE REVIEW .................................................... 7
2.1 LEAN DEFINES WASTE IN PROCESS ................................................................. 8
2.1.1 Value Stream Map (VSM) ............................................................................... 9
2.1.2 Applying Lean to Construction .................................................................... 10
2.2 GREEN REDUCES ENVIRONMENTAL IMPACT ............................................ 11
2.2.1 Life Cycle Assessment (LCA) ........................................................................ 12
2.2.2 Life Cycle Assessment addresses the environmental impact of on-site construction activities ................................................................................................ 13
2.3 SIX-SIGMA HELPS IMPROVE PROCESS PERFORMANCE ......................... 14
2.3.1 Cause and Effect Diagram............................................................................. 16
2.3.2 Pareto Chart ................................................................................................... 17
2.3.3 Process Improvement..................................................................................... 17
2.4 APPLYING SIX-SIGMA TO CONSTRUCTION ................................................. 18

viii
2.5 OUTLINE OF DISSERTATION ............................................................................. 21
3.0 A FRAMEWORK TO IMPROVE CONSTRUCTION PROCESSES: INTEGRATING LEAN, GREEN, AND SIX-SIGMA ............................................................ 22
3.1 ABSTRACT ............................................................................................................... 23
3.2 INTRODUCTION ..................................................................................................... 24
3.3 FRAMEWORK ......................................................................................................... 25
3.4 METHOD ................................................................................................................... 26
3.4.1 Case Study ...................................................................................................... 26
3.5 RESULTS AND DISCUSSION ................................................................................ 28
3.6 CONCLUSIONS AND FUTURE WORK ............................................................... 36
4.0 APPLYING THE LEAN, GREEN, AND SIX-SIGMA FRAMEWORK TO IMPROVE AN EXTERIOR CONSTRUCTION PROCESS IN SAUDI ARABIA ............. 38
4.1 ABSTRACT ............................................................................................................... 39
4.2 INTRODUCTION ..................................................................................................... 40
4.3 METHODOLOGY .................................................................................................... 41
4.3.1 Case Study ...................................................................................................... 42
4.4 RESULTS AND DISCUSSION ................................................................................ 43
4.5 CONCLUSION .......................................................................................................... 53
5.0 A MODEL COMBINING THE THREE METHODS LEAN, GREEN, AND SIX-SIGMA (LG6) TO IDENTIFY WASTE IN CONSTRUCTION PROCESSES PRIOR TO CONSTRUCTION PHASE ....................................................................................................... 55
5.1 ABSTRACT ............................................................................................................... 55
5.2 INTRODUCTION ..................................................................................................... 57
5.3 RESEARCH METHODOLOGY ............................................................................. 60
5.3.1 Lean Green Six-sigma (LG6) Model ............................................................ 60
5.3.1.1 Define.................................................................................................... 60

ix
5.3.1.2 Measure ................................................................................................ 61
5.3.1.3 Analyze ................................................................................................. 61
5.3.1.4 Improve ................................................................................................ 62
5.3.1.5 Control ................................................................................................. 62
5.3.2 Case Study ...................................................................................................... 64
5.4 RESEARCH FINDINGS AND RESULTS: ............................................................ 64
5.4.1 Define (D) ........................................................................................................ 64
5.4.2 Measure (M) ................................................................................................... 65
5.4.3 Analyze (A) ..................................................................................................... 68
5.4.4 Improve (I) ...................................................................................................... 69
5.4.5 Control (C) ...................................................................................................... 70
5.5 CONCLUSION .......................................................................................................... 73
6.0 CONCLUSION ........................................................................................................... 75
6.1 SUMMARY ................................................................................................................ 75
6.2 RECOMMENDATIONS FOR FUTURE WORK ................................................. 77
7.0 ACKNOWLEDGEMENTS ....................................................................................... 79
APPENDIX A .............................................................................................................................. 80
APPENDIX B .............................................................................................................................. 83
APPENDIX C .............................................................................................................................. 93
APPENDIX D ............................................................................................................................ 100
BIBLIOGRAPHY ..................................................................................................................... 104

x
LIST OF TABLES
Table 1 Examples of tools and methods used in Define, Measure, Analyze, Improve, and Control....................................................................................................................................................... 16
Table 2 Life cycle inventory, data sources and remarks for the pile cap process ......................... 30
Table 3 Life cycle inventory, data sources and remarks for exterior painting process ................ 46
Table 4 Life cycle environmental impacts and time duration of the original painting process, modified process and rejected process .......................................................................................... 52
Table 5 Define phase explains start dates, process steps and units for the woodpile installation process........................................................................................................................................... 65
Table 6 Measure phase explains consumed resources for the woodpile installation process, including materials, equipment, and workers ............................................................................... 67
Table 7 Analyze phase highlights value-added and non value-added steps and addresses environmental impact of the woodpile installation process. ......................................................... 69
Table 8 Improve phase discusses alternatives to the process with less environmental impact and better economic returns for the woodpile installation process ...................................................... 70
Table 9 Control phase explains the current performance level according to the Six-Sigma scale for the installation of the woodpile process .................................................................................. 71
Table 10 QCI Process Analysis - Results for the woodpile installation process - Quality, Costs & Impacts .......................................................................................................................................... 72

xi
LIST OF FIGURES
Figure 1 Project Phases in Design-Bid- Build Contract and Research Objectives 1, 2, and 3 ....... 4
Figure 2 Literature review and research contribution ................................................................... 20
Figure 3 Lean, Green, Six-Sigma framework ............................................................................... 26
Figure 4 Value Stream Mapping (VSM) of the pile caps process. ............................................... 28
Figure 5 Life cycle environmental impacts of the pile cap process using the Tool for the Reduction and Assessment of Chemical and other environmental Impacts (TRACI). ................ 31
Figure 6 Cause and Effect Diagram: Common factors causing waste in the pile cap process ..... 33
Figure 7 Pareto Chart: Factors that generate most waste according to questionnaire for the pile cap process .................................................................................................................................... 34
Figure 8 Photos highlighting exterior quality issues .................................................................... 43
Figure 9 Value Stream Map (VSM) of case study exterior painting process ............................... 44
Figure 10 Life cycle environmental impacts for the original exterior painting process ............... 47
Figure 11 Life cycle environmental impacts for materials consumed for the exterior painting process........................................................................................................................................... 48
Figure 12 Pareto chart with factors that generate waste as identified by the field investigation of 53 units for the exterior painting process. ..................................................................................... 49
Figure 13 Modified Value Stream Map (VSM) for the exterior painting process........................ 51
Figure 14 Examples of the modified painting process outcomes ................................................. 51
Figure 15 Outline, LG6 model ...................................................................................................... 63

xii
NOMENCLATURE
A/E Architecture Engineering firm
ACT. Actual
C&D Construction and Demolition
CT Cycle Time
DBB Design – Bid – Build
DB Design – Build
DMAIC Define, Measure, Analyze, Improve, Control
DOE Design of Experiments
DPMO Defect Per Million Opportunities
Eq Equivalent
EST. Estimated
FMEA Failure Mode and Effects Analysis
GDP Gross Domestic Product
GW Global Warming
LCA Life Cycle Assessment
LCI Life Cycle Inventory
LCIA Life Cycle Impact Assessment
LEED Leadership in Energy and Environmental Design

xiii
NOMENCLATURE (CONT’D)
LG6 Lean, Green, Six-Sigma
MO Modified Process
MSA Measurement System Analysis
MCSI Mascaro Centre for Sustainable Innovation
MYAS Madinat Yanbu Al Sinaiyah
NVA/T Non Value Added Time
OP Original Process
PM Particulate Matter
QCI Quality, Cost, and Impacts
RCIY Royal Commission for Industrial Yanbu
RP Rejected Process
TIP Total Industry Productivity
TQM Total Quality Management
TRACI Tool for the Reduction and Assessment of Chemical and other
environmental Impacts
US United States
USGBC U. S. Green Building Council
USLCI US Life Cycle Inventory

xiv
NOMENCLATURE (CONT’D)
VSM Value Stream Mapping
WIP Work In Process
VA/T Value Added Time

xv
PREFACE
I am extremely thankful for the help of my dissertation advisor, Dr. Melissa M. Bilec, who has
been with me throughout these years as mentor, colleague, editor, and friend. Also I extend
special thanks to my dissertation committee for their useful suggestions and guidance throughout
my work.
I would to thank my colleagues and friends for their help and endless support during my
study.
Finally, I owe my greatest debt to my family. I thank my parents for life and strength and
the determination to live fully. Warm thanks to my kids Lana and Yazn, whom remind me daily
that miracles exist everywhere around us. Most of all, I thank my beloved wife, Heba, who
shares my burdens and my joys.
To all
Thank You.
1
1.0 INTRODUCTION
The construction industry contributed over $639 billion to the United States' Gross Domestic
Product (GDP) in 2009 (U.S. Department of Commerce 2010). Moreover, the U.S. has over nine
million workers employed in the construction industry (U.S. Census Bureau 2010). In Saudi
Arabia, the construction sector represented 6.4% of the total country’s GDP in 2010 (Saudi
National Commercial Bnak 2011). In Qatar, the total investment in the construction sector is
forecasted to be USD 225 million in total by the end of 2020 (The Commercial Bank of Qatar
Q.S.C. 2012). As the construction industry produces an abundance of waste and consumes vast
quantities of resources and energy, this increase in construction is troubling. In Saudi Arabia,
for example, the demand for cement reached about 36.7 million tons, one third of US cement
consumption in 2008 (Saudi National Commercial Bnak 2011; Portland Cement Association
2012). In the United States, 136 million tons of the solid waste entering landfills, constituting
roughly one-third of all the solid waste, is from the construction sector (U.S. Environmental
Protection Agency 2003). In addition, money, time, and resources are also wasted as a result of
inefficient or poorly managed construction projects. Improving the efficiency and management
of construction projects, then, can result in savings related to resources, energy, and cost.
While previous construction related studies have focused on the reduction of waste,
increase of productivity, or minimization of environmental impacts, to date, limited research has
been done to combine all three efforts. This research integrates three methods: lean to reduce

2
waste, green to lower the environmental impact, and Six-Sigma to improve quality and
productivity, in the belief that all three methods together could help minimize all of the above-
mentioned impacts generated by construction activities.
1.1 WHY LEAN, GREEN, AND SIX-SIGMA?
The three methods Lean, Green, and Six-Sigma are complementary; therefore, use of all three
would allow more comprehensive analysis of waste and impacts. Lean is valued for its ability to
identify waste in the process. For example, Lean does not quantify environmental consequences;
therefore, for this research, the aim was to consider ‘greening’ via life cycle assessment to fill
this gap and evaluate the environmental impacts of the generated waste. However, while
together, Lean and green have the ability to identify waste and evaluate environmental impact,
they often do not suggest an actual method to reduce waste. Six-Sigma has the potential to fill
this gap.
1.2 RESEARCH GOALS AND OBJECTIVES
The overall goals of this research are to develop and find ways to improve the environmental
performance and to enhance the efficiency of the construction processes during and prior to the
construction phase. To accomplish these goals, this research applied three methods: Lean, Green,
and Six-Sigma, in a systematic approach following the five phase improvement model: Define,
Measure, Analyze, Improve, Control (DMAIC). The specific objectives were:

3
1) To develop a systematic framework intended for use in the construction phase that
integrates Lean, Green, and Six-Sigma methods in order to improve the environmental
performance of the construction process during the construction phase.
2) To validate the framework by implementing it during the construction phase during a
project in the Kingdom of Saudi Arabia.
3) To create a quality model applying a form of DMAIC that integrates Lean, Green, and
Six-Sigma (LG6) intended for pre-construction phases that can help contractors plan and
implement construction projects in an efficient manner. This involves using the
developed LG6 model to identify potential sources of waste early in the process, i.e.,
prior to the construction phase.
The research objectives were developed to be implemented on Design-Bid-Build
type of projects, where the contractor is not involved in the design phase (see Figure 1).

4
Figu
re 1
Pro
ject
Pha
ses i
n D
esig
n-B
id- B
uild
Con
trac
t and
Res
earc
h O
bjec
tives
1, 2
, and
3

5
1.3 INTELLECTUAL MERIT
This study has beneficial intellectual merit for several reasons: it will provide a better
understanding of how construction activities can have negative environmental impacts if not
planned well. This research will increase the awareness of identifying waste in construction
processes so that it can be prevented or eliminated. The study’s findings will encourage
contractors to establish new construction methods or choose materials that are environmentally
friendly. The methods developed here could help contractors who seek to have their projects
LEED certified. For instance, the LG6 quality model helps contractors devise different options
to be implemented including; equipment with lower emissions, materials with lower impacts and
methods with less acquisition of resources. The investigator of this research study has the proper
knowledge and experience to execute these tasks.
Currently, there is no study that has combined all three methods, Lean, Green, and Six-
Sigma to develop improvement tool that would help enhance the environmental performance of
the construction processes during or prior to construction phase. The novelty in the work is
combing these methods into a common system and using this system in an untapped sector.

6
1.4 BROADER IMPACT
This study has a broader impact on the community for several reasons. First, it teaches college
students novel methods to improve the quality of any type of job processes. Second, it involves
collaboration between the educational sector and the construction industry – a sector that
contributed substantially to U.S. GDP and is among major consumers of natural resources, as
reported by the U.S. Environmental Protection Agency in 2009. Also, this research helps to
enhance the knowledge of construction workers by introducing them to several concepts such as
waste definition, types, environmental consequences, and importance of quality. In addition, this
research encourages the environmental impacts to be included in change orders. Enabled by the
findings of this research, both parties can cooperate for ideal practice; projects to be completed
with the optimal use of natural resources with minimal environmental impact.

7
2.0 BACKGROUND AND LITERATURE REVIEW
The nature of the construction industry is complex. Construction projects need to be expertly
managed in terms of considering not only budgets and schedules, but also quality and
environmental impacts (Howell and Ballard 1998; Formoso, Soibelman et al. 2002). Lean,
Green, and Six-Sigma are different methods that are already often used independently to address
quality, waste, and environmental impacts in construction.
Previous studies have addressed improving the quality of construction processes and
strategies for the reduction of construction waste (Bossink and Brouwers 1996; Chase 1998;
Ekanayake and Ofori 2000; Love, Edwards et al. 2009). For example, Serpell and Alarcun
(1998) created a framework for improving construction processes through use of a set of
structured activities and tools to help increase quality. Wang (2008) created an automated quality
management system that helps gather, filter, manage, monitor and share quality data between
different crews participating in a construction project. This system was able to enhance
information flow to produce cost savings and to increase the speed of completion of the project
while at the same time improving the quality of the product.
Arditi and Gunaydin (1997) addressed the importance of process quality to construction
companies. One way to improve process quality is through Total Quality Management (TQM),
which has shown great benefits when applied in manufacturing industries. The successful
implementation of TQM in the construction industry requires a commitment to quality from both

8
management and workers. In addition, the implementation of technological advances in design
and construction and full knowledge of the assembly process amongst workers have been
identified as factors influencing Total Industry Productivity (TIP) for construction (Ganesan
1984). The impact of effective pre-construction planning on the reduction of waste was
highlighted in a survey of high rise construction projects in Hong Kong which showed that
execution of work orders with incomplete contract documentation can result in the loss of quality
in several areas such as frequent variation in design, inaccurate material orders, as well as
delivery scheduling difficulties (Poon, Yu et al. 2004 ).
2.1 LEAN DEFINES WASTE IN PROCESS
Lean is a business strategy with the primary objective of eliminating waste, with waste being
defined as “anything that does not add value.” In Lean, the customer defines value. Value-added
activities are ones that the customer is willing to pay for, the ones that help transform the product
or service in some way, and the ones that must be done correctly the first time. Taiiachi Ohno,
the father of the Toyota Production System, identified seven different forms of waste (Ohno
1990), including:
1) Transport: Moving products or materials around is waste; because the more things are moved
the more chance there is for damage to occur.
2) Waiting: Waiting is any form is waste.
3) Overproduction: Producing more than what the customer needs is waste. Overproduction
causes unnecessary inventory cost, materials consumption, and manpower.
9
4) Defect: Any process that fails to transfer inputs to desired outputs is considered waste. Any
failure to meet the customer’s requirements is considered waste.
5) Inventory: Any inventory is considered a non-value added commodity, even though it may be
needed. Once inventoried, it is at risk of damage, obsolescence, spoilage, and quality issues.
6) Motion: Any physical movement by people that does not add value to the process is waste,
including moving things, walking, lifting, etc.
7) Extra Processing: Any processing that does not add value to the product is waste.
2.1.1 Value Stream Map (VSM)
The Lean method offers various tools to help identify any of the seven types of waste in process
mentioned above. A well-known and commonly used Lean tool is Value Stream Mapping
(VSM), a technique that creates a process flow diagram of materials and information. VSM uses
a systematic approach, covering all activities required to bring the product or service to
completion, and shows all the steps, highlighting any ineffectiveness in the value stream. The
following key elements are important in VSM (Sayer and Williams 2007):
Process steps: VSM depicts each of the process steps in the value stream, including both value-
added and non-value-added. The VSM reveals process statistics, including cycle time, number of
operators, quantity of inventory, and number of pieces.
Inventory: VSM highlights the storage as well the quantity and movement of inventory within
the process.
Information flow: VSM depicts all supporting information required by the process, including
schedules, specifications, and orders.

10
Cycle Time (CT): CT includes the time required to complete one cycle of the operation, or one
step in the process.
Work in process (WIP): WIP includes the condition of all products that are neither raw
materials nor final products.
2.1.2 Applying Lean to Construction
Using Lean strategies, Garrett and Lee (2011) analyze the submission and review processes of a
typical construction project and concluded that incomplete or deficient documentation raised
problems during construction; once Lean tools were applied to reduce non-value added activates,
measureable reduction in both process and lead times was achieved. Lapinski, Horman et al.
(2006) examined Toyota’s successful implementation of Lean methodologies to minimize costs
in construction, specifically how Lean can reduce the high initial expense of green building
projects by eliminating process waste. Specifically at the process level, Pasqualini and Zawislak
(2005) applied Value Stream Mapping (VSM) to masonry construction to highlight all associated
waste sources, including extra inventories and delays; however, they did not identify the causes
of proposed solutions. Another study using Lean by Yu, Tweed et al. (2009) found that poorly
managed production flows resulted in significant construction waste; they then used VSM to
analyze and restructure the system to minimize waste.
In Lean, identifying the value stream is the how value will be realized and establishes
when and how decisions should be made. Mapping the value stream shows when the information
necessary to meet the owner’s requirements will be available and when it will be required.
This research used VSM since it can be used to explain an entire system with the goal of
developing a comprehensive Lean system (Howell and Ballard 1998). Some researchers have

11
paired VSM and construction, with efforts focused on the macro process level, such as supply
chains (Arbulu and Tommelein 2002; Fontanini and Picchi 2004), project delivery (Yu, Tweed et
al. 2009), or a single construction process such as fabricating masonry (Pasqualini and Zawislak
2005) or component manufacturing (Da CL Alves, Tommelein et al. 2005).
However, this research also demonstrates that while VSM has the ability to outline
processes, simplifying the identification of waste, VSM does not have the ability to analyze the
environmental impact to help improve a construction process prior to or during the construction
phase.
2.2 GREEN REDUCES ENVIRONMENTAL IMPACT
Although Lean has the potential to identify the waste in the process, Lean does not quantify the
environmental impacts of waste in the construction process. Therefore, in this research, Life
Cycle Assessment (LCA) was used in conjunction with Lean to allow evaluation of the
environmental impact of construction process prior to and during the construction phase.
Massive construction activities are under way globally in an effort to meet the projected
demands of a rapidly growing world population. Building in the United States annually
consumes 66% of the total produced electricity and 40% of the total primary energy generated
(U.S.Energy Information Adminstartion 2010 ). As a result, many initiatives have been
established to improve the environmental performance of the built environment. The process of
applying such initiatives can be labeled “greening.” Greening is the collective term for a variety
of principles and approaches aimed at minimizing or eliminating the environmental impact of a
product or activity. For instance, the U.S. Green Building Council (USGBC) has developed a

12
rating system named Leadership in Energy and Environmental Design (LEED) that rates; the
success of the LEED rating system is evident in the more that 13,400 certified buildings in the
United States (U.S. Green Building Council USGBC 2009).
2.2.1 Life Cycle Assessment (LCA)
Life Cycle Assessment (LCA) is a green tool that that systematically assesses and manages the
environmental impact of a product, process, or service through its entire life cycle, from the
material and energy used in the raw material extraction and production processes, through
acquisition and product use, and continuing to final product disposal. The International
Standardization Organization (ISO) has formalized LCA into a four-step process (International
Organization for Standardization 2006):
1) Goal and scope definition: goals and objectives, boundaries, and functional units are identified
and established.
2) Life Cycle Inventory (LCI): data inventory are collected from different sources such as
relevant literature and databases. Inventories are collected according to the system boundaries;
these include all necessary inventories required in order to achieve to defined goal. This an
important phase since the LCA’s final results will depend on the quality of the LCI.
3) Life Cycle Impact Assessment (LCIA): during this step, LCI data is converted into an
understandable and quantifiable environmental impact, for example, Global Warming Potential
(GWP). The LCIA tool used in this research is the Tool for Reduction and Assessment of
Chemical and other environmental Impacts (TRACI), developed by the U.S. Environmental
Protection Agency. TRACI translates the environmental loads identified by the LCI into nine
different categories. These categories include ozone depletion, global warming, acidification,
13
eutrophication, tropospheric ozone (smog) formation, ecotoxicity, human health criteria-related
effects, human health cancer effects, human health non-cancer effects, fossil fuel depletion, and
land use effects. Each impact is calculated on a midpoint basis and is presented in kg Equivalent
of a reference substance (U.S. Environmental Protection Agency 2010).
4) Interpretation: during this step, recommendations are made to improve environmental
performance and aid project managers in decision-making with respect to the final product and
process results.
2.2.2 Life Cycle Assessment addresses the environmental impact of on-site construction
activities
With respect to greening, Life Cycle Assessment (LCA) has been used in previous studies to
quantify the environmental impacts of construction. A life-cycle study developed by Bilec, Ries
et al. (2006), for example, found that the construction phase, though not as significantly as the
use phase, may have serious impacts on the environment, highlighting the generation of
Particulate Matter (PM) emissions during construction phase. Guggemos and Horvath (2005)
utilized LCA to examine strategies for reducing environmental impact of on-site construction
activities, particularly the strategy of minimizing and reusing temporary materials during
construction. They found that using well maintained or new construction equipment would
improve the environmental impact of the construction phase. Aimed at better informing decision-
makers seeking to add environmental quality and sustainable development to project goals, a
study by Sharrard, Matthews et al. (2008) developed an input-output LCA estimating the
comprehensive environmental effects of construction processes. A study by Li, Zhu et al. (2010)
applied process LCA to work breakdown structures to help decision makers have a clearer
14
understanding of the environmental impact of the material and equipment brought to the project
during the construction phase.
While the previous studies illustrated how construction activities overall contributed to
the life cycle environmental impacts of buildings, this research focused on evaluating the
environmental impact of a single construction process.
2.3 SIX-SIGMA HELPS IMPROVE PROCESS PERFORMANCE
Although the Lean method is used to identify waste, it does not eliminate or reduce variability in
processes. Six-Sigma, however, can improve processes by eliminating all types of root causes
through a variety of tools.
Six-Sigma is a comprehensive method used to help businesses achieve and sustain a
healthy level of success. The Six-Sigma system focuses on customer needs, statistical analyses,
continuous improvement, and business reinvention. Sigma refers to the amount of inconstancy or
variance occurring in a process, and Six-Sigma equates to 3.4 Defects Per Million Opportunities
(DPMO). Most defect opportunity measures are translated into the DPMO format, which
indicates how many defects, would arise if there were one million opportunities.
DPMO = (No. Of X (Defects) in the data collection sheet / No. Of opportunities of defects × No.
Of Units) × 1,000,000 Equation (2.1)
Six-Sigma was introduced by Motorola and General Electric (GE) in the 1980s as a new
set of management tools to help both companies. At that time, Motorola was searching for a

15
solution to improve production inefficiencies; meanwhile, GE was trying to return to its former
status after a significant decline. The status of the companies changed after the application of the
Six-Sigma method to their businesses. Motorola accumulated savings from 1987 to 1997 totaling
$14 billion, and by the end of 1998, GE had accumulated $750 million in sales, which grew to
$1.5 billion by the end of 1999. Since the late 1990s many more companies have adopted Six-
Sigma as part of their management strategy, including Honeywell, ASEA Brown Boveri, Black
& Decker, Bombardier, Dupont, Dow Chemical, Federal Express, Johnson & Johnson, Kodak,
Navistar, Polaroid, Sony, Toshiba, and many others (Pande, Neuman et al. 2000).
The Six-Sigma method has many benefits. Specifically, it 1) helps to identify and
eliminate sources of variation in the process, 2) sustains success, 3) sets performance goals for
all involved parties, 4) enhances value to customers, and 5) allows businesses to execute strategic
change.
Define, Measure, Analyze, Improve, Control (DMAIC) is a five-step Six-Sigma
improvement model. DMAIC is commonly used by Six-Sigma firms to improve the current
capabilities of an existing process. A number of tools and methods can be used in each step of
the DMAIC model. The DMAIC’s five phases along with examples of the tools applied in each
phase are presented in Table 1.

16
Table 1 Examples of tools and methods used in Define, Measure, Analyze, Improve, and Control
DMAIC Steps Examples of tools or methods Define: Identify the problem and the issues causing decreased customer satisfaction.
• Five whys and how. • System thinking. • Flowchart.
Measure: Collect data from the process. • Measurement system analysis (MSA).
• Benchmark.
Analyze: Evaluate the current process; identify the root causes of the problem.
• Cause & Effect Diagram. • Continual improvement. • Experiment.
Improve: Act on the data to change the process for improvement.
• Pareto Chart. • Design of Experiments (DOE). • Failure Mode and Effects Analysis (FMEA). • Process improvement. • Variation reduction.
Control: Monitor the process to sustain the gains • Management commitment. • Control Plan. • Process behavior chart.
This research uses different Six-Sigma tools for the two different case studies. These
tools are Cause and Effect Diagram, Pareto Chart, and Process improvement. The Cause and
Effect Diagram and Pareto Chart will be used for the Chapter 3 case study and the Cause and
Effect Diagram and Process Improvement tools will be used for the Chapter 4 case study.
2.3.1 Cause and Effect Diagram
The Cause and Effect Diagram, also known as “Fishbone” or “Ishikawa Diagram,” is a
categorical brainstorming graphic tool used for determining the root-cause hypothesis and the
potential causes (the bones of the fish) of a specific effect (the head of the fish) (Munro, Maio et

17
al. 2008). Cause and Effect Diagrams can help teams to focus on the problem itself and not on
the history of the problem. Also, Cause and Effect Diagrams can aid in focusing the team
members on the roots of the problem and not prescriptive symptoms.
2.3.2 Pareto Chart
The Pareto principle based on Vilfredo Pareto’s research is an application of the 80/20 rule
(Munro, Maio et al. 2008). Basically, the Pareto principle is that for any issue, the greatest
impact is made by a few vital causes (20 percent) while a lesser impact is made by the many
trivial causes (80 percent). A Pareto Chart arranges attribute data so that columns are arranged in
descending order, with highest occurrences first, while using a cumulative line to track the
percentage of each category/bar, which distinguishes the 20 percent of items that causes are the
main causes of the problem. In other words, the Pareto chart focuses on those causes that will
have the greatest impact if solved.
2.3.3 Process Improvement
The Process Improvement method is the act of making the system work better to meet customer
needs. It is a vital element of implementing continual improvement. The purpose here is to look
at overall variability and not only on the variation. The three elements, which cause variability in
a process, include: instability, variation, and being off-target. Considering variation, instability,
and being off-target at the time of developing the new process would help create a process with
sustainable desired performance. Sustainable performance is a vital element in continual
improvement (Munro, Maio et al. 2008).

18
To date, few papers have been published that discuss the application of integrating Six-
sigma into construction (Pheng and Hui 2004; Stewart and Spencer 2006; Han, Chae et al. 2008).
2.4 APPLYING SIX-SIGMA TO CONSTRUCTION
With respect to quality of construction, Six-Sigma is a quantitative methodology that can
establish definitive improvement goals to reduce process variability in current construction
operations. Six-Sigma was combined with Lean in the Han, Chae et al. (2008) study and had a
great effect on improving the performance of the original process. Six-Sigma evaluates the
quality of an ongoing operation and quantifies the goals of improvement for targeted workflow
so as to control the critical sources of variability. Pheng and Hui (2004) applied Defects Per
Million Opportunities (DPMO) as the Six-Sigma process-performance metric to internal
finishing processes for a residential construction project. The low process performance—2
sigma—encouraged the contractor to supervise its on-going building projects more closely,
better ensuring that the level of workmanship for the internal finishes complied with overall
quality standards. Stewart and Spencer (2006) used DMAIC as a model to help enhance
interactions between project teams, reduce project delays and provide a structured process-
improvement strategy, ultimately improving the productivity of the beam construction process
for a railway station. DMAIC offers a solid procedure for gathering information, and enabling
process quality improvement.
Overall, although a fairly robust body of literature exists with detailed information on
these three methods individually, there is a gap in research and practice with respect to

19
combining Lean, Green, and Six-Sigma into one framework for comprehensive improvement of
the construction processes (see Figure 2).

20
Figu
re 2
Lite
ratu
re r
evie
w a
nd r
esea
rch
cont
ribu
tion

21
2.5 OUTLINE OF DISSERTATION
Chapter 3 addresses Objective 1, which is to develop a systematic framework that integrates
Lean, Green, and Six-Sigma methods in order to improve the environmental performance of the
construction process during the construction phase, using DMAIC steps. This work has been
submitted to the International Journal of Construction Management and is currently under
review.
Chapter 4 addresses Objective 2, where the developed Lean, Green, and Six-Sigma
framework from Objective 1 was applied to evaluate and improve construction processes in the
Kingdom of Saudi Arabia. This work has been submitted to the Journal of Construction
Engineering and Project Management.
Chapter 5 addresses Objective 3, creating a quality model by applying a form of DMAIC
that integrates Lean, Green, and Six-Sigma called (LG6) in order to help contractors plan and
implement construction projects in an efficient manner. Putting the developed LG6 model into
practice can help to identify potential sources of waste early in the process, prior to the
construction phase.

22
3.0 A FRAMEWORK TO IMPROVE CONSTRUCTION PROCESSES:
INTEGRATING LEAN, GREEN, AND SIX-SIGMA
The following chapter is an article under review in the International Journal of Construction
Management with the citation:
Banawi, A., M. Bilec, “A Framework to Improve Construction Processes: Integrating Lean,
Green and Six-Sigma.” International Journal of Construction Management, 2013: Under review.
Supporting Information submitted with the work to the International Journal of Construction
Management appears in Appendix B.

23
3.1 ABSTRACT
The construction industry consumes a significant amount of resources annually, generates
significant waste, and produces a host of emissions. This work develops a framework and
integrates three different approaches—Lean, Green, and Six-Sigma—in a systematic approach
with the goal of improving the quality and environmental impacts of the construction process. A
case study of pile cap installation is conducted to illustrate the application of the framework and
associated results. The study highlights two issues within the pile cap construction process
responsible for waste: delay and potential errors in material estimation and ordering. It
describes the environmental impacts arising from waste and analyzes the root causes behind
waste generation to enable improved process performance. A survey of field professionals
regarding the causal factors of waste in everyday construction activities identified “Design
changes during construction” as responsible for 48% of waste occurrences during construction,
confirm results from the literature. In conclusion, the Lean Green Six-Sigma framework offers a
comprehensive, multi-stage approach for process improvement minimization of life cycle
environmental impacts.

24
3.2 INTRODUCTION
The construction industry contributed over $639 billion to the United States' Gross Domestic
Product (GDP) in 2009 (U.S. Department of Commerce 2010); moreover, it employs over nine
million workers (U.S. Census Bureau 2010). At the same time, the construction industry
consumes vast quantities of resources and energy and produces an abundance of waste. In the
U.S. in 2002, 136 million tons, constituting roughly one-third of the solid waste entering
landfills, was from construction activities alone (U.S. Environmental Protection Agency 2003).
Resources, energy, and cost are wasted as a result of inefficient or poorly managed construction
projects. Therefore, improving the efficiency and management of construction projects can
result in savings related to these assets. While previous construction-related studies have
focused on how to reduce waste (Pasqualini and Zawislak 2005), minimize environmental
impacts (Bilec, Ries et al. 2006; Bilec, Ries et al. 2010), or increase productivity (Pheng and Hui
2004), to date, limited research has been done examining how to achieve all three in
combination. This research integrates three methods - Lean to reduce waste, Green to assess the
environmental impact, and Six-Sigma to improve productivity - in an attempt to do so. The
hypothesis is that use of all three methods together will help minimize impacts generated by
construction activities while also improving efficiency and safeguarding the bottom line.
The main goal of this study is to develop a framework that incorporates all three methods,
Lean, LCA, and Six-Sigma, to quantify and reduce the waste associated with construction. To
achieve this goal, several objectives were completed:
1) Identifying waste at different stages in the construction process via the Lean tool
VSM.
2) Quantifying the environmental impacts of resulting waste via LCA.

25
3) Eliminating or reducing the sources of waste via Six-sigma tools.
3.3 FRAMEWORK
The overall framework structure is based on Six-sigma’s DMAIC. The designed DMAIC
framework consists of three steps, described below and illustrated in Figure 3.
Step 1: Define and Measure - After selecting a construction process for evaluation,
concurrently apply both Lean (VSM) and Green (LCA) methodologies to determine if waste is
generated in the process and then quantify the environmental impacts of the waste.
Step 2: Analyze and Improve - If the process generates waste, then select and apply one
or more appropriate Six-sigma tools to eliminate or reduce waste. Essentially the framework
contains Six-sigma tools “nested” within Step 2. For example, Figure 1 shows the Cause and
Effect Diagram and the Pareto chart as the chosen Six-sigma tools; however any Six-sigma
tool(s) could be executed for use in Step 2 based on the case needs.
Step 3: Control - Re-evaluate using Lean (VSM) and Green (LCA) to determine the
extent of waste reduction.

26
Figure 3 Lean, Green, Six-Sigma framework
3.4 METHOD
3.4.1 Case Study
A case study was done to illustrate the functionality of the framework. The case study “test” was
deliberately simple to truly test the framework. The construction process used was the
installation of pile caps for the Mascaro Center for Sustainable Innovations (MCSI) building, a

27
42,000 sq. ft. green building adjacent and integral to the Swanson School of Engineering at the
University of Pittsburgh. The project cost $16 million and took 19 months to complete, from
January 2008 to August 2009.
The pile cap construction process consisted of: 1) cutting the top of piles, 2) excavating
for the pile cap installation, 3) forming the pile caps, and 4) placing and finishing the concrete.
The pile cap process was deemed ideal for this study because it is a common construction
activity typically having a common construction waste, specifically, concrete and formworks
(U.S. Environmental Protection Agency 2003).
28
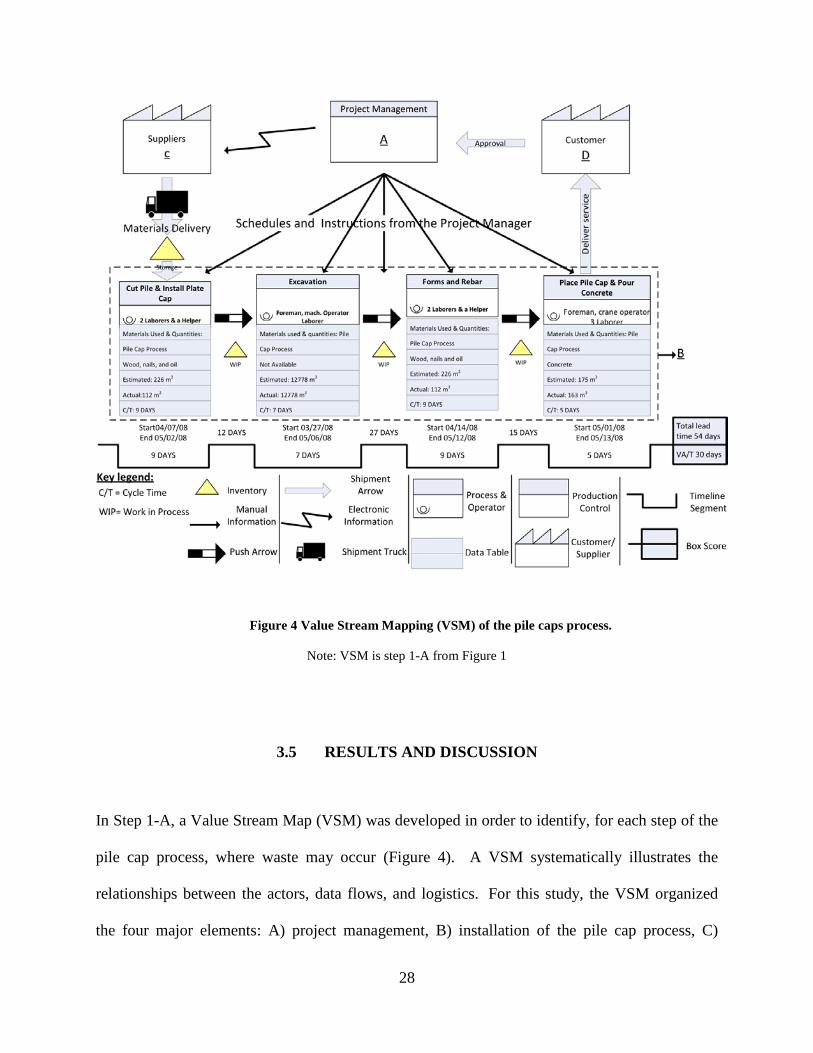
Figure 4 Value Stream Mapping (VSM) of the pile caps process.
Note: VSM is step 1-A from Figure 1
3.5 RESULTS AND DISCUSSION
In Step 1-A, a Value Stream Map (VSM) was developed in order to identify, for each step of the
pile cap process, where waste may occur (Figure 4). A VSM systematically illustrates the
relationships between the actors, data flows, and logistics. For this study, the VSM organized
the four major elements: A) project management, B) installation of the pile cap process, C)

29
supplier, and D) customer. One notable feature of the VSM is the data table, which can be used
to organize process-related data, such as time, money, and materials used. In this case study, the
information recorded in the data table includes crew composition and size, materials type,
estimated material, installed materials, and cycle time. Cycle time (C/T) and delay time are
illustrated on the timeline.
For step 1-B, Green, LCA was used to evaluate the environmental impacts of the pile cap
process. The LCA system boundaries for the pile cap process includes raw materials extraction
and manufacturing, transportation of equipment and materials to the site, waste disposal, and
equipment usage on-site. LCA was used to evaluate both the actual and the estimated quantities
of the materials, as well as to analyze the environmental impacts of changes in anticipated
activity duration due to delays from 31 days to 54 days. The Tool for the Reduction and
Assessment of Chemical and Other Environmental Impacts (TRACI 2 V3.01) (U.S.
Environmental Protection Agency 2010) was then used to perform a life cycle impact assessment
(LCIA).
The life cycle inventory data used to determine aggregate construction emissions for the
pile cap process is shown in Table 2.

30
Tab
le 2
Life
cyc
le in
vent
ory,
dat
a so
urce
s and
rem
arks
for
the
pile
cap
pro
cess

31
Figure 5 Life cycle environmental impacts of the pile cap process using the Tool for the Reduction
and Assessment of Chemical and other environmental Impacts (TRACI).
The side-by-side comparison of the LCA results of the pile cap process for nine
environmental impact categories is shown in Figure 5 for each of four process phases: Materials,
Equipment manufacturing and combustion, Waste, and Transportation. Impact values were
calculated based on both actual material use and times as well as estimated materials and time
according to final contractor reports. Of the general environmental impacts, material use
exhibited the highest share of impact in five of the nine categories. Environmental burdens in the
other four categories arose in two cases from equipment manufacturing and combustion and in
two categories of waste. Transportation showed the least environmental impact.

32
Materials accounted for the highest impacts in global warming potential, carcinogenics,
respiratory effects, ozone depletion, and ecotoxicity. Cement manufacturing was a significant
contributor to environmental impact from the material phase.
Equipment manufacturing and combustion contributed the highest environmental impacts
in two categories: acidification and smog potential. Moreover, equipment contributed the highest
after materials in terms of global warming potential and respiratory effects. Diesel combustion
was a notable contributor to respiratory effects (Particulate Matter, PM2.5), that is, effects leading
to issues with the respiratory system, including asthma and lung cancer (U.S. Environmental
Protection Agency 2010).
Although the quantity of material waste generated in comparison to the actual materials
utilized was insignificant, the environmental impacts were able to be quantified. Waste
generation and associated disposal had the highest environmental impact in the categories of
non-carcinogenic potential and eutrophication potential. While the concrete delivery was the
highest of the transportation processes, totaling 3642 ton–kilometers (see Table 2), transportation
generated the lowest environmental impacts.
For step 2, Analyze & Improve, the Six-sigma process improvement method was
implemented, with a Cause and Effect Diagram being used to analyze the root causes of the
generated waste (Figure 6). Then a Pareto chart was used to explore how to improve the most
commonly occurring waste causes. First, the Cause and Effect Diagram helped to identify the
root causes of waste under several categories: Uncontrollable events, Materials, Labor,
Machines, Methods, and Measure. Out of the 30 possible factors considered as possible causes of
waste, only 16 are included on the Cause and Effect Diagram. These 16 were chosen based on
two criteria: (1) the variables had to be independent, and (2) the factors had to have been

33
researched extensively in the literature (Bossink and Brouwers 1996; Formoso, Soibelman et al.
2002; Poon, Yu et al. 2004 ). Independence here means that the occurrence of one cause of error
does not affect the possibility that another of the 16 causes will occur. For example, having
inexperienced workers could lead to errors by laborers, making it a dependent variable; on the
other hand, damage during transportation could not lead to having materials which do not
comply with specifications.
Figure 6 Cause and Effect Diagram: Common factors causing waste in the pile cap process
The set of 16 potential causal factors was further narrowed down via a two-step process
to identify which factors contribute most to waste generation: First, a questionnaire was
developed and sent to a construction claims consultant, who then distributed it to 30 employees
involved with daily on-site construction claim activities. All 30 responses were returned within

34
three days. In the questionnaire employees in the firm were asked to rank the 16 causal factors in
order of importance, with number one being the highest, that is, most likely to generate waste.
More data, including a description of the phases of questionnaire development, questionnaire
sample and a table summarizing questionnaire results, can be found in Appendix B.
The Pareto chart was then used to create a representation of the feedback revealed by the
questionnaire results. Applying the Pareto principles, each causal factor was given points based
on how it was ranked in the employee questionnaire (Pande, Neuman et al. 2000). To elaborate
more, if a factor rated first place it was assigned 12 points; second place, 6 points; third place, 3
points; and any place after third, 1 point. “Design changes during construction” ranked first
overall, representing 46% of the total number of points. “Delay in passing information” ranked
second representing 28%, and “Errors by laborers” was third place, representing 18% of the
total. The remaining factors represented only 8% (Figure 7).
Figure 7 Pareto Chart: Factors that generate most waste according to questionnaire for the pile cap
process
The questionnaire results compared well with causal factors found in the literature
(Bossink and Brouwers 1996; Formoso, Soibelman et al. 2002; Rojas and Aramvareekul 2003;

35
Poon, Yu et al. 2004 ). A majority of on-site workers concurred that reducing or eliminating the
likelihood of design changes during construction would help increase process performance by
reducing waste. This might be achieved through establishing clear communication between
involved parties, especially during the early phases of the project. Finally Step 3, Control,
retrospectively evaluates the achieved process performance as well as techniques and strategies
implemented in order to develop improved procedures for better performance in the future. Step
3 is essential to the framework: this step is responsible for maintaining consistent successful
performance and for allowing continuous improvement.
To recap, this framework enabled us to apply the concept of DMAIC to the construction
phase to improve the process. As demonstrated above, the sequence of steps starts with
evaluating a chosen process, identifying the waste generated during the process, and measuring
its impact. In this study, two types of waste were recognized: the ordering of too much materials
and delays in the process schedule. During the second step, through the use of Six-sigma tools,
we were able to identify 16 possible reasons for the generation of waste deriving from various
sources. The 16 causes were narrowed down to the 3 most common causes via a questionnaire
that was developed and sent to a consultant company. Because of that, we were able to find
suitable solutions to implement to overcome these three causes. Finally, the success of these
solutions was monitored and revised business processes were established to maintain improved
performance.

36
3.6 CONCLUSIONS AND FUTURE WORK
Waste management has become a necessary task in the construction industry due to the abundant
amount of waste generated by construction activities every year. For objective one, we explained
a framework developed to identify and reduce waste during construction processes by integrating
three methods: Lean, Green, and Six-Sigma. A case study of the installation of pile caps process
was implemented to illustrate and validate the framework. In the Lean stage, the two categories
of waste in the pile cap process studied were found to be waste in terms of materials and waste in
terms of time. In the Green Stage, the associated environmental impact of the pile cap process
was analyzed using common TRACI impact categories. The consumption of materials was the
highest contributor to most impact categories including contributing to global warming, being
carcinogenic, having respiratory effects, depleting ozone, and contributing to ecotoxicity. In the
Six-Sigma stage, potential causes of waste were identified, then validated and ranked using a
questionnaire that was administrated to a construction consulting company. The root cause,
responsible for 46% of waste occurrences during the construction phase, was identified as
“Design changes during construction” by questionnaire respondents.
The framework presented here has been designed to improve process performance during
the construction phase of projects by reducing waste through a retrospective diagnosis. Errors
and mistakes happen most of the time during construction due to the inherent complexity of the
process. Typically, projects go through five phases: programming, design, construction,
operation, and demolition. For future work the authors are proposing to develop a prospective
model incorporating Lean, Green, and Six-sigma tools to prevent waste by diagnosing in
advance the planned processes likely to produce waste. Improved planning and enhanced control
during the earliest phases of the project have even greater potential to decrease the expense and

37
environmental impacts of waste; or, to extend the medical metaphor, “An ounce of prevention is
worth a pound of cure”.

38
4.0 APPLYING THE LEAN, GREEN, AND SIX-SIGMA FRAMEWORK TO
IMPROVE AN EXTERIOR CONSTRUCTION PROCESS IN SAUDI ARABIA
The following chapter was submitted to the Journal of Construction Engineering and Project
Management, with citation:
Banawi, A., Bilec M. (2013). “Applying Lean, Green, and Six-Sigma Framework to Improve
Exterior Construction Processes in Saudi Arabia.”

39
4.1 ABSTRACT
Over the last decade, Saudi Arabia has experienced significant economic increases, as evidenced
by the 30% growth in its gross domestic product; furthermore, the construction industry has
increased 10% in the same time period (S. A. Minstry of Finance 2011; Saudi National
Commercial Bnak 2011). Due to this significant growth, the construction industry is
encountering issues related to construction quality, resulting in significant waste and associated
environmental impacts. In this research, we applied our previously developed framework that
integrates three different methods—Lean, Green, and Six-sigma – to a residential construction
complex in Saudi Arabia. Our aim with this case study was to explore the application of the
framework in practice to glean quantitative results and further validate the framework. In the
case study, we used the developed framework to identify a significant issue related to quality and
delays, i.e., final completion of 53 residential units was delayed because of failed exterior
buildings surfaces. We then used the framework to define the causes behind the defects via a
field investigation of the 53 units. We found that construction execution was responsible for
43%; untrained workers, 31%; unfavorable construction weather conditions, 19%; and other
issues accounting for 7%. A procedure was developed in concert with the construction manager
and overall developer to reduce the amount of work having to be done again and the amount of
waste revealed by the field examination and the framework. Although two steps were added to
the original construction process to overcome the causes of the waste, a lot of resources were
nonetheless saved and the environmental impacts were reduced. In summary, we found that the
Lean, Green, Six-sigma framework allowed increases in productivity and quality, and reduction
in waste.

40
4.2 INTRODUCTION
The construction industry has a major impact on economic growth. In developing countries such
as Saudi Arabia, the construction sector is essential to short- and long-term economic growth. In
2010 the construction industry accounted for 11% of Saudi Arabia’s Gross Domestic Product
(GDP) at $300 billion. Saudi Arabia’s GDP growth is the highest the country has experienced
in the last several years. Many projects in various sectors have been constructed, with many
more projects still in the planning phase. Some current construction projects include 36,800km
of new roads, new airports, and additional berths in ports (S. A. Minstry of Finance 2011).
Unfortunately, the rise in construction activity has also led to a host of construction issues -
shortages of equipment, trained workers, and materials; sub-prime scheduling of activities during
significantly higher temperatures.
Environmental protection to some countries is an integral aspect to long-term strategic
planning, legislation, and executive orders. While a host of environmental issues exists, some of
the most pressing ones include non-renewable energy usage, climate change, waste generation,
poor water quality and insufficient availability of water and other natural resources, all of which
are exacerbated by the increasing global population. The construction industry is a primary
consumer for natural resources. In Saudi Arabia, for example, the demand for cement reached
about 36.7 million tons, one third of US cement consumption in 2008 (Saudi National
Commercial Bnak 2011; Portland Cement Association 2012).
With the high amounts of construction activity and the creation of poor-quality products,
the Saudi construction industry is faced with the dual issue of excessive production of waste and
excessive use of natural resources. Even though a significant portion of the municipal waste
stream in Saudi Arabia is from construction, the government exercises minimal efforts to reduce

41
waste in this area. Looking at various sources; including waste management facilities,
municipalities, and construction companies, reveals a lack of data and information regarding
construction waste in Saudi Arabia (Al-Jarallah 1983; Assaf and Al-Hejji 2006; Al-Nagadi 2007;
Al-Sudairi 2007).
To address this problem, we applied our framework, an integration of three different
methods—Lean, Green, and Six-Sigma, in a systematic approach, with the goal of reducing
waste and thereby reducing the associated environmental impacts of the construction process
(Banawi and Bilec 2013). Our aim was to illustrate via a residential development project in
Saudi Arabia that all three methods in concert have the potential to minimize impacts generated
by construction activities while improving quality.
4.3 METHODOLOGY
The overall framework is based on Six-sigma’s Define, Measure, Analyze, Improve, Control
(DMAIC), previously discussed in Banawi and Bilec (2013). To briefly summarize: Steps 1a and
1b, Define and Measure - after selecting a construction process for evaluation, concurrently
apply both Lean (VSM) and Green (LCA) to determine if waste is generated in the process and
then to quantify the environmental impacts of the waste; Steps 2a and 2b, Analyze and Improve -
if the process generates waste, then select and apply one or more appropriate Six-sigma tools to
eliminate or reduce waste. Essentially, the framework contains Six-sigma tools nested within
Step 2. For example, in this research a Pareto Chart and Process improvement were the selected
Six-sigma tools; however any Six-sigma tool(s) could be executed in Step 2 based on the case
42
Six-sigma tools; however any Six-sigma tool(s) could be executed in Step 2 based on the case
needs; Step 3, Control - Re-evaluate using Lean (VSM) and Green (LCA) to determine the extent
of waste reduction. Each step is illustrated below in the case study.
4.3.1 Case Study
A case study was done to improve the construction processes for a residential complex in
Madinat Yanbu Al-Sinaiyah (MYAS), Saudi Arabia and to illustrate the functionality of the
framework. The case study “test” was simple to test the framework. MYAS is one of two
industrial cites currently being established in Saudi Arabia to support the oil industry. MYAS is
the western destination of oil and gas pipelines that start from the production area in the east of
the Kingdom, and it is the largest port for exporting oil to the Red Sea. MYAS is an attractive
business destination to many major oil investors from inside and outside the country. Therefore,
construction in this area is a high priority on the Royal Commission for Industrial Yanbu’s
(RCIY) agenda, with the aim of providing services required by residents such as those related to
housing, industry, health, education, recreational and public needs.
Prior to applying the framework, an on-site inspection was conducted over a total of two
months, June to August 2012. During the on-site inspection and data collection phases, the
framework was introduced and explained to the both the construction project manager and the
RCIY project manager. On-site investigating of all study units was completed to identify the
major issues of project delay and rejection by owners.
The framework was then applied to help analyze and ameliorate the root causes behind
the appearance of paint blistering on buildings surfaces, shown in Figure 8. Fifty-three
residential units, covering a total of 498,664 sf, were investigated in this case study. The exterior

43
painting construction process evaluated in this case study consisted of three simple steps: (1)
applying cement plaster, (2) applying primer sealer, and (3) applying paint.
Figure 8 Photos highlighting exterior quality issues
4.4 RESULTS AND DISCUSSION
To explain the implementation of the framework, we review each step in the process as each
plays an important part in obtaining results:
Step 1a: Value Stream Map: For Step 1a, a Value Stream Map (VSM) was developed in
order to identify, for each step of the exterior painting processes, where waste occurred (see
Figure 9). The VSM was organized into four major elements: (A) project management, (B) the
exterior painting construction process, (C) supplier, and (D) customer. The VSM systematically

44
illustrates the relationships between the actors, data flow, and logistics. As illustrated in the
VSM, the painting construction process consisted of three steps, with duration of 53-55 days.
Lead/total time was a combination of Non-Value Added Time (NVA/T) or the time the process
was on hold; and Value-Added Time (VA/T), the time the process was in progress. The NVA/T
was 4 to 6 business days while the VA/T was 49 business days; furthermore the VSM explains
the resources the process consumed including labor hours, materials and equipment. Finally, the
VSM shows that units were rejected by owners due to the appearance of painting blistering on
the building surfaces.
Figure 9 Value Stream Map (VSM) of case study exterior painting process

45
Step 1b, Greening: For Step 1b, Greening, LCA was used to evaluate the environmental
impacts of the exterior painting construction process. The LCA system boundary for the exterior
painting construction process includes raw materials extraction and manufacturing;
transportation of equipment, materials, and workers to and from the site; and equipment usage
on-site. LCA was used to quantify the original process, and subsequently, the
modified/improved process to understand the reduction in the environmental impacts. The Tool
for the Reduction and Assessment of Chemical and other environmental Impacts (TRACI 2
V3.01) was used to perform the life cycle impact assessment (LCIA). The life cycle inventory
data used is shown in Table 3.

46
Tab
le 3
Life
cyc
le in
vent
ory,
dat
a so
urce
s and
rem
arks
for
exte
rior
pai
ntin
g pr
oces
s
Not
e:
Orig
inal
Pro
cess
(O
P) c
onsi
sts o
f: 1)
app
lyin
g ce
men
t pla
ster,
2) a
pply
ing
prim
er se
aler
, and
3) a
pply
ing
pain
t. M
odifi
ed P
roce
ss (
MP)
con
sist
s of
: 1)
pre-
plas
terin
g, 2
) ap
plyi
ng c
emen
t pla
ster
, 3)
clea
ning
sur
face
s, 4)
app
lyin
g pr
imer
sea
ler,
and
5) a
pply
ing
pain
t.
Rej
ecte
d Pr
oces
s (R
P) c
onsi
sts
of: 1
) app
lyin
g ce
men
t pla
ster
, 2) a
pply
ing
prim
er s
eale
r, 3)
app
lyin
g pa
int,
4) R
emov
ing
old
pain
t, 5)
app
lyin
g pr
imer
seal
er,6
) app
lyin
g pa
int.

47
Figure 10 Life cycle environmental impacts for the original exterior painting process
The LCA results of the exterior paint process for nine environmental impact categories
are shown in Figure 10 for three phases: Materials, Equipment manufacturing and combustion,
and Transportation. Of the general environmental impacts, materials contributed to the highest
share of impacts in all of the categories except for Ozone depletion, where Equipment
manufacturing and combustion was the highest. From a closer analysis of the overall LCA
results, cement manufacturing was a significant contributor to environmental impact
from materials while paint came in second, as shown in Figure 11. Equipment
manufacturing and combustion and Transportation each had the second highest impact in four
categories: Equipment manufacturing and combustion came second in term of Acidification,
Carcinogenic, Noncarcinogenic and Ecotoxicity while Transportation was the second highest in
Global warming, Respiratory Effects, Eutrophication, and Smog.

48
Figure 11 Life cycle environmental impacts for materials consumed for the exterior painting process
Step 2, Analyze and Improve: For Step 2, Analyze and Improve, the Six-sigma process
improvement method was implemented, using a Pareto chart to analyze and identify the most
commonly occurring causes that led to blistering. Then, Process improvement was used to create
an alternative process that could minimize the variables’ occurrence. In order to identify the
variables causing blistering, an evaluation of 53 residential units was performed. Out of these 53
units, 10 units exhibited minimal blistering while the remaining 42 units had extensive blistering.
A data sheet and site observations were used to collect data for the Pareto chart (see Appendix
C.2).
Examining the units to identify the major causes of blistering was a time- and effort-
intensive task. The units had to be carefully examined and the contractor project manager and

49
the RCIY project manager had to be present and participating. Different parties were asked for
their feedback regarding the low quality of the painting, including superintendents, project
engineers, foremen, and workers. After final analysis of the data collected from the site, four
major factors of blistering were observed: inadequate application (43%), untrained workers
(31%), unfavorable weather conditions (19%), and others (7%), see Figure 12.
Figure 12 Pareto chart with factors that generate waste as identified by the field investigation of 53
units for the exterior painting process.
The Process improvement method was then used in order to improve the original process
and to reduce the defects causes revealed by the Pareto chart. The main objective of the modified
process was to eliminate or minimize the occurrence of blistering. Therefore, all four causal
factors were considered at the time the modified process was created. The modified process
includes two additional steps: (1) pre-plastering, (2) applying cement plaster, (3) cleaning
surfaces, (4) applying primer sealer, and (5) applying paint with adequate wait time. The pre-
plastering step involves adding bonding materials to minimize humidity transfer to surfaces.
Humidity (included in cause “unfavorable weather conditions”) was shown to be a major cause
of the blistering and resulted from the fact that more water was added to the concrete during

50
construction because of the high temperature in order to slow the curing process. The other new
step was cleaning the surface before applying the primer. Due to the climate of the area, dust is a
major issue, especially in the summer season. The dust particles co-mingle with the paint,
contributing to blistering. Both processes are obvious solutions that nonetheless had been
neglected during the original process. Lastly, an increase in wait time from 2 days to 4 days was
made before the last step of applying paint.
Figure 13 shows the current VSM for the modified process, including the additional two
steps and all other data related to the exterior painting process. In collaboration with the
construction management team, the modified process was successfully applied to two residential
units. Both units were carefully examined and both showed no signs of blistering (see Figure
14).

51
Figure 13 Modified Value Stream Map (VSM) for the exterior painting process
Figure 14 Examples of the modified painting process outcomes

52
Finally Step 3, Control: for this step, we retrospectively evaluated the achieved process
performance as well as techniques and strategies implemented in order to develop improved
procedures for better performance in the future. Step 3 is essential to the framework: this step is
responsible for maintaining consistent successful performance and for continuous improvement.
The modified process was able to deliver a consistent construction process, and one
designed to overcome unfavorable weather conditions and changing labor force. While the
modified process did require more time and more resources than the original process, the
modified process was the environmentally preferable option when compared to the original
process plus rejected work. The rejected process’ environmental impact includes the original
process environmental impact plus the environmental impact generated from repeating two
steps: 1) applying base plaster and 2) applying paint (see Table 4).
Table 4 Life cycle environmental impacts and time duration of the original painting process, modified process
and rejected process
Impact Category Unit Original Process (OP)
Modified Process (MP)
Rejected Process (Including OP)
Global Warming kg CO2 eq 1291 1510 1634 Acidification H+ moles eq 194 222 276 Carcinogenics kg benzene eq 9 9.6 18 Non carcinogenics kg toluene eq 29409 30505 54266 Respiratory effects
kg PM2.5 eq 0.5 0.6 0.64
Eutrophication kg N eq 0.26 0.3 0.34 Ozone depletion kg CFC-11 eq 0.001 0.001 0.002 Ecotoxicity kg 2,4-D eq 681 802 837 Smog kg NOx eq 2.7 3 4
Number of steps 3 5 6 Duration (Days) 53-55 67-71 77
To recap, this framework enabled us to apply the concept of DMAIC to the construction
phase to improve the process. The sequence of steps started with evaluating a chosen process,

53
identifying the waste generated during the process, and measuring its impact. Then, through the
use of Six-sigma tools, we identified possible reasons for the generation of the waste and found
suitable solutions to implement. Finally, we monitored these solutions and revised business
processes established to maintain improved performance.
4.5 CONCLUSION
Saudi Arabia is experiencing a boom in the construction industry, yet it is facing many
challenges that could impact the industry’s environmental performance. This paper explains a
previously developed framework that can be used to identify and reduce waste during
construction processes by integrating three methods: Lean, Green, and Six-Sigma. A case study
of construction process of applying exterior painting in a residential complex in Saudi Arabia
was implemented to further illustrate and validate the framework. A major defect, blistering, was
identified. The associated environmental impact of the painting construction process was
analyzed using TRACI impact categories. The consumption of materials was the highest
contributor to most categories including Global Warming, Acidification, Carcinogenic, Non
Carcinogenic, Respiratory Effects, Eutrophication, Ecotoxicity, and Smog. Potential causes of
waste were identified, then validated and ranked, using a Pareto Chart. The root causes
responsible for the blistering occurring during the construction phase were identified as
“inadequate procedure” accounting for 43%, “untrained workers” at 31%, “unfavorable weather
conditions” at 19%, and “others” at 7%. A modified process was developed to eliminate potential
causes by applying the Process improvement method. The modified process was then
54
implemented on two residential units for validation. The modified process was able to deliver
units that are blistering less.
In the future the Lean Green, Six-Sigma framework will be modified to allow it to be a
part of the quality inspection procedure for buildings during construction. To achieve that, the
framework should take less time and effort than what it does now, yet should deliver the desired
results. The successful attempts in this study will be introduced to several organizations in Saudi
Arabia to encourage the industry to consider revaluating their own processes for a better quality
environmental performance.

55
5.0 A MODEL COMBINING THE THREE METHODS LEAN, GREEN, AND SIX-
SIGMA (LG6) TO IDENTIFY WASTE IN CONSTRUCTION PROCESSES PRIOR TO
CONSTRUCTION PHASE
5.1 ABSTRACT
The construction sector is a major contributor to negative environmental impacts in the United
States and furthermore consumes an abundant quantity of natural resources---. In this research,
an innovative model was developed with the goal of improving the life cycle environmental
impacts of buildings by identifying potential waste sources prior to the construction phase, in the
earliest stages of a project. The new model, called LG6, integrates three methods - Lean, Green,
and Six-Sigma - and implements the Define, Measure, Analyze, Improve, and Control (DMAIC)
improvement framework to environmental improvement, waste and cost reduction in
construction.
The functionality of LG6 is illustrated through a case study of a woodpile installation
construction process. In this case study, the LG6 model identified four steps out of eight as non-
value added steps or potential waste generators according to the Lean principles. Three of the
four steps involved extra time and effort by the contractor to set up equipment, while the fourth
involved additional work that could have been avoided with adequate planning. For the case
study, the LG6 model showed that environmental impact could be reduced by 9%—and expenses

56
reduced by 1% as well—if alternative processes had been implemented. Specifically, the
alternatives suggested would have minimized the environmental impacts of major contributors of
materials, transportation, and equipment usage, in addition to helping reduce the residual waste
that occurred from cutting to length all woodpiles. Quality, Costs & Impacts Process Analysis
demonstrates that this case study shows the usefulness of the LG6 model on a single process and
suggests that much unnecessary waste could be avoided if the LG6 model were applied
extensively during pre-construction.

57
5.2 INTRODUCTION
Activities related to the construction industry have a considerable environmental impact in the
United States: Total construction and demolition (C&D) waste in the US was estimated to be 325
million tons in 2003 (U.S. Environmental Protection Agency 2004). Unfortunately efforts to
reduce C&D waste have not been very successful to date. One reason for this is that while
contractors have different methods of completing their jobs, usually relying heavily on their own
experience, for most, success is defined as finishing the job within the given constraints of
money, time, and quality. Although contractors may typically finish within the budget and the
time frame they are given, their construction methods may generate a significant amount of
waste (Love, Edwards et al. 2009).
Another reason it is difficult to reduce waste in the construction process is that the nature
of the construction industry is complicated: every project is unique and has a different purpose
(Bossink and Brouwers 1996; Ekanayake and Ofori 2000); moreover, every project consists of
multiple tasks that are usually assigned to separate crews involved with the project, with each
having a high likelihood of contributing to waste generation. This fragmented nature of
construction makes the likelihood of waste being generated at any point of the project phases
greater. Therefore, it seems that environmental and economic benefits arising from the reduction
of waste can best be achieved by proactively planning ways to prevent waste from being
generated in a project in the first place a priori, rather than simply seeking to reduce it ad hoc on
site during construction itself (Lee, Diekmann et al. 1999).
Several organizations have established rating systems to enhance the environmental
performance of the built environment. For instance, the U.S. Green Building Council (USGBC)
has developed the Leadership in Energy and Environmental Design (LEED) system, which

58
awards points under several categories for the reduction of environmental impacts at
corresponding points in a building’s life cycle. Effective application of LG6 to a specific
building project may result in the awarding of LEED points under the category for design
innovation and the creation of new methods or tools to improve life cycle environmental
performance (U.S. Green Building Council USGBC 2009).
This chapter presents an innovative model for the identification and minimization of
waste and extends a previously developed conceptual framework (Banawi and Bilec 2013) by
applying three proven methods at the pre-construction bidding/planning phase. The developed
model can be applied to many construction processes without the need for trying new tools every
time we evaluate a construction producer while the framework was developed with the capability
to apply certain aspects that might differ from one process to another depending on the chosen
process. An earlier conceptual framework was proposed and tested integrating three methods—
Lean, Green, and Six-sigma—to eliminate waste during the construction phase through
monitoring and continuous improvement strategies. This framework applies the 5-step Define,
Measure, Analyze, and Improve, Control (DMAIC) process improvement approach to waste
reduction and environmental impact improvement. Specifically, possible waste sources in each
construction process are defined, then related environmental impacts are measured, root causes
of waste analyzed, fundamental waste sources eliminated, and finally, process performance
controlled to sustain success.
This present work applies the same three Lean, Green, and Six-Sigma (LG6) methods to
enable contractors to proactively identify and eliminate potential waste prior to the construction
phase. The hypothesis is that LG6 will reduce waste generation during the pre-bidding and
bidding phases of construction projects, resulting in both decreased environmental impacts and

59
lower costs. All three methods can be efficiently integrated into the project pre-construction
phase: Lean to identify waste, Green to evaluate the environmental impact of potential waste,
and Six-Sigma to evaluate and improve process performance. The objectives to achieve by
developing the LG6 model are:
1) Helping stakeholders reduce environmental impacts of buildings prior to construction.
2) Decreasing the overall environmental impacts and carbon footprint of the construction
industry.
3) Increasing awareness of green initiatives and the value of their application to the
construction industry.
4) Creating a tool for buildings to be awarded LEED points.
To illustrate how LG6 was used to accomplish these main research objectives and what
was learned from this research, this chapter presents a brief background of the incorporated
methods, details the improvement model and its structure, discusses a case study, and concludes
with recommendations for LG6 implementation and future research.

60
5.3 RESEARCH METHODOLOGY
The work consists of developing a proactive model and executing a case study to examine the
validity of the LG6 model. Excel, a well-known and easy-to-use software tool, was used to
construct the LG6 case. The model is available for download at
http://www.engineering.pitt.edu/SGD/.
5.3.1 Lean Green Six-sigma (LG6) Model
The LG6 model has two parts (Figure 15): Level one: contains the basic information about the
construction process under consideration, including the name, scope of work, date, client
information, and project requirements. Some main points about the three methods Lean, Green,
and Six-sigma are listed at Level One of the LG6 model, where it is essential to give the user a
reminder of what the purpose of each method is. Level two: Divided into five functions, based on
the DMAIC stages:
5.3.1.1 Define
The Define phase identifies the starting date of each step, its incremental duration, and the total
duration of the construction process. It is important for contractors to layout all the steps they
usually follow in finishing a certain job so that each step can be evaluated individually to
determine to what extent it absorbs resources and generates waste.
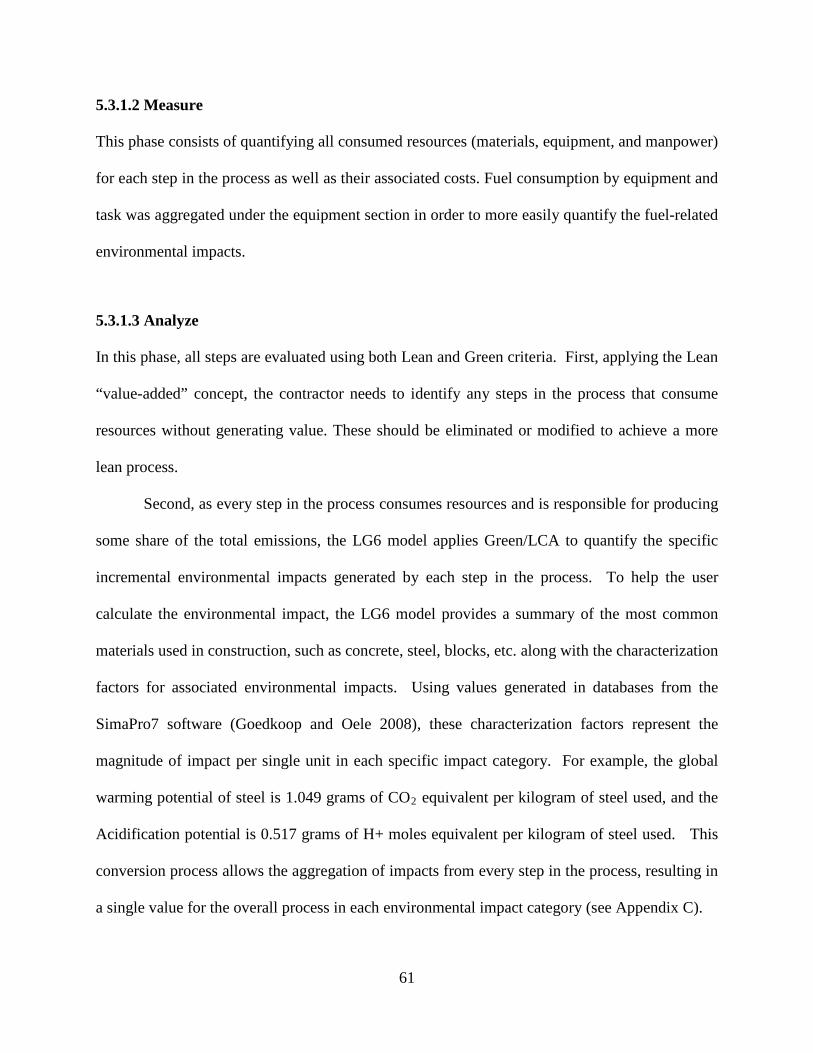
61
5.3.1.2 Measure
This phase consists of quantifying all consumed resources (materials, equipment, and manpower)
for each step in the process as well as their associated costs. Fuel consumption by equipment and
task was aggregated under the equipment section in order to more easily quantify the fuel-related
environmental impacts.
5.3.1.3 Analyze
In this phase, all steps are evaluated using both Lean and Green criteria. First, applying the Lean
“value-added” concept, the contractor needs to identify any steps in the process that consume
resources without generating value. These should be eliminated or modified to achieve a more
lean process.
Second, as every step in the process consumes resources and is responsible for producing
some share of the total emissions, the LG6 model applies Green/LCA to quantify the specific
incremental environmental impacts generated by each step in the process. To help the user
calculate the environmental impact, the LG6 model provides a summary of the most common
materials used in construction, such as concrete, steel, blocks, etc. along with the characterization
factors for associated environmental impacts. Using values generated in databases from the
SimaPro7 software (Goedkoop and Oele 2008), these characterization factors represent the
magnitude of impact per single unit in each specific impact category. For example, the global
warming potential of steel is 1.049 grams of CO2 equivalent per kilogram of steel used, and the
Acidification potential is 0.517 grams of H+ moles equivalent per kilogram of steel used. This
conversion process allows the aggregation of impacts from every step in the process, resulting in
a single value for the overall process in each environmental impact category (see Appendix C).

62
5.3.1.4 Improve
In this phase, the process owner has the opportunity to consider alternatives that offer better
performance in terms of efficiency, economy and/or specific environmental impacts.
Considering the outputs from the Define, Measure, and Analyze stages, the contractor can now
easily identify which steps in the process are most wasteful of time and money and which have
the greatest associated environmental impacts. For example, an improvement might be to use
pile-driving equipment that requires less fuel so as to generate fewer emissions (and
simultaneously save on fuel costs); another suggestion might be to eliminate a non-value adding
step to reduce labor and fuel costs as well as related emissions.
5.3.1.5 Control
The purpose of the control stage is to keep performance at a targeted level. The LG6 uses the
Defect Per Million Opportunities criteria to measure the overall performance of the process.
Applying the DPMO tells how efficiently the process is performing according to the Six-sigma
scale. The output from DPMO is converted to a sigma level, where the more closely the value
approaches the number 6, the fewer defects the process will generate.

63
Figu
re 1
5 O
utlin
e, L
G6
mod
el

64
5.3.2 Case Study
A case study of the pile-driving process was generated to illustrate the functionality of the LG6
model. Specifically, the model was used to evaluate the process for furnishing and driving
approximately 160 woodpiles that were 40 feet long, 14 inches in diameter at the base and 7
inches at the tip into normal soil. This case study was taken from a project recently completed by
a local contractor for a commercial building project in Pittsburgh, PA. All data regarding the cost
of the construction process including materials, workers, transportation and time schedule was
provided by the contractor.
5.4 RESEARCH FINDINGS AND RESULTS:
5.4.1 Define (D)
For the sample case, a total of eight steps and 88 hours were estimated to be required to finish
furnishing and driving 160 woodpiles. The identified steps were: delivering the materials to the
site, driving the equipment to the site, setting up the equipment, taking down the equipment,
moving out the equipment, driving the piles, cutting to length, and cleaning up the site. The step
of driving the piles was the most time-intensive, using 56 labor-hours; while cutting to length
was second, requiring 16 hours of work (see Table 5).

65
Table 5 Define phase explains start dates, process steps and units for the woodpile installation process.
Define (D): Date start Process steps Process Description Value
06/01 D.1 Delivering the woodpiles and the pile points to the job site Distance: 50 miles
06/01 D.2 Driving the equipment to the job site Distance: 30 miles 06/02 D.3 Setting up the equipment Duration: 4 hrs. 06/02 D.4 Taking down the equipment Duration: 4 hrs.
06/02,03 D.5 Moving out the equipment Duration: 4 hrs. 06/04 D.6 Driving the piles Duration: 56 hrs. 06/12 D.7 Cutting to length Duration: 16 hrs. 06/14 D.8 Cleaning up the site Duration: 4 hrs.
Total Process Time Duration in Hours 88 Non-Value added Total Time Duration in Hours 28
Key Legend: Non-Value Added Step Value-Added Step
5.4.2 Measure (M)
The next stage required an assessment of all resources consumed by each step in the construction
process, including materials, equipment, and workers (Table 6).
A- Materials: Quantities and Cost: Only step D.1 “Delivering the woodpiles and the piles
points to the job site” was estimated to consume significant quantities of materials: about 6720 ft.
of woodpiles, and 160 steel pile points at a total cost of $83,795.
B- Equipment, fuel usage, and equipment cost: Both step D.1 “Delivering the woodpiles
and the piles points to the job site” and step D.2 “Driving the equipment to the job site” was
estimated to require trucks to deliver the materials (50 miles away) and the equipment (30 miles
away) to the job site. The delivery costs for materials and equipment was estimated to be
included by the vendor in their respective costs. Step D.6 “Driving the piles” was estimated to
require equipment use representing a total equipment rental cost of $6859 and consuming a total
66
of 4711 gallons of fuel. Step D.7 “Cutting to length” was estimated to use a power saw costing
$523.60 for rental and consuming about 6 gallons of fuel.
C- Workers: no contractor workers were required for steps D.1 “Delivering the woodpiles
and the piles points to the job site”, and D.2 “Driving the equipment to the job site”; however,
the remaining steps in the process each did. Step D.6 “Driving the piles” required a crane
operator (at a higher hourly rate) in addition to general laborers. The total cost for the workers
for this process was estimated at $5371.

67
Table 6 Measure phase explains consumed resources for the woodpile installation process, including materials, equipment, and workers Measure (M):
Process
steps Materials (A) Quantities Unit cost $ Total cost $
M.1.A 1. 160 wooden piles (40 lin. ft.) 6720 ft. 11 72912 2. Pile points 168 pieces 65 10884
M.2.A NA M.3.A NA M.4.A NA M.5.A NA M.6.A NA M.7.A NA M.8.A NA
Total Materials Cost 83,795 Total Materials Cost for Non-Value Added Steps 0
Equipment (B) Fuel
usage in gal.
Cost of equipment usage
Unit cost $ Total cost $
M.1.B 1. NA 2. NA 3.A Truck for materials transportation Include with materials cost
M.2.B 1.A Truck for equipment transportation Include with equipment cost M.3.B NA M.4.B NA M.5.B NA
M.6.B
1. Crane 800 HP. Diesel 2688 82.4 4614.4 2. Leads for hammer NA 14.63 819.28 3. Pile hammer 600 HP. Diesel 2016 10.8 604.8 4. Air compressor 3.0 HP. Gasoline 6.72 14.65 820.4
M.7.B 1. Concrete saw, Gasoline 5.6 HP. 5.4 9.35 523.6 M.8.B 1. Construction cleaning tools (brushes, brooms, etc.) NA NA NA
Total Equipment Cost 7,382.5 Total Equipment Cost for Non-Value Added Steps 523.6
Workers (C) Working
Hours Unit cost
$/hr. Total cost
$ M.1.C NA M.2.C NA M.3.C 1. (2) General laborers 4 15.56 124.48 M.4.C 1. (2) General laborers 4 15.56 124.48 M.5.C 1. (2) General laborers 4 15.56 124.48
M.6.C 1. (1) Crane operator 56 21.67 1386 2. (3) General laborers 56 15.56 2987.52
M.7.C 1. (2) General laborers 7 15.56 497.92 M.8.C 1. (1) General laborers 1 15.56 15.56
Total Workers Cost 5,370.2 Total Workers Cost for Non-Value Added Steps 871.4

68
5.4.3 Analyze (A)
Each step of the woodpile installation process was then evaluated according to Lean criteria to
determine if it added value and by Green criteria to calculate its environmental impacts in each
category (See Table 7).
Lean: Four steps out of the total eight were recognized as non added-value steps, namely
Step D.3 “Setting up the equipment”, Step D.4 “Taking down the equipment”, Step D.5 “Moving
out the equipment”, and Step D.7 “ Cutting to length”. Cutting to length is a task that is
responsible for the kind of materials residual waste typically found in most of the construction
projects reported by EPA 2010 (U.S. Environmental Protection Agency 2003).
Green: Two major sources of potential environmental impacts in this process were
identified: First the estimated materials —both wood and steel—have significant environmental
impacts. Wood shows the highest aggregate impacts in categories such as Carcinogenics,
Respiratory effects, Eutrophication, Eco-toxicity and Smog; while steel reflects greater impacts
in the categories of Global Warming, Acidification, Non-carcinogenics and Ozone depletion. A
second major source of impacts was fuel usage for both transportation and equipment operation.
The crane operation was the highest contributor to Global Warming Potential while driving the
piles ranked second (see Table 7).

69
Table 7 Analyze phase highlights value-added and non value-added steps and addresses environmental impact of the woodpile installation process.
5.4.4 Improve (I)
In this stage, alternatives were generated to replace the previously proposed steps in order to
improve the environmental performance of the woodpile process (See Table 8). It is not
Analyze (A):
Lean Green
Process Steps Value-Added Steps Non Value-Added
Steps Source of Potential Waste/Environmental
Impact to be Analyzed by LCA Inventories
A.1 ✔ A.1.1 Resources usage / Wood 6720 ft.
A.1.2 Resources usage / Steel 2016 kg A.1.3 Transportation/ Diesel 50 miles
A.2 ✔ A.2 Transportation/ Diesel 30 miles A.3 ✖ NA A.4 ✖ NA A.5 ✖ NA
A.6 ✔
A.6.1 Equipment usage/ Diesel 2688 gal NA NA A.6.3 Equipment usage/ Diesel 2016 gal A.6.4 Equipment usage/ Diesel 6.72 gal
A.7 ✖ A.7 Equipment usage/ Diesel 5.4 gal A.8 ✔ NA
Green - Life Cycle Environmental Impact Categories
Item
Global Warming (CO2 eq.)
Acidifica -tion Potential (H+moles eq.)
Carcinog-enics Potential (Benzene eq.)
Non-Carcinogenics Potential (Toluene eq.)
Respirato-ry Effects Potential (PM2.5 eq.)
Eutrophicat-ion Potential (N eq.)
Ozone Depletion Potential (CFC-11 eq.)
Eco toxicity Potential (2.4-D eq.)
Smog Potential (NOX eq.)
A.1.1 -1065098 93808.84 98.9 970641.3 315 39.6 2.81E-06 20099.9 1279 A.1.2 2116 1044 62 110759 4 0.6 7.0825E-
06 249 10
A.1.3 65 23 0.012 195 0.05 0.04 9.6911E-06
9 0.5
A.2 39 14 0.007 117 0.03 0.024 5.8146E-06
5.4 0.3
A.3 NA A.4 NA A.5 NA
A.6.1 4683 3227 11 239336 5 2 1.3081E-06
6646 32
A.6.2 NA A.6.3 3512 2420 9 179502 4 1.7 9.8109E-
07 4985 24
A.6.4 13 8.8 0.03 651 0.01 0.006 3.5594E-09
18 0.09
A.7 10 7 0.02 520 0.01 0.004 2.8444E-09
14 0.07
A.8 NA Total Emiss-ions
-1054660 100552.8
181.2 1501721.5 327.6 44 2.7696E-05
32027.3 1345.7

70
necessary that each step be replaced with a more efficient, environmentally friendly or less costly
alternative; rather, the objective was to let the owner consider what specific alternatives might be
applied that could reduce environmental impacts and improve the bottom-line. For instance,
renting equipment or acquiring material closer to the job site could reduce fuel consumption,
thus lowering costs and emissions. Another alternative is to standardize all piles to a single
length if the topography of the site would allow. This would eliminate the necessity of the extra
work needed to cut all woodpiles to length after driving them, thereby reducing manpower costs,
materials used, fuel consumed and their related impacts.
Table 8 Improve phase discusses alternatives to the process with less environmental impact and better economic returns for the woodpile installation process
Improve (I):
Process Steps
Optional Alternatives (For better process performance)
I.1.1 I.1.2 I.1.3 Purchase materials from a close providers (Less travel distance) I.2 Rent equipment from a close providers (Less travel distance) I.3 I.4 I.5 I.6 I.7 Consider wood piles with same length I.8
5.4.5 Control (C)
This stage evaluated via DPMO the revised method that the contractor actually implemented to
finish installing 168 pieces of woodpiles. According to the Lean criterion, four out of the eight
steps (50%) in the process were considered non value-added steps; because of this, the current
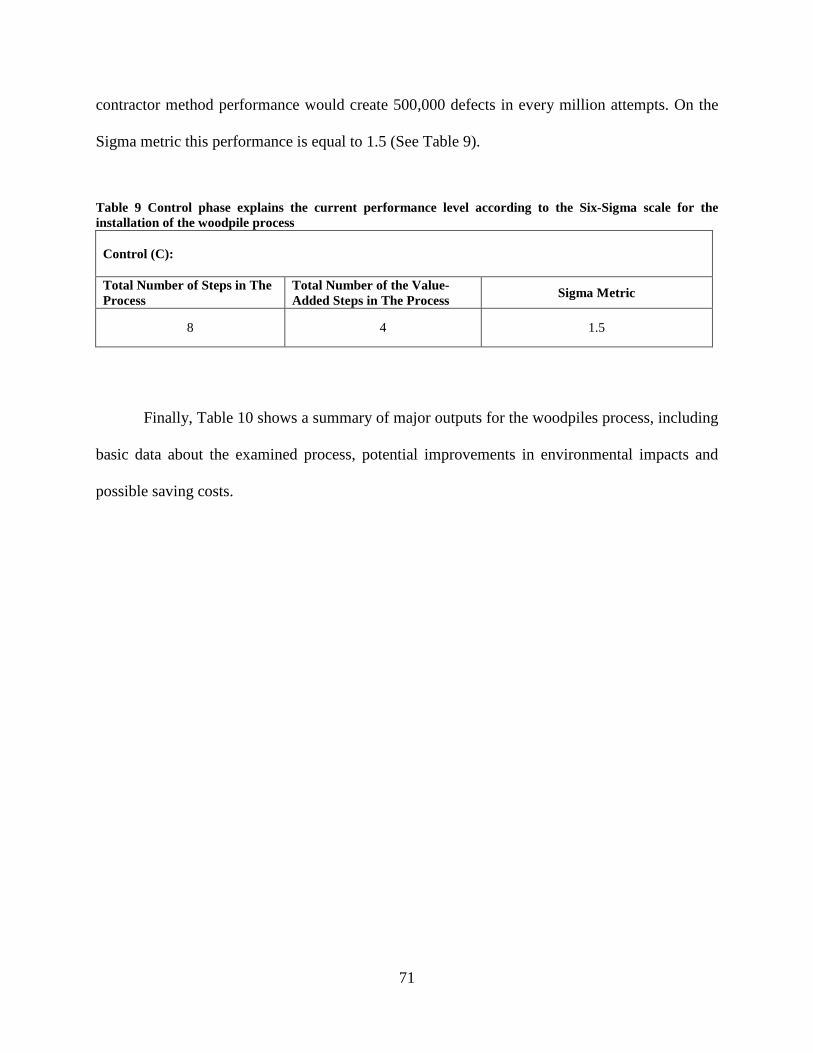
71
contractor method performance would create 500,000 defects in every million attempts. On the
Sigma metric this performance is equal to 1.5 (See Table 9).
Table 9 Control phase explains the current performance level according to the Six-Sigma scale for the installation of the woodpile process
Control (C):
Total Number of Steps in The Process
Total Number of the Value-Added Steps in The Process Sigma Metric
8 4 1.5
Finally, Table 10 shows a summary of major outputs for the woodpiles process, including
basic data about the examined process, potential improvements in environmental impacts and
possible saving costs.

72
Table 10 QCI Process Analysis - Results for the woodpile installation process - Quality, Costs & Impacts
QCI Process Analysis for Installation of Woodpiles
Division Foundation Process Installation of Woodpiles
Total number of steps in the process 8
Total number of non-value added steps in the process 4
Defective per million opportunities 500,000
Sigma Metric 1.5
Total process time (hrs.) 85
Time that might be saved in the process (hrs.) 28
Total process cost ($) 96,547.76
Total saving cost ($) 1394.96
Total saving in materials cost ($) 0
Total saving in equipment cost ($) 523.6
Total saving in workers cost ($) 871.36
Total Environmental Impact
Impact Category Unit
Original process
Value-added steps + Non-value steps
Modified Process
Value-added steps only
Global Warming (CO2 eq.) (1054660.2) (1054670.3)
Acidification (H+moles eq.) 100552.8 100545.8
Carcinogenics (Benzene eq.) 181.2 181.1
Non-carcinogenics (Toluene eq.) 1501721.5 1501201.1
Respiratory effects (PM2.5 eq.) 327.6 327.5
Eutrophication (N eq.) 44.05 44.04
Ozone depletion (CFC-11 eq.) 2.7696E-05 2.7693E-05
Eco toxicity (2.4-D eq.) 32027.3 32012.8
Smog (NOX eq.) 1345.78 1345.71

73
5.5 CONCLUSION
Planning and carrying out projects in the construction industry is distinctly challenging in that
many different resources have to come together to accomplish one goal and the many tasks
involved must be completed in a cost-effective and minimally wasteful manner. Despite the
potential conflicts between these two objectives on any given project, the construction industry
has the opportunity to make improvements to both during each of the specific phases of a
project. This research study seeks to create an innovative yet intuitive and easy-to-use model
that can help improve environmental performance and bottom-line results of construction
processes. Preventing waste before construction has greater benefits than trying either to
eliminate waste “on the fly” or to remediate for it after construction.
For this purpose of preventing waste, a pro-active Lean-Green-Six Sigma improvement
model (LG6) was designed to help contractors and process owners to re-evaluate their traditional
construction methods during the bidding phase to decrease environmental impacts, inefficiencies
and costs. In order to illustrate the LG6 model, a case study of installing 160 of woodpiles was
examined. This single process required eight steps, 88 hours of total process time and $96,548 in
total process costs, prior to implementation of any improvement strategies.
The LG6 model shows that four out of the total eight steps in the woodpiles process were
non value-added, indicating that their elimination or replacement could enhance the performance
of the process by up to twice as much. For instance, in the case study, acquiring woodpiles with
the same length would eliminate the equipment usage and money required to cut all of the
woodpiles to length. Also, the LG6 shows that the costs could be reduced by 1% and greenhouse
gas emissions by 9% if the original process was revised to implement the suggested alternatives.
74
The case-study results in terms of savings might seem insignificant, yet the woodpiles
process is only one construction process that is often integrated with other non-optimized
processes. Evaluation of all of the steps in a project, then, and use of alternatives suggested by
LG6 could result in more significant aggregate savings in money, time, and environmental
impacts.
In conclusion, the LG6 model is a comprehensive, step-wise tool that can help any
process owner to pre-plan the process, highlighting any potential waste generators early so they
can be avoided. The LG6 model is easy to implement, provides tangible results, addresses
multiple applicable alternatives, provides for performance control and continuous improvement,
and above all, is proactive.
75
6.0 CONCLUSION
6.1 SUMMARY
This work exhibits the use and benefit of a novel approach to construction evaluation,
combining three different approaches into one common system and using this system in an
untapped sector to improve the environmental performance of the construction processes during
and prior to the construction phase. The construction sector is a major materials consumer and
major contributor to environmental impacts around the globe. For that purpose two methods
were developed and applied during and prior to the construction phase, a 3-step framework and
an improvement model. The two methods integrate Lean, Green, and Six-Sigma with the help of
the DMAIC improvement model.
The 3-step framework was validated via a case study performed to evaluate and improve
a pile caps construction process for an educational institute project in Pittsburgh, Pennsylvania.
Two issues were revealed by the framework: extra inventory and a 23-day delay. Then, the
environmental impacts of the pile caps process were analyzed using LCA. LCIA results show
that the material for the pile caps construction process was the highest contributor to the
environmental impact in five out of nine categories. The potential causes for waste in pile caps
were collected and ranked through a survey developed for and administered by a construction
consultant company in Pittsburgh. Results from the questionnaire suggested that 60% of the time

76
“Design changes during construction” leads to waste in projects, which matches what has been
reported by professionals and industry in the literature.
The previous framework was further validated via a study looking at how to improve an
exterior painting construction process for a residential complex in Saudi Arabia. A major defect,
blistering, was identified. Then the associated environmental impacts of the painting construction
process were analyzed. The materials production phase was found to be the highest contributor
in almost all of the environmental impact categories. Potential causes of waste were identified
and ranked using a Pareto chart as follows: Inadequate procedure at 43%, Untrained workers at
31%, Unfavorable weather condition at 19% and Other at 7%. A modified process was then
developed using Process improvement method to overcome these variables and then applied to
two units. The modified process was able to deliver units that were not rejected, reducing the
overall project waste and associated environmental impacts.
A pro-active improvement model (LG6) was then designed to help contractors and
process owners to reevaluate their traditional processes to decrease environmental impacts and
increase the bottom-line prior to construction. A case study of installing 160 of woodpiles was
implemented to examine the LG6 model. In order to finish this job, eight steps were required.
The total process time was 88 hours and the total process cost was $96,547.76. The LG6 model
shows that four out of the total eight steps in the woodpiles process were non value-added steps
replacing these steps with better alternatives would enhance the performance of the process,
where costs could be reduced by 1% and emissions by 9%.

77
6.2 RECOMMENDATIONS FOR FUTURE WORK
Construction is a challenging field, where activities require careful planning and effective
management. As sustainability becomes more of an issue worldwide, in addition to meeting the
budget and time estimates during early phases, projects must also now consider achieving other
objectives such as reducing the environmental impacts of construction activities.
The framework and LG6 model developed in this study can help to achieve the desired
benefits given two important conditions: first, the commitment of the upper management and all
the people involved in any improvement effort must be obtained. Without their support and
participation it is not possible to achieve improvements. A second important condition is that the
implementation of improvement actions be carefully planned. Carefully implementing will
require time and effort, yet it is very important for accurate results.
Aspects for future consideration are as follows: first is how to integrate these
methodologies to be part of work producer in one of the early phases in a project, i.e., the
planning, designing, or bidding phase, most effectively. Second is to consider applying these
methodologies to Design-Build (DB) type of projects, where the contractor is involved with the
process from the beginning as this might increase the benefits of applying the developed tool. A
third possibility to consider is applying the methodologies to improve a construction process that
is already known to be a major source of waste during the construction phase. Fourth, the
construction firms might develop a plan that deals with extra inventory. Finally, the
environmental impacts that change orders might be responsible for must be included as a
consideration for decision-making on the part of the producer in addition to other concerns such
as budget and time. Using the life cycle assessment method would help the decision makers

78
evaluate change orders environmental impacts to reach a change order that has minimal
environmental impact.

79
7.0 ACKNOWLEDGEMENTS
The authors wish to thank the Ministry of Higher Education, Saudi Arabia for the support and
efforts provided through King Abdullah Scholarships Program. Also the authors would like to
thank the Royal Commission of Industrial Yanbu for their help providing data for the case study
in this research.

80
APPENDIX A
A.1 PROPOSAL 1, LEAN, GREEN, AND SIX-SIGMA FRAME WORK

81
A.2 PROPOSAL 2, LEAN, GREEN, AND SIX-SIGMA FRAME WORK

82
A.3 PROPOSAL 3, LEAN, GREEN, AND SIX-SIGMA FRAME WORK

83
APPENDIX B
B.1 CASE STUDY: QUESTIONNAIRE DEVELOPMENT PHASES
A questionnaire was developed including 16 major causes that narrowed down from 51 causes
for generating waste during construction from different resources including construction
companies, professionals, educational institute, and literature review, to help identified the ones
that occur in most projects.

84
B.2 A LIST OF COMMON CAUSES FOR WASTE GENERATION IN
CONSTRUCTION PROJECTS ADDRESSED BY INDUSTRY, PROFESSORS OF
PRACTICE, AND THE LITERATURE
Waste Source Category
Cause
References
Industry Professors of
practice
Literature
Labor
1. Untrained workers ✓ ✓ 2. Errors by laborers ✓ ✓ ✓ 3. Lack of teamwork ✓ ✓ ✓ 4. Inexperienced designer ✓ ✓ ✓ 5. Lack of influence of contractors and lack of
knowledge about construction ✓
6. Contractor unfamiliarity with the project/site location
✓
7. Poor fabrication ✓
Measures
8. Ordering errors (too much/too little) ✓ ✓ ✓ 9. Errors by suppliers ✓ ✓ ✓ 10. Lack of possibilities to order small quantities
of materials ✓ ✓
11. Over mixing of materials for wet trades due to lack of knowledge of requirements
✓
12. Designer is not familiar with possibility of different products
✓
13. Offcuts from cutting materials to length ✓ ✓ 14. Conversion waste from cutting uneconomical
shapes ✓
15. Poor Project Estimate ✓ ✓
Materials
16. Damages during transportation to site/onsite ✓ ✓ ✓ 17. Damages subsequent ✓ ✓ ✓ 18. Materials do not comply with specifications ✓ ✓ ✓ 19. Low quality materials ✓ 20. Having materials from whatever place that
close to the site ✓
21. Choices about specifications of products ✓ 22. Use of products that do not fit ✓ 23. Use of incorrect materials that need
replacement ✓
24. Poor materials preparation for concrete ✓ ✓ 25. Difficulty controlling quantities for materials
such as concrete ✓
26. Poor scheduling ✓ ✓ 27. Delay of passing information to the contractor ✓ ✓ ✓

85
B.2 (CONTINUED)
Waste Source Category Cause
References
Industry Professors of
practice
Literature
Method
28. Design changes during construction ✓ ✓ ✓ 29. Errors in contract documents ✓ ✓ ✓ 30. Inappropriate storage leading to damage ✓ ✓ ✓ 31. Contract documents are not complete at
commencement of construction ✓ ✓
32. Method to lay foundation ✓ 33. Waste from application process ✓ 34. Complexity of detailing in the drawings ✓ 35. Complexity of the design ✓ ✓ 36. Lack of information in the drawings ✓ 37. Unpacked supply ✓ 38. Lack of on-site control and management ✓ ✓ 39. Materials placed in the wrong place on site ✓ 40. Lack of quality inspection ✓ ✓ 41. Choosing qualified contractor during the bid
process ✓ ✓
Uncontrollable events
42. Bad weather ✓ ✓ ✓ 43. Unexpected injuries on construction site ✓ ✓ ✓ 44. Criminal waste due to damage or theft ✓ 45. Natural disaster ✓ 46. Lack of basic services near to project location ✓
Machines
47. Use of low quality tools ✓ ✓ ✓ 48. Use of sophisticated technology ✓ ✓ ✓ 49. Equipment malfunction ✓ ✓ 50. Untrained equipment operators ✓ 51. Poor equipment maintenance ✓ ✓
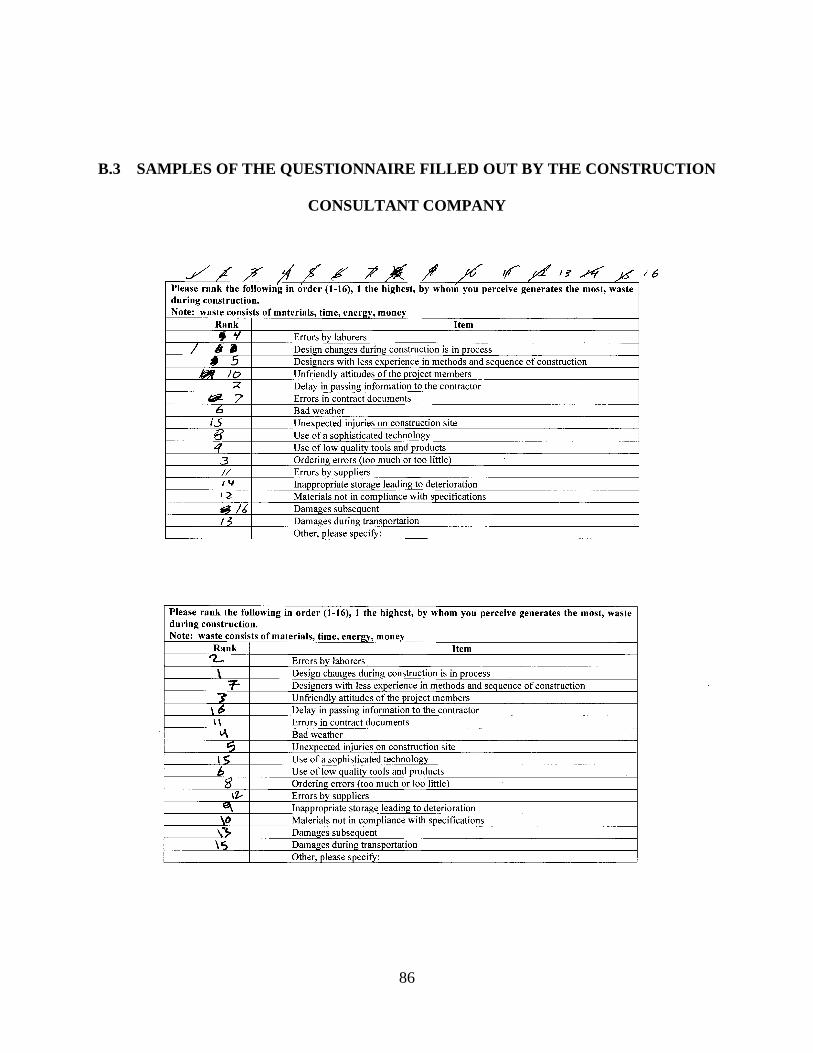
86
B.3 SAMPLES OF THE QUESTIONNAIRE FILLED OUT BY THE CONSTRUCTION
CONSULTANT COMPANY

87
B.3 (CONTINUED)

88
B.3 (CONTINUED)

89
Table B- 1 Rating system used to calculate factors causing the most construction waste based on the
questionnaire
Survey No. A B C D E F G H I J K L M N O P
1 6 12 3 1 1 1 1 1 1 1 1 1 1 1 1 1 2 3 12 1 1 6 1 1 1 1 1 1 1 1 1 1 1 3 12 6 1 1 1 1 1 1 1 1 1 1 1 1 1 3 4 3 12 1 1 1 1 1 1 1 1 1 1 1 1 6 1 5 1 12 1 1 6 1 1 3 1 1 1 1 1 1 1 1 6 6 3 1 1 12 1 1 1 1 1 1 1 1 1 1 1 7 6 1 3 1 12 1 1 1 1 1 1 1 1 1 1 1 8 1 6 1 1 12 1 1 1 1 1 1 1 3 1 1 1 9 6 12 1 3 1 1 1 1 1 1 1 1 1 1 1 1 10 3 12 1 1 1 1 1 1 1 1 1 1 1 1 6 1 11 3 12 1 1 1 1 1 1 1 1 1 1 1 1 1 6 12 3 12 1 1 6 1 1 1 1 1 1 1 1 1 1 1 13 1 12 1 1 3 1 1 1 1 1 6 1 1 1 1 1 14 1 6 1 1 12 1 1 1 1 1 1 1 1 3 1 1 15 1 6 1 1 3 1 1 1 1 1 12 1 1 1 1 1 16 1 12 1 6 1 1 1 1 1 1 1 1 1 1 1 1 17 1 3 1 1 12 1 1 1 1 1 1 1 1 1 6 1 18 3 6 1 1 12 1 1 1 1 1 1 1 1 1 1 1 19 6 12 1 1 1 1 3 1 1 1 1 1 1 1 1 1 20 12 3 1 1 1 1 1 1 1 1 1 1 6 1 1 1 21 1 12 1 1 1 6 1 1 1 1 3 1 1 1 1 1 22 1 3 1 1 6 1 1 1 1 1 1 1 1 1 1 12 23 1 6 1 1 3 1 1 1 1 1 1 1 1 1 12 1 24 1 6 1 1 3 1 1 1 1 1 1 1 1 1 12 1 25 1 3 1 1 12 1 1 1 1 1 1 6 1 1 1 1 26 1 12 1 1 6 1 1 1 1 1 3 1 1 1 1 1 27 3 12 1 1 6 1 1 1 1 1 1 1 1 1 1 1 28 6 1 12 1 3 1 1 1 1 1 1 1 1 1 1 1 29 1 6 1 1 1 12 1 1 1 1 3 1 1 1 1 1 30 1 12 1 1 6 1 1 1 1 1 1 1 1 1 3 1 Total 96 245 50 32 152 46 32 34 30 30 52 35 37 32 69 48 Scoring: 1st = 12 points , 2nd = 6 points , 3rd = 3 points , 4th – 16th = 1 point
Key Legend:
A. Errors by laborers. B. Design changes during construction. C. Designers with less experience in methods and sequence of construction. D. Unfriendly attitude of the project members. E. Delay in passing information to the contractor. F. Errors in contract documents. G. Bad weather. H. Unexpected injuries on construction site. I. Use of sophisticated technology. J. Use of low quality tools and products. K. Ordering errors (too much or too little). L. Errors by suppliers. M. Inappropriate storage leading to deterioration. N. Materials not in compliance with specifications. O. Damage subsequent. P. Damages during transportation.

90
B.4 CASE STUDY: DATA INPUT USED FOR THE PILE CAP PROCESS
• Total number of pile caps for the MSCI project was 17. Some pile caps were 8” ×
8” thick and some were 6” x 4” thick.
• Required quantity and type of equipment used for the construction of the pile cap
process was based on RS means (2009).
• Duration for equipment usage was taken from the contractor’s project scheduling
information.
• Data for construction materials was from the final construction reports, which
included both the estimated and the actual quantities.
• Transportation included a 28-ton truck to deliver the form materials and waste,
and a 32-ton concrete truck to deliver the concrete (213 kilometer).
• The data input involved several types of equipment: the excavator, the concrete
pump, and the concrete vibrator. The data sources for these pieces of equipment
are from the process LCA.
• The amount of fuel used in gallons was determined by multiplying the actual
working hours by horsepower by 0.04 for the diesel equipment and by
multiplying actual hours by horsepower by 0.06 for the gasoline equipment
(Peurifoy and Schexnayder 2002).

91
B.5 CASE STUDY: MATERIALS QUANTITIES FOR PILE CAP PROCESS
MCSI - Quantities Tracked Quantity
Division Category (If Applicable) Cost Item Unit Estimated Actual 02 - Site Construction General Conditions Shoring / Scaffolding SF 1334 1034
Concrete Demolition
Demo SOG - Sub-Basement SF 544 544 Demo Slab - Basement SF 939 400 Demo Slab - Plaza SF 1700 7910 Demo - Salvage Planters / Stairs LS 1 1 Rework Pavers / Off-Site Storage LS 1 1 Demolition Interior Demo - Sub & Basement 2500 2500 Structural Excavation &
Backfill Interiors 227 120
Exterior Pile Caps LS 619 1 Site Furnishings Site Furnishings - Allowance LS 1 1 03 - Concrete
General Conditions
Misc. Formwork and Lumber LS 1 1 Concrete Pump Days 48 48 Concrete Pump Slick Lines MD 32 22 Cranes (< 50 Tons) Month 6 7 Stone Subbase Material LS 1 1 Concrete Reinforcement Reinforcing Steel LS 1 1 Misc. Reinforcing Materials LS 1 1 Pile Caps Pour / F / C Pile Caps CY 228 225 Pile Cap Form 2428 1200
Columns
Concrete (w/ waste) CY 205 268.5 A-Line Columns SF 932 5526
Basement & Sub-Basement Columns SF 2703 2698
K-Wall SF 2350 1290 Y-Column SF 1188 736 Typical Bldg Column SF 5688 2088 Rub Columns SF 9323 9580 Spray Cure SF 9323 9323
Concrete Walls - Handset
Handset LS 1 1 Concrete CY 168.52 19 Wall Forms > 8' High Curbs SF 4550 2175 Finish Top of Wall SF 0 54 Knock Fins & Patch SF 4550 4550 Rub Finish SF 4550 4550

92
B.5 (CONTINUED)
MCSI - Quantities Tracked Quantity
Division Category (If Applicable) Cost Item Unit Estimated Actual Sub-base for Slab Work Stone Sub-base Tons 348 350 Fine Grade Stone Sub-base SF 4700 4700
Slab on Grade Concrete CY 128 86
Edge Form LF 1100 962 Drill Dowels Ea 840 473

93
APPENDIX C
C.1 CASE STUDY LOCATION: SAUDI ARABIA
Figure C- 1 Location for the three residential projects in MYAS

94
C.2 ADDITIONAL PHOTOS FOR RESIDENTIAL UNITS SHOWING PAINT
BLISTERING AND PAINTING PROCESS EQUIPMENT

95
C.3 FINAL CHECK SHEET SHOWING MAJOR PAINTING BLISTERING CAUSES
PROJECT NAME: ROYAL COMMISSION PUBLIC HOUSING (PHASE 4)
LOCATION: INDUSTRIAL YANBU, SAUDI ARABIA
HAII AL-FAISAL HARRAH 1 NUMBER OF TOTAL UNITS: 53
Unit
Causes of Error (Blistering in Exterior Painting) 1- Workers - Preparation of Materials - Execution of Training
2- Method: Current Process: 1- Plastering 2-applying primer sealer 3- Applying Paint
3- Weather Conditions: - High Temperature - Humidity - Dust
4- Other - Structural (Cracks) - Plumbing
1/30 × 2/30 × 3/30 × 4/30 × 5/30 × 6/30 × 7/30 ✔
8/30 × 1/31 × 2/31 ✔
3/31 ✔
4/31 ✔
5/31 × 6/31 × 7/31 × 8/31 × 9/31 × 10/31 ✔
1/32 ✔
2/32 ✔
3/32 × 4/32 × 5/32 × 6/32 × 7/32 × 8/32 × 1/33 ×

96
C.3 (CONTINUED)
PROJECT NAME: ROYAL COMMISSION PUBLIC HOUSING (PHASE 4)
LOCATION: INDUSTRIAL YANBU, SAUDI ARABIA HAII AL-FAISAL HARRAH 1 NUMBER OF TOTAL UNITS: 53
Unit Causes of Error (Blistering in Exterior Painting)
1- Workers - Preparation of Materials - Execution of Training
- Method: Current Process: 1- Plastering 2-applying primer sealer 3- Applying Paint
- Weather Conditions: - High Temperature - Humidity - Dust
4- Other - Structural (Cracks) - Plumbing
2/33 × 3/33 × 4/33 × 5/33 × 6/33 × 7/33 × 8/33 × 9/33 × 10/33 × 11/33 × 12/33 × 13/33 × 15/33 ✔
17/33 ✔
1/34 × 2/34 × 3/34 × 4/34 × 5/34 × 6/34 × 7/34 × 8/34 × 9/34 × 10/34 × 11/34 ✔
12/34 ✔
No. Of Defects 13 18 8 3 Total Number of Defects 42 Total Number of Checks 11 Total Number of checks/Opportunities for defects 53 Defective Per Million Opportunities (DPMO) 792,453 Six-Sigma level 1 out of
6

97
C.4 CASE STUDY: MODIFIED PROCESS INCLUDING THE TWO STEPS ADDED
POST-EVALUATION
Finishing works Exterior Painting
Project Name: HOP Location: Haii Al-Faisal Harah 1 Unit Number: xxxxxxx Date: Time: Unit Type: Scope of work:
Step 1: Pre-Plaster: To prevent any humidity reaching the outside surface from inside the building. Comment:
Step 2:Plaster: 2.5 mm thickness. Comment:
Step 3:Clean the outside surface: To remove dust or any other element which could lead to blistering in paint. Comment:
Step 4:Apply primer sealer: for surface leveling (if applicable) Comment:
Step 5:Apply paint: 2 coats Comment:

98
C.5 CASE STUDY: MATERIAL QUANTITIES AND PRICES

99
C.5 (CONTINUED)

100
APPENDIX D
D.1 APPLYING LG6 IN PRE-CONSTRUCTION PHASE

101
D.2 CONSTRUCTION MATERIALS AND ASSOCIATED ENVIRONMENTAL
IMPACTS IN THE LG6 MODEL
To help the user calculate environmental impact, the LG6 model provides a summary of the
characterization factors for associated environmental impacts for the most common materials
used in construction, such as concrete, steel, blocks, etc. Using values generated in the SimaPro7
software, these characterization factors represent the magnitude of impact per single unit in each
specific impact category. For example, the global warming potential of steel is 1.049 grams of
CO2 equivalent per kilogram of steel used, and the Acidification potential is 0.517 grams of H+
moles equivalent per kilogram of steel used. This conversion process allows the aggregation of
impacts from every step in the process, resulting in a single value for the overall process in each
environmental impact category.

102
Figure D- 1 Construction materials in LG6 model and associated environmental impacts using
TRACI

103
BIBLIOGRAPHY
Al-Jarallah, M. (1983). "Construction Industry In Saudi Arabia " Journal of Construction
Engineering and Management 109(4): 355-368.
Al-Nagadi, M. (2007). Conccrete Construction Industry-Cement Based Materials and Civil
Infrastructure International Workshop - Cement Based Materials and Civil Infrastructure
Pakistan
Al-Sudairi, A. (2007). "Evaluating the effect of construction process characteristics to the
applicability of lean principles " Construction Innovation 7(1): 99-121.
Al-Swat, A. (2009). "Developing a comprehensive program to deal with the problem of
construction waste in Saudi Arabia."
Arbulu, R. and I. Tommelein (2002). Value stream analysis of construction supply chains: case
study on pipe supports used in power plants. International Group for Lean Construction
University of California
Arditi, D. and M. Gunaydin (1997). "Total quality management in the construction process."
International Journal of Project Management 15(4): 235-243.
Assaf, S. and S. Al-Hejji (2006). "Causes of delay in large construction projects " International
Journal of Project Management 24(10): 349-357.
Ampofo-Anti, N. (2009). "The environmental impacts of construction materials use: a life cycle
perspective ." Green Buildinghandbook South Africa 1: 1-9.
Ballard, G. and G. Howell (1997). "Implementing lean construction: improving downstream
performance." Lean construction: 111-125.
Banawi, A. and M. Bilec (2013). "A Framework to Improve Construction Processes: Integrating
Lean, Green, and Six-Sigma " International Journal of Construction Management (Under
review).
Baumann, H. and A. Marie (2004 ). The Hitch Hiker's Guied to LCA Lund, Sweden,
Studentlitteratur.

104
Beary, M. and T. Abdelhamid (2005). Production planning process in residential construction
using lean construction and six sigma principles. Proceedings of the Construction
Research Congress, San Diego, CA.
Bilec, M., R. Ries, et al. (2010). "Life-Cycle Assessment Modeling of Construction Processes for
Buildings." Journal of Infrastructure Systems 16(3): 199-205.
Bilec, M., R. Ries, et al. (2006). "Example of a Hybrid Life-Cycle Assessment of Construction
Processes." Journal of Infrastructure Systems 12(4): 207-215.
Bossink, B. and H. Brouwers (1996). "Construction Waste: Quantification And Source
Evaluation " Construction Engineering and Management 122(1): 55-60.
Chase, G. (1998). "Improving construction methods: A story about quality." Journal of
Management in Engineering 14(3): 30-33.
Chung, S. and C. Lo (2003). "Evaluating sustainability in waste management: the case of
construction and demolition, chemical and clinical wastes in Hong Kong." Resources,
conservation and recycling 37(2): 119-145.
Consultants, P. (2004). The BUWAL 250 library.
Da CL Alves, T., D. Tommelein, et al. (2005). Value stream mapping for make-to-order products
in a job shop environment, Construction Research Congress.
Dainty, A. and R. Brooke (2004). "Towards improved construction waste minimisation: a need
for improved supply chain integration?" Structural Survey 22(1): 20-29.
Degani, C. and F. Cardoso (2002). Environmental Performance and Lean Construction Concepts:
Can We Talk about A Clean Construction. Proceedings IGLC.
Dubois, A. and L.-E. Gadde (2002). "The construction industry as a loosely coupled system:
implications for productivity and innovation." Construction Management & Economics
20(7): 621-631.
Dulaimi, M., F. Ling, et al. (2002). "Enhancing integration and innovation in construction."
Building Research & Information 30(4): 237-247.
Ekanayake, L. and G. Ofori (2000). Construction Material Waste Source Evaluation. Strategies
for a Sustainable Built Environment.
Fontanini, P. and F. Picchi (2004). "value stream macro mapping- a case study of aluminum
windows for construction supply chain ".
Formoso, C., L. Soibelman, et al. (2002). "Material waste in building industry: main causes and
prevention." Journal of Construction Engineering and Management 128(4): 316-325.

105
Ganesan, S. (1984). "Construction productivity." Habitat International 8(3): 29-42.
Gann, D. (1996). "Construction as a manufacturing process-Similarities and differences between
industrialized housing and car production in Japan." Construction Management &
Economics 14(5): 437-450.
Garrett, D. and J. Lee (2011). "Lean Construction Submittal Process." Quality Engineering,
Taylor & Francis 23(1): 84-93.
Greg Norris - Sylvatica (2004). The Franklin US LCI library.
Goedkoop, M. and M. Oele (2008). SimaPro Database Manual, Product ecology consultants.
Guggemos, A. and A. Horvath (2005). "Comparison of Environmental Effects of Steel- and
Concrete-Framed Buildings." Journal of Infrastructure Systems 11(2): 93-101.
Han, S., M. Chae, et al. (2008). "Six Sigma-Based Approach to Improve Performance in
Construction Operations." Journal of Management in Engineering 24(1): 21-31.
Herbsman, Z. and R. Ellis (1990). "Research of factors influencing construction productivity."
Construction Management and Economics 8(1): 49-61.
Hill, R. and P. Bowen (1997). "Sustainable construction: principles and a framework for
attainment." Construction Management & Economics 15(3): 223-239.
Horowitz, D. (2001). Construction Quality. Professional Builder (1993). 66: 35.
Howell, G. and G. Ballard (1998). Implementing lean construction: understanding and action.
Proc. 6 th Ann. Conf. Intl. Group for Lean Constr.
Howell, G. (1999). What is lean construction - 1999. IGLC International Group for Lean
Construction
Hsiao, T., Y. Huang, et al. (2002). "Modeling materials flow of waste concrete from construction
and demolition wastes in Taiwan." Resources Policy 28(1): 39-47.
Huovila, P., L. Koskela, et al. (1997). "Fast or concurrent: the art of getting construction
improved." Lean construction: 143-159.
International Organization for Standardization (2006). "14040 Environmental management-Life
cycle assessment-Principles and Framework." International organization for
standardization.
Kagioglou, M., R. Cooper, et al. (2001). "Performance management in construction: a conceptual
framework." Construction Management & Economics 19(1): 85-95.

106
Kibert, C. (2007). Sustainable construction: Green building design and delivery, wiley.
Klee, H. and E. Coles (2004). "The cement sustainability initiative‚implementing change across
a global industry." Corporate Social Responsibility and Environmental Management
11(2): 114-120.
Kolarik, W. (1995). Creating quality: concepts, systems, strategies, and tools, McGraw-Hill New
York.
Koskela, L. (1992). Application of the New Production Philosophy to Construction. Centre for
Integrated Facility Engineering - Technical Report, Standford University.
Lam, P., E. Chan, et al. (2009). "Integrating green specifications in construction and overcoming
barriers in their use." Journal of Professional Issues in Engineering Education and
Practice 135(4): 142-152.
Lapinski, A., M. Horman, et al. (2006). "Lean Processes for Sustainable Project Delivery."
Journal of Construction Engineering and Management 132(10): 1083-1091.
Lee, S., J. Diekmann, et al. (1999). Identifying waste: applications of construction process
analysis. Proceedings of the Seventh Annual Conference of the International Group for
Lean Construction.
Li, X., Y. Zhu, et al. (2010). "An LCA-based environmental impact assessment model for
construction processes." Building and Environment 45(3): 766-775.
Love, D., J. Edwards, et al. (2009). "Project Pathogens: The Anatomy of Omission Errors in
Construction and Resource Engineering Project." Engineering Management, IEEE
Transactions on 56(3): 425-435.
Mawby, W. (2005 ). Decission Process Quality Management USA William A. Tony
Mehta, M., W. Scarborough, et al. (2008 ). Building Construction USA, PEARSON
Mohamed, S. (1996). "Benchmarking and improving construction productivity." Benchmarking
for Quality Management & Technology 3(3): 50-58.
Munro, R., M. Maio, et al. (2008). The Certified Six Sigma Green Belt. India, Dorling
Kindersley Publishing Inc.
Nahmens, I. (2009). From Lean to Green Construction: A Natural Extension. Building a
Sustainable Future Seattle, Washington ASCE.
National Renewable Energy Laboratory (2004). U.S.Life Cycle Inventory Database.

107
Oguz, C., Y. Kim, et al. (2012). "Implementing Lean Six Sigma: A case study in concrete panel
production." Proceedings of IGLC-20, San Diego, CA.
Ohno, T. (1990). Toyota production systems: beyond large-scale production Tokyo.
Ortiz, O., F. Castells, et al. (2009). "Sustainability in the construction industry: A review of
recent developments based on LCA." Construction and Building Materials 23(1): 28-39.
Pande, P., R. Neuman, et al. (2000). The six sigma way. How GE, Motorola, and other top
companies are honing their performance McGraw-Hill.
Pasqualini, F. and P. Zawislak (2005). Value Stream Mapping in Construction: A Case Study in
a Brazilian Construction Company. 13th International Group for Lean Construction
Conference: Proceedings. R. Kenley. Sydney, International Group on Lean Construction:
117-125.
Peurifoy, R., W. Ledbetter, et al. (2002). "Construction, planning, equipment, and methods,
McGraw-Hill." New York.
Peurifoy, R. and G. Oberlender (2002). Estimating Construction Cost New York, NY, McGraw-
Hill
Pheng, L. and M. Hui (2004). "Implementing and Applying Six Sigma in Construction." Journal
of Construction Engineering and Management 130(4): 482-489.
Poon, C., A. Yu, et al. (2004 ). "Reducing Building Waste at Construction Sites in Hong Kong "
Construction Management and Economics 22(5): 461-470.
Portland Cement Association. (2012). "Cement Industry overview " Retrieved January 2013,
from http://www.cement.org/econ/industry.asp.
RSMeans (2010). RSMeans Building Construction Cost Data Kingston, MA
Rolf, F. and R. Gerald "The ecoinvent database system: a comprehensive web-based LCA
database." Journal of Cleaner Production 13(13-14): 1337-1343.
Romm, J. (1994). Lean and Clean Management New York , NY, Kodansha America, Inc. .
Rojas, e. and P. Aramvareekul (2003). "Labor Productivity Drivers and Opportunities in the
Construction Industry." Journal of Management in Engineering 19(2): 78-82.
S. A. - Minstry of Economy and Planning (2012). Saudi Arabia: Economic Indicators (2004 -
2011). Riyadh, SA
S. A. Minstry of Finance. (2011, 20 December 2010). "Recent Economic Developments and
Highlights of Fiscal Years 1431/1432 (2010) &1432/1433 (2011)." Retrieved

108
December, 2012, from
http://www.mof.gov.sa/English/DownloadsCenter/Budget/Statement
Salem, O., J. Solomon, et al. (2006). "Lean Construction: From Theory to Implementation."
Journal of Management in Engineering 22(4): 168-175.
Sandler, K. (2003). "Analyzing What's Recyclable in C&D Debris " BioCycle 51-54.
Saudi National Commercial Bnak. (2011). "In Focus Report, Saudi Construction Sector Review
" Retrieved November, 2012, from
http://www.menafn.com/updates/research_center/Saudi_Arabia/Special_Ed/ncb250710.p
df.
Sayer, N. and B. Williams (2007). Lean For Dummies. New Jersey, Wiley Publisher, Inc.
Serpell, A. and L. Alarcun (1998). "Construction process improvement methodology for
construction projects." International Journal of Project Management 16(4): 215-221.
Sharrard, A., H. Matthews, et al. (2008). "Estimating Construction Project Environmental Effects
Using an Input-Output-Based Hybrid Life-Cycle Assessment Model." Journal of
Infrastructure Systems 14(4): 327-336.
Shash, A. and N. Abdul-Hadi (1992). "Factors affecting a contractor's mark-up size decision in
Saudi Arabia." Construction Management and Economics 10(5): 415-429.
Shen, L., V. Tam, et al. (2004). "Mapping approach for examining waste management on
construction sites." Journal of Construction Engineering and Management 130(4): 472-
481.
Stewart, A. and A. Spencer (2006). "Six-sigma as a strategy for process improvement on
construction projects: a case study." Construction Management & Economics 24(4): 339-
348.
Swiss Centre for Life Cycle Inventories (1997). ecoinvent database ecoinvent centre.
Tatum, B. (1987). "Improving constructibility during conceptual planning." Journal of
Construction Engineering and Management 113(2): 191-207.
The Commercial Bank of Qatar Q.S.C. (2012 ). Qatar Construction Sector Doha State of Qatar
Thomas, H., M. Horman, et al. (2002). "Reducing variability to improve performance as a lean
construction principle." Journal of Construction Engineering and Management 128(2):
144-154.
109
Tilley, P. (2005). Lean Design Management: A New Paradigm for Managing the Design and
Documentation Process to Improve Quality? 13th International Group for Lean
Construction Conference: Proceedings, International Group on Lean Construction.
U.S. Census Bureau (2010). Labor Force, Employment, & Earnings by Industry. Washington,
DC.
U.S. Department of Commerce (2010). Gross-Domestic-Product-(GDP)-by-Industry Data.
Washington, DC.
U.S. Environmental Protection Agency (2003). Construction and Demolition Materials Amounts.
Washington, DC: 1-27.
U.S. Environmental Protection Agency (2004). RCRA in Focus: Construction, Demolition, and
Renovation
U.S. Environmental Protection Agency (2007). Measuring Construction Industry Environmental
Performance
U.S. Environmental Protection Agency (2010). Fine Particle (PM2.5) Designations.
U.S. Environmental Protection Agency. (2010). "Tool for the Reduction and Assessment of
Chemical and Other Environmnetal Impacts (TRACI) " Retrieved January 2013, from
http://www.epa.gov/nrmrl/std/traci/traci.html.
U.S. Environmental Protection Agency. (2009, 1/23/2012). "Buildings and their Impact on the
Environmental: A Statistical Summary " Retrieved October, 2012 from
http://www.epa.gov/greenbuilding/pubs/gbstats.pdf.
U.S. Green Building Council USGBC (2009). Green Associate Study Guide and Core Concepts
Guide. Washington DC
U.S.Energy Information Adminstartion (2010 ). Annual Energy Review 2009. Washington, DC
U.S. Saudi Arabian Business Council (2009). The Construction Sector in the Kingdome of Saudi
Arabia Vienna, VA
Ventures middle east (2011). The Saudi Construction Industry Jeddah, SA.
Wang, L. (2008 ). "Enhancing construction quality inspection and management using RFID
technology " Automation in Construction - ELSEVIER 17(4): 467-479.
Winch, G. (2003). "Models of manufacturing and the construction process: the genesis of re-
engineering construction." Building Research & Information 31(2): 107-118.

110
Womac, J. and D. Jones (2003). Lean Thinking: Banish Waste and Create Wealth in Your
Corporation New York, NY, Free Press.
Womac, J., D. Jones, et al. (1990). The Machine that Changed the World: the story of lean
production New York, NY HarperCollins
Yu, H., T. Tweed, et al. (2009). "Development of Lean Model for House Construction Using
Value Stream Mapping." Journal of Construction Engineering and Management 135(8):
782-790.
Zhang, J., D. Eastham, et al. (2005). "Waste-Based Management in Residential Construction."
Journal of Construction Engineering and Management 131(4): 423-430.