improving efficiency for discovering business processes
TRANSCRIPT
Improving efficiency for discovering business processes containing invisible tasks in non‑free choiceRiyanarto Sarno1*, Kelly Rossa Sungkono1, Muhammad Taufiqulsa’di1, Hendra Darmawan1, Achmad Fahmi2,3 and Kuwat Triyana4
IntroductionThe rapid development of information systems leads to a growing amount of informa-tion [1] that obtains massive stored data [2, 3]. In the presence of various types of data, events that are happened in the systems are stored in so-called event log [4]. Monitoring
Abstract
Process discovery helps companies automatically discover their existing business pro-cesses based on the vast, stored event log. The process discovery algorithms have been developed rapidly to discover several types of relations, i.e., choice relations, non-free choice relations with invisible tasks. Invisible tasks in non-free choice, introduced by α$ method, is a type of relationship that combines the non-free choice and the invisible task. α$ proposed rules of ordering relations of two activities for determining invisible tasks in non-free choice. The event log records sequences of activities, so the rules of α$ check the combination of invisible task within non-free choice. The checking processes are time-consuming and result in high computing times of α$ . This research pro-poses Graph-based Invisible Task (GIT) method to discover efficiently invisible tasks in non-free choice. GIT method develops sequences of business activities as graphs and determines rules to discover invisible tasks in non-free choice based on relationships of the graphs. The analysis of the graph relationships by rules of GIT is more efficient than the iterative process of checking combined activities by α$ . This research measures the time efficiency of storing the event log and discovering a process model to evaluate GIT algorithm. Graph database gains highest storing computing time of batch event logs; however, this database obtains low storing computing time of streaming event logs. Furthermore, based on an event log with 99 traces, GIT algorithm discovers a pro-cess model 42 times faster than α++ and 43 times faster than α$. GIT algorithm can also handle 981 traces, while α++ and α$ has maximum traces at 99 traces. Discovering a process model by GIT algorithm has less time complexity than that by α$ , wherein GIT obtains O(n3) and α$ obtains O(n4) . Those results of the evaluation show a significant improvement of GIT method in term of time efficiency.
Keywords: Business process, Graph-database, Invisible task, Non-free-choice, Process discovery
Open Access
© The Author(s), 2021. Open Access This article is licensed under a Creative Commons Attribution 4.0 International License, which permits use, sharing, adaptation, distribution and reproduction in any medium or format, as long as you give appropriate credit to the original author(s) and the source, provide a link to the Creative Commons licence, and indicate if changes were made. The images or other third party material in this article are included in the article’s Creative Commons licence, unless indicated otherwise in a credit line to the mate-rial. If material is not included in the article’s Creative Commons licence and your intended use is not permitted by statutory regulation or exceeds the permitted use, you will need to obtain permission directly from the copyright holder. To view a copy of this licence, visit http:// creat iveco mmons. org/ licen ses/ by/4. 0/.
RESEARCH
Sarno et al. J Big Data (2021) 8:113 https://doi.org/10.1186/s40537‑021‑00487‑x
*Correspondence: [email protected] 1 Department of Informatics Engineering, Institut Teknologi Sepuluh Nopember, Jalan Raya ITS, Sukolilo, Surabaya 60111, IndonesiaFull list of author information is available at the end of the article
Page 2 of 17Sarno et al. J Big Data (2021) 8:113
business processes from a massive event log brings a challenge related to Big Data. Pro-cess mining is a discipline of gathering the event log and processing the log into a pro-cess model for monitoring, including capturing anomalies [5, 6] or bottlenecks [7]. The technique of constructing a process model by process mining is called process discovery.
There are several types of relationships which are formed by process discovery algo-rithms. The sophisticated relationship is invisible tasks in non-free choice. This condi-tion occurs when choice activities which involve invisible tasks are not a choice-free relation (their execution depends on previous activities). This research presents two business processes to give usage overview of invisible tasks in non-free choice.
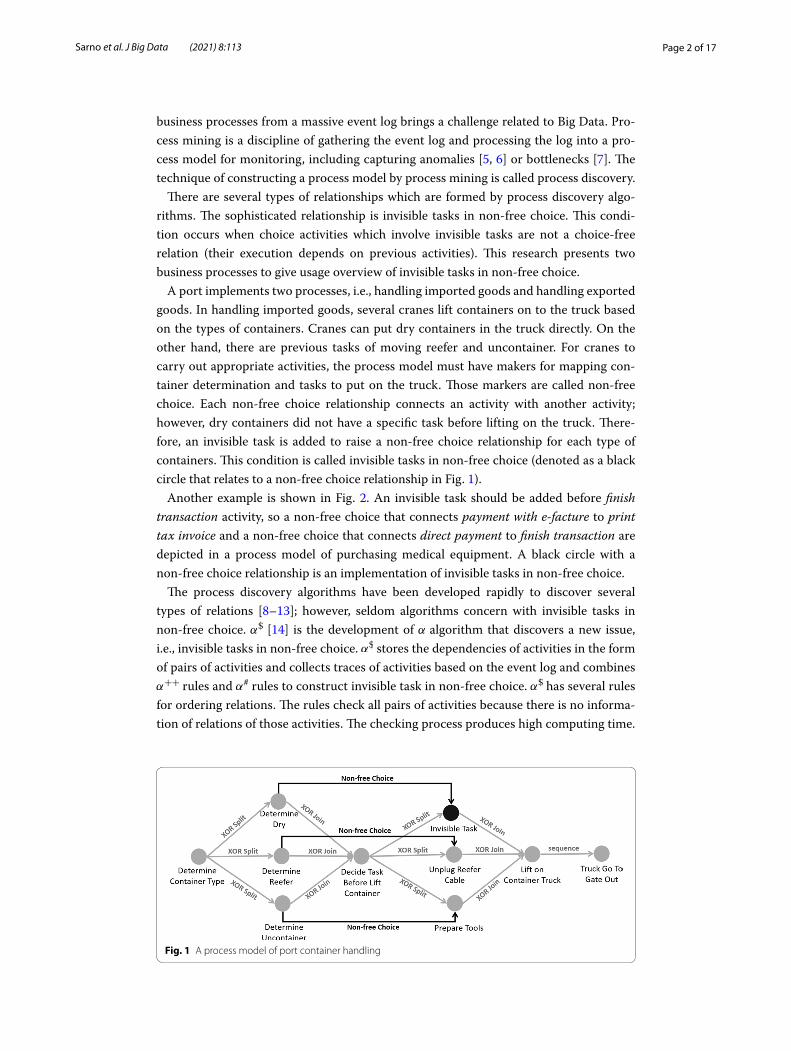
A port implements two processes, i.e., handling imported goods and handling exported goods. In handling imported goods, several cranes lift containers on to the truck based on the types of containers. Cranes can put dry containers in the truck directly. On the other hand, there are previous tasks of moving reefer and uncontainer. For cranes to carry out appropriate activities, the process model must have makers for mapping con-tainer determination and tasks to put on the truck. Those markers are called non-free choice. Each non-free choice relationship connects an activity with another activity; however, dry containers did not have a specific task before lifting on the truck. There-fore, an invisible task is added to raise a non-free choice relationship for each type of containers. This condition is called invisible tasks in non-free choice (denoted as a black circle that relates to a non-free choice relationship in Fig. 1).
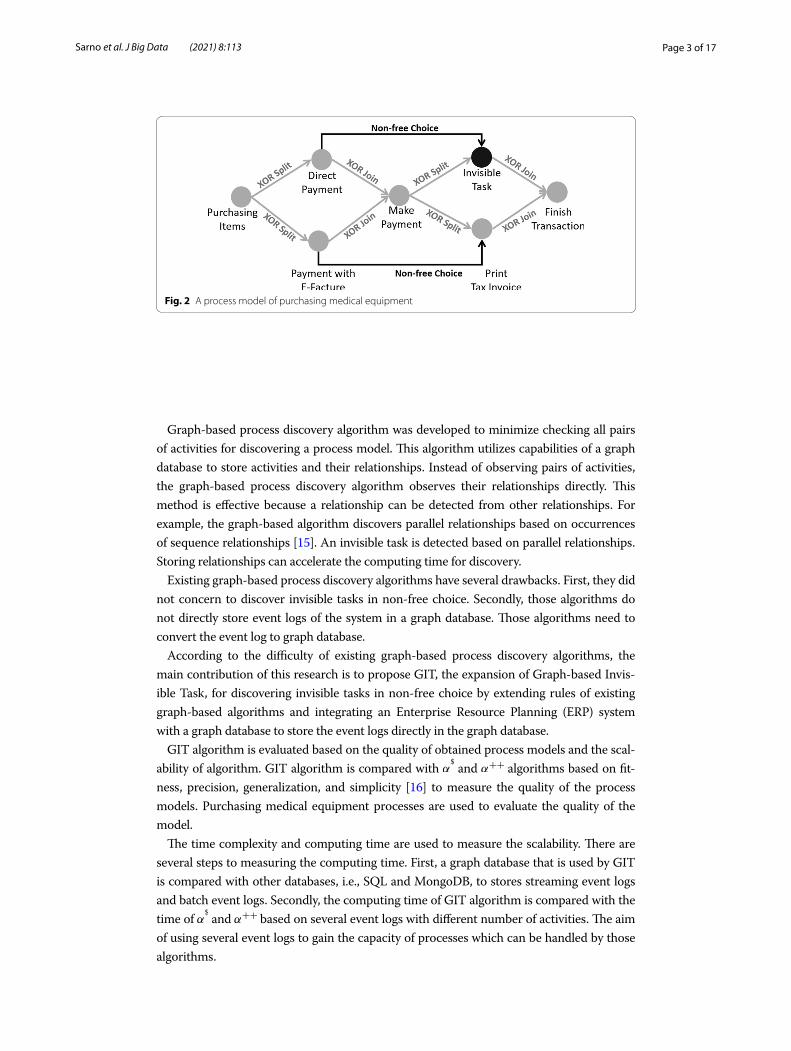
Another example is shown in Fig. 2. An invisible task should be added before finish transaction activity, so a non-free choice that connects payment with e-facture to print tax invoice and a non-free choice that connects direct payment to finish transaction are depicted in a process model of purchasing medical equipment. A black circle with a non-free choice relationship is an implementation of invisible tasks in non-free choice.
The process discovery algorithms have been developed rapidly to discover several types of relations [8–13]; however, seldom algorithms concern with invisible tasks in non-free choice. α$ [14] is the development of α algorithm that discovers a new issue, i.e., invisible tasks in non-free choice. α$ stores the dependencies of activities in the form of pairs of activities and collects traces of activities based on the event log and combines α++ rules and α# rules to construct invisible task in non-free choice. α$ has several rules for ordering relations. The rules check all pairs of activities because there is no informa-tion of relations of those activities. The checking process produces high computing time.
Fig. 1 A process model of port container handling
Page 3 of 17Sarno et al. J Big Data (2021) 8:113
Graph-based process discovery algorithm was developed to minimize checking all pairs of activities for discovering a process model. This algorithm utilizes capabilities of a graph database to store activities and their relationships. Instead of observing pairs of activities, the graph-based process discovery algorithm observes their relationships directly. This method is effective because a relationship can be detected from other relationships. For example, the graph-based algorithm discovers parallel relationships based on occurrences of sequence relationships [15]. An invisible task is detected based on parallel relationships. Storing relationships can accelerate the computing time for discovery.
Existing graph-based process discovery algorithms have several drawbacks. First, they did not concern to discover invisible tasks in non-free choice. Secondly, those algorithms do not directly store event logs of the system in a graph database. Those algorithms need to convert the event log to graph database.
According to the difficulty of existing graph-based process discovery algorithms, the main contribution of this research is to propose GIT, the expansion of Graph-based Invis-ible Task, for discovering invisible tasks in non-free choice by extending rules of existing graph-based algorithms and integrating an Enterprise Resource Planning (ERP) system with a graph database to store the event logs directly in the graph database.
GIT algorithm is evaluated based on the quality of obtained process models and the scal-ability of algorithm. GIT algorithm is compared with α$ and α++ algorithms based on fit-ness, precision, generalization, and simplicity [16] to measure the quality of the process models. Purchasing medical equipment processes are used to evaluate the quality of the model.
The time complexity and computing time are used to measure the scalability. There are several steps to measuring the computing time. First, a graph database that is used by GIT is compared with other databases, i.e., SQL and MongoDB, to stores streaming event logs and batch event logs. Secondly, the computing time of GIT algorithm is compared with the time of α$ and α++ based on several event logs with different number of activities. The aim of using several event logs to gain the capacity of processes which can be handled by those algorithms.
Fig. 2 A process model of purchasing medical equipment
Page 4 of 17Sarno et al. J Big Data (2021) 8:113
Related worksExisting methods of process discovery
Nowadays, many methods of process discovery are developed. There are two well-know methods, i.e. α [17] and Heuristic Miner [8].α algorithm forms all unique sequences of activities into a process model. This algo-
rithm is expanded to other algorithms to handle several issues in discovering relation-ships of activities. α+ [18] add rules of α for handling looping activities. Furthermore, α++ [14] and α# [19] expands rules of α+ with different purposes. α++ focuses to depict non-free choice; however, α# appends additional activities, called invisible prime tasks, in a process model to discover particular situations, i.e. skip, redo and switch. Thereafter, α
$ [4] introduces invisible tasks in non-free choice and combines α++ with α# to over-come that recent issue. α and its expended algorithms do not consider noises, so those algorithms are suitable for noise-free event logs.
Heuristic Miner [8] is process discovery algorithm that modifies α by adding a thresh-old to filter activities which will be formed in a process model. There are two aims of adding a threshold. First, the action can simplify an obtained process model based on logs containing huge activities and relationships. Activities which have appearance times less than the threshold will be abandoned, so the obtained process model only discover frequently executed activities. Secondly, the disposal of activities with occur-rences less than the threshold can eliminates noises because noises raise rarely. Fodina [11] improves Heuristic Miner to create robust heuristic process discovery algorithm. In addition, Fodina also develops rules to handle invisible prime tasks.α algorithm, as a pioneer process discovery algorithm, inspires the formation of new
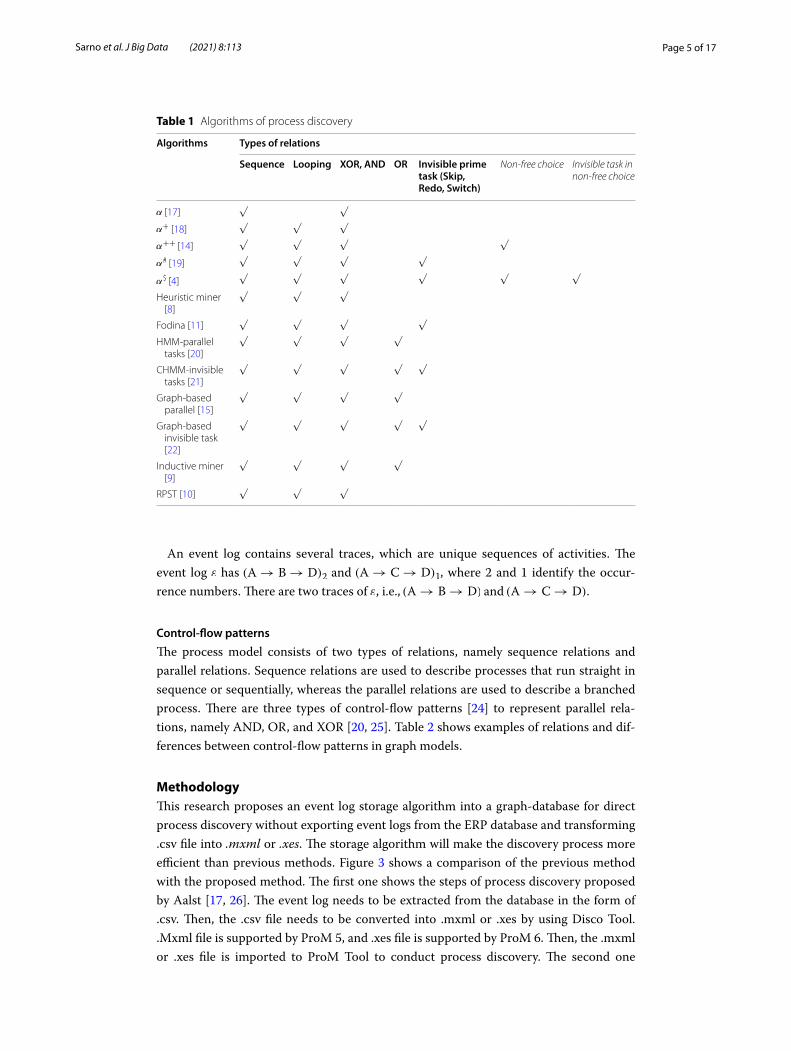
methods. HMM-Parallel Tasks [20] and CHMM-Invisible Tasks [21] modifies rules of α in the form of Hidden Markov Models. There are also graph-based α algorithm, such as Graph-based Parallel [15] and Graph-based Invisible Task [22]. Other algorithms are developed, such as Inductive Miner [9] and RPST [10]. Table 1 describes the existing algorithms which can discover types of relations depicted by the columns. The tick signs explain that the algorithms can discover the related relations depicted by the columns.
According to Table 1, existing graph-based process discovery algorithms had not con-cern in invisible task in non-free choice. GIT algorithm as proposed algorithm of this research handles this type of relation.
Event log
An event log consists of several cases, which identify the executed processes. Each case has several attributes, such as identification of case (CaseId), name of activities (Activ-ity), the execution time of the activities (Timestamp), and actors who carried out activi-ties (Resource) [23]. For example, an event log ε = { {C1, A , 2018-08-05-15:54, Admin}, {C1, B , 2018-08-05-16:54, Customer}, {C1, D , 2018-08-05-16:54, Customer}, {C2, A , 2018-08-06-15:54, Admin}, {C2, B , 2018-08-06-16:54, Customer}, {C2, D , 2018-08-06-16:54, Customer}, {C3, A , 2018-08-07-15:54, Admin}, {C3, C , 2018-08-07-16:54, Cus-tomer}, {C3, D , 2018-08-07-16:54, Customer}. The event log ε has three cases with id C1, C2, and C3. Both C1 and C2 have the same sequence of activities, which is A → B → D and C3 has A → C → D.
Page 5 of 17Sarno et al. J Big Data (2021) 8:113
An event log contains several traces, which are unique sequences of activities. The event log ε has (A → B → D)2 and (A → C → D)1 , where 2 and 1 identify the occur-rence numbers. There are two traces of ε , i.e., (A → B → D) and (A → C → D).
Control‑flow patterns
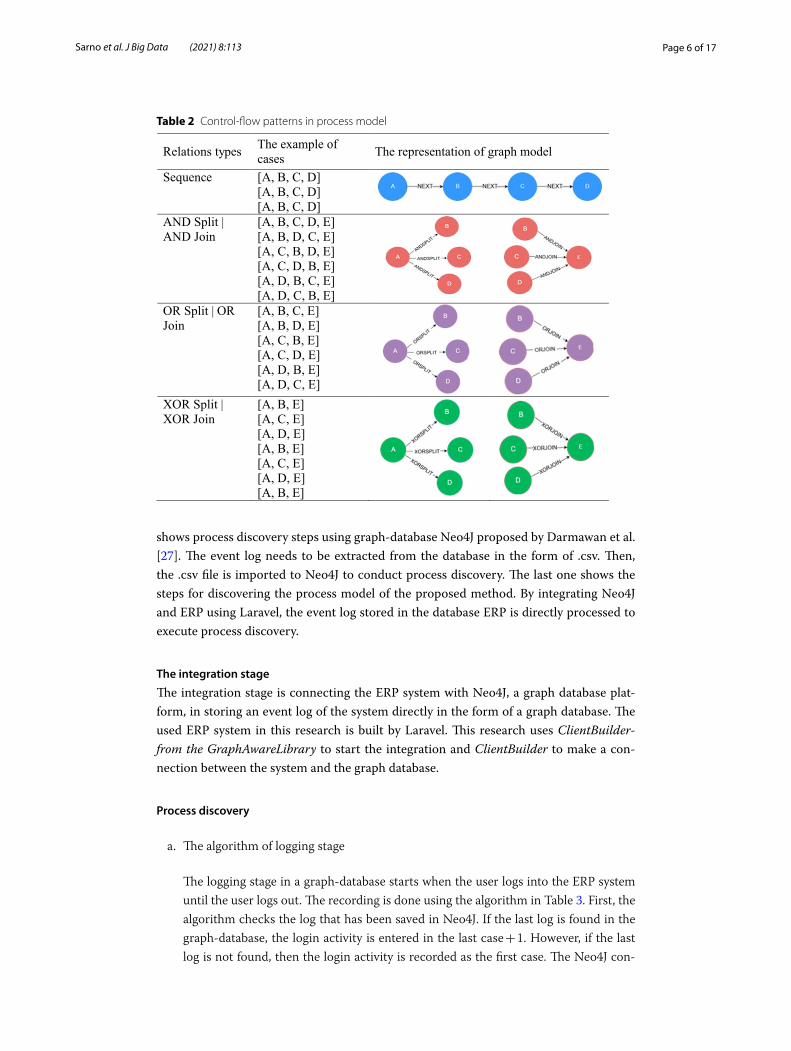
The process model consists of two types of relations, namely sequence relations and parallel relations. Sequence relations are used to describe processes that run straight in sequence or sequentially, whereas the parallel relations are used to describe a branched process. There are three types of control-flow patterns [24] to represent parallel rela-tions, namely AND, OR, and XOR [20, 25]. Table 2 shows examples of relations and dif-ferences between control-flow patterns in graph models.
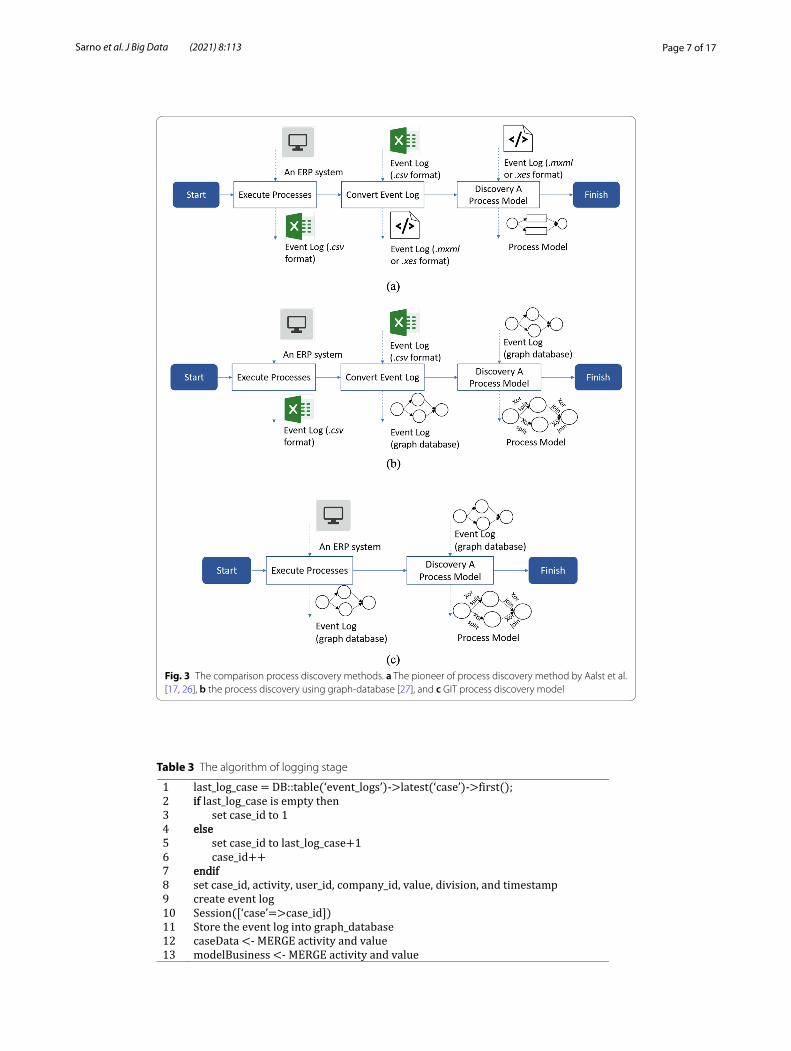
MethodologyThis research proposes an event log storage algorithm into a graph-database for direct process discovery without exporting event logs from the ERP database and transforming .csv file into .mxml or .xes. The storage algorithm will make the discovery process more efficient than previous methods. Figure 3 shows a comparison of the previous method with the proposed method. The first one shows the steps of process discovery proposed by Aalst [17, 26]. The event log needs to be extracted from the database in the form of .csv. Then, the .csv file needs to be converted into .mxml or .xes by using Disco Tool. .Mxml file is supported by ProM 5, and .xes file is supported by ProM 6. Then, the .mxml or .xes file is imported to ProM Tool to conduct process discovery. The second one
Table 1 Algorithms of process discovery
Algorithms Types of relations
Sequence Looping XOR, AND OR Invisible prime task (Skip, Redo, Switch)
Non-free choice Invisible task in non-free choice
α [17] √ √
α+ [18] √ √ √
α++ [14] √ √ √ √
α# [19] √ √ √ √
α$ [4] √ √ √ √ √ √
Heuristic miner [8]
√ √ √
Fodina [11] √ √ √ √
HMM-parallel tasks [20]
√ √ √ √
CHMM-invisible tasks [21]
√ √ √ √ √
Graph-based parallel [15]
√ √ √ √
Graph-based invisible task [22]
√ √ √ √ √
Inductive miner [9]
√ √ √ √
RPST [10] √ √ √
Page 6 of 17Sarno et al. J Big Data (2021) 8:113
shows process discovery steps using graph-database Neo4J proposed by Darmawan et al. [27]. The event log needs to be extracted from the database in the form of .csv. Then, the .csv file is imported to Neo4J to conduct process discovery. The last one shows the steps for discovering the process model of the proposed method. By integrating Neo4J and ERP using Laravel, the event log stored in the database ERP is directly processed to execute process discovery.
The integration stage
The integration stage is connecting the ERP system with Neo4J, a graph database plat-form, in storing an event log of the system directly in the form of a graph database. The used ERP system in this research is built by Laravel. This research uses ClientBuilder-from the GraphAwareLibrary to start the integration and ClientBuilder to make a con-nection between the system and the graph database.
Process discovery
a. The algorithm of logging stage
The logging stage in a graph-database starts when the user logs into the ERP system until the user logs out. The recording is done using the algorithm in Table 3. First, the algorithm checks the log that has been saved in Neo4J. If the last log is found in the graph-database, the login activity is entered in the last case + 1. However, if the last log is not found, then the login activity is recorded as the first case. The Neo4J con-
Table 2 Control-flow patterns in process model
Relations types The example of cases The representation of graph model
Sequence [A, B, C, D][A, B, C, D] [A, B, C, D]
AND Split | AND Join
[A, B, C, D, E][A, B, D, C, E] [A, C, B, D, E] [A, C, D, B, E] [A, D, B, C, E] [A, D, C, B, E]
OR Split | OR Join
[A, B, C, E][A, B, D, E] [A, C, B, E] [A, C, D, E] [A, D, B, E] [A, D, C, E]
XOR Split | XOR Join
[A, B, E][A, C, E] [A, D, E][A, B, E] [A, C, E] [A, D, E][A, B, E]
Page 7 of 17Sarno et al. J Big Data (2021) 8:113
Fig. 3 The comparison process discovery methods. a The pioneer of process discovery method by Aalst et al. [17, 26], b the process discovery using graph-database [27], and c GIT process discovery model
Table 3 The algorithm of logging stage
Page 8 of 17Sarno et al. J Big Data (2021) 8:113
nection is made using the GraphAwarelibrary by connecting ClientBuilder from the GraphAware. At that moment, the current case will be included in the session to be used in later stages.
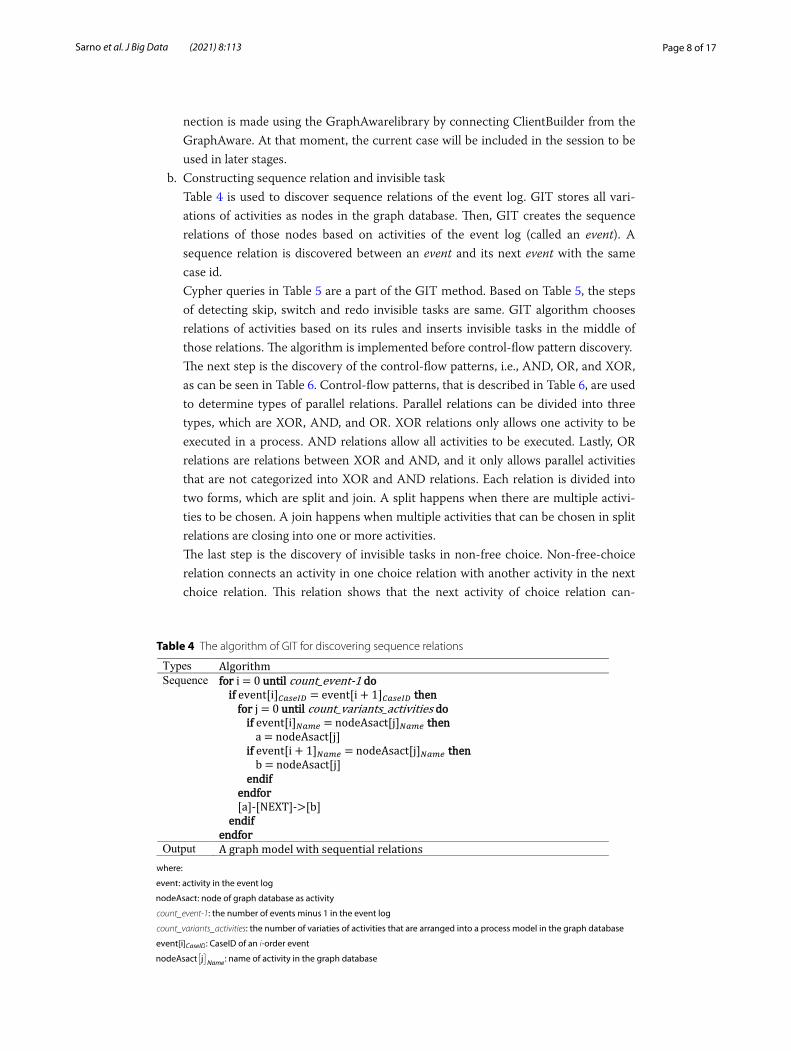
b. Constructing sequence relation and invisible task Table 4 is used to discover sequence relations of the event log. GIT stores all vari-
ations of activities as nodes in the graph database. Then, GIT creates the sequence relations of those nodes based on activities of the event log (called an event). A sequence relation is discovered between an event and its next event with the same case id.
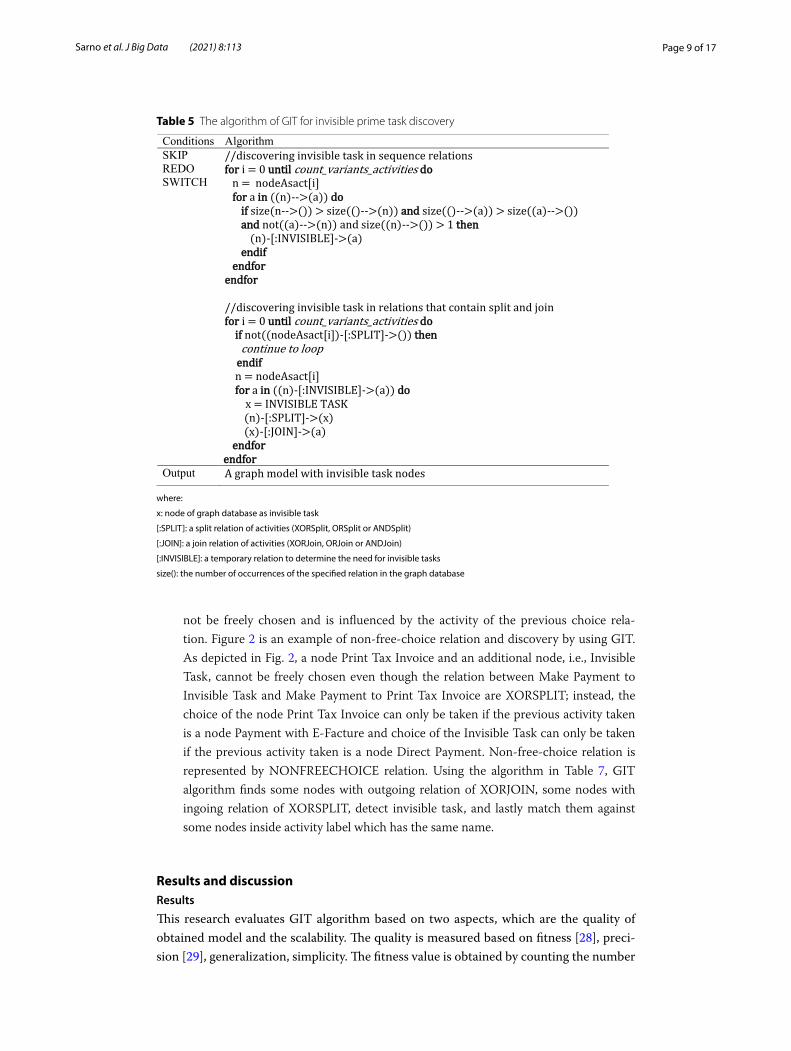
Cypher queries in Table 5 are a part of the GIT method. Based on Table 5, the steps of detecting skip, switch and redo invisible tasks are same. GIT algorithm chooses relations of activities based on its rules and inserts invisible tasks in the middle of those relations. The algorithm is implemented before control-flow pattern discovery.
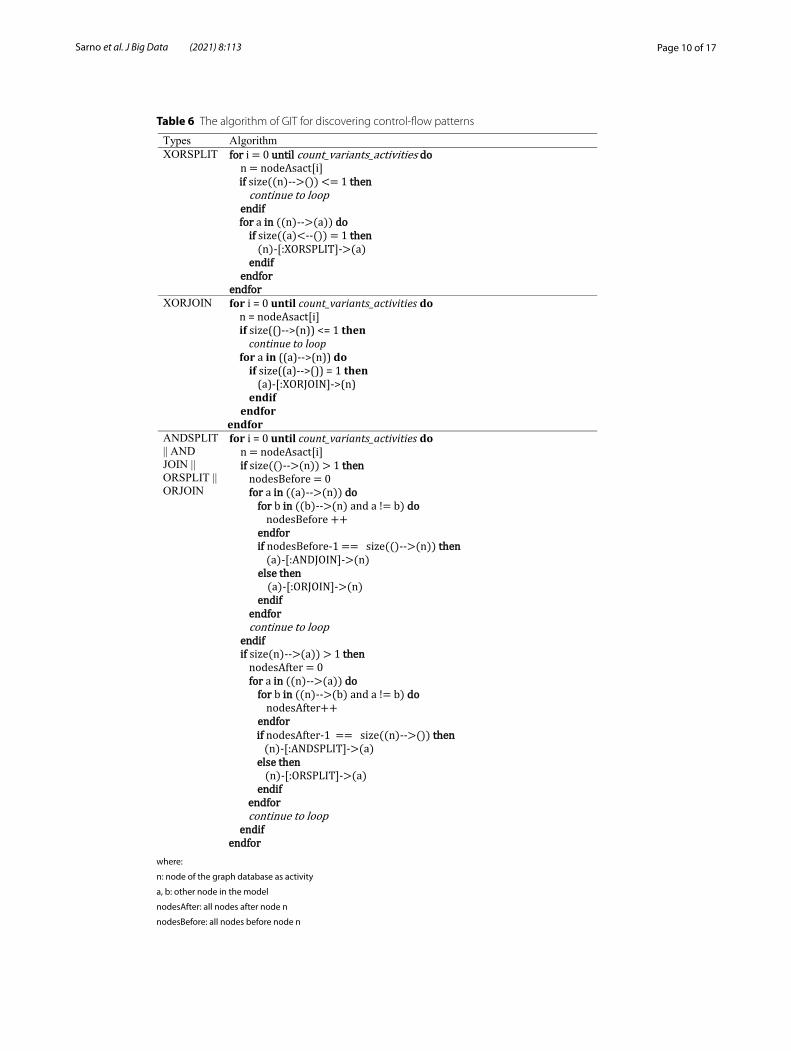
The next step is the discovery of the control-flow patterns, i.e., AND, OR, and XOR, as can be seen in Table 6. Control-flow patterns, that is described in Table 6, are used to determine types of parallel relations. Parallel relations can be divided into three types, which are XOR, AND, and OR. XOR relations only allows one activity to be executed in a process. AND relations allow all activities to be executed. Lastly, OR relations are relations between XOR and AND, and it only allows parallel activities that are not categorized into XOR and AND relations. Each relation is divided into two forms, which are split and join. A split happens when there are multiple activi-ties to be chosen. A join happens when multiple activities that can be chosen in split relations are closing into one or more activities.
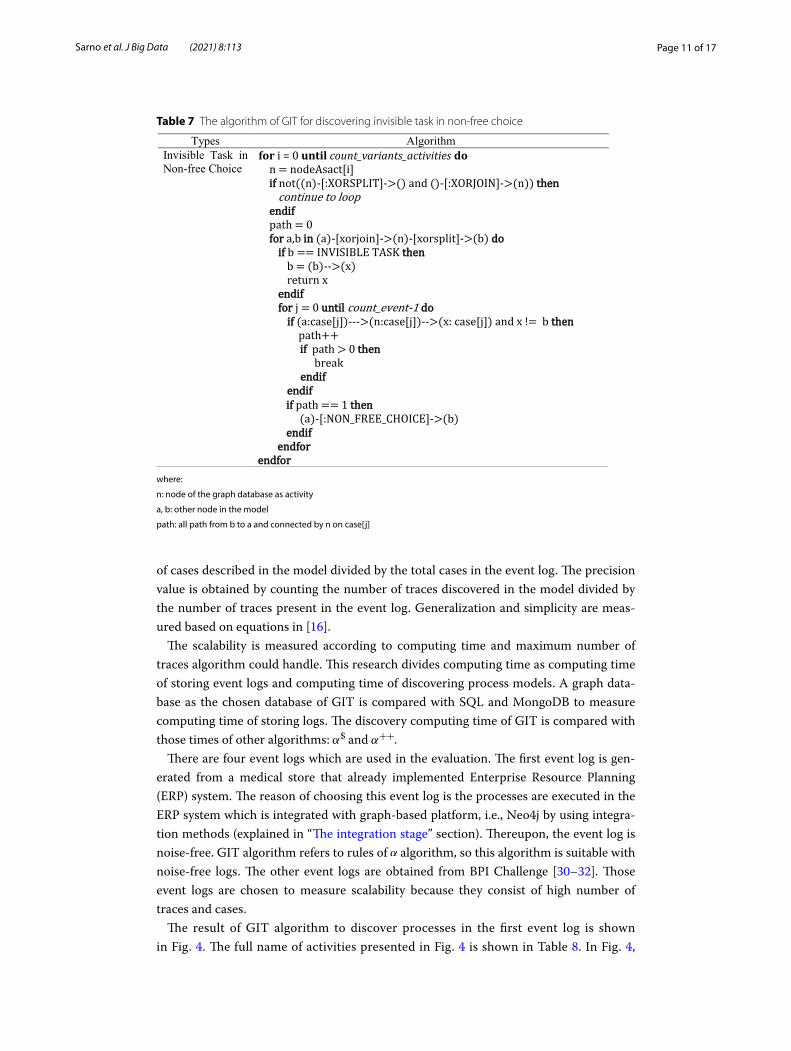
The last step is the discovery of invisible tasks in non-free choice. Non-free-choice relation connects an activity in one choice relation with another activity in the next choice relation. This relation shows that the next activity of choice relation can-
Table 4 The algorithm of GIT for discovering sequence relations
where:
event : activity in the event log
nodeAsact : node of graph database as activity
count_event-1: the number of events minus 1 in the event log
count_variants_activities: the number of variaties of activities that are arranged into a process model in the graph database
event[i]CaseID : CaseID of an i-order event
nodeAsact[
j]
Name : name of activity in the graph database
Page 9 of 17Sarno et al. J Big Data (2021) 8:113
not be freely chosen and is influenced by the activity of the previous choice rela-tion. Figure 2 is an example of non-free-choice relation and discovery by using GIT. As depicted in Fig. 2, a node Print Tax Invoice and an additional node, i.e., Invisible Task, cannot be freely chosen even though the relation between Make Payment to Invisible Task and Make Payment to Print Tax Invoice are XORSPLIT; instead, the choice of the node Print Tax Invoice can only be taken if the previous activity taken is a node Payment with E-Facture and choice of the Invisible Task can only be taken if the previous activity taken is a node Direct Payment. Non-free-choice relation is represented by NONFREECHOICE relation. Using the algorithm in Table 7, GIT algorithm finds some nodes with outgoing relation of XORJOIN, some nodes with ingoing relation of XORSPLIT, detect invisible task, and lastly match them against some nodes inside activity label which has the same name.
Results and discussionResults
This research evaluates GIT algorithm based on two aspects, which are the quality of obtained model and the scalability. The quality is measured based on fitness [28], preci-sion [29], generalization, simplicity. The fitness value is obtained by counting the number
Table 5 The algorithm of GIT for invisible prime task discovery
where:
x: node of graph database as invisible task
[:SPLIT]: a split relation of activities (XORSplit, ORSplit or ANDSplit)
[:JOIN]: a join relation of activities (XORJoin, ORJoin or ANDJoin)
[:INVISIBLE]: a temporary relation to determine the need for invisible tasks
size(): the number of occurrences of the specified relation in the graph database
Page 10 of 17Sarno et al. J Big Data (2021) 8:113
Table 6 The algorithm of GIT for discovering control-flow patterns
where:
n: node of the graph database as activity
a, b: other node in the model
nodesAfter: all nodes after node n
nodesBefore: all nodes before node n
Page 11 of 17Sarno et al. J Big Data (2021) 8:113
of cases described in the model divided by the total cases in the event log. The precision value is obtained by counting the number of traces discovered in the model divided by the number of traces present in the event log. Generalization and simplicity are meas-ured based on equations in [16].
The scalability is measured according to computing time and maximum number of traces algorithm could handle. This research divides computing time as computing time of storing event logs and computing time of discovering process models. A graph data-base as the chosen database of GIT is compared with SQL and MongoDB to measure computing time of storing logs. The discovery computing time of GIT is compared with those times of other algorithms: α$ and α++.
There are four event logs which are used in the evaluation. The first event log is gen-erated from a medical store that already implemented Enterprise Resource Planning (ERP) system. The reason of choosing this event log is the processes are executed in the ERP system which is integrated with graph-based platform, i.e., Neo4j by using integra-tion methods (explained in “The integration stage” section). Thereupon, the event log is noise-free. GIT algorithm refers to rules of α algorithm, so this algorithm is suitable with noise-free logs. The other event logs are obtained from BPI Challenge [30–32]. Those event logs are chosen to measure scalability because they consist of high number of traces and cases.
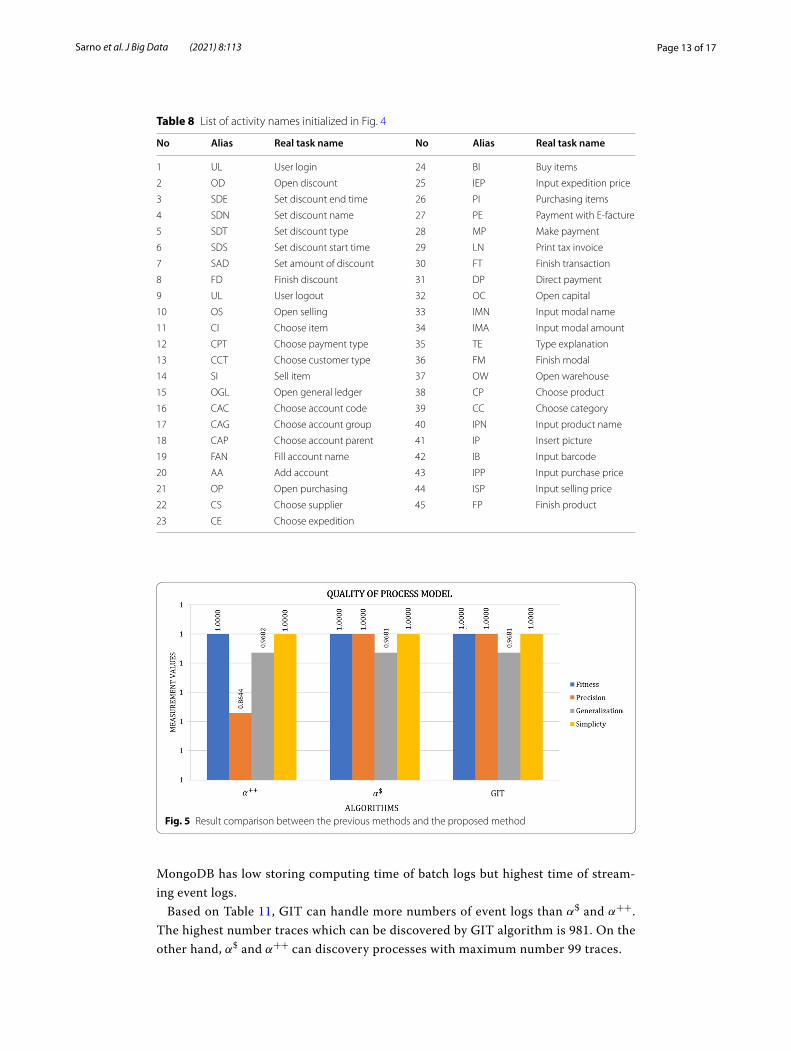
The result of GIT algorithm to discover processes in the first event log is shown in Fig. 4. The full name of activities presented in Fig. 4 is shown in Table 8. In Fig. 4,
Table 7 The algorithm of GIT for discovering invisible task in non-free choice
where:
n: node of the graph database as activity
a, b: other node in the model
path: all path from b to a and connected by n on case[j]
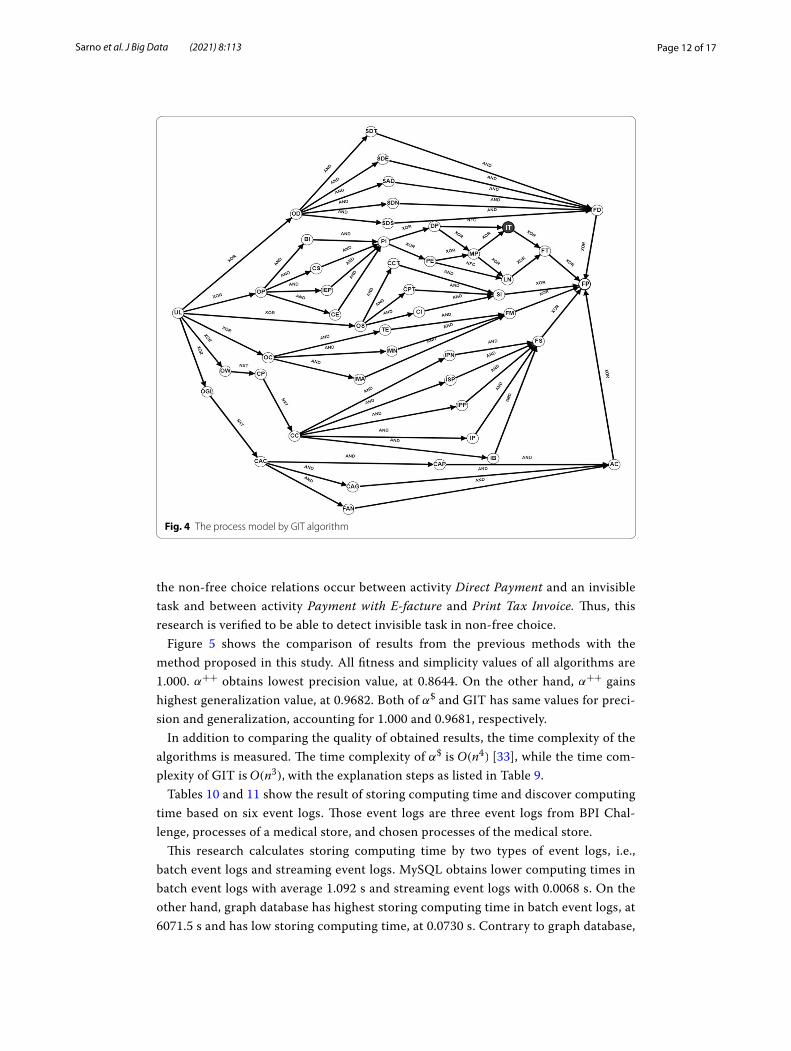
Page 12 of 17Sarno et al. J Big Data (2021) 8:113
the non-free choice relations occur between activity Direct Payment and an invisible task and between activity Payment with E-facture and Print Tax Invoice. Thus, this research is verified to be able to detect invisible task in non-free choice.
Figure 5 shows the comparison of results from the previous methods with the method proposed in this study. All fitness and simplicity values of all algorithms are 1.000. α++ obtains lowest precision value, at 0.8644. On the other hand, α++ gains highest generalization value, at 0.9682. Both of α$ and GIT has same values for preci-sion and generalization, accounting for 1.000 and 0.9681, respectively.
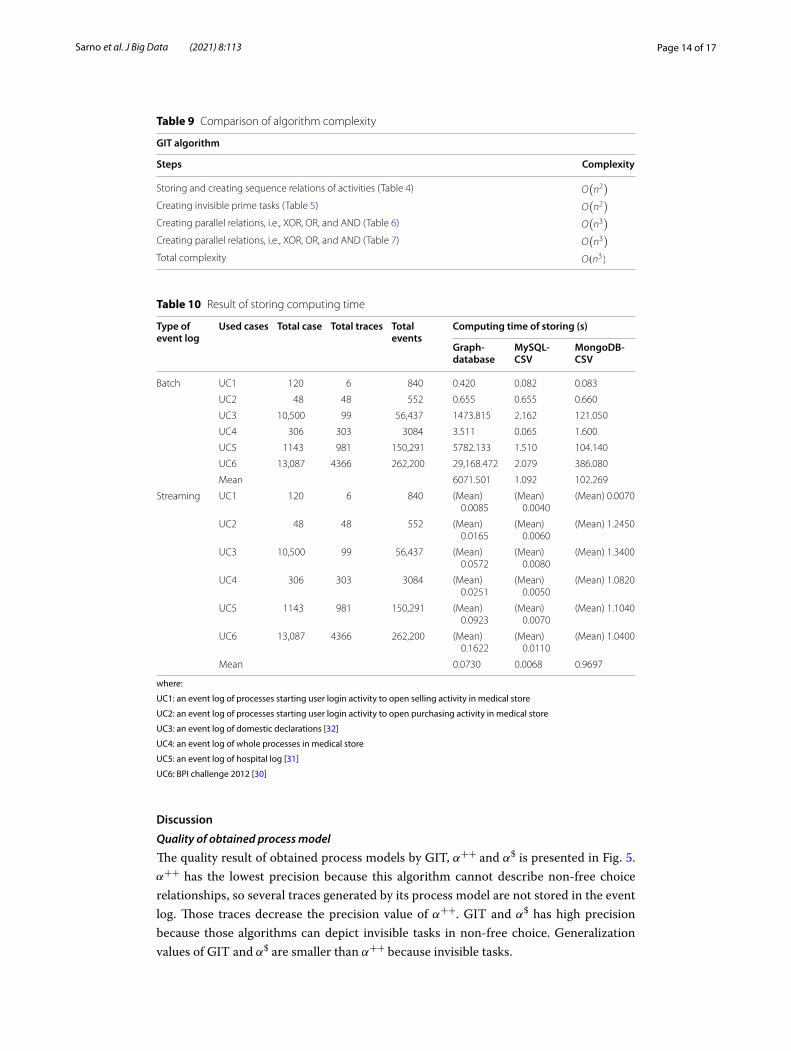
In addition to comparing the quality of obtained results, the time complexity of the algorithms is measured. The time complexity of α$ is O(n4) [33], while the time com-plexity of GIT is O(n3), with the explanation steps as listed in Table 9.
Tables 10 and 11 show the result of storing computing time and discover computing time based on six event logs. Those event logs are three event logs from BPI Chal-lenge, processes of a medical store, and chosen processes of the medical store.
This research calculates storing computing time by two types of event logs, i.e., batch event logs and streaming event logs. MySQL obtains lower computing times in batch event logs with average 1.092 s and streaming event logs with 0.0068 s. On the other hand, graph database has highest storing computing time in batch event logs, at 6071.5 s and has low storing computing time, at 0.0730 s. Contrary to graph database,
Fig. 4 The process model by GIT algorithm
Page 13 of 17Sarno et al. J Big Data (2021) 8:113
MongoDB has low storing computing time of batch logs but highest time of stream-ing event logs.
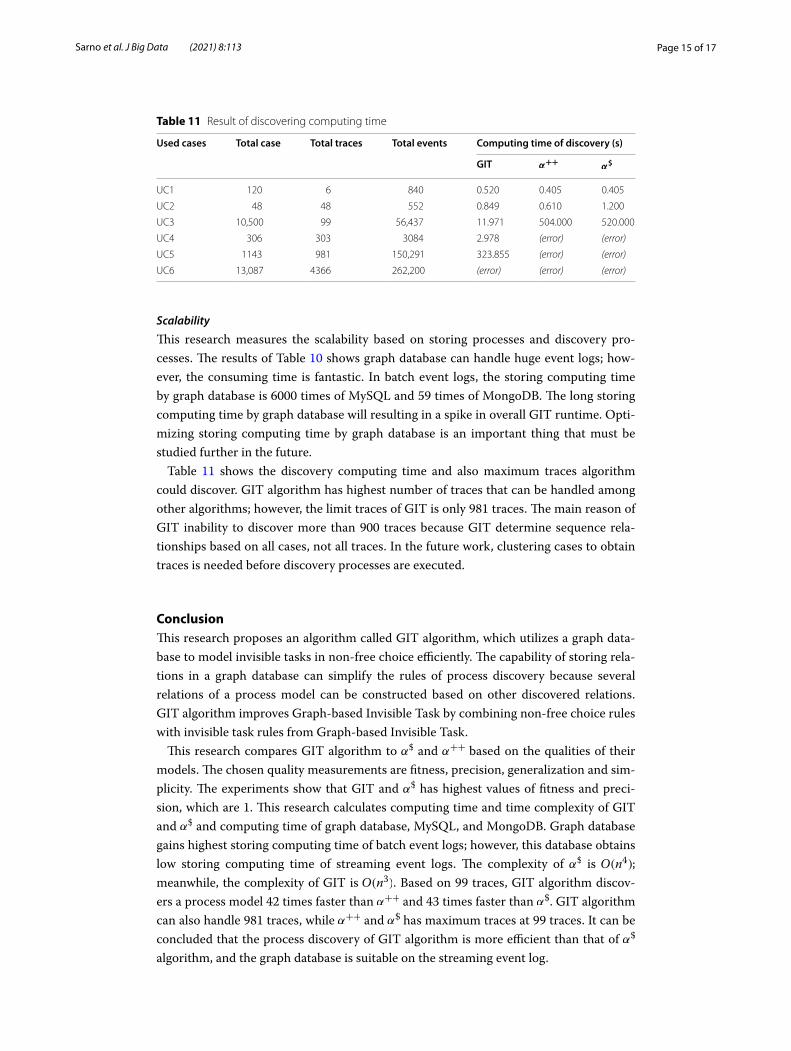
Based on Table 11, GIT can handle more numbers of event logs than α$ and α++ . The highest number traces which can be discovered by GIT algorithm is 981. On the other hand, α$ and α++ can discovery processes with maximum number 99 traces.
Table 8 List of activity names initialized in Fig. 4
No Alias Real task name No Alias Real task name
1 UL User login 24 BI Buy items
2 OD Open discount 25 IEP Input expedition price
3 SDE Set discount end time 26 PI Purchasing items
4 SDN Set discount name 27 PE Payment with E-facture
5 SDT Set discount type 28 MP Make payment
6 SDS Set discount start time 29 LN Print tax invoice
7 SAD Set amount of discount 30 FT Finish transaction
8 FD Finish discount 31 DP Direct payment
9 UL User logout 32 OC Open capital
10 OS Open selling 33 IMN Input modal name
11 CI Choose item 34 IMA Input modal amount
12 CPT Choose payment type 35 TE Type explanation
13 CCT Choose customer type 36 FM Finish modal
14 SI Sell item 37 OW Open warehouse
15 OGL Open general ledger 38 CP Choose product
16 CAC Choose account code 39 CC Choose category
17 CAG Choose account group 40 IPN Input product name
18 CAP Choose account parent 41 IP Insert picture
19 FAN Fill account name 42 IB Input barcode
20 AA Add account 43 IPP Input purchase price
21 OP Open purchasing 44 ISP Input selling price
22 CS Choose supplier 45 FP Finish product
23 CE Choose expedition
Fig. 5 Result comparison between the previous methods and the proposed method
Page 14 of 17Sarno et al. J Big Data (2021) 8:113
Discussion
Quality of obtained process model
The quality result of obtained process models by GIT, α++ and α$ is presented in Fig. 5. α++ has the lowest precision because this algorithm cannot describe non-free choice relationships, so several traces generated by its process model are not stored in the event log. Those traces decrease the precision value of α++ . GIT and α$ has high precision because those algorithms can depict invisible tasks in non-free choice. Generalization values of GIT and α$ are smaller than α++ because invisible tasks.
Table 9 Comparison of algorithm complexity
GIT algorithm
Steps Complexity
Storing and creating sequence relations of activities (Table 4) O(
n2)
Creating invisible prime tasks (Table 5) O(
n2)
Creating parallel relations, i.e., XOR, OR, and AND (Table 6) O(
n3)
Creating parallel relations, i.e., XOR, OR, and AND (Table 7) O(
n3)
Total complexity O(n3)
Table 10 Result of storing computing time
where:
UC1: an event log of processes starting user login activity to open selling activity in medical store
UC2: an event log of processes starting user login activity to open purchasing activity in medical store
UC3: an event log of domestic declarations [32]
UC4: an event log of whole processes in medical store
UC5: an event log of hospital log [31]
UC6: BPI challenge 2012 [30]
Type of event log
Used cases Total case Total traces Total events
Computing time of storing (s)
Graph‑database
MySQL‑CSV
MongoDB‑CSV
Batch UC1 120 6 840 0.420 0.082 0.083
UC2 48 48 552 0.655 0.655 0.660
UC3 10,500 99 56,437 1473.815 2.162 121.050
UC4 306 303 3084 3.511 0.065 1.600
UC5 1143 981 150,291 5782.133 1.510 104.140
UC6 13,087 4366 262,200 29,168.472 2.079 386.080
Mean 6071.501 1.092 102.269
Streaming UC1 120 6 840 (Mean) 0.0085
(Mean) 0.0040
(Mean) 0.0070
UC2 48 48 552 (Mean) 0.0165
(Mean) 0.0060
(Mean) 1.2450
UC3 10,500 99 56,437 (Mean) 0.0572
(Mean) 0.0080
(Mean) 1.3400
UC4 306 303 3084 (Mean) 0.0251
(Mean) 0.0050
(Mean) 1.0820
UC5 1143 981 150,291 (Mean) 0.0923
(Mean) 0.0070
(Mean) 1.1040
UC6 13,087 4366 262,200 (Mean) 0.1622
(Mean) 0.0110
(Mean) 1.0400
Mean 0.0730 0.0068 0.9697
Page 15 of 17Sarno et al. J Big Data (2021) 8:113
Scalability
This research measures the scalability based on storing processes and discovery pro-cesses. The results of Table 10 shows graph database can handle huge event logs; how-ever, the consuming time is fantastic. In batch event logs, the storing computing time by graph database is 6000 times of MySQL and 59 times of MongoDB. The long storing computing time by graph database will resulting in a spike in overall GIT runtime. Opti-mizing storing computing time by graph database is an important thing that must be studied further in the future.
Table 11 shows the discovery computing time and also maximum traces algorithm could discover. GIT algorithm has highest number of traces that can be handled among other algorithms; however, the limit traces of GIT is only 981 traces. The main reason of GIT inability to discover more than 900 traces because GIT determine sequence rela-tionships based on all cases, not all traces. In the future work, clustering cases to obtain traces is needed before discovery processes are executed.
ConclusionThis research proposes an algorithm called GIT algorithm, which utilizes a graph data-base to model invisible tasks in non-free choice efficiently. The capability of storing rela-tions in a graph database can simplify the rules of process discovery because several relations of a process model can be constructed based on other discovered relations. GIT algorithm improves Graph-based Invisible Task by combining non-free choice rules with invisible task rules from Graph-based Invisible Task.
This research compares GIT algorithm to α$ and α++ based on the qualities of their models. The chosen quality measurements are fitness, precision, generalization and sim-plicity. The experiments show that GIT and α$ has highest values of fitness and preci-sion, which are 1. This research calculates computing time and time complexity of GIT and α$ and computing time of graph database, MySQL, and MongoDB. Graph database gains highest storing computing time of batch event logs; however, this database obtains low storing computing time of streaming event logs. The complexity of α$ is O(n4) ; meanwhile, the complexity of GIT is O(n3) . Based on 99 traces, GIT algorithm discov-ers a process model 42 times faster than α++ and 43 times faster than α$ . GIT algorithm can also handle 981 traces, while α++ and α$ has maximum traces at 99 traces. It can be concluded that the process discovery of GIT algorithm is more efficient than that of α$ algorithm, and the graph database is suitable on the streaming event log.
Table 11 Result of discovering computing time
Used cases Total case Total traces Total events Computing time of discovery (s)
GIT α++
α$
UC1 120 6 840 0.520 0.405 0.405
UC2 48 48 552 0.849 0.610 1.200
UC3 10,500 99 56,437 11.971 504.000 520.000
UC4 306 303 3084 2.978 (error) (error)
UC5 1143 981 150,291 323.855 (error) (error)
UC6 13,087 4366 262,200 (error) (error) (error)

Page 16 of 17Sarno et al. J Big Data (2021) 8:113
The future work of this research is optimizing storing processes in the graph database and clustering processes as the input of discovery processes. Those subjects should be analyzed further to increase the scalability of GIT algorithm.
AbbreviationsERP: Enterprise Resource Planning; GIT: Graph-based Invisible Task in Non-Free Choice.
AcknowledgementsThis research was funded by the Ministry of Research and Technology/National Research and Innovation Agency Repub-lic of Indonesia (Ristek-BRIN) and the Indonesian Ministry of Education and Culture under Newton Institutional Links—Kerjasama Luar Negeri (KLN) Program, and under the World Class University Program managed by Institut Teknologi Bandung, also under Penelitian Terapan Unggulan Perguruan Tinggi (PTUPT) Program managed by Institut Teknologi Sepuluh Nopember (ITS).
Authors’ contributionsRS formulated rules of GIT algorithm and checked the manuscript. KRS analyzed the efficiency of GIT algorithm and was a major contributor in writing the manuscript. MT and HD implemented the rules of GIT algorithm and performed the evaluation of GIT algorithm, AF describes the flow of medical store processes. KT checks the analysis of evaluation. All authors read and approved the final manuscript.
FundingThis research was funded by the Indonesian Ministry of Education and Culture under the World Class University Program managed by Institut Teknologi Bandung, under Penelitian Terapan Unggulan Perguruan Tinggi (PTUPT) Program man-aged by Institut Teknologi Sepuluh Nopember (ITS) and under the Indonesian Ministry of Education and Culture under Riset Inovatif-Produktif (RISPRO) Invitation Program managed by Lembaga Pengelola Dana Pendidikan (LPDP).
Availability of data and materialsThe used raw dataset in this research is not publicly available. Readers can contact the corresponding author if they want to access the data.
Declarations
Ethics approval and consent to participateNot applicable.
Consent for publicationNot applicable.
Competing interestsThe authors declare that they have no competing interests.
Author details1 Department of Informatics Engineering, Institut Teknologi Sepuluh Nopember, Jalan Raya ITS, Sukolilo, Surabaya 60111, Indonesia. 2 Department of Neurosurgery, Faculty of Medicine, Universitas Airlangga, Jalan Mayjen, Prof. Dr. Moestopo 47, Surabaya 60131, Indonesia. 3 Dr Soetomo General Academic Hospital, Medical Center, Jalan Mayjen Prof. Dr. Moestopo 6-8, Airlangga, Surabaya 60286, Indonesia. 4 Department of Physics, Universitas Gadjah Mada, Jalan Grafika 2, Yogya-karta 55281, Indonesia.
Received: 4 September 2020 Accepted: 23 June 2021
References 1. Mantzaris AV, Walker TG, Taylor CE, Ehling D. Adaptive network diagram constructions for representing big data
event streams on monitoring dashboards. J Big Data. 2019. https:// doi. org/ 10. 1186/ s40537- 019- 0187-2. 2. Ismail A, Truong HL, Kastner W. Manufacturing process data analysis pipelines: a requirements analysis and survey. J
Big Data. 2019;6:1–26. https:// doi. org/ 10. 1186/ s40537- 018- 0162-3. 3. Hasan MM, Popp J, Oláh J. Current landscape and influence of big data on finance. J Big Data. 2020. https:// doi. org/
10. 1186/ s40537- 020- 00291-z. 4. Guo Q, Wen L, Wang J, Yan Z, Yu PS. Mining invisible tasks in non-free choice constructs. Cham: Springer; 2015. p.
109–10. 5. Sarno R, Sinaga F, Sungkono KR. Anomaly detection in business processes using process mining and fuzzy associa-
tion rule learning. J Big Data. 2020;7:1–19. 6. Al Jallad K, Aljnidi M, Desouki MS. Anomaly detection optimization using big data and deep learning to reduce
false-positive. J Big Data. 2020;7:68. https:// doi. org/ 10. 1186/ s40537- 020- 00346-1. 7. Eboreime EA, Idika O, Omitiran K, Eboreime O, Ibisomi L. Primary healthcare planning, bottleneck analysis and
performance improvement: an evaluation of processes and outcomes in a Nigerian context. Eval Program Plan. 2019;77:101712.
Page 17 of 17Sarno et al. J Big Data (2021) 8:113
8. Weijters AJMM, Van Der Aalst WMP. Process mining with the heuristics miner-algorithm. Tech Rep WP. Technische Universiteit Eindhoven. 2006;166:1–34.
9. Leemans SJJ, Fahland D, van der Aalst WMP. Discovering block-structured process models from incomplete event logs. In: International conference on applications and theory of petri nets and concurrency. 2014;9698:91–110. https:// doi. org/ 10. 1007/ 978-3- 319- 07734-5_6.
10. Yan Z, Sun B, Chen Y, Wen L, Hu L, Wang J, et al. Decomposed and parallel process discovery: a framework and application. Future Gener Comput Syst. 2019;98:392–405.
11. vanden Broucke SKLM, De Weerdt J. Fodina: a robust and flexible heuristic process discovery technique. Decis Sup-port Syst. 2017;100:109–18.
12. Hermawan SR. A more efficient deterministic algorithm in process. Int J Innov Comput Inf Control. 2018;14:971–95. 13. Sarno R, Sungkono KR, Johanes R, Sunaryono D. Graph-based algorithms for discovering a process model contain-
ing invisible tasks. Int J Intell Eng Syst. 2019;12:85–94. 14. Guo Q, Wen L, Wang J, Yan Z, Yu PS. Mining invisible tasks in non-free-choice constructs. Lecture notes in computer
science. Cham: Springer International Publishing; 2015. p. 109–25. 15. Waspada I, Sarno R, Sungkono KR. An improved method of parallel model detection for graph-based process model
discovery. Int J Intell Eng Syst. 2020;13:127–38. 16. Sungkono KR, Sarno R. Constructing control-flow patterns containing invisible task and non-free choice based on
declarative model. Int J Innov Comput Inf Control. 2018;14:1285–99. 17. van der Aalst WMP, Weijters T, Maruster L. Workflow mining: discovering process models from event logs. IEEE Trans
Knowl Data Eng. 2004;16:1128–42. 18. De Medeiros AKA, Van Dongen BF, van der Aalst WMP, Weijters AJMM. Process mining: extending the α-algorithm to
mine short loops. Eindhoven University of Technology Eindhoven; 2004. p. 1–25. 19. Wen L, Wang J, van der Aalst WMP, Huang B, Sun J. Mining process models with prime invisible tasks. Data Knowl
Eng. 2010;69:999–1021. 20. Sarno R, Sungkono KR. Hidden Markov model for process mining of parallel business processes. Int Rev Comput
Softw. 2016;11:290–300. 21. Sarno R, Sungkono KR. Coupled hidden Markov model for process mining of invisible prime tasks. Int Rev Comput
Softw. 2016;11:539–47. 22. Sarno R, Sungkono KR, Johanes R, Sunaryono D. Graph-based algorithms for discovering a process model contain-
ing invisible tasks. Intell Netw Syst Soc. 2019;12:85–94. 23. Sungkono KR, Sarno R. Patterns of fraud detection using coupled hidden Markov Model. In: 2017 3rd international
conference on science in information technology (ICSITech), Bandung. IEEE; 2017. p. 235–40. 24. Russell N, Hofstede AHM, Aalst WMP Van Der, Mulyar N. Workflow control-flow patterns: a revised view. BPM Center
Report BPM-06-22. Netherlands; 2006. p. 6–22. 25. Sarno R, Sungkono KR. Coupled hidden Markov model for process discovery of non-free choice and invisible prime
tasks. In: 4th information systems international conference. Elsevier B.V.; 2017. p. 134–41. 26. Van Der Aalst WMP. Process mining discovery, conformance and enhancement of business processes. Dordrecht:
Springer; 2011. 27. Darmawan H, Sarno R, Ahmadiyah AS, Sungkono KR, Wahyuni CS. Anomaly detection based on control-flow pattern
of parallel business processes. TELKOMNIKA. 2018;16:2808–15. 28. Buijs JCAM, Van Dongen BF, van Der Aalst WMP. On the role of fitness, precision, generalization and simplicity in
process discovery. In: OTM conferences; 2012. p. 305–22. 29. Buijs JCAM, Van Dongen BF, Van Der Aalst WMP. Quality dimensions in process discovery: the importance of fitness,
precision, generalization and simplicity. Int J Coop Inf Syst. 2014;23:1–39. 30. van Dongen B. BPI challenge 2012; 2012. https:// doi. org/ 10. 4121/ uuid: 3926d b30- f712- 4394- aebc- 75976 070e9 1f. 31. van Dongen B. Real-life event logs—hospital log; 2011. https:// doi. org/ 10. 4121/ uuid: d9769 f3d- 0ab0- 4fb8- 803b-
0d112 0ffcf 54. 32. van Dongen B. BPI challenge 2020: domestic declarations; 2020. 33. Sarno R, Sungkono KR. A survey of graph-based algorithms for discovering business processes. Int J Adv Intell Inf.
2019;5:137–49.
Publisher’s NoteSpringer Nature remains neutral with regard to jurisdictional claims in published maps and institutional affiliations.