improvements to ncdot’s wetland
TRANSCRIPT

Improvements to NCDOT’s Wetland
Prediction Model (Phase II)
NCDOT Project 2016-16
FHWA/NC/2016-16
March 2020
Sheng-Guo Wang, PhD, Professor
UNCC WAM Research Team
Department of Engineering Technology
Department of Computer Science
University of North Carolina at Charlotte
with Axiom Research Team

Improvements to NCDOT’s Wetland
Prediction Model (Phase II)
P.I.: Sheng-Guo Wang, Professor, UNC Charlotte
UNCC WAM Research Team
with Axiom Research Team
for NCDOT RP 2016-16
Date: 03-03-2020

3
1. Report No.
NCDOT RP 2016-16
2. Government Accession No.
… …
3. Recipient’s Catalog No.
… …
4. Title and Subtitle
Improvements to NCDOT’s Wetland Prediction Model
5. Report Date
Mar. 3, 2020 (initial Nov. 28, 2019)
6. Performing Organization Code
… …
7. Author(s)
Sheng-Guo Wang (PI) with Sandy Smith, Scott Davis, and Shanshan Jiang
8. Performing Organization Report No.
… …
9. Performing Organization Name and Address
Dept. of Engineering Technology & Dept. of Computer Science
University of North Carolina – Charlotte
Charlotte, NC 28223-0001
10. Work Unit No. (TRAIS)
… …
with Axiom environmental, Inc.
218 Snow Ave., Raleigh, NC 27603
11. Contract or Grant No.
… NCDOT RP 2016-16 …
12. Sponsoring Agency Name and Address
NC Department of Transportation
13. Type of Report and Period Covered
Final Report
March 16, 2015 – Aug. 15, 2019
14. Sponsoring Agency Code
NCDOT Project # 2016-16
15. Supplementary Notes:
This project was supported by a grant from the U.S. Department of Transportation and the North Carolina Department of
Transportation
16. Abstract
This Final Report is to summarize several main achievements of this project as follows:
(i) Method Development for Wetland Type Identification and Prediction;
(ii) Wetland Type (Prediction) Automation Tool (WAMTAT) using LiDAR data for non-coastal areas;
(iii) Systematic Method Development of Wetland Functional E-Assessment for 16 NCWAM Metrics and function combination;
(iv) Initial Wetland Functional E-Assessment Tools (WAMFEAT) as extra; and
(v) User Friendly deliverables of methods, models and documentations.
These achievements fit the NCDOT research needs as: “while NCDOT has made significant advances with the concept, the
process and tools of predicting wetlands using LiDAR is under-developed.”
That also completes the goal of the project to provide an advanced wetland type prediction method and automation tool based on
ArcGIS, and to develop wetland functional e-assessment method.
The UNC Charlotte WAM Research Team with Axiom Research Team has successfully completed a number of valuable research
topics related to wetland type prediction process, such as process automation, variables exploration, data mining, and statistical
analysis, and samples selection; and wetland functional e-assessment methodology and its tools.
The acclaimed results include the deliverable WAMTAT and WAMFEAT tools and the User Guides to the tools, wetland type
prediction method, and the wetland e-functional assessment method.
17. Key Words
Wetland, Automation, Wetland Type, Modeling,
Prediction, Analysis, Functional Assessment
18. Distribution Statement
… …
19. Security Classif. (of this report)
Unclassified
20. Security Classif. (of this page)
Unclassified
21. No. of Pages
50
22. Price
… …
Form DOT F 1700.7 (8-72) Reproduction of completed page authorized

4
DISCLAIMER
The contents of this report reflect the views of the authors and not necessarily the views of the
University. The authors are responsible for the facts and the accuracy of the data presented herein.
The contents do not necessarily reflect the official views or policies of the North Carolina
Department of Transportation or the Federal Highway Administration at the time of publication.
This report does not constitute a standard, specification, or regulation.

5
ACKNOWLEDGEMENTS
________________________________________
The research team thanks the North Carolina Department of Transportation (NCDOT) for
supporting and funding this project. We extend special thanks to the project Steering and
Implementation Committee members:
• Morgan Weatherford (Chair)
• Philip S. Harris III
• LeiLani Paugh
• David Johnson
• James Mason
• Colin Mellor
• Sarah Schwarzer
• Neil Mastin
• John W. Kirby
The research team is indebted to the tremendous support provided by these committee members
in assisting with the scope of the project and providing general advice during the project.
Special thanks are given to LeiLani Paugh, Morgan Weatherford, and John Kirby at NCDOT who
provided us with valuable information and expert advice about the North Carolina Wetland
Assessment Method (NC WAM) and gave strong support for the project. Sincere thanks to Neil
Mastin for his strong support. Sincere thanks are to Philip S. Harris III for his strong support. His
warm encouragement has left a deep impression on the team when the team has worked at the
NCDOT.
The P.I. also wants to thank our partner Key Investigators Alexander P. (Sandy) Smith and Scott
Davis at Axiom Environmental, Inc. (Axiom) for their expert support, especially for wetland field
visits, functional assessments, and model testing. We worked so closely for the plan, variable set
and its generation, field work, and frequent discussions.

6
Without the help of the above individuals, this project could not have had the success we have
found, leading to our new automation tool, WAMTAT-I, for wetland type prediction and new e-
tools, WAMFEAT-I, for wetland functional e-assessment.

7
EXECUTIVE SUMMARY
________________________________________
As demonstrated by the recent 2011 FHWA Environmental Excellence Award (EEA) received by
the NCDOT and NCDENR for Excellence in Environmental Research in the development of “GIS-
based Wetland and Stream Predictive Models” [6], there is general acknowledgement of the
importance of development and integration of airborne LiDAR, digital imagery, and pattern
recognition technology into GIS-based methods for 21st century transportation and environment
monitoring, measurement, and inventories. The importance of the need for these technological
improvements is recognized both nationally and internationally in [4-10]. Currently, our team has
developed automated methods for modeling and predicting wetland boundaries within a majority
of North Carolina [1-3]. Our team has completed the tasks corresponding to the NCDOT research
need [5] that states “Resource agencies typically require some form of wetland condition and/or
wetland type to be provided prior to making decisions on alternatives. NCDOT would like to
develop GIS-based methods for determining this information for the wetlands that are predicted.”
Our goal for this project is to provide advanced GIS-based wetland type prediction methods in
non-coastal (non-tidal) areas and their tools based on LiDAR data and ArcGIS for NCDOT, and
wetland functional e-assessment methods and tools for predicting the level of function of identified
wetlands. Based on the NCDOT needs [5], we have proposed and completed a scope of work as
follows [1]:
Conduct a literature review and investigate the status of existing GIS-based methods and
models of wetland type and functional assessment prediction.
Create an automated method capable of assigning N.C. Wetland Assessment Method (NC
WAM) [7] wetland types to predicted wetlands via machine learning method RF (random
forest), regression method Logit (logistic regression), and first-hand experience of wetland
scientist’s training data [13, 49, 12.B].
Create an automated tool for wetland type prediction in non-coastal areas as WAMTAT–I
(WAM Type Automation Tool–I) [12.A, 12.B].

8
Develop a method to assess wetland function/condition of predicted wetlands based on NC
WAM [12.D, 12.G].
Conduct a field test to validate and analyze the methods and prediction results [12.E, 12.F].
Prepare documentation and products for the proposed methods, models, and tools [12.A– G].
The PI and his research team at UNCC (together, the UNCC Team) have worked closely with
wetland scientists from Axiom as a joint research team for this project. The resulting methods
offer wetland-type prediction models with machine learning (ML) methods for modeling and
prediction, and geographic information system (GIS) based approach for the wetland functional e-
assessment tools.
This project has effectively completed wetland type prediction using LiDAR data, machine
learning, pattern recognition, and GIS, thereby significantly reducing the time and cost of field
delineations. In addition, the team has developed a method and its initial tools to predict wetland
function level based on the 16 selected metrics. The automation tools vividly display results of
the process based on the GIS platform that NCDOT currently uses and requires.
The results of this project provide a cost-effective estimation of potential wetland impacts that
will improve the efficiency of initial project planning [5] and the National Environmental Policy
Act (NEPA) process [8].

9
CONTENTS
________________________________________
DISCLAIMER............................................................................................................................... 4
ACKNOWLEDGEMENTS ......................................................................................................... 5
EXECUTIVE SUMMARY .......................................................................................................... 7
CONTENTS................................................................................................................................... 9
1. INTRODUCTION.................................................................................................................. 13
2. WAM TYPE PREDICTION AUTOMATION TOOL: WAMTAT–I ............................. 16
2.1. STRUCTURE OF AUTOMATION TOOL WAMTAT–I .......................................................................................... 16
2.2. ADVANTAGES OF AUTOMATION TOOL WAMTAT–I ....................................................................................... 17
3. WAM FUNCTIONAL E-ASSESSMENT TOOLS–I: WAMFEAT–I ............................. 18
4. WETLAND TYPE PREDICTION METHODS AND MODELS ..................................... 19
4.1. WETLAND TYPE PREDICTION VARIABLES ........................................................................................................ 19
4.2. MULTI-CLASS LOGISTIC REGRESSION (LOGIT) MODEL .................................................................................... 20
4.3. RANDOM FOREST (RF) ..................................................................................................................................... 23
4.4. TRAINING DATA............................................................................................................................................... 24
4.5. POST-TREATMENT ........................................................................................................................................... 25
5. WETLAND FUNCTIONAL E-ASSESSMENT METHOD .............................................. 25
5.1. TWO KEY PROCESSES ...................................................................................................................................... 26
5.2. GENERATION OF 16 E-METRICS ....................................................................................................................... 26
5.3. FUNCTION COMBINATION FOR E-ASSESSMENT ................................................................................................ 28
5.4. INITIAL FUNCTIONAL E-ASSESSMENT TOOLS .................................................................................................. 29
6. FEATURES OF METHODS ................................................................................................ 29
6.1. METHOD OF AUTOMATION TOOL WAMTAT–I ............................................................................................... 29

10
6.2. METHOD OF FUNCTIONAL E-ASSESSMENT TOOL WAMFEAT–I ..................................................................... 30
7. CASE STUDY AND FIELD VALIDATION ...................................................................... 30
7.1. WETLAND TYPE PREDICTION AND FUNCTION ASSESSMENT IN GUILFORD COUNTY .......................................... 30
7.2. WETLAND TYPE MODEL CONSTRUCTION .......................................................................................................... 33
7.3. FIELD VALIDATION OF WETLAND TYPE PREDICTION ......................................................................................... 33
7.4. FIELD VALIDATION OF WETLAND FUNCTIONAL E-ASSESSMENT ........................................................................ 36
8. CONCLUSIONS .................................................................................................................... 38
9. RECOMMENDED FUTURE WORK ................................................................................. 41
10. PAPERS PUBLISHED AND PATENT AWARDED IN THE PROJECT PERIOD .... 44
11. REFERENCES ..................................................................................................................... 45
12. APPENDIX – PRODUCTS (SUBMITTED SEPARATELY) ......................................... 50
[A] WAMTAT-I V.5.1, (2019). S.-G. WANG (PI) AND S. JIANG. (JUNE 2019) ................................................. 50
[B] WAMTAT-I USER GUIDE FOR NCDOT, V.5.1, (2019). S.-G. WANG (PI), S. JIANG AND W. WILLIAMS. (JUNE
2019) .......................................................................................................................................................... 50
[C] WAMFEAT–I (WAM FUNCTIONAL E-ASSESSMENT TOOLS – I) V.2.0, (2019). S.-G. WANG (PI), Y. HE, Z.
ZHOU, P. PATEL AND H. PARIMI. (NOV. 2019) .......................................................................................... 50
[D] WAMFEAT–I USER GUIDE FOR NCDOT, V.2.0, (2019). PART 1 – 16 E-METRICS GENERATION, S.-G.
WANG (PI), Y. HE, AND Z. ZHOU WITH S. DAVIS AND A.S. SMITH. PART 2 -- FUNCTIONAL E-ASSESSMENT
RATING, S.-G. WANG (PI), AND H. PARIMI WITH S. DAVIS AND A.S. SMITH. (NOV. 2019) ....................... 50
[E] FIELD TEST VALIDATION IN GUILFORD COUNTY FOR WETLAND TYPE PREDICTION (2020). SANDY SMITH,
SCOTT DAVIS, SHANSHAN JIANG, AND SHENG-GUO WANG (PI). (APRIL 30 ~ MAY 1. 2019, MAY 2019,
MARCH 2020) ............................................................................................................................................. 50
[F] FIELD TEST VALIDATION AT GUILFORD COUNTY FOR WETLAND FUNCTIONAL E-ASSESSMENT TOOLS
(2019). SANDY SMITH, SCOTT DAVIS, AND SHENG-GUO WANG (PI) WITH HARI PARIMI AND ZHOU ZHOU.
(APRIL 30 ~ MAY 1. 2019, NOV. 2019) ...................................................................................................... 50
[G] COMBINATION OF METRICS TO EVALUATE WETLAND SUB-FUNCTIONS, FUNCTIONS, AND OVERALL
FUNCTIONS FOR WAM FUNCTIONAL E-ASSESSMENT TOOLS (WAMFEAT-I), (2020). SANDY SMITH AND
SCOTT DAVIS WITH SHENG-GUO WANG (PI). (MAY 2019, JANUARY 2020) .............................................. 50

11
LIST OF FIGURES
________________________________________
Figure 1. WAMTAT–I structure .................................................................................................. 17
Figure 2. Schematic block diagram of the WAMFEAT-I ........................................................... 18
Figure 3. Random Forest Modeling Method................................................................................ 24
Figure 4. Two-Stage Processes of WAMFEAT-I ........................................................................ 26
Figure 5. Wetland type model training area................................................................................. 32
Figure 6. Wetland type model prediction areas (area 1 and area 2) ............................................ 33
Figure 7. Data collected in field visit area 1 ................................................................................ 34
Figure 8. Data collected in field visit area 2 ................................................................................ 35
Figure 9. Five functional assessment field test sites for WAMFEAT-I ...................................... 37

12
LIST OF TABLES
________________________________________
Table 1. Variable Set of wetland type prediction used to build the models ................................ 20
Table 2. List of the wetland functional e-assessment metrics (refer to [7]) ................................ 27
Table 3. Wetland functional combination method check list (Axiom team) ............................... 28
Table 4. Field visit overview ....................................................................................................... 31
Table 5. Distribution of field-collected GPS points of wetland types for the 4 prediction sites . 36

13
1. Introduction
This Final Report is for the NCDOT Research Project RP 2016-16, titled “Improvements to
NCDOT’s Wetland Prediction Model” (Phase II), conducted April 1, 2015 and June 30, 2019.
Project efforts have resulted in the following achievements in non-coastal (non-tidal) areas using
LiDAR data, soils and land-cover data, and other related data:
(i) Method development for wetland type prediction and identification;
(ii) Wetland type prediction automation tool: Wetland Assessment Method (WAM) Type
Automation Tool–I (WAMTAT–I);
(iii) Systematic method development of the WAM functional e-assessment with e-metrics and
functional combination;
(iv) Systematic method development of an initial wetland functional e-assessment tool: WAM
Functional E-Assessment Tool–I (WAMFEAT–I);
(v) User-friendly products as listed in attachments [12.A – 12.G]; and
(vi) User-friendly deliverables of methods, models, and documentation.
This project builds upon results of previous projects: 1) the 2011 FHWA Environmental
Excellence Awards (EEA) for NCDOT and NCDENR, “GIS-based Wetland and Stream Predictive
Models” [6], and 2) the 2015 National “Sweet Sixteen” High Value Research Award winner
NCDOT Research Project 2013-13 “Improvements to NCDOT’s Wetland Prediction Model” [4,
49].
As recognized nationally and internationally [6-7], there is a trend toward development and
integration of airborne LiDAR, digital imagery [1-3, 6-7], and machine learning pattern
recognition technology [3, 13, 15, 16, 49, 50] for 21st century transportation and environmental
monitoring, measurement, and inventory. This technology supports enhanced prediction of
wetland boundaries.
NCDOT has sponsored research into and development of an automated wetland prediction
model to supplant the majority of field-based wetland delineations as part of a major streamlining

14
initiative for the NEPA process. The results of the model give NCDOT planners the ability to
compare alternatives of road projects [8] and reduce the time and money costs of field delineations.
Prior to this project, the existing model results did not identify individual wetland types or
functions. These characteristics were obtained when wetlands were delineated in the field.
Resource agencies typically require some form of wetland type and/or wetland condition to be
provided prior to making decisions concerning project alternatives.
The NCDOT need addressed by this project is for research and resultant products that provide
an enhanced prediction procedure for determining wetland type and level of function, thus giving
NCDOT the information needed to discuss alternatives with resource agencies. Our project
achievements (described above) satisfy the NCDOT need.
The goals of this project are to provide (1) advanced GIS-based non-coastal wetland type
prediction methods and (2) advanced GIS-based wetland functional e-assessment methods
predicting wetland functions.
The significance of LiDAR implementation into wetland identification and modeling, as stated
by the FHWA, is to exemplify “how innovative technologies can be used to speed the
environmental assessment process and ultimately advance transportation projects while protecting
the environment” [6]. Therefore, this project research, e.g., [49], is important and highly needed.
These results help NCDOT maintain its leading status in this important area of research [12.A–
12.G].
This project includes research topics related to (1) wetland type prediction, such as process
automation, variables exploration, data mining, machine learning, and statistical analyses, and (2)
wetland functional e-assessment method, such as source data, e-Metrics, functional combinations,
and statistical analyses.
Our research goals have been achieved. The deliverables are the anticipated wetland type
prediction models, the associated procedures, and wetland functional assessment potential
developed through this study, which can be incorporated into and improve NCDOT’s current
modeling efforts [5]. The required highly automated, reliable, and user-friendly methods and tools
in this research project are also completed.

15
In addition, it is emphasized that we have completed more than the required tasks committed
to in the proposal [1], i.e., not only to develop a method [e-method] to assess the wetland functional
potential and condition of predicted wetlands as stated in the proposal, but also to develop initial
corresponding e-metrics automation test tools and e-combination tools for this wetland functional
e-assessment. These project products will benefit NCDOT’s NEPA efforts by providing
innovative predictive models and significant labor saving in the NEPA process [8].
The rest of this report is organized in the following manner.
Chapter 2 summarizes our developed key product: Wetland Assessment Method Type
Prediction Automation Tool, called WAM Type Automation Tool–I, or WAMTAT–I
in short.
Chapter 3 summarizes our other developed key product: WAM Functional E-
Assessment Tools–I, or WAMFEAT–I in short.
Chapter 4 summarizes the research results of our wetland type prediction models,
including the wetland variable set and two models of Logistic regression model (Logit)
and Random Forest (RF).
Chapter 5 summarizes the wetland functional e-assessment method research.
Chapter 6 highlights the key features of the methods developed in this project.
Chapter 7 summarizes case studies conducted by applying our models and automation
tools to Guilford County, NC, which include two parts:
o Wetland type prediction and
o Wetland functional e-assessment method.
Chapter 8 provides summary remarks of the project highlighting our research results
and conclusions.
Chapter 9 proposes the recommended future work.
Chapter 10 lists published papers.
Chapter 11 provides references.
Chapter 12 includes research results attachments listed as appendices.

16
2. WAM Type Prediction Automation Tool: WAMTAT–I
The N.C. Wetland Assessment Method (NC WAM) identifies and describes 16 general
wetland types in North Carolina. Of these, 13 occur in non-tidal areas. Non-tidal areas are referred
to in this report as “non-coastal.” The 13 non-coastal wetlands include Bog, Non-Tidal Freshwater
Marsh, Floodplain Pool, Headwater Forest, Bottomland Hardwood Forest, Seep, Hardwood Flat,
Riverine Swamp Forest, Non-Riverine Swamp Forest, Pocosin, Pine Savanna, Pine Flat, and Basin
Wetland. Coastal wetlands include Salt/Brackish Marsh, Tidal Freshwater Marsh, and Estuarine
Woody Wetland.
This NCDOT project has a key product that is the wetland type prediction automation tool in
non-coastal areas. It is developed based on LiDAR DEM and auxiliary data. This tool package is
called WAMTAT–I for WAM Type Automation Tool–I.
2.1. Structure of Automation Tool WAMTAT–I
WAMTAT–I includes automation of the following tasks:
(i) Prediction variable generation,
(ii) Wetland type model generation,
(iii) Wetland type prediction,
(iv) Post-treatment,
(v) Wetland type evaluation, and
(vi) A combination of the above-listed processes for an automatic run of the WAMTAT-I.
The overview of the tool interface can be found in Fig. O-1 of Attachment B [12.B]. In addition,
WAMTAT–I has a function to easily remove individual variables, e.g., land cover or soils, or both,
and to add new variables based on user choices. WAMTAT-I also provides demo models with
these inherent choices. Thus, this product has flexibility not only in model selection but also in
variable selection.
Logit and RF models are used based on the wetland type training data and wetland prediction
variable set as described in Chapter 4. The prediction process can be run by either Logit model or
RF model or both from the modeling process. After prediction and post-treatment, accuracy is
evaluated using ground truth input data.

17
2.2. Advantages of Automation Tool WAMTAT–I
This WAMTAT provides the NCDOT with enhanced automation and flexibility with variable
selections (e.g., with both, either, or neither soil and/or land cover), RF and Logit model building,
and post-treatment. These functions lead to enhanced speed and accuracy. It also keeps the
variable maps for the user to view and make use of. This makes it particularly easy for the user to
run the model in new areas.
The WAMTAT has not only a big-data (large area) prediction ability, but also a big-data
(spread area) training ability. Moreover, the user interface is clean and easy; for example, there is
a single interface where users can set their input files once, then click one button to run the whole
process automatically.
Based on the training data, the resultant prediction map is generated to show different wetland
types and non-wetland areas in different colors. Finally, the evaluation results are presented by
the confusion matrix, which can be used to generate different evaluation indexes, e.g., Kappa,
precision, recall, and other accuracy values.
The WAMTAT-I tool structure is shown in Figure 1.
Figure 1. WAMTAT–I structure
Based on the field collected data of prediction variable y in the training data, the WAMTAT
will generate the model to predict wetland types and upland (non-wetland) type if the training data
include non-wetland type. Therefore, this tool has flexibility for users, i.e., it may work together
with WAMAT tools, or independently of WAMAT tools.
Additional information and functions of WAMTAT–I are described further in its User Guide
[12.B]. Also, we shall describe the models and the prediction methods in Chapter 4.
Model Variable
Generation
Wetland Type
Models Generation
Wetland Type
Prediction
Post-Treatment
Wetland Type
Prediction Map

18
3. WAM Functional E-Assessment Tools–I: WAMFEAT–I
The tools based on our developed e-assessment methods lead to the WAM Functional E-
Assessment Tools, referred to as WAMFEAT-I. Here, this project final report briefly summarizes
this initial extra automation tool for the wetland function e-assessment below.
The schematic block diagram of WAMFEAT-I is as shown in Figure 2.
NC WAM uses 22 metrics to evaluate wetland function. A review of these metrics determined
that 16 of these metrics can be generally evaluated remotely. The WAMFEAT-I has two key
processes (stages): the first is to evaluate 16 metrics including their corresponding sub-metrics
based on their source data, and the second is to separate the 16 metrics into sub-metrics and to
organize them for generating the sub-function ratings, the function ratings, and finally the overall
function rating.
These e-processes are initially automated e-processes in the tools when their resource data are
input into the tools. In the first process, the evaluation of each e-metric or e-sub-metric is
automated at each e-metric level via the ArcGIS platform. The second process is further automated
at the whole process level with its output of these three level ratings: sub-function ratings, function
ratings, and overall function rating.
Details of WAMFEAT-I can be found in its User Guide as Attachment D [12.D] including the
overview of the tool interface. Also, Chapter 5 will describe this method further.
Figure 2. Schematic block diagram of the WAMFEAT-I
Predicted Wetland
Types
Functional
e-Assessment
Wetland Type
Functional e-Assessment
Source Data DEM, Soil, LC etc.

19
4. Wetland Type Prediction Methods and Models
In this chapter, we summarize the wetland type prediction models and the methods we
developed and applied. We developed two models for wetland type prediction as follows:
(1) Logistic regression model (Logit) and
(2) Random Forest model (RF).
The first step is to determine the variable set for building prediction models. This step is
described in the next Section (Section 4.1). After the model variable set has been determined, the
next step is to build models by the following two methods as briefly described in Sections 4.2 and
4.3 respectively, followed by post-treatment for wetland type prediction described in Section 4.4.
4.1. Wetland Type Prediction Variables
Table 1 provides a list of the variable set used to predict wetland types via the Logit and RF
methods. These variables (except Soil and Gap) are derived and generated from LiDAR data.
Also, these variables are listed in Attachment B: “WAMTAT-I User Guide v.5.1” [12.B].
We must emphasize again that the user has flexibility to add new variables as he wishes, and
to remove existing variables as he wishes. Therefore, the predictor variable set is adjustable easily
by the user.
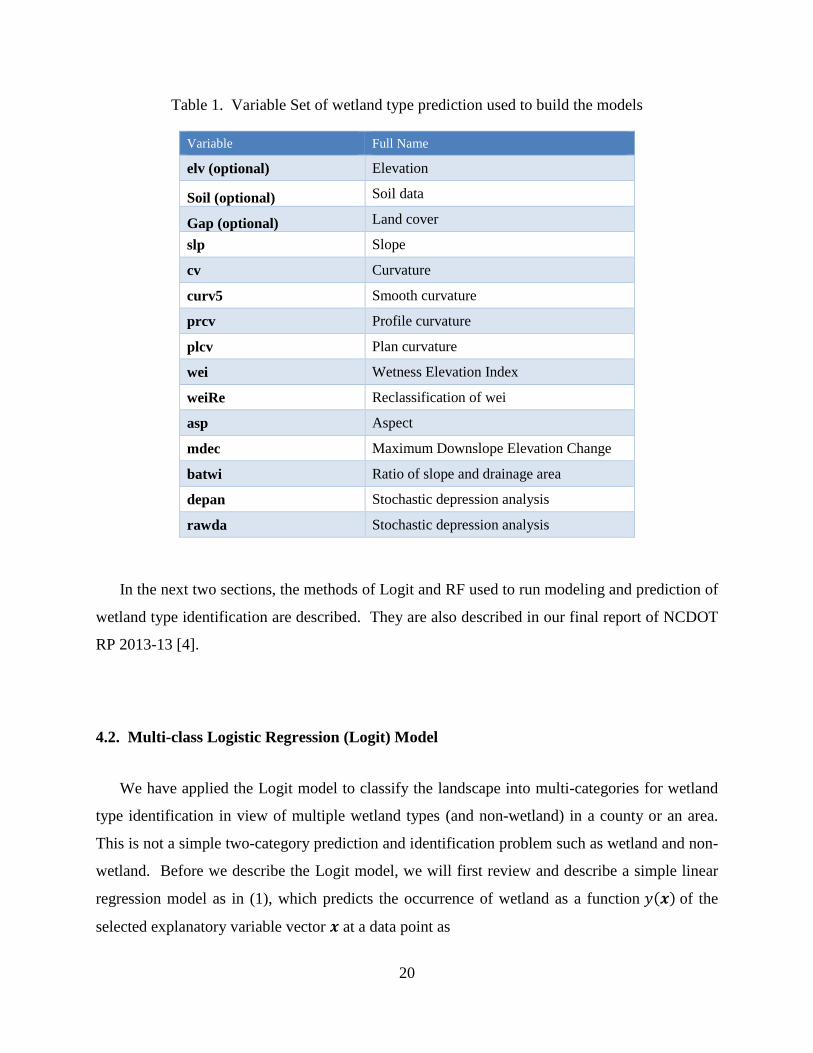
20
Table 1. Variable Set of wetland type prediction used to build the models
Variable Full Name
elv (optional) Elevation
Soil (optional) Soil data
Gap (optional) Land cover
slp Slope
cv Curvature
curv5 Smooth curvature
prcv Profile curvature
plcv Plan curvature
wei Wetness Elevation Index
weiRe Reclassification of wei
asp Aspect
mdec Maximum Downslope Elevation Change
batwi Ratio of slope and drainage area
depan Stochastic depression analysis
rawda Stochastic depression analysis
In the next two sections, the methods of Logit and RF used to run modeling and prediction of
wetland type identification are described. They are also described in our final report of NCDOT
RP 2013-13 [4].
4.2. Multi-class Logistic Regression (Logit) Model
We have applied the Logit model to classify the landscape into multi-categories for wetland
type identification in view of multiple wetland types (and non-wetland) in a county or an area.
This is not a simple two-category prediction and identification problem such as wetland and non-
wetland. Before we describe the Logit model, we will first review and describe a simple linear
regression model as in (1), which predicts the occurrence of wetland as a function 𝑦(𝒙) of the
selected explanatory variable vector 𝒙 at a data point as

21
𝑦(𝒙) = 𝜷𝑇𝒙 + 𝜀 (1)
where 𝒙 is the wetland variables vector 𝒙 = [𝑥1, 𝑥2, ⋯ , 𝑥𝑚]𝑇 , 𝑦 is a response variable as the
prediction result, 𝜷 is the coefficient vector as a “weighting factor” for the variable vector, and 𝜀
is an estimator/noise error or adjustment of this linear estimator. In a prediction area, where each
cell (e.g., 20 𝑓𝑒𝑒𝑡 × 20 𝑓𝑒𝑒𝑡) is a point, the variable vector x can be arranged in a matrix 𝑋, and
the corresponding response variable y can be presented as a vector y, where each row represents a
data point. Then we have the following linear regression model in a matrix-vector format as
𝒚(𝑋) = 𝑋𝜷 + 𝜺 (2)
If the user is only predicting between wetland and non-wetland, then the response vector should
be a binary-valued vector, i.e., the prediction model is a two-category classification; therefore, a
binary-valued model is used with a logistic function transform to (1) and called logistic regression.
Logistic regression is just to take a transform on the continuous-valued response variable to predict
a binary response with a “probability” value in [0, 1]. In statistics, the probability describing the
possible outcomes of a single trial is modeled as a function of predictor variables, using a logistic
function
𝑝(𝒙) = 𝐹(𝑡) = 𝑒𝑡
1+𝑒𝑡=
1
1+𝑒−𝑡 (3)
where 𝑡 = 𝜷𝑇𝒙 + 𝜀, i.e., to transform a continuous response 𝑦(𝑥) in (1) to a binary response.
After the logistic function transform, we may have a generalized linear model for binary response
in probability as
�̂� = 𝑙𝑜𝑔𝑖𝑡 (𝐸[𝑦|𝒙 ]) = 𝑙𝑜𝑔𝑖𝑡 (𝑝) = ln (𝑝
1−𝑝) = 𝑡 = 𝜷𝑇𝒙 + 𝜀 (4)
𝑝 = 𝐸[𝑦|𝒙 ] = 1
1+𝑒−𝜷𝑇𝒙−𝜀 (5)
where 𝑝 ∈ [0, 1]. Sometimes, it is simply written as a new response variable y as follows
𝑦 = 1
1+𝑒−𝜷𝑇𝒙−𝜀 (6)
Also, please notice that the Logit model may be extended for multi-category classification.

22
Now, this project goal is to predict and identify the wetland types, therefore the variable Y is a
multi-value function of predictive variable X.
Because the model predicts wetland types, the prediction output y is a high dimension-valued
vector, not a 2-dimension vector. Thus, its Logit mapping function is as follows with a softmax
function for the output.
𝑦𝑘(𝑖) = 𝛽𝑘0 + 𝛽𝑘1𝑥1(𝑖) + 𝛽𝑘2𝑥2(𝑖) + ⋯ + 𝛽𝑘𝑝𝑥𝑝(𝑖) + 𝜖 = 𝛽𝑘𝑇𝑋(𝑖) + 𝜖, (7)
𝛽𝑘 = [𝛽𝑘0, ⋯ , 𝛽𝑘𝑝]𝑇
, 𝑋(𝑖) = [1, 𝑥1(𝑖), ⋯ , 𝑥𝑗(𝑖), ⋯ , 𝑥𝑝(𝑖)]𝑇
for 𝑖 ∈ {1, ⋯ , 𝑛} and 𝑘 ∈ {0,1, ⋯ , 𝐾 − 1},
𝑃(𝑌(𝑖) = 𝑘) = 𝑃(𝑦𝑘(𝑖)) =𝑒𝛽𝑘
𝑇𝑋(𝑖)
∑ 𝑒𝛽𝑡𝑇𝑋(𝑖)𝐾−1
𝑡=0
(8)
𝑌(𝑖) = [𝑦0(𝑖), 𝑦1(𝑖), ⋯ , 𝑦𝐾−1(𝑖)]𝑇
�̂�(𝑖) = arg [max𝑘
𝑃(𝑌(𝑖) = 𝑘)] = arg [max𝑘
𝑒𝛽𝑘𝑇𝑋(𝑖)
∑ 𝑒𝛽𝑡𝑇𝑋(𝑖)𝐾−1
𝑡=0
]
= 𝑎𝑟𝑔 [max𝑘
𝑒𝛽𝑘𝑇𝑋(𝑖)] = 𝑎𝑟𝑔 [max
𝑘(𝛽𝑘
𝑇𝑋(𝑖))] (9)
where the notations are as described as follows,
i is the index for an observation (data sample, it corresponds to a grid cell), i.e., i is the index
number for cells, and for the i-th sample cell;
k is the index of Y for the category group which the dependent variables X map into, i.e.,
wetland type k, type 0 is assumed as non-wetland;
𝑥𝑗(𝑖), 𝑗 ∈ {1, ⋯ , 𝑝}, is a set of variables for the i-th observation, i.e., total p predictive variables
(features) for wetland type prediction;
𝑋(𝑖) = [1, 𝑥1(𝑖), 𝑥2(𝑖), … , 𝑥𝑝(𝑖)]𝑇
, it is a vector of independent variables for the i-th
observation;
𝛽𝑘 = [𝛽𝑘0, 𝛽𝑘1, 𝛽𝑘2, … , 𝛽𝑘𝑝]𝑇, it is a vector of parameters for type group k;
23
𝛽𝑘𝑇𝑋 = 𝛽𝑘0 + 𝛽𝑘1𝑥1 + 𝛽𝑘2𝑥2 + ⋯ + 𝛽𝑘𝑝𝑥𝑝 , it is known as the linear predictor;
𝑦𝑘(𝑖) = 𝛽𝑘𝑇𝑋(𝑖) is the dependent variable for cell i which value falls into the group k;
𝑃(𝑌(𝑖) = 𝑘) is the probability of observation i to be predicted as the k-th wetland type based
on measured features of the observation i.
So, the multiple type output Logit model applies softmax function to have its model function
output as
�̂�(𝑖) = 𝑎𝑟𝑔[max𝑘
𝑃(𝑌(𝑖) = 𝑘)] = 𝑎𝑟𝑔 [max𝑘
(𝛽𝑘𝑇𝑋(𝑖))] (10)
4.3. Random Forest (RF)
In order to reduce the sensitivity to data noise and the overfitting problem, we have applied a
decision tree-based classification method Random Forest (RF), a machine learning method, with
the derivative variables in Table 1 to predict wetland types. Random trees in RF are built by a set
of rules that uses a bagging technique to randomly select sub-datasets and an optimization
technique to determine the best decision tree nodes from a randomly selected sub-set of variables
[13, 48]. Thus, it leads to a random forest. Then, in the prediction process, RF can recursively
partition the data into categories. For prediction, each randomly built decision tree in the random
forest generates a decision result for each prediction point based on this prediction point data
passing this decision tree. Then the method collects the voting results from all decision trees in
the random forest. It is described in Figure 3.
The classification tree analysis (CTA), also referred to as classification and regression trees
(CART), is a typical tree-based classification method. RF aims at improving predictive ability by
taking the majority vote result from the prediction results of multiple trees in classification mode
or taking the average result of the prediction results of multiple trees in regression mode. Thus,
this method is not sensitive to noise or overfitting, as resampling is not based on weighting. In the
literature, it is used for land cover classification [23] and was recently used for the first time for
wetland identification in our publication [48].

24
Figure 3. Random Forest Modeling Method
Note that the RF model may also work for multi-category classification problems, e.g., wetland
types and non-wetlands.
4.4. Training Data
It is noted from our study that the training data are important for modeling and machine
learning methodology. This is particularly true when the method or model training is used in
mountain areas, where the majority area is non-wetland, and the size of wetland types is small
compared with non-wetland areas. Therefore, if the method and model are built and used for the
training data with non-wetland, the training data need to be balanced with appropriate ratios of
wetland and non-wetland areas.
To maximize prediction accuracy, the best balance of training data is an open research issue in
some sense, especially across a range of ecoregions and with varying amounts of available training
data. These are important topics for future research.

25
Currently, the WAMTAT has an option for users to balance non-wetland and wetland ratios in
data pre-processing by setting the training buffer size. An effective way to manage the different
ratios of available wetland data in areas with limited training data is to vary the buffer size of the
wetlands used for training data, and restrict the input training data to train wetland and non-wetland
in these buffers rather than within the entire training area.
We performed experiments using buffers ranging from 20 to 100 feet for these training data in
the field validation areas. These buffer sizes should be considered in relation to this model cell
size of 20 𝑓𝑒𝑒𝑡 × 20 𝑓𝑒𝑒𝑡 [12.E]. Testing of the potential buffer sizes indicates that an 80-foot
buffer provides the better balance of wetland and non-wetland areas in the training process.
Additional research may refine the ideal size of the buffer for model training.
4.5. Post-Treatment
Post-treatment has been developed to remove lakes, rivers, buildings, agricultural land, and
roads from the predicted wetlands. It is also used to identify one specific wetland type (Pocosin).
5. Wetland Functional E-Assessment Method
In this Chapter, we summarize the methods and framework of wetland functional e-assessment.
This includes the two main processes described in Chapter 3 that are developed and programmed
based on the NC WAM User Manual [7] and discussions with Axiom and NCDOT experts on
February 16, 2017 and with Axiom experts on May 15, 2019.
As stated in the proposal [1], the development of a method to assess wetland type function
potential and condition of predicted wetlands is an initial project focus. This method utilizes
available GIS data that provide information requested on the NC WAM Field Assessment Form
(for example: streams, land cover, soils, contour, and measurements from wetland model results).
For informational needs lacking available GIS data, our team (Axiom and the UNCC Team) have
been working closely with NCDOT experts to interpret the desired functional attributes considered
by the developers of NC WAM and identify surrogate information as needed. Our team will
continue coordinating this effort with NCDOT experts with this type of data interpretation. Our

26
research effort is to answer the question, “how closely can our results approximate each wetland’s
ability to provide anticipated sub-functions and functions as identified by NC WAM?” The
expected path toward developing an e-method is as shown in Figure 2.
5.1. Two Key Processes
In the functional e-assessment, there are two key e-processes. The first e-process generates 16
of the 22 metrics defined in the NC WAM User Manual and used by the Field Assessment Form
[7]. The second e-process generates the metric function combinations, which include each metric
rating as the input. Thus, the second process generates the sub-function ratings from the e-metrics,
the function ratings from sub-function ratings, and finally the overall functional assessment rating
from function ratings. The metric and function combination rating method of the second process
has been generated by Axiom [12.G] and automated by the UNCC Team through the generation
of e-tools.
These two key stage processes are cascaded as shown in Figure 4.
Figure 4. Two-Stage Processes of WAMFEAT-I
5.2. Generation of 16 E-Metrics
The first process of WAMFEAT is to generate 16 e-metrics from among the 22 NC WAM
Field Assessment Form metrics based on the digital resource data for the wetland function e-
assessment. The 16 e-metrics are listed in Table 2 among the 22 original NC WAM Field
Assessment Form metrics.
The UNCC Team, with Axiom’s advice and help, has developed 16 e-metric algorithms based
on the LiDAR source data and other auxiliary digital data, including DEM, soil, and land cover.

27
Information related to wetland parcels is organized within a GIS feature class (i.e., *shp), where
each row corresponds to a wetland parcel object recording its attributes. Therefore, all operations
will be processed through editing the feature class, and the final score of each metric for each
wetland site will be recorded for the second process.
Table 2. List of the wetland functional e-assessment metrics (refer to [7])
No. NC WAM Field Assessment Form Metric E-Process
1 Ground surface condition / vegetation condition No
2. 2 Surface and Sub-Surface Storage No
3 Water storage and surface relief Yes
4 Soil texture / structure Yes
5 Discharge into Wetland Yes
6 Land use Yes
7 Wetland acting as vegetated buffer Yes
8 Wetland width at the assessment area Yes
9 Inundation duration Yes
10 Indicators of deposition Yes
11 Wetland size Yes
12 Wetland intactness Yes
13 Connectivity to other natural areas Yes
14 Edge effect Yes
15 Vegetative composition Yes
16 Vegetative diversity No
17 Vegetative structure Yes
18 Snags No
19 Diameter class distribution Yes
20 Large woody debris No
21 Vegetation / open water dispersion Yes
22 Hydrologic connectivity No
For each metric, the criterion variables are the same as the list in the NC WAM User’s Manual
[7], which is generated from the input data as described in Attachment D Part 1 [12.D-1].

28
5.3. Function Combination for E-Assessment
The second process of WAMFEAT is a multiple functional rating combination process based
on the current version of NC WAM [7]. The Axiom team has developed a function combination
method to translate metric evaluations to function ratings for each wetland. This combination
method has a respective uniform algorithm for each k-factor functional rating combination
respectively, where 𝑘 = 2, 3, 4, …, as provided by Axiom. The detail of the Boolean combinations
method for each metric is referred to in Attachment G [12.G].
Based on that combination method, the UNCC Team has further implemented it into our initial
tools for the e-assessment process from the e-metrics to the overall wetland function rating, where
the e-metrics are as described in section 5.2.
We are pleased to report that the functional combination method for wetland types, as required
in this project scope [1], has been successfully completed by Axiom as shown in Table 3.
Table 3. Wetland functional combination method check list (Axiom team)
Wetland Types Mountains Piedmont Coastal Plain
1 Bog X --
2 Basin Wetland X X
3 Bottomland Hardwood Forest
X X X
4 Floodplain Pool X X
5 Hardwood Flat X
6 Headwater Forest X X X
7 Non-Riverine Swamp Forest -- -- X
8 Non-Tidal Freshwater Marsh X X
9 Pine Flat X
10 Pine Savannah -- -- X
11 Pocosin -- X
12 Riverine Swamp Forest X X X
13 Seep X X
X Completed
-- Not applicable

29
5.4. Initial Functional E-Assessment Tools
From the above-described wetland functional e-assessment methods, the e-assessment tools
have been completed by the UNCC Team with Axiom and NCDOT input. As described in Chapter
1, it is our extra effort to develop this group of tools for NCDOT to initially run the WAM
functional e-assessment.
6. Features of Methods
6.1. Method of Automation Tool WAMTAT–I
Some important features of the method in WAMTAT–I are summarized below.
(1) Flexible:
The method of WAMTAT–I has all flexibility of itself and combination with other tools. In
addition, it has the flexibility to easily add or remove the predictor variables for building
models and running predictions. Moreover, there is the flexibility of selection of the post-
treatment, which has selecting functions, and to determine one specific wetland type (Pocosin).
(2) Efficient:
The algorithm and tool are both enhanced to be able to predict large areas.
(3) User friendly:
The simple interface is more straightforward and applicable. Users can easily change their
data files, such as linking them to the files in different folders for different areas for running
wetland type modeling and prediction in different areas.
(4) Training data:
The wetland type detection method is based on the training data input. So, to let model training
have broad data based on featured regions and/or county will be important and support the
modeling process with a quality model. The tool method can handle the widely spread and
distributed training data for modeling. This function feature helps the tool to generate a better
wetland type prediction model.

30
6.2. Method of Functional E-Assessment Tool WAMFEAT–I
Some features of the method in WAMFAET–I are summarized as below.
(1) Flexible:
The method of WAMFEAT-I has feature flexibility to treat various situations in the e-metrics
evaluation, e.g., to automatically evaluate different type wetlands in non-coastal area at the
same time in its second process.
(2) Efficient:
The method is efficient, where the tools are initially developed for running e-assessment on
different wetland types under various situations.
(3) User Friendly:
The WAMFEAT-I is user friendly with the interface for each e-metric evaluation. It is easy to
use. As soon as the each one of 16 e-metrics is automatically completed, the remaining second
process for overall function evaluation is fully automated. Thus, the final wetland overall
function rating is predicted.
7. Case Study and Field Validation
This Chapter describes the field visit and the case studies. The field validation was carried out
in Guilford County during April 30 – May 1, 2019.
7.1. Wetland type prediction and function assessment in Guilford County
The prediction models are built with the training data provided by Axiom. The 1034-acre
training area (Figure 5) is the focus of a proposed extension of an existing roadway (Naco Road)
and includes wetland boundaries delineated by Axiom and approved by both federal and state
wetland regulators. The delineation comprises 123 individual wetlands totaling approximately
52.35 acres. Axiom identified wetland types and conducted functional evaluations of each
delineated wetland.

31
We implemented the automation process of wetland type prediction in two areas in Guilford
County (Table 4). The prediction areas are two parks recommended by Axiom, Hagen-Stone Park
(area 1) and Southwest Park (area 2), that are located south and southwest of the training area,
respectively. The two prediction areas were selected because they include multiple wetlands, are
located in the same level IV ecoregion as the training area, and allow public access. Figure 6
shows the locations of prediction areas and their spatial relationship with the training area. It is
emphasized that the predicted areas are not in the training areas.
Table 4. Field visit overview
Date April 31-May 1, 2019
Location Greensboro in Guilford County
Visited sites 2 areas (shown in Figure 6) that are publicly accessible:
Area 1: Hagan Stone Park
Area 2: Southwest Park
Participants Sandy Smith (Axiom)
Scott Davis (Axiom)
Sheng-Guo Wang (UNCC)
Shanshan Jiang (UNCC)
Yinan He (UNCC)
Object Field test for identification of wetland types

32
Figure 5. Wetland type model training area

33
Figure 6. Wetland type model prediction areas (area 1 and area 2)
7.2. Wetland type model construction
We ran the following process of building our models and predicting wetland types. Our models
include two machine learning methods: (1) multi-class Logistic regression (Logit) method and
(2) Random Forest (RF) method. The WAMTAT-I has two approaches: (i) train the model with
the non-wetlands data and (ii) train the model without the non-wetland data. In this field visit, we
only ran approach (i).
7.3. Field validation of wetland type prediction
The goals of this field test are: (1) to validate automated wetland type identification digital
maps generated by using the Logit model and RF model and (2) to validate wetland function e-
assessment method results. This section focuses on the first objective, the validation of the wetland
type modeling and prediction model methods.
A brief summary of the field test follows.

34
Study area
– Wetland training area: located in Guilford County as shown in Figure 5.
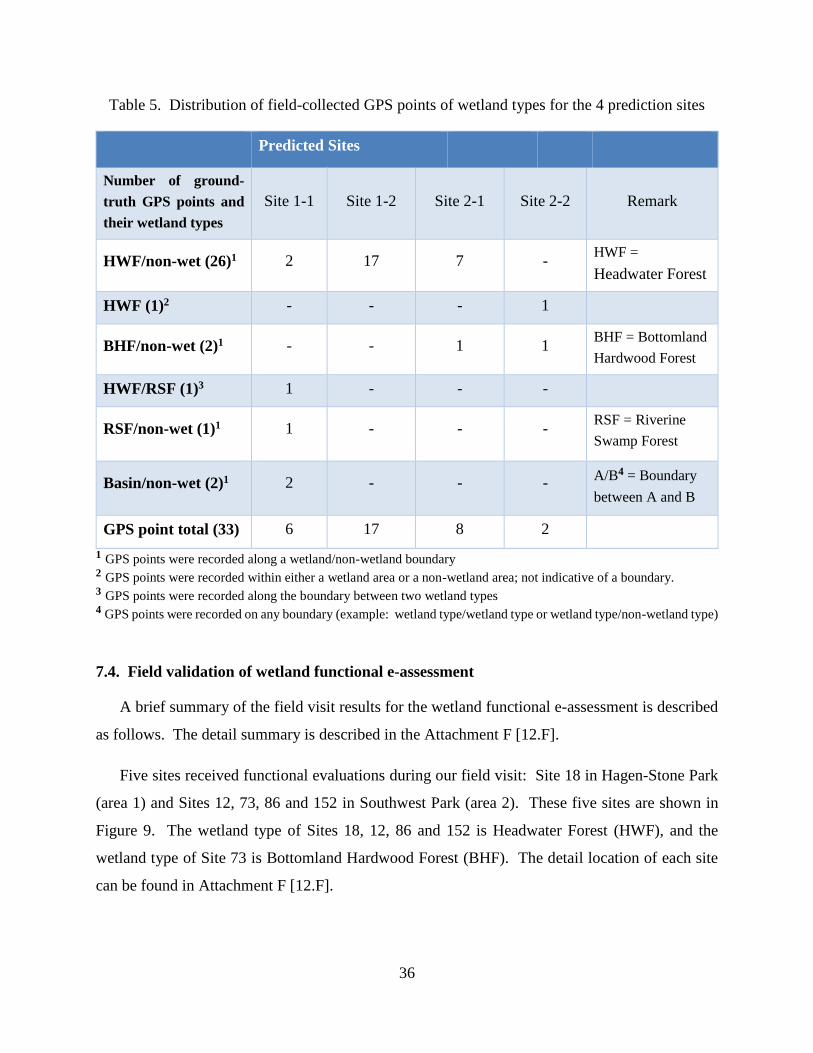
– Areas for model prediction verification: shown on Figure 6, includes 4 sites, where 2 sites
are in area 1, and 2 sites are in area 2 as shown in Figures 7 and 8 respectively. The GPS-
recorded boundary points were collected during the field visit. Table 5 shows the numbers of
wetland type points among these collected data points.
Figure 7. Data collected in field visit area 1

35
Figure 8. Data collected in field visit area 2
The field validation results show that the RF model is a better model, i.e., RF results in less
modeling error than Logit. Field results for the RF model and Logit model are described in
Attachment E [12.E].
36
Table 5. Distribution of field-collected GPS points of wetland types for the 4 prediction sites
Predicted Sites
Number of ground-
truth GPS points and
their wetland types
Site 1-1 Site 1-2 Site 2-1 Site 2-2 Remark
HWF/non-wet (26)1 2 17 7 - HWF =
Headwater Forest
HWF (1)2 - - - 1
BHF/non-wet (2)1 - - 1 1 BHF = Bottomland
Hardwood Forest
HWF/RSF (1)3 1 - - -
RSF/non-wet (1)1 1 - - - RSF = Riverine
Swamp Forest
Basin/non-wet (2)1 2 - - - A/B4 = Boundary
between A and B
GPS point total (33) 6 17 8 2
1 GPS points were recorded along a wetland/non-wetland boundary 2 GPS points were recorded within either a wetland area or a non-wetland area; not indicative of a boundary. 3 GPS points were recorded along the boundary between two wetland types 4 GPS points were recorded on any boundary (example: wetland type/wetland type or wetland type/non-wetland type)
7.4. Field validation of wetland functional e-assessment
A brief summary of the field visit results for the wetland functional e-assessment is described
as follows. The detail summary is described in the Attachment F [12.F].
Five sites received functional evaluations during our field visit: Site 18 in Hagen-Stone Park
(area 1) and Sites 12, 73, 86 and 152 in Southwest Park (area 2). These five sites are shown in
Figure 9. The wetland type of Sites 18, 12, 86 and 152 is Headwater Forest (HWF), and the
wetland type of Site 73 is Bottomland Hardwood Forest (BHF). The detail location of each site
can be found in Attachment F [12.F].

37
Figure 9. Five functional assessment field test sites for WAMFEAT-I
Green points: field visit points; Red point pin: indicating the functional assessment site area
Left 4 sites are Sites 12, 73, 86, and 152 in Southwest Park; Right 1 site is Site 18 in Hagen-
Stone Park
The main input data is our WAMTAT output at the above five sites, with other required data,
e.g., QL-2 data, DEM, NLCD, soil data, and some other related data as described in Attachment
D [12.D] to generate these 16 e-metrics with their sub-metrics. Then the second process is to run
the rating combination process as described in Chapter 5 based on these generated 16 e-metrics
with their sub-metrics.
The team has run the comparison at 4 levels: 16 metrics (36 sub-metrics), 10 sub-function
ratings (10=2+5+3 in three groups), 3 function ratings, and 1 overall function rating. The
WAMFEAT-I performance results compared with the field visit ground-truth data are described
in Attachment F [12.F].
In order to further test our WAMFEAT-I, we designed another test, where the reference data
set is generated from the 16 ground-truth metrics data via the same combination method for e-

38
metrics combination. The motivation of this test is to test the WAMFEAT-I performance
comparing to the reference at their estimated sub-function ratings, 3 function ratings, and overall
function rating score from 16 ground-truth metrics when using the same combination methodology.
This test is a full test of the WAMFEAT-I, but it is to exclude the effect of the difference between
16 metrics combination and 22 metrics combination. The test results are also described in
Attachment F [12.F]. The test results shows that the performance of the WAMFEAT-I compared
to the results from the ground-truth 16 metrics and same combination method is much better. It
means that WAMFEAT utilizes the 16 e-metrics well.
In summary, the initial WAMFEAT-I and its method have achieved a level of reliability to
prove the value of the tool, but there is space to improve the accuracy, and the PI will work further
to investigate and improve it.
To the best of our knowledge, this is the first time in the Nation that this set of products (e-
assessment method and its automation tools) are available for wetland function assessment
estimation. These products provide a starting point for further investigations and developments.
Further investigation and refinement will be needed to satisfactorily predict level of function
for all wetland types. We hope to have the opportunity to improve and raise the accuracy rate.
For that, the PI with his team has identified the related direction with valued topics.
8. Conclusions
This project mainly focuses on the following major objectives:
(a) Develop an effective predictor variable set for wetland type prediction;
(b) Develop effective methods for modeling wetland types by using LiDAR data with other
digital data;
(c) Develop a new automated practical tool for wetland type identification and prediction in non-
coastal areas by using LiDAR data and other digital data in WAMTAT-I;

39
(d) Develop an effective wetland function e-assessment method based on LiDAR data and other
digital data;
(e) Run a field test to validate our developing methods and models; and
(f) Generate deliverable methods, models, and documents.
In addition, we have developed the following tool, which is beyond our scope of tasks.
(g) Develop new practical tools for wetland function e-assessment in WAMFEAT-I.
According to the results, we summarize this project completion status as follows:
(1) We have successfully completed this important project for the NCDOT needs of wetland
type modeling and prediction by LiDAR data with auxiliary digital data.
(2) We have successfully completed this important project for the NCDOT needs of wetland
function e-assessment method by LiDAR data with auxiliary digital data.
(3) Two systematic models were developed and are presented for the automation of wetland
type prediction in non-coastal areas. They are multi-class logistic regression model (Logit)
and Random Forest model (RF).
(4) We have successfully developed a wetland type prediction automation tool, WAMTAT-I,
in non-coastal areas as a deliverable for NCDOT to use internally. The User Guide of
WAMTAT-I is also ready for delivery with the tools together [12.A, 12.B].
(5) We have successfully completed and developed wetland function e-assessment method
[12.G].
(6) We have successfully developed wetland function e-assessment tools, WAMFEAT-I, as a
deliverable for NCDOT to use internally. The User Guide of WAMFEAT-I is also ready
for deliverable with the tools together [12.C, 12.D].
(7) The models with automation have been applied to predict wetlands types for two test areas
in Guilford County. The resultant data, digital map, and validation analysis are in
attachment [12.E].
(8) The methods have been applied to predict wetland functional e-assessment for two test

40
areas in Guilford County. The resultant data, digital map, and validation analysis are in
attachment [12.F]
(9) A field visit to Guilford County has been conducted with Axiom support [12.E, 12.F]. Our
prediction results are mainly based on LiDAR data with other digital data that may change
over time. The tools can be run based on updated data.
(10) Further research and study in this important research area and direction is needed to
advance our developed system with the tools and the NCDOT’s excellent NC WAM work,
which will continue NCDOT’s role as a national leader in wetland assessment.
The deliverable products include:
(i) Systematic digital wetland types prediction methods,
(ii) Logit model and RF model for wetland type prediction in non-coastal areas,
(iii) Systematic Wetland Functional e-Assessment e-method,
(iv) WAMTAT-I v.5.1 (WAM Type Automation Tool-I),
(v) WAMTAT-I v.5.1 User Guide,
(vi) WAMFEAT-I v.2.0 (WAM Functional E-Assessment Tool-I),
(vii) WAMFEAT-I v.2.0 User Guide,
(viii) Wetland E-Functional Combination Method.
Under the Master Agreement Contract MA-2009-01 Between NCDOT and the UNCC Team,
we are pleased to report and conclude that this project has been successfully completed.
During this project period, we have published three papers that are listed in Chapter 10. Among
them are one at the International Conference on Ecology and Transportation, held in Raleigh, NC,
2015 [10.1], and another two at the Transportation Research Board (TRB) Annual Meetings, 2017
and 2018 respectively [10.2, 10.3]. In addition, we took part in an invited presentation at TRB
Annual Meeting 2016 [10.4]. Furthermore, our previous research result has led to a US Patent
issued by USPTO on 07-17-2018 [10.5].

41
9. Recommended Future Work
To follow the discussion and comments from NCDOT and the current achievement of this
project, the research team proposes the recommended future work as follows.
(1) Differences in Wetland Types, Metrics, and Functions across Various Parts of the State.
The forms and functions of wetlands are anticipated to differ across various parts of the
state. This is reflected in a broad sense by the differences in functional assessment
combinations developed by the WFAT and provided in the NC WAM User’s Manual [7].
Thus, an analysis of the various forms of wetland types and their specific functions should
be considered further to improve WAMFEAT performance. The weighting of available e-
metrics to reflect the relative importance of metrics to specific sub-function and function
ratings should be investigated to more accurately assess wetland function. Currently,
metrics are considered evenly when performing functional assessments, while it is
understood that some available e-metrics play a larger role in accurately assessing wetland
function than others. Thus, an analysis of the various forms of wetland types and their
specific functions should be considered further to improve both WAMTAT and
WAMFEAT performance.
(2) Wetland Information Library
As the WAMTAT and WAMFEAT processes are dependent upon geographically local
training data, a justifiable concern of the NCDOT regards classification and assessment of
wetlands in areas where appropriate training data are lacking. A library of reference data
is recommended as available training data for the tool rather than relying solely on
potentially limited input data. This will help in cases when users input data may not contain
all wetland types that may exist in the prediction area or be representative of a range of
local conditions. These situations can result in incorrect predictions of wetland types and
e-assessments. Thus, the suggested wetland information library will help to eliminate or
minimize these situations. It is anticipated that the library will enrich available training data
to enhance the modeling quality and prediction performance, and that this library will
eventually be comprised of information NCDOT will provide from its catalogue of wetland
delineations.

42
(3) Training Data Balance
For prediction accuracy and prevention of model overfitting, the best balance of input
training data across various portions of the state is an open research issue. In order to
balance wetland and non-wetland training data, an assessment of general wetland to non-
wetland ratios within the various ecoregions of the state is anticipated to provide a baseline
measure to identify the way that training data should be selected for the prediction tools.
While the WAMTAT has provided flexibility for selecting a buffer size for the training
data in the tool interface, an assessment of regional (level IV ecoregion) and local
(landform) wetland/non-wetland ratios to optimize the selection of this training data buffer
size. This is anticipated to be particularly true for cases of limited training data as well as
large amounts of training data.
(4) Hydrography Dataset
In the field test of WAMFEAT, the UNCC Team used the NC DEQ hydrography data
provided by NC OneMap. It has been recommended that the more complete stream data
compiled by the NCDOT ATLAS Hydrography dataset be incorporated, and the research
team concurs with this advice. The WAMFEAT tools have the flexibility to incorporate
the NCDOT ATLAS Hydrography dataset file instead of linking to NC OneMap.
(5) Field Verifications
Additional field validations of WAMTAT and WAMFEAT results are recommended
within more portions of the state. Field verifications are anticipated to be one of the most
useful tasks for validating results as well as improving model predictions. Valuable future
work is anticipated to include the selection of multiple trial areas within various level IV
ecoregions across the state. Field investigations are anticipated to verify and provide
training data related to wetland type identification and specific NC WAM sub-function and
function identification to optimize the combination of available e-metrics.
(6) Tidal Wetlands Functional E-Assessment
Research to date has focused on the identification and evaluation of riparian and non-
riparian wetland types. These wetlands represent the majority of wetlands within North

43
Carolina; however, tidal wetlands represent some of the most ecologically important, and
most heavily regulated waters in the state. With the limited number of wetland types (four)
located in tidal areas, and a more limited geographic range of these wetlands, evaluations
of tidal wetland assessments are the logical complement to the current and recommended
wetland modeling processes and are anticipated to be worth the effort involved as the basic
framework for development and functional combination have been developed.

44
10. Papers Published and Patent Awarded in the Project Period
Published Papers and/or Presentations:
[10.1] S.-G. Wang, J. Deng, M.-Z. Chen, M. Weatherford, and L. Paugh, “Random Forest
Classification and Automation for Wetland Identification based on DEM Derivatives,”
2015 ICOET (International Conference on Ecology and Transportation), paper 778,
session 408-2, Raleigh, US, pp.1-17, Sept. 2015.
[10.2] J. Deng, A.S. Smith, S. Davis, M. Weatherford, L. Paugh, and S.-G. Wang*, “Identification
of NC Wetland Types by Lidar Data and Tree Based Machine Learning Methods,” the TRB
96th Annual Meeting, National Academies of Sciences-Engineering-Medicine, Paper
No.17-01199, pp.1-16, Washington, DC, Jan. 2017.
[10.3] J. Deng, S.-G. Wang*, A.S. Smith, S. Davis, M. Weatherford, L. Paugh, and S. Jiang,
“Scale Analysis of a Wetland Classification Model based on LiDAR Data and Machine
Learning Methodology,” the TRB 97th Annual Meeting, National Academies of Sciences-
Engineering-Medicine, Paper No. 18-01812, pp.1-16, Washington, DC, Jan. 2018.
[10.4] S.-G. Wang†, M. Weatherford, L. Paugh, N. Mastin†, and J. Kirby, “Improvements to
NCDOT’s Wetland Prediction Model,” State Department of Transportation High Value
Research, 2015 AASHTO-RAC Awarded Sweet 16 High Value Research Project, at the
TRB 95th Annual Meeting, National Academies of Sciences-Engineering-Medicine,
Washington DC, Jan. 10-14, 2016. (†Invited Presenters/Speakers)
* Corresponding Author
US Patent issued by USPTO:
[10.5] S.-G. Wang, L. Bai, J. Deng, M. Jia, M. Weatherford, L. Paugh, W. Tang, M. Chen and S.
Chen, “Wetland Modeling and Prediction,” Invention Documents, UNC Charlotte, April
18, 2014. US 10,026,221, 07-17-2018. (14/724,787, 05-28-2015)
45
11. References
[1] S.-G. Wang, A.P. Smith, and S. Davis, “Improvements to NCDOT’s Wetland Prediction
Model (Phase II),” Proposal of NCDOT RP 2016-16, 2014.
[2] S.-G. Wang, L. Bai, J. Deng, M. Jia, M. Weatherford, L. Paugh, W. Tang, M. Chen, and S.
Chen, “Automation Process Method of Generating Wetland Predictive Variables,” Invention
Documents, UNC Charlotte, April 18, 2014. (USPTO 62/003,869, 05/28/2014)
[3] S.-G. Wang, L. Bai, L. Paugh and M. Weatherford, “Automation Process Method of Wetland
Modeling and Prediction,” Invention Documents, UNC Charlotte, April 18, 2014. (USPTO
62/003,887, 05/28/2014)
[4] S.-G. Wang (PI), “Final Report on Project – Improvements to NCDOT’s Wetland Prediction
Model,” NCDOT RP 2013-13, UNCC, 08-14-2014.
[5] M. Weatherford and P. Harris, (2014). “Improvements to NCDOT’s Wetland Prediction
Model,” Call for New Research Needs, 6106, NCDOT, 2014.
[6] FHWA, 2011 Environmental Excellence Awards, GIS-based Wetland and Stream Predictive
Models – For Excellence in Environmental Research, http://environment.fhwa.dot.gov/
eea2011/environment_research.htm, 2011.
[7] N.C. Wetland Functional Assessment Team, (2016). N.C. Wetland Assessment Method (NC
WAM) User Manual, version 5, Feb. 2016.
[8] National Environmental Policy Act (NEPA), US Environmental Law, 1970.
[9] Environmental Laboratory, (1987). “Corps of Engineers Wetlands Delineation Manual,” U.S.
Army Engineer Waterways Experiment Station, Vicksburg, MS, 1987.
[10] Minnesota Geospatial Information Office, “How is LiDAR Data Used to Protect Water Quality
in Minnesota?” www.mngeo.state.mn.us/chouse/.../lidar_uses_waterquality.html.
[11] J. Pomeroy et al., “Prairie Hydrological Model Study,” Final Report, Center for Hydrology,
University of Saskatchewan, http://www.usask.ca/hydrology/reports/CHRpt07_PHMS-Final-
Report_Jan10.pdf, 2010.
[12] North Carolina Floodplain Mapping Program, www.ncfloodmaps.com, Retrieved June 6,
2014.
[13] L. Breiman, “Random forests”, Machine learning, vol. 45, pp.5-32, 2001.
[14] Environmental Laboratory, (2010). “Regional Supplement to the Corps of Engineers
Wetland Delineation Manual: Atlantic and Gulf Coastal Plain Region,” U.S. Army Engineer
Research and Development Center, Vicksburg, MS, 2010.

46
[15] S.-G. Wang and B. Wang, “Modeling of Distributed RLC Interconnect and Transmission
Line via Closed Forms and Recursive Algorithms,” IEEE Trans. VLSI, Vol.18, No.1,
pp.119-130, 2010.
[16] Baker, C., Lawrence, R., Montagne, C., & Patten, D. (2006). Mapping wetlands and riparian
areas using Landsat ETM+ imagery and decision-tree-based models. Wetlands, 26(2), 465-
474.
[17] Boyd, J. (2002). Compensating for Wetland Losses under the Clean Water Act. Environment:
Science and Policy for Sustainable Development, 44(9), 43-44.
[18] Castañeda, C., & Ducrot, D. (2009). Land cover mapping of wetland areas in an agricultural
landscape using SAR and Landsat imagery. Journal of Environmental Management, 90(7),
2270-2277.
[19] Corcoran, J.M., Knight, J.F., & Gallant, A.L (2013). Influence of Multi-Source and Multi-
Temporal Remotely Sensed and Ancillary Data on the Accuracy of Random Forest
Classification of Wetlands in Northern Minnesota, Remote Sensing, 5(7), 3212-3238.
[20] EPA, U.S. (2012, Octorber 05, 2012). Section 404 of the Clean Water Act: how wetlands are
defined and identified. Retrieved 0529, 2014, from http://water.epa.gov/type/wetlands/
outreach/fact11.cfm.
[21] Freeman, E., Frescino, T., & Moisen, G. (2009). ModelMap: An R package for modeling
and map production using Random Forest and Stochastic Gradient Boosting. USDA Forest
Service, Rocky Mountain Research Station, 507.
[22] Friedman, J.H. (2002). Stochastic gradient boosting. Computational Statistics & Data
Analysis, 38(4), 367-378.
[23] Gislason, P.O., Benediktsson, J.A., & Sveinsson, J.R. (2006). Random forests for land cover
classification. Pattern Recognition Letters, 27(4), 294-300.
[24] Henderson, F.M., & Lewis, A.J. (2008). Radar detection of wetland ecosystems: a review.
International Journal of Remote Sensing, 29(20), 5809-5835.
[25] Hess, L.L., Melack, J.M., Novo, E.M., Barbosa, C.C., & Gastil, M. (2003). Dual-season
mapping of wetland inundation and vegetation for the central Amazon basin. Remote
Sensing of Environment, 87(4), 404-428.
[26] Hogg, A., & Todd, K. (2007). Automated discrimination of upland and wetland using terrain
derivatives. Canadian Journal of Remote Sensing, 33(S1), S68-S83.

47
[27] Hope, Morgan and Draper, Will. "Living LiDAR Data Collection at QL2 -
Proceedings.esri.com." Web. 04 Feb. 2016. http://proceedings.esri.com/library/userconf/
proc14/papers/386_161.pdf.
[28] Johnston, Keith. "Quality Level 2 (QL2) LIDAR Utilization at NCDOT." NC MicroStation
Local Users Group, 16 Dec. 2015. Web. 23 Mar. 2016. http://www.nclug.com/
uploads/2/8/0/0/2800961/ql2_lidar_to_nclug_4-3_20151216.pdf
[29] Keddy, P. A. (2010). Wetland ecology: principles and conservation: Cambridge University
Press.
[30] Kennedy, G., and Mayer, T. (2002). Natural and constructed wetlands in Canada: An
overview. Water Quality Research Journal of Canada, 37(2), 295-325.
[31] Lawrence, R., Bunn, A., Powell, S., and Zambon, M. (2004). Classification of remotely
sensed imagery using stochastic gradient boosting as a refinement of classification tree
analysis. Remote Sensing of Environment, 90(3), 331-336.
[32] Lawrence, R.L., and Wright, A. (2001). Rule-based classification systems using
classification and regression tree (CART) analysis. Photogrammetric Engineering and
Remote Sensing, 67(10), 1137-1142.
[33] Loh, W. Y. (2011). Classification and regression trees. Wiley Interdisciplinary Reviews:
Data Mining and Knowledge Discovery, 1(1), 14-23.
[34] Olhan, E., Gun, S., Ataseven, Y., and Arisoy, H. (2010). Effects of agricultural activities in
Seyfe Wetland. Scientific Research and Essays, 5(1), 9-14.
[35] Pal, M., & Mather, P. (2003). An assessment of the effectiveness of decision tree methods
for land cover classification. Remote Sens. Environ, 86, 554–565.
[36] Rebelo, L.-M., Finlayson, C., and Nagabhatla, N. (2009). Remote sensing and GIS for
wetland inventory, mapping and change analysis. Journal of Environmental Management,
90(7), 2144-2153.
[37] Rodríguez-Galiano, V., Abarca-Hernández, F., Ghimire, B., Chica-Olmo, M., Atkinson, P.,
and Jeganathan, C. (2011). Incorporating spatial variability measures in land-cover
classification using Random Forest. Procedia Environmental Sciences, 3, 44-49.
[38] Team, R. D. C. (2012). R: A Language and Environment for Statistical Computing. R
Foundation for Statistical Computing, Vienna, Austria, 2012: ISBN 3-900051-07-0.
[39] Thompson, Gary. "North Carolina LiDAR - Federal Geographic Data Committee." Mar.
2015. Web. 23 Mar. 2016. <https://www.fgdc.gov/ngac/meetings/march-2015/north-
carolina-lidar-ngac-march-2015.pdf>

48
[40] Toner, M., and Keddy, P. (1997). River hydrology and riparian wetlands: a predictive model
for ecological assembly. Ecological applications, 7(1), 236-246.
[41] Wang, L., Lyons, J., Kanehl, P., and Bannerman, R. (2001). Impacts of urbanization on
stream habitat and fish across multiple spatial scales. Environmental Management, 28(2),
255-266.
[42] Wang, S.-G., Bai, L., Deng, J., Jia, M., Weatherford, M., Paugh, L., Tang, W., Chen, M., and
Chen, S. (2015). Wetland Modeling and Prediction, Patent application, US 14/724,787,
USPTO, 05-28-2015.
[43] Weatherford, Morgan. "NCDOT Wetland Modeling Program Updates." 16 Oct. 2014. Web.
04 Feb. 2016. <https://connect.ncdot.gov/resources/Environmental/Merger Process
Meetings/NCDOT LiDAR Presentation.pdf>
[44] Wright, C., and Gallant, A. (2007). Improved wetland remote sensing in Yellowstone
National Park using classification trees to combine TM imagery and ancillary environmental
data. Remote Sensing of Environment, 107(4), 582-605.
[45] Zomer, R., Trabucco, A., and Ustin, S. (2009). Building spectral libraries for wetlands land
cover classification and hyperspectral remote sensing. Journal of Environmental
Management, 90(7), 2170-2177.
[46] J. Deng, A.S. Smith, S. Davis, M. Weatherford, L. Paugh, and S.-G. Wang*, (2017).
“Identification of NC Wetland Types by Lidar Data and Tree Based Machine Learning
Methods”, the TRB 96th Annual Meeting, National Academies of Sciences-Engineering-
Medicine, Paper No.17-01199, pp.1-16, Washington, DC, Jan. 2017.
[47] J. Deng, S.-G. Wang*, A.S. Smith, S. Davis, M. Weatherford, L. Paugh, and S. Jiang, (2018).
“Scale Analysis of a Wetland Classification Model based on LiDAR Data and Machine
Learning Methodology”, TRB 97th Annual Meeting, National Academies of Sciences-
Engineering-Medicine, Paper No. 18-01812, pp.1-16, Washington, DC, Jan. 2018.
http://amonline.trb.org/2017trb-1.3983622/t010-1.3999179/514-1.3999392/18-01812-
1.3999398/18-01812-1.3999399?qr=1 and Represented at NCDOT Research and Innovation
Summit 2019, at NC A&T University, May 7, 2019.
[48] S.-G. Wang, J. Deng, M.-Z. Chen, M. Weatherford, and L. Paugh, (2015). “Random Forest
Classification and Automation for Wetland Identification based on DEM Derivatives”, 2015
ICOET (International Conference on Ecology and Transportation), paper 778, session 408-
2, Raleigh, US, pp.1-17, Sept. 2015.

49
[49] S.-G. Wang†, M. Weatherford, L. Paugh, N. Mastin†, and J. Kirby, (2016). “Improvements
to NCDOT’s Wetland Prediction Model,” State Department of Transportation High Value
Research, 2015 AASHTO-RAC Awarded Sweet 16 High Value Research Project, at the TRB
95th Annual Meeting, National Academies of Sciences-Engineering-Medicine, Washington
DC, Jan. 10-14, 2016. (†Invited Presenters/Speakers)
[50] S.-G. Wang, L. Bai, J. Deng, M. Jia, M. Weatherford, L. Paugh, W. Tang, M. Chen, and S.
Chen, (UNCC & NCDOT) (2018). “Wetland Modeling and Prediction,” US Patent
10,026,221, 07-17-2018.
*Corresponding Author

50
12. Appendix – Products (submitted separately)
[A] WAMTAT-I v.5.1, (2019). S.-G. Wang (PI) and S. Jiang. (June 2019)
[B] WAMTAT-I User Guide for NCDOT, v.5.1, (2019). S.-G. Wang (PI), S. Jiang and W.
Williams. (June 2019)
[C] WAMFEAT–I (WAM Functional E-Assessment Tools – I) v.2.0, (2019). S.-G. Wang (PI),
Y. He, Z. Zhou, P. Patel and H. Parimi. (Nov. 2019)
[D] WAMFEAT–I User Guide for NCDOT, v.2.0, (2019). Part 1 – 16 E-Metrics Generation,
S.-G. Wang (PI), Y. He, and Z. Zhou with S. Davis and A.S. Smith. Part 2 -- Functional E-
Assessment Rating, S.-G. Wang (PI), and H. Parimi with S. Davis and A.S. Smith. (Nov.
2019)
[E] Field Test Validation in Guilford County for Wetland Type Prediction (2020). Sandy Smith,
Scott Davis, Shanshan Jiang, and Sheng-Guo Wang (PI). (April 30 ~ May 1. 2019, May
2019, March 2020)
[F] Field Test Validation at Guilford County for Wetland Functional E-Assessment Tools (2019).
Sandy Smith, Scott Davis, and Sheng-Guo Wang (PI) with Hari Parimi and Zhou Zhou.
(April 30 ~ May 1. 2019, Nov. 2019)
[G] Combination of Metrics to Evaluate Wetland Sub-Functions, Functions, and Overall
Functions for WAM Functional E-Assessment Tools (WAMFEAT-I), (2020). Sandy Smith
and Scott Davis with Sheng-Guo Wang (PI). (May 2019, January 2020)