improved algorithm for modis satellite retrievals of
TRANSCRIPT
Improved algorithm for MODIS satellite retrievals of aerosol
optical depths over western North America
Easan Drury,1 Daniel J. Jacob,1 Jun Wang,2 Robert J. D. Spurr,3 and Kelly Chance4
Received 5 November 2007; revised 28 March 2008; accepted 29 April 2008; published 21 August 2008.
[1] Quantitative evaluation of chemical transport models (CTMs) with aerosol opticaldepth (AOD) products retrieved from satellite backscattered reflectances can becompromised by inconsistent assumptions of aerosol optical properties and errors insurface reflectance estimates. We present an improved AOD retrieval algorithm for theMODIS satellite instrument using locally derived surface reflectances and CTM aerosoloptical properties for the 0.47, 0.65, and 2.13 mm MODIS channels. Assuming negligibleatmospheric reflectance at 2.13 mm in cloud-free conditions, we derive 0.65/2.13 surfacereflectance ratios at 1� � 1.25� horizontal resolution for the continental United States insummer 2004 from the subset of top-of-atmosphere (TOA) reflectance data withminimal aerosol reflectance. We obtain a mean ratio of 0.57 ± 0.10 for the continentalUnited States, with high values over arid regions and low values over the Midwestprairies. The higher surface reflectance ratios explain the high AOD bias over aridregions found in previous MODIS retrievals. We calculate TOA reflectances for eachMODIS scene using local aerosol optical properties from the GEOS-Chem CTM, and fitthese reflectances to the observed MODIS TOA reflectances for a best estimate ofAODs for that scene. Comparison with coincident ground-based (AERONET) AODobservations at 16 sites in the western and central United States in summer 2004 showspoor correlation in the daily data but the correlation improves as averaging timeincreases. Averaging over the available coincident observations (n = 11–44 days) results instrong correlations (R0.47mm = 0.90, R0.65mm = 0.67) and a 19% low bias, representingconsiderable improvement over the operational MODIS AOD products in this region.
Citation: Drury, E., D. J. Jacob, J. Wang, R. J. D. Spurr, and K. Chance (2008), Improved algorithm for MODIS satellite retrievals of
aerosol optical depths over western North America, J. Geophys. Res., 113, D16204, doi:10.1029/2007JD009573.
1. Introduction
[2] Atmospheric aerosols are of major concern for publichealth and climate change, but their sources and atmospher-ic distributions remain poorly constrained. Observations totest global aerosol simulations from chemical transportmodels (CTMs) have been mainly confined to surface sites.Satellite-borne radiometers offer a new perspective for CTMevaluation and aerosol data assimilation by providing globalaerosol optical depth (AOD) retrievals [Chin et al., 2004].In this regard, the Moderate Resolution Imaging Spectror-adiometer (MODIS) instruments aboard the NASA Terraand Aqua satellites are a particularly valuable resource.These instruments have 7 dedicated wavelength bands foraerosol retrieval (0.47 mm, 0.55 mm, 0.65 mm, 0.85 mm,
1.24 mm, 1.65 mm, and 2.13 mm), a nadir resolution of 250–500 m, and a cross-track nadir swath of 2330 km providingglobal coverage every one to two days [Kaufman et al.,1997]. Daily AOD products have been retrieved operation-ally from the measured top-of-atmosphere (TOA) reflectan-ces at 10 � 10 km2 resolution since February 2000 (Terra)and June 2002 (Aqua) [Remer et al., 2005, 2006].[3] MODIS AODs are most reliable over the oceans
[Remer et al., 2002; Levy et al., 2005]. The collection 4MODIS land AODs were subject to higher uncertainty and apersistent high bias [Ichoku et al., 2002; Kinne et al., 2003;Chin et al., 2004; Matsui et al., 2004; Abdou et al., 2005;Levy et al., 2005]. A preliminary evaluation of the mostrecent collection 5 MODIS land AODs shows significantglobal mean improvement [Levy et al., 2007b], but willrequire more studies to quantify regional improvements.[4] The quality of land AOD products derived from
MODIS depends critically on the ability to distinguish theatmospheric from the surface reflectance. This task is moredifficult over land than over the ocean, where albedos arelow and predictable (excepting glitter reflection cases)[Kaufman et al., 1997]. In the operational MODIS AODretrieval over land, Level 2 TOA reflectances are estimatedfor every 10 � 10 km2 scene from the ensemble of Level 1
JOURNAL OF GEOPHYSICAL RESEARCH, VOL. 113, D16204, doi:10.1029/2007JD009573, 2008ClickHere
for
FullArticle
1School of Engineering and Applied Sciences, Harvard University,Cambridge, Massachusetts, USA.
2Department of Geosciences, University of Nebraska, Lincoln,Nebraska, USA.
3RT Solutions, Inc., Cambridge, Massachusetts, USA.4Atomic and Molecular Physics Division, Harvard-Smithsonian Center
for Astrophysics, Cambridge, Massachusetts, USA.
Copyright 2008 by the American Geophysical Union.0148-0227/08/2007JD009573$09.00
D16204 1 of 11
TOA reflectances at 0.5 � 0.5 km2 within that scene that arecloud-free and have low 2.13 mm surface reflectance, hencedesignated as ‘‘dark targets’’ [Gao et al., 2002; Martins etal., 2002; Remer et al., 2005, 2006; Levy et al., 2007b].Level 2 TOA reflectances are averaged from this ensembleof cloud screened, ‘‘dark target’’ pixels at 0.47, 0.65 and2.13 mm, and are further corrected for gaseous absorptionby water vapor and ozone [Remer et al., 2006; Levy et al.,2007b]. At 2.13 mm the atmospheric transmissivity is closeto unity when aerosols are small or AODs are low, and theMODIS 2.13 mm band measures surface reflectance in theseconditions. Visible surface reflectances at 0.47 and 0.65 mmare inferred from 2.13 mm TOA reflectances throughspecified 0.47/0.65 and 0.65/2.13 surface reflectance rela-tionships. The collection 4 MODIS AOD algorithm uses afixed value of 0.50 ratio for these reflectance relationships[Kaufman et al., 1997, 2002; Remer et al., 2005]. The mostrecent collection 5 algorithm allows the 0.65/2.13 surfacereflectance ratio to vary over a range 0.39–0.67 based onlocally retrieved Normalized Difference Vegetation Index(NDVI) values and the sun/satellite measurement geometry[Remer et al., 2006; Levy et al., 2007b]. In collection 5, the0.47 mm surface reflectance is estimated by a 0.47/0.65 ratioof 0.49 plus an intercept of 0.005. (r0.47
s = 0.49*r0.65s +
0.005) [Remer et al., 2006; Levy et al., 2007b]. Theatmospheric reflectances at 0.47 and 0.65 mm are obtainedby subtracting the surface reflectances from the measuredTOA reflectances.[5] Retrieving AODs from the residual atmospheric
reflectances at 0.47 and 0.65 mm requires independentestimation of the wavelength-dependent single scatteringalbedo (w), which is the fraction of incident radiation that isscattered by an aerosol particle, and the scattering phasefunction (P), which characterizes the directional intensity ofscattered light. These aerosol optical properties depend onthe aerosol chemical composition, size distribution, phase,and mixing state [Wang and Martin, 2007]. The operationalMODIS AOD algorithm assigns fixed aerosol optical prop-erties for individual continental regions and seasons (col-lection 4: [Kaufman et al., 1997; Remer et al., 2005] andcollection 5: [Remer et al., 2006; Levy et al., 2007a]). Aproblem then in comparing the MODIS AODs to thosegenerated by a CTM is that the CTM aerosol opticalproperties vary with the aerosol chemical composition ineach model grid and time step and hence differ from thoseused in the MODIS retrieval. The comparison cannot beinterpreted quantitatively in terms of an AOD discrepancy[Weaver et al., 2007].[6] This paper presents a new method for inferring AODs
over land from MODIS reflectances. We use (1) locallyderived 0.65/2.13 surface reflectance ratios from subsets ofMODIS data with minimal aerosol reflectance, (2) localaerosol optical properties from a global CTM (GEOS-Chem),and (3) an external multiple scattering radiative transfermodel to simulate TOA reflectances which we use to inferAODs. We demonstrate that this new approach improves theretrieval of AODs from MODIS over the western and centralUnited States, a region that has been identified as particularlyproblematic for the operational algorithms [Chu et al., 2002;Abdou et al., 2005]. Our method also allows quantitativeevaluation of a CTM aerosol simulation through comparisonof MODIS vs. CTM-derived TOA reflectances. Our study
focuses on the continental United States during the July 1–August 15, 2004 period of the ICARTT aircraft campaign[Fehsenfeld et al., 2006; Singh et al., 2006], because ourlonger-term interest is to use the ensemble of MODIS andICARTT observations to analyze aerosol distributions overthe United States. That analysis will be the topic of asubsequent paper.
2. Data Sets
2.1. MODIS
[7] We use MODIS Level 2 raster data (Collection 004,version 4.2.2. http://ladsweb.nascom.nasa.gov/data/search.html) at 10 � 10 km2 resolution from the Terra(1030 local time overpass) and Aqua (1330 local timeoverpass) satellites over the continental United States(45–135�W, 25–55�N) for the period July 1–August 15,2004. The data consist of cloud screened [Gao et al., 2002;Martins et al., 2002] TOA reflectances (rl*) at wavelengthsl = 0.47, 0.65, and 2.13 mm over land, calculated from themeasured backscattered radiances Il:
rl* ¼ IlpFlmo
ð1Þ
where Fl is the TOA solar radiation flux and mo is thecosine of the solar zenith angle. The Level 2 MODISreflectances are corrected for ozone and water vaporabsorption using climatological ozone profiles and watervapor from the National Centers for EnvironmentalPrediction (NCEP), and suitable absorption cross sectionstaken from the literature [Vermote et al., 1997; Remer et al.,2006]. We did not find significant differences between thereflectances measured by Terra and Aqua during our studyperiod.[8] We associate each 10 � 10 km2 MODIS reflectance
scene with 1� � 1.25� grid squares for the continentalUnited States, corresponding to the native resolution ofthe GEOS-Chem CTM. This yields 200–1000 measure-ments per grid square for the summer of 2004. We removedata where we expect sub-grid surface water contamination,diagnosed by 2.13 mm reflectance values less than 0.03[Levy et al., 2005].[9] We also obtained collection 4 MODIS AODs (level 2,
filtered in the same manner as the reflectances above)[Kaufman et al., 1997; Remer et al., 2005] and collection5 MODIS AODs (level 3, quality assured) [Remer et al.,2006; Levy et al., 2007b] to compare with the MODISAODs generated by our algorithm. Following the notationin the MODIS Algorithm Theoretical Basis Document(ATBD), we henceforth refer to collection 4 data as C004and collection 5 data as C005 [Remer et al., 2005, 2006].
2.2. AERONET
[10] The global AERONET network consists of ground-based sun photometers that measure AODs at 0.34, 0.38,0.44, 0.50, 0.67, 0.87, and 1.02 mm with an uncertainty of±0.01 [Holben et al., 2001]. We used hourly level 2AERONET AOD data (cloud screened and quality assured[Smirnov et al., 2000]) from 31 stations in the United Statesand Canada. We selected AERONET AODs measuredwithin ±1 hour of Terra and Aqua overpasses and compared
D16204 DRURY ET AL.: IMPROVED MODIS AOD ALGORITHM OVER LAND
2 of 11
D16204
them with the collocated MODIS AODs retrieved within the1� � 1.25� grid square associated with each station. Whilewe required only one collocated MODIS and AERONETAOD, we frequently retrieved multiple MODIS AODswithin each grid square. We interpolated the 0.44 mm and0.50 mm AERONET AODs to 0.47 mm using the Angstromexponent [Eck et al., 1999] and compared them with0.47 mm MODIS AODs. We compared the 0.67 mmAERONET AODs with 0.65 mm MODIS AODs.
3. Derivation of Visible Surface Reflectances
[11] Following the notation of the MODIS ATBD [Remeret al., 2005], the TOA reflectance rl* observed by MODIScan be expressed as the sum of the atmospheric reflectancerla and the surface reflectance rl
s :
rl* q0; q;fð Þ ¼ ral q0; q;fð Þ þ Fl q0ð ÞTl qð Þ1� slrsl q0; q;fð Þ r
sl q0; q;fð Þ ð2Þ
where qo is the solar zenith angle, q is the satellite zenithangle, f is the relative azimuth angle between solar andsatellite directions and rl
s (q0, q, f) is the bidirectionalreflectance distribution function (BRDF) of the surface. Thesurface BRDF is corrected for the atmospheric attenuationof downward solar and upward line-of-sight beams inequation (2). Here Fl (q0) is the downward transmissionfunction representing solar attenuation from TOA to thesurface, Tl (q) is the upward atmospheric transmissionfunction, sl is the atmospheric reflectance for upwardradiation, and the 1/(1 � slrl) term represents thesummation over the infinite series of atmosphere-surfacereflections.[12] The atmosphere is approximately transparent at
2.13 mm except under cloudy or unusually dusty con-ditions, so that the clear sky TOA reflectance at thatwavelength can be assumed equal to the surface reflec-tance, r2.13* = r2.13
s [Kaufman et al., 2002]. Furtherassuming that the angular dependence of the BRDF doesnot vary with wavelength [Kaufman et al., 2002], one can
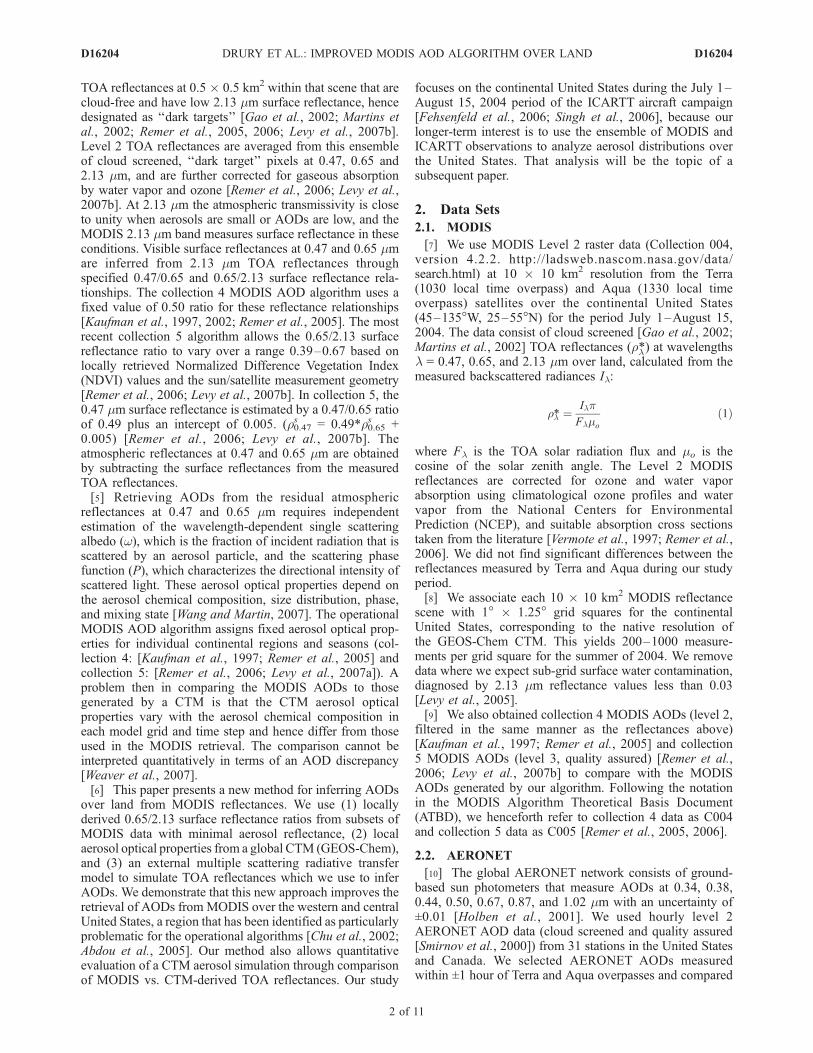
Figure 1. Scatterplot of nadir scaled MODIS TOA reflectances at 0.65 mm r0.65* (qo, q, f)mo m vs.2.13 mm F0.65 (qo)T0.65 (q)r2.13* (qo, q, f)mom for six illustrative 1� � 1.25� grid squares in the UnitedStates and Canada with AERONET sites and for the July 1–August 15, 2004 period. The blue squaresidentify the subset of reflectance data used to define the linear lower envelope (see text) and fromthere the surface reflectance ratio x0.65 by reduced-major-axis (RMA) linear regression. Correlationcoefficients (R) and RMA regression slopes (x0.65) are shown inset.
D16204 DRURY ET AL.: IMPROVED MODIS AOD ALGORITHM OVER LAND
3 of 11
D16204
derive the surface reflectances at visible wavelengths byscaling to the 2.13 mm reflectance:
rslq0; q;fð Þ ¼ xlr2:13* q0; q;fð Þ ð3Þ
where the surface reflectance ratio xl is independentlyspecified. We described in the Introduction how x0.47 andx0.65 are specified in the C004 and C005 MODISoperational retrievals. Since the atmospheric reflectancecontribution is greater at 0.47 mm than 0.65 mm, deriving anestimate of x0.47 is more difficult than for x0.65, as will beexplained below. The C004 MODIS operational algorithmassumed x0.47 = x0.65/2 [Levy et al., 2007b] and we do thesame here. The C005 algorithm makes a similar assumption,as given in the Introduction.[13] We present here a new approach to estimate the
surface reflectance ratio x0.65 for a given location from therelationship between the MODIS TOA reflectances at 0.65and 2.13 mm. We use for this purpose the subset of localMODIS TOA reflectances with the lowest aerosol reflec-tance values, diagnosed as described below. Under suchconditions, the atmosphere is optically thin so that theatmospheric reflectance varies linearly with AOD, and wecan further assume sl � 1. Equation (2) becomes
r0:65* qo; q;fð Þ ¼ t0:65w0:65P0:65 qo; q;fð Þmo;m
þ F0:65 qoð ÞT0:65 qð Þx0:65r2:13* qo; q;fð Þð4Þ
where t0.65 is the atmospheric optical depth at 0.65 mm, andw and P are respectively the single-scattering albedo andscattering phase function for the complete atmosphere (notjust aerosol). Further multiplying by mom removes thedependence of TOA reflectance on atmospheric path length,giving nadir scaled reflectances rl*mom :
r0:65* qo; q;fð Þmom ¼t0:65w0:65P0:65 qo; q;fð Þþ x0:65 � F0:65 qoð ÞT0:65 qð Þr2:13* qo; q;fð Þmom
ð5Þ
[14] We see from equation (5) that a scatterplot of r0.65*
(qo, q, f)mom vs. F0.65(qo)T0.65(q)r2.13* (qo, q, f)mom in an
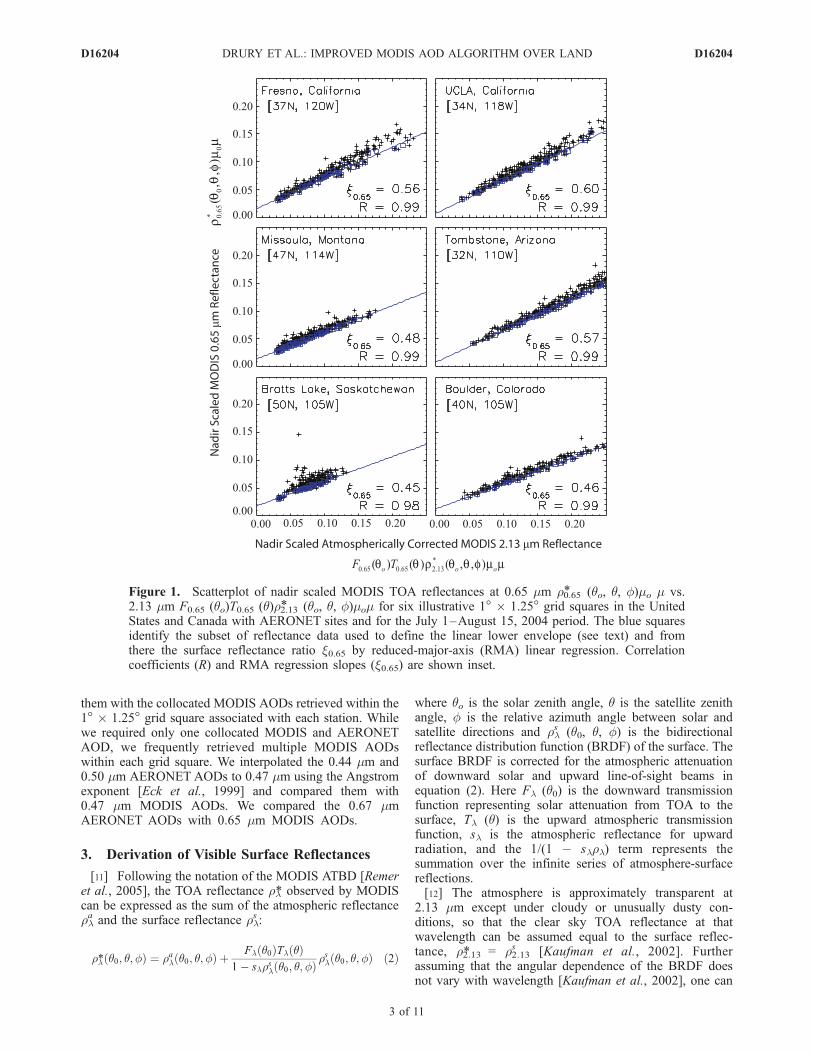
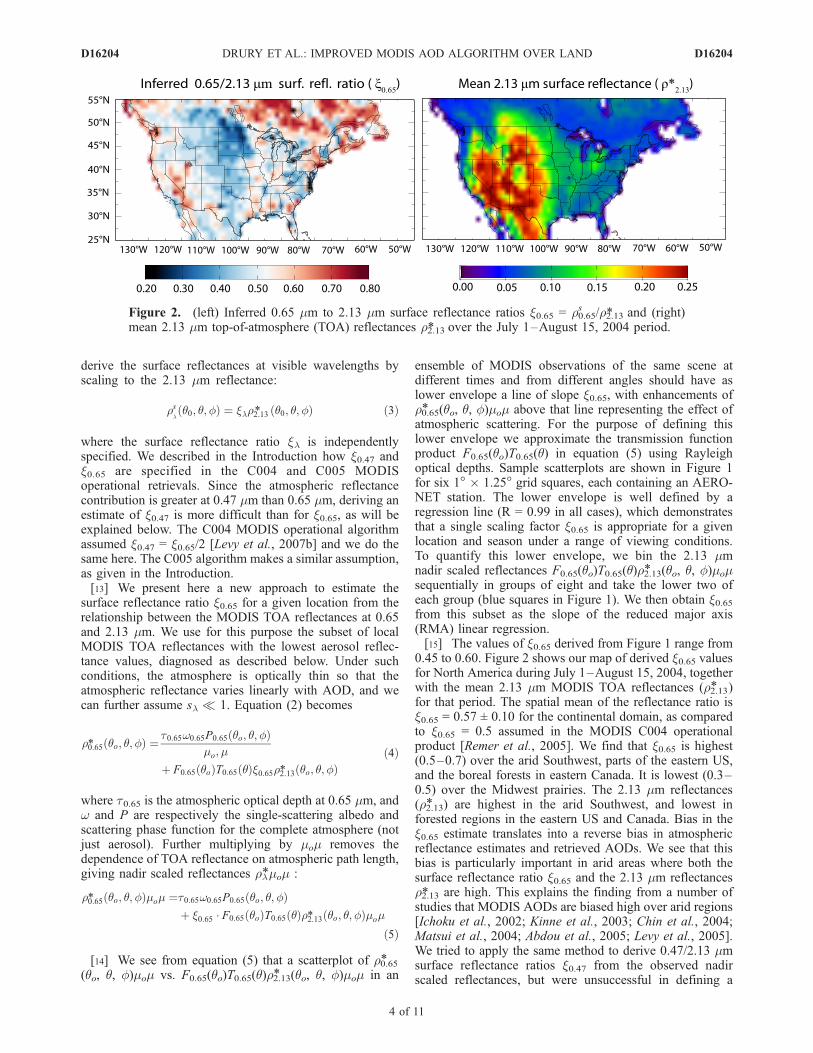
ensemble of MODIS observations of the same scene atdifferent times and from different angles should have aslower envelope a line of slope x0.65, with enhancements ofr0.65* (qo, q, f)mom above that line representing the effect ofatmospheric scattering. For the purpose of defining thislower envelope we approximate the transmission functionproduct F0.65(qo)T0.65(q) in equation (5) using Rayleighoptical depths. Sample scatterplots are shown in Figure 1for six 1� � 1.25� grid squares, each containing an AERO-NET station. The lower envelope is well defined by aregression line (R = 0.99 in all cases), which demonstratesthat a single scaling factor x0.65 is appropriate for a givenlocation and season under a range of viewing conditions.To quantify this lower envelope, we bin the 2.13 mmnadir scaled reflectances F0.65(qo)T0.65(q)r2.13* (qo, q, f)momsequentially in groups of eight and take the lower two ofeach group (blue squares in Figure 1). We then obtain x0.65from this subset as the slope of the reduced major axis(RMA) linear regression.[15] The values of x0.65 derived from Figure 1 range from
0.45 to 0.60. Figure 2 shows our map of derived x0.65 valuesfor North America during July 1–August 15, 2004, togetherwith the mean 2.13 mm MODIS TOA reflectances (r2.13* )for that period. The spatial mean of the reflectance ratio isx0.65 = 0.57 ± 0.10 for the continental domain, as comparedto x0.65 = 0.5 assumed in the MODIS C004 operationalproduct [Remer et al., 2005]. We find that x0.65 is highest(0.5–0.7) over the arid Southwest, parts of the eastern US,and the boreal forests in eastern Canada. It is lowest (0.3–0.5) over the Midwest prairies. The 2.13 mm reflectances(r2.13* ) are highest in the arid Southwest, and lowest inforested regions in the eastern US and Canada. Bias in thex0.65 estimate translates into a reverse bias in atmosphericreflectance estimates and retrieved AODs. We see that thisbias is particularly important in arid areas where both thesurface reflectance ratio x0.65 and the 2.13 mm reflectancesr2.13* are high. This explains the finding from a number ofstudies that MODIS AODs are biased high over arid regions[Ichoku et al., 2002; Kinne et al., 2003; Chin et al., 2004;Matsui et al., 2004; Abdou et al., 2005; Levy et al., 2005].We tried to apply the same method to derive 0.47/2.13 mmsurface reflectance ratios x0.47 from the observed nadirscaled reflectances, but were unsuccessful in defining a
Figure 2. (left) Inferred 0.65 mm to 2.13 mm surface reflectance ratios x0.65 = r0.65s /r2.13* and (right)
mean 2.13 mm top-of-atmosphere (TOA) reflectances r2.13* over the July 1–August 15, 2004 period.
D16204 DRURY ET AL.: IMPROVED MODIS AOD ALGORITHM OVER LAND
4 of 11
D16204
lower-envelope regression line. This can be explained bythe stronger atmospheric scattering at 0.47 than at 0.65 mm,limiting the availability of data with sufficiently low atmo-spheric scattering to constrain the lower envelope. There-fore we assume x0.47 = x0.65/2, following the MODISCollection 4 ATBD [Kaufman et al., 1997; Remer et al.,2005].
4. CTM Simulation of MODIS Reflectances
[16] As noted in the Introduction, a comparison of CTMAODs with MODIS AODs cannot be interpreted quantita-tively in terms of AOD discrepancies if the aerosol opticalproperties assumed in the MODIS retrieval are inconsistentwith those in the CTM simulation. We overcome this issuehere by using local GEOS-Chem CTM aerosol informationto simulate TOA reflectances for each 10 � 10 km2 MODISscene. GEOS-Chem TOA reflectances are calculated at thetime and location of each MODIS scene (including bothTerra and Aqua overpasses) in the local sun-satellite geom-etry of the MODIS instrument. In a subsequent paper we willapply the method to compare MODIS and GEOS-ChemTOA reflectances for evaluation of the GEOS-Chem aerosolsimulation; here we apply it to derive an improved MODISAOD product.[17] GEOS-Chem is driven by GEOS-4 assimilated
meteorological data from the NASA Global Modelingand Assimilation Office (GMAO). The GEOS-4 data have1� � 1.25� horizontal resolution with 48 vertical layersand 6-h temporal resolution (3-h for surface properties).
We degrade the horizontal resolution to 2� � 2.5� forthe GEOS-Chem simulation. GEOS-Chem simulatesmass concentrations for six aerosol types: (1) dust in fivesize classes, (2) sulfate, (3) nitrate, (4) black carbon (BC),(5) organic carbon (OC), and (6) fine and coarse mode seasalt. Detailed descriptions of the GEOS-Chem aerosolsimulation including evaluations with surface observationsin the US are given by Fairlie et al. [2007] for dust,Alexander et al. [2005] for sea salt, and Park et al. [2003,2004, 2006] for the other aerosol types. Specific evalua-tion with ICARTT aircraft aerosol observations over east-ern North America during summer 2004 is presented byHeald et al. [2006]. Biomass burning sources for thesummer 2004 are from a daily inventory constrained bysatellite fire counts [Turquety et al., 2007].[18] Aerosol optical properties in GEOS-Chem are derived
from simulated aerosol mass concentrations by assuming thatthe aerosols have lognormal size distributions with type-dependent size parameters, hygroscopic growth factors, andrefractive indices taken from the Global Aerosol Data Set(GADS) [Koepke et al., 1997]. Hygroscopic growth iscalculated using GEOS-4 relative humidity fields at theoriginal 1� � 1.25� resolution. A standard Mie code is usedto calculate optical properties for each aerosol type. Weassume an external mixture of aerosols and sum over aerosoltypes to generate an optical depth, an ensemble singlescattering albedo, and an ensemble scattering phase functionfor each vertical model layer.[19] The mean GEOS-Chem AODs and single scattering
albedos for the MODIS overpass times (1030 and 1330
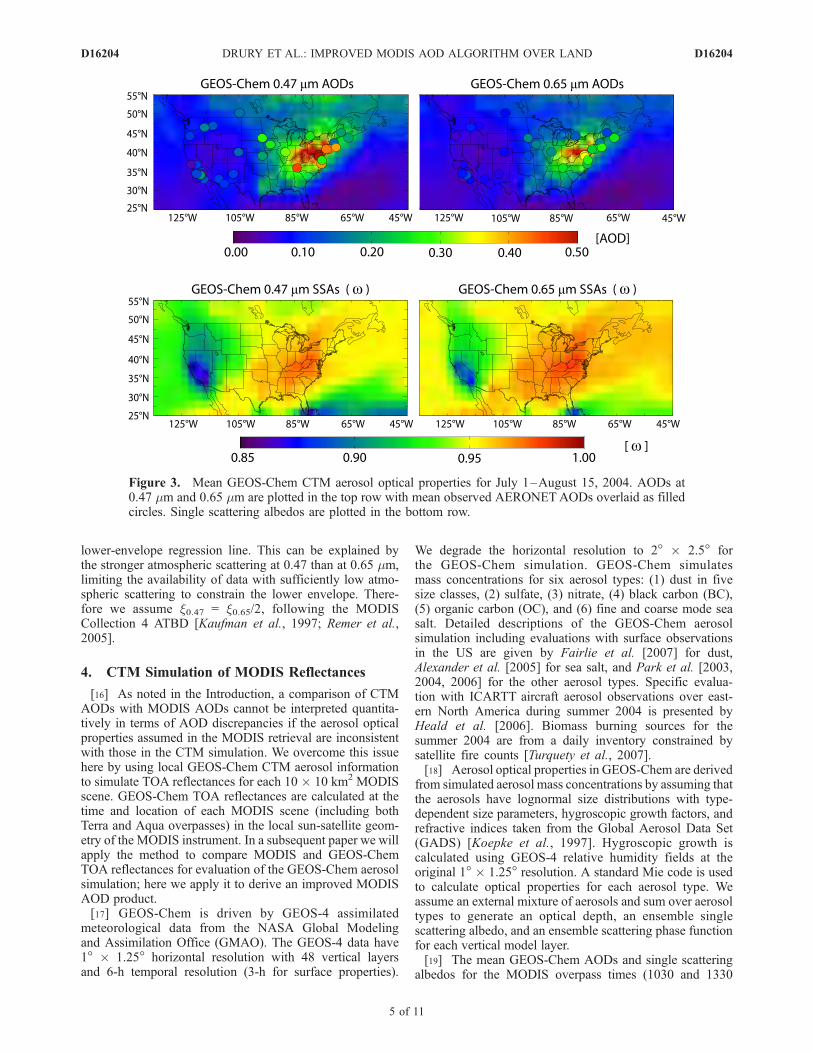
Figure 3. Mean GEOS-Chem CTM aerosol optical properties for July 1–August 15, 2004. AODs at0.47 mm and 0.65 mm are plotted in the top row with mean observed AERONETAODs overlaid as filledcircles. Single scattering albedos are plotted in the bottom row.
D16204 DRURY ET AL.: IMPROVED MODIS AOD ALGORITHM OVER LAND
5 of 11
D16204
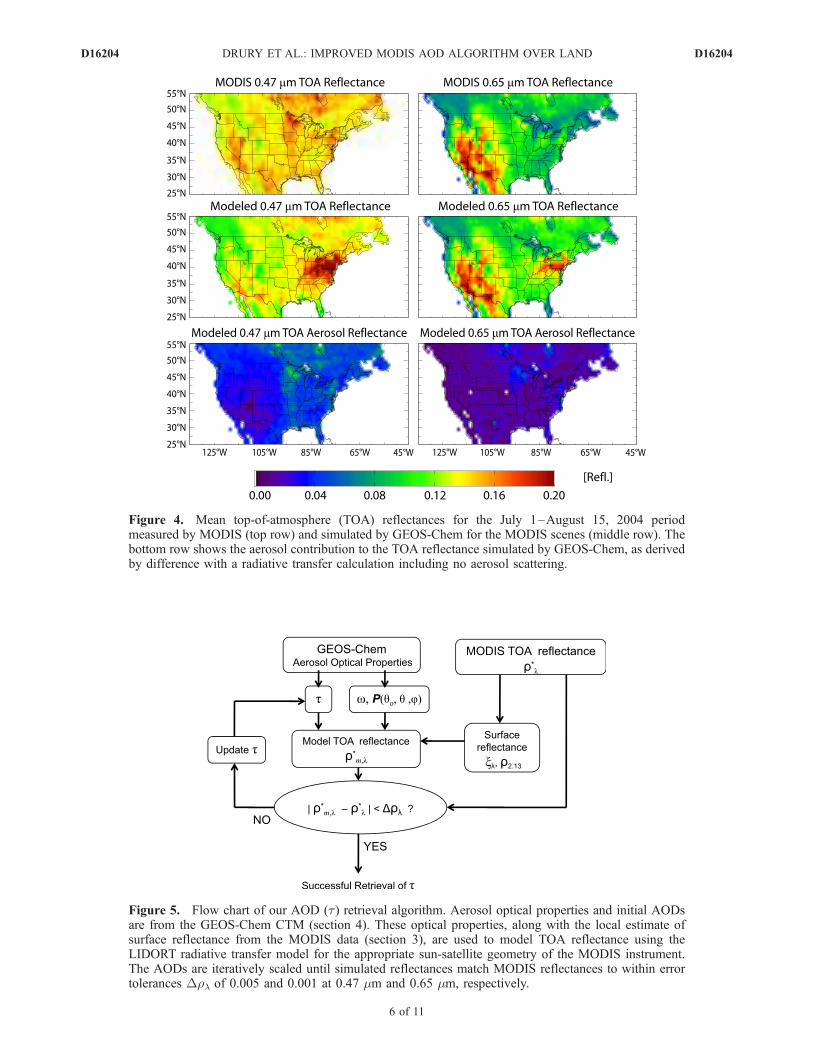
Figure 4. Mean top-of-atmosphere (TOA) reflectances for the July 1–August 15, 2004 periodmeasured by MODIS (top row) and simulated by GEOS-Chem for the MODIS scenes (middle row). Thebottom row shows the aerosol contribution to the TOA reflectance simulated by GEOS-Chem, as derivedby difference with a radiative transfer calculation including no aerosol scattering.
Figure 5. Flow chart of our AOD (t) retrieval algorithm. Aerosol optical properties and initial AODsare from the GEOS-Chem CTM (section 4). These optical properties, along with the local estimate ofsurface reflectance from the MODIS data (section 3), are used to model TOA reflectance using theLIDORT radiative transfer model for the appropriate sun-satellite geometry of the MODIS instrument.The AODs are iteratively scaled until simulated reflectances match MODIS reflectances to within errortolerances Drl of 0.005 and 0.001 at 0.47 mm and 0.65 mm, respectively.
D16204 DRURY ET AL.: IMPROVED MODIS AOD ALGORITHM OVER LAND
6 of 11
D16204
local time) during July 1–August 15, 2004 are plotted inFigure 3. Mean AERONET AODs collected within ±1 hourof MODIS overpasses are overlaid. GEOS-Chem AODscapture the general spatial distribution of AODs measuredby AERONET, with correlations (R values) of 0.67 and0.59 at 0.47 mm and 0.65 mm, respectively. The GEOS-Chem AODs are biased low at 0.47 mm relative to AERO-NET with an RMA regression slope of 0.85 ± 0.14, andbiased high at 0.65 mm with a regression slope of 1.25 ±0.22. The modeled AODs are highest over the industrialMidwest where the AOD is dominated by sulfate aerosols,resulting also in high single scattering albedos. Singlescattering albedos are lowest over the Los Angeles Basinwhere the model has high concentrations of black carbonand dust. Low single-scattering albedos over Florida are dueto Saharan dust.[20] We use the LIDORT discrete ordinate multiple
scattering radiative transfer model Version 2.3 [Spurr etal., 2001; Spurr, 2002] to simulate TOA reflectances foreach 10 � 10 km2 MODIS scene on the basis of theGEOS-Chem aerosol information. LIDORT provides exacttreatment of the single-scattering radiation field and apseudo-spherical capability to deal with solar beam atten-uation in a curved atmosphere. We include molecular
(Rayleigh) scattering based on the scattering cross sectionsfrom Bodhaine et al. [1999] weighted by the relativespectral response functions of the MODIS instrument(ftp://ftp.mcst.ssai.biz/pub/permanent/MCST/PFM_L1B_LUT_4-30-99/L1B_RSR_LUT/). We scale Rayleigh opticaldepths using local GEOS-4 surface pressures. Polarization isneglected in this version of LIDORT.[21] Figure 4 compares the TOA reflectances measured
by MODIS for the July 1–August 15, 2004 period to thereflectances simulated by LIDORT based on GEOS-Cheminputs. The surface reflectances used for this simulationwere described in section 3. Also shown in Figure 4 is theaerosol contribution to the TOA reflectance, obtained as thedifference between LIDORT calculations with and withoutaerosol. This contribution is small, highlighting the impor-tance of accurately estimating surface reflectance in theAOD retrieval. For example, TOA reflectances at 0.65 mmare higher in the Southwest than in the Northeast because ofhigh surface reflectances. GEOS-Chem shows maximumaerosol reflectances in the Northeast, consistent with theAERONET data (Figure 3), and producing TOA reflectancemaxima in the middle rows of Figure 4. The MODIS TOAreflectance data show much less enhancement in the North-
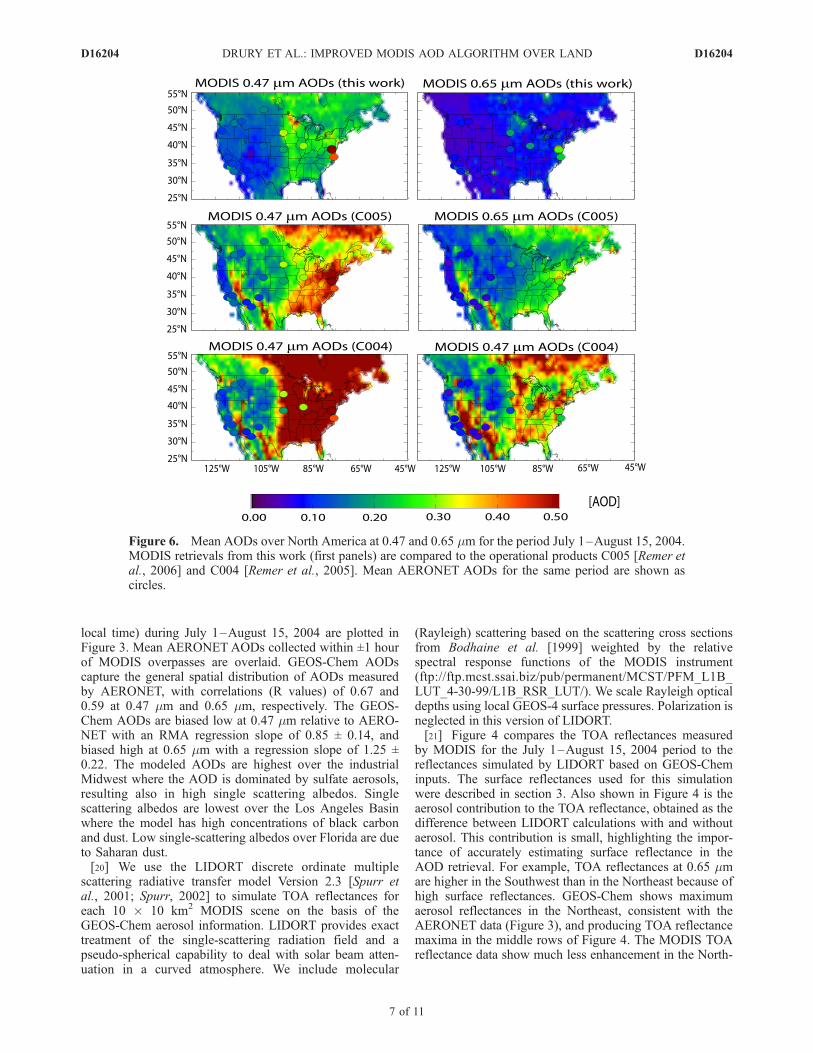
Figure 6. Mean AODs over North America at 0.47 and 0.65 mm for the period July 1–August 15, 2004.MODIS retrievals from this work (first panels) are compared to the operational products C005 [Remer etal., 2006] and C004 [Remer et al., 2005]. Mean AERONET AODs for the same period are shown ascircles.
D16204 DRURY ET AL.: IMPROVED MODIS AOD ALGORITHM OVER LAND
7 of 11
D16204
east (top rows); this discrepancy is discussed briefly belowand will be the topic of a subsequent paper.
5. Retrieving MODIS Aerosol Optical Depths
[22] We retrieve here MODIS AODs from the comparisonof modeled (LIDORT/GEOS-Chem) to observed (MODIS)TOA reflectances (Figure 4) by fitting the modeled AODs tomatch the observed reflectances. The inversion is not linear,since the atmosphere cannot in general be assumed opticallythin. Therefore the fitting is performed iteratively until thedifference between modeled and measured reflectance iswithin Dr0.47* = ±0.005 and Dr0.65* = ±0.001. These limitscorrespond to the uncertainty caused by neglecting polari-zation in the radiative transfer code [Levy et al., 2004]. Thisleads to precision limits of Dt0.47 = ±0.05 and Dt0.65 =±0.01 in AODs retrieved for each scene. No further qualityassurance is applied in the retrieval.[23] Figure 5 is a flow chart of our AOD retrieval
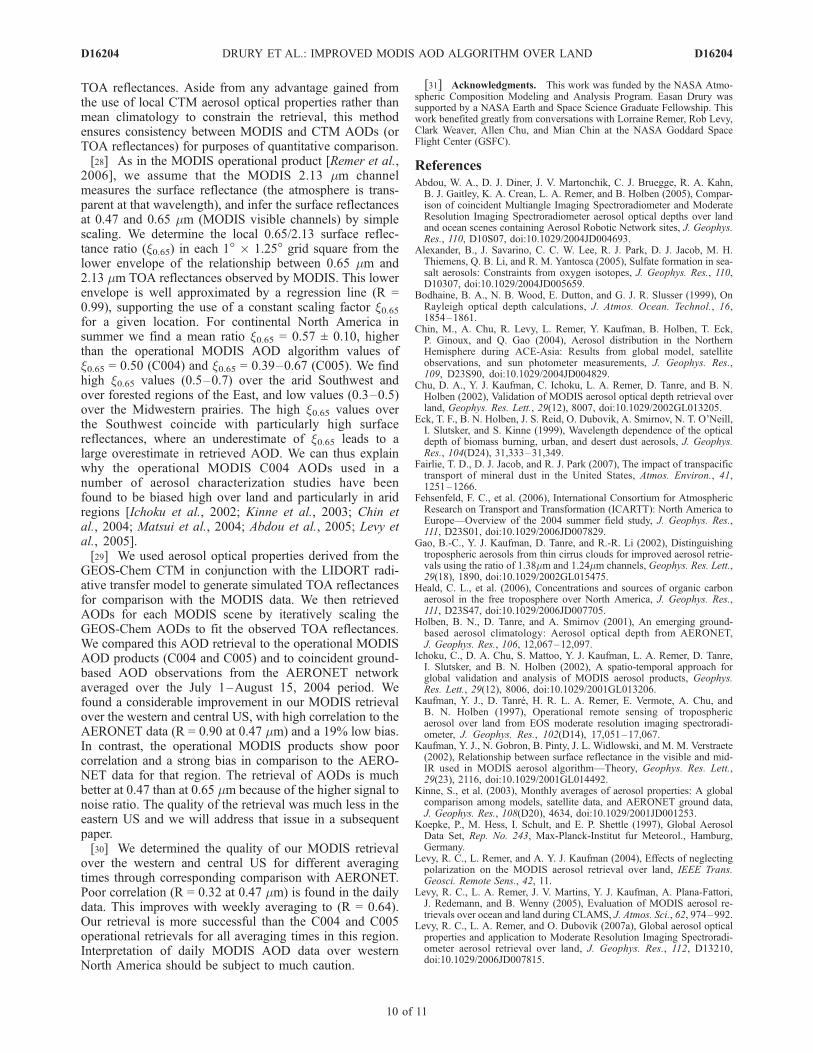
algorithm, and Figure 6 shows the mean 0.47 mm and0.65 mm AODs derived over the continental US for theJuly 1–August 15, 2004 period. In Figure 6, our retrievalis compared to the C004 and C005 MODIS operationalproducts. Mean AERONETAODs collected within ±1 hourof MODIS retrievals are plotted as filled circles for stationswith at least 9 days of coincident measurements from the July1–August 15 period. Our retrieved AODs are consistentwith AERONET AODs over the western and central USbut too low for the two east coast sites (SERC and GSFCin Maryland with 12 and 13 days of coincident measure-ments respectively). The SERC and GSFC AERONETinstruments recorded high AODs (>1.0) on a few daysassociated with high relative humidity, which we underes-timate in our MODIS retrieval. These sites also show largediurnal variability, which is not seen at sites in the westernand central US, and may require increasing the temporalwindow of AERONET data to match the 1� � 1.25� spatialextent of MODIS AODs for an accurate comparison [Ichokuet al., 2002]. These issues are unique to the SERC and GSFCand require further investigation; for now, we exclude thesetwo sites from further discussion and focus on sites in thewestern and central US where the comparison betweenMODIS and AERONET is more robust.[24] Figure 7 compares the mean of coincident MODIS
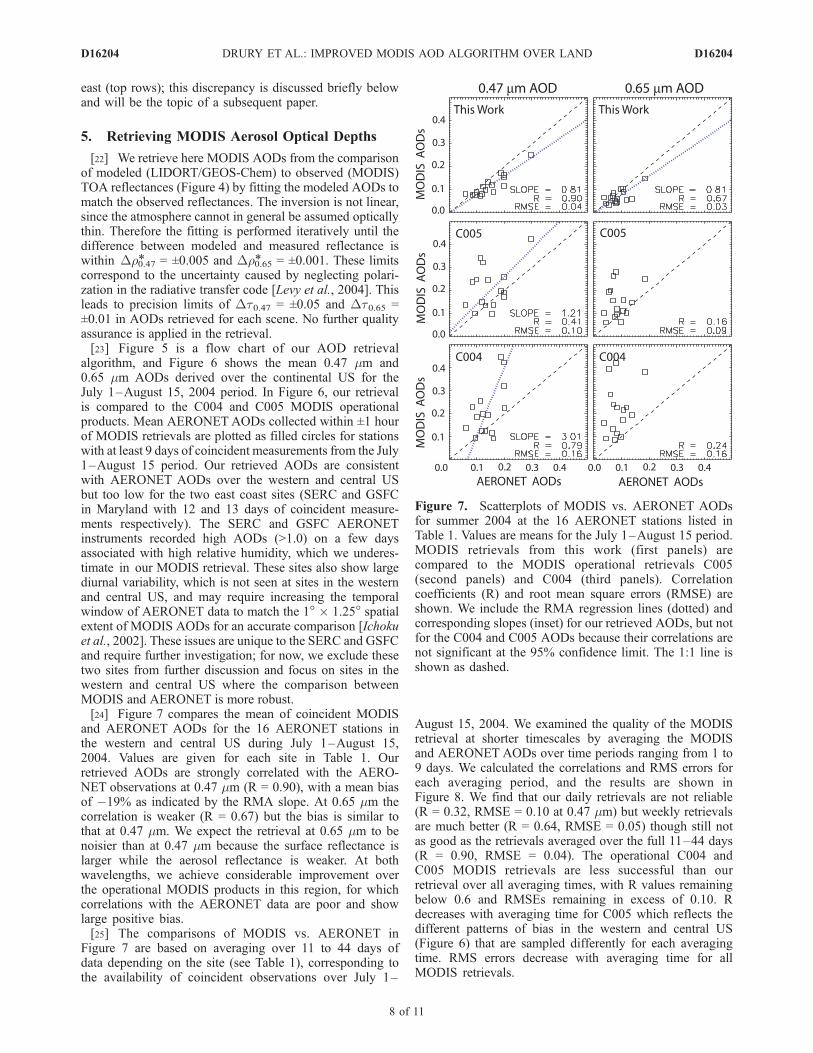
and AERONET AODs for the 16 AERONET stations inthe western and central US during July 1–August 15,2004. Values are given for each site in Table 1. Ourretrieved AODs are strongly correlated with the AERO-NET observations at 0.47 mm (R = 0.90), with a mean biasof �19% as indicated by the RMA slope. At 0.65 mm thecorrelation is weaker (R = 0.67) but the bias is similar tothat at 0.47 mm. We expect the retrieval at 0.65 mm to benoisier than at 0.47 mm because the surface reflectance islarger while the aerosol reflectance is weaker. At bothwavelengths, we achieve considerable improvement overthe operational MODIS products in this region, for whichcorrelations with the AERONET data are poor and showlarge positive bias.[25] The comparisons of MODIS vs. AERONET in
Figure 7 are based on averaging over 11 to 44 days ofdata depending on the site (see Table 1), corresponding tothe availability of coincident observations over July 1–
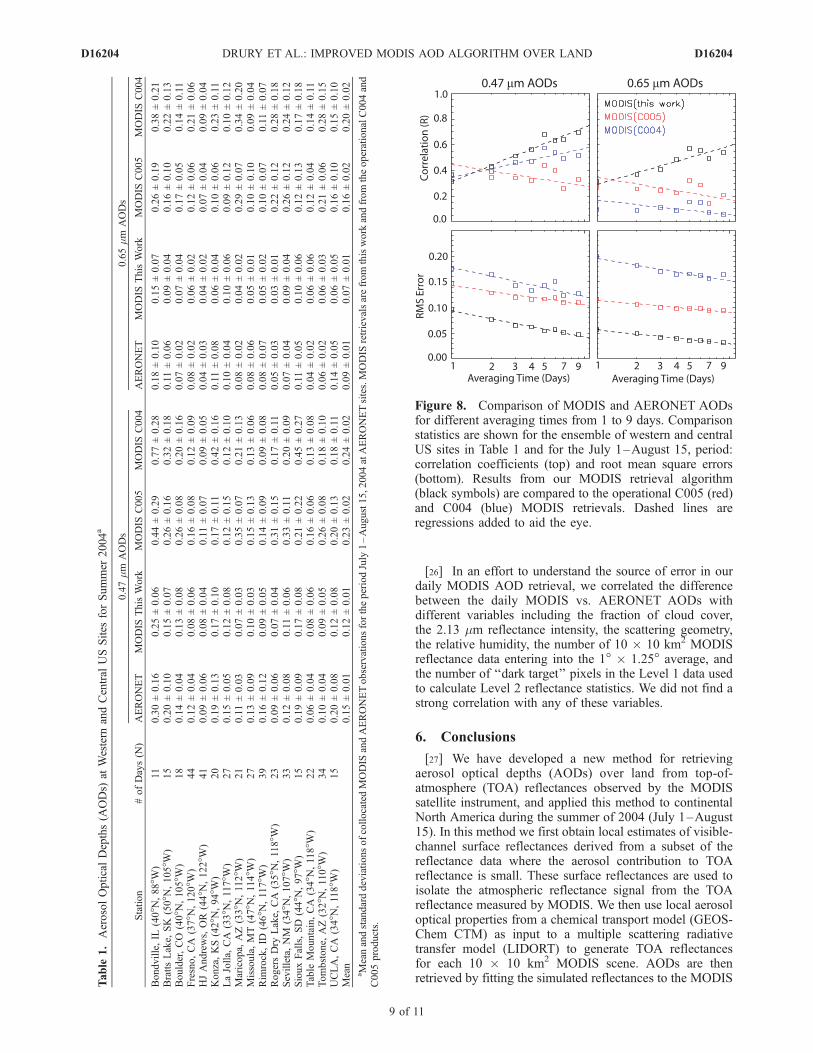
August 15, 2004. We examined the quality of the MODISretrieval at shorter timescales by averaging the MODISand AERONET AODs over time periods ranging from 1 to9 days. We calculated the correlations and RMS errors foreach averaging period, and the results are shown inFigure 8. We find that our daily retrievals are not reliable(R = 0.32, RMSE = 0.10 at 0.47 mm) but weekly retrievalsare much better (R = 0.64, RMSE = 0.05) though still notas good as the retrievals averaged over the full 11–44 days(R = 0.90, RMSE = 0.04). The operational C004 andC005 MODIS retrievals are less successful than ourretrieval over all averaging times, with R values remainingbelow 0.6 and RMSEs remaining in excess of 0.10. Rdecreases with averaging time for C005 which reflects thedifferent patterns of bias in the western and central US(Figure 6) that are sampled differently for each averagingtime. RMS errors decrease with averaging time for allMODIS retrievals.
Figure 7. Scatterplots of MODIS vs. AERONET AODsfor summer 2004 at the 16 AERONET stations listed inTable 1. Values are means for the July 1–August 15 period.MODIS retrievals from this work (first panels) arecompared to the MODIS operational retrievals C005(second panels) and C004 (third panels). Correlationcoefficients (R) and root mean square errors (RMSE) areshown. We include the RMA regression lines (dotted) andcorresponding slopes (inset) for our retrieved AODs, but notfor the C004 and C005 AODs because their correlations arenot significant at the 95% confidence limit. The 1:1 line isshown as dashed.
D16204 DRURY ET AL.: IMPROVED MODIS AOD ALGORITHM OVER LAND
8 of 11
D16204
[26] In an effort to understand the source of error in ourdaily MODIS AOD retrieval, we correlated the differencebetween the daily MODIS vs. AERONET AODs withdifferent variables including the fraction of cloud cover,the 2.13 mm reflectance intensity, the scattering geometry,the relative humidity, the number of 10 � 10 km2 MODISreflectance data entering into the 1� � 1.25� average, andthe number of ‘‘dark target’’ pixels in the Level 1 data usedto calculate Level 2 reflectance statistics. We did not find astrong correlation with any of these variables.
6. Conclusions
[27] We have developed a new method for retrievingaerosol optical depths (AODs) over land from top-of-atmosphere (TOA) reflectances observed by the MODISsatellite instrument, and applied this method to continentalNorth America during the summer of 2004 (July 1–August15). In this method we first obtain local estimates of visible-channel surface reflectances derived from a subset of thereflectance data where the aerosol contribution to TOAreflectance is small. These surface reflectances are used toisolate the atmospheric reflectance signal from the TOAreflectance measured by MODIS. We then use local aerosoloptical properties from a chemical transport model (GEOS-Chem CTM) as input to a multiple scattering radiativetransfer model (LIDORT) to generate TOA reflectancesfor each 10 � 10 km2 MODIS scene. AODs are thenretrieved by fitting the simulated reflectances to the MODIST
able
1.AerosolOpticalDepths(A
ODs)
atWestern
andCentral
USSites
forSummer
2004a
Station
#ofDays(N
)
0.47mm
AODs
0.65mm
AODs
AERONET
MODIS
ThisWork
MODIS
C005
MODIS
C004
AERONET
MODIS
ThisWork
MODIS
C005
MODIS
C004
Bondville,IL
(40�N
,88�W
)11
0.30±0.16
0.25±0.06
0.44±0.29
0.77±0.28
0.18±0.10
0.15±0.07
0.26±0.19
0.38±0.21
BrattsLake,
SK
(50�N
,105�W
)15
0.20±0.10
0.15±0.07
0.26±0.16
0.32±0.18
0.11±0.06
0.09±0.04
0.16±0.10
0.22±0.13
Boulder,CO
(40�N
,105�W
)18
0.14±0.04
0.13±0.08
0.26±0.08
0.20±0.16
0.07±0.02
0.07±0.04
0.17±0.05
0.14±0.11
Fresno,CA
(37�N
,120�W
)44
0.12±0.04
0.08±0.06
0.16±0.08
0.12±0.09
0.08±0.02
0.06±0.02
0.12±0.06
0.21±0.06
HJAndrews,OR(44�N
,122�W
)41
0.09±0.06
0.08±0.04
0.11±0.07
0.09±0.05
0.04±0.03
0.04±0.02
0.07±0.04
0.09±0.04
Konza,KS(42�N
,94�W
)20
0.19±0.13
0.17±0.10
0.17±0.11
0.42±0.16
0.11±0.08
0.06±0.04
0.10±0.06
0.23±0.11
LaJolla,
CA
(33�N
,117�W
)27
0.15±0.05
0.12±0.08
0.12±0.15
0.12±0.10
0.10±0.04
0.10±0.06
0.09±0.12
0.10±0.12
Maricopa,
AZ(33�N
,112�W
)21
0.11±0.03
0.07±0.03
0.35±0.07
0.21±0.13
0.08±0.02
0.04±0.02
0.29±0.07
0.34±0.20
Missoula,MT(47�N
,114�W
)27
0.13±0.09
0.10±0.03
0.15±0.13
0.13±0.06
0.08±0.06
0.05±0.01
0.10±0.10
0.09±0.04
Rim
rock,ID
(46�N
,117�W
)39
0.16±0.12
0.09±0.05
0.14±0.09
0.09±0.08
0.08±0.07
0.05±0.02
0.10±0.07
0.11±0.07
RogersDry
Lake,
CA
(35�N
,118�W
)23
0.09±0.06
0.07±0.04
0.31±0.15
0.17±0.11
0.05±0.03
0.03±0.01
0.22±0.12
0.28±0.18
Sevilleta,NM
(34�N
,107�W
)33
0.12±0.08
0.11±0.06
0.33±0.11
0.20±0.09
0.07±0.04
0.09±0.04
0.26±0.12
0.24±0.12
SiouxFalls,SD
(44�N
,97�W
)15
0.19±0.09
0.17±0.08
0.21±0.22
0.45±0.27
0.11±0.05
0.10±0.06
0.12±0.13
0.17±0.18
Table
Mountain,CA
(34�N
,118�W
)22
0.06±0.04
0.08±0.06
0.16±0.06
0.13±0.08
0.04±0.02
0.06±0.06
0.12±0.04
0.14±0.11
Tombstone,
AZ(32�N
,110�W
)34
0.10±0.04
0.09±0.05
0.26±0.08
0.18±0.10
0.06±0.02
0.06±0.03
0.21±0.06
0.28±0.15
UCLA,CA
(34�N
,118�W
)15
0.20±0.08
0.12±0.08
0.20±0.13
0.18±0.11
0.14±0.05
0.06±0.05
0.16±0.10
0.15±0.10
Mean
0.15±0.01
0.12±0.01
0.23±0.02
0.24±0.02
0.09±0.01
0.07±0.01
0.16±0.02
0.20±0.02
aMeanandstandarddeviationsofcollocatedMODIS
andAERONETobservationsfortheperiodJuly
1–August15,2004atAERONETsites.MODIS
retrievalsarefrom
thiswork
andfrom
theoperationalC004and
C005products.
Figure 8. Comparison of MODIS and AERONET AODsfor different averaging times from 1 to 9 days. Comparisonstatistics are shown for the ensemble of western and centralUS sites in Table 1 and for the July 1–August 15, period:correlation coefficients (top) and root mean square errors(bottom). Results from our MODIS retrieval algorithm(black symbols) are compared to the operational C005 (red)and C004 (blue) MODIS retrievals. Dashed lines areregressions added to aid the eye.
D16204 DRURY ET AL.: IMPROVED MODIS AOD ALGORITHM OVER LAND
9 of 11
D16204
TOA reflectances. Aside from any advantage gained fromthe use of local CTM aerosol optical properties rather thanmean climatology to constrain the retrieval, this methodensures consistency between MODIS and CTM AODs (orTOA reflectances) for purposes of quantitative comparison.[28] As in the MODIS operational product [Remer et al.,
2006], we assume that the MODIS 2.13 mm channelmeasures the surface reflectance (the atmosphere is trans-parent at that wavelength), and infer the surface reflectancesat 0.47 and 0.65 mm (MODIS visible channels) by simplescaling. We determine the local 0.65/2.13 surface reflec-tance ratio (x0.65) in each 1� � 1.25� grid square from thelower envelope of the relationship between 0.65 mm and2.13 mm TOA reflectances observed by MODIS. This lowerenvelope is well approximated by a regression line (R =0.99), supporting the use of a constant scaling factor x0.65for a given location. For continental North America insummer we find a mean ratio x0.65 = 0.57 ± 0.10, higherthan the operational MODIS AOD algorithm values ofx0.65 = 0.50 (C004) and x0.65 = 0.39–0.67 (C005). We findhigh x0.65 values (0.5–0.7) over the arid Southwest andover forested regions of the East, and low values (0.3–0.5)over the Midwestern prairies. The high x0.65 values overthe Southwest coincide with particularly high surfacereflectances, where an underestimate of x0.65 leads to alarge overestimate in retrieved AOD. We can thus explainwhy the operational MODIS C004 AODs used in anumber of aerosol characterization studies have beenfound to be biased high over land and particularly in aridregions [Ichoku et al., 2002; Kinne et al., 2003; Chin etal., 2004; Matsui et al., 2004; Abdou et al., 2005; Levy etal., 2005].[29] We used aerosol optical properties derived from the
GEOS-Chem CTM in conjunction with the LIDORT radi-ative transfer model to generate simulated TOA reflectancesfor comparison with the MODIS data. We then retrievedAODs for each MODIS scene by iteratively scaling theGEOS-Chem AODs to fit the observed TOA reflectances.We compared this AOD retrieval to the operational MODISAOD products (C004 and C005) and to coincident ground-based AOD observations from the AERONET networkaveraged over the July 1–August 15, 2004 period. Wefound a considerable improvement in our MODIS retrievalover the western and central US, with high correlation to theAERONET data (R = 0.90 at 0.47 mm) and a 19% low bias.In contrast, the operational MODIS products show poorcorrelation and a strong bias in comparison to the AERO-NET data for that region. The retrieval of AODs is muchbetter at 0.47 than at 0.65 mm because of the higher signal tonoise ratio. The quality of the retrieval was much less in theeastern US and we will address that issue in a subsequentpaper.[30] We determined the quality of our MODIS retrieval
over the western and central US for different averagingtimes through corresponding comparison with AERONET.Poor correlation (R = 0.32 at 0.47 mm) is found in the dailydata. This improves with weekly averaging to (R = 0.64).Our retrieval is more successful than the C004 and C005operational retrievals for all averaging times in this region.Interpretation of daily MODIS AOD data over westernNorth America should be subject to much caution.
[31] Acknowledgments. This work was funded by the NASA Atmo-spheric Composition Modeling and Analysis Program. Easan Drury wassupported by a NASA Earth and Space Science Graduate Fellowship. Thiswork benefited greatly from conversations with Lorraine Remer, Rob Levy,Clark Weaver, Allen Chu, and Mian Chin at the NASA Goddard SpaceFlight Center (GSFC).
ReferencesAbdou, W. A., D. J. Diner, J. V. Martonchik, C. J. Bruegge, R. A. Kahn,B. J. Gaitley, K. A. Crean, L. A. Remer, and B. Holben (2005), Compar-ison of coincident Multiangle Imaging Spectroradiometer and ModerateResolution Imaging Spectroradiometer aerosol optical depths over landand ocean scenes containing Aerosol Robotic Network sites, J. Geophys.Res., 110, D10S07, doi:10.1029/2004JD004693.
Alexander, B., J. Savarino, C. C. W. Lee, R. J. Park, D. J. Jacob, M. H.Thiemens, Q. B. Li, and R. M. Yantosca (2005), Sulfate formation in sea-salt aerosols: Constraints from oxygen isotopes, J. Geophys. Res., 110,D10307, doi:10.1029/2004JD005659.
Bodhaine, B. A., N. B. Wood, E. Dutton, and G. J. R. Slusser (1999), OnRayleigh optical depth calculations, J. Atmos. Ocean. Technol., 16,1854–1861.
Chin, M., A. Chu, R. Levy, L. Remer, Y. Kaufman, B. Holben, T. Eck,P. Ginoux, and Q. Gao (2004), Aerosol distribution in the NorthernHemisphere during ACE-Asia: Results from global model, satelliteobservations, and sun photometer measurements, J. Geophys. Res.,109, D23S90, doi:10.1029/2004JD004829.
Chu, D. A., Y. J. Kaufman, C. Ichoku, L. A. Remer, D. Tanre, and B. N.Holben (2002), Validation of MODIS aerosol optical depth retrieval overland, Geophys. Res. Lett., 29(12), 8007, doi:10.1029/2002GL013205.
Eck, T. F., B. N. Holben, J. S. Reid, O. Dubovik, A. Smirnov, N. T. O’Neill,I. Slutsker, and S. Kinne (1999), Wavelength dependence of the opticaldepth of biomass burning, urban, and desert dust aerosols, J. Geophys.Res., 104(D24), 31,333–31,349.
Fairlie, T. D., D. J. Jacob, and R. J. Park (2007), The impact of transpacifictransport of mineral dust in the United States, Atmos. Environ., 41,1251–1266.
Fehsenfeld, F. C., et al. (2006), International Consortium for AtmosphericResearch on Transport and Transformation (ICARTT): North America toEurope—Overview of the 2004 summer field study, J. Geophys. Res.,111, D23S01, doi:10.1029/2006JD007829.
Gao, B.-C., Y. J. Kaufman, D. Tanre, and R.-R. Li (2002), Distinguishingtropospheric aerosols from thin cirrus clouds for improved aerosol retrie-vals using the ratio of 1.38mm and 1.24mm channels, Geophys. Res. Lett.,29(18), 1890, doi:10.1029/2002GL015475.
Heald, C. L., et al. (2006), Concentrations and sources of organic carbonaerosol in the free troposphere over North America, J. Geophys. Res.,111, D23S47, doi:10.1029/2006JD007705.
Holben, B. N., D. Tanre, and A. Smirnov (2001), An emerging ground-based aerosol climatology: Aerosol optical depth from AERONET,J. Geophys. Res., 106, 12,067–12,097.
Ichoku, C., D. A. Chu, S. Mattoo, Y. J. Kaufman, L. A. Remer, D. Tanre,I. Slutsker, and B. N. Holben (2002), A spatio-temporal approach forglobal validation and analysis of MODIS aerosol products, Geophys.Res. Lett., 29(12), 8006, doi:10.1029/2001GL013206.
Kaufman, Y. J., D. Tanre, H. R. L. A. Remer, E. Vermote, A. Chu, andB. N. Holben (1997), Operational remote sensing of troposphericaerosol over land from EOS moderate resolution imaging spectroradi-ometer, J. Geophys. Res., 102(D14), 17,051–17,067.
Kaufman, Y. J., N. Gobron, B. Pinty, J. L. Widlowski, and M. M. Verstraete(2002), Relationship between surface reflectance in the visible and mid-IR used in MODIS aerosol algorithm—Theory, Geophys. Res. Lett.,29(23), 2116, doi:10.1029/2001GL014492.
Kinne, S., et al. (2003), Monthly averages of aerosol properties: A globalcomparison among models, satellite data, and AERONET ground data,J. Geophys. Res., 108(D20), 4634, doi:10.1029/2001JD001253.
Koepke, P., M. Hess, I. Schult, and E. P. Shettle (1997), Global AerosolData Set, Rep. No. 243, Max-Planck-Institut fur Meteorol., Hamburg,Germany.
Levy, R. C., L. Remer, and A. Y. J. Kaufman (2004), Effects of neglectingpolarization on the MODIS aerosol retrieval over land, IEEE Trans.Geosci. Remote Sens., 42, 11.
Levy, R. C., L. A. Remer, J. V. Martins, Y. J. Kaufman, A. Plana-Fattori,J. Redemann, and B. Wenny (2005), Evaluation of MODIS aerosol re-trievals over ocean and land during CLAMS, J. Atmos. Sci., 62, 974–992.
Levy, R. C., L. A. Remer, and O. Dubovik (2007a), Global aerosol opticalproperties and application to Moderate Resolution Imaging Spectroradi-ometer aerosol retrieval over land, J. Geophys. Res., 112, D13210,doi:10.1029/2006JD007815.
D16204 DRURY ET AL.: IMPROVED MODIS AOD ALGORITHM OVER LAND
10 of 11
D16204
Levy, R. C., L. A. Remer, S. Mattoo, E. Vermote, and F. Y. J. Kaufman(2007b), Second-generation operational algorithm: Retrieval of aerosolproperties over land from inversion of Moderate Resolution ImagingSpectroradiometer spectral reflectance, J. Geophys. Res., 112, D13211,doi:10.1029/2006JD007811.
Martins, J. V., D. Tanre, L. A. Remer, Y. J. Kaufman, S. Mattoo, andR. Levy (2002), MODIS cloud screening for remote sensing of aerosolover oceans using spatial variability, Geophys. Res. Lett., 29(12), 8009,doi:10.1029/2001GL013252.
Matsui, T., S. M. Kreidenweis, R. A. Pielke Sr., B. Schichtel, H. Yu,M. Chin, D. A. Chu, and D. Niyogi (2004), Regional comparisonand assimilation of GOCART and MODIS aerosol optical depthacross the eastern U.S., Geophys. Res. Lett., 31, L21101, doi:10.1029/2004GL021017.
Park, R. J., D. Jacob, J. Chin, and M. R. V. Martin (2003), Sources ofcarbonaceous aerosols over the United States and implications fornatural visibility, J. Geophys. Res., 108(D12), 4355, doi:10.1029/2002JD003190.
Park, R. J., D. J. Jacob, B. D. Field, R. M. Yantosca, and M. Chin (2004),Natural and transboundary pollution influences on sulfate-nitrate-ammo-nium aerosols in the United States: Implications for policy, J. Geophys.Res., 109, D15204, doi:10.1029/2003JD004473.
Park, R. J., D. J. Jacob, N. Kumar, and R. M. Yantosca (2006), Regionalvisibility statistics in the United States: Natural and transboundary pollu-tion influences, and implications for the Regional Haze Rule, Atmos.Environ., 40, 5405–5423.
Remer, L. A., et al. (2002), Validation of MODIS aerosol retrieval overocean, Geophys. Res. Lett., 29(12), 8008, doi:10.1029/2001GL013204.
Remer, L. A., et al. (2005), The MODIS aerosol algorithm, products andvalidation, J. Atmos. Sci., 62, 947–973.
Remer, L. A., D. Tanre, Y. J. Kaufman, R. Levy and S. Mattoo (2006),Algorithm for remote sensing of Tropospheric aerosol from MODIS:Collection 005, Product ID MOD04/MYD04 Ref. No. ATBD-MOD-96. (Available at http://modis-atmos.gsfc.nasa.gov/_docs/MOD04:-MYD04_ATBD_C005_revl.pdf)
Singh, H. B., W. H. Brune, J. H. Crawford, D. J. Jacob, and P. B. Russell(2006), Overview of the summer 2004 Intercontinental Chemical Trans-
port Experiment-North America (INTEX-A), J. Geophys. Res., 111,D24S01, doi:10.1029/2006JD007905.
Smirnov, A., B. N. Holben, T. F. Eck, O. Dubovik, and I. Slutsker (2000),Cloud screening and quality control algorithms for the AERONET data-base, Remote Sens. Environ., 73, 337–349.
Spurr, R. J. D. (2002), Simultaneous radiative transfer derivation of inten-sities and weighting functions in a general pseudo-spherical treatment,J. Quant. Spectrosc. Radiat. Transfer, 75, 129–175.
Spurr, R. J. D., T. P. Kurosu, and K. V. Chance (2001), A linearized discreteordinate radiative transfer model for atmospheric remote sensing retrie-val, J. Quant. Spectrosc. Radiat. Transfer, 68, 689–735.
Turquety, S., et al. (2007), Inventory of boreal fire emissions for NorthAmerica in 2004: The importance of peat burning and pyro-convectiveinjection, J. Geophys. Res., 112, D12S03, doi:10.1029/2006JD007281.
Vermote, E. F., D. Tanre, J. L. Deuze, M. Herman, and J. J. Morcrette(1997), Second simulation of the satellite signal in the solar spectrum,6S: An overview, IEEE Trans. Geosci. Remote Sens., 35, 675–686.
Wang, J., and S. T. Martin (2007), Satellite characterization of urban aero-sols: Importance of including hygroscopicity and mixing state in theretrieval algorithms, J. Geophys. Res., 112, D17203, doi:10.1029/2006JD008708.
Weaver, C. J., A. da Silva, M. Chin, P. Ginoux, O. Dubovik, D. E. Flittner,A. Zia, L. A. Remer, B. N. Holben, and W. Gregg (2007), Assimilation ofMODIS radiances in a global aerosol transport model, J. Atmos. Sci., 64,doi:10.1175/JAS3838.1.
�����������������������K. Chance, Atomic andMolecular Physics Division, Harvard-Smithsonian
Center for Astrophysics, 60 Garden Street, Cambridge, MA 02138, USA.E. Drury and D. J. Jacob, School of Engineering and Applied Sciences,
Harvard University, 29 Oxford Street, Cambridge, MA 02138, USA.([email protected])R. J. D. Spurr, RT Solutions, Inc., 9 Channing Street, Cambridge, MA
02138, USA.J. Wang, Department of Geosciences, University of Nebraska, 303
Bessey Hall, Lincoln, NE 68588, USA.
D16204 DRURY ET AL.: IMPROVED MODIS AOD ALGORITHM OVER LAND
11 of 11
D16204