satellite based retrievals of chlorophyll, dissolved …... satellite based retrievals of...
TRANSCRIPT

www.mtri.org
Satellite Based Retrievals of Chlorophyll,
Dissolved Organic Carbon and Suspended
Minerals for Lake Michigan
Robert Shuchman, Ph.D., MTRI [email protected]
734-913-6860
R.A. Shuchman1, G. Leshkevich2, C.N. Brooks1, M.J. Sayers1, and C. Hatt3
Michigan Tech Research Institute1, NOAA Great Lakes
Environmental Research Laboratory2, and University of Wisconsin/MTRI3
September 27, 2011 SOLM – Michigan City, Indiana
State of Lake Michigan Conference
2
An Observational Satellite Algorithm for the Retrieval of Chlorophyll, Dissolved Organic Carbon, and
Suspended Minerals for all Laurentian Great Lakes
Review Case II Color Producing Agent Algorithm
Development of new hydro-optical (HO) models – Inherent optical properties (IOP) and in-situ measurement
database – Compare lake to lake HO model parameters
Lake Michigan examples and comparison
Concluding Remarks

3
Motivation for Case II Color Producing Agent Algorithm
Standard NASA retrieval is only for Chlorophyll concentrations
Optimized for Oceans (Case I waters)
Great Lakes (Case II) water color signatures are more complex (Chlorophyll, Dissolved Organic Carbon, and Suspended Mineral components)
Primary productivity estimates for the Great Lakes require robust Chlorophyll concentration inputs

4
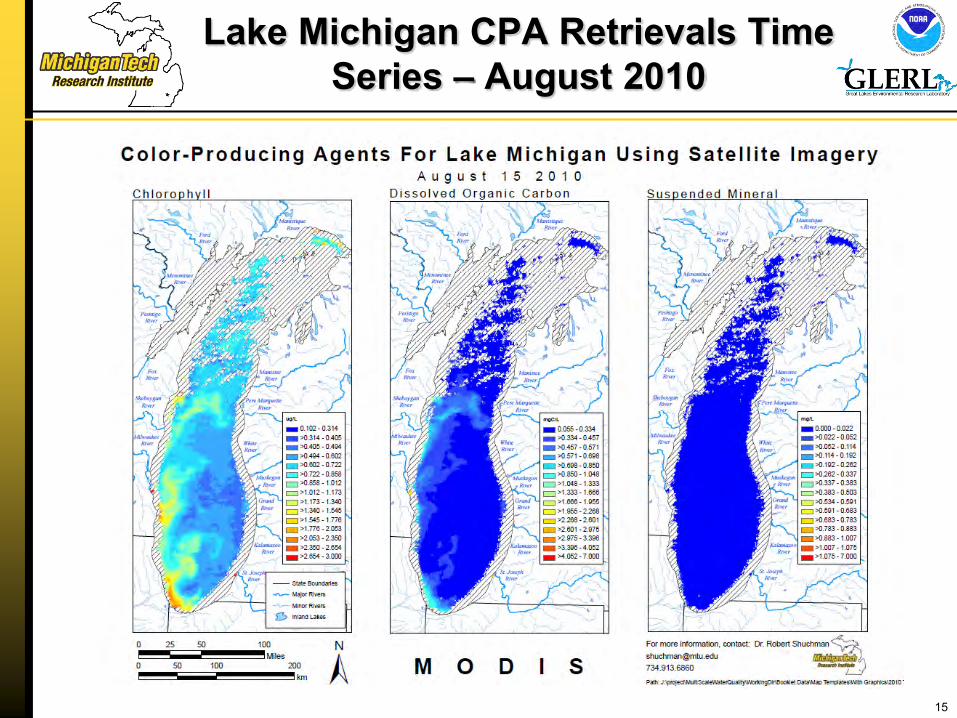
Chlorophyll (CHL) , Dissolved Organic Carbon (DOC), Suspended Mineral (SM)
Algorithm
Water color in inland and coastal water results mainly from three different parameters, known as color-producing agents (CPAs): – Chlorophyll (CHL): A green pigment found in plant cells. Algal
cells that are suspended in water produce a green-yellow color. – Dissolved Organic Carbon (DOC): Organic carbons that are
produced as part of micro-organism metabolism or are transported from decaying vegetation products via rivers and streams. DOC only absorbs light, it doesn’t scatter it. It appears yellow to brown in color (CDOM).
– Suspended Minerals (SM): Inorganic particulate matter. Scatters and absorbs light.
DOC CHL SM

5
Principal Component Analysis
The standard NASA retrieval (OC3) assumes Chlorophyll is the primary and only significant CPA
3/24/1998 SeaWiFS Retrieval

6
CPA Algorithm
The table of specific backscattering and absorption coefficients is also referred to as a Hydro-optical (HO) model
Different bodies of water have different HO models
Similar types of water bodies have similar HO-models, such as Lake Michigan and Lake Huron
HO model depends of what type of CPAs are in the water

7
CPA Algorithm
Given an HO-model for a body of water, CPA concentration (Chl, SM, DOC) images can be produced from satellite reflectance images using multivariate inverse procedures
Our algorithm uses the Levenburg-Marquardt (LM) procedure for finding a solution to the inverse problem
A CPA concentration vector is found which minimizes the error between the measured and calculated RSR (Remote sensing reflectance)
8
Application of Algorithm
The CPA retrieval algorithm has been applied to MODIS and SeaWiFS images of the Great Lakes, mostly using a HO-model for Lake Ontario developed over 20 years ago
The most extensive analysis was performed in Lake Michigan: – Pozdnyakov, D., Shuchman, R.A., Korosov, A., Hatt, C. (2005)
“Operational algorithm for the retrieval of water quality in the Great Lakes,” Remote Sensing of Environment, Volume 97, Issue 3, pp. 352-370.
– Shuchman, R.A., Korosov, A., Hatt, C. and. Pozdnyakov, D. (2006). “Verification and Application of a Bio-optical Algorithm for Lake Michigan Using SeaWiFS: a 7-year Inter-Annual Analysis.” Journal of Great Lakes Research 32: 258-279.

9
Initial 2006 Results of Algorithm
Algorithm results for Lake Michigan have been shown to compare reasonably well with patterns obtained from sea-truth values – however absolute concentrations were either under predicted or over predicted as a function of concentration.
More importantly, the images produced are able to capture important episodic events and temporal-spatial phenomena that scheduled field sampling cannot capture, such as the spring-time sediment re-suspension event in Lake Michigan
Annual and inter-annual synoptic observations show changes in the Great Lakes that are a result of changing climate conditions and invasive species

10
Lake Michigan CPA Retrievals

11
Chlorophyll Retrieval Comparison - Lake Michigan
EPA sampling station average =.60 ug/L versus CPA algorithm (in boxed area) =.62 ug/L
Individual station comparison (3x3 km buffer)
– Max difference = .34 ug/L – Min difference = .01 ug/L – Avg difference = .17 ug/L
Very good considering temporal and spatial differences between satellite retrieval and field measurements
12
Lake Michigan CPA Retrievals
Uses both MODIS (1 km resolution) and MERIS (300 m resolution) satellite imagery.
Retrievals have been completed for entire MODIS Aqua archive (2002 – 2010) of cloud free imagery.
Lake Michigan “sees” approximately 60-70 cloud free days a year between March and November.
Retrieval results are optimal when the target is in the center of the swath.
Approximately 520 MODIS images have been processed for Lake Michigan.
Extensive archive facilitates analysis in Chlorophyll, DOC, and SM trends in relation to changes in anthropogenic forcing, invasive species, and climate change.
13
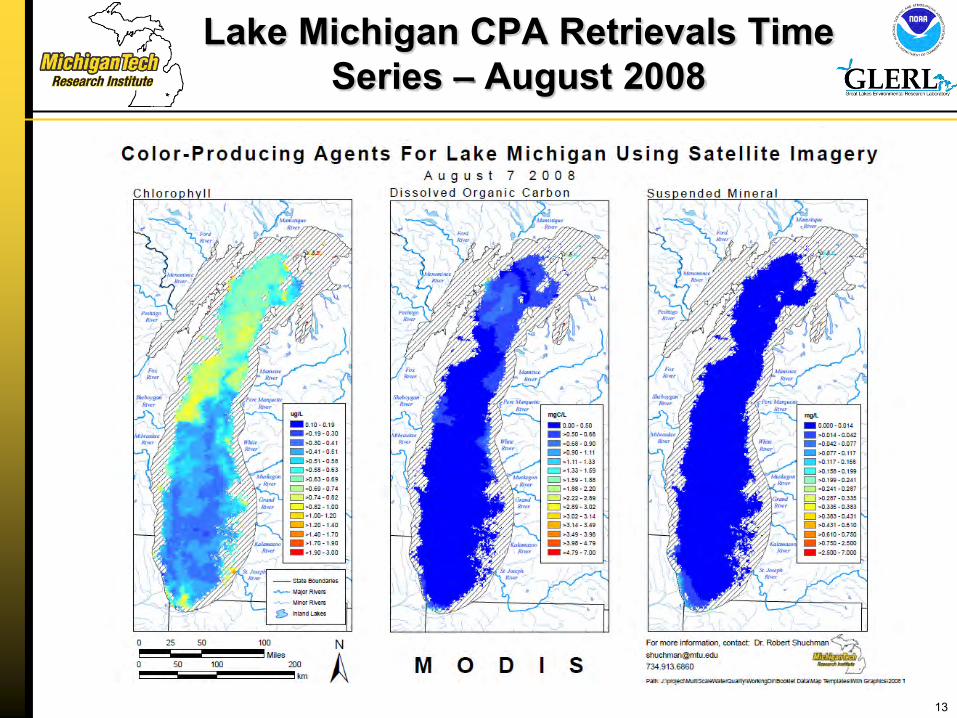
Lake Michigan CPA Retrievals Time Series – August 2008

14
Lake Michigan CPA Retrievals Time Series – August 2009
15
Lake Michigan CPA Retrievals Time Series – August 2010

16
Lake Michigan Chlorophyll Retrieval Comparison - Standard NASA OC3 Algorithm
Station In situ CHL
(ug/L) 8/8/2010 CPA
(ug/L) CPA versus in
situ (ug/L) 8/8/2010 OC3
(ug/L) OC3 versus in situ
(ug/L)
MI 17 0.51 0.81 0.30 0.37 0.14 MI 18M 0.61 0.80 0.19 0.43 0.18 MI 19 0.54 0.55 0.01 0.28 0.26 MI FE 0.63 0.73 0.10 0.49 0.15 MI 23 0.55 0.59 0.04 0.30 0.26 MI 27M 0.55 0.56 0.01 0.30 0.25 MI 34 0.60 0.68 0.08 0.44 0.16 MI 32 1.27 0.76 0.51 0.71 0.56
Cruise data from 8/6/2010-8/8/2010, Satellite image from 8/8/2010.
GLERL sampling station average = .66 ug/L versus CPA algorithm (in boxed area) =.74 ug/L, OC3 = .76 ug/L
Individual station comparison (3x3 km buffer) – Max difference
– CPA = .51 ug/L – OC3 = .56 ug/L
– Min difference – CPA = .01 ug/L – OC3 = .14 ug/L
– Avg difference – CPA = .15 ug/L – OC3 = .24 ug/L

17
CPA Algorithm vs. Standard NASA OC3 Comparisons
CPA retrievals are significantly more accurate than OC3 when compared to EPA in situ observations
OC3 only provides Chlorophyll estimate, DOC and SM are not estimated
Satellite based Lake wide primary productivity estimates require accurate Chlorophyll inputs
18
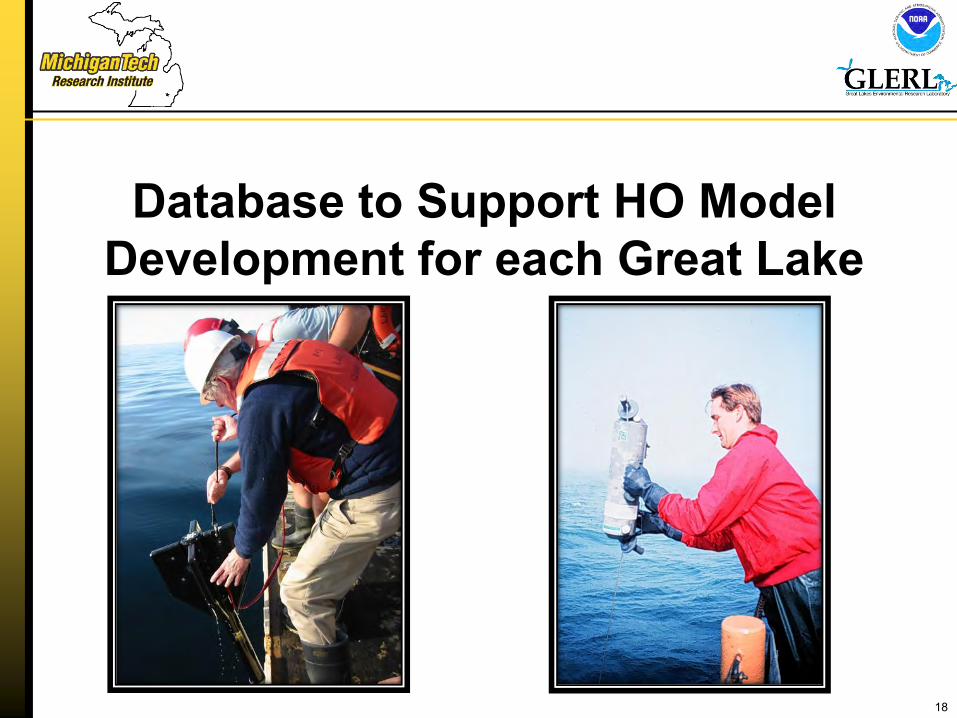
Database to Support HO Model Development for each Great Lake

19
The Great Lakes IOP Geospatial Database: Design and Implementation
– We have created the Great Lakes Inherent Optical Properties (IOP) Geospatial Database
– Data was delivered in many different formats and styles (UFI & NOAA-GLERL).
– Need a database development environment to be able to create data “importers” to make sure data is in standard format to facilitate accurate querying.
– Need to rigorously test data importers to make sure data is imported correctly.
– Data from many different years and cruises needs to be stored in a uniform structure
– A spatially enabled database allows for spatial analysis of how much and where coincident field and lab data is present.
Example of CHL, FSS, VSS, TSS, CDOM, absorption,
& attenuation data now stored in relational IOP
geospatial database
Objective: Create an organized spatial representation of in-situ optical and lab concentration measurements.

20
Field and Lab Data Summary
Data provided by the Great Lakes Environmental Research Laboratory (GLERL) and the Upstate Freshwater Institute (UFI)
Green cells indicate where there is available data, by year (1997-2008) & by lake
Great Lakes Inherent Optical Properties (IOP) Geospatial Database

21
Spatial Distribution of Coincident Field and Lab Data
Spatial data is easily accessed via open source & commercial GIS environments.
Facilitates QA/QC activities as well as spatial analysis.
Data can easily be distributed via online interactive websites as well.
22
Upstate Freshwater Institute Inherent Optical Property Comparison
Station
MI3
1BM
I48B
MI4
9BM
I53B
MI1
1M
I32
MI4
1M
I47
HU
96B
HU
06H
U38
HU
48ER
58ER
91M
ER78
MER
95B
ER09
ON
64B
ON
12O
N49
ON
60
(m-1
)
0.0
0.5
1.0
1.5
2.0
2.5
3.0
3.5
Michigan Huron
Erie
Ontario
cpg(440)apg(440)
Station
MI3
1b
MI4
8b
MI4
9b
MI1
1
MI3
2
MI4
7
Hu9
6b
Hu0
6
HU
61
Hu3
8
Hu4
8
ER58
ER91
M
On4
9
On6
0
Kd(
m-1
)
0.0
0.2
0.4
0.6
0.8
1.0
Michigan Huron
Erie
Ontario
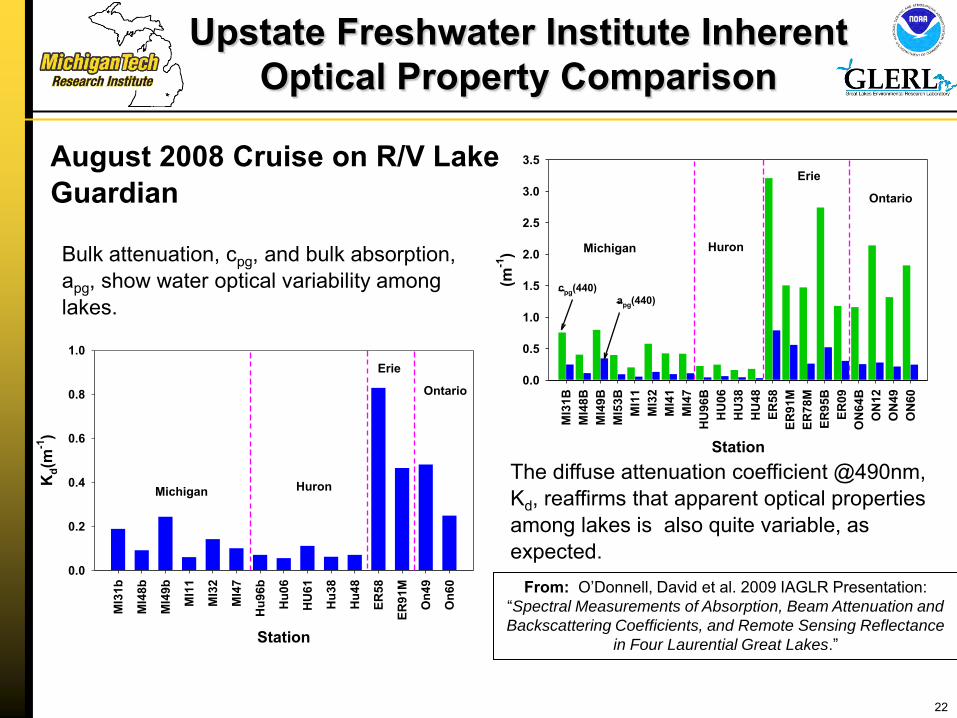
August 2008 Cruise on R/V Lake Guardian
Bulk attenuation, cpg, and bulk absorption, apg, show water optical variability among lakes.
The diffuse attenuation coefficient @490nm, Kd, reaffirms that apparent optical properties among lakes is also quite variable, as expected.
From: O’Donnell, David et al. 2009 IAGLR Presentation: “Spectral Measurements of Absorption, Beam Attenuation and
Backscattering Coefficients, and Remote Sensing Reflectance
in Four Laurential Great Lakes.”

23
Modified Hydro-Optical Model Chlorophyll Example
Significant departure from over 20 year old Bukata Lake Ontario HO Model
Results agree with analysis conducted by UFI.
Indicates that different HO models will be necessary for individual lakes or groups of lakes for accurate retrievals.
Further analysis will be done examining in-situ data from 2000-2007 to further strengthen HO model parameters.

24
Summary for Hydro-Optical Model
A comprehensive set of IOP measurements with in-situ sampling exists for all the Great Lakes.
This data set is providing input for updating the Hydro-optical (HO) models for each lake, which is necessary for correct retrievals.
Preliminary results indicate each Lake will require its own unique HO model.
The new HO models for Lakes Michigan and Huron are providing robust retrievals.
CPA algorithm provides more accurate chlorophyll estimates than the standard NASA OC3 retrievals.

25
Chlorophyll Retrieval Comparison Lake Huron
In situ measurements from NOAA GLERL cruise 8/6/2010 to 8/8/2010
Station Depth (m) In situ CHL CPA
Retrieval (8/12/10)
CPA versus in situ (ug/L) (ug/L)
HU 48 1.6 0.33 0.28 0.05
HU 45M 1.8 0.71 0.41 0.30
HU 37 1.9 0.33 0.36 0.03
HU 38 2.1 0.31 0.47 0.16
HU 32 1.5 0.34 0.35 0.01
HU 27 2.1 0.33 0.36 0.03
HU 15M 2.1 0.32 0.18 0.15
HU 93 2.1 0.36 0.41 0.05
HU 12 1.9 0.41 0.36 0.05
HU 09 1.9 0.37 0.35 0.02
HU 06 2.1 0.53 0.35 0.18
Average Difference = .09 ug/L
26
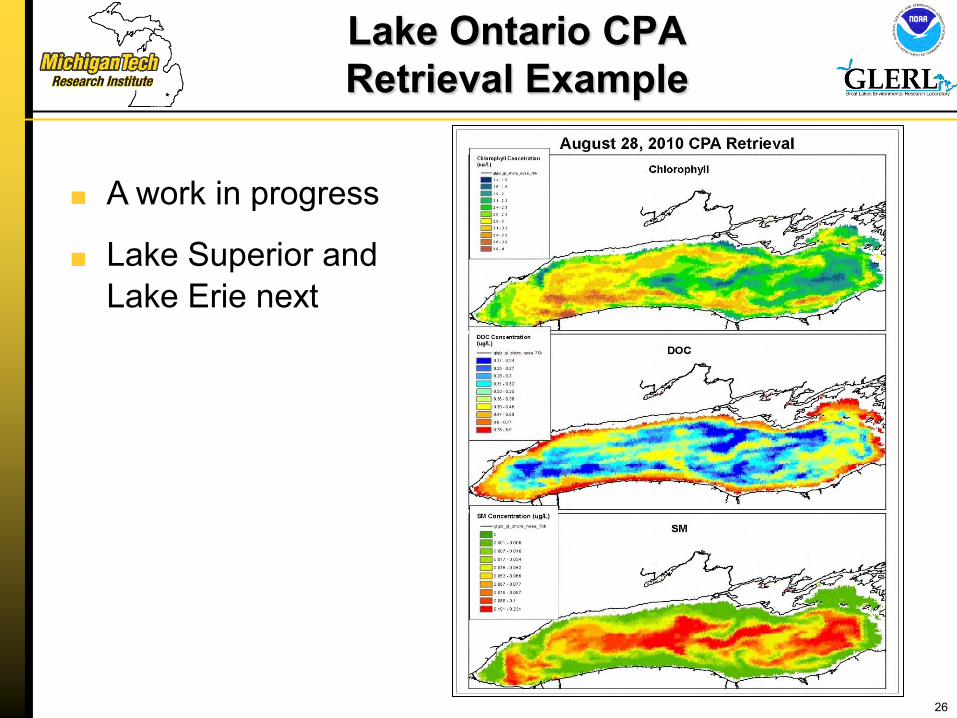
Lake Ontario CPA Retrieval Example
A work in progress
Lake Superior and Lake Erie next

27
Questions? Robert Shuchman, PhD. [email protected] 734-913-6860, MTRI
Mike Sayers, [email protected], 734-913-6852, MTRI
Colin Brooks, [email protected], 734-913-6858, MTRI