improve and secure the supplier capacity process thesis by...
TRANSCRIPT

Improve and Secure the Supplier Capacity Process
Within IKEA’s Plastic Category in Greater China
Thesis by
Carl-Fredrik Lie
Toste Elinder
In Partial Fulfillment of the Requirements
for the Degree of
Master of Science in Mechanical Engineering
Lund University
Faculty of Engineering
Lund, Sweden

II

III
Preface
This master thesis has been written during the spring of 2012 and is the final part of our Master of
Science degree in Mechanical Engineering at Lund University, Faculty of Engineering.
During this period we had the opportunity to meet and experience a lot different cultures and
professional people within the IKEA organization. The thesis has been carried out at the IKEA Trading
office in Shenzhen China and at IKEA of Sweden office in Älmhult in collaboration with the Production
Management institution at Lund University, Faculty of Engineering.
First of all we would like to thank our supervisor Paul Björnsson at IKEA for his support and passionate
commitment during the project. The responsible within the category plastic; Mattias Adamsson and
Minh Nguyen Hoang have also been a good and appreciated support during our project time. We also
want to acknowledgement our supervisor from the Lund University Peter Berling for his much
appreciated help and guidance during the project. At last we also would like to extend our gratitude to all
the people involved within the plastic category at the trading office in Shenzhen, China for giving their
fullest support when implementing this process at the suppliers in China and Taiwan.
Lund, 2012
Toste Elinder
Carl-Fredrik Lie

IV

V
Abstract
Title: Improve and Secure the Supplier Capacity Process within IKEA’s Plastic
Category in Greater China
Authors: Carl-Fredrik Lie and Toste Elinder
Supervisors: Paul Björnsson – Process Leader for Plan & Secure Capacity, IKEA of Sweden
Peter Berling – Department of Production Management at Lund University,
Faculty of Engineering
Purpose: The purpose of this thesis is to implement the One Supplier Capacity Process, a
standardized method of working with capacities within IKEA. In order to do this
the current way of working with capacities is investigated prior to the actual
implementation of the process. The key contribution of the authors is the
development of a template to support the implementation process and ensure
accurate capacity figures and support the capacity planning process. After the
implementation the One Supplier Capacity Process is evaluated with regards to
its key components, its implementation, and the results and potential to improve
the capacity planning process for IKEA and its suppliers.
Methodology: As the authors were actively involved in the implementation phase by adapting
the One Supplier Capacity process to the specifics of plastic production, the
chosen methodology was participatory action research with a normative
approach. The study is deductive and mainly qualitative based on interviews and
observations of IKEA employees and suppliers.
Conclusions: The One Supplier Capacity Process provides a much needed framework for
working with capacities that is lacking today. With the support of the template it
provides a standardized method of calculating the capacities to ensure their
accuracy, and allows allocation of production resources shared between products.
It gives IKEA an insight into the suppliers’ productions that enable proactive
work with regards to operationally maintaining availability. The insight should
also enable IKEA to more efficiently secure tactical dedication of capacity at its
suppliers.

VI

VII
Table of Contents
Table of Figures .................................................................................................................................. XI
Table of Tables ................................................................................................................................. XIII
List of Abbreviations .......................................................................................................................... XV
1 Introduction .................................................................................................................................. 1 1.1 Background ............................................................................................................................ 1 1.2 Problem Discussion ................................................................................................................ 1 1.3 Purpose .................................................................................................................................. 2 1.4 Directives ............................................................................................................................... 3 1.5 Delimitations ......................................................................................................................... 3 1.6 Target Groups ........................................................................................................................ 4 1.7 Company Descriptions ........................................................................................................... 4
1.7.1 General description ............................................................................................................ 4 1.7.2 Functions ........................................................................................................................... 5
1.8 Time Plan .............................................................................................................................. 6
2 Methodology ................................................................................................................................. 7 2.1 Participatory Action Research ................................................................................................. 7 2.2 Methodology Approach .......................................................................................................... 7 2.3 Induction, Deduction, and Abduction .................................................................................... 8 2.4 Quantitative and Qualitative studies ...................................................................................... 8 2.5 Data Collection ...................................................................................................................... 8
2.5.1 Interviews ........................................................................................................................... 8 2.5.2 Observations ....................................................................................................................... 9 2.5.3 Literature study .................................................................................................................. 9
2.6 Credibility ............................................................................................................................ 10 2.6.1 Reliability ......................................................................................................................... 10 2.6.2 Validity ............................................................................................................................ 10 2.6.3 Objectivity ....................................................................................................................... 11
2.7 Criticism of Sources ............................................................................................................. 11 2.8 Method of Implementing the One Supplier Capacity Process .............................................. 12
3 Frame of Reference ...................................................................................................................... 15 3.1 Production Capacity ............................................................................................................. 15

VIII
3.1.1 Definition ......................................................................................................................... 15 3.1.2 Capacity Planning ............................................................................................................ 16
3.2 Theory of Constraint ............................................................................................................ 20 3.3 Machine Grouping ............................................................................................................... 21
3.3.1 Line production ................................................................................................................ 21 3.3.2 Cellular manufacturing ..................................................................................................... 22 3.3.3 Functional manufacturing ................................................................................................ 22
3.4 Process Implementation ....................................................................................................... 23 3.4.1 Define initial state and project team ................................................................................. 24 3.4.2 Plan process implementation ............................................................................................ 24 3.4.3 Execute process implementation ....................................................................................... 24 3.4.4 Evaluate process implementation ...................................................................................... 24
3.5 Supplier Relations ................................................................................................................ 25
4 One Supplier Capacity Process .................................................................................................... 27 4.1 Key components of the One Supplier Capacity Process ........................................................ 27 4.2 Method of calculating capacity ............................................................................................. 30 4.3 Method of evaluating capacity .............................................................................................. 31 4.4 Plan for establishing the One Supplier Capacity Process ...................................................... 32
5 IKEA Trading’s Current Way of Working .................................................................................. 33 5.1 Capacity Groups ................................................................................................................... 33 5.2 Capacities in GPS ................................................................................................................. 33 5.3 Working With Capacities ..................................................................................................... 33
5.3.1 Operationally ................................................................................................................... 33 5.3.2 Tactically .......................................................................................................................... 34
6 One Supplier Capacity Process Implementation .......................................................................... 35 6.1 General Description of the Investigated Plastic Productions ................................................. 35 6.2 Production Situations ........................................................................................................... 36
6.2.1 Situation 1 – One Product Group per production line ..................................................... 36 6.2.2 Situation 2 – One Resource Group is a shared bottleneck for several Product Groups ...... 37 6.2.3 Situation 3 – Multiple Resource Group bottlenecks in a production ................................ 38 6.2.4 Situation 4 – Partial sharing of Resource Groups .............................................................. 38
6.3 OSCP Product Groups ......................................................................................................... 38
7 The Development of the Template .............................................................................................. 41

IX
7.1 Initial Analysis of the One Supplier Capacity Process Method of Implementation ............... 41 7.2 The Template Developed for the Implementation ................................................................ 42
7.2.1 Data Collection ................................................................................................................ 42 7.2.2 Data Analysis .................................................................................................................... 43
8 The Specific Implementations on the Plastic Suppliers ............................................................... 47 8.1 Supplier A ............................................................................................................................ 47 8.2 Supplier B ............................................................................................................................ 48 8.3 Supplier C ............................................................................................................................ 49 8.4 Supplier D ............................................................................................................................ 50 8.5 Supplier E ............................................................................................................................. 50 8.6 Supplier F ............................................................................................................................. 51 8.7 Supplier G ............................................................................................................................ 52 8.8 Supplier H ............................................................................................................................ 52 8.9 Supplier I ............................................................................................................................. 53
9 Analysis and Evaluation ............................................................................................................... 55 9.1 Current Working Methods ................................................................................................... 55
9.1.1 Suppliers ........................................................................................................................... 55 9.1.2 IKEA ................................................................................................................................ 56
9.2 OSCP Implementation ......................................................................................................... 56 9.2.1 Process Implementation .................................................................................................... 56 9.2.2 Product Groups ................................................................................................................ 57 9.2.3 Resource Groups .............................................................................................................. 59
9.3 OSCP Evaluation ................................................................................................................. 64 9.3.1 Supplier Capacities ........................................................................................................... 64 9.3.2 Capacity Planning ............................................................................................................ 68
10 Conclusions and Recommendations .......................................................................................... 73 10.1 Conclusions ........................................................................................................................ 73 10.2 Recommendations .............................................................................................................. 75
11 References ................................................................................................................................. 77 11.1 Literature ........................................................................................................................... 77 11.2 Electronic sources ............................................................................................................... 77 11.3 Journals .............................................................................................................................. 78 11.4 Interviews ........................................................................................................................... 78

X
Appendix A – Reference case A ........................................................................................................... 79
Appendix B - Reference case B ............................................................................................................ 81
Appendix C – Reference case C .......................................................................................................... 85
Appendix D - Reference case D .......................................................................................................... 87
Appendix E - Reference Case E ........................................................................................................... 89
Appendix F - Reference case F ............................................................................................................ 91
Appendix G - Reference case G ........................................................................................................... 93
Appendix H - Reference case H .......................................................................................................... 97
Appendix I - Reference case I ............................................................................................................ 101
Appendix J - Mathematical Model .................................................................................................... 103
Appendix K – Template Instructions for Data Collection ................................................................. 107

XI
Table of Figures
Figure 1. Time plan for the empirical investigation in Shenzhen in China. .............................................. 6
Figure 2. The different dartboards illustrate the relationship between reliability and validity. ................ 10
Figure 3. Illustration of different capacity levels. .................................................................................... 15
Figure 4. Relationships between planning levels, components, and tools. .............................................. 17
Figure 5. Jobbing production. ................................................................................................................ 18
Figure 6. Batch production. ................................................................................................................... 19
Figure 7. Batch production with a stationary bottleneck. ....................................................................... 19
Figure 8. Line production. ..................................................................................................................... 20
Figure 9. The figure describes the three different ways of grouping machines; line production, cellular
grouping, and functional grouping. .............................................................................................. 23
Figure 10. Four steps for implementing a new process ........................................................................... 23
Figure 11. Three different levels of customer-supplier relationships. .................................................... 25
Figure 12. Key OSCP components and their relationship ...................................................................... 28
Figure 13. Available Supplier Capacity ................................................................................................... 29
Figure 14. Depiction of Supplier Capacity Value ................................................................................... 30
Figure 15. Graphic depiction of how the bottleneck's capacity can be allocated between two Product
Groups. The allocation can lie along the red line. ........................................................................ 31
Figure 16. Timeframe for the implementation of OSCP. ....................................................................... 32
Figure 17. One-shot production ............................................................................................................ 35
Figure 18. Assembly production. ........................................................................................................... 35
Figure 19. Situation 1 reference example (Lekman produced at B). ........................................................ 37
Figure 20. Situation 2 reference example (Rufsig Kitchen Utensils S2 and Rufsig Wok Utensils S2). ..... 37
Figure 21. Reference example depicting the complication in Situation 4 (Tolsby Frame and Fantastisk
Napkin Holder produced at B). ................................................................................................... 38
Figure 22. Factors affecting capacity and how they are considered in the template. ................................ 43

XII
Figure 23. The solution for the Situation 4 example. ............................................................................. 44
Figure 24. Looking at the tooling capacities of the round Jämka food savers. ......................................... 59
Figure 25. Example of complicated use of constraining Resource Groups due to the dedication of certain
machines within a Resource Group. ............................................................................................. 62
Figure 26. Dynamic Capacities. ............................................................................................................. 66
Figure 27. Static Capacities. ................................................................................................................... 66
Figure 28. Distribution for the percentual change of capacity for products with static capacities (i.e.
dedicated bottlenecks and dedicated productions). ....................................................................... 66
Figure 29. Distribution for the percentual change of capacity for products with dynamic capacities. ..... 67
Figure 30. The roles of the templates in the capacity planning. .............................................................. 69
XIII
Table of Tables
Figure 1. Time plan for the empirical investigation in Shenzhen in China. .............................................. 6
Figure 2. The different dartboards illustrate the relationship between reliability and validity. ................ 10
Figure 3. Illustration of different capacity levels. .................................................................................... 15
Figure 4. Relationships between planning levels, components, and tools. .............................................. 17
Figure 5. Jobbing production. ................................................................................................................ 18
Figure 6. Batch production. ................................................................................................................... 19
Figure 7. Batch production with a stationary bottleneck. ....................................................................... 19
Figure 8. Line production. ..................................................................................................................... 20
Figure 9. The figure describes the three different ways of grouping machines; line production, cellular
grouping, and functional grouping. .............................................................................................. 23
Figure 10. Four steps for implementing a new process ........................................................................... 23
Figure 11. Three different levels of customer-supplier relationships. .................................................... 25
Figure 12. Key OSCP components and their relationship ...................................................................... 28
Figure 13. Available Supplier Capacity ................................................................................................... 29
Figure 14. Depiction of Supplier Capacity Value ................................................................................... 30
Figure 15. Graphic depiction of how the bottleneck's capacity can be allocated between two Product
Groups. The allocation can lie along the red line. ........................................................................ 31
Figure 16. Timeframe for the implementation of OSCP. ....................................................................... 32
Figure 17. One-shot production ............................................................................................................ 35
Figure 18. Assembly production. ........................................................................................................... 35
Figure 19. Situation 1 reference example (Lekman produced at B). ........................................................ 37
Figure 20. Situation 2 reference example (Rufsig Kitchen Utensils S2 and Rufsig Wok Utensils S2). ..... 37
Figure 21. Reference example depicting the complication in Situation 4 (Tolsby Frame and Fantastisk
Napkin Holder produced at B). ................................................................................................... 38
Figure 22. Factors affecting capacity and how they are considered in the template. ................................ 43

XIV
Figure 23. The solution for the Situation 4 example. ............................................................................. 44
Figure 24. Looking at the tooling capacities of the round Jämka food savers. ......................................... 59
Figure 25. Example of complicated use of constraining Resource Groups due to the dedication of certain
machines within a Resource Group. ............................................................................................. 62
Figure 26. Dynamic Capacities. ............................................................................................................. 66
Figure 27. Static Capacities. ................................................................................................................... 66
Figure 28. Distribution for the percentual change of capacity for products with static capacities (i.e.
dedicated bottlenecks and dedicated productions). ....................................................................... 66
Figure 29. Distribution for the percentual change of capacity for products with dynamic capacities. ..... 67
Figure 30. The roles of the templates in the capacity planning. .............................................................. 69

XV
List of Abbreviations
BD Business Developer
BDM Business Development Manager
CRP Capacity Requirement Planning
GPS Global Purchasing System
HFB Home Furnish Business
IM Injection Machine
IoS IKEA of Sweden
MRP Material Requirement Planning
MPS Material Planning System
OSCP One Supplier Capacity Process
PG Product Group
RG Resource Group
RM Raw Material
SM Support Machine
SPI Supply Plan Information
SP Supply Planner
TA Trading Area
TOC Theory of Constraints
UR Unique Resource

XVI

1
1 Introduction
The intention of the introduction is to provide an understanding of the reasons behind this master thesis. This
includes a background of the problem they experienced by IKEA. This is then developed into a purpose and
constrained by the company directives as well as the authors’ delimitations. The target group is presented along
with an overview of the company and the key processes and functions connected to this thesis.
1.1 Background In all large companies the planning is vital to stay successful among all other strong competitors in the
global market. Capacity planning is one important part of a company’s planning. Capacity planning for
IKEA is how to determine the production resources within the suppliers. Capacity is a measure of how
much of a product that can be produced by the manufacturer in a given time period. There are extra costs
related to having a capacity that is too high or too low. A good capacity planning will minimize the
secured capacity to insure low cost while retaining a good availability of the product by meeting the
demand.1
The capacities could be defined in different ways and it is of great importance that the company has a
clear understanding on how the suppliers have calculated their capacities. When having a number of
suppliers defining and calculating the capacities in dissimilar ways the use of these figures will deteriorate
significantly.
In 2010 a report was published showing the “Top 100 worsties” of IKEA overall performance. This
report presented that 44% of these problems was due to supplier capacity issues. 2 When this was
presented, it was realized that a solution needed to be developed to reduce these problems. The One
Supplier Capacity Process (OSCP) is a process being implemented with the objective to standardize the
methods of working with capacities in order to insure accuracy in the capacity figures maintained and
provide a standard framework to make the capacity planning process more efficient3.
1.2 Problem Discussion4 IKEA currently has difficulty in determining the capacity of different suppliers within their categories
which has led to availability problems. One reason is because there is no standardized method of
evaluating and securing capacity. Although there is a general framework for working with supplier
1 Mattson & Jonsson, 2005 2 Björnsson, (2012-01-23) 3 Ibid 4 Ibid
2
capacities it is not followed locally, meaning there is no specific decision-making framework or procedure
to follow when capacities cannot be met. The decisions being made locally means that figures are updated
infrequently and irregularly.
Capacity is determined on single article level or groups specific to certain suppliers. It means that there
are difficulties translating capacity between different articles from different suppliers and also for articles
that share similar production resources. The key factors for determining the capacity of a production
facility are the critical resources, or bottlenecks, in production. One thing OSCP aims to do is to provide
a framework where the capacity is derived from the capacity of the bottleneck and easily translated
between product groups bound by this bottleneck.
Another issue is that the capacity is registered in different units of measurement such as volumes,
purchasing value, pieces of end products, and square meters. The reason is that although there is a
framework in place ensuring the decision should be made by the category globally, the measurement of
capacity is essentially decided locally. The solution OSCP will provide for this problem is to focus on one
measure for IKEA that is globally defined and this measure is to be pieces of end products. The simple
logic used to justify this choice is that all goods are essentially sold in pieces.
These fundamental problems with the method of planning capacity as well as frequent deviations of the
registered and demonstrated capacities has led to an overall lack of trust in the capacity figures inserted in
the internal planning system.
1.3 Purpose The purpose of this master thesis is to investigate IKEA’s new OSCP model of determining the capacity
of their suppliers. It is summarized into the following four points:
Map and analyze how IKEA and its suppliers are working today ("as-is") with supplier capacity
planning.
The first task is to investigate IKEA’s current method of determining the capacity of their suppliers and
how they work with them. This will provide an understanding of the perceived capacity and a basis for
investigating the impact of an eventual change using OSCP.
Implement ("to-be") the common way of working with One Supplier Capacity Process
The next step is the implementation of the OSCP process IKEA has developed. The focus for the
implementation is the development of a template to effectively apply the process to the plastic
productions visited and address any complications that can arise in a standardized manner.

3
Evaluate the One Supplier Capacity Process
The new process is compared to the current system used to determine whether any benefits have been
realized. The capacities determined using the process are evaluated, but the main focus with regards to
savings are qualitative benefits in the suppliers’ and IKEA’s capacity planning processes. The
implementation process is also evaluated and compared to relevant theory.
Contribute to improve the One Supplier Capacity Process
Throughout the implementation and analysis of OSCP any potential improvements in the
implementation and maintaining of the process should be identified. This includes both from the
suppliers’ and IKEA’s point of views.
1.4 Directives IKEA has approximately 1,000 suppliers in 53 countries5, and investigating all of them is an unrealistic
feat given the time constraints for the thesis. The following directives have been assigned by the company
in order to restrict the scope of the thesis.
Product category
The authors have been tasked with focusing specifically on the product category Plastics. IKEA has
already determined that product groups should not contain articles from different segments. This
delimitation will therefore still allow the investigation of different article groupings in different segments
within a category. 6
Geography
China has been chosen as a starting point for the rollout of IKEA’s new capacity planning process and
subsequently the investigation will only affect Chinese suppliers. Suppliers are largely grouped with
regards to which category of products they produce, and Plastics are produced around the city of
Shenzhen in the Guangdong province. Here there are 7 suppliers, and in addition there are 2 suppliers in
Taiwan meaning a total of 9 suppliers will be investigated. 7
1.5 Delimitations The total time spent on the project is 20 weeks; 12 weeks of this time will be spent in China. This will
limit the depth of the project both with regards to the investigation of the suppliers as well as the analysis
of the results, where quantitative savings with regards to the calculated capacities resulting from the
process are difficult to analyze. When calculating the capacity for each supplier the total capacity except
5 Andrukiewicz (2012-01-27) 6 Björnsson (2012-01-23) 7 Ibid
4
for capacity dedicated to other customers is regarded. The basis for the capacity allocation will be the
current need decided on supplier level.
1.6 Target Groups This thesis report is mainly written for employees at IKEA to give guidance on how to proceed to
implement the OSCP process as well as an evaluation of its potential benefits. It could also be use by
other students who want to immerse themselves in capacity planning. It is therefore assumed that the
reader has basic knowledge of production management.
1.7 Company Descriptions
1.7.1 General description Ingvar Kamprad founded IKEA in 1943 in a small village called Agunnaryd in Sweden. Today it is one of
the world leading companies in the furniture business, with 131 000 coworkers in 41 countries and with
an annual revenue of over 24,7 billion euro. About 88 percent of all IKEA stores are fully owned by IKEA
and the remaining stores are operated by other franchisees owned outside the IKEA Group.8
The company is divided into three groups; the IKEA Group, Inter IKEA Group and the IKANO Group.
The IKEA Group encompasses all from warehouses, distribution, and also owns the stores in each
country. Inter IKEA Group owns the trademark and process and takes a franchise fee from all IKEA
stores revenue, and the IKANO Group is an organization that deals with all financial work.9
IKEA’s business idea is “To create a better everyday life for the many people”. Their mission is to “offer a
wide range of well-designed, functional home furnishing products at prices so low that as many as
possible will be able to afford them.”10
Kamprad has been keen on creating an ownership structure and organization that stands for individuality
and sustainability. Therefore, the IKEA group is owned since 1982 by a foundation.11
IKEA has adopted a process-oriented organization only recently in order to tie functions together to
improve efficiency. The three main processes are Creating the Home Furnishing Business,
Communicating and Selling, and Supplying. Within Supplying there are four core processes, one of
which is Plan & Secure Logistics. To this process there is a sub-process called Plan & Secure Capacity
(PSC) responsible for carrying out the capacity planning. 12
8 IKEA (a) 9 IKEA (c) 10 IKEA (b) 11 IKEA (c) 12 IKEA Intranet (a)

5
1.7.2 Functions There are three key functions within IKEA that are connected to the OSCP process:
Home Furnishing Businesses
IKEA of Sweden (IoS) is responsible for the development of the range of home furnishing products. This
range is divided into eight Business Areas (BA), for example “Living Room and Workspaces” and
“Lighting”, and complemented by a Free Range. This division is further disaggregated into 20 Home
Furnishing Businesses (HFB), for example “Living room seating”, “Store and organize furniture” and
“Workspaces” with the BA “Living Room and Workspaces”. At IoS there are Demand and Need Planners
responsible for forecasting the need and aligning it to the capacity respectively. 13
Categories14
In addition to belonging to an HFB each IKEA product also belongs to a category. The categories are
based on products belonging to the same industry, meaning they share similar materials and/or
production techniques, and as a result share a similar supplier base. The reason for this division is to
coordinate the purchasing within the different industries rather than allowing the HFBs to separately
perform this task.
Each category is led by one Category Leader at IoS and one or more at Trading Operations, who are
accountable for the development of their category.
Trading Operations15
This is the unit within the Supply function responsible for supporting and developing the suppliers. The
Trading Operations are divided into 9 regional Trading Areas (TAs). In each area the function is divided
into Category specific teams. These teams consist of the following positions connected to specific key
goals:
• Business Developer (BD) and Business Developer Manager (BDM) o Responsible for price development and ensuring environment and social
requirements are met. • Supply Planner (SP)
o Responsible for ensuring product availability. This includes maintenance of the operational capacity figures.
• Technician o Responsible for ensuring product quality.
13 IKEA Intranet (c) 14 IKEA Intranet (a) 15 IKEA Intranet (d)
6
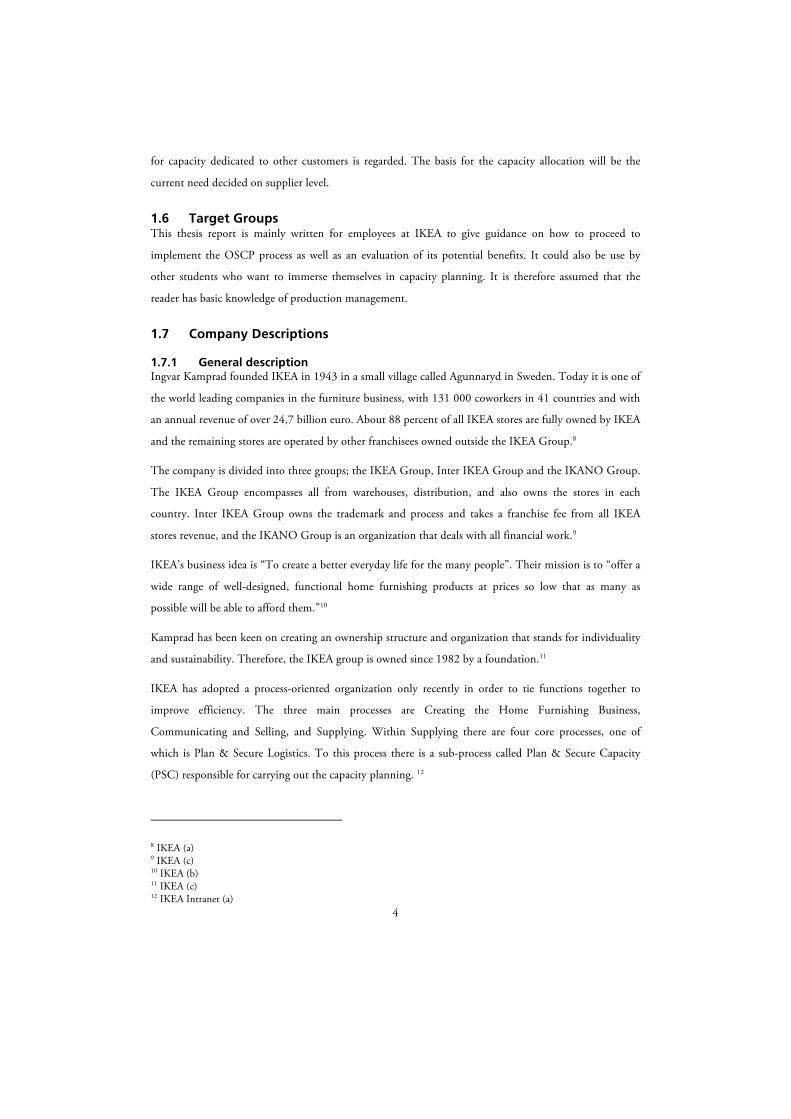
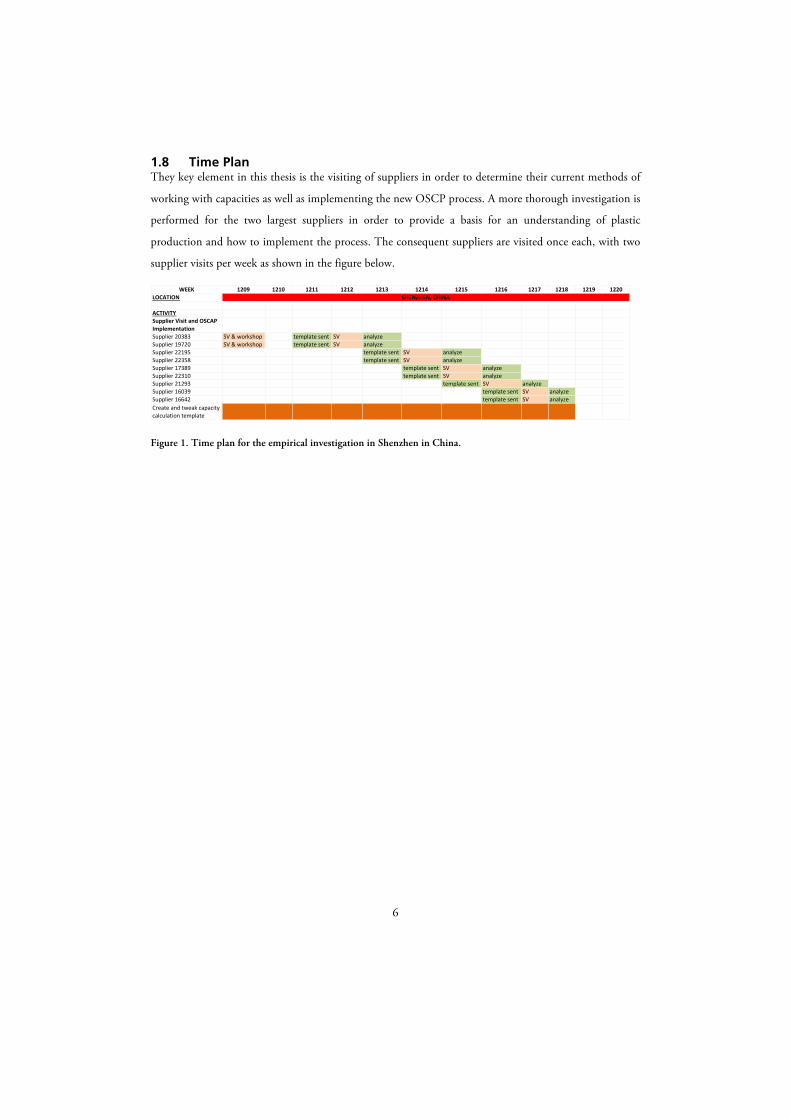
1.8 Time Plan They key element in this thesis is the visiting of suppliers in order to determine their current methods of
working with capacities as well as implementing the new OSCP process. A more thorough investigation is
performed for the two largest suppliers in order to provide a basis for an understanding of plastic
production and how to implement the process. The consequent suppliers are visited once each, with two
supplier visits per week as shown in the figure below.
Figure 1. Time plan for the empirical investigation in Shenzhen in China.
WEEKLOCATION
ACTIVITY
1209 1210 1211 1212 1213 1214 1215 1216 1217 1218 1219 1220SHENZHEN,;CHINA
Supplier;Visit;and;OSCAP;ImplementationSupplier(20383Supplier(19720Supplier(22195Supplier(22358Supplier(17389Supplier(22310Supplier(21293Supplier(16039Supplier(16642Create(and(tweak(capacity(calculation(template
SV(&(workshop template(sent SV analyzeSV(&(workshop template(sent SV analyze
template(sent SV analyzetemplate(sent SV analyze
template(sent SV analyzetemplate(sent SV analyze
template(sent SV analyzetemplate(sent SV analyzetemplate(sent SV analyze

7
2 Methodology
This chapter describes the different methods and approaches used when performing research. The used methods
and approaches for this master thesis are also stated and motivated.
2.1 Participatory Action Research Participatory action research (PAR) is a method of research used when the researcher is actively
participating not only in the development phase of a project but also the implementation, while at the
same time performing research about it. When doing this type of study the investigator is both a
researcher and a manager, constantly implementing changes throughout the project based on ongoing
analysis. When using this method the process will be updated during the course of the project. The
development process in a project is normally very complicated and the PAR research method gives a
better view of the reality through a close daily interaction. This also leads the potential to put the findings
of a research into practical use quickly. 16
Method chosen The PAR method has been used during this project since the authors have been actively involved in the
implementation of the OSCP process. The template used as a key tool to implement the process
effectively was created by the authors and has continuously been updated following each new obstacle
investigated and addressed.
2.2 Methodology Approach The methodology describes the decided approach on how the study will be performed. There are four
different levels on which the study could be formed; explorative, descriptive, explanative, and normative.
This is based on the amount of existing knowledge in the specific research area. An explorative study is
performed when there is little expertise within the area and the goal of the study is to reach a basic
understanding. When there already is basic knowledge and understanding within the area and where the
objective is to describe but not explain the relations the descriptive study method is used. Explanative
research is used when you want to explain and describe a area deeper to get a better understanding, while
normative study is used when knowledge already exist and the goal for the study is to dig deeper into the
subject and locate ways to improve. 17
Method chosen A lot of research already exists within the field of capacity planning. As the thesis aims to implement a
new process and evaluate and improve it based on existing theory the approach can be seen as normative.
16 Ottosson, 2003 17 Björklund & Paulsson, 2008

8
2.3 Induction, Deduction, and Abduction There are normally two different methods to precede a research project; induction or deduction. The
induction method starts with making the empirical study of the area without looking into the theory and
instead the theory is based on the empirical study. The deduction method starts with the theory, and a
funded theoretical hypothesis is tested empirically. When using both induction and deduction back and
forth the method is called abduction.18
Method chosen The deduction method is used for this master thesis, as the basic knowledge from the theory along with
the OSCP process is the foundation for the research. The process is implemented through the template
and empirically tested and evaluated.
2.4 Quantitative and Qualitative studies A quantitative study contains information that could be measured or be validated numerically. This
means that the results from these studies could be generalized to make conclusions. Qualitative studies are
used to do deeper analyzes and the possibility to generalize is normally low. 19
Method chosen The calculations of the capacities is quantitative, but the main focus is the implementation and
adaptation of the OSCP concept to the productions visited and evaluate the effect of the process as a tool
to aid in capacity planning. It can therefore be concluded that the study is mainly qualitative.
2.5 Data Collection The data being gathering to the research could be divided into two types; primary and secondary data.
The primary data is data collected to be used specifically for the research work; for example interviews,
questionnaires and observations. Secondary data is general public information; for example literature and
articles.20
2.5.1 Interviews Interviews are categorized as a form of primary data and could be performed in various ways; for example
by telephone, email, and face-to-face contact. The interviews could be structured, semi structured and
unstructured. A structured interview uses predetermined questions in a specific order and is normally
used when having a large number of interviews. Otherwise, if the question areas are decided before but
the actual questions are decided at the interview and are formulated during the interview depending on
18 Björklund & Paulsson, 2008 19 Ibid 20 Ibid

9
the interviewers’ reactions the interview is called semi-structured interview. The last way is the
unstructured interview where the questions are decided during the dialog. 21
2.5.2 Observations Observations can be done in various ways. One way of doing it is to be part of the activity and another
way could be to observe the activity from the outside. The observation could also be varied by giving
information in advance for more detailed information or by being performed in secret so the observed do
not know that you are observing them, which will give a better picture of the reality. 22
2.5.3 Literature study23 This is written material such as books, and articles. This is a secondary data because it isn’t specific for the
research, and this is important to consider when using information from this kind of source. The purpose
of the material could be different from the research, which can render it unusable.
Method chosen for data collection The interviews where performed both with the TA team in Shenzhen and with the suppliers during the
project period. There were two different approaches used for trading and supplier respectively. The TA
team was interviewed with a semi structured method face-to-face and the suppliers were interviewed by
email in a structured form. The main reasons for this is because that the best way of doing an interview is
to have it face-to-face to get more details and background to the answers. The good cooperation between
the researcher and the TA team made it easy to ask questions as soon as they came up. The interviews
with the suppliers were done by mail because of the distance to them and the limited time during the
supplier visits.
The observations that have been done during the master thesis project have mainly been at the supplier
visits. The observations have been done together with the suppliers through discussions and by factory
visits.
The authors have based the report mainly on literature concerning capacity, process implementations,
and other relevant theories to form the theoretical framework. The literatures have mainly been journals
available from e-sources and written literature. In addition to this internal documents from IKEA have
been used.
21 Björklund & Paulsson, 2008 22 Ibid 23 Ibid
10
2.6 Credibility In a scientific report it is important to show a high credibility to give the reader a necessary
trustworthiness of the writer. To get this high trustworthiness in the report the research need to have
good validity, reliability, and objectivity.
2.6.1 Reliability The reliability is measured by repeating the study to make sure the same result is repeated whenever. If a
study has good reliability it should be able to be repeated by other researchers in the same conditions and
arrive at the same results. Without any repetition of the experiment and study the result will always have a
low testability, meaning that the hypotheses are neither supported nor disproved. 24
2.6.2 Validity The validity shows to what extent what was measured actually got measured. To get a high validity it is
important to test with different perspectives. It is important to make sure the study is not angled towards
a specific approach. 25
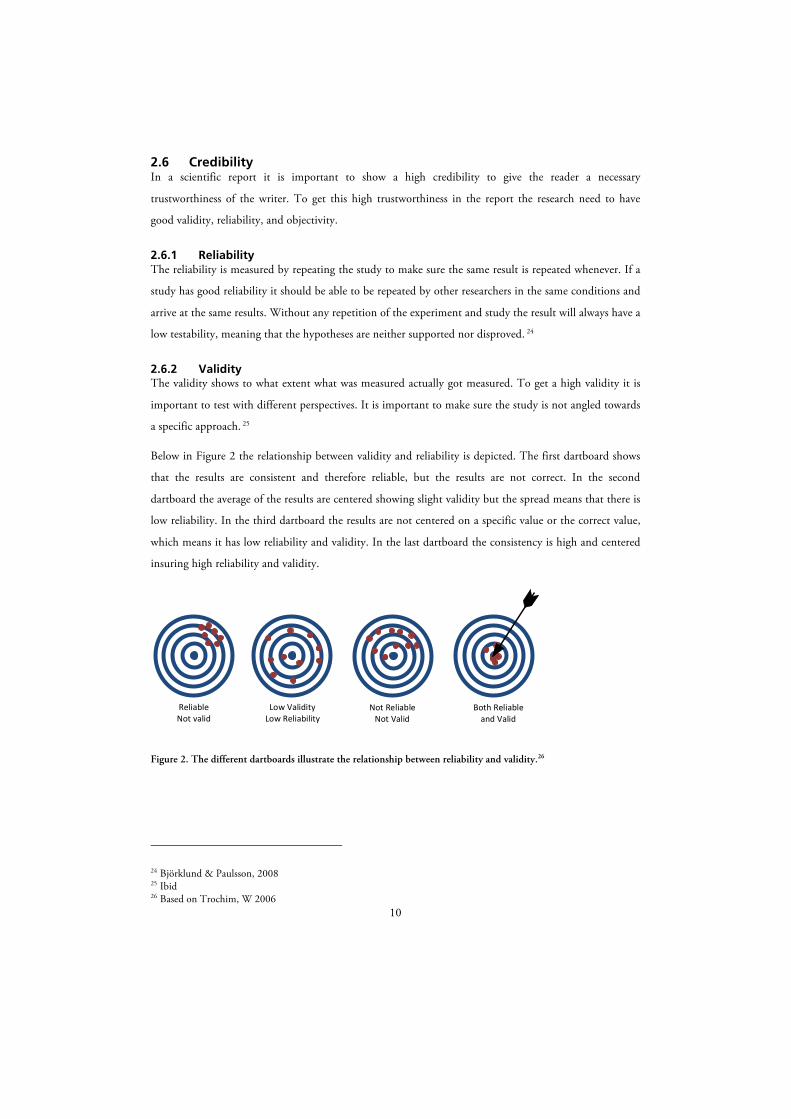
Below in Figure 2 the relationship between validity and reliability is depicted. The first dartboard shows
that the results are consistent and therefore reliable, but the results are not correct. In the second
dartboard the average of the results are centered showing slight validity but the spread means that there is
low reliability. In the third dartboard the results are not centered on a specific value or the correct value,
which means it has low reliability and validity. In the last dartboard the consistency is high and centered
insuring high reliability and validity.
Figure 2. The different dartboards illustrate the relationship between reliability and validity.26
24 Björklund & Paulsson, 2008 25 Ibid 26 Based on Trochim, W 2006
Reliable Not valid
Low Validity Low Reliability
Not Reliable Not Valid
Both Reliable and Valid

11
2.6.3 Objectivity The objectivity shows to what extent someone’s evaluation has an influence on the studies. High objective
could be archived if the researcher clarifies and explains the methods chosen, which will make the reader
be able to take its own position in each manner. 27
Credibility of this thesis This study is mainly based on supplier visits and interviews with the TA team in Shenzhen and suppliers
of plastic products. The reliability of this study therefore depends on the repetition of each case that has
been encountered. During the research period nine suppliers have been visited all with similarities to each
other and a lot of dissimilarities. The complications discovered in one visit are repeatedly found during
the other visits. This makes the reliability rather high but the visits are only performed in China and
Taiwan, which means the situation may look different in other countries.
The validity of the information gathering from the supplier visits could be assumed to be pretty high by
the reason of the number of visits and also the dissimilarity in production setups. The information
gathered and the conclusions drawn have a high probability of being useful for other plastic suppliers.
However again the investigation into only Chinese and Taiwanese suppliers may limit the validity with
regards to applying to more automated or well planned productions in other countries.
The interviews where structured in one way for the suppliers and one for the TA team. The supplier’s
interviews were done in a structured manner with the identical questions to each that was sent by mail
and answered by mail. The reasons for having just email interviews with the suppliers where because the
supplier visits already gave answers to most of the questions and the interviews gave confirmations to
these answers as well as some answers to additional questions. The interviews with trading where done in
a semi-structured method with written questions and follow up questions to make sure the answers is
reliable.
The research has a low objectivity mainly due to the authors’ participation in the implementation process
and specific application of OSCP to the plastic suppliers visited. The research has greatly been affected by
these participants’ ideas and thoughts that all together have shaped the research work.
2.7 Criticism of Sources The sources that have been used during the supplier visits have been managers from the suppliers and
trading from the office in Shenzhen. The suppliers visits has been done in generally two days which
means it is a limited time for deep understanding. This means that there could be misunderstandings
mainly because of the translations between English and Chinese, but also because of the sometimes low
27 Björklund & Paulsson, 2008

12
level of knowledge from the suppliers. These errors have decreased by repeatedly asking follow up
questions to make sure the answer is correct. By sending out interviews by email to the suppliers the data
gathered during the visits could be confirmed. The close cooperation between the suppliers and trading
also made it easy to make follow up questions on things that was found unclear after the visits.
Besides these possible causes of errors, there is also risk that the data they gave is wrong for things such as
the cycle times for the machines and labor. This was secured at all suppliers’ visits with a short production
visit where some of these data was checked and the flows were controlled compared to the data collection
sheet filled in by the suppliers. This is an important step in a supplier visit that makes the data collected
more valid.
The TA at the IKEA office in Shenzhen on the other hand could also be a cause of errors in the project.
Frequent meetings are arranged to make sure the project is going in the right direction. The interviews
performed at the TA office have been with four different employees of varying positions to make sure the
information is correct. The close cooperation in daily work between the authors and TA employees made
it easy to discuss questions that came up and other issues.
2.8 Method of Implementing the One Supplier Capacity Process The first step of the implementation of the OSCP process was an introductory workshop week planned
by the project group from IoS with the aim of providing the local TA teams with a good understanding
of the process. The agenda for the week was as follows:
• Monday: A presentation of the process was made by the project group from IoS followed by
workshop with the Category teams in Trading from Shenzhen, India, and Taiwan.
• Tuesday and Wednesday: The week also included presentations and workshops at the two key
suppliers in Shenzhen, A and B, that together stand for the majority of the total turnover
within the Plastic Category in China. The workshop included investigation of a production
line in order to perform Resource groupings and calculate consumption rates in order to
familiarize both the suppliers and local Trading team with the process.
• Thursday and Friday: A final workshop was performed with the Trading teams and the IoS
project group. The goal was to resolve any issues and questions raised to ensure a good
understanding from all parties involved.
With the resulting feedback and experience from this introduction week a preliminary template was
developed by the project team and expanded by the authors in order to effectively provide the suppliers
with an efficient method of collecting the relevant data and processing it. Following the principles of
Participatory Action Research this template was evaluated and improved as needed following each
supplier visit in order to improve the implementation at each succeeding supplier.

13
The method of implementation developed at this point was to send out the latest version of the complete
template to each supplier a few days in advance of the visit. They were asked to perform the data
collection part of the template and to attempt to familiarize themselves with the data analysis part. After
that the authors and the respective responsible Supply Planner or Business Developer visited the suppliers
for a one to three day workshop at each supplier, depending on the complexity of and amount of
products produced. This included a revisit to the suppliers visited in the introduction week.

14

15
3 Frame of Reference
In this chapter the theory that the analysis is based on is presented. Although the focus is capacity planning there
is also a presentation on relevant theory pertaining to the Theory of Constraints management philosophy,
machine grouping in productions, as well as supplier relationships and process implementation in order provide
a basis for evaluating the implementation of the process.
3.1 Production Capacity
3.1.1 Definition28 Production capacity is a measurement of level of output a production can generate in a given time period
with the current resources. Common measurements include man-hours, machine hours, units, kilograms,
or value (currency) per time unit. Regardless of the choice it is important that it reflects the aims of the
organization, and that there is consistency in which measurement is used.
There are different levels of capacity as depicted in Figure 3.
Figure 3. Illustration of different capacity levels.29
Maximum capacity is the capacity given full operation every hour of every day in a year. This capacity is
seldom utilized and therefor not of interest. Instead the nominal capacity is often calculated. This is the
planned capacity with regards to four key variables: amount of machines or other production units in a
production line, number of shifts per day, number of hours per shift, and number of working days per
period of planning.
It is however again seldom the case that this even level is achieved. This is due to capacity lost as a result
of for example machine breakdowns, labor absences, maintenance, and so on. When this is taken into
account the gross capacity is determined. In order to arrive at the net capacity there are further
unplannable events or operations that need to be taken into regard. These may include time spent on
28 Mattson & Johnsson, 2005 29 Based on Mattson & Johnsson, 2005
Maximum'Capacity'
Nominal'Capacity'
Gross'Capacity'
Net'Capacity'
Capacity(not(planned(to(use(
Capacity(lost(
Unplannable(opera3ons(

16
reviews with management, waiting time for materials, and so on. It also includes unplannable production
dedicated to for example rework of claims and rush orders. The resulting net capacity is the true available
capacity that can be utilized for production.
3.1.2 Capacity Planning Capacity planning deals with ensuring that the capacity of production resources can meet the changing
demands for products.
3.1.2.1 Levels of capacity planning There are three different levels of capacity planning within production generally classified depending on
the time frame. Strategic planning is long-term and focuses on expansion of capacity through capital
investments. Mid-term tactical planning deals with the aggregate planning process of assigning resources
to products. It involves time-staged planning to meet the demand, and includes decisions that modify the
capacity such as labor hiring or firing and building stocks. In the short term operational planning the
detailed decisions to execute the production are made. It involves planning and purchasing materials and
scheduling the capacity and final assembly.30
3.1.2.2 Tools for capacity planning The key components to a successful planning process are the master production schedule (MPS) for the
tactical planning, and the material requirements plan (MRP) and input and output (I/O) control for the
operational planning (shown in Figure 4 along with the planning level to which the components belong).
The MPS is a weekly plan that translates sales and operations planning into a production plan for specific
time periods. This production plan is supported by MRP that ensures resource availability. The I/O
control ensures the most efficient use of production resources. There are different types of capacity
planning that differ in sophistication and hence support different levels of the production planning
process. The differences in level of sophistication of these planning methods also influence their
applicability to different production types.31
30 Mattson & Johnsson, 2005 31 Tenhiälä, 2011

17
Figure 4. Relationships between planning levels, components, and tools. 32
Non-systematic capacity planning
The simplest form of capacity planning is using a non-standardized approach. The MPS is based on
experience to determine the feasibility. The Bill of Materials (BOM), a list of raw material and
component requirements for an end product, supports the MRP and processing lead times are
determined by averages and buffered by arbitrary safety lead times. The scheduling for the I/O control is
based on priority rules for capacity leveling. 33
Rough-cut capacity planning (RCCP)34
RCCP is the simplest standardized capacity planning and is associated with the development of the MPS.
This form of capacity planning aims to estimate capacity requirements on resource or resource group
level, and is usually only used for resources that may have insufficient capacity and not for those with a
history of low utilization. It does not take into account things such as subassemblies, setups, and batch
sizes. There are three key approaches to rough-cut capacity planning, providing figures with accuracy
relative to the detail of the input.
RCCP is an efficient planning tool to use in jobbing productions (Figure 5). This is because the high level
of variation and low volume means that maintaining detailed information on specific jobs is difficult.
Because the productions focus on general-purpose machinery there is a low level of complexity, which
also suits RCCP.
32 Based on Tenhiälä, 2011 33 Tenhiälä, 2011 34 Swamidass, 2000
Master'Produc-on'Schedule'
Input/Output'Control'
Material'Requirements'Planning'
Tac-cal'
Opera-onal'
Rough=Cut'Capacity'Plan'
Capacity'Requirements'Plan'
Finite'Loading'
Planning'Level' Planning'Component' Planning'Tool'

18
Figure 5. Jobbing production.35
RCCP by method of overall factors
This first method requires information about the total standard machine or labor hours required by each
finished product as well as a historical percentage about which operation these hours pertain to. As there
is no account for lead time in this method it only provides good estimates of capacity needs when the
production mix remains fairly constant.
RCCP using the bill of labor
The Bill of Labor (BOL) is a list of the capacity requirements of production operations needed to produce
a product similar to the way the BOM lists the raw materials and components requirements. Because of
the use of actual information on requirements from different production operations rather than historical
estimates this method is more accurate than the previous. It again does not take lead times into account
making it inaccurate for changing production mixes.
RCCP using the resource profile
This approach is similar to the previous approach using the BOL but it also takes the lead time into
account by offsetting the capacity requirements into earlier weeks depending on this. It is therefore the
most accurate approach. The lead time makes the calculations more difficult as the needs of a certain
week are based on the MPS for that week and perhaps several different weeks ahead due to the offset.
Inaccuracy in the approach stems from situations when the actual production lots do not correspond with
the MPS quantities.
Capacity Requirements Planning (CRP)36
CRP provides more detail and support for the MRP. It looks specific products and even subassemblies
and their capacity requirements with regards to raw materials and components as well. Production
routing also provides the ability to consider sequencing, batch sizes, and setups allowing for a more
35 Based on Tenhiälä, 2011 36 Tenhiälä, 2011
Resources(
Bo*leneck(resource(
Material(flows(

19
efficient production plan. Manual iterations are generally used for revising the plans, often requiring a
large amount of them.
In batch production (Figure 6) orders are more repetitive and resources are more specialized, meaning
that the maintenance of data pertaining to specific resources is of more importance. There is also a need
to consider different routings in the planning process.
Figure 6. Batch production.37
Finite-loading38
Finite-loading generally tends to automate the iterations previously described. It uses algorithms to
automatically schedule production so as not to exceed capacity constraints while ensuring minimal failure
to meet due dates. This automation reduces the chance of human error. The method can be extended to
complement the capacity leveling with optimization to minimize setups and downtimes for example. The
method requires an extensive array of parameters to define the production and ensuring the accuracy of
these is crucial in the resulting quality of the plan. Due to the level of detail the method supports the I/O
control process.
In a batch production with a stationary bottleneck (Figure 7) the complexity is reduced which means that
the finite loading method can be applied. This is because when there is no stationary bottleneck the finite
loading of one resource may move the bottleneck to another resource. The iterative revision of the plan
could potentially enter an endless state.
Figure 7. Batch production with a stationary bottleneck.39
37 Based on Tenhiälä, 2011 38 Tenhiälä, 2011 39 Based on Tenhiälä, 2011
Resources(
Material(flows(
Resources(
Bo*leneck(resource(
Material(flows(
20
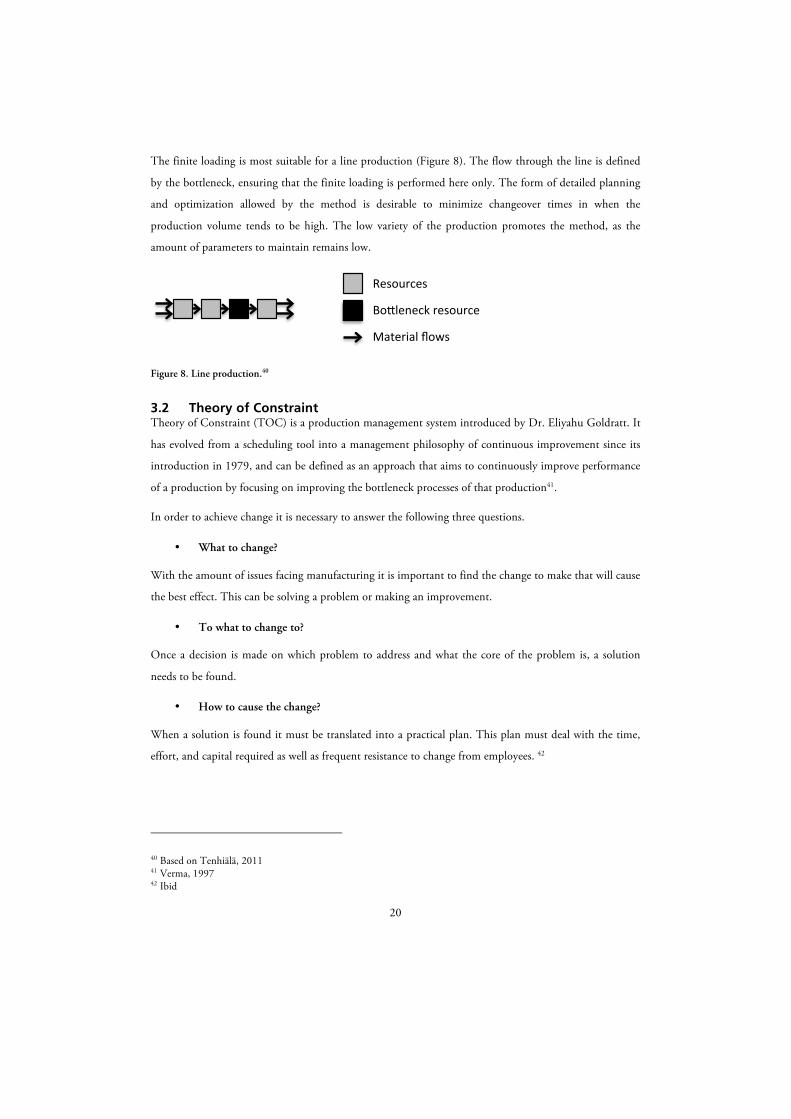
The finite loading is most suitable for a line production (Figure 8). The flow through the line is defined
by the bottleneck, ensuring that the finite loading is performed here only. The form of detailed planning
and optimization allowed by the method is desirable to minimize changeover times in when the
production volume tends to be high. The low variety of the production promotes the method, as the
amount of parameters to maintain remains low.
Figure 8. Line production.40
3.2 Theory of Constraint Theory of Constraint (TOC) is a production management system introduced by Dr. Eliyahu Goldratt. It
has evolved from a scheduling tool into a management philosophy of continuous improvement since its
introduction in 1979, and can be defined as an approach that aims to continuously improve performance
of a production by focusing on improving the bottleneck processes of that production41.
In order to achieve change it is necessary to answer the following three questions.
• What to change?
With the amount of issues facing manufacturing it is important to find the change to make that will cause
the best effect. This can be solving a problem or making an improvement.
• To what to change to?
Once a decision is made on which problem to address and what the core of the problem is, a solution
needs to be found.
• How to cause the change?
When a solution is found it must be translated into a practical plan. This plan must deal with the time,
effort, and capital required as well as frequent resistance to change from employees. 42
40 Based on Tenhiälä, 2011 41 Verma, 1997 42 Ibid
Resources(
Bo*leneck(resource(
Material(flows(

21
In order to answer these questions Goldratt introduced a Five Focusing Steps (5FS) heuristic, which is a
simple method of implementing the TOC practice.43
Step 1. Identify the system’s bottlenecks
This is the basis of TOC. The bottleneck of the system determines the throughput of the system.
Step 2. Decide how to exploit the bottlenecks.
Exploiting the bottleneck results in maximizing the entire systems throughput given its constraints.
Step 3. Subordinate everything else to the above decision.
The rest of the production should focus on maintaining high utilization of the bottleneck. This essentially
means planning the rest of the production so that the bottleneck has maximum utilization without
unnecessary work in progress elsewhere in the system.
Step 4. Elevate the system’s bottlenecks.
Should the throughput of the bottleneck be insufficient capacity needs to be added to it.
Step 5. If, in a previous step, a bottleneck has been broken go back to Step 1.
This step leads to continuous improvement prompting the restart of the process. Elevating the capacity of
the bottlenecks may create new bottlenecks.
3.3 Machine Grouping To get from raw material to a finished products it requires one or more process steps normally carried out
by machinery and labor. The flow between these processes could be organized in different ways
depending on the type of manufacturer. There are three types of production setups that are normally
used; line, cellular, or functional setups. The method of grouping the machines may increase the
efficiency and total utilization of the machine park if suited to the nature of the products being produced.
It is also common that manufacturers use a mixture of these setups.
3.3.1 Line production44 The line production is a setup where the machines are grouped in the sequence for which they are used in
a processing a specific product. By this reason the setups could also be called product layout and an
example of the setup is shown in Figure 9. This kind of machine arrangement is suitable for continuous
production of high quantities. The line production could be divided into two different types of lines,
steering and floating line. In steering lines all processes will mechanically be controlled to keep same
speed. The floating line does not have this kind of forced control and the material buffers are allowed.
43 Verma, 1997 44 Mattson & Johnsson, 2005

22
The benefit with this kind of setup is that the time required through the production line could be short.
The mayor disadvantage is that if one machine within the line stops the whole line need to be stopped.
By attempt to have buffers before all processes the production balance could be better.
3.3.2 Cellular manufacturing45 The cellular manufacturing is one way of grouping machines for producing groups of products with close
similarities with regards to production and design. The machines in that group are placed closed together
and are dedicated to a group of products as shown in Figure 9. Each cell consists of necessary machines to
ideally complete the articles within the product group to which is dedicated.
The benefits with this type of production setup is that the machines that are dedicated to products are
close to each other, which will lower the transportation time of the batches between the production steps.
Products with similar production settings could be placed after each other if they use the same machine,
which will minimize the setup time. This type of setup is also ideally for a computerized production.
On the other hand the disadvantages of this kind of machine setups could also be discussed. First of all it
normally incurs a high investment that is needed for the re-planning of machinery and any new
equipment that must be purchased. The grouping into cells could also lead to disadvantages
if new products that are introduced cannot be produced in the existing cells.
3.3.3 Functional manufacturing46 Functional manufacturing is another type of workstation design where machines are arranged into
functional groups with machines of similar characteristics, where a product jobbed by any machine in this
group. By grouping the machines in this way the production will be stronger against breakdowns, as the
total production do not need to be stopped. This kind of setup is also very useful for production of low
demand products together with high demand products, because the utilization of the machines could be
kept high. The functional layout is shown in Figure 9 and describes the flow of the products.
A possible benefit with introducing functional manufacturing is the ability to achieve a better balance in
production and increases in productivity. The main costs is associated with the implementing of the
system in an existing production facility, due to the necessary reorganization of machines into cells as in
cellular manufacturing. It is also important to consider that the loss of production hours during
implementation of the new setup could be very high.
45 Shahrukh, 1999 46 Shahrukh, 1999

23
Figure 9. The figure describes the three different ways of grouping machines; line production, cellular grouping, and
functional grouping.47
3.4 Process Implementation To successfully implement a new process requires the right knowledge, preparation, resources, time, and
also a strong will from all involved. The implementation could be divided into four steps; defining the
initial state and creating a project team, planning for the process implementation, executing the process
implantation, and evaluate the process implementation. These four steps are shown in Figure 10 and are
described below.48
Figure 10. Four steps for implementing a new process49
47 Based on Shahrukh, 1999 48 Based on James C. Helm, 2001 49 Based on James C. Helm, 2001
L" L" M" G"
L" M" M" G"
L" G" G" D"
M" G" G" D"
Line"layout"
L" M"
L" D"
L" D"
M" M"
L" D"
G" G"
M" D"
G" G"
Cellular"layout"
L" L"
L" L"
M" M"
M" M"
G" G"
G" G"
D" D"
D" D"Func3onal"layout"
Key:"L"="lathe " "M"="mill " "G"="grinder """"D"="drill"
Start%
Ready%
1.%Define%ini0al%state%and%project%team%
2.%Plan%Implementa0on%
3.%Execute%Implementa0on%
4.%Evaluate%Process%Implementa0on%

24
3.4.1 Define initial state and project team The first step in implementing a new process is to get a sharp understanding of how the organization is
currently operating and what tools are in use. This also includes what kind of people that are working
there, with regards to their competence and motivation. Then the current problems in the organization
are identified and potential improvements are developed. The project team leading the implementation
should be created and their different responsibilities should be determined. 50
3.4.2 Plan process implementation Step two is to establish a plan for the implementation that should include all tasks required, the resources
needed and the timeframe for each task. The plan should constantly be reviewed and changed if needed.
During the implementation time all progress should be followed up to see if the plan should be modified
to make sure the project is moving towards its goal. 51
The goals for the project should be set, such as how the process will work when the implementation is
completed. Before the actual process can be implemented the project team has to make sure that all
involved managers support the project. Well-prepared documents and presentations should be used to
explain all benefits with the new processes for them and the company. Process implementation guidelines
should be used to give a clear view how the actual implementation will be executed. All risks in the
project should be taken into account.52
3.4.3 Execute process implementation Before the actual process implementation could be start it is recommended that using a smaller group for
a pilot to make sure that people will understand and make the actual rollout smoother and better. The
feedback from the pilot should be taken into account to improve how the implementation should be
proceeding. When starting the actual rollout the revised presentations and material are presented and the
training starts. 53
3.4.4 Evaluate process implementation Normally when introducing new processes there are complications in the implementation and it is of
great importance that these are considered, so that the process can be modified and improved. A process
implementation is not fulfilled successfully if people are not following the new process, so it is critical to
ensure that processes is followed and also in a satisfying way. The processes should be continuously
improved both during the implementation and after to make sure it is updated.54
50 James C. Helm, 2001 51 Ibid 52 Sheard, 2003 53 James C. Helm, 2001 54 Ibid

25
3.5 Supplier Relations55 Today’s businesses normally have a strategy that includes having several outside companies deliver goods
and services. These suppliers are of great importance for how the companies’ performance will develop.
Normally companies prioritize to keep the activities that they are best at in-house and remaining will be
outsourced to company specialized in these kind of products or services. In this way the company can
keep their focus on its core processes. In order to obtain a first class-performance for a company it is
important that their suppliers have a first class performance as well.
There are different ways for a company to handle their suppliers, which depends on what kind of risk that
is related with the specific suppliers products or services. The risk could be associated with how many
available suppliers it is on the market, time to develop new suppliers and if the product is vital for the
company or not. If a product is easy to find by sourcing from other suppliers the risk will be low.
Products that are vital for the company and where it is hard or takes long time to develop new suppliers,
the products can be seen as having a higher risk. The relationships that a company could have with their
suppliers could be divided into three steps as shown in Figure 11.
Figure 11. Three different levels of customer-supplier relationships. 56
The pyramid shows different grades of customer-supplier relationships and each step has it specific
strategies on how to handle the supplier.
The suppliers at the lowest level of the pyramid are the conventional suppliers. The relationship to these
suppliers is characterizes by the price being main factors of deciding on a supplier, and the company
usually keep a safety stocks to handle supply disruptions. The conventional suppliers could be divided
into two different kinds; those with frequent orders and those with infrequent orders.
55 Mattson & Johnsson, 2005 56 Based on Mattson & Johnsson, 2005
Associated*Suppliers*
Conven3onal*Suppliers*
Partnership*Supplier*
*
26
Next level in the relationship pyramid is the associated suppliers where they characterizes by a longer
relationships and closer cooperation. Together they try to shorten the lead-times and stock costs by
synchronizing product flows. For this kind of suppliers price is just one assessment variable when
choosing a supplier.
The top part of the relationship pyramid is partnership suppliers, where all is included from the associated
suppliers but the relation is even deeper. In this kind of relation suppliers will be included in product
development, frequent information exchange, and quality questions. In this kind of relationships
investments in new equipment could be funded together or by the company because of the long
relationships. Normally very long contracts are written to secure a healthy relationship.
To keep a relationship in a higher level there is a need for a lot of time and cost efforts to maintain the
supplier in the high level. It is normally too costly to keep all suppliers in the higher level of relationships
and it is not necessary if the products from that supplier aren’t an essential for the company’s success. By
concentrating on the suppliers where highest volume, biggest profits and suppliers that help with the
technical development, the company could keep the costs down. It has been shown that 20% of
commodities suppliers stands for 80% of the total spending (the 80-20 rule).

27
4 One Supplier Capacity Process57
In this chapter the One Supplier Capacity Process is presented, focusing on the framework for implementing it
and calculating capacities.
This is a description of the One Supplier Capacity Process (OSCP), a process designed by the Plan &
Secure Capacity process within IKEA. This process will help IKEA to archive the overall goal that is to
have one common way of working. The method will standardize the way they are working with capacities
in order to provide the ability to centrally aggregate the total accurate capacities of all IKEA suppliers
worldwide as well as provide the local Trading Areas with a decision making framework.
The key to the process is to within IKEA work with all capacities in pieces of finished goods and work on
group level with regards to products and production resources. It also provides a decision-making
framework that contains predefined symptoms of problems, providing diagnosis and prescriptions. This
framework is however not investigated in the thesis and is therefore not explained in this section.
There are three main goals for the process. The first is to contribute to better availability. This is to be
achieved through accurate capacity figures, a proactive way of solving potential capacity issues both
operationally and tactically, and the possibility to aggregate and follow up capacities on HFB and
Category level through the common measurement being pieces.
The second goal is to reduce supply chain costs. This is to be achieved by having a global overview that
will enable better utilization of suppliers through improved allocation possibilities, support in
management of risk through the decision making framework, and better planning of downstream flows
by reducing bullwhip effects from previously unforeseen capacity issues.
The third goal is the soft factors. The tools presented in the OSCP should provide a simple framework to
help Trading Areas with working with capacities proactively instead of firefighting, increasing their
motivation. It also provides a framework for working together across functions by defining
responsibilities.
The operational capacity figures should be revised three times a year and for certain events, to keep the
data updated to changes.
4.1 Key components of the One Supplier Capacity Process The One Supplier Capacity Process uses many clearly defined components in order to insure that all who
57 Björnsson, 2012

28
use the process will speak a common language. Most components relate to ideas needed to understand the
method in which capacities are to be calculated. Other components are used to evaluate the capacities and
connect them to the decision-making framework. The relationship between the first five components is
depicted in Figure 12 below
Figure 12. Key OSCP components and their relationship58
Resource Groups
The definition of a Resource Group is a group consisting of production resources that have similar
characteristics. A Resource Group provides capacity and is defined locally by TAs.
Product Groups
Product Groups are defined as a group of articles that have similar characteristics and share the same
Resource Group or Groups. Product Groups consume capacity. They should be restricted to containing
articles from one Segment and one HFB, and are globally defined by IoS for all connected suppliers.
Dedicated Supplier Capacity
The Dedicated Supplier Capacity is defined as the capacity of a Resource Group that is dedicated to
IKEA for a given time period. It is dimensioned as the total local capacity need for the connected Product
Groups and can be defined in any unit of measurement. The Business Developers are responsible for
dedicating capacity.
58 Based on Björnsson, 2012
Resource(Group(2(
Resource(Group(3(
Max(5000(kg/week(
Max(120(hours/week(
Max(220(hours/week(
Product(Group(X(
Product(Group(Y( Dedicated(Capacity(Allocated(Capacity(
Resource(Group(1(
1000( 2000( 2000(
Available(Expensive(Capacity(

29
Allocated Supplier Capacity
The Allocated Supplier Capacity is defined as the capacity that is allocated to a given Product Group
within a given Resource Group. It is dimensioned as the capacity need of a Resource Group by a Product
Group. The Supply Planners are responsible for allocating capacity.
Available Expensive Supplier Capacity
The Dedicated Supplier Capacity that is not allocated within a Resource Group is referred to as Available
Expensive Capacity, as it is unutilized.
Available Supplier Capacity
Capacity in a Resource Group that is available but not dedicated to either IKEA or other customers is
defined as Available Supplier Capacity (Figure 13).
Figure 13. Available Supplier Capacity59
Net Supplier Capacity
The sum of all the Dedicated and Available Supplier Capacities within a given time period is the Net
Supplier Capacity.
Max Supplier Capacity
The Max Supplier Capacity is defined as the theoretical capacity of a Resource Group within a given time
period. This is based on a constant production 24 hours a day 365 days a year.
Supplier Capacity Value
The Supplier Capacity Value is the capacity determined for a Product Group as the Allocated Capacity
within a bottleneck (Figure 14). The bottleneck is where a single or a number of Resource Groups limits
the performance of the entire production system. The capacity is translated into pieces for a given time
period by multiplying the Allocated Capacity for each respective Product Group in the bottleneck by the
consumption rate of that Product Group.
59 Based on Björnsson, 2012
Resource(Group(1(
Dedicated(to(others(
Available(Supplier(Capacity(
Dedicated(to(IKEA(

30
Figure 14. Depiction of Supplier Capacity Value60
Supplier Capacity Type
The Supplier Capacity Type, or bottleneck type, identifies the factor that causes the bottleneck Resource
Group for a Product Group. There are 10 predefined types, each with an identifying code, as shown
below:
• 01 Component • 02 Raw material • 03 Labor • 04 Electricity • 05 Machinery
• 06 Tool • 07 Packing • 08 Storage • 09 Maintenance • 10 Others
Supplier Capacity Value Name
The name to be entered into the Global Purchasing System (GPS) and used to maintain capacities for
each Product Group is the Supplier Capacity Value Name. It consists of the Product Group name,
bottleneck Resource Group name, and bottleneck type. Each of these items is separated by a semicolon
(;).
4.2 Method of calculating capacity A 6-step procedure explains how the process is to be implemented. It is explained through 8 example
reference cases of varying complexity.
Step 1. Define Resource Group/Groups
The first step is to define all the Resource Groups connected to a certain production system.
60 Based on Björnsson, 2012
Resource(Group(1(
Resource(Group(3(
Product(Group(X(
Product(Group(Y(Allocated)Supplier)
Capacity)that)determines))Supplier)Capacity)Value)
Resource(Group(2(
Bo7leneck)
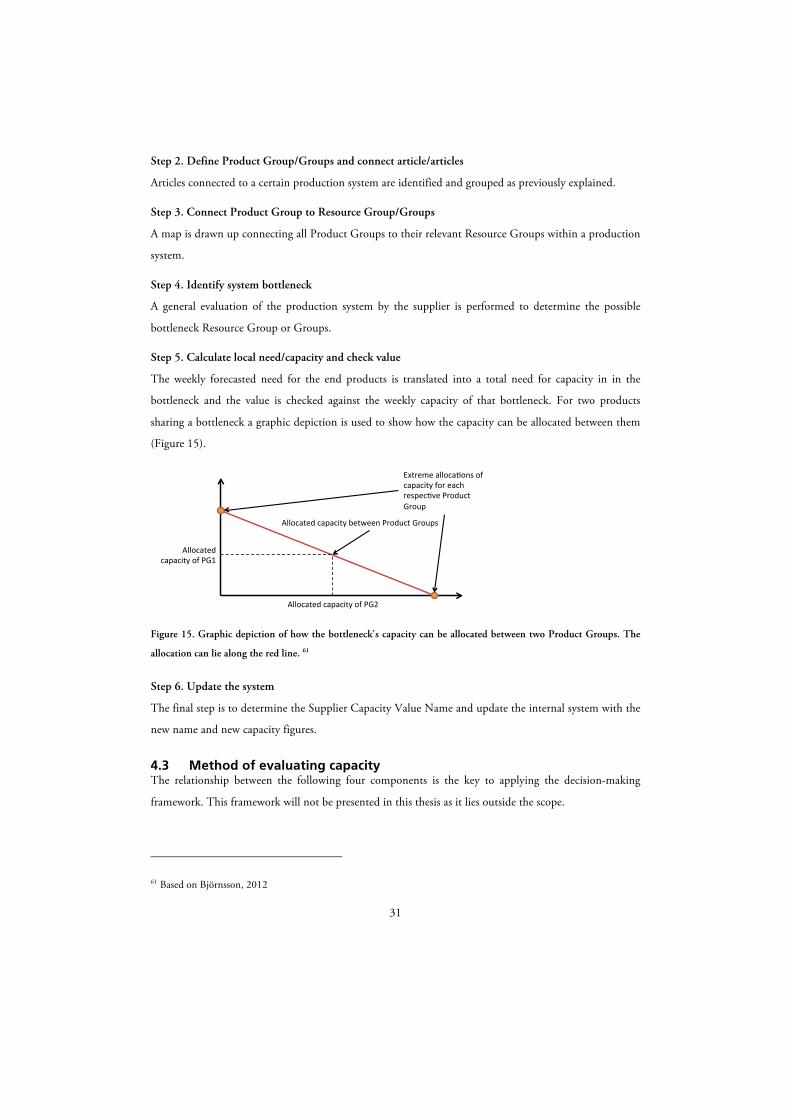
31
Step 2. Define Product Group/Groups and connect article/articles
Articles connected to a certain production system are identified and grouped as previously explained.
Step 3. Connect Product Group to Resource Group/Groups
A map is drawn up connecting all Product Groups to their relevant Resource Groups within a production
system.
Step 4. Identify system bottleneck
A general evaluation of the production system by the supplier is performed to determine the possible
bottleneck Resource Group or Groups.
Step 5. Calculate local need/capacity and check value
The weekly forecasted need for the end products is translated into a total need for capacity in in the
bottleneck and the value is checked against the weekly capacity of that bottleneck. For two products
sharing a bottleneck a graphic depiction is used to show how the capacity can be allocated between them
(Figure 15).
Figure 15. Graphic depiction of how the bottleneck's capacity can be allocated between two Product Groups. The
allocation can lie along the red line. 61
Step 6. Update the system
The final step is to determine the Supplier Capacity Value Name and update the internal system with the
new name and new capacity figures.
4.3 Method of evaluating capacity The relationship between the following four components is the key to applying the decision-making
framework. This framework will not be presented in this thesis as it lies outside the scope.
61 Based on Björnsson, 2012
Allocated)capacity)of)PG1)
Allocated)capacity)of)PG2)
Extreme)alloca6ons)of)capacity)for)each)respec6ve)Product)Group)
Allocated)capacity)between)Product)Groups)
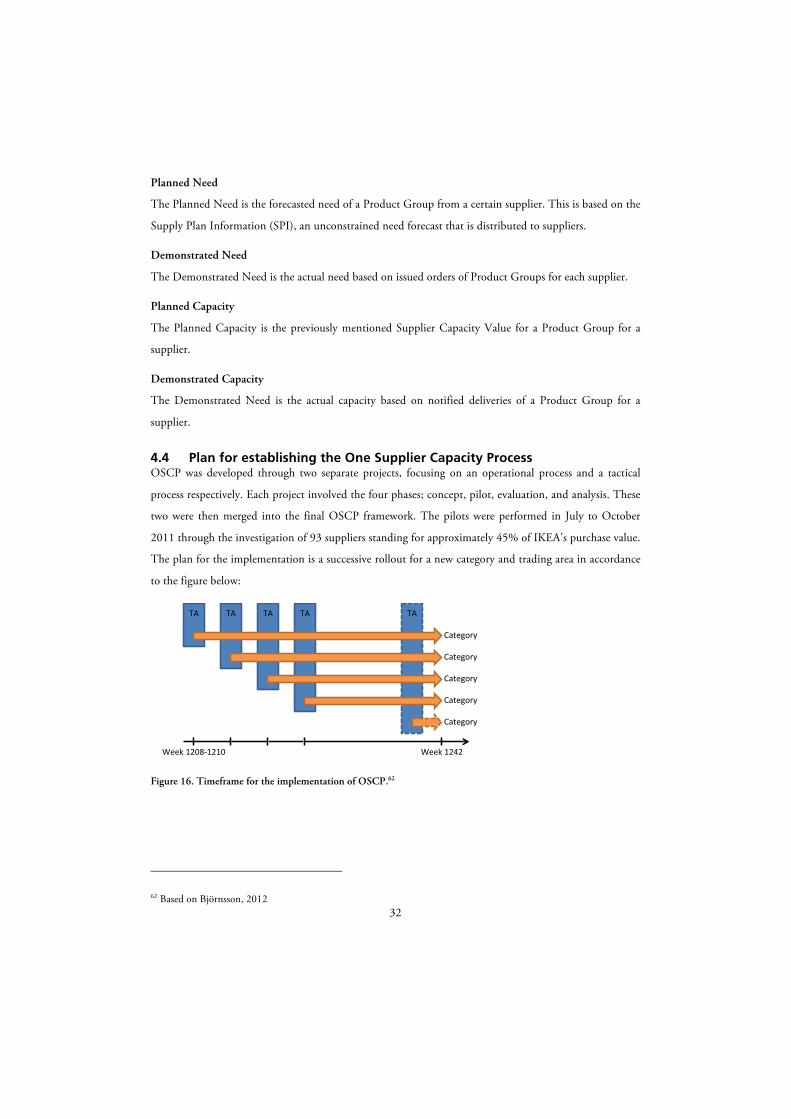
32
Planned Need
The Planned Need is the forecasted need of a Product Group from a certain supplier. This is based on the
Supply Plan Information (SPI), an unconstrained need forecast that is distributed to suppliers.
Demonstrated Need
The Demonstrated Need is the actual need based on issued orders of Product Groups for each supplier.
Planned Capacity
The Planned Capacity is the previously mentioned Supplier Capacity Value for a Product Group for a
supplier.
Demonstrated Capacity
The Demonstrated Need is the actual capacity based on notified deliveries of a Product Group for a
supplier.
4.4 Plan for establishing the One Supplier Capacity Process OSCP was developed through two separate projects, focusing on an operational process and a tactical
process respectively. Each project involved the four phases; concept, pilot, evaluation, and analysis. These
two were then merged into the final OSCP framework. The pilots were performed in July to October
2011 through the investigation of 93 suppliers standing for approximately 45% of IKEA’s purchase value.
The plan for the implementation is a successive rollout for a new category and trading area in accordance
to the figure below:
Figure 16. Timeframe for the implementation of OSCP.62
62 Based on Björnsson, 2012
TA# TA# TA# TA# TA#
Week#1208+1210## Week#1242#
Category#
Category#
Category#
Category#
Category#

33
5 IKEA Trading’s Current Way of Working
This chapter presents the plastic category within IKEA’s Trading Area Greater China and their way of working
with capacities, based on interviews and observations of employees.
The plastic category is one of the bigger ones within IKEA with totally 1591 articles crossing 15 HFB.
The category is characterized by long lead-times and huge investments when new machines and tools are
needed to increase the output.
5.1 Capacity Groups The products today are grouped mainly according to tools, because that is what is normally viewed as the
bottleneck. The decision about how to group lies with the responsible SP together with the supplier, and
the naming of the group is the SPs responsibility. The product groups and names are uniform within
China, but the Chinese TA is not sure about how other countries groups are.
5.2 Capacities in GPS Currently IKEA maintains its capacity figures in the GPS software, which allows only the maintenance of
one figure. The capacities entered to GPS are always registered in pieces and are 100% of the capacity.
The numbers are determined by suppliers and inserted to the system by the SP. The capacities are
updated 2-3 times a year for most products, but for certain products the capacities is updated 4-5 times
per year and some monthly. The TA perceives the current accuracy of the capacity numbers to be good.
The capacities inserted to the GPS are operational, and they try to maintain tactical figures, but this is
only done for the critical products.
5.3 Working With Capacities
5.3.1 Operationally The TA’s key operational task with regards to capacities is to continuously check the capacities compared
to what they order are and will not take any actions if the orders are below the registered capacity. If the
orders are higher for a short time period the SP will ask the supplier to start frontloading to prepare for
the upcoming orders. When having very high orders or high orders for a longer time where there is not
enough storage space to frontload to meet the upcoming orders the SP will lock the orders in the system
to a level that could be delivered. The remaining part of the orders will be sent to other suppliers
producing that product if there are any by the need planner. This suppliers need to be in a reasonably
close area to be able to get the orders, because of customer location and transportation costs. If orders are
higher than the capacity at the supplier and they have not frontloaded enough a cancelation of the order

34
will be made, which means that the supplier will just deliver the amount that it has on hand. This will
create high fluctuations in the SPI that makes it either harder to foresee upcoming order quantities.
If the supplier delivers more than the capacities figures shows in GPS, trading will investigate the reasons
why. The explanations could be more working hours, changed cycle times, overtime, or safety stocks.
5.3.2 Tactically If orders will not decrease during a longer time period the SP, BD, and supplier will start discussing about
investment in new tools or/and machines. The tool investments are always funded by IKEA and in some
rare cases they will help to invest in machines for the suppliers. When IKEA invests in machines at
suppliers they usually have a long-term contract and the supplier will then pay off that in a defined
timeframe. The times from the proposal of new tools or machines to when they are ready for use takes on
average about six months. Normally decisions to invest in new tools are taken when orders cannot be met
during a longer time period. The main reason that the decision is taken this late is because of the lack of
confidence in the SPI. They do not rely on its actual figures and will not take decisions to invest in new
tools or/and machines even if they can see that the future SPI will be above the capacities, because of its
huge investments and risks. When ordering new tools or machines the supplier will deliver max capacities
until the machines are in place and the bottleneck is changed or improved. Because of high fluctuations
in the SPI, SP will also not take any kind of action before it is less than 2 months before actual order.
In some cases decisions of new tools or machines could be decided by discovering strong increases in the
SPI. SP and BD will then discuss and send a proposal concerning the investment with IoS that will need
to verify that the increase in the SPI is reliable.

35
6 One Supplier Capacity Process Implementation
This chapter presents an initial insight into the suppliers’ productions. It describes the plastic production
generally using terms from the OSCP process, and depicts four situations that need solving in order to effectively
implement the process to calculate the capacities. The Product Groups predefined by IoS are also discussed.
6.1 General Description of the Investigated Plastic Productions The products investigated in this thesis are categorized by IKEA in three types; one-shot products,
products requiring assembly, and technical products. All productions are centered on one or more
injection machines. Raw material is fed into the machine, and one or more pieces are produced there
using a tool specific for that piece. Injection machines are rated in tonnage expressing the exerted
clamping force in the machine. Each tool has a minimum clamping force meaning that it can be used in
machines of a certain size or larger, but the use of the minimum size machine is preferred from a cost
perspective.
For one-shot items the piece or pieces are packed either alone or with other pieces (Figure 17). For
products requiring assembly the pieces are assembled together and then packed. Common variations to
this include the addition of components, and the use of another form of machine (Figure 18). Technical
products are produced similarly to assembly products or one-shot products but require advanced
machines such as over-mold machines and bristling machines for brushes.
Figure 17. One-shot production
Figure 18. Assembly production.
Injec&on(Machine(s)((
Raw(Material(
Packing(
Injec&on(Machine(s)((
Assembly(
Raw(Material(
Packing(
Other(Machine( Component(Injec&on(Machine(s)((
Raw(Material(

36
The assembly and packing comprises of manual labor on the most part in the productions investigated. In
some exceptions support machines are used. Because of the high availability of cheap labor in China the
suppliers generally dimension the capacities so that these resources are not bottlenecks. The event in
which there may be an exception to this is in the immediate period surrounding Chinese New Year.
During this weeklong holiday many Chinese travel to their hometowns to meet their families, and
because of the expansion of industry throughout China some find jobs closer to home and therefore do
not return63. Time is therefore needed to fill these vacancies.
The raw materials are ordered by the suppliers based on the SPI provided to them by IKEA. The major
raw material suppliers require a two month need forecast, and weekly the actual amount needed is
ordered and delivered with a one week lead time. The actual orders can contractually only deviate 20%
from this need forecast.
For these reasons the suppliers within the plastic category tend to have a clearly identified bottleneck
being the injection machines and the tools used in them. The reasoning for this is that these machines
and tools tend to be the most expensive investments. As a result suppliers generally determine capacities
by looking at tooling capacity without regard for the allocation of machine hours to these tools. In their
production plan they do however perform an allocation of tools to machines. The capacities are therefore
most often determined by the cycle time for a tool in a machine multiplied by a certain amount of weekly
production hours.
6.2 Production Situations There are four general situations that the various Product Groups belong to depending on the complexity
of the production and the way in which the production resources are shared.
6.2.1 Situation 1 – One Product Group per production line This is the simplest situation where an entire production line is dedicated to a single Product Group. An
example is the Product Group Lekman which is produced in a dedicated line at the supplier B. It consists
of two different raw material Resource Groups and two different injection machines Resource Groups
followed by a packing Resource Group. The bottleneck is the group of injection machines producing the
front and back panel. This is shown in the Figure 19.
63 Supplier 19720

37
Figure 19. Situation 1 reference example (Lekman produced at B).
6.2.2 Situation 2 – One Resource Group is a shared bottleneck for several Product Groups
This is again a simple situation. It is where several Product Groups share one or more entire Resource
Groups, and where one Resource Group shared by all in this system is the bottleneck. It is the bottleneck
when capacity is calculated given the need from the SPI and remains the bottleneck when the maximum
capacity is calculated with regards to this need.
An example is the production of the Product Groups Rufsig Kitchen Utensils S2 and Rufsig Wok
Utensils S2 at the supplier B. They share raw materials, one injection machine, and assembly line (Figure
20). This injection machine is viewed as the bottleneck.
Figure 20. Situation 2 reference example (Rufsig Kitchen Utensils S2 and Rufsig Wok Utensils S2).
Raw$Material$(PP)$
Injec2on$Machines$(front$and$back$panel)$$
Packing$(Lekman)$
LEKMAN$
Raw$Material$(AS)$
Injec2on$Machines$(boCom$panel)$$
RUFSIG'WOK'UTENSILS'S2'
Injec4on'Machine'(#18)'
Injec4on'Machine'(#40)'
RUFSIG'KITCHEN'UTENSILS'S2'
Raw'Material'(PA)'
Assembly'

38
6.2.3 Situation 3 – Multiple Resource Group bottlenecks in a production In this situation there is more than one bottleneck Resource Group within a system. Due to the
complexity of the sharing of Resource Groups the identification of the bottleneck is sometimes difficult.
An example of this situation is depicted in the B reference case in Appendix B.
6.2.4 Situation 4 – Partial sharing of Resource Groups Sometimes there are cases when one or more, but not all, specific resources in a parallel Resource Group
for one Product Group is being shared with another Product Group. An example is the production of the
Tolsby Frame at B. It uses four machines to make one component of the end product, and only one of
these machines is shared with the Fantastisk Napkin Holder, as depicted in the figure below.
Figure 21. Reference example depicting the complication in Situation 4 (Tolsby Frame and Fantastisk
Napkin Holder produced at B).
6.3 OSCP Product Groups The job of defining and naming the Product Groups within a category lies with its category leader from
IoS. In the plastic category the Product Groups are defined by the tools they use, because each is custom
made for a specific part. All articles within a Product Group consist of identical parts with the exception
of the color of these parts. This is because it is assumed that the difference in production between
different colors is so miniscule that it can be disregarded. The addition of a small amount of the material
masterbatch is usually responsible for determining the color, and suppliers don’t experience shortages in
the availability of this material. The changing of colors in an injection does however require cleaning of
the machine reducing the amount of machine hours available for production. For some products such as
the Raffig hook produced at H one color is a result of a coating process (see reference case H).
In most instances articles of varying colors are sold separately, but sometimes articles are sold in sets of
individual pieces of different colors. An example of this is the Smaska Bowl that is sold in a set of three
FANTASTISK(NAPKIN(HOLDER(
Raw(Material((PPR)(
TOLSBY(FRAME(
Raw(Material((ABS)(
Injec?on(Machines((base)(
IM((frame)(1(
IM((frame)(2(
IM((frame)(3(
IM((frame)(4(
Component((screen)(
Packing((Tolsby)( Packing((Fantas?sk)(

39
different colors. It is produced at G (see Appendix G) and their practice is to produce the three colors
parallel in three different machines and assemble immediately.
Another difference between some articles within a Product Group is the labels that are put on them. This
is dependent upon the region in which the articles are sold. The only other difference experienced by the
authors is that on one version of the Antilop Highchair the safety belt is factory assembled and on the
other it is not, again depending on the region in which it is sold.

40

41
7 The Development of the Template
In order to apply the OSCP process to plastic production an initial analysis is made of the its implementation
method as well as the suppliers productions. The experienced lack of tools and clear procedure is the basis for the
development of the template used as the key tool to apply the process to the suppliers visited in a structured
manner.
7.1 Initial Analysis of the One Supplier Capacity Process Method of Implementation
There is a difficulty in defining the initial state in the implementation of a process such as this, as the
process is standardized and to be implemented on several different suppliers with vastly different products
and productions. An investigation into plastic production with regards to determining capacities was not
performed prior to the rollout of the process. As a result the immediate realization upon visiting the
suppliers was that OSCP provides no concrete plan of how to determine the suppliers’ capacities. The
method steps presented through the use of reference cases (section 4.2) are quite unclear and the cases
themselves are all relatively very simple compared to many of the production systems investigated,
addressing only the first two situations discussed in section 6.2. There is no structured way of identifying
the bottleneck described, and there is also no guidance for determining consumption rates for different
forms of Resource Groups, which was especially difficult when several production resources perform the
same part for a product but in a different manner.
The purpose of the first supplier visits together with the project team from IoS was to gain an
understanding of the plastic production in China through the investigation of the two biggest suppliers
with different levels of production complexities and dedications to IKEA. However, the productions
witnessed during these visits only presented the same simple situations as the OSCP reference cases, and
provided little insight into the current working methods with regards to capacity determination. The
initial interpretation that the complexity would not exceed that of these situations led to a lack of
preparedness for the more difficult ones.
The second visit to B and A essentially followed the four step procedure for process implementation
discussed in section 3.4. The initial state had been investigated, although insufficiently, and a very basic
initial template was developed as a plan for the implementation of the process on all Product Groups.
This was in order to minimize the burden for suppliers and IKEA employees to implement the process,
which might minimize their incentive to use it.
The implementation during this second visit provided a clearer understanding of the complexities of
plastic production with regards to the implementation of OSCP, and from the evaluation of this the first

42
version of the complete template in its final form was developed. The implementation at B and A can
essentially be seen as a pilot for the implementation of OSCP specifically for the plastic Category. This
template was successively updated following each new complication investigated at the suppliers. It
follows steps that are thoroughly explained in the template instructions (see Appendix K and Appendix L)
and only summarized in this section.
7.2 The Template Developed for the Implementation The introduction of the template to the suppliers was performed in specific way. The complete template
with the data collection and data analysis sections were sent to them prior to the supplier visits, but they
were only required to complete the former. The latter was sent in order to give the supplier time to
familiarize themselves with it, and it was thoroughly presented during the visits.
7.2.1 Data Collection The first step is to investigate the production resources linked to a certain Product Group, and they are
listed and relevant information is collected. For raw materials and components the amount per end
product is entered. For machine and manual labor includes the amount of machines or laborers, cycle
times, the contribution to end pieces of a cycle, the dedicated weekly capacity, and a downtime rate. The
latter two are used to determine the dedicated supplier capacity of a production resource. The allocation
of tools to machines is based on the suppliers production plan.
7.2.1.1 Dedicated Supplier Capacity As the supplier visits revealed a lack of suppliers understanding of what net capacity is, a standardized
method of determining the net capacity of each machine dedicated to IKEA was developed. Most
suppliers have a common figure for the daily production time for all their machines taking into account
power cuts and planned maintenance, essentially providing figures for the nominal capacity. In order to
arrive at the gross capacity other downtime such as tool and color changes and breakdowns needs
consideration. Although tool and color changes are planned events they occur irregularly and affect only
certain machines in different ways. It is therefore advisable not to include this in the weekly capacity
figure but rather in a downtime rate together with other unplanned events (Figure 22). In this way most
Resource Groups will have a common weekly capacity and only the downtime rate will need regular
updating.
As for determining the gross capacity of labor resources this was not thoroughly investigated in this thesis.
This is because there is a general lack of consideration taken for labor by the suppliers as they never
experience this as a bottleneck and therefore there is a lack of information pertaining to capacity loss. The
nominal capacity takes into account only the length of the shifts and downtime rate is essentially the time

43
spent on breaks. To arrive at the net capacity a defect rate is used to take all manner of rework and
capacity losses due to defect products or parts into account (Figure 22).
Figure 22. Factors affecting capacity and how they are considered in the template.
7.2.2 Data Analysis
7.2.2.1 Resource Groups The next step is to determine how to group resources and calculate consumption rates for the groups. If
one or more resources are used for a specific job and are identical in terms of cycle time and amount of
pieces produced per cycle they are immediately grouped as a conceptual unique resource (UR). These
unique resources are grouped together into Resource Groups in four ways each with a different method of
calculating the group’s consumption rate:
• Type 1 - Single UR This is where a UR is ungrouped. The consumption rate is that of the UR.
• Type 2 - Consecutive UR This is where several UR performing different jobs are grouped. The consumption rate for the
group is that of the bottleneck UR in this group.
• Type 3 - Parallel UR This is a group of UR performing the same job but in different ways. The consumption rate for
the group is calculated as a weighted average (based on nominal capacity in pieces) of the
individual rates of the URs in the group.
• Type 4 - A combination of Consecutive and Parallel UR When consecutive and parallel groups are combined the consumption rate is calculated for the
lowest level group first and then continuously for the aggregated groups.
The template provides tools for translating the cycle times into consumption rates for each of the first
three groupings.
!"Defect"products Defect&rateNet&capacity
Maximum&capacity Weekly
(Nominal)&capacity&
Regular&planned&downtime
Gross&capacity
!"Breakdowns!"Color"changes!"Tool"changes!"Unplanned"maintenance
!"Labor"breaks
Irregular&or&unplanned&downtime(Downtime&rate)
!"Unplanned"powercuts!"Planned"powercuts!"Planned"maintenance!"Length"of"shifts

44
A decision was made by the TA and Category leader at IoS to use the following six generic types of
Resource Group names as they cover most of the activities within plastic production:
• Raw material (RM) • Injection machine (IM) • Support machine (SM) • Component (Comp) • Assembly • Packing
In order to differentiate between the different specific Resource Groups it was also decided to include a
specifying name to the generic name, especially in instances where there was more than one of a certain
type of Resource Group in a production system. This is for example the raw material type or injection
machine number or part it makes.
In order to address the complications presented in Situation 4 (section 6.2.4) a solution was found. It is
assumed that the Product Group using less the total amount of resources in a Resource Group can in fact
use all the resources. A new Resource Group is added that constrains that Product Group. In the case of
plastic production this second Resource Group is usually the tool. If the template tries to allocate more
hours than one machine can provide the tool capacity will constrain it. The Tolsby and Fantastisk
example is shown in Figure 23. It is assumed that the Fantastisk Napkin Holder can utilize the entire
Injection Machine (frame) Resource Group but is then constrained by the Tool (Fantastisk) Resource
Group. The consumption rate for the Fantastisk Napkin Holder is the same for these two Resource
Groups, and the downtime rates should be the same. The difference is that the weekly capacity for the
tool accounts for only one machine whereas the capacity for the injection machine group accounts for all
four machines.
Figure 23. The solution for the Situation 4 example.
FANTASTISK(NAPKIN(HOLDER(
Raw(Material((PPR)(
TOLSBY(FRAME(
Raw(Material((ABS)(
Injec?on(Machines((base)(
Component((screen)(
Packing((Tolsby)( Packing((Fantas?sk)(
Injec?on(Machines((frame)(
Tool((Fantas?sk)(

45
This solution should also be able to be used for cases not related to plastic production, but when the
complication arises for other reasons.
7.2.2.2 Allocated Capacity The material argues that the allocated capacity should cover average need of a Resource Group for each
Product Group that uses it. As the capacity should reflect how much can be produced in a given time
period the authors’ deduction from this is that the total capacity in a Resource Group that is dedicated to
IKEA should be allocated. This allocation is based on the average need and means that the capacities
determined are never constant when allocation of the bottleneck is performed. Other weightings could be
taken into regard such as service level and fluctuations, which might be especially important if the need
exceeds the capacity.
In order to standardize the method of allocating capacity for Product Groups sharing critical Resource
Groups based on need, the basis for this allocation is decided as the average forecasted need for 17 weeks
starting outside the lead time plus one week in the future. This is a decision made by the category leader.
The template then follows the principles of rough-cut capacity planning using the Bill of Labor and Bill
of Materials. This is done by calculating a need for capacity of a Resource Group by all Product Groups
connected to it given the value for the forecasted need of each respective Product Group, taking into
account the added need for the defective products. From this the utilization is determined for each
Resource Group based on the previously determined dedicated net capacity. Here the ideas behind TOC
come to use. The bottleneck Resource Groups are identified and theoretically exploited to their full
potential in order to determine the maximum net capacity for the Product Groups. Dividing the need by
the bottleneck utilization given the need does this.
In some cases, as discussed in Situation 3 (section 6.2.3) this does not result in a capacity that insures a
100% utilization of each Product Groups bottleneck, resulting in a capacity that is not the maximum
allocated net capacity. An iterative procedure was developed to maximize all bottlenecks while
maintaining the allocation based on the forecasted need. This is by increasing all capacity values for
Product Groups with maximum utilization less than 100% by a common factor until each one
successively reaches 100%.

46

47
8 The Specific Implementations on the Plastic Suppliers
This second empirical study looks at the specific suppliers visited and explains their productions along with a
short summary of key points regarding the specific implementations of the OSCP process. The resulting
capacities calculated through the use of the template are presented alongside the previously determined
capacities.
8.1 Supplier A A is one of IKEAs biggest suppliers within the plastic category in China in that they have totally 27
Product Groups in their production. Their production is 100% dedicated to IKEA, which means that
IKEA have big power directing the supplier. They have both one-shot products but also a lot of more
complicated production setups. Currently the demand is lower than normally and there are only two
cases of sharing’s. Through discussions and interviews with the responsible team for A they experience
that higher demand will increase the complexity through more sharing’s of production resources. The
capacity today is calculated by determining the bottleneck machine for each product in each production
line and then calculating the weekly maximum throughput of that product in that bottleneck. The hours
per week used for the calculations is 24 hours per day 6 days a week, removing one workday in
consideration for capacity losses due to factors such as power cuts and tool and color changes. The
capacities calculated is the operational, what can be produced today. Tactical capacities are also managed
by working out yearly business development plan or new investment plan. If there are orders higher than
the capacity figures A will prepare inventory in advance, re-assign shared resources and secure a seven days
production with generator to secure against power cuts.
Implementation
The biggest issues when implementing the new process was for one of the more complex setups with one
Resource Group with two machines where both are used for one Product Group and only one of these is
also used for another Product Group. Below in Table 1 the old and new Product Group names,
capacities, and bottleneck utilizations given the forecasted need before and after the implementation are
shown. The amount of bottlenecks and whether they are shared is also shown along with the bottleneck
type and a specifying code for those that are shared. The downtime rate was calculated by adding actual
historical data of the machine breakdown, tool breakdown, repair time, testing, and much more. The
capacity hours per week (144 hours) used in the calculations of the capacities are defined as 24 hours per
day 6 days a week.

48
Table 1. Results of the implementation for the supplier A.
8.2 Supplier B B is one of IKEA’s key suppliers within the Plastics category in China with regards to its 21 products in
production. IKEA stands for 55% of B’s production turnover with the rest producing for other customers
or the enterprise group of which it is a part. The types of products are both complicated products that
require support machines, assembly, or more advanced packaging, as well as simple one-shot products.
The layout of the factory is such that production lines are used for the more complicated products
requiring support machines and one-shot items are produced in machines of the correct size where there
is experienced available capacity. This means that the latter items are sometimes produced in machines
belonging to the production lines of the former items.
B’s production strategy is to ensure that the injection machines are the bottlenecks. In their planning they
group their injection machines based on size only and allocate tools to machines. The capacities provided
to IKEA are the maximum tooling capacities regardless of machine hour allocations to these tools and
machine dedications to IKEA. The weekly machine hours that are used to calculate capacities are 138
hours, taking into account only scheduled maintenance and power cuts. B collects information about
defect rates but not about down times of the machines pertaining to breakdowns and tool changes.
Implementation
The implementation of the OSCP process resulted in B demonstrating the ability to use the template
independently by creating the Resource Groups and connecting the Product Groups, as well as inserting
the other relevant data such as downtimes and weekly forecasted need. They presented figures for the
weekly capacity of their machine Resource Groups dedicated to IKEA, with the basis for the dedication
being the demand from the SPI, allowing for a very slight arbitrary buffer. This is what B can promise to
dedicate to IKEA. Because of the lack of statistical data pertaining to unplanned downtimes of their
Old$group$name$in$GPS(pieces) (%) Amount Shared Type$and$specifier Before After
Forecasted$need$
(pieces)
UtilizationNo$of$PG$sharing$resouces
New$capacity$(pieces)
New$Product$Group$nameOld$GPS$capacity$
(pieces)
Capacity$difference$
Bottleneck
AntoniusBagis+big+blackbagis+childrenBoholmen+colandarBoholmen+wash6bowlBolmen+toil+brush+hldrBolmen+toilet+seatBolmen+waste+binBygelChosigtDiskaFlackig+colanderFlackig+jugFlackig+mixing+bowlFlundraKalas+cutleryKalas+mugKalas+bowlKalas+platePlastisPrutaRationell+Variera+trayReda+roundTokigBolmen+toil+roll+hldrBolmen+bthr+s3
A
25996 ANTONIUS_BASK_INSERT 26988 992 4% 1 no im 1 12690 49% 47%39204 BAGIS_4P 39682 478 1% 1 no im 1 23815 61% 60%18005 BAGIS_8P 40982 22977 128% 1 no im 1 12674 70% 31%31363 BOHOLMEN_COLANDER 31858 495 2% 1 no im 1 10475 33% 33%4704 BOHOLMEN_WASH_UP_BOWL 12266 7562 161% 1 no im 1 2635 56% 21%78821 BOLMEN_TOIL_BRUSH_HOL 98658 19837 25% 1 no sm 1 60200 76% 61%6428 BOLMEN_TOIL_SEAT 14757 8329 130% 1 no im 1 2795 43% 19%15618 BOLMEN_WASTE_BIN_WITH_LID 15084 6534 63% 1 no im 1 7235 46% 48%120000 BYGEL_CONTAINER 134615 14615 12% 1 no im 1 116432 97% 86%19701 CHOSIGT_FUNNEL 20185 484 2% 1 no im 1 13849 70% 69%33943 DISKA_DISH_WASHING_BRUSH 31500 62443 67% 1 no sm 1 20170 59% 64%30396 FLÄCKIG_COLANDER 34150 3754 12% 1 no im 1 22036 72% 65%14702 FLÄCKIG_JUG_1L 13999 6703 65% 1 no im 1 12488 85% 89%10760 FLÄCKIG_MIX_BOWL 17459 6699 62% 1 no im 1 5475 51% 31%20328 FLUNDRA_DISH_DRAINER 18440 61888 69% 1 no im 1 15780 78% 86%81507 KALAS_CUTLERY 66316 615191 619% 1 no im 1 45480 56% 69%109004 KALAS_MUG 131984 22980 21% 1 no im 84812 78% 64%99442 KALAS_BOWL 80412 619030 619% 1 no im 54025 54% 67%67478 KALAS_PLATE 73911 6433 10% 1 no im 41202 61% 56%58000 PLASTIS_DISH_WASHING_BRUSH 49887 68113 614% 1 no im 1 50264 87% 101%100800 PRUTA_FOOD_SAVER_S17 67123 633677 633% 1 no im 1 55000 55% 82%59692 RATIONELL_V_CUT_TRAY_31X26 57238 62454 64% 1 no im 1 34019 57% 59%22402 REDA_FOOD_SAVER_S5 9259 613143 659% 1 no im 1 3134 14% 34%41196 TOKIG_SALAD_SPINNER 34019 67177 617% 2 yes im(tn)/im(s) 15968 39% 47%6055 BOLMEN_TOIL_ROLL_HOLDER 13987 7932 131% 1 yes im(s) 1312 22% 9%7841 BOLMEN_S3 3999 63842 649% 1 yes im(tn) 2520 32% 63%
3
3

49
machines they provided a standard figure of 4%. The following table summarizes the results of the
implementation:
Table 2. Results of the implementation for the supplier B.
B expressed their view that that the process could help them in their production planning. One example
they explained was the yearly resource planning and IKEA dedication that is currently performed based
on experience and conjecture could greatly be improved through OSCP and the supporting template.
8.3 Supplier C C is a rather small supplier for IKEA as at the time of the supplier visit they have only three Product
Groups in their production that all share the assembly, packaging and the baking machine. The supplier
has a shared production with other customers, but there is just a small amount of sharing in the specific
machines that IKEA used. Mainly it is the baking machines that were shared for all Product Groups
between IKEA and other customers to C. The products produced for IKEA are all in silicone with a
production setup that is slightly different compared to the other suppliers. The production basically
follows these steps; coloring the silicone, oil pressure (the product gets its shape), trimming, baking, and
packing.
Implementation
The capacity per week is determined by 10 hours per day and six days per week, they also consider power
cuts. The Product Groups and capacities before and after the implementation is shown below in Table 3.
Old$group$name$in$GPS(pieces) (%) Amount Shared Type$and$specifier Before After
Forecasted$need$
(pieces)
UtilizationNo$of$PG$sharing$resouces
New$capacity$(pieces)
New$Product$Group$nameOld$GPS$capacity$
(pieces)
Capacity$difference$
Bottleneck
erlandImpulsKrus-2.4Lsamla-55Lsamla-130LTobiasAntilop-chairBrada-laptop-supportFnissAntilop-traySnilleTolsby-FrameFantastiskKvillKvill-ovalUPPLEVA-cblsamla-45Lsamla-65Lsamla-85Lsamla-45/65L-lidsamla-55/130L-lidBolmen-corner-shelfrufsig-kitchen-ut-s2rufsig-wok-s2Bagis-big-whiteBolmen-stoolBursjönLekman
B
1082 ERLAND_CHAIR 536 V546 V50% 1 no im 144 13% 27%21977 IMPULS_JUG_W_LID_2L 13547 V8430 V38% 1 no im 10697 49% 79%21560 KRUS_JAR_W_LID_2,4L 8964 V12596 V58% 1 no im 840 4% 9%9590 SAMLA_55L 4298 V5292 V55% 1 no im 3617 38% 84%5222 SAMLA_130L 2387 V2835 V54% 1 no im 2009 38% 84%1248 TOBIAS_CHAIR 929 V319 V26% 1 no im 472 38% 51%8791 ANTILOP_HIGHCHAIR 7755 V1036 V12% 1 no- im 5901 67% 76%65930 BRÄDA 46860 V19070 V29% 1 yes im(5,7,8,62) 46997 71% 100%53958 FNISS_WASTEPAPER_BASKET 37056 V16902 V31% 1 yes im(5,7,8,62) 35500 66% 96%9590 ANTILOP_TRAY 7056 V2534 V26% 1 yes im(snille-chr) 6042 63% 86%19903 SNILLE_SEAT_SHELL 10920 V8983 V45% 1 yes im(snille-chr) 8291 42% 76%176452 TOLSBY_FRAME 154780 V21672 V12% 1 no im 143000 81% 92%21977 FANTASTISK_NAPKIN_HOLDER 17808 V4169 V19% 1 no tool 7736 35% 43%19600 KVILL_FRAME_13X18 10612 V8988 V46% 1 yes im(20) 10453 53% 99%19600 KVILL_FRAME_13X18_OVAL 6481 V13119 V67% 1 yes im(20) 6738 34% 104%12172 UPPLEVA 7868 V4304 V35% 2 no im/im 7750 64% 99%21609 SAMLA_45L 12920 V8689 V40% 1 no im 10355 48% 80%8114 SAMLA_65L 3960 V4154 V51% 1 yes im(1) 3902 48% 99%6593 SAMLA_BIN_WITH_LID_85L 342 V6251 V95% 2 yes im(1)/im(16) 338 5% 99%39069 SAMLA_LID_FOR_BOX_45/65L 22356 V16713 V43% 1 yes im(3,61) 13839 35% 62%12558 SAMLA_LID_FOR_BOX_55/130L 5358 V7200 V57% 1 yes im(16) 5221 42% 97%7889 BOLMEN_SHELF 6192 V1697 V22% 2 yes im(3,61)/im 5521 70% 89%27720 RUFSIG_KITCHEN_UTENSILS_S2 10080 V17640 V64% 1 yes im(18) 6435 23% 64%26372 RUFSIG_WOK_UTENSILS_S2 22800 V3572 V14% 1 yes im(18) 14768 56% 65%84699 BAGIS_4P 82320 V2379 V3% 1 no im 1 44988 53% 55%15070 BOLMEN_STOOL 16000 930 6% 1 no im 1 16142 107% 101%8453 BURSJÖN_STOOL 4284 V4169 V49% 1 no im 1 3103 37% 72%33901 LEKMAN_BOX 25120 V8781 V26% 1 no im 1 21336 63% 85%
2
6
3
2
2
2
7

50
Table 3. Results of the implementation for the supplier C.
8.4 Supplier D D supplies only three Product Groups to IKEA. Although the supplier supplies other customers than
IKEA, these products are all produced on injection machines completely dedicated to IKEA, and none of
these are shared between the Product Groups. The weekly capacity is 126 hours taking into account
planned maintenance and power cuts, as well as tool and color changes.
Implementation
D set both the defect and downtime rates at 1%. This is because they claim that their machines are brand
new meaning that they very seldom break down or produce defect products. The results of the
implementation at D are shown in the table below:
Table 4. Results of the implementation for the supplier D.
8.5 Supplier E E had at the supplier visit 8 Product Groups within their production. They had other customer besides
IKEA but did not share the machine between these customers, which made the production pretty simple.
They have both one shot products but also more complicated products with assembly. The current
calculations of the capacity are done by determining the bottleneck and give the figures according to that
throughput.
Implementation
The implementation of the new Products Groups and template made some small changes in the old
structure. The Product Groups and capacities before and after the implementation are shown below in
Table 5. The Product Groups for 365+ was before categorized by the lid and size of the lid as shown in
the table. This was because they assumed that these were the bottlenecks. In the new calculations all parts
are considered and a better picture of reality is shown.
Old$group$name$in$GPS(pieces) (%) Amount Shared Type$and$specifier Before After
Forecasted$need$
(pieces)
UtilizationNo$of$PG$sharing$resouces
New$capacity$(pieces)
New$Product$Group$nameOld$GPS$capacity$
(pieces)
Capacity$difference$
Bottleneck
STINN%oven%mittSOCKERKAKA%HEARTSOCKERKAKA%MAT%AND%KNIFE
C10047 STINN_OVEN_GLOVE 9675 B372 B4% 1 no sm 1 18789 187% 194%4800 SOCKERKAKA_BAK_MOULD_1,5L 4988 188 4% 1 no sm 1 6150 128% 123%9600 SOCKERKAKA_BAK_MAT_KNIFE 8869 B731 B8% 1 no sm 1 5294 55% 60%
Old$group$name$in$GPS(pieces) (%) Amount Shared Type$and$specifier Before After
Forecasted$need$
(pieces)
UtilizationNo$of$PG$sharing$resouces
New$capacity$(pieces)
New$Product$Group$nameOld$GPS$capacity$
(pieces)
Capacity$difference$
Bottleneck
!!!
D! FIXA_DRILL 40420 ! ! 1 no im(18) 1 9700 ! 24%! EKBY_STÖDIS 167967 ! ! 1 no im(21,42) 1 77000 ! 46%! SAXNÄS_FRAME 11116 ! ! 1 no im(44) 1 1900 ! 17%

51
Table 5. Results of the implementation for the supplier E.
8.6 Supplier F F produces only one-shot items. Despite supplying to other customers other than IKEA it has machines
completely dedicated to IKEA. At the time of the supplier visit each machine was dedicated to only one
tool, but this was due to change in the immediate future following the arrival of new tools with the
initiation of new product productions. Including these new products the total amount of Product Groups
is 10. It is important to note that F does have excess machine capacity apart from the machines dedicated
to IKEA that can be used if needed.
The production setup consists of all machines grouped by size placed next to a conveyor onto which the
molded parts are fed. This conveyor transfers the parts to a labor station where they are manually placed
on pallets. As one side of the conveyor is unobstructed it is possible to add similar labor stations here as to
not congest the main station in the event of a high production level. Because of the simple nature of
packing requiring no assembly F conjectures that factoring in labor in their capacity determination is
insignificant as the availability of labor is high.
The capacities are currently calculated as the tooling capacity based on a 138 hour week. This takes
planned downtime into account but not capacity losses due to breakdowns and defect rates.
Implementation
Due to the foreseeable introduction of new tools to be used in machines currently dedicated to other
machines, the template was implemented to consider this. Despite the lack of ability to provide weekly
raw material capacities the sharing of these Resource Groups incurred the linking of all but one Product
Groups into one production system. Due to the lack of information regarding downtime within the 138
hour week and defect products rates of 2.5% and 2% respectively were set by supplier. The figures
provided on cycle times of the packing Resource Groups is based on the approximate time it takes to
finalize a pallet for shipment.
Old$group$name$in$GPS(pieces) (%) Amount Shared Type$and$specifier Before After
Forecasted$need$
(pieces)
UtilizationNo$of$PG$sharing$resouces
New$capacity$(pieces)
New$Product$Group$nameOld$GPS$capacity$
(pieces)
Capacity$difference$
Bottleneck
!OMSORG!LargeOMSORG!SmallBrada0laptop0supportChostigt0Ice0Lolly0Ice0MakerTRONES0shoe0cabinetNordby0Bed0Tray058x36
3650250x17
365017x17
E
IKEA_365+_FOOD0SV_25X17X9 10788 1 yes im0(lid025) 2967 28%IKEA_365+_FOOD0SV_25X17X6 5981 1 yes im0(lid025) 1645 28%IKEA_365+_FOOD0SV_17X17X12 8782 1 yes im0(lid017) 2394 27%IKEA_365+_FOOD0SV_17X17X6 13466 1 yes im0(lid017) 3671 27%
! ANTILOP_HIGHCHAIR 6899 ! ! 1 no im 6081 ! 88%96500 OMSORG_SHOETREE_LARGE 53839 !42661 !44% 1 no im 21910 23% 41%105273 OMSORG_SHOETREE_SMALL 53839 !51434 !49% 1 no im 7841 7% 15%12000 BRÄDA 12957 957 8% 1 no im 1 10418 87% 80%52800 CHOSIGT_ICE_LOLLY 55446 2646 5% 3 no im/im/im 1 23696 45% 43%3439 TRONES_SHOE_CAB 3128 !311 !9% 2 no im/im 1 3215 93% 103%12000 NORDBY0BED0TRAY 18641 6641 55% 1 no im 1 3901 33% 21%
3
425%
24%
!9%!2222
!13%!242719196
24470
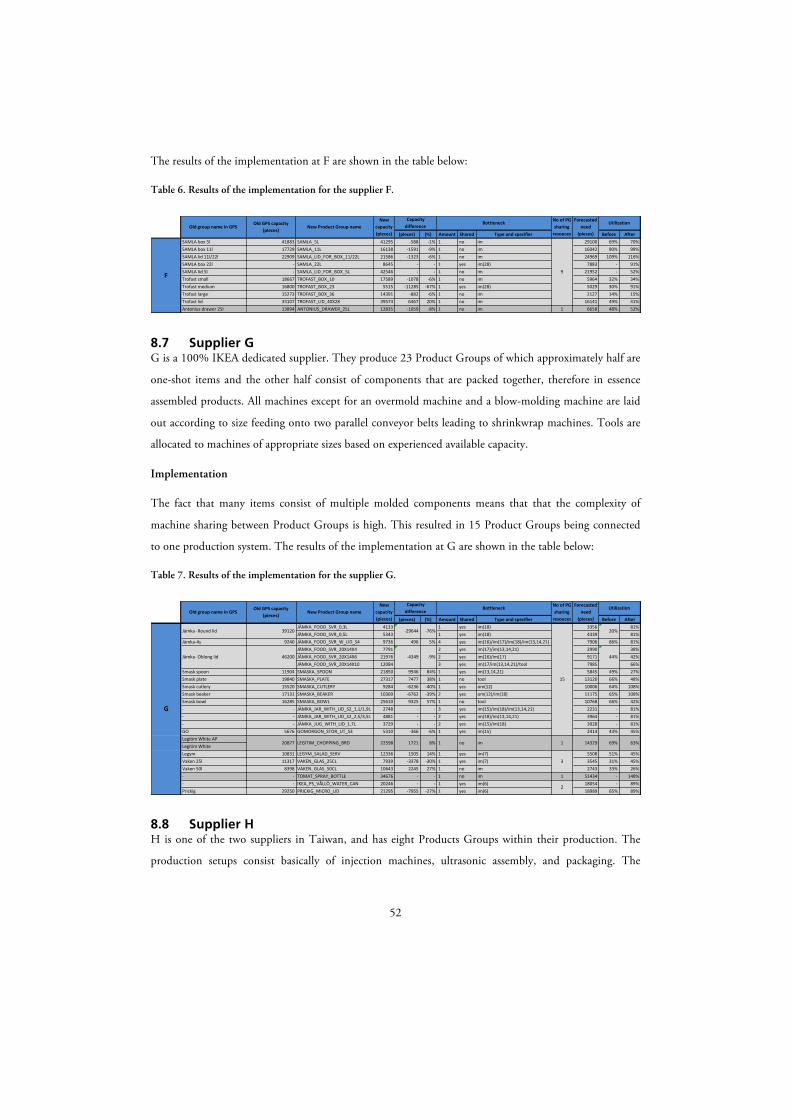
52
The results of the implementation at F are shown in the table below:
Table 6. Results of the implementation for the supplier F.
8.7 Supplier G G is a 100% IKEA dedicated supplier. They produce 23 Product Groups of which approximately half are
one-shot items and the other half consist of components that are packed together, therefore in essence
assembled products. All machines except for an overmold machine and a blow-molding machine are laid
out according to size feeding onto two parallel conveyor belts leading to shrinkwrap machines. Tools are
allocated to machines of appropriate sizes based on experienced available capacity.
Implementation
The fact that many items consist of multiple molded components means that that the complexity of
machine sharing between Product Groups is high. This resulted in 15 Product Groups being connected
to one production system. The results of the implementation at G are shown in the table below:
Table 7. Results of the implementation for the supplier G.
8.8 Supplier H H is one of the two suppliers in Taiwan, and has eight Products Groups within their production. The
production setups consist basically of injection machines, ultrasonic assembly, and packaging. The
SAMLA%box%5lSAMLA%box%11lSAMLA%lid%11l/22lSAMLA%box%22lSAMLA%lid%5lTrofast%smallTrofast%mediumTrofast%largeTrofast%lidAntonius%drawer%25l
Old$group$name$in$GPS
F
(pieces) (%) Amount Shared Type$and$specifier Before After41883 SAMLA_5L 41295 A588 A1% 1 no im 29100 69% 70%17729 SAMLA_11L 16138 A1591 A9% 1 no im 16042 90% 99%22909 SAMLA_LID_FOR_BOX_11/22L 21586 A1323 A6% 1 no im 24969 109% 116%
A SAMLA_22L 8645 A A 1 yes im(28) 7883 A 91%A SAMLA_LID_FOR_BOX_5L 42546 A A 1 no im 21952 A 52%
18667 TROFAST_BOX_10 17589 A1078 A6% 1 no im 5964 32% 34%16800 TROFAST_BOX_23 5515 A11285 A67% 1 yes im(28) 5029 30% 91%15273 TROFAST_BOX_36 14391 A882 A6% 1 no im 2127 14% 15%33107 TROFAST_LID_40X28 39574 6467 20% 1 no im 16141 49% 41%13894 ANTONIUS_DRAWER_25L 12835 A1059 A8% 1 no im 1 6658 48% 52%
Forecasted$need$
(pieces)
UtilizationNo$of$PG$sharing$resouces
New$capacity$(pieces)
9
New$Product$Group$nameOld$GPS$capacity$
(pieces)
Capacity$difference$
Bottleneck
Old$group$name$in$GPS(pieces) (%) Amount Shared Type$and$specifier Before After
Forecasted$need$
(pieces)
UtilizationNo$of$PG$sharing$resouces
New$capacity$(pieces)
New$Product$Group$nameOld$GPS$capacity$
(pieces)
Capacity$difference$
Bottleneck
Jämka&4s
Smask*spoonSmask*plateSmask*cutlerySmask*beakerSmask*bowl&&&GOLegitim*White*APLegitim*WhiteLegymVaken*25lVaken*50l&&Prickig
Jämka*&Round*lid
Jämka&*Oblong*lid
G
JÄMKA_FOOD_SVR_0,3L 4133 1 yes im(18) 3356 81%JÄMKA_FOOD_SVR_0,5L 5343 1 yes im(18) 4339 81%
9240 JÄMKA_FOOD_SVR_W_LID_S4 9736 496 5% 4 yes im(16)/im(17)/im(18)/im(13,14,21) 7906 86% 81%JÄMKA_FOOD_SVR_20X14X4 7791 2 yes im(17)/im(13,14,21) 2990 38%JÄMKA_FOOD_SVR_20X14X6 21976 2 yes im(16)/im(17) 9171 42%JÄMKA_FOOD_SVR_20X14X10 12084 3 yes im(17/im(13,14,21)/tool 7985 66%
11904 SMASKA_SPOON 21850 9946 84% 1 yes im(13,14,21) 5845 49% 27%19840 SMASKA_PLATE 27317 7477 38% 1 no tool 13120 66% 48%15520 SMASKA_CUTLERY 9284 &6236 &40% 1 yes om(12) 10006 64% 108%17131 SMASKA_BEAKER 10369 &6762 &39% 2 yes om(12)/im(18) 11175 65% 108%16285 SMASKA_BOWL 25610 9325 57% 1 no tool 10768 66% 42%
& JÄMKA_JAR_WITH_LID_S2_1,1/1,9L 2748 & & 3 yes im(15)/im(18)/im(13,14,21) 2231 & 81%& JÄMKA_JAR_WITH_LID_S2_2,5/3,5L 4881 & & 2 yes im(18)/im(13,14,21) 3964 & 81%& JÄMKA_JUG_WITH_LID_1,7L 3729 & & 2 yes im(15)/im(18) 3028 & 81%
5676 GOMORGON_STOR_UT_S3 5310 &366 &6% 1 yes im(15) 2414 43% 45%
10831 LEGYM_SALAD_SERV 12336 1505 14% 1 yes im(7) 5508 51% 45%11317 VAKEN_GLAS_25CL 7939 &3378 &30% 1 yes im(7) 3545 31% 45%8398 VAKEN_GLAS_50CL 10643 2245 27% 1 no im 2743 33% 26%
& TOMAT_SPRAY_BOTTLE 34676 & & 1 no im 1 51434 & 148%& IKEA_PS_VÅLLÖ_WATER_CAN 20246 & & 1 yes im(6) 18054 & 89%
29250 PRICKIG_MICRO_LID 21295 &7955 &27% 1 yes im(6) 18989 65% 89%
63%
44%
2
3
15
14329 69%1imno12259820877 8%1721
39120
&9%&4349
20%&29644 &76%
LEGITIM_CHOPPING_BRD
46200

53
production is shared with other customers, but the machines were mainly dedicated to IKEA within each
Product Group. They currently calculated the capacities by looking at the bottleneck’s weekly
throughput. They if they had more than one product using the Resource Group the capacities are simply
divided by two. The demand at the supplier was very low at the time of the supplier visit and they had
built up huge stocks preparing for upcoming orders. Because of the low demand there is low utilization of
the resources throughout the whole factory, which means that some machines are not in use.
Implementation
To give the capacity calculations more accurate figures all machines and tools at hand were registered,
even if some were not in use. The template worked well, but there was low level of understanding on the
first day because of low English skills, but the acceptable level of understanding was achieved at the end of
the second day following discussions and explanations. The factory had many parts of the Products
Groups being outsourced and the transports times are not considered because of high quantities in the
transports. In the production there was two Product Groups that shared one common problem in the
implementation of the current template. Within these two Product Groups the products had different
colors and where produced in different ways. Some of the colors needed coating that resulted in a split of
the Product Group. The Product Groups and capacities before and after the implementation are shown
below in Table 8.
Table 8. Results of the implementation for the supplier H.
8.9 Supplier I I is a supplier that has 11 Product Groups at their factory. The Product Groups basically follow these five
steps; extrusion, cutting, printing, and packing. I has other customers besides IKEA, but there was a low
amount of sharing of specific Resource Groups. The suppliers have a lot of Free Range products (seasonal
products) that were not included in the template because of no demand during the supplier visit.
Implementation
The supplier had very high knowledge of English which made the implementation process very efficient.
During the visit the template that was already filled out by the supplier was checked and reviewed
Old$group$name$in$GPS(pieces) (%) Amount Shared Type$and$specifier Before After
Forecasted$need$
(pieces)
UtilizationNo$of$PG$sharing$resouces
New$capacity$(pieces)
New$Product$Group$nameOld$GPS$capacity$
(pieces)
Capacity$difference$
Bottleneck
SKULPTURSAREGENUTHALLIG.KVARTAL
RAFFIG1hook
VASENTLIG
SYRLIG
H
RAFFIG1(black&white) 70867 1 yes pack(ra) 8983RAFFIG1(silver) 36085 1 yes pack(ra) 4574VÄSENTLIG_FINIAL1(white)1 54526 1 yes im(f2,f5,f6) 17409VÄSENTLIG_FINIAL1(silver&gold)1 12688 1 yes im(f2,f5,f6) 4051
15120 SKULPTUR_FINIAL1 26139 11019 73% 2 yes pack(ss)/tool 6671 44% 26%10584 SÄREGEN_FINIAL1 4236 .6348 .60% 1 yes pack(ss) 356 3% 8%10400 UTHÅLLIG_FINIAL1 8524 .1876 .18% 1 no im 0 0% 0%
. RINGSJÖN_SHOW_CURT 27000 . . 1 no pack 1 27044 . 100%13166 KVARTAL_GLIDE_24P 7765 .5401 .41% 1 no im 1 12469 95% 161%
SYRLIG_CRTN_RING_25MM 18358 2 yes sm(h)/sm(c)1 7793SYRLIG_CRTN_RING_38MM 20859 2 yes sm(h)/sm(c)1 8855
519%89672
42%18%
32%32%
13%52%
24%13214
.9%.3983
7
17280
54000
43200 2

54
together. The template was filled out correctly and the visit was mainly used for checking the
understanding and answering questions that came up. The supplier had spent two hours reading the
template’s instruction manuals, and that was enough to achieve the highest understanding of all suppliers
during the process implementation. This shows that when having good English skills the template
instructions can provide the suppliers with adequate knowledge to independently use it. In Table 9
shown below the Product Groups and capacities before and after the implementation are presented.
Table 9. Results of the implementation for the supplier I.
Old$group$name$in$GPS(pieces) (%) Amount Shared Type$and$specifier Before After
Forecasted$need$
(pieces)
UtilizationNo$of$PG$sharing$resouces
New$capacity$(pieces)
New$Product$Group$nameOld$GPS$capacity$
(pieces)
Capacity$difference$
Bottleneck
LJUDAOMTYCKTSADD
KLISTRIGSUMMERA1drop1fileORDENTLIGVANNERNA<PATRULL
IDROMMAR
62308 LJUDA_PLACE_MAT 300421 238113 382% 1 yes em(1) 67000 108% 22%62308 OMTYCKT_PLACEMAT 203201 140893 226% 1 yes em(1) 45318 73% 22%36000 SÅDD_PLACE_MAT 74066 38066 106% 1 yes em(1) 16518 46% 22%
DRÖMMAR_CAKE_DOILY 6641 2 yes em(1)/pack(p2) 2306DRÖMMAR_STENCIL 4911 2 yes em(1)/pack(p2) 1705
79208 KLISTRIG_PLACEMAT 107454 28246 36% 2 yes em(1)/pack(p2) 37312 47% 35%7200 SUMMERA_DROP_FILE 10377 3177 44% 1 yes em(1) 2314 32% 22%
111467 ORDENTLIG_PLACEMAT 127656 16189 15% 1 no sm 1 87361 78% 68%3960 VÄNNERNA_DRAPE 2550 <1410 <36% 2 yes sm(cm)/pack(v) 1112 28% 44%
< VITAMINER_DRAPE 1931 < < 2 yes sm(cm)/pack(v) 842 < 44%< PATRULL 40000 < < 1 no comp 1 4595 < 11%
15556 15%<26%<4004 35%7
2
55
9 Analysis and Evaluation
In this chapter the empirical findings are coupled with the theoretical framework to analyze the OSCP process.
The current working methods are first analyzed, followed by an analysis of the implementation of OSCP and
especially its components Product Groups and Resource Groups. Finally the results are analyzed along with
potential benefits to IKEA and its suppliers.
9.1 Current Working Methods IKEA seems to have a close strategic relationship with all the suppliers visited. One evidence of this is that
the tools used by the suppliers are owned by IKEA, who even support supplier development by for
example aiding in machine investments. The ownership of the tools means that IKEA has insight into
these capacities, but currently the rest of the production is not as transparent. The share of production
turnover that IKEA products comprise justifies the close relationships for customers completely dedicated
to IKEA or those with a high share. For those with lower shares the justification is less apparent. For all
suppliers there is however a close communication that enables supply chain optimization by sharing
information.
9.1.1 Suppliers The suppliers’ methods of calculating the capacities presented to IKEA are largely derived from the total
tooling capacities based on the planned weekly working hours. This is because the aim in the production
planning is that tools and the machines be the bottlenecks. However, they lack consideration of the
tactical plan of tools to machines, which may constrain the capacity when machines share more than one
tool. Other capacity losses due to breakdowns and defect rates are not properly considered. Some consider
them by arbitrarily subtracting weekly production hours while others do not consider them at all. This
means that the provided capacities are inconsistent and may have a tendency to be inflated.
The focus of this thesis is the method in which capacities are calculated, not the method in which the
supplier plans capacities. The important aspect to consider is that they do have tactically planned
allocation of tools to machines. Most suppliers seem have a non-systematic method of capacity planning
based on experience, which questions the efficiency of these plans as is evident in the varying level of
utilization in many functional productions. Regardless of this the utilizations of most resources at the
suppliers are quite low, which means that suboptimal allocation plans may not impede the efficiency of
the productions in the current state. There is however a disregard for the planning of labor resources.
This means that the efficiency of the labor force cannot be evaluated.

56
9.1.2 IKEA One of the key tasks of the local TA with regards to capacities is to register them. For this, the current
grouping of articles is performed based on consultations with the suppliers, and the naming is decided by
the responsible SP. The latter means that there is no standardized naming globally for IKEA. The duty of
determining of the capacities is given to the supplier, which means that an understanding of how they are
determined is lacking, preventing a proper evaluation of their accuracy and credibility. Evidence of this is
the fact that the current capacities provided by the suppliers that are used operationally and tactically are
not operational or tactical.
This relates to another key task for the TA, which is to maintain availability by ensuring that orders can
be fulfilled. The tactical work is limited due to the experienced unreliability and volatility of the SPI. If
the capacity figures are inflated leading to exceptions being missed and orders being cancelled, this can be
a cause of fluctuations of the SPI. This means that SPs tend not to respond to exceptions until actual
orders are in place and it is too late. Currently the only response to exceptions is to contact the supplier,
and if there is no possibility meet the need capacity leveling is performed. This is an unstructured and
time-consuming solution.
The strategic focus for IKEA’s TAs with regards to capacity planning is tool investments. Without a clear
picture of the rest of production, especially with regards to the machine inventory, tool investment
decisions may be difficult.
9.2 OSCP Implementation The key aspects of the implementation of OSCP are the effectiveness of the method in which it is
implemented as well as the applicability of the process to the specifics of plastic production. The latter is
especially important to analyze for the key concepts of Product Groups and Resource Groups.
9.2.1 Process Implementation As previously explained the investigation of the initial state, in essence the setups of the various
productions for which the process was to be implemented as well as the current means of determining
and allocating production resource capacities, was essentially performed in conjunction with the
implementation phase. The plan for implementation essentially comprised of the template for collecting
and processing the data from production, and the fact that this was continuously updated at each
implementation has led to a slightly different practice being implemented. This makes the
implementation ineffective as it means that the first suppliers need to be presented with the final version
as opposed to the version they were initially presented with. This presents a notion of unpreparedness
from IKEA’s side and may lead to a lack of faith in the process from the suppliers.

57
What the planning part of implementation lacked was a clear idea of benefits to the suppliers, and as a
result none were presented. Although many evidently realized the benefits as a tool to aid in production
planning, more emphasis should have been placed on presenting this. Without a clear picture of the
benefits to the supplier they may lack incentive to maintain the template and update it regarding changes
in the production setup.
Another evident hurdle is the distribution of a template with instructions in a language of which the
recipient is not fluent. Many of the answers to the questions raised during the visits were in the
instructions and the fact that they were raised therefore questions the extent to which the suppliers were
prepared. This preparation was meant to be a key part of the plan for the implementation of the process
but failed, meaning that valuable time was spent clarifying issues dealt with in the instructions.
The directive from IKEA to implement the OSCP method of determining capacities at 9 suppliers and
the time limit in which to do it presented an obstacle in evaluating the implementation process. After
each implementation at a new supplier the ability in which the supplier can use and update the template
should be thoroughly evaluated. This would have the potential to improve the method if implementation,
especially the instructions for using the template as well as the user-friendliness of it.
9.2.2 Product Groups The implementation of the process of Product Groups as defined by IoS seems successful. The groupings
differ very little from the way that articles are currently grouped as it is based on the same logic being the
group-specific tools. The standardized naming of the Product Groups according to OSCP is generally
more specific than the previous names registered in GPS. For many groups the name is currently only the
family name of the product. The SPs responsible for the suppliers are aware of the specific product that
the family name refers to, but for IoS it means that they have to look at the specific articles within the
group to determine which specific product it is. One issue is the use of the letters Å, Ä, and Ö in the new
names. They were rarely used prior to the implementation and may be due to the unnecessary added
complexity in the writing them as most employees have no keys for these on their computers.
Substituting these for A and O should not present a complication as the risk of this leading to a common
name for different Product Groups seems unlikely.
Looking at the exceptions where the articles differ within a group they are often based on color and
labeling, as well as the assembly difference in some instances such as for the Antilop Highchair. These
differences generally seem to consume minute differences in resources in terms of raw materials and labor
hours. They can therefore most often be disregarded. One instance where the calculated capacity may not
be able to be reached is when product sets containing articles of different colors are produced. In the
example from G the three different colored Smaska Bowls are produced in three different machines in

58
parallel, but it is assumed in the capacity calculation that this practice does not need to be followed. This
means that if need be they could theoretically produce the different colors in one machine in sequence
changing color after each batch, but this may not be practical and the effect that color changes have with
regards to reduced capacity are not properly taken into consideration.
Where the color difference is dependent on a coating step this can be a bottleneck. It should be analyzed
whether or not this is a possibility, and if it the proposed Product Group should be split up into those
articles that require coating and those that do not. For the products Raffig and Väsentlig produced at H
the coating capacity is lower than the determined bottleneck capacity. This means that if the allocation
were to change to extremes, if the coated products had much higher demands, coating would become the
bottlenecks given the current capacity. As this step is outsourced and the capacity is based on what the
sub supplier can promise based on forecasted need, and since the need is currently low, an important
question is whether the sub supplier can in fact provide a higher capacity. For the sake of transparency
however it is recommended that the group is split.
In four instances the Product Groups have been divided up from their old grouping. The Jämka series of
food containers using the same lid have been grouped at the supplier G and the 365+ series of food
containers have also been grouped based on identical lids. On both occasions the lid has previously been
identified as a bottleneck and as such the grouping can only be seen as viable if the products belong to a
Situation 2. This is the case for the 365+ food containers as they share only the lid machine and each has
a dedicated box machine. Investigating the figures it becomes evident also that when determining the
capacity for each new Product Group with total allocation of the lid machine this machine remains the
bottleneck. The problem lies in how to account for the use of different box machines and tools for the
aggregated group.
In the case of the Jämka food containers they belong to a production system with very complex sharing
(see Appendix G) making it less viable to aggregate the different products into one group. The machines
that make the product specific boxes is shared with other Product Groups for which these machines are
the bottlenecks, meaning that their allocation to the Jämka food containers is critical in acquiring a view
of the total capacity of the production system. Without even looking at the sharing of the machines
making the boxes the tooling capacity of each of the round Jämka boxes is less than the capacity of the
lids, meaning that in cases of extreme allocation of the time in the lid machine the bottleneck will shift
(Figure 24).

59
Figure 24. Looking at the tooling capacities of the round Jämka food savers.
Regardless of the complexities of the production setups to which these aggregated groups belong there is
still a problem if the bottleneck is expanded to increase the capacity. Without the overview of the
machines used for the specific boxes the ability to determine whether these become the bottleneck would
be lost.
From this it can be concluded that the directive in OSCP of grouping products using similar Resource
Groups is essential as deviating from this creates complications. The disaggregation of the current
Product Groups based on differences in color and labeling is unnecessary as the differences in
consumption of Resource Groups are insignificant. Therefore the decision to base the Product Groups on
the tools used in their production seems suitable.
9.2.3 Resource Groups The generic Resource Group names on the most part cover the types of production resources used in
injection molding plastic production. One supplier visited does however not produce injection-molded
products, but rather silicone products and hence the predetermined generic names do not apply. The
analysis of the grouping is however divided into the different generic groups.
9.2.3.1 Raw materials and components When looking at raw materials and components it is unreasonable to group them with each other or any
other production resources. They can be grouped as a Type II group (see chapter 7.2.2.1), but this results
only in complication due to the need to manually determine which is a bottleneck in the Type II group,
and a lack of overview. There are no foreseeable benefits other than minimally reducing the amount of
information presented in the consumption table.
As the supplier orders raw materials and components from sub-suppliers based on the forecasted need,
and they have never experienced this as a bottleneck, the relevance of determining the weekly capacities
Jämka&Food&Svr&0,3L&
Jämka&Food&Svr&0,5L&
42&240&
42&240
&
30&171
&
26&400&
Tool&capacity&lid&0,5l&box&
Tool&capacity&lid&
Tool&capacity&0,3l&box&

60
for these resources is questionable. One rare exception where raw material might constrain the capacity is
when there is an extreme deviation in the total demand for all products using a certain material at a
supplier. This deviation would need to incur an increased need of the material exceeding 20% of the
forecasted need as well as any buffer stock. Component sub-suppliers could be asked for maximum
weekly capacity figures or the weekly capacity can simply be deduced from past proven capacity.
Overall it can be viewed that disregarding these Resource Groups’ capacities only results in a slight and
acceptable depreciation of the accuracy of the Product Group capacities. Including them in the template
and maintaining them seems therefore only beneficial to the supplier.
9.2.3.2 Injection machines The grouping of injection machines is only necessary when more than one is used to perform the same
task for a certain Product Group. This is because OSCP assumes that a Product Group does or does not
use a Resource Group. If two resources perform the same task and were to constitute two separate
Resource Groups it would mean that a Product Group may or may not use one depending on whether it
uses the other, which is not possible. This necessity to group in some instances therefore results in
grouping of machines of different sizes if different tools contributing the same pieces require it, often
resulting in a need for a weighted average consumption rate if the cycle times or number of cavities differ
for the tools. The weighting has been based on the nominal capacity of each machine based on the tool
used. This may inevitably affect the accuracy of the calculated capacity, especially as a result of complex
sharing of Resource Groups
Line production
The line productions investigated provide few complications with regards to grouping of resources. As
this method of production is intended for high volume low diversity production there is inherently little
sharing. There are essentially two forms of line production witnessed at suppliers, one is where complex
assemblies with support machines result in a need for production to be specialized and dedicated to a
Product Group and one where the production is interpreted as line as a result of the choice to dedicate
resources to products. Due to the fact that most products are one-shot and when assembly is required it
most often entails unskilled manual labor, there is always a potential flexibility in where tools are used. In
the example of the line production of the Tolsby Frame at the supplier B, there is a sharing of one
injection machine with the product Fantastisk despite the specialization of the production line. The
conclusion is that despite interpreting line productions as dedicated to Product Groups the fact that the
tools in machines can be changed rather easily there is always the potential to deviate from this
dedication.

61
Functional grouping
The natural way of grouping injection machines functionally is by size. This is due to the flexible nature
of the machines in that many different tools can be used in them. For this many suppliers plan the layout
of their production functionally, especially for the production of one-shot items, and therefore a potential
basis for grouping resources. The visited suppliers do however already have a plan for the use of tools in
machines. Grouping machines by size would mean the resulting capacities would depend on the tools
being able to be used on all machines of a certain size. This could challenge and improve their planned
dedication but also might not be feasible due to other factors. It might also result in instances where a
Product Group using different machine sizes for the same parts results in a need to aggregate these size
groups.
When attempting to implement this form of grouping at G which has a layout based on sizes these
complications arise. As shown in the reference case (see Appendix G) there is a grouping of machines
number 13, 14, and 21 due to the fact that the Smaska Spoon is manufactured in all three. The sizes are
however 140T, 140T and 260T respectively. This means that a group based on sizing would also include
all machines within this interval. Because tools have a required minimum clamping force it means that
tools requiring a force at the upper end of the size interval for a group cannot be restricted to the proper
sized machines but are assumed to be able to use all machines in the group.
Table 10. List of machine numbers and sizes at G.
Machine Number Size1 520T2 450T3 450T4 250T5 560T6 450T7 250T8 300T9 250T10 200T11 200T12 75T13 140T14 140T15 320T16 260T17 320T18 220T19 260T20 320T21 260T22 600T

62
Partial Resource Group sharing
A problem that arises regardless of how the grouping is performed is stems from when one Product
Group requires several machines to be grouped into a Resource Group but one or more other Product
Groups use only specific machines in that group. This is the case for the “IM #13/#14/#21” Resource
Group where only the Jämka Spoon uses all machines but the four other Product Groups do not as
shown in Table 11.
Table 11. Product Groups using Resource Group "IM #13/#14/#21" at G and the specific machines they use.
One solution could be to alter the constraining Resource Group based on the tooling capacity of each
Jämka series product that uses this group to instead comprise of two constraining Resource Groups for
machines 13 and 14 respectively. The tooling capacity constraint could remain but as constraining to one
machine will impose the same restriction it is extraneous. If we complicate the example further by
allowing the Jämka Food Saver with lid to also use injection machine 14 this would incur a necessity to
have two additional constraining Resource Groups; “IM #13/#14” and a tool group for that specific
Product Group. This example is shown in Figure 25 below.
Figure 25. Example of complicated use of constraining Resource Groups due to the dedication of certain machines
within a Resource Group.
This complexity would result in a difficulty in implementing the template and updating it following
changes in tool to machine dedications. It also contributes to a source of reduced accuracy in the
capacities if a consumption rate in the aggregated Resource Group is weighted. Consider if the Smaska
Product Groups Machine SMASKA_SPOON 13, 14, and 21JÄMKA_FOOD_SVR_W_LID_S4 13JÄMKA_FOOD_SVR_20X14X4 13JÄMKA_FOOD_SVR_20X14X10 14JÄMKA_JAR_WITH_LID_S2_1,1/1,9L 13JÄMKA_JAR_WITH_LID_S2_2,5/3,5L 13
Jämka&jar&w&lid&s2&2,5/3,5l&
Jämka&jar&w&lid&s2&1,1/1,9l& Jämka&
food&svr&20x14x4&
Jämka&food&svr&w&
lid&s4& Jämka&food&svr&20x14x10&
IM
/#14/#21&
IM
/#14&
IM
&
Smaska&spoon&
IM&TOOL&
63
spoon’s use of the Resource Group constitutes a weighted average consumption rate with high
throughputs in machines 13 and 14 and low throughput in machine 21. As much of the machine time in
these two machines will be allocated to the Jämka products, it can be assumed that machine 21 will
constitute the majority of the production of the spoon. The resulting capacity would be inflated as this
machine assumes a higher throughput than the reality. Though this is not the case in this example as the
three tools used for the Smaska spoon are identical, it is the case for the sharing of the “IM Base”
Resource Group between Tolsby and Fantastisk (see section 4.6 Production Scenarios). In this case one of
the machines that is not shared with Fantastisk has a higher throughput than the shared one, meaning
that actual consumption rate on the machine hours in the Resource Group allocated to Tolsby should be
lower than the weighted average. The conclusion is that all average consumption rates in shared Resource
Groups provide a source of error in the capacity of the Product Group for which the average is made, to a
degree that is relative to the amount of machine time that is allocated away from that Product Group.
9.2.3.3 Support Machines Support machines include machines used mainly in the production of technical plastic products that are
not injection machines. They include for example bristling machines used for production of brushes and
overmold machines. As they tend to be Product Group specific there no complications arise when
implementing the process as a result of need for allocation. They do however sometimes require skilled
labor to operate as is with the bristling machines at A. This labor may constitute a constraint if the
current utilization of the machines is low resulting in a labor capacity prevents the ability to use all
machines. The operational capacity must therefore take this into account.
9.2.3.4 Assembly and Packing Assembly and Packing Resource Groups comprise of all final steps of production following the injection
machine and eventual support machine Resource Groups. For assembly and non-assembly Product
Groups these steps are grouped as a Type II Resource Group and named assembly and packing
respectively. As previously mentioned the access to labor is abundant in China resulting in a lack of
regard at suppliers for this resource in determining capacities. Many of the assembly and packing jobs are
menial tasks such as moving product from assembly lines to pallets or placing labels on products. These
“unskilled” labor resources can therefore on many occasions be disregarded in the calculation as the
capacity of them can easily be expanded. The complexity of mapping the number of these laborers and
determining cycle times for their contributions to different Product Group is a burden that should not be
forced on the supplier unless needed. Skilled labor on the other hand presents an operational constraint
due to the necessity of either finding appropriate people or training which takes time, and this labor force
should be mapped and approximate cycle times should be determined.

64
On some occasions these two Resource Groups may include a machine such as the stamping machine
used to assemble the Tolsby Frame at B or shrinkwrap machines used to pack many products. These are
often disregarded, but as they have the potential to constrain the capacity of products requiring them they
need consideration. At G, for example, many products are packed using the same shrinkwrap machines
and the capacity of this should be determined using an empirically determined cycle time.
9.3 OSCP Evaluation In order to evaluate the contribution of the OSCP process both the calculated capacities and the benefits
to IKEA and its suppliers capacity planning are analyzed. The latter is not a goal for the press but seen as
a vital goal for creating an incentive for the supplier to maintain the template seen as critical to the
process.
9.3.1 Supplier Capacities There are several factors that can be identified as critical to the proper calculation of the capacities at
IKEA’s suppliers and need to be analyzed in order to determine the accuracy of the resulting figures:
• The nominal weekly capacity in terms of production hours. • The loss of capacity due to irregular downtimes. • The dedication of the weekly capacity to IKEA. • The loss of capacity due to defect products.
When implementing the OSCP process through the use of the template the figures gathered for the
weekly capacities were figures given by the suppliers. As many remove hours each week to account for
unplanned or irregular capacity losses, the given figures given may contain errors affecting the accuracy of
the calculated capacities. All the weekly nominal capacities should be reviewed to ensure they are correct.
For an efficient use of the template it is recommended that the weekly production hours should be a
variation of the nominal capacity only taking into account the regular planned downtimes. Even though
for example tool changes and color changes constitute planned downtimes they are irregular in that they
affect only some machines in production and happen at irregular time intervals and result in irregular
durations of downtime. Data on all irregular production stops should be maintained and inserted in the
template as downtime. This results in a simpler maintenance of the template as only one figure is
updated.
In order to insure a higher degree of accuracy IKEA must make an effort to encourage the suppliers to
thoroughly appreciate the value of having accurate figures. Their use of the template as a capacity
planning tool should incentivize them to do so. Figures for downtimes due to the different factors
including breakdowns and different irregular planned downtime should be maintained along with
consumption rates, and could benefit the suppliers in analyzing their productions and implement changes
to improve.

65
These figures may also be beneficial to IKEA in evaluating their suppliers by benchmarking them against
each other. The realization of this may however remove suppliers’ incentives to provide IKEA with
accurate figures as they may chose to embellish them.
One cause for inaccuracy that arises from the downtime rates in the template is when they are
administered to a grouping of machines. This means that a weighted average has to be calculated, which
may not reflect the true capacity lost when the use of grouped machines is uneven. This average may also
mean a time consuming job in updating the figures that could be avoided if they are taken into
consideration in the calculation tools and automatically calculated.
Finally the dedication of weekly capacity to IKEA when production resources are shared with other
customers presents a problem in the validity of the capacity figures with the method currently used. This
is because there is currently no directive in place for this dedication, and when B was asked to perform it
they used the template as a RCCP tool and only dedicated the amount of capacity necessary to cover the
average forecasted need in the SPI. Many TA employees in Shenzhen as well as the suppliers visited
experience large deviations in actual orders relative to the forecast in the SPI. This means that fluctuations
of orders above this average will cause alarms and necessitate a high amount of work from IKEA’s supply
planners to insure that these orders can be fulfilled.
The goal for the future is for IKEA to be involved with the tactical dedication of suppliers Resource
Groups. IKEA should then also be aware of the total net capacity of these suppliers out of a tactical and
strategic perspective.
The defect rates has only a slight effect on the capacities as they tend to be very low, and the question is
whether the burden of maintaining these figures for the sake of calculating capacities outweighs the
importance of the slight inaccuracy. The defect rate can however provide the supplier as well as IKEA
with information regarding the efficiency of the production with a potential for IKEA to benchmark this
and support the improvement for those suppliers with problems.
9.3.1.1 The resulting capacities It is difficult to perform a proper analysis of the resulting capacities calculated and allocated with the use
of the template. This is because there is no follow-up of the figures. The capacities are in also most
instances dynamic due to the frequent allocation of Resource Groups’ capacities between Product Groups
as a result of flexible productions, and dedications to IKEA. Figure 26 depicts how the dedication of a
bottleneck Resource Group’s capacity to IKEA and allocation of the dedicated capacity between Product
Groups make the resulting capacities dynamic, as opposed to static capacities depicted in Figure 27 where
the entire capacity of the bottleneck Resource Group is dedicated to IKEA and only used by one Product
Group.

66
Figure 26. Dynamic Capacities.
Figure 27. Static Capacities.
Because of the very similar grouping of articles before and after OSCP implementation it is possible to
compare them. When analyzing the difference of the capacities currently in GPS and those calculated by
the template following the OSCP process with regards to if they are static or dynamic it shows a clearer
picture of the impact of the change. It should also be pointed out that the lack of a standard way of
working with regards to maintaining the figures currently in GPS means that some figures are set for long
time periods and infrequently updated. This means that their relevance in the operational perspective is
sometimes questionable.
Figure 28 and Figure 29 depict the distribution of percentual change of capacities
(!"# !"#"!$%$&'!!"# !"#"!$%$&'!"# !"#"!$%$&'
) in 5 percent intervals for static and dynamic capacities respectively.
Figure 28. Distribution for the percentual change of capacity for products with static capacities (i.e. dedicated
bottlenecks and dedicated productions).
Bo#leneck)Resource)Group)
Dedicated)to)IKEA)PG1) PG2) PG3)
Bo#leneck)Resource)Group)
Dedicated)to)IKEA)PG1)
0"
1"
2"
3"
4"
5"
6"
7"
8"
9"
10"
,55"to",6
0",50"to",5
5",45"to",5
0",40"to",4
5",35"to",4
0",30"to",3
5",25"to",3
0",20"to",2
5",15"to",2
0",10"to",1
5",5"to
",10"
0"to",5
"0"to"5"
5"to"10"
10"to
"15"
15"to
"20"
20"to
"25"
25"to
"30"
30"to
"35"
35"to
"40"
40"to
"45"
45"to
"50"
50"to
"55"
55"to
"60"
60"to
"65"
65"to
"70"
70"to
"75"
75"to
"80"
80"to
"85"
85"to
"90"
90"to
"95"
95"to
"100"
100"to"105"
105"to"110"
110"to"115"
115"to"120"
120"to"125"
125"to"130"
130"to"135"
135"to"140"
140"to"145"
145"to"150"
150"to"155"
155"to"160"
160"to"165"
Coun
t&
Percentual&change&
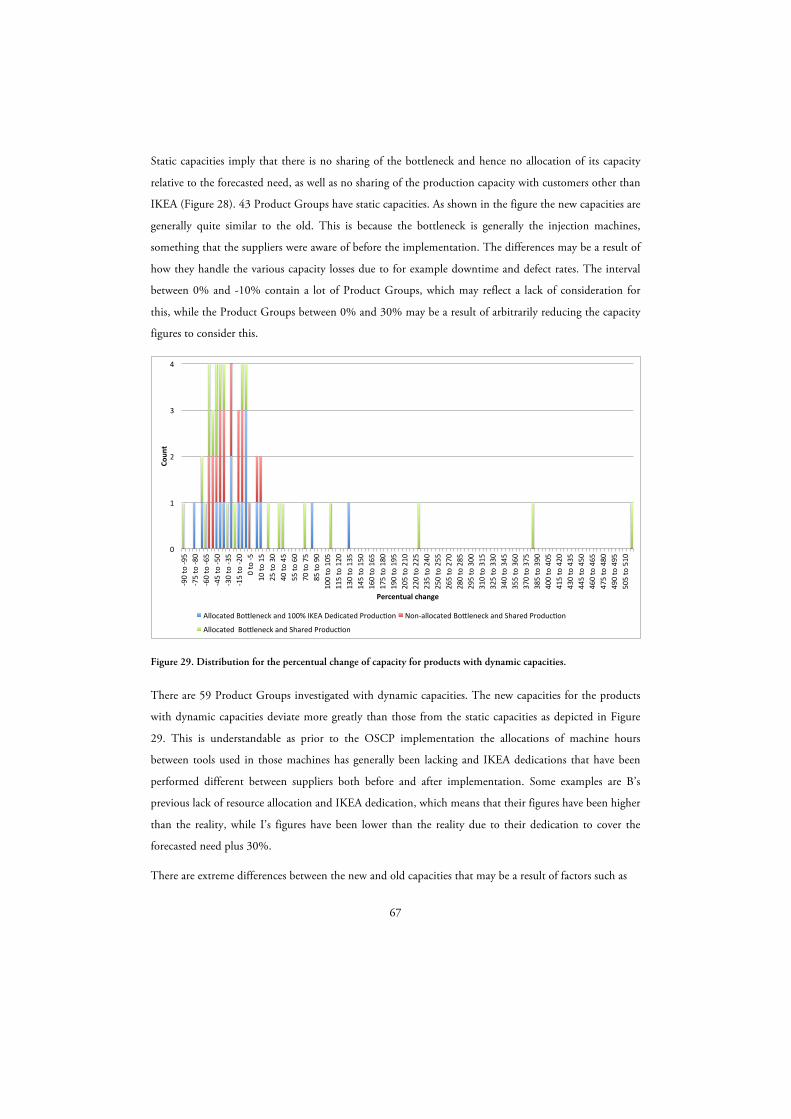
67
Static capacities imply that there is no sharing of the bottleneck and hence no allocation of its capacity
relative to the forecasted need, as well as no sharing of the production capacity with customers other than
IKEA (Figure 28). 43 Product Groups have static capacities. As shown in the figure the new capacities are
generally quite similar to the old. This is because the bottleneck is generally the injection machines,
something that the suppliers were aware of before the implementation. The differences may be a result of
how they handle the various capacity losses due to for example downtime and defect rates. The interval
between 0% and -10% contain a lot of Product Groups, which may reflect a lack of consideration for
this, while the Product Groups between 0% and 30% may be a result of arbitrarily reducing the capacity
figures to consider this.
Figure 29. Distribution for the percentual change of capacity for products with dynamic capacities.
There are 59 Product Groups investigated with dynamic capacities. The new capacities for the products
with dynamic capacities deviate more greatly than those from the static capacities as depicted in Figure
29. This is understandable as prior to the OSCP implementation the allocations of machine hours
between tools used in those machines has generally been lacking and IKEA dedications that have been
performed different between suppliers both before and after implementation. Some examples are B’s
previous lack of resource allocation and IKEA dedication, which means that their figures have been higher
than the reality, while I’s figures have been lower than the reality due to their dedication to cover the
forecasted need plus 30%.
There are extreme differences between the new and old capacities that may be a result of factors such as
0"
1"
2"
3"
4"
'90"to"'9
5"'75"to"'8
0"'60"to"'6
5"'45"to"'5
0"'30"to"'3
5"'15"to"'2
0"0"to"'5
"10
"to"15"
25"to
"30"
40"to
"45"
55"to
"60"
70"to
"75"
85"to
"90"
100"to"105
"11
5"to"120
"13
0"to"135
"14
5"to"150
"16
0"to"165
"17
5"to"180
"19
0"to"195
"20
5"to"210
"22
0"to"225
"23
5"to"240
"25
0"to"255
"26
5"to"270
"28
0"to"285
"29
5"to"300
"31
0"to"315
"32
5"to"330
"34
0"to"345
"35
5"to"360
"37
0"to"375
"38
5"to"390
"40
0"to"405
"41
5"to"420
"43
0"to"435
"44
5"to"450
"46
0"to"465
"47
5"to"480
"49
0"to"495
"50
5"to"510
"
Coun
t&
Percentual&change&
Allocated"Bo6leneck"and"100%"IKEA"Dedicated"ProducBon" Non'allocated"Bo6leneck"and"Shared"ProducBon"
Allocated""Bo6leneck"and"Shared"ProducBon"
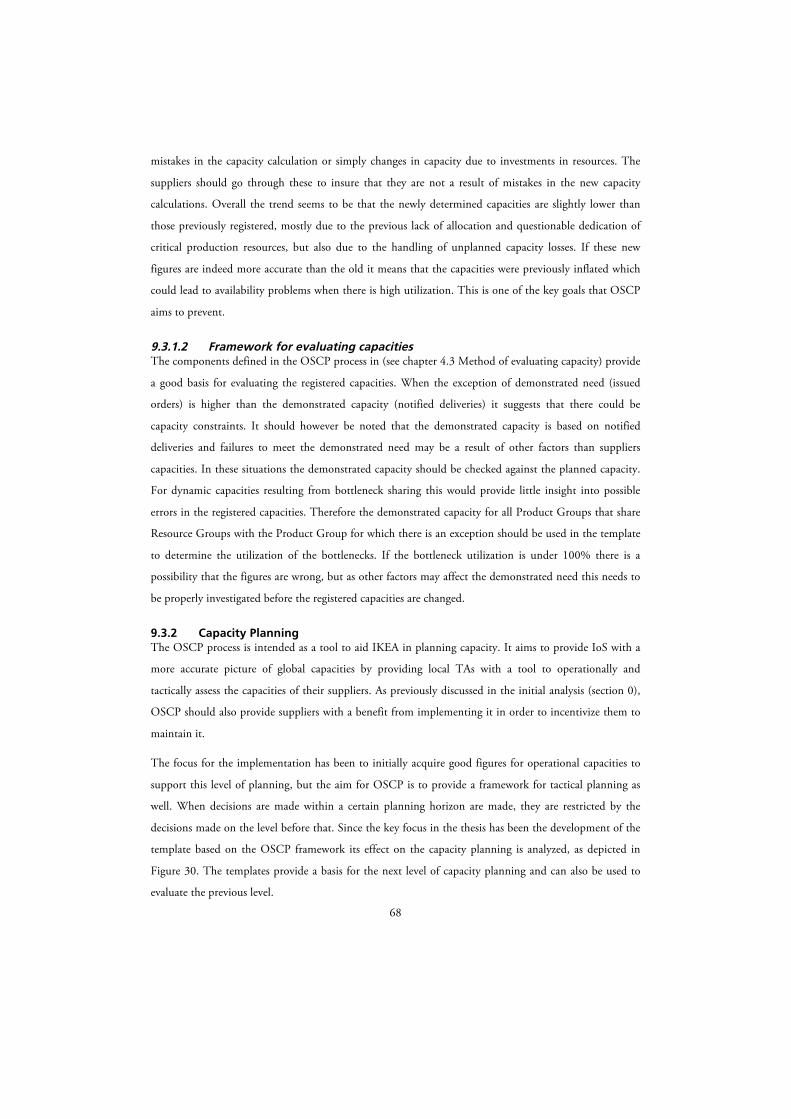
68
mistakes in the capacity calculation or simply changes in capacity due to investments in resources. The
suppliers should go through these to insure that they are not a result of mistakes in the new capacity
calculations. Overall the trend seems to be that the newly determined capacities are slightly lower than
those previously registered, mostly due to the previous lack of allocation and questionable dedication of
critical production resources, but also due to the handling of unplanned capacity losses. If these new
figures are indeed more accurate than the old it means that the capacities were previously inflated which
could lead to availability problems when there is high utilization. This is one of the key goals that OSCP
aims to prevent.
9.3.1.2 Framework for evaluating capacities The components defined in the OSCP process in (see chapter 4.3 Method of evaluating capacity) provide
a good basis for evaluating the registered capacities. When the exception of demonstrated need (issued
orders) is higher than the demonstrated capacity (notified deliveries) it suggests that there could be
capacity constraints. It should however be noted that the demonstrated capacity is based on notified
deliveries and failures to meet the demonstrated need may be a result of other factors than suppliers
capacities. In these situations the demonstrated capacity should be checked against the planned capacity.
For dynamic capacities resulting from bottleneck sharing this would provide little insight into possible
errors in the registered capacities. Therefore the demonstrated capacity for all Product Groups that share
Resource Groups with the Product Group for which there is an exception should be used in the template
to determine the utilization of the bottlenecks. If the bottleneck utilization is under 100% there is a
possibility that the figures are wrong, but as other factors may affect the demonstrated need this needs to
be properly investigated before the registered capacities are changed.
9.3.2 Capacity Planning The OSCP process is intended as a tool to aid IKEA in planning capacity. It aims to provide IoS with a
more accurate picture of global capacities by providing local TAs with a tool to operationally and
tactically assess the capacities of their suppliers. As previously discussed in the initial analysis (section 0),
OSCP should also provide suppliers with a benefit from implementing it in order to incentivize them to
maintain it.
The focus for the implementation has been to initially acquire good figures for operational capacities to
support this level of planning, but the aim for OSCP is to provide a framework for tactical planning as
well. When decisions are made within a certain planning horizon are made, they are restricted by the
decisions made on the level before that. Since the key focus in the thesis has been the development of the
template based on the OSCP framework its effect on the capacity planning is analyzed, as depicted in
Figure 30. The templates provide a basis for the next level of capacity planning and can also be used to
evaluate the previous level.
69
Figure 30. The roles of the templates in the capacity planning.
9.3.2.1 Operational perspective Trading Area
One benefit for IKEA is the increase in insight into the capacities at suppliers that the OSCP process
provides. The key operational work performed by the TAs with regards to capacities is to insure that the
need can be met. Currently if the need exceeds the registered capacity the SPs contact the supplier to see
whether they have the possibility to increase the capacity. The supplier capacity value name created for
OSCP seeks to support this by providing information about what constrains the capacity. Following the
ideas of TOC by identifying the system bottlenecks and focusing the production on these enables quick
identification of the problems that need to be solved when the registered capacity is exceeded by the need.
The Resource Group name provides the ability to see whether reallocation of the capacity in the
constraint is possible. For this there is no need to contact the supplier as the reallocation can be tested in
the template. The SP can search for all Product Groups with a matching Resource Group name and if
this bottleneck is underutilized for some the capacity should be able to be transferred. The bottleneck
type indicates whether there is a possibility to temporarily increase capacity. Operationally this is
especially true for labor bottlenecks in the visited productions. It is also if injection machines are the
bottlenecks as the flexibility of using tools in different machines means that there may be machines not
dedicated to tools where they can be temporarily used. For this there is a need to contact the supplier.
This supplier capacity value name however lacks the ability to handle cases where there are multiple or
moving bottlenecks. Currently the bottleneck type is not maintained in the template, but if it were added
then all the relevant information for operational capacity planning would be maintained there. Therefore
the supplier capacity value name should perhaps provide information to easily locate the template file
instead. As explained in section 9.3.1.1, the nature of capacities being static or dynamic affects the
Strategic)Capacity)Planning)
Tac1cal)Capacity)Planning)
Dedica1on)of)RG)capacity)to)IKEA)< Dedica1on)of)tools)to)machines)
< Investment)in)tools)
Alloca1on)of)RG)capacity)between)PG)
Tac1cal)Template)
Opera1onal)Template)
Opera1onal)Capacity)Planning)

70
validity of the registered capacity value. If the capacity is static then the relevant information is the
bottleneck type and whether it can be temporarily increased. If the dynamic nature stems for bottleneck
sharing the investigation into whether the capacities can be increased by reallocation requires only access
to the template, but if it stems from a dedication of capacity to IKEA it requires contact with the supplier
to determine whether there is available undedicated capacity. The relevance of this information means
that it could also be added to the supplier capacity value name.
One thing the allocation in the template does not take into account in its current form is the fluctuations
of the weekly need relative to the average need. The allocation needs to be fixed in GPS for the time
periods between events when the figures are updated in the system. If a Product Group fluctuates heavily
and the bottleneck utilization given average need is relatively high, the result would be a large amount of
warnings in GPS when the need peaks. When the bottleneck capacity is allocated it could lead to an
unnecessarily high workload if the other Product Groups sharing this bottleneck fluctuate less and their
allocated margin is less often utilized. Therefore the weighting of the allocation should perhaps take into
account the fluctuations by calculating the standard deviation of the need over the 17 week time period
and adding it to the forecasted need. Another way of reducing the fluctuations is to operationally look at
a shorter time period. This would however mean that the frequency of updating the figures would have to
increase which in turn means a higher workload.
Suppliers
The operational benefit to the supplier is the ability to perform an MRP based on the Resource Groups
for as components and raw materials. As the template is designed as a RCCP the key benefits are mostly
tactical. It supports their production planning by providing a picture of the resources necessary to meet
the forecasted need.
Most of the suppliers have a planned dedication of injection machines to tools but many tools can be
used in more machines than stated in this plan. Because the machines are often the bottleneck there is the
possibility to move the tools to machines with forecasted low utilization to meet a demand that is higher
than the registered capacity, given the utilization of non-bottleneck resources are not exceeded. In these
situations the bottleneck name and identification code could be helpful in signaling this possibility. As
the template gives an overview of the utilization of all Resource Groups this provides for a quick and easy
support in determining where to move the tool. This short-term solution for exceptions is however in
essence operational as it deals with alterations in the short term planning. A tactical decision would be to
alter the plan for where tools are used. This would follow the TOC steps of especially identifying and
elevating the bottleneck tactically to match the demand. This would entail a rework of data in the
template, which supports the notion that IKEA should ensure adequate training for suppliers in this.

71
Where the OSCP process may impede the capacity planning ability of the template is with regards to
grouping of resources where it is not necessary, such as Type II Resource Groups including most assembly
and packing lines. This removes the insight into the capacity requirements from some resources,
especially labor, which could be useful. An overview of all labor stations and proper information about
throughput in these would provide a framework for tactically planning the hiring and firing of labor, a
decision that seems to currently be based on experience and feeling.
9.3.2.2 Tactical perspective Trading Areas and suppliers
The nature of the close relationship between the TAs and its suppliers means that the tactical perspective
for both can be analyzed together.
The nature of the flexibility in which machines to use tools, especially in functionally grouped layouts,
means that the use of the template to support tactical decisions would entail a rework of it from its
current operational form. The supplier’s planned dedications of tools to machines should not be taken
into consideration, instead the machines should be grouped by size and tools should be allocated to
proper groups. This would show the total machine hours capacity for all the tools as well as the total
tooling capacity. In this tactical version of the template there is no necessity to include labor and raw
materials, as these are not affected by strategic decisions. A template such as this would also support the
tactical machine dedication plan by allowing a greater overview over different possibilities of where to use
tools. If this promotes a better tactical plan then it would incur saving through a more efficient
production at the supplier.
The dedication of capacity to IKEA being performed in cooperation between the supplier and BD, as well
as the insight into the capacities, should improve IKEAs availability of products. This is by being able to
hold the supplier accountable to exceptions where the need is not met despite a less than 100% utilization
of IKEA dedicated resources.
The tactical perspective for IKEA also deals with the investments in tools, which are always owned by
IKEA, and injection machines, which IKEA often supports. The OSCP process of identifying and
maintaining information pertaining to the bottlenecks of productions supports a TOC based
management to support the strategic decision-making.

72
73
10 Conclusions and Recommendations
10.1 Conclusions The purpose of this thesis has been to implement and evaluate the OSCP process for working
with capacities. It also includes a mapping of the current methods of doing this to provide a basis
for the evaluation.
The current method of working with capacities leads to several problems. The groupings prior to
OSCP are generally the same as the IoS defined Product Groups with few exceptions. With
regards to the determining of capacities the general practice is to look at the total tooling capacity
based on the nominal production hours, sometimes minimizing these to buffer against any
unplanned events or issues. The former means that there is no allocation of hours in shared
injection machines to the tools used in them. The latter means that the accuracy of the figures is
questionable. When registering capacities the current naming of product groups is decided by the
SP responsible for the supplier, which has led to names being unstandardized and on many
occasion only product family names. This makes the task of aggregating global capacities
difficult.
The key focus of the thesis has been the actual implementation of the process to calculate the operational
capacities. The preparation for the implementation was lacking in that the specifics of plastic production
were not investigated prior to the implementation, but rather during the implementation, and the
methods described in the OSCP material for determining the capacities was below par and lacked tools to
support it. The latter lead to the development of a comprehensive template to aid in the implementation
process and the former meant that this template needed much revision following new complications
arising at successive supplier visits.
Once the final template was developed the implementation process was more effective as it could be
applied to all the investigated productions. The addition of a table of needs presented in the template also
allows for a RCCP tool that is a very useful for the suppliers in planning their production. This is seen as
an important factor in incentivizing them to maintain and update the template following changes in
production, and input values such as the forecasted SPI need, consumption rates, and downtime and
defect rates. This ensures the continuous accuracy of the figures.
When implementing the process the grouping of production resources into Resource Groups was limited
to grouping injection machines, and assembly and packing lines. The injection machines were only
grouped when necessary, which was a result of them contributing the same piece to a product. Since the
focus for the implementation was to acquire operational capacity figures the dedication of tools to

74
machines was based on the suppliers’ tactical plans. There is however a flexibility in using different tools
in different machines which means that the tactical or strategic capacity figures can be based on grouping
machines functionally by size. There were some flexible productions that presented very difficult
implementations of the template that limit the accuracy of the capacities calculated as well as present
problems for maintaining and updating the template.
The results of the OSCP process are divided into quantitative and qualitative results. The quantitative
results are the new capacities that have been calculated. Although it is difficult to evaluate them, as they
cannot be followed up due to the time constraint, the difference between the new and old figures was
investigated in section 9.3.1.1. When looking at static capacities, i.e. Product Groups that do not share
bottlenecks with other Product Groups or other customers, the deviation from the old figures was rather
small. The dynamic capacities, i.e. where bottleneck capacities are allocated between Product Groups or
shared with other customers or both, the new figures were generally lower. This is mainly due to the
previously lacking practice of allocating and dedicating injection machine hours between Product Groups
and to IKEA respectively, as well as the lack of proper consideration of unplanned losses in capacity.
The qualitative results deal with the way the process can help both IKEA and its suppliers with their
capacity planning. The benefits are summarized in the following points for IKEA and suppliers
respectively:
IKEA
• It allows IKEA to verify suppliers’ capacities.
• OSCP provides a greater insight into the factors that affect capacities.
o This enables a better handling of complications arising when the need exceeds the
capacity both operationally and tactically.
o Allows for the possibility to benchmark suppliers against each other to find areas of
improvement and evaluate their efficiency.
o Potential to influence IKEA dedication of specific resources and allocation of
capacity in these resources to specific products.
• It provides a standardized product grouping and naming that enables a better global overview.
Suppliers
• The key benefit to the suppliers is the tool that the template provides.
o It can be used as a RCCP tool for the allocation of machine hours to products.
o It has the potential to aid in the planning of labor if consumption rates and weekly
capacities for this are properly maintained.
75
o It provides a CRP to determine need for raw materials and components.
• The implementation has provided the suppliers with an awareness of the impact of unplanned
or irregular capacity losses and how to handle these.
10.2 Recommendations With regards to calculating the capacities there are some issues that need to be addressed. In order to
insure the accuracy of the capacity figures IKEA should ensure that the suppliers maintain information
about breakdowns and defect rates correctly, something that is not experienced today. The allocation
basis should also be reviewed and standardized, perhaps taking into account standard deviation or also
other factors such as service level goals. The allocation should also be reviewed more frequently than the
recommended 3 times a year for some product such as seasonal products and volatile products where the
need fluctuates greatly.
IKEA should review the implementation process for the OSCP process. First of all the template that was
developed in this thesis could be used for other suppliers, but it is recommended that it is first properly
tested and evaluated in different productions and over a period of time to see if improvements can be
made. The goal for the process is “one common way of working”, which means that only one template
should be developed. In order for the suppliers to maintain it they should be properly educated and
properly incentivized. The former means that firstly the instructions should be translated to the local
language where the English skills are below par. It could also mean workshops to train in the use of the
template. To support suppliers continuously in updating the template following changes in production a
“super user” should also be trained at each Trading Area, and they should in turn be supported by an
expert at IoS. The benefits to the suppliers must also be focused on, as the lack of this may prevent an
implementation. The authors chose to present the rough-cut capacity plan in the template to be used by
the suppliers.
In this thesis the focus for the implementation of the OSCP process was to determine the operational
capacities. In order to determine the tactical capacities a framework for this must be set. This must
address the difficulty of the flexibility in plastic production with the ability to use a certain tool in a wide
range of machine sizes. The total tooling capacity should be linked to the total machine capacity in some
way to provide a good overview that enables a good potential to dedicate machines to tools and machine
time to IKEA. Apart from the injection machines and tools the tactical capacities should look at other
machines only, and not raw materials and labor. The lead time to increase labor, both skilled and
unskilled, can be assumed to lie within the time frame for tactical planning.
One problem with OSCP that needs to be addressed is the Supplier Capacity Value Name. The authors’
recommendation is to review the importance of maintaining the bottleneck name and bottleneck type in

76
this way. The potential for multiple and moving bottlenecks as has been experienced with the operational
capacities complicates the implementation of this naming. Instead the name could include an
identification code for the template, which itself should be stored in a standardized way so that it can be
accessed easily. This is because the template provides all the detailed information with regards to what
affects the capacities. Including an identifier as to the static or dynamic nature of the capacity can be used
operationally along with the template code to aid in the decision making when working capacities on a
daily basis (as explained in section 9.3.2.1).
77
11 References
11.1 Literature Björklund, M., & Paulsson, U. (2008). Seminarieboken. Studentlitteratur, Lund.
Björnsson, P. (2012-02-29). One Supplier Capacity Process. Version 0.997. IKEA of Sweden, Älmhult.
Goldratt, E. M., & Cox, J. (2004). The Goal: A Process of Ongoing Improvement. Great Barrington,
MA: North River
Mattson, S., & Johnsson, P. (2005). Produktionslogistik. Studentlitteratur, Lund.
11.2 Electronic sources IKEA (a). Facts & Figures: http://www.ikea.com/ms/en_GB/about_ikea/facts_and_figures/index.html
(visited 2012-02-10)
IKEA (b). Our Business idea:
http://www.ikea.com/ms/en_GB/about_ikea/the_ikea_way/our_business_idea/index.html (visited 2012-
02-10)
IKEA (c). The IKEA Group:
http://www.ikea.com/ms/en_US/about_ikea/index.html (visited 2012-02-10)
IKEA Intranet (a). Category Presentation:
http://inside.ikea.com/aboutikea/PresentationLibrary/Related%20Documents/categories/SCGlobal_New
%20assignments:%20categories.ppt (visited 2012-05-15)
IKEA Intranet (b). (2011-11-14) Processes:
http://inside.ikea.com/methodsstrategies/Processes/Pages/default.aspx (visited 2012-05-15)
IKEA Intranet (c). (2012-05-14) Range:
http://inside.ikea.com/aboutikea/functions/Range/Pages/default.aspx (visited 2012-05-15)
IKEA Intranet (d). (2012-05-12) Trading Operations:
http//inside.ikea.com/aboutikea/functions/Supply/TradingOperations/Pages/TradingOperations.asp
(visited 2012-05-15)
James C. Helm, P. P. (2001). Concepts: Implementing a Process in an Organization. Taken from Rational
Unified Process:
http://sce.uhcl.edu/helm/rationalunifiedprocess/process/workflow/environm/co_imppr.htm (visited
2012-05-28)

78
Swamidass, Paul M., ed. Encyclopedia of Production and Manufacturing Management. Springer, 2000.
Electronic.
Trochim, W. (2006-10-20). Reliability & Validity. Taken from from Reseach Methods Knowledge
Database: http://www.socialresearchmethods.net/kb/relandval.php (visited 2012-05-15)
11.3 Journals Ottosson, S. (2003) Participation action research: A key to improved knowledge of management.
Technovation Journal. Vol. 23, No. 2, pp. 87-94.
Sheard, S. A., (2003, June 01). Process Implementation. Proceedings , pp. 1-11.
Tenhiälä, A. (2011). Contingency theory of capacity planning: The link between process types and
planning methods . Journal of Operations Management. Vol. 29, No. 1, pp. 65-77.
Verma, R. (1997). Management Science, Theory of Constraints/Optimized Production Technology and
Local Optimization . Omega , Vol. 25, No 2, pp. 189-200.
11.4 Interviews IoS, Älmhult Andrukiewicz, P., (2012-01-27) Process Devoloper, IKEA of Sweden, Älmhult.
Björnsson, P., (2012-02-23) Process Leader, Plan & Secure Capacity, IKEA of Sweden, Älmhult.
Trading, Shenzhen Dong, J., (2012-05-01) Supply Planner, IKEA, Shenzhen.
Du, I., (2012-05-01) Business Developer, IKEA, Shenzhen.
Huang, V., (2012-05-01) Supply Planner, IKEA, Shenzhen.
Zhang, F., (2012-05-01) Business Development Manager, IKEA trading, Shenzhen.

79
Appendix A – Reference case A
Case description
Three Product Groups share a single or a number of Resource Groups together. The production setup
contains of a number of injection molding machines producing parts that is assembled together to the
end product. What makes this production setup a little bit more complicated than other production
setups is that there are dissimilar parts within a Product Group produced in the same machine with only
a tool-change in between. Additional to that there are also other Product Groups sharing that machine.
These means that the sharing is rather complex for this small amount of Product Groups.
Production setup
In the Figure below the production setup is shown with the bottlenecks included. In this production
setup you can see that Tokig salad spinner has two bottlenecks. The bottlenecks are for all Product
Groups the injection machines. The average need of all these Product Groups are rather low, which
makes it possible with this kind of advance sharing.
RM2$
Bolmen$S3$ Bolmen$toil$$roll$holder$
Tokig$salad$$spinner$
IM1$
PACK2$ PACK3$PACK1$
RM3$RM1$
IM2$
IM3$&$IM4$
IM6$&$IM7$
IM9$ IM10$
IM5$
IM8$
IM11$
IM12$
SM$
ASSEMBLY2$ ASSEMBLY3$ASSEMBLY1$

80
Consumption table
Below is the consumption table with the three Product Groups included.
Utilization of each Resource Group by Product Group
New Capacity figures
The capacity allocated by need is given in the table below. The capacities between the Product Groups
will be changed when the SPI changes.
Product Group:
Resource Group Unit
RM Tokig kgRM Bolmen roll holder kgRM S3 tooth brush kgIM Tokig bowl hoursIM Tokig lid hoursIM Tokig net , S3 tooth brush mug lid & S3 soap bottom hoursIM Tokig knob, S3 dispenser lid, S3 Soap top hoursIM Tokig strainer 1, Bolmen roll holder knife & Bolmen roll holder support hours
IM Tokig insert hoursSM Tokig hoursIM Bolmen S3 mug hoursBolmen S3 Assembly hoursBolmen S3 Component piecesBolmen roll Injection frame hoursBolmen roll Assembly hoursTOKIG assembly & Packaging hours
Tool tokig net hours
Tool tokig strainer hoursTool s3 toothbrush mug lid and soap bottom hoursTool bolmen knife and support hours
Tokig salad spinner Bolmen toil roll holder Bolmen S3
Consumption rate Consumption rate Consumption
rate
(Unit/piece) (Unit/piece) (Unit/piece)
0,3630,12
0,16530,0059689920,0056225490,00634058 0,0094166670,001336806 0,0044861110,004301075 0,004930556
0,0036805560,004169408
0,0043055560,002777778
10,0048611110,003472222
0,001555556
0,00634058
0,0043010750,009416667
0,004930556
Capacity
Downtime
(Unit/week) rate (%)
100000100000100000288 12,00%288 12,00%288 12,00%144 12,00%288 12,00%
144 12,00%288 12,00%144 20,00%14410000144 10,00%144144
288 12,00%
288 12,00%144 12,00%144 12,00%
Defect rate (%)
Average for 17 weeks from SPI, starting from the first week after the Lead time+1
0,80% 1,30% 1,00%
15968 1312 2520
Resource Group
RM TokigRM Bolmen roll holderRM S3 tooth brush IM Tokig bowlIM Tokig lidIM Tokig net , S3 tooth brush mug lid & S3 soap bottomIM Tokig knob, S3 dispenser lid, S3 Soap topIM Tokig strainer 1, Bolmen roll holder knife & Bolmen roll holder support IM Tokig insertSM TokigIM Bolmen S3 mugBolmen S3 AssemblyBolmen S3 ComponentBolmen roll Injection frameBolmen roll AssemblyTOKIG assembly & Packaging Tool tokig net Tool tokig strainerTool s3 toothbrush mug lid and soap bottomTool bolmen knife and support
Tokig salad spinner
Bolmen toil roll holder
Bolmen S3
5,8% 0,0% 0,0%0,0% 0,2% 0,0%0,0% 0,0% 0,4%
37,9% 0,0% 0,0%35,7% 0,0% 0,0%49,7% 0,0% 49,7%26,0% 0,0% 26,0%29,9% 29,9% 0,0%
46,7% 0,0% 0,0%26,5% 0,0% 0,0%0,0% 0,0% 9,5%0,0% 0,0% 4,9%0,0% 0,0% 25,5%0,0% 5,0% 0,0%0,0% 3,2% 0,0%
17,4% 0,0% 0,0%
40,3% 0,0% 0,0%
27,3% 0,0% 0,0%0,0% 0,0% 18,9%0,0% 5,2% 0,0%
Utilization given average need
Tokig salad spinner
Bolmen toil roll holder
Bolmen S3
11,8% 0,0% 0,0%0,0% 2,8% 0,0%0,0% 0,0% 0,8%
76,2% 0,0% 0,0%71,8% 0,0% 0,0%
100,0% 0,0% 100,0%52,3% 0,0% 52,3%99,9% 99,9% 0,0%
94,0% 0,0% 0,0%53,3% 0,0% 0,0%0,0% 0,0% 19,1%0,0% 0,0% 9,9%0,0% 0,0% 51,2%0,0% 86,7% 0,0%0,0% 55,7% 0,0%
35,0% 0,0% 0,0%
81,0% 0,0% 0,0%
54,9% 0,0% 0,0%0,0% 0,0% 38,0%0,0% 89,9% 0,0%
Utilization based on capacity allocated by need
Capacity Allocated by NeedTokig salad spinner Bolmen toil roll holder Bolmen S3
32113 22818 5068

81
Appendix B - Reference case B
Case description
In this case 7 Product Groups share a production system. The bottlenecks identified given the values
from the SPI forecast are not the bottlenecks when determining the maximum allocated net capacity.
Production setup
This is the production setup. Note that the bottlenecks highlighted in red are the bottlenecks when the
capacity is maximized.
RM1$
Impuls$jug$w$lid$2l$Krus$jar$w$lid$2,4l$ An8lop$highchair$ Samla$130l$$
Erland$chair$ Tobias$chair$ Samla$55l$
RM2$
RM3$ RM4$ RM5$ RM6$
RM7$
RM8$IM1$
IM3$
IM2$
$$$$$$IM4$
IM5$
IM7$
IM6$
IM8$ IM9$
IM11$
Comp1$ Comp2$ Comp3$
PACK6$PACK1$ PACK2$ PACK3$ PACK4$ PACK5$
IM10$

82
Consumption Table
The breakdown rates for B are all set at 4% as this is an estimate by them and they do not maintain the
exact figures for this.
Utilization of Resource Groups by Product Groups
As shown in the image below the Resource Groups with the highest utilization for each Product Group
shift when the capacity is determined.
Product Group: Impuls jug w lid 2l Krus jar w lid 2,4l Samla 130l Erland chair Antilop highchair Tobias chair Samla 55l
Consumption rate Consumption rate Consumption
rate Consumption
rate Consumption
rate Consumption
rate Consumption
rate
Resource Group Unit (Unit/piece) (Unit/piece) (Unit/piece) (Unit/piece) (Unit/piece) (Unit/piece) (Unit/piece)
RM AS kg 0,3484849 0,2969697RM ABS kg 0,0675758IM 36# hours 0,005555556IM 42# hours 0,00375IM 25# hours 0,003888889IM 64# hours 0,000972222 0,000694444 0,004444444 0,008333333 0,007777778 0,005277778ASSEMBLY Impuls hours 0,002777778PACKING Impuls hours 0,001388889
RM ABS1 kg 0,0525252RM TPE kg 0,0040404IM 59# hours 0,005IM 46# hours 0,004722222IM 47# hours 0,003333333SM TPE hours 0,004444444ASSEMBLY Krus 0,004166667PACKING Krus hours 0,004166667
RM PP kg 3,7636364 1,4RM POM kg 0,018181825RM TPE1 kg 0,3010909 0,112IM 50# hours 0,026666667 0,014722222
RM PP1 kg 1,135RM LDPE kg 0,0105COMP 1 Antilop pieces 1COMP 2 Antilop pieces 1IM 17# hours 0,016666667PACKING Antilop highchr hours 0,002777778
RM PC kg 3,6363636RM TPE2 kg 0,0038384IM 1050# hours 0,044444444COMP Tobias pieces 1
RM HDPE kg 0,0044RM PC/ABS kg 3,0202IM 1# hours 0,041666667COMP Erland pieces 1
Defect rate (%) 0,0205 0,0284 0,0378 0,03 0,025 0,0629 0,0499
10697 840 2009 144 5901 472 3617Average for 17 weeks from SPI, starting from the
first week after the Lead time+1
Capacity
Downtime
(Unit/week) rate (%)
38000200080 4,00%60 4,00%60 4,00%138 4,00%7878
1900050048 4,00%48 4,00%48 4,00%48 4,00%4848
34000100
2000138 4,00%
17000200
1000010000138 4,00%138
48005046 4,00%
1200
25200023 4,00%
5000
Resource Group
RM ASRM ABSIM 36#IM 42#IM 25#IM 64#ASSEMBLY ImpulsPACKING Impuls RM ABS1RM TPEIM 59#IM 46#IM 47#SM TPEASSEMBLY KrusPACKING Krus RM PPRM POMRM TPE1IM 50# RM PP1RM LDPECOMP 1 Antilop COMP 2 Antilop IM 17#PACKING Antilop highchr RM PCRM TPE2IM 1050#COMP Tobias RM HDPERM PC/ABSIM 1#COMP Erland
Impuls jug w lid 2l
Krus jar w lid 2,4l
Samla 130l
Erland chair
Antilop highchair
Tobias chair Samla 55l
10,7% 10,7% 0,0% 0,0% 0,0% 0,0% 0,0%36,9% 0,0% 0,0% 0,0% 0,0% 0,0% 0,0%79,0% 0,0% 0,0% 0,0% 0,0% 0,0% 0,0%71,1% 0,0% 0,0% 0,0% 0,0% 0,0% 0,0%73,7% 0,0% 0,0% 0,0% 0,0% 0,0% 0,0%53,9% 53,9% 53,9% 53,9% 53,9% 53,9% 0,0%38,9% 0,0% 0,0% 0,0% 0,0% 0,0% 0,0%19,4% 0,0% 0,0% 0,0% 0,0% 0,0% 0,0%
0,0% 0,2% 0,0% 0,0% 0,0% 0,0% 0,0%0,0% 0,7% 0,0% 0,0% 0,0% 0,0% 0,0%0,0% 9,4% 0,0% 0,0% 0,0% 0,0% 0,0%0,0% 8,9% 0,0% 0,0% 0,0% 0,0% 0,0%0,0% 6,2% 0,0% 0,0% 0,0% 0,0% 0,0%0,0% 8,3% 0,0% 0,0% 0,0% 0,0% 0,0%0,0% 7,5% 0,0% 0,0% 0,0% 0,0% 0,0%0,0% 7,5% 0,0% 0,0% 0,0% 0,0% 0,0%
0,0% 0,0% 38,7% 0,0% 0,0% 0,0% 38,7%0,0% 0,0% 37,9% 0,0% 0,0% 0,0% 0,0%0,0% 0,0% 52,7% 0,0% 0,0% 0,0% 52,7%0,0% 0,0% 84,2% 0,0% 0,0% 0,0% 84,2%
0,0% 0,0% 0,0% 0,0% 40,4% 0,0% 0,0%0,0% 0,0% 0,0% 0,0% 31,8% 0,0% 0,0%0,0% 0,0% 0,0% 0,0% 60,5% 0,0% 0,0%0,0% 0,0% 0,0% 0,0% 60,5% 0,0% 0,0%0,0% 0,0% 0,0% 0,0% 76,1% 0,0% 0,0%0,0% 0,0% 0,0% 0,0% 12,2% 0,0% 0,0%
0,0% 0,0% 0,0% 0,0% 0,0% 38,0% 0,0%0,0% 0,0% 0,0% 0,0% 0,0% 3,9% 0,0%0,0% 0,0% 0,0% 0,0% 0,0% 50,5% 0,0%0,0% 0,0% 0,0% 0,0% 0,0% 41,8% 0,0%
0,0% 0,0% 0,0% 2,6% 0,0% 0,0% 0,0%0,0% 0,0% 0,0% 22,4% 0,0% 0,0% 0,0%0,0% 0,0% 0,0% 28,0% 0,0% 0,0% 0,0%0,0% 0,0% 0,0% 3,0% 0,0% 0,0% 0,0%
Utilization given average needImpuls jug w lid 2l
Krus jar w lid 2,4l
Samla 130l
Erland chair
Antilop highchair
Tobias chair Samla 55l
19,9% 19,9% 0,0% 0,0% 0,0% 0,0% 0,0%46,7% 0,0% 0,0% 0,0% 0,0% 0,0% 0,0%
100,0% 0,0% 0,0% 0,0% 0,0% 0,0% 0,0%90,0% 0,0% 0,0% 0,0% 0,0% 0,0% 0,0%93,3% 0,0% 0,0% 0,0% 0,0% 0,0% 0,0%77,2% 77,2% 77,2% 77,2% 77,2% 77,2% 0,0%49,2% 0,0% 0,0% 0,0% 0,0% 0,0% 0,0%24,6% 0,0% 0,0% 0,0% 0,0% 0,0% 0,0%
0,0% 2,5% 0,0% 0,0% 0,0% 0,0% 0,0%0,0% 7,4% 0,0% 0,0% 0,0% 0,0% 0,0%0,0% 100,0% 0,0% 0,0% 0,0% 0,0% 0,0%0,0% 94,5% 0,0% 0,0% 0,0% 0,0% 0,0%0,0% 66,7% 0,0% 0,0% 0,0% 0,0% 0,0%0,0% 88,9% 0,0% 0,0% 0,0% 0,0% 0,0%0,0% 80,0% 0,0% 0,0% 0,0% 0,0% 0,0%0,0% 80,0% 0,0% 0,0% 0,0% 0,0% 0,0%
0,0% 0,0% 46,0% 0,0% 0,0% 0,0% 46,0%0,0% 0,0% 45,0% 0,0% 0,0% 0,0% 0,0%0,0% 0,0% 62,6% 0,0% 0,0% 0,0% 62,6%0,0% 0,0% 100,0% 0,0% 0,0% 0,0% 100,0%
0,0% 0,0% 0,0% 0,0% 53,1% 0,0% 0,0%0,0% 0,0% 0,0% 0,0% 41,7% 0,0% 0,0%0,0% 0,0% 0,0% 0,0% 79,5% 0,0% 0,0%0,0% 0,0% 0,0% 0,0% 79,5% 0,0% 0,0%0,0% 0,0% 0,0% 0,0% 100,0% 0,0% 0,0%0,0% 0,0% 0,0% 0,0% 16,0% 0,0% 0,0%
0,0% 0,0% 0,0% 0,0% 0,0% 74,8% 0,0%0,0% 0,0% 0,0% 0,0% 0,0% 7,6% 0,0%0,0% 0,0% 0,0% 0,0% 0,0% 99,4% 0,0%0,0% 0,0% 0,0% 0,0% 0,0% 82,3% 0,0%
0,0% 0,0% 0,0% 9,3% 0,0% 0,0% 0,0%0,0% 0,0% 0,0% 79,9% 0,0% 0,0% 0,0%0,0% 0,0% 0,0% 99,9% 0,0% 0,0% 0,0%0,0% 0,0% 0,0% 10,6% 0,0% 0,0% 0,0%
Utilization based on capacity allocated by need

83
Resulting Capacities
The resulting capacities are shown below. Note that the overwrite capacities are the relevant figures and
show where the iterative procedure was used.
Impuls jug w lid 2l Krus jar w lid 2,4l Samla 130l Erland chair Antilop highchair
Tobias chair Samla 55l
13547 1559 2387 268 7755 876 4298
8964 514 929
Capacity Allocated by Need
Overwrite Capacity

84

85
Appendix C – Reference case C
Case description Three Product Groups shares a single or a number of Resource Groups. The products contain of the same
raw material, silicone and are mainly produced by oil pressure, injection molding and assembling.
Production setup In Figure below the production setup is shown with the bottleneck identified by the red boxes. The bottlenecks identified in the production is the oilpressure machines and injection molding for the Sockerkaka
Consumption table
RM1$
Sockerkaka$bak$mat$knife$
Sockerkaka$bak$$mould$1,5L$
S8nn$oven$$glove$
SM1$
PACKING$
SM6$
SM2$
Baking$
SM3$
SM7$
SM8$
SM9$
SM10$
IM$
SM4$
SM5$
Product Group: Stinn oven gloveSockerkaka bak mould 1,5L
Sockerkaka bak mat knife
Consumption rate Consumption rate Consumption rate
Resource Group Unit (Unit/piece) (Unit/piece) (Unit/piece)
RM- Silicone kg 0,115 0,19 0,106SM- Color mix shared hours 0,001152074 0,001901141SM-Oil pressure STINN hours 0,045833333SM- Trimming hours 0,008333333Baking hours 0,000625 0,005514706 0,002604167Packing hours 0,001296296 0,001666667 0,001833333
SM Oil pressure Sockerkaka bakingmould heartshaped hours 0,045833333SM trimming hours 0,003333333SM colormix not shared hours 0,005899705RM - Clothing kg 0,065SM- Coating hours 0,012218045SM- cutting hours 0,00625SM - printing manually hours 0,008333333SM- printing machine hours 0,004166667RM- PP kg 0,022IM knife hours 0,010416667
Capacity
Downtime
(Unit/week) rate (%)
10000120 0,50%480 3,00%480300 2,50%120
2402401206241202403602301000100 3,00%
Defect rate (%) 5,00% 5,00% 5,00%
18789 6150 5294Average for 17 weeks from SPI, starting from the
first week after the Lead time+1

86
Utilization of each Resource Group by Product Group
New Capacity figures The new capacities calculated in the template gives the capacity allocated by the need. This is the capacity
that should be inserted into GPS.
Resource Group
RM- SiliconeSM- Color mix sharedSM-Oil pressure STINNSM- TrimmingBaking PackingSM Oil pressure Sockerkaka bakingmould heartshapedSM trimmingSM colormix not sharedRM - ClothingSM- CoatingSM- cuttingSM - printing manuallySM- printing machine RM- PPIM knife
Stinn oven glove Sockerkaka bak mould 1,5L
Sockerkaka bak mat knife
40,8% 40,8% 40,8%29,3% 29,3% 0,0%
194,2% 0,0% 0,0%34,3% 0,0% 0,0%21,3% 21,3% 21,3%38,8% 38,8% 38,8%0,0% 123,3% 0,0%0,0% 9,0% 0,0%0,0% 45,3% 45,3%0,0% 0,0% 57,9%0,0% 0,0% 56,6%0,0% 0,0% 14,5%0,0% 0,0% 12,9%0,0% 0,0% 10,1%
55,6% 0,0% 55,6%0,0% 0,0% 59,7%
Utilization given average need
Stinn oven glove Sockerkaka bak mould 1,5L
Sockerkaka bak mat knife
31,5% 31,5% 31,5%18,1% 18,1% 0,0%
100,0% 0,0% 0,0%17,6% 0,0% 0,0%20,3% 20,3% 20,3%32,5% 32,5% 32,5%0,0% 100,0% 0,0%0,0% 7,3% 0,0%0,0% 60,3% 60,3%0,0% 0,0% 97,0%0,0% 0,0% 94,8%0,0% 0,0% 24,3%0,0% 0,0% 21,6%0,0% 0,0% 16,9%
42,8% 0,0% 42,8%0,0% 0,0% 100,0%
Utilization based on capacity allocated by need
Stinn oven gloveSockerkaka bak mould 1,5L
Sockerkaka bak mat knife
9675 4988 8869 Capacity Allocated by NeedOverwrite Capacity

87
Appendix D - Reference case D
Case description
The Fixa Drill stencil is one of three products produced at D.
Production setup
As for all three IKEA products at D the Fixa Drill stencil is produced in a dedicated production line. One
injection machine produces a part that is assembled onto a label in a time-consuming manner.
Consumption Table
The downtime and defect rates for F are set at 1%. The reason for the former is that the machines are
new and rarely experience breakdowns, while the latter stems from a lack of maintaining information on
defects.
Utilization of Resource Groups by Product Groups
In this simple case the injection machine is the bottleneck.
RM#
Fixa_Drill#
IM#
ASSEMBLY#
Product Group: FIXA_DRILL
Consumption rate
Resource Group Unit (Unit/piece)
RM GPPS KG 0,033Injection18# Hours 0,003055556Assembly hours 0,002777778
Capacity
Downtime
(Unit/week) rate (%)
1360126 1,00%126
Defect rate (%) 1,00%
9700Average for 17 weeks from SPI, starting from the
first week after the Lead time+1
Resource Group
RM GPPSInjection18#Assembly
Utilization given average need
FIXA_DRILL
23,8%24,0%21,6%
Utilization based on capacity allocated by need
FIXA_DRILL
99,1%100,0%90,0%

88
Resulting Capacities
The resulting capacities are shown below. As there is no sharing the capacity is constant and independent
of the forecasted need.
FIXA_DRILL
40420 Capacity Allocated by Need
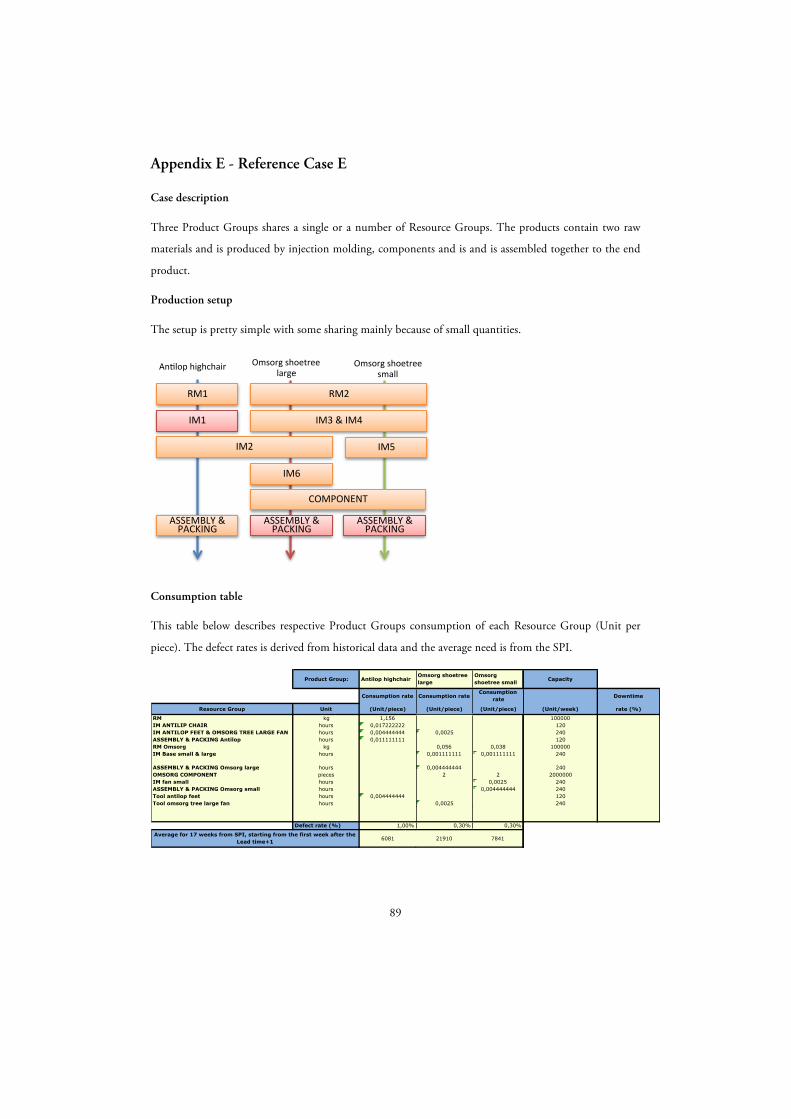
89
Appendix E - Reference Case E
Case description
Three Product Groups shares a single or a number of Resource Groups. The products contain two raw
materials and is produced by injection molding, components and is and is assembled together to the end
product.
Production setup
The setup is pretty simple with some sharing mainly because of small quantities.
Consumption table
This table below describes respective Product Groups consumption of each Resource Group (Unit per
piece). The defect rates is derived from historical data and the average need is from the SPI.
Omsorg'shoetree''small'
Omsorg'shoetree''large'
RM2'
An2lop'highchair'
IM1' IM3'&'IM4'
IM2' IM5'
IM6'
RM1'
COMPONENT'
ASSEMBLY'&'PACKING'
ASSEMBLY'&'PACKING'
ASSEMBLY'&'PACKING'
Product Group: Antilop highchair
Consumption rate
Resource Group Unit (Unit/piece)
RM kg 1,156IM ANTILIP CHAIR hours 0,017222222IM ANTILOP FEET & OMSORG TREE LARGE FAN hours 0,004444444ASSEMBLY & PACKING Antilop hours 0,011111111RM Omsorg kgIM Base small & large hours
ASSEMBLY & PACKING Omsorg large hoursOMSORG COMPONENT piecesIM fan small hoursASSEMBLY & PACKING Omsorg small hoursTool antilop feet hours 0,004444444Tool omsorg tree large fan hours
Omsorg shoetree large
Omsorg shoetree small
Consumption rate Consumption
rate
(Unit/piece) (Unit/piece)
0,0025
0,056 0,0380,001111111 0,001111111
0,0044444442 2
0,00250,004444444
0,0025
Capacity
Downtime
(Unit/week) rate (%)
100000120240120
100000240
2402000000240240120240
Defect rate (%) 1,00%
6081Average for 17 weeks from SPI, starting from the first week after the
Lead time+1
0,30% 0,30%
21910 7841

90
Utilization of each Resource Group by Product Group
The table below shows the different Resource Groups utilization from each Product Group and the
template will automatically show the bottlenecks with the highest utilization in red. As we can see in the
table the IM “ANTILOP CHAIR”, ASSEMBLY & PACKING Omsorg large and ASSEMBLY &
PACKING Omsorg small is the bottlenecks.
Resulting Capacities
The new capacities calculated in the template gives the capacity allocated by the need. This is the capacity
that should be inserted into GPS. Because the Omsorg shoetree large and small has the same assembly
and packing time and this is the bottleneck, they gets the same capacity number as shown in table below.
Resource Group
RMIM ANTILIP CHAIRIM ANTILOP FEET & OMSORG TREE LARGE FANASSEMBLY & PACKING AntilopRM OmsorgIM Base small & large ASSEMBLY & PACKING Omsorg largeOMSORG COMPONENTIM fan smallASSEMBLY & PACKING Omsorg smallTool antilop feetTool omsorg tree large fan
Antilop highchair
7,1%88,1%34,3%56,9%0,0%0,0%
0,0%0,0%0,0%0,0%
22,7%0,0%
Utilization given average needOmsorg shoetree large
Omsorg shoetree small
0,0% 0,0%0,0% 0,0%
34,3% 0,0%0,0% 0,0%1,5% 1,5%
13,8% 13,8%
40,7% 0,0%3,0% 3,0%0,0% 8,2%0,0% 14,6%0,0% 0,0%
22,9% 0,0%
Utilization given average need
Antilop highchair
8,1%100,0%69,2%64,5%0,0%0,0%
0,0%0,0%0,0%0,0%
25,8%0,0%
Utilization based on capacity allocated by needOmsorg shoetree large
Omsorg shoetree small
0,0% 0,0%0,0% 0,0%
69,2% 0,0%0,0% 0,0%5,1% 5,1%
50,0% 50,0%
100,0% 0,0%10,8% 10,8%0,0% 56,3%0,0% 100,0%0,0% 0,0%
56,3% 0,0%
Utilization based on capacity allocated by need
Capacity Allocated by NeedOverwrite Capacity
6899
Antilop highchair Omsorg shoetree large
Omsorg shoetree small
53839 53839

91
Appendix F - Reference case F
Case description
At the time of the visit to F the production of Samla 22l box had not started yet, but was due to start in
the near future. This Product Group’s tool was to be used in two injection machines currently dedicated
to two separate products. This meant that all Product Groups could use both injection machines in that
Resource Groups but not at the same time. Therefore the tool capacity is used to constrain the capacity.
Production setup
Without any current need for the Samla 22l box the two injection machines are essentially dedicated
Samla 5l box and Trofast lid respectively. This means that the Resource Groups IM3/IM4 is the
bottleneck and the capacity allocation is restricted by the fact that each Product Group only has one tool.
Consumption Table
The breakdown rates for F are set at 2.5% and the defect rates are set at 2%. This is because they
currently do not maintain figures for it and have chosen these figures from experience. The figures for the
weekly capacities of the raw materials are entered as a high figure as they have no figures for this either.
Trofast(box(10(
RM1(
Samla(5l(Samla(11l( Samla(22l( Trofast(box(23(Samla(lid(f(box(11/22l( Trofast(box(36(
IM7(IM1( IM2( IM3/IM4( IM5( IM6(
PACK1( PACK2( PACK3( PACK4( PACK5(
Trofast(lid(42x28(
RM2(
PACK6( PACK7( PACK8(
TOOL1( TOOL2( TOOL3(
Product Group: Samla 5l Samla 11lSamla lid f box 11/22l Samla 22l
Consumption rateConsumption
rate Consumption
rate Consumption
rate
Resource Group Unit (Unit/piece) (Unit/piece) (Unit/piece) (Unit/piece)
Raw Material 348 Kg 0,214 0,42111 0,164
packing samla 5l box (!!) hours 0,002138889
injection 33# hours 0,008055556packing samla 11l box (!!) pieces 0,000555556
injection 34# hours 0,006111111packing samla 11l lid ���� hours 0,000527778
hourspacka samla 22l box hours
injection 36# hourspacka samla 5l lid hours
Raw Material BJ550 Kginjection 32# hourspacking trofast 10h box (!!) hours
injection 33# hourspacking trofast 23h box (!!) hours
injection 34# hourspacking trofast 36 box ���� hours
packing trofast lid ���� hours
injection 29#, 30# hours 0,003194444 0,006388889
tool s5lb (injection 29#, 30#) hours 0,003194444tool s22lb (injection 29#, 30#) hours 0,006388889tool tl (injection 29#, 30#) hours
Defect rate (%) 2,00% 2,00% 2,00% 2,00%
29100 16042 24969 0Average for 17 weeks from SPI, starting from the first
week after the Lead time+1
Trofast box 10 Trofast box 23 Trofast box 36 Trofast lid 42x28
Consumption rate
Consumption rate Consumption rate Consumption rate
(Unit/piece) (Unit/piece) (Unit/piece) (Unit/piece)
0,35547 0,54435 0,78536 0,181620,0075
0,002155278
0,0083333330,001666667
0,0091666670,002083333
0,0003125
0,003333333
0,003333333
2,00% 2,00% 2,00% 2,00%
5964 5029 2127 16141
Capacity
Downtime
(Unit/week) rate (%)
100000
138
138 2,50%138
138 2,50%138
100000138 2,50%138
138 2,50%138
138 2,50%138
138
276 2,50%
138 2,50%138 2,50%138 2,50%
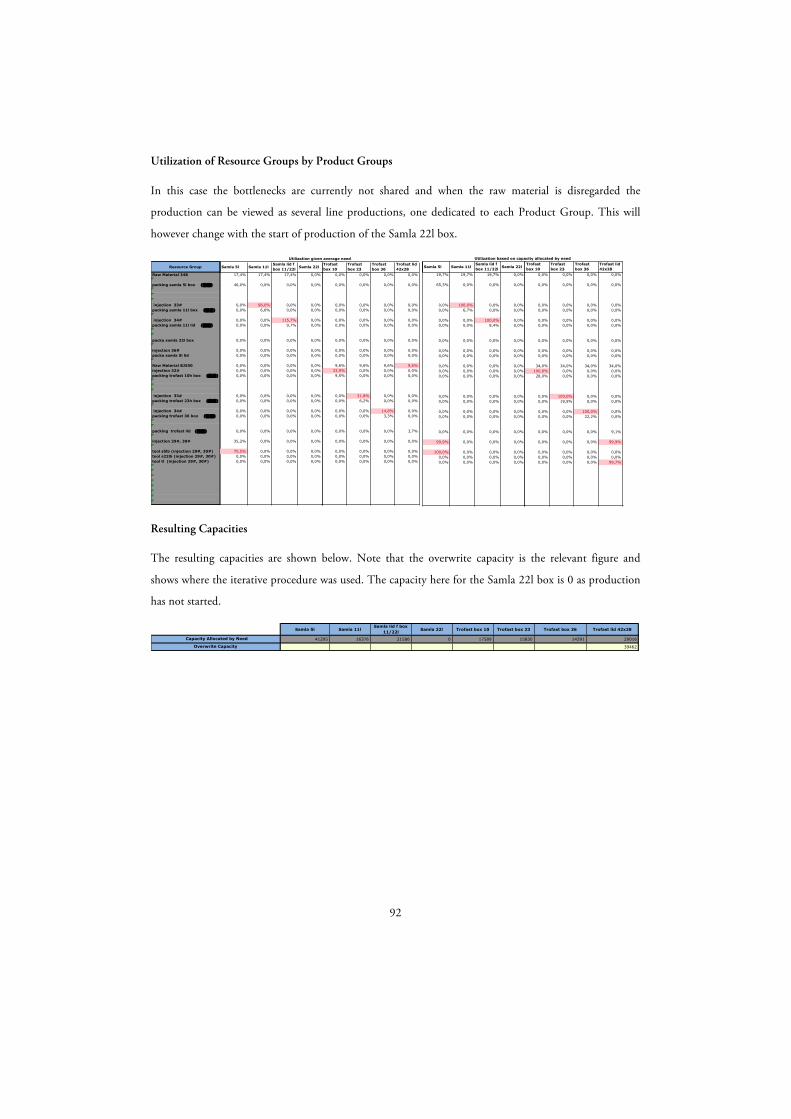
92
Utilization of Resource Groups by Product Groups
In this case the bottlenecks are currently not shared and when the raw material is disregarded the
production can be viewed as several line productions, one dedicated to each Product Group. This will
however change with the start of production of the Samla 22l box.
Resulting Capacities
The resulting capacities are shown below. Note that the overwrite capacity is the relevant figure and
shows where the iterative procedure was used. The capacity here for the Samla 22l box is 0 as production
has not started.
Resource Group
Raw Material 348 packing samla 5l box (!!) injection 33#packing samla 11l box (!!) injection 34#packing samla 11l lid (!!) packa samla 22l box injection 36#packa samla 5l lid Raw Material BJ550 injection 32#packing trofast 10h box (!!) injection 33#packing trofast 23h box (!!) injection 34#packing trofast 36 box (!!) packing trofast lid (!!) injection 29#, 30# tool s5lb (injection 29#, 30#)tool s22lb (injection 29#, 30#)tool tl (injection 29#, 30#)
Samla 5l Samla 11lSamla lid f box 11/22l Samla 22l
17,4% 17,4% 17,4% 0,0%
46,0% 0,0% 0,0% 0,0%
0,0% 98,0% 0,0% 0,0%0,0% 6,6% 0,0% 0,0%
0,0% 0,0% 115,7% 0,0%0,0% 0,0% 9,7% 0,0%
0,0% 0,0% 0,0% 0,0%
0,0% 0,0% 0,0% 0,0%0,0% 0,0% 0,0% 0,0%
0,0% 0,0% 0,0% 0,0%0,0% 0,0% 0,0% 0,0%0,0% 0,0% 0,0% 0,0%
0,0% 0,0% 0,0% 0,0%0,0% 0,0% 0,0% 0,0%
0,0% 0,0% 0,0% 0,0%0,0% 0,0% 0,0% 0,0%
0,0% 0,0% 0,0% 0,0%
35,2% 0,0% 0,0% 0,0%
70,5% 0,0% 0,0% 0,0%0,0% 0,0% 0,0% 0,0%0,0% 0,0% 0,0% 0,0%
Utilization given average needTrofast box 10
Trofast box 23
Trofast box 36
Trofast lid 42x28
0,0% 0,0% 0,0% 0,0%
0,0% 0,0% 0,0% 0,0%
0,0% 0,0% 0,0% 0,0%0,0% 0,0% 0,0% 0,0%
0,0% 0,0% 0,0% 0,0%0,0% 0,0% 0,0% 0,0%
0,0% 0,0% 0,0% 0,0%
0,0% 0,0% 0,0% 0,0%0,0% 0,0% 0,0% 0,0%
9,6% 9,6% 9,6% 9,6%
33,9% 0,0% 0,0% 0,0%9,5% 0,0% 0,0% 0,0%
0,0% 31,8% 0,0% 0,0%0,0% 6,2% 0,0% 0,0%
0,0% 0,0% 14,8% 0,0%0,0% 0,0% 3,3% 0,0%
0,0% 0,0% 0,0% 3,7%
0,0% 0,0% 0,0% 0,0%
0,0% 0,0% 0,0% 0,0%0,0% 0,0% 0,0% 0,0%0,0% 0,0% 0,0% 0,0%
Utilization given average need
Samla 5l Samla 11lSamla lid f box 11/22l Samla 22l
19,7% 19,7% 19,7% 0,0%
65,3% 0,0% 0,0% 0,0%
0,0% 100,0% 0,0% 0,0%0,0% 6,7% 0,0% 0,0%
0,0% 0,0% 100,0% 0,0%0,0% 0,0% 8,4% 0,0%
0,0% 0,0% 0,0% 0,0%
0,0% 0,0% 0,0% 0,0%0,0% 0,0% 0,0% 0,0%
0,0% 0,0% 0,0% 0,0%0,0% 0,0% 0,0% 0,0%0,0% 0,0% 0,0% 0,0%
0,0% 0,0% 0,0% 0,0%0,0% 0,0% 0,0% 0,0%
0,0% 0,0% 0,0% 0,0%0,0% 0,0% 0,0% 0,0%
0,0% 0,0% 0,0% 0,0%
99,9% 0,0% 0,0% 0,0%
100,0% 0,0% 0,0% 0,0%0,0% 0,0% 0,0% 0,0%0,0% 0,0% 0,0% 0,0%
Utilization based on capacity allocated by needTrofast box 10
Trofast box 23
Trofast box 36
Trofast lid 42x28
0,0% 0,0% 0,0% 0,0%
0,0% 0,0% 0,0% 0,0%
0,0% 0,0% 0,0% 0,0%0,0% 0,0% 0,0% 0,0%
0,0% 0,0% 0,0% 0,0%0,0% 0,0% 0,0% 0,0%
0,0% 0,0% 0,0% 0,0%
0,0% 0,0% 0,0% 0,0%0,0% 0,0% 0,0% 0,0%
34,0% 34,0% 34,0% 34,0%
100,0% 0,0% 0,0% 0,0%28,0% 0,0% 0,0% 0,0%
0,0% 100,0% 0,0% 0,0%0,0% 19,5% 0,0% 0,0%
0,0% 0,0% 100,0% 0,0%0,0% 0,0% 22,2% 0,0%
0,0% 0,0% 0,0% 9,1%
0,0% 0,0% 0,0% 99,9%
0,0% 0,0% 0,0% 0,0%0,0% 0,0% 0,0% 0,0%0,0% 0,0% 0,0% 99,7%
Utilization based on capacity allocated by need
Samla 5l Samla 11lSamla lid f box
11/22l Samla 22l
41295 16376 21586 0 Capacity Allocated by Need
Overwrite Capacity
Trofast box 10 Trofast box 23 Trofast box 36 Trofast lid 42x28
17589 15830 14391 29016
39462

93
Appendix G - Reference case G
Case description
This is the most complicated case experienced in this thesis. 15 Product Groups belong to the same
production as they share Resource Groups in a very complicated manner. The case also contains the
complication of Product Groups using Resource Groups without being able to use the entire capacity of
those Resource Groups due to a restricted number of tools.
Production setup
The production looks as follows with the bottlenecks highlighted:
Consumption Table
For the purpose of presenting the consumption table on these pages in an esthetic way it is split into two
to fit the page, but in the template it is maintained as one long table.
Smaska&cutlery&
IM6&
COMP&
Jämka&food&svr&0,3l&
Jämka&food&svr&0,5l& Jämka&
food&svr&w&lid&s4&
Jämka&food&svr&20x14x4& Jämka&
food&svr&20x14x6&
Jämka&food&svr&20x14x10& Smaska&
spoon&
Smaska&plate&
Smaska&bowl&
Smaska&beaker&
IM2&
RM3&
RM2&
IM3&
RM4&
OM&
IM1&
IM5&
IM8&
SM&
ASSEMBLY2& PACK2&
PACK3&
PACK4&
PACK5&
PACK6&
Godmorgon&stor&ut&s3&
Jämka&jar&w&lid&s2&1,1/1,9l&Jämka&jar&
w&lid&s2&2,5/3,5l&
Jämka&jug&w&lid&1,7l&
PACK1&
IM4&
ASSEMBLY1&
RM1&
TOOL2&
TOOL1&
TOOL4&TOOL3& TOOL
7&
IM7&
TOOL5&
TOOL6&

94
Utilization of Resource Groups by Product Groups
In this case several Product Groups have multiple bottlenecks with the allocated capacity.
Product Group:JÄMKA_FOOD_SVR
_0,3LJÄMKA_FOOD_SVR
_0,5LJÄMKA_FOOD_SVR
_W_LID_S4JÄMKA_FOOD_SVR
_20X14X4JÄMKA_FOOD_SVR
_20X14X6JÄMKA_FOOD_SVR
_20X14X10 SMASKA_SPOON SMASKA_PLATE
Consumption rate Consumption rate Consumption rate Consumption rate Consumption rate Consumption rate Consumption rate Consumption rate
Resource Group Unit (Unit/piece) (Unit/piece) (Unit/piece) (Unit/piece) (Unit/piece) (Unit/piece) (Unit/piece) (Unit/piece)
RM PPR KG 0,13371 0,16665 0,24862 0,1995 0,246 0,285 0,051 0,309RM PE KG 0,08511 0,08511 0,14224 0,12825 0,12825 0,12825RM PPC KGCOMP SMASKA_CUTLERY PIECESIM #9/#10/#11 HOURS 0,004166667OM #12 HOURSIM #13/#14/#21 HOURS 0,002638889 0,007916667 0,01 0,00625IM #15 HOURSIM #5IM #16 HOURS 0,001597222 0,004791667IM #17 HOURS 0,001666667 0,0025 0,0025 0,0025IM #18 HOURS 0,003125 0,003125 0,002083333IM #19 HOURS 0,005 0,004375 0,003125
SM SHRINK JÄMKA HOURS 0,000694444 0,000694444 0,000694444 0,000694444 0,000694444 0,000694444ASSEMBLY JÄMKA JARS HOURSASSEMBLY JÄMKA HOURS 0,000277778 0,000277778 0,000277778 0,000277778 0,000277778 0,000277778TOOL JÄMKA_JAR_1,1/1,9L IM#13 HOURSTOOL JÄMKA_JAR_2,5/3,5L IM#13 HOURS
TOOL SMASKA_BEAKER HOURSTOOL JÄMKA_X4_BOX hours 0,002638889 0,007916667TOOL JÄMKA_X10_BOX hours 0,01PACK SMASKA_SPOON hours 0,000277778PACK SMASKA_PLATE hours 0,000277778PACK SMASKA_CUTLERY hoursPACK SMASKA_BEAKER hoursPACK SMASKA_BOWL hoursPACK JÄMKA JUG hoursTOOL SMASKA_BOWL HOURSTOOL SMASKA_PLATE HOURS 0,004166667RM PC kgASSEMBLY GOMORGON hours
Defect rate (%) 0,10% 0,10% 0,10% 0,10% 0,10% 0,10% 0,10% 0,20%
3356 4339 7906 2990 9171 7985 5845 13120Average for 17 weeks from SPI, starting from the
first week after the Lead time+1
Capacity
Downtime
(Unit/week) rate (%)
10000010000010000020000432 20,80%144 31,00%432 16,50%144 15,00%144 18,00%144 16,00%144 16,00%144 13,00%144 17,00%
120 5,00%120120144 16,00%144 16,00%
144 20,80%144 16,00%144 16,00%120120120120120120144 20,80%144 20,80%10000120
Product Group:
Resource Group Unit
RM PPR KGRM PE KGRM PPC KGCOMP SMASKA_CUTLERY PIECESIM #9/#10/#11 HOURSOM #12 HOURSIM #13/#14/#21 HOURSIM #15 HOURSIM #5IM #16 HOURSIM #17 HOURSIM #18 HOURSIM #19 HOURS
SM SHRINK JÄMKA HOURSASSEMBLY JÄMKA JARS HOURSASSEMBLY JÄMKA HOURSTOOL JÄMKA_JAR_1,1/1,9L IM#13 HOURSTOOL JÄMKA_JAR_2,5/3,5L IM#13 HOURS
TOOL SMASKA_BEAKER HOURSTOOL JÄMKA_X4_BOX hoursTOOL JÄMKA_X10_BOX hoursPACK SMASKA_SPOON hoursPACK SMASKA_PLATE hoursPACK SMASKA_CUTLERY hoursPACK SMASKA_BEAKER hoursPACK SMASKA_BOWL hoursPACK JÄMKA JUG hoursTOOL SMASKA_BOWL HOURSTOOL SMASKA_PLATE HOURSRM PC kgASSEMBLY GOMORGON hours
Defect rate (%)
Average for 17 weeks from SPI, starting from the first week after the Lead time+1
SMASKA_CUTLERY SMASKA_BEAKER SMASKA_BOWLJÄMKA_JAR_WITH_LID_S2_1,1/1,9L
JÄMKA_JAR_WITH_LID_S2_2,5/3,5L
JÄMKA_JUG_WITH_LID_1,7L
GOMORGON_STOR_UT_S3 Capacity
Consumption rate Consumption rate Consumption rate Consumption rate Consumption rate Consumption rate Consumption rate Downtime
(Unit/piece) (Unit/piece) (Unit/piece) (Unit/piece) (Unit/piece) (Unit/piece) (Unit/piece) (Unit/week) rate (%)
0,027 0,189 0,271 0,428 0,158 1000000,056 0,046 0,066 1000000,026 0,016 0,026 0,049 100000
1 200000,0025 0,004444444 432 20,80%
0,004791667 0,005277778 144 31,00%0,001944444 0,002083333 432 16,50%0,009166667 0,008888889 0,011944444 144 15,00%
0,007777778 144 18,00%144 16,00%144 16,00%
0,002916667 0,003888889 0,005 0,002638889 144 13,00%144 17,00%
0,000277778 0,000277778 120 5,00%0,000277778 0,000277778 120
1200,001944444 144 16,00%
0,002083333 144 16,00%
0,0025 144 20,80%144 16,00%144 16,00%120120
0,000277778 1200,000277778 120
0,000277778 1200,000277778 120
0,004444444 144 20,80%144 20,80%
0,845 100000,011944444 120
0,10% 0,20% 0,20% 0,20% 0,20% 0,20% 0,80%
10006 11175 10768 2231 3964 3028 2414
Resource Group
RM PPRRM PERM PPCCOMP SMASKA_CUTLERYIM #9/#10/#11OM #12IM #13/#14/#21IM #15IM #5IM #16IM #17IM #18IM #19 SM SHRINK JÄMKAASSEMBLY JÄMKA JARSASSEMBLY JÄMKATOOL JÄMKA_JAR_1,1/1,9L IM#13TOOL JÄMKA_JAR_2,5/3,5L IM#13 TOOL SMASKA_BEAKER IM#11TOOL JÄMKA_X4_BOXTOOL JÄMKA_X10_BOXPACK SMASKA_SPOONPACK SMASKA_PLATEPACK SMASKA_CUTLERYPACK SMASKA_BEAKERPACK SMASKA_BOWLPACK JÄMKA JUGTOOL SMASKA_BOWL TOOL SMASKA_PLATERM PCASSEMBLY GOMORGON
JÄMKA_FOOD_SVR_0,3L
JÄMKA_FOOD_SVR_0,5L
JÄMKA_FOOD_SVR_W_LID_S4
JÄMKA_FOOD_SVR_20X14X4
JÄMKA_FOOD_SVR_20X14X6
JÄMKA_FOOD_SVR_20X14X10
SMASKA_SPOON SMASKA_PLATE SMASKA_CUTLERY
SMASKA_BEAKER
SMASKA_BOWLJÄMKA_JAR_WITH_LID_S2_1,1/1,9L
JÄMKA_JAR_WITH_LID_S2_2,5/3,5L
JÄMKA_JUG_WITH_LID_1,7L
GOMORGON_STOR_UT_S3
17,7% 17,7% 17,7% 17,7% 17,7% 17,7% 17,7% 17,7% 17,7% 0,0% 17,7% 17,7% 17,7% 17,7% 0,0%5,4% 5,4% 5,4% 5,4% 5,4% 5,4% 0,0% 0,0% 0,0% 5,4% 0,0% 5,4% 5,4% 0,0% 0,0%0,0% 0,0% 0,0% 0,0% 0,0% 0,0% 0,0% 0,0% 0,0% 0,6% 0,0% 0,6% 0,6% 0,6% 0,0%0,0% 0,0% 0,0% 0,0% 0,0% 0,0% 0,0% 0,0% 50,1% 0,0% 0,0% 0,0% 0,0% 0,0% 0,0%0,0% 0,0% 0,0% 0,0% 0,0% 0,0% 0,0% 38,2% 0,0% 38,2% 38,2% 0,0% 0,0% 0,0% 0,0%0,0% 0,0% 0,0% 0,0% 0,0% 0,0% 0,0% 0,0% 107,8% 107,8% 0,0% 0,0% 0,0% 0,0% 0,0%0,0% 0,0% 48,2% 48,2% 0,0% 48,2% 48,2% 0,0% 0,0% 0,0% 0,0% 48,2% 48,2% 0,0% 0,0%0,0% 0,0% 0,0% 0,0% 0,0% 0,0% 0,0% 0,0% 0,0% 0,0% 0,0% 62,5% 0,0% 62,5% 62,5%0,0% 0,0% 0,0% 0,0% 0,0% 0,0% 0,0% 0,0% 0,0% 0,0% 0,0% 0,0% 26,2% 0,0% 0,0%0,0% 0,0% 46,8% 0,0% 46,8% 0,0% 0,0% 0,0% 0,0% 0,0% 0,0% 0,0% 0,0% 0,0% 0,0%0,0% 0,0% 52,6% 52,6% 52,6% 52,6% 0,0% 0,0% 0,0% 0,0% 0,0% 0,0% 0,0% 0,0% 0,0%
87,6% 87,6% 87,6% 0,0% 0,0% 0,0% 0,0% 0,0% 0,0% 87,6% 0,0% 87,6% 87,6% 87,6% 0,0%50,6% 50,6% 50,6% 0,0% 0,0% 0,0% 0,0% 0,0% 0,0% 0,0% 0,0% 0,0% 0,0% 0,0% 0,0%
23,3% 23,3% 23,3% 23,3% 23,3% 23,3% 0,0% 0,0% 0,0% 0,0% 0,0% 23,3% 23,3% 0,0% 0,0%0,0% 0,0% 0,0% 0,0% 0,0% 0,0% 0,0% 0,0% 0,0% 0,0% 0,0% 1,4% 1,4% 0,0% 0,0%8,3% 8,3% 8,3% 8,3% 8,3% 8,3% 0,0% 0,0% 0,0% 0,0% 0,0% 0,0% 0,0% 0,0% 0,0%0,0% 0,0% 0,0% 0,0% 0,0% 0,0% 0,0% 0,0% 0,0% 0,0% 0,0% 3,6% 0,0% 0,0% 0,0%0,0% 0,0% 0,0% 0,0% 0,0% 0,0% 0,0% 0,0% 0,0% 0,0% 0,0% 0,0% 6,8% 0,0% 0,0%
0,0% 0,0% 0,0% 0,0% 0,0% 0,0% 0,0% 0,0% 0,0% 24,5% 0,0% 0,0% 0,0% 0,0% 0,0%0,0% 0,0% 36,9% 36,9% 0,0% 0,0% 0,0% 0,0% 0,0% 0,0% 0,0% 0,0% 0,0% 0,0% 0,0%0,0% 0,0% 0,0% 0,0% 0,0% 66,1% 0,0% 0,0% 0,0% 0,0% 0,0% 0,0% 0,0% 0,0% 0,0%0,0% 0,0% 0,0% 0,0% 0,0% 0,0% 1,4% 0,0% 0,0% 0,0% 0,0% 0,0% 0,0% 0,0% 0,0%0,0% 0,0% 0,0% 0,0% 0,0% 0,0% 0,0% 3,0% 0,0% 0,0% 0,0% 0,0% 0,0% 0,0% 0,0%0,0% 0,0% 0,0% 0,0% 0,0% 0,0% 0,0% 0,0% 2,3% 0,0% 0,0% 0,0% 0,0% 0,0% 0,0%0,0% 0,0% 0,0% 0,0% 0,0% 0,0% 0,0% 0,0% 0,0% 2,6% 0,0% 0,0% 0,0% 0,0% 0,0%0,0% 0,0% 0,0% 0,0% 0,0% 0,0% 0,0% 0,0% 0,0% 0,0% 2,5% 0,0% 0,0% 0,0% 0,0%0,0% 0,0% 0,0% 0,0% 0,0% 0,0% 0,0% 0,0% 0,0% 0,0% 0,0% 0,0% 0,0% 0,7% 0,0%0,0% 0,0% 0,0% 0,0% 0,0% 0,0% 0,0% 0,0% 0,0% 0,0% 42,0% 0,0% 0,0% 0,0% 0,0%0,0% 0,0% 0,0% 0,0% 0,0% 0,0% 0,0% 48,0% 0,0% 0,0% 0,0% 0,0% 0,0% 0,0% 0,0%0,0% 0,0% 0,0% 0,0% 0,0% 0,0% 0,0% 0,0% 0,0% 0,0% 0,0% 0,0% 0,0% 0,0% 20,6%0,0% 0,0% 0,0% 0,0% 0,0% 0,0% 0,0% 0,0% 0,0% 0,0% 0,0% 0,0% 0,0% 0,0% 24,2%
Utilization based on average need

95
Resulting Capacities
The resulting capacities are shown below. Note that the overwrite capacity is the relevant figure and
shows where the iterative procedure was used. Because of the complexity of the production setup the
iterative procedure was used for 10 of the 15 Product Groups.
Resource Group
RM PPRRM PERM PPCCOMP SMASKA_CUTLERYIM #9/#10/#11OM #12IM #13/#14/#21IM #15IM #5IM #16IM #17IM #18IM #19 SM SHRINK JÄMKAASSEMBLY JÄMKA JARSASSEMBLY JÄMKATOOL JÄMKA_JAR_1,1/1,9L IM#13TOOL JÄMKA_JAR_2,5/3,5L IM#13 TOOL SMASKA_BEAKER IM#11TOOL JÄMKA_X4_BOXTOOL JÄMKA_X10_BOXPACK SMASKA_SPOONPACK SMASKA_PLATEPACK SMASKA_CUTLERYPACK SMASKA_BEAKERPACK SMASKA_BOWLPACK JÄMKA JUGTOOL SMASKA_BOWL TOOL SMASKA_PLATERM PCASSEMBLY GOMORGON
JÄMKA_FOOD_SVR_0,3L
JÄMKA_FOOD_SVR_0,5L
JÄMKA_FOOD_SVR_W_LID_S4
JÄMKA_FOOD_SVR_20X14X4
JÄMKA_FOOD_SVR_20X14X6
JÄMKA_FOOD_SVR_20X14X10
SMASKA_SPOON SMASKA_PLATE SMASKA_CUTLERY
SMASKA_BEAKER
SMASKA_BOWLJÄMKA_JAR_WITH_LID_S2_1,1/1,9L
JÄMKA_JAR_WITH_LID_S2_2,5/3,5L
JÄMKA_JUG_WITH_LID_1,7L
GOMORGON_STOR_UT_S3
32,4% 32,4% 32,4% 32,4% 32,4% 32,4% 32,4% 32,4% 32,4% 0,0% 32,4% 32,4% 32,4% 32,4% 0,0%8,6% 8,6% 8,6% 8,6% 8,6% 8,6% 0,0% 0,0% 0,0% 8,6% 0,0% 8,6% 8,6% 0,0% 0,0%0,0% 0,0% 0,0% 0,0% 0,0% 0,0% 0,0% 0,0% 0,0% 0,6% 0,0% 0,6% 0,6% 0,6% 0,0%0,0% 0,0% 0,0% 0,0% 0,0% 0,0% 0,0% 0,0% 46,5% 0,0% 0,0% 0,0% 0,0% 0,0% 0,0%0,0% 0,0% 0,0% 0,0% 0,0% 0,0% 0,0% 74,3% 0,0% 74,3% 74,3% 0,0% 0,0% 0,0% 0,0%0,0% 0,0% 0,0% 0,0% 0,0% 0,0% 0,0% 0,0% 100,0% 100,0% 0,0% 0,0% 0,0% 0,0% 0,0%0,0% 0,0% 100,0% 100,0% 0,0% 100,0% 100,0% 0,0% 0,0% 0,0% 0,0% 100,0% 100,0% 0,0% 0,0%0,0% 0,0% 0,0% 0,0% 0,0% 0,0% 0,0% 0,0% 0,0% 0,0% 0,0% 100,0% 0,0% 100,0% 100,0%0,0% 0,0% 0,0% 0,0% 0,0% 0,0% 0,0% 0,0% 0,0% 0,0% 0,0% 0,0% 32,2% 0,0% 0,0%0,0% 0,0% 100,0% 0,0% 100,0% 0,0% 0,0% 0,0% 0,0% 0,0% 0,0% 0,0% 0,0% 0,0% 0,0%0,0% 0,0% 100,0% 100,0% 100,0% 100,0% 0,0% 0,0% 0,0% 0,0% 0,0% 0,0% 0,0% 0,0% 0,0%
100,0% 100,0% 100,0% 0,0% 0,0% 0,0% 0,0% 0,0% 0,0% 100,0% 0,0% 100,0% 100,0% 100,0% 0,0%62,4% 62,4% 62,4% 0,0% 0,0% 0,0% 0,0% 0,0% 0,0% 0,0% 0,0% 0,0% 0,0% 0,0% 0,0%
39,1% 39,1% 39,1% 39,1% 39,1% 39,1% 0,0% 0,0% 0,0% 0,0% 0,0% 39,1% 39,1% 0,0% 0,0%0,0% 0,0% 0,0% 0,0% 0,0% 0,0% 0,0% 0,0% 0,0% 0,0% 0,0% 1,8% 1,8% 0,0% 0,0%
14,1% 14,1% 14,1% 14,1% 14,1% 14,1% 0,0% 0,0% 0,0% 0,0% 0,0% 0,0% 0,0% 0,0% 0,0%0,0% 0,0% 0,0% 0,0% 0,0% 0,0% 0,0% 0,0% 0,0% 0,0% 0,0% 4,4% 0,0% 0,0% 0,0%0,0% 0,0% 0,0% 0,0% 0,0% 0,0% 0,0% 0,0% 0,0% 0,0% 0,0% 0,0% 8,4% 0,0% 0,0%
0,0% 0,0% 0,0% 0,0% 0,0% 0,0% 0,0% 0,0% 0,0% 22,8% 0,0% 0,0% 0,0% 0,0% 0,0%0,0% 0,0% 72,3% 72,3% 0,0% 0,0% 0,0% 0,0% 0,0% 0,0% 0,0% 0,0% 0,0% 0,0% 0,0%0,0% 0,0% 0,0% 0,0% 0,0% 100,0% 0,0% 0,0% 0,0% 0,0% 0,0% 0,0% 0,0% 0,0% 0,0%0,0% 0,0% 0,0% 0,0% 0,0% 0,0% 5,1% 0,0% 0,0% 0,0% 0,0% 0,0% 0,0% 0,0% 0,0%0,0% 0,0% 0,0% 0,0% 0,0% 0,0% 0,0% 6,3% 0,0% 0,0% 0,0% 0,0% 0,0% 0,0% 0,0%0,0% 0,0% 0,0% 0,0% 0,0% 0,0% 0,0% 0,0% 2,2% 0,0% 0,0% 0,0% 0,0% 0,0% 0,0%0,0% 0,0% 0,0% 0,0% 0,0% 0,0% 0,0% 0,0% 0,0% 2,4% 0,0% 0,0% 0,0% 0,0% 0,0%0,0% 0,0% 0,0% 0,0% 0,0% 0,0% 0,0% 0,0% 0,0% 0,0% 5,9% 0,0% 0,0% 0,0% 0,0%0,0% 0,0% 0,0% 0,0% 0,0% 0,0% 0,0% 0,0% 0,0% 0,0% 0,0% 0,0% 0,0% 0,9% 0,0%0,0% 0,0% 0,0% 0,0% 0,0% 0,0% 0,0% 0,0% 0,0% 0,0% 100,0% 0,0% 0,0% 0,0% 0,0%0,0% 0,0% 0,0% 0,0% 0,0% 0,0% 0,0% 100,0% 0,0% 0,0% 0,0% 0,0% 0,0% 0,0% 0,0%0,0% 0,0% 0,0% 0,0% 0,0% 0,0% 0,0% 0,0% 0,0% 0,0% 0,0% 0,0% 0,0% 0,0% 45,2%0,0% 0,0% 0,0% 0,0% 0,0% 0,0% 0,0% 0,0% 0,0% 0,0% 0,0% 0,0% 0,0% 0,0% 53,3%
Utilization based on capacity allocated by need
JÄMKA_FOOD_SVR_0,3L
JÄMKA_FOOD_SVR_0,5L
JÄMKA_FOOD_SVR_W_LID_S4
JÄMKA_FOOD_SVR_20X14X4
JÄMKA_FOOD_SVR_20X14X6
JÄMKA_FOOD_SVR_20X14X10 SMASKA_SPOON SMASKA_PLATE
3830 4952 9023 5687 17441 12084 12139 27317
4133 5343 9736 7791 21976 21850
Capacity Allocated by Need
Overwrite Capacity
Capacity Allocated by Need
Overwrite Capacity
SMASKA_CUTLERY SMASKA_BEAKER SMASKA_BOWLJÄMKA_JAR_WITH_LID_S2_1,1/1,9L
JÄMKA_JAR_WITH_LID_S2_2,5/3,5L
JÄMKA_JUG_WITH_LID_1,7L
GOMORGON_STOR_UT_S3
9284 10369 25610 2547 4524 3456 3862
2748 4881 3729 5310

96
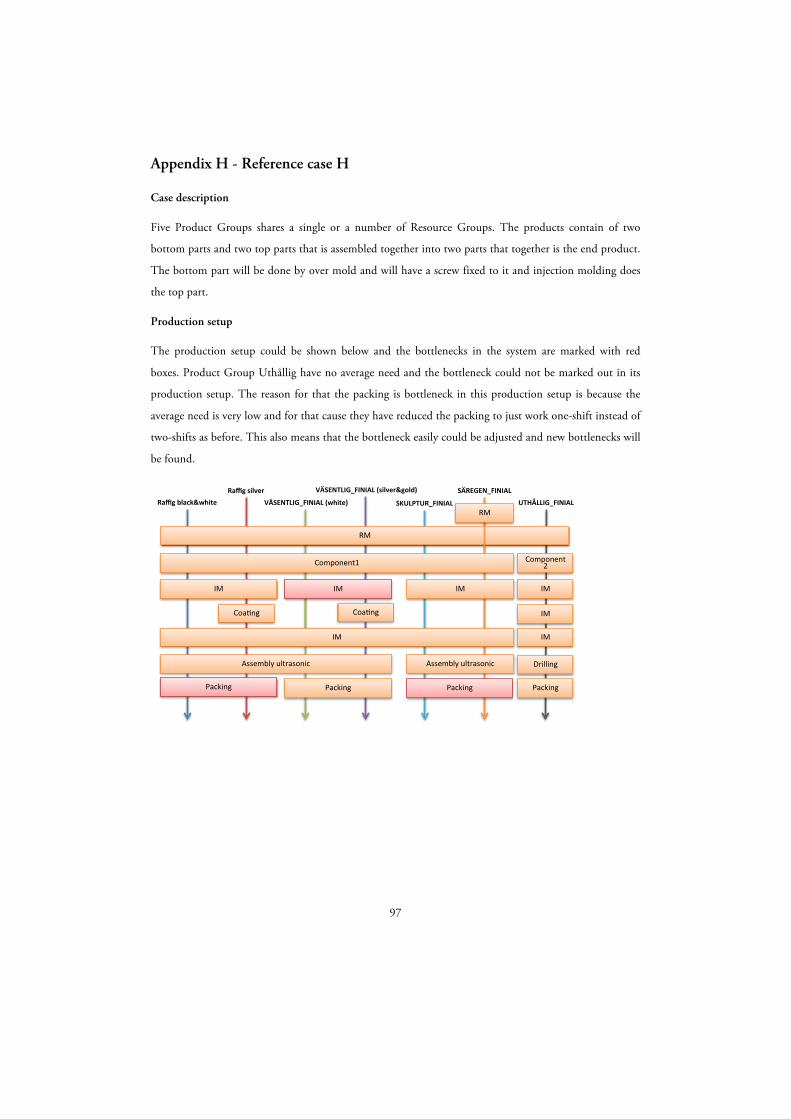
97
Appendix H - Reference case H
Case description
Five Product Groups shares a single or a number of Resource Groups. The products contain of two
bottom parts and two top parts that is assembled together into two parts that together is the end product.
The bottom part will be done by over mold and will have a screw fixed to it and injection molding does
the top part.
Production setup
The production setup could be shown below and the bottlenecks in the system are marked with red
boxes. Product Group Uthållig have no average need and the bottleneck could not be marked out in its
production setup. The reason for that the packing is bottleneck in this production setup is because the
average need is very low and for that cause they have reduced the packing to just work one-shift instead of
two-shifts as before. This also means that the bottleneck easily could be adjusted and new bottlenecks will
be found.
RM#
VÄSENTLIG_FINIAL-(white)##Raffig-silver## VÄSENTLIG_FINIAL-(silver&gold)## SÄREGEN_FINIAL##
Raffig-black&white#-
Component1#
Assembly#ultrasonic#
SKULPTUR_FINIAL#-
IM#
UTHÅLLIG_FINIAL##
Coa7ng#
IM#
Coa7ng#
Packing#
RM#
Component2#
IM#
Packing#
IM#
Assembly#ultrasonic#
Packing#
IM#
IM#
IM#
Drilling#
Packing#

98
Consumption table
Utilization of each Resource Group by Product Group
Product Group: RAFFIG (black&white)
RAFFIG (silver) VÄSENTLIG_FINIAL (white)
VÄSENTLIG_FINIAL (silver&gold)
SKULPTUR_FINIAL SÄREGEN_FINIAL UTHÅLLIG_FINIAL
Consumption rate Consumption rate Consumption rate Consumption rate Consumption rate Consumption rate Consumption rate
Resource Group Unit (Unit/piece) (Unit/piece) (Unit/piece) (Unit/piece) (Unit/piece) (Unit/piece) (Unit/piece)
RM HPS kg 0,1114 0,1082 0,084 0,084 0,0716 0,3088
Component screw short (10mm) pieces 2 2 2 2 2 2IM C1-B1-C2 top hours 0,001515508 0,001515508Coating outsourced 0,000842105IM A7-A8-F3-F7-A10-A11 bottom hours 0,001840278 0,001840278 0,002604167 0,002604167 0,002361111 0,002256944Assembly Ultrasonic 4 big hours 0,001111111 0,001111111 0,001666667 0,001666667Packaging raffig hours 0,002083333 0,002083333
RM PS kg 0,0988Component screw long (73mm) pieces 2 IM F2, F5 and F6- top hours 0,004861111 0,004861111
Packaging outsorced hours 0,002083333 0,002083333Coating vässentlig silver&gold 0,000842105
IM B2, B3- top hours 0,004166667 0,007222222Ultrasonic small 3 machines hours 0,003333333 0,003891051Packaging säregen &skulptur 0,001082251 0,002083333IM A4- biggest grey 0,012777778IM A2- middle beach 0,012222222IM A3 - smallest white 0,011388889Drilling1 0,001666667Drilling2 0,001666667Drilling3 0,001666667Packing uthållig 0,001805556
Tooling capicity raffig bottom hours 0,001840278 0,001840278Tooling capicity raffig top hours 0,001515508 0,001515508Tooling capicity väsentlig bottom hours 0,002604167 0,002604167Tooling capicity väsentlig top hours 0,004861111 0,004861111Tooling capacity Skulptur bottom hours 0,002361111Tooling capacity Skulptur top hours 0,004166667Tooling capacity Säregen bottom hours 0,002256944Tooling capacity Säregen top hours 0,007222222
Capacity
Downtime
(Unit/week) rate (%)
1000000
50000033040660440225
12000150000330
15040
22022537,511011011037,537,537,537,5
440440220440110110110110
Defect rate (%) 1,00% 1,00% 1,00% 1,00% 1,00% 1,00% 1,00%
8983 4574 17409 4051 6671 356 0Average for 17 weeks from SPI, starting from the first
week after the Lead time+1
Resource Group
RM HPS Component screw short (10mm)IM C1-B1-C2 topCoating outsourcedIM A7-A8-F3-F7-A10-A11 bottomAssembly Ultrasonic 4 bigPackaging raffig RM PSComponent screw long (73mm) IM F2, F5 and F6- top Packaging outsorced Coating vässentlig silver&gold IM B2, B3- topUltrasonic small 3 machines Packaging säregen &skulpturIM A4- biggest greyIM A2- middle beachIM A3 - smallest whiteDrilling1Drilling2Drilling3Packing uthållig Tooling capicity raffig bottomTooling capicity raffig topTooling capicity väsentlig bottomTooling capicity väsentlig topTooling capacity Skulptur bottomTooling capacity Skulptur topTooling capacity Säregen bottomTooling capacity Säregen top
RAFFIG (black&white) RAFFIG (silver)
VÄSENTLIG_FINIAL (white)
VÄSENTLIG_FINIAL (silver&gold) SKULPTUR_FINIAL SÄREGEN_FINIAL UTHÅLLIG_FINIAL
0,4% 0,4% 0,4% 0,4% 0,4% 0,0% 0,0%
17,0% 17,0% 17,0% 17,0% 17,0% 17,0% 0,0%6,3% 6,3% 0,0% 0,0% 0,0% 0,0% 0,0%0,0% 9,7% 0,0% 0,0% 0,0% 0,0% 0,0%
14,9% 14,9% 14,9% 14,9% 14,9% 14,9% 0,0%11,7% 11,7% 11,7% 11,7% 0,0% 0,0% 0,0%12,7% 12,7% 0,0% 0,0% 0,0% 0,0% 0,0%
0,0% 0,0% 0,0% 0,0% 0,0% 0,3% 0,0%0,0% 0,0% 0,0% 0,0% 0,0% 0,0% 0,0%0,0% 0,0% 31,9% 31,9% 0,0% 0,0% 0,0%
0,0% 0,0% 30,1% 30,1% 0,0% 0,0% 0,0%0,0% 0,0% 0,0% 8,6% 0,0% 0,0% 0,0%
0,0% 0,0% 0,0% 0,0% 13,9% 13,9% 0,0%0,0% 0,0% 0,0% 0,0% 10,6% 10,6% 0,0%0,0% 0,0% 0,0% 0,0% 21,4% 21,4% 0,0%0,0% 0,0% 0,0% 0,0% 0,0% 0,0% 0,0%0,0% 0,0% 0,0% 0,0% 0,0% 0,0% 0,0%0,0% 0,0% 0,0% 0,0% 0,0% 0,0% 0,0%0,0% 0,0% 0,0% 0,0% 0,0% 0,0% 0,0%0,0% 0,0% 0,0% 0,0% 0,0% 0,0% 0,0%0,0% 0,0% 0,0% 0,0% 0,0% 0,0% 0,0%0,0% 0,0% 0,0% 0,0% 0,0% 0,0% 0,0%
5,7% 5,7% 0,0% 0,0% 0,0% 0,0% 0,0%4,7% 4,7% 0,0% 0,0% 0,0% 0,0% 0,0%0,0% 0,0% 25,7% 25,7% 0,0% 0,0% 0,0%0,0% 0,0% 23,9% 23,9% 0,0% 0,0% 0,0%0,0% 0,0% 0,0% 0,0% 14,5% 0,0% 0,0%0,0% 0,0% 0,0% 0,0% 25,5% 0,0% 0,0%0,0% 0,0% 0,0% 0,0% 0,0% 0,7% 0,0%0,0% 0,0% 0,0% 0,0% 0,0% 2,4% 0,0%
Utilization given average need

99
New Capacity figures
The capacity allocated by need is given in the table below. Important to notice is that the when there are
numbers in the yellow boxes (overwrite capacity) this numbers is the capacity of the Product Group. The
Product Group Raffig for example consists of 70861 pieces of Raffig (black &white) and 36081 pieces of
Raffig (silver), which that the capacity that should be register for Raffig is 70851+36082=106933 pieces.
Resource Group
RM HPS Component screw short (10mm)IM C1-B1-C2 topCoating outsourcedIM A7-A8-F3-F7-A10-A11 bottomAssembly Ultrasonic 4 bigPackaging raffig RM PSComponent screw long (73mm) IM F2, F5 and F6- top Packaging outsorced Coating vässentlig silver&gold IM B2, B3- topUltrasonic small 3 machines Packaging säregen &skulpturIM A4- biggest greyIM A2- middle beachIM A3 - smallest whiteDrilling1Drilling2Drilling3Packing uthållig Tooling capicity raffig bottomTooling capicity raffig topTooling capicity väsentlig bottomTooling capicity väsentlig topTooling capacity Skulptur bottomTooling capacity Skulptur topTooling capacity Säregen bottomTooling capacity Säregen top
RAFFIG (black&white)
RAFFIG (silver) VÄSENTLIG_FINIAL (white)
VÄSENTLIG_FINIAL (silver&gold)
SKULPTUR_FINIAL SÄREGEN_FINIAL UTHÅLLIG_FINIAL
2,0% 2,0% 2,0% 2,0% 2,0% 0,0% 0,0%
82,6% 82,6% 82,6% 82,6% 82,6% 82,6% 0,0%49,6% 49,6% 0,0% 0,0% 0,0% 0,0% 0,0%0,0% 76,7% 0,0% 0,0% 0,0% 0,0% 0,0%
67,8% 67,8% 67,8% 67,8% 67,8% 67,8% 0,0%53,0% 53,0% 53,0% 53,0% 0,0% 0,0% 0,0%
100,0% 100,0% 0,0% 0,0% 0,0% 0,0% 0,0%
0,0% 0,0% 0,0% 0,0% 0,0% 3,5% 0,0%0,0% 0,0% 0,0% 0,0% 0,0% 0,0% 0,0%0,0% 0,0% 100,0% 100,0% 0,0% 0,0% 0,0%
0,0% 0,0% 94,3% 94,3% 0,0% 0,0% 0,0%0,0% 0,0% 0,0% 27,0% 0,0% 0,0% 0,0%
0,0% 0,0% 0,0% 0,0% 64,0% 64,0% 0,0%0,0% 0,0% 0,0% 0,0% 46,5% 46,5% 0,0%0,0% 0,0% 0,0% 0,0% 100,0% 100,0% 0,0%0,0% 0,0% 0,0% 0,0% 0,0% 0,0% 0,0%0,0% 0,0% 0,0% 0,0% 0,0% 0,0% 0,0%0,0% 0,0% 0,0% 0,0% 0,0% 0,0% 0,0%0,0% 0,0% 0,0% 0,0% 0,0% 0,0% 0,0%0,0% 0,0% 0,0% 0,0% 0,0% 0,0% 0,0%0,0% 0,0% 0,0% 0,0% 0,0% 0,0% 0,0%0,0% 0,0% 0,0% 0,0% 0,0% 0,0% 0,0%
45,2% 45,2% 0,0% 0,0% 0,0% 0,0% 0,0%37,2% 37,2% 0,0% 0,0% 0,0% 0,0% 0,0%0,0% 0,0% 80,4% 80,4% 0,0% 0,0% 0,0%0,0% 0,0% 75,0% 75,0% 0,0% 0,0% 0,0%0,0% 0,0% 0,0% 0,0% 56,7% 0,0% 0,0%0,0% 0,0% 0,0% 0,0% 100,0% 0,0% 0,0%0,0% 0,0% 0,0% 0,0% 0,0% 8,8% 0,0%0,0% 0,0% 0,0% 0,0% 0,0% 28,1% 0,0%
Utilization based on capacity allocated by need
RAFFIG (black&white) RAFFIG (silver)
VÄSENTLIG_FINIAL (white)
VÄSENTLIG_FINIAL (silver&gold) SKULPTUR_FINIAL SÄREGEN_FINIAL UTHÅLLIG_FINIAL
52881 26926 54521 12687 26136 1661 070861 36081 4236
Capacity Allocated by NeedOverwrite Capacity

100

101
Appendix I - Reference case I
Case description
Seven Product Groups shares a single or a number of Resource Groups. All Product Groups mainly
follow these production steps; extrusion, cutting and printing. They all share the same rawmaterial and
the extrusion machine.
Production setup
The production setup could be shown below and the bottlenecks in the system are marked with red
boxes. Note that both Product Groups Drömmar do not use the printing machine shown by having no
lines going below that Resource Group.
Consumption table
Utilization of each Resource Group by Product Group
RM#
SÅDD_PLACE_MAT##OMTYCKT_PLACEMAT## DRÖMMAR_CAKE_DOILY## KLISTRIG_PLACEMAT##
LJUDA_PLACE_MAT#5
Extrusion#machine#
PACK1#
DRÖMMAR_STENCIL5
Prin7ng#machine#
SUMMERA_DROP_FILE##
Lamina7on#machine#
Cu:ng#machine#
PACK2# PACK3#
Cu:ng#machine#
IM#
3##Component#
Product Group: LJUDA_PLACE_MAT OMTYCKT_PLACEMAT SÅDD_PLACE_MAT DRÖMMAR_CAKE_DOILY DRÖMMAR_STENCIL KLISTRIG_PLACEMAT SUMMERA_DROP_FILE
Consumption rate Consumption rate Consumption rate Consumption rate Consumption rate Consumption rate Consumption rate
Resource Group Unit (Unit/piece) (Unit/piece) (Unit/piece) (Unit/piece) (Unit/piece) (Unit/piece) (Unit/piece)
RM -PP Ho Kg 0,095 0,095 0,095 0,155 0,11 0,2218 0,72Extrusion Machine hours 0,000682023 0,000682023 0,000682023 0,000520419 0,000580929 0,001190476 0,003787879Printing Machine P1 hours 0,000166667 0,000166667 0,000166667 0,000333333Lamination Machine-L1~3 hours 0,000166667 0,000166667 0,000166667 0,000333333Cutting Machine C1~2 hours 0,000166667 0,000166667 0,000166667 0,000333333 0,000333333 0,000333333Packing and labeling hours 0,000277778 0,000277778 0,000277778
Packaging P2 hours 0,002777778 0,002777778 0,002777778
Cutting Machine A1 hours 0,015555556Packaging P3 hours 0,00625Componenet PET index pieces 16Component paper index pieces 1Componenet PP hangers pieces 32IM - Packing box hours 0,008333333
Capacity
Downtime
(Unit/week) rate (%)
1000000420 3,30%50 0,70%330 2,27%220 2,27%225 2,22%
337,5
247,5123,75 3,30%384000200000600000120 1,60%
Defect rate (%) 2,00% 2,00% 2,00% 3,00% 3,00% 2,00% 3,00%
67000 45318 16518 2306 1705 37312 2314Average for 17 weeks from SPI, starting from the
first week after the Lead time+1
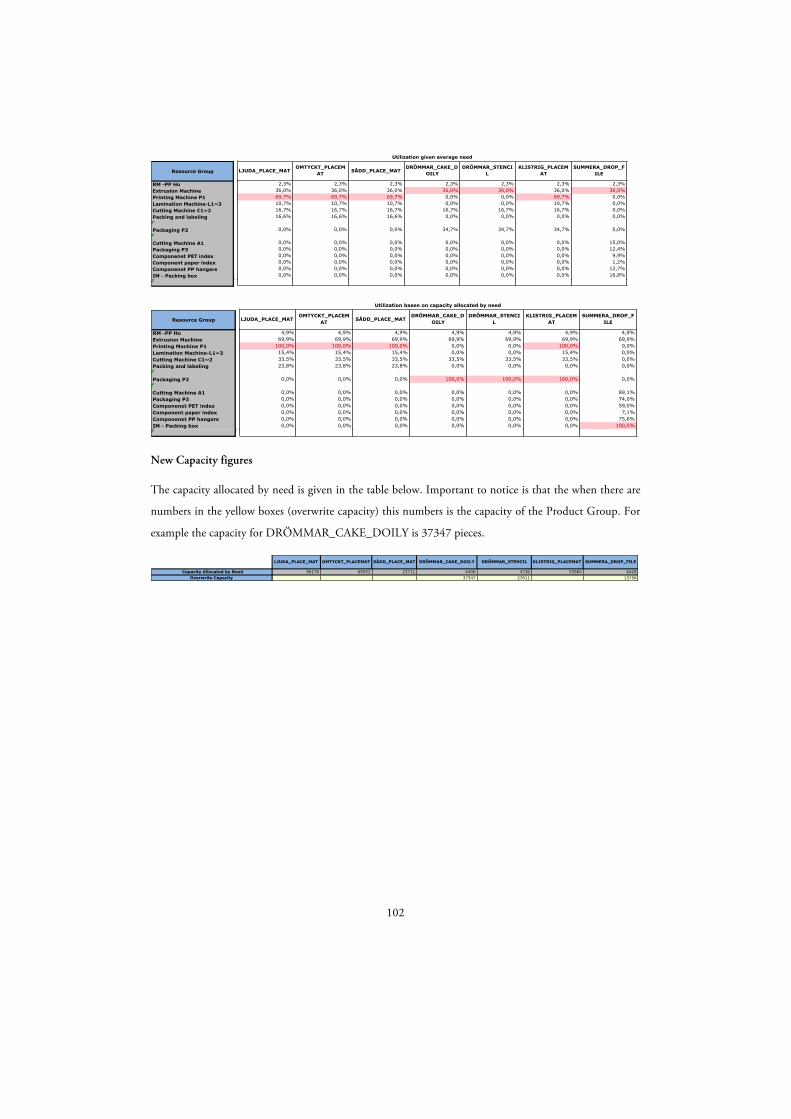
102
New Capacity figures
The capacity allocated by need is given in the table below. Important to notice is that the when there are
numbers in the yellow boxes (overwrite capacity) this numbers is the capacity of the Product Group. For
example the capacity for DRÖMMAR_CAKE_DOILY is 37347 pieces.
Resource Group
RM -PP HoExtrusion Machine Printing Machine P1Lamination Machine-L1~3Cutting Machine C1~2Packing and labeling Packaging P2 Cutting Machine A1Packaging P3Componenet PET indexComponent paper indexComponenet PP hangersIM - Packing box
LJUDA_PLACE_MATOMTYCKT_PLACEM
AT SÅDD_PLACE_MATDRÖMMAR_CAKE_D
OILYDRÖMMAR_STENCI
LKLISTRIG_PLACEM
ATSUMMERA_DROP_F
ILE
2,3% 2,3% 2,3% 2,3% 2,3% 2,3% 2,3%36,0% 36,0% 36,0% 36,0% 36,0% 36,0% 36,0%69,7% 69,7% 69,7% 0,0% 0,0% 69,7% 0,0%10,7% 10,7% 10,7% 0,0% 0,0% 10,7% 0,0%16,7% 16,7% 16,7% 16,7% 16,7% 16,7% 0,0%16,6% 16,6% 16,6% 0,0% 0,0% 0,0% 0,0%
0,0% 0,0% 0,0% 34,7% 34,7% 34,7% 0,0%
0,0% 0,0% 0,0% 0,0% 0,0% 0,0% 15,0%0,0% 0,0% 0,0% 0,0% 0,0% 0,0% 12,4%0,0% 0,0% 0,0% 0,0% 0,0% 0,0% 9,9%0,0% 0,0% 0,0% 0,0% 0,0% 0,0% 1,2%0,0% 0,0% 0,0% 0,0% 0,0% 0,0% 12,7%0,0% 0,0% 0,0% 0,0% 0,0% 0,0% 16,8%
Utilization given average need
Resource Group
RM -PP HoExtrusion Machine Printing Machine P1Lamination Machine-L1~3Cutting Machine C1~2Packing and labeling Packaging P2 Cutting Machine A1Packaging P3Componenet PET indexComponent paper indexComponenet PP hangersIM - Packing box
LJUDA_PLACE_MATOMTYCKT_PLACEM
AT SÅDD_PLACE_MATDRÖMMAR_CAKE_D
OILYDRÖMMAR_STENCI
LKLISTRIG_PLACEM
ATSUMMERA_DROP_F
ILE
4,9% 4,9% 4,9% 4,9% 4,9% 4,9% 4,9%69,9% 69,9% 69,9% 69,9% 69,9% 69,9% 69,9%
100,0% 100,0% 100,0% 0,0% 0,0% 100,0% 0,0%15,4% 15,4% 15,4% 0,0% 0,0% 15,4% 0,0%33,5% 33,5% 33,5% 33,5% 33,5% 33,5% 0,0%23,8% 23,8% 23,8% 0,0% 0,0% 0,0% 0,0%
0,0% 0,0% 0,0% 100,0% 100,0% 100,0% 0,0%
0,0% 0,0% 0,0% 0,0% 0,0% 0,0% 89,1%0,0% 0,0% 0,0% 0,0% 0,0% 0,0% 74,0%0,0% 0,0% 0,0% 0,0% 0,0% 0,0% 59,0%0,0% 0,0% 0,0% 0,0% 0,0% 0,0% 7,1%0,0% 0,0% 0,0% 0,0% 0,0% 0,0% 75,6%0,0% 0,0% 0,0% 0,0% 0,0% 0,0% 100,0%
Utilization basen on capacity allocated by need
LJUDA_PLACE_MAT OMTYCKT_PLACEMAT SÅDD_PLACE_MAT DRÖMMAR_CAKE_DOILY DRÖMMAR_STENCIL KLISTRIG_PLACEMAT SUMMERA_DROP_FILE
96176 65053 23711 6406 4736 53560 642837347 27611 13756
Capacity Allocated by NeedOverwrite Capacity

103
Appendix J - Mathematical Model
In order to calculate the gross capacity in units for the Product Groups of a certain supplier the authors
have developed a mathematical model.
Model Notation
The following variables are used in the model:
𝑜!" standard operating time (in seconds) required for unique resource i per article j
𝑂!" standard operating time (in seconds) required for unique resource i per Product Group l
𝑏!" standard consumption rate (in hours per piece) of unique resource i per article j
𝐵!" standard consumption rate (in hours per piece) of unique resource i Product Group l
𝐶!" standard consumption rate (in hours per piece) of Resource Group k per Product Group l
𝑞! defect rate for Product Group l
𝑟! downtime rate for unique resource i
𝑅! downtime rate for Resource Group k
𝐹!" failure rate for the Resource Group k for Product Group l
𝐴! amount of available unique resources i
𝑃! amount of pieces contributed to per cycle in unique resource i
𝑑! dedicated weekly capacity (gross capacity in hours for machines and labor) per unique resource i
𝐷! dedicated weekly capacity (gross capacity in hours for machines and labor) per Resource Group k
𝑛! average forecasted weekly need of article j determined from the SPI
𝑁! average forecasted weekly need of Product Group l determined from the SPI
𝐸! allocated maximum capacity of Product Group l
𝑈! utilization of Resource Group k
𝐼! all unique resources within Resource Group k
𝐽! all unique resources within Resource Group l
𝐾 all Resource Groups within a certain production line
𝐿 all Product Groups within a certain production line

104
Consumption Rate Calculation
First it is important to note that there are two different types of unique resources. One type is time
dependent resources (TD) including machine or labor hours and the other is material dependent
resources (MD) including raw materials and components. This means that the consumption rate is
calculated with a different approach for each.
Once the required data is collected for a production line the next step is to group unique resources into
resource groups. This is an objective task and can therefore not be mathematically modeled. The model
hence starts after this step.
In order to calculate the consumption rate or cycle time for a Product Group a weighted average is
calculated related to the forecasted average weekly demand from the SPI as follows:
𝐵!" =𝑏!"𝑛!𝑛!!
𝑗 ∈ 𝐽!
𝑂!" =𝑜!"𝑓!𝑓!!
𝑗 ∈ 𝐽!
The consumption rate of MD resources is determined by how much of that resource is required for each
end product of article i, while the consumption rate of TD resources must be calculated from the cycle
time data.
MD resources are never grouped with other unique resources into Resource Groups and are therefore
always Type I. The consumption rate is therefore as follows:
𝐶!",!" = 𝐵!" 𝑖 ∈ 𝐼!
Consumption rates for the three different types of Resource Groups are calculated as follows:
Type I. This is a group consisting of one type of unique resource and the consumption rate is converted from seconds per piece to hours per piece:
𝐶!",!",!"#$ ! =𝑂!"
𝑃! ∗ 3600 𝑖 ∈ 𝐼!
Type II. As this is a group of consecutive unique resources the bottleneck determines the consumption rate. The bottleneck is found by determining each unique resources weekly capacity and seeing which one has the lowest, then the consumption rate for this one is calculated:
𝐶!",!",!"#$ !! =𝑂!"
𝑃! ∗ 3600 𝑖 = max
!∈!!
𝑑!𝐴!𝑃! ∗ 3600𝑂!"
Where the gross weekly capacity in pieces of each unique resource i is:

105
𝑑!𝐴!𝑃! ∗ 3600𝑂!"
Type III. For this grouping of parallel unique resources an average consumption rate is calculated. This is done by dividing the total dedicated weekly capacity in hours of all individual machines by the total calculated weekly gross capacity for the group:
𝐶!",!",!"#$ !!! =𝐴!𝑑!!∈!!
𝑑!𝐴!𝑃!3600𝑂!"!∈!!
Utilization
Utilization is calculated for each Resource Group for both forecasted need and allocated maximum
capacity. To calculate this first determine the need of each Resource Group by each Product Group. This
need is calculated by multiplying the consumption rate by the forecasted need or allocated maximum
capacity in pieces and the failure rate. Note that downtime only affect consumption of production hours
and not raw materials while defects affect both. This need is then summarized for all Product Groups per
Resource Group and divided by the dedicated capacity of that Resource Group to determine the
utilization, as shown below:
𝑈! =
𝐶!"𝑋!𝐹!,!!∈!
𝐷!
Where:
𝑋! =𝑁! 𝑓𝑜𝑟 𝑢𝑡𝑖𝑙𝑖𝑧𝑎𝑡𝑖𝑜𝑛 𝑏𝑎𝑠𝑒𝑑 𝑜𝑛 𝑓𝑜𝑟𝑒𝑐𝑎𝑠𝑡𝑒𝑑 𝑛𝑒𝑒𝑑 𝐸! 𝑓𝑜𝑟 𝑢𝑡𝑖𝑙𝑖𝑧𝑎𝑡𝑖𝑜𝑛 𝑏𝑎𝑠𝑒𝑑 𝑜𝑛 𝑎𝑙𝑙𝑜𝑐𝑎𝑡𝑒𝑑 𝑚𝑎𝑥𝑖𝑚𝑢𝑚 𝑐𝑎𝑝𝑎𝑐𝑖𝑡𝑦.
The failure rate is as follows:
𝐹!" = 1 + 𝑞! 1 − 𝑅!
Where 𝑅! is the average defect rate for a Resource Group determined through a weighted average of the
defect rates within that resource group based on their respective capacities:
𝑅! =(𝑟!𝑑!𝐴!)!∈!
(𝑑!𝐴!)!∈!
Determining Allocated Maximum Capacity
The allocation for the maximum capacity is based on the average forecasted need determined from the
SPI. First the bottleneck Resource Group has to be determined for each Product Group by looking at the
Resource Group with the highest utilization based on the average forecasted need for that Product Group.
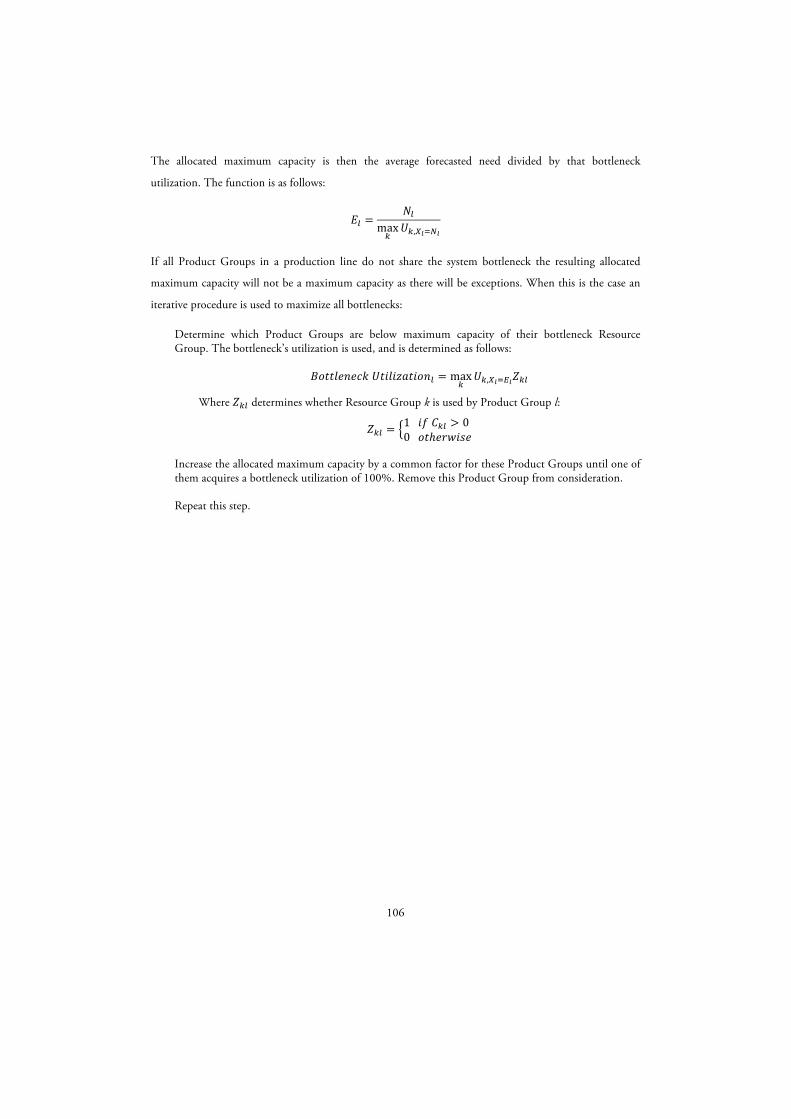
106
The allocated maximum capacity is then the average forecasted need divided by that bottleneck
utilization. The function is as follows:
𝐸! =𝑁!
max!𝑈!,!!!!!
If all Product Groups in a production line do not share the system bottleneck the resulting allocated
maximum capacity will not be a maximum capacity as there will be exceptions. When this is the case an
iterative procedure is used to maximize all bottlenecks:
Determine which Product Groups are below maximum capacity of their bottleneck Resource Group. The bottleneck’s utilization is used, and is determined as follows:
𝐵𝑜𝑡𝑡𝑙𝑒𝑛𝑒𝑐𝑘 𝑈𝑡𝑖𝑙𝑖𝑧𝑎𝑡𝑖𝑜𝑛! = max!𝑈!,!!!!!𝑍!"
Where 𝑍!" determines whether Resource Group k is used by Product Group l:
𝑍!" =1 𝑖𝑓 𝐶!" > 0 0 𝑜𝑡ℎ𝑒𝑟𝑤𝑖𝑠𝑒
Increase the allocated maximum capacity by a common factor for these Product Groups until one of them acquires a bottleneck utilization of 100%. Remove this Product Group from consideration.
Repeat this step.

107
Appendix K – Template Instructions for Data Collection
Introduction and concept For many years we have struggled to find a common way of defining and planning capacities within
IKEA and in cooperation with our suppliers. For this reason, we have launched a project that will aim to
improve the way of working, by establishing a common and agreed way to define, register and maintain
supplier capacity in ONE framework. We will have clear roles and responsibilities, and the goal is that
this will lead to a proactive and innovative way of solving potential capacity issues.
The process will in the long term also lead to a more even order pattern, a better overall utilization of the
capacity for you and a simplified way of working in the relationship between us.
The base in the ONE Supplier Capacity process is Product Groups and Resource Groups.
Resource group (Defined by Trading Operations together with supplier) Production resource/resources with similar characteristics constitutes a “Resource group”. A Resource group provides capacity. For example: Raw Material, Injection Machine, Paint line, Packaging
Product group (Defined by IoS together with Trading Operations/supplier) Article/articles with similar characteristics AND share the same Resource group/groups constitutes a “Product group”. A Product group consumes capacity. IKEA Trading Office can supply a list with the Product Groups that your articles belong to.
Dedication (Defined by Trading Operations) Dedicated Supplier Capacity is defined as the capacity that is dedicated to a given Resource group for IKEA for an agreed time period.
Allocation (Defined by Trading Operations) Allocated Supplier Capacity is defined as the capacity that is allocated to a given Product group within a given Resource group.
In preparation for the coming visit, we’d like to ask you to prepare a mapping of your Resource Groups,
and the Product Groups connected to them. You will find the Product groups defined for your articles in
the separate Excel-sheet. On the following pages you will find instructions for the “Data Collection”
template (Excel file attached). Please try to complete the Template before the agreed visit, so during the
visit we can verify the table as well as begin with some capacity calculation exercises.
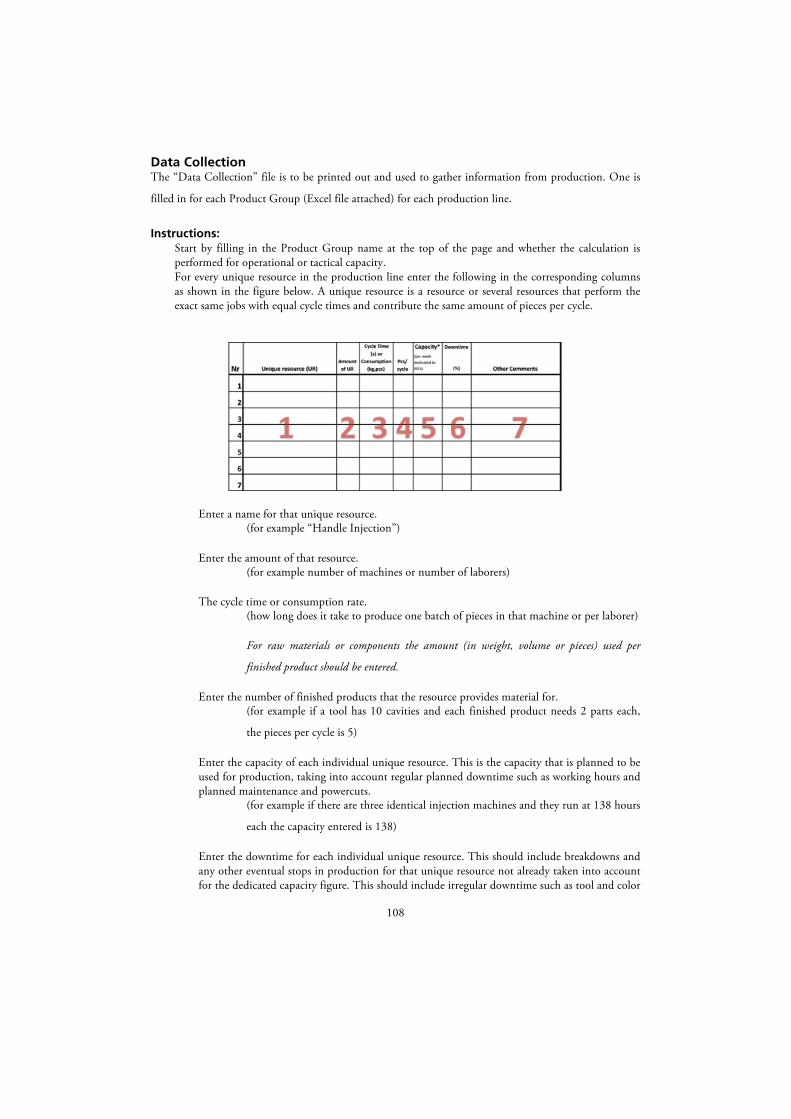
108
Data Collection The “Data Collection” file is to be printed out and used to gather information from production. One is
filled in for each Product Group (Excel file attached) for each production line.
Instructions: Start by filling in the Product Group name at the top of the page and whether the calculation is performed for operational or tactical capacity. For every unique resource in the production line enter the following in the corresponding columns as shown in the figure below. A unique resource is a resource or several resources that perform the exact same jobs with equal cycle times and contribute the same amount of pieces per cycle.
Enter a name for that unique resource. (for example “Handle Injection”)
Enter the amount of that resource. (for example number of machines or number of laborers)
The cycle time or consumption rate. (how long does it take to produce one batch of pieces in that machine or per laborer)
For raw materials or components the amount (in weight, volume or pieces) used per
finished product should be entered.
Enter the number of finished products that the resource provides material for. (for example if a tool has 10 cavities and each finished product needs 2 parts each,
the pieces per cycle is 5)
Enter the capacity of each individual unique resource. This is the capacity that is planned to be used for production, taking into account regular planned downtime such as working hours and planned maintenance and powercuts.
(for example if there are three identical injection machines and they run at 138 hours
each the capacity entered is 138)
Enter the downtime for each individual unique resource. This should include breakdowns and any other eventual stops in production for that unique resource not already taken into account for the dedicated capacity figure. This should include irregular downtime such as tool and color

109
change, machine calibration, or unscheduled maintenance. The figure below depicts how to take planned and unplanned downtimes into consideration in the template.
Enter any additional information that can help you. This must include information about shared resources between different Product Groups and can also include things such as minimum order quantity for raw materials and whether labor is the constraint.
When this is finished the “Resource Group Layout” box should be used to draw up the Resource Groups that make up the production line. There are four different types of Resource Groups:
Type I: Resource Group with 1 unique resource
This is the simplest Resource Group when there is no grouping.
Type II: Resource Group with more than 1 consecutive unique resources grouped
If several unique resources perform different jobs but belong to the same Resource
Groups.
Example:
The Resource Group “Packing” can consist of several unique resources such as
assembly, shrink-wrapping and packing)
!"Defect"products Defect&rateNet&capacity
Maximum&capacity Weekly
(Nominal)&capacity&
Regular&planned&downtime
Gross&capacity
!"Breakdowns!"Color"changes!"Tool"changes!"Unplanned"maintenance
!"Labor"breaks
Irregular&or&unplanned&downtime(Downtime&rate)
!"Unplanned"powercuts!"Planned"powercuts!"Planned"maintenance!"Length"of"shifts

110
Type III: Resource Group with more than 1 parallel unique resources grouped
Several unique resources perform the same job but with different cycle times and/or
produce different amount of pieces per cycle.
Example:
Injection machines with different cycle times and/or different amounts of cavities
that make the same part)
Type IV: A combination of consecutive and parallel groups grouped together
Group the three previous types by making a square around them. Several can be
grouped as above. Here Nr 2 and the grouped Nr 3 and 4 become a Type II group.
This new group along with Nr 1 and the grouped Nr 5 and 6 become a Type III
group.
Example:
In injection molding if there are two machines that are automated differently. One
makes the piece and trims off waste automatically (Nr 1) while the second machine
(Nr 2) does not automatically trim. This machine has a laborer after it (Nr 3) who
manually trims. Then the grouping would be performed as below:
Together
Together become
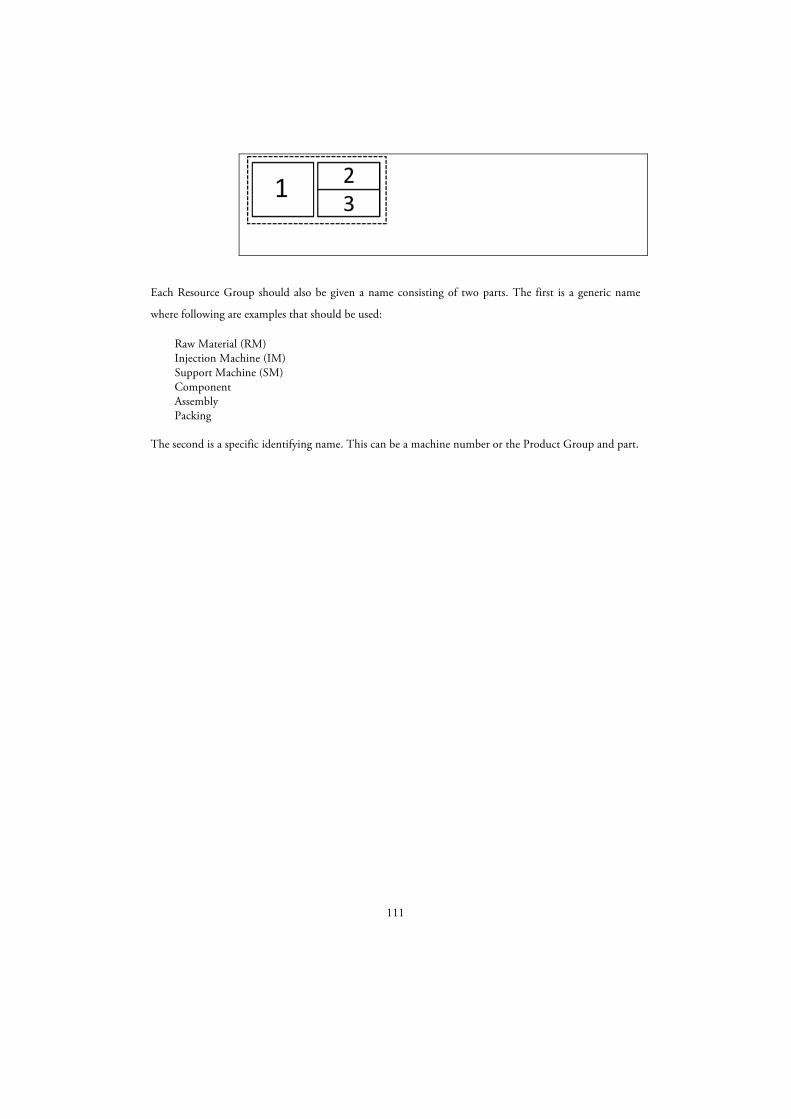
111
Each Resource Group should also be given a name consisting of two parts. The first is a generic name
where following are examples that should be used:
Raw Material (RM) Injection Machine (IM) Support Machine (SM) Component Assembly Packing
The second is a specific identifying name. This can be a machine number or the Product Group and part.

112
Data Collection Example After collecting the data from a production line (in this case for the Product Group Tolsby) the data
collection should look like this:
The different unique resources (injection machines) for making frames have been grouped as Type III
groups as they perform the same jobs. The same is true for the making of the foot. The unique resources
7, 9, 10, and 11 have been grouped into a Type II group as they are all essentially a part of the packing
line but don’t perform the same job as one another.
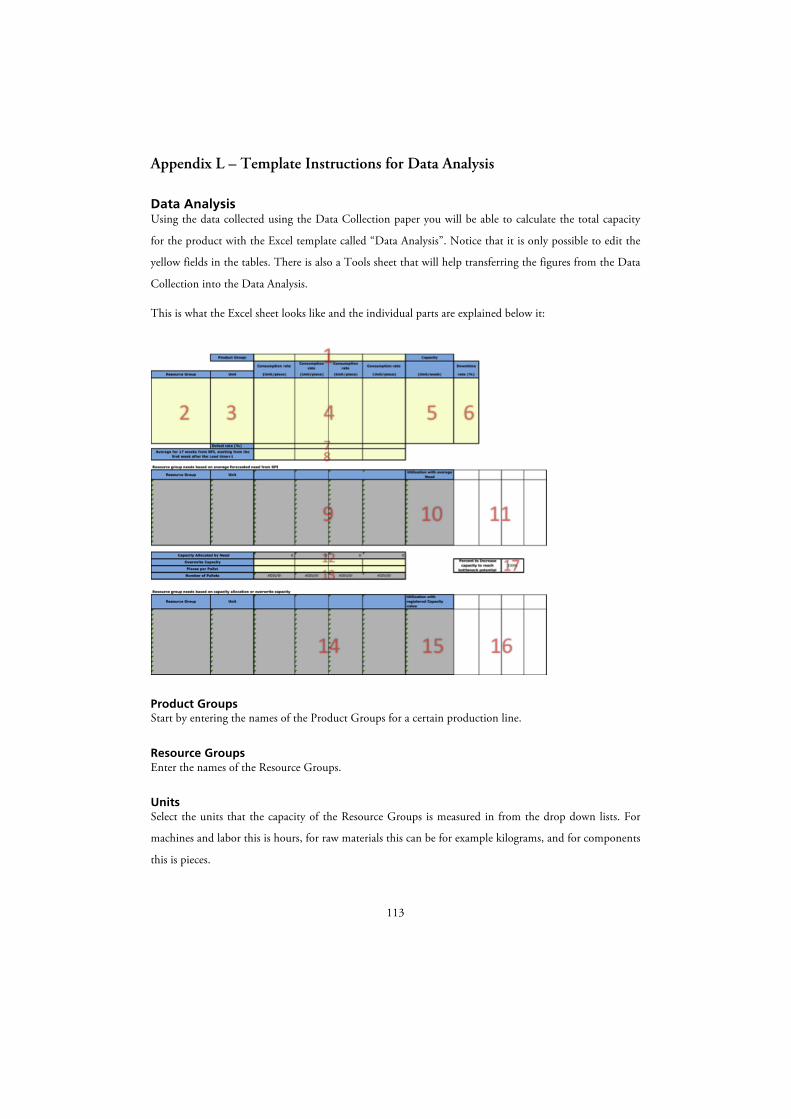
113
Appendix L – Template Instructions for Data Analysis
Data Analysis Using the data collected using the Data Collection paper you will be able to calculate the total capacity
for the product with the Excel template called “Data Analysis”. Notice that it is only possible to edit the
yellow fields in the tables. There is also a Tools sheet that will help transferring the figures from the Data
Collection into the Data Analysis.
This is what the Excel sheet looks like and the individual parts are explained below it:
Product Groups Start by entering the names of the Product Groups for a certain production line.
Resource Groups Enter the names of the Resource Groups.
Units Select the units that the capacity of the Resource Groups is measured in from the drop down lists. For
machines and labor this is hours, for raw materials this can be for example kilograms, and for components
this is pieces.

114
Consumption Rate The consumption rate is the number of pieces that a resource group processes per unit (as previously
determined). The following is usually true for machines and labor where the unit is hours:
Type I: For each machine the consumption rate is calculated from the cycle time using “Table Type I” in the “Tools” sheet.
Type II: The Resource Group’s consumption rate is the consumption rate of the bottleneck unique resource. If the figures for all the unique resources of a Resource Group are entered into “Table Type II” the one with the lowest capacity in pieces per week is the bottleneck and is highlighted in red. The consumption rate and total weekly capacity for that one is shown at the bottom.
Type III: Use “Table Type III” in the “Tools” sheet. Enter the figures for all the unique resources of a Resource Group and the average consumption rate is presented as well as total weekly capacity.

115
Capacity Determining the weekly capacity needs to be done differently depending on whether it is operational or
tactical as stated in the introduction. For raw materials and components this figure is the weekly capacity
in the chosen unit (3). The following is usually true for machines and labor where the unit is hours:
Type I: The capacity is the weekly production hours of each unique resource.
Type II: The capacity is the capacity of the bottleneck unique resource of that Resource Group (where the capacity is determined as it is for Type I). The capacity is shown in the “Table Type II”.
Type III: The capacity is total of the capacities for all the unique resources of that Resource Group (where the capacity is determined as it is for Type I).
Downtime For each Resource Group an average downtime percentage should be determined. This is calculated by
the downtime for each unique resource in a group times its capacity divided by the total capacity.
Defect rate For each product group there should be a figure for the defect rate (in percent).
Average need The average need should be calculated for the need in SPI for 17 weeks starting from the lead time plus
one week from the current date, as shown in the picture below. The reason for doing this is that within
the lead time orders have been dispatched lowering the need in SPI and distorting the average.
116
Results:
Need in chosen unit based on average need The results tables show how much capacity of each Resource Group that each Product Group needs given
the SPI average need.
Utilization based on average need Shows the level of utilization of each Resource Group given the SPI average need.
Bottleneck utilization for each Product Group based on average need This table identifies the utilization of the Resource Groups that each Product Group uses. From here the
bottleneck Resource Group for each Resource Group is determined and highlighted. Note that this
bottleneck may only be true given the average need and may change.
Capacity allocated by need These are the final capacity values for the product groups where the capacity is allocated with regards to
the SPI average needs. There is also the possibility to overwrite these figures here affecting the results in
the tables explained in sections 14 to 16 below.
Capacity in pallets To calculate the capacity in pallets enter the amount of pieces per pallet.
Need in chosen unit based on resulting capacity figures The results tables show how much capacity of each Resource Group that each Product Group needs given
the resulting capacity figures (capacity allocated by need or overwrite figures).
Utilization based on resulting capacity figures Shows the level of utilization of each Resource Group given the resulting capacity figures.
Bottleneck utilization for each Product Group based on resulting capacity figures This table again identifies the utilization of the Resource Groups that each Product Group uses and the
bottleneck utilization is highlighted. Here the bottleneck may have moved. If the bottleneck utilization is
not 100% for each product group, use the iterative procedure presented in the next section.
Common factor used for iterative procedure (if final bottleneck utilization is less than 100%) If the final bottleneck utilization for one or more Product Groups is not 100%, use the following iterative
procedure:
For these Product Groups only, in the overwrite capacity cells make a formula multiplying the capacity allocated by need for this Product Group by the common factor (start with the common factor at 100%).

117
Increase the common factor until one of these Product Groups achieves 100% utilization for one of its Resource Groups (as shown in section 16 above). When a Product Group achieves 100% bottleneck utilization replace the formula in the overwrite field with the capacity that the formula gives. Continue increasing and repeat steps 2 to 3 until all Product Groups have 100% bottleneck utilization.

118

119
Data Analysis Example
Product Groups First we enter the Product Groups, and in this example it is only Tolsby.
Resource Groups Here the Resource Groups from the Data Collection are entered:
Unit Next the units by which the Resource Groups are measured in is selected from the drop down lists:
Consumption rate The first step here is to convert the cycle times and raw material and component consumption into the
units that were selected above. For this the tables in the “Tools” sheet are used to help. The following
shows how the consumption rates for each Resource Group are determined.
Raw Material: For each finished Tolsby product 100g is needed, and this is converted into the selected unit kg (0.1kg).

120
Injection Frame: This is a Type III Resource Group and we use “Table Type III” to calculate the average consumption rate
and average capacity of each unique resource per week.
Injection Foot This is also a Type III group and the Consumption Rate is calculated in the same way as the Injection
Frames Resource Group.
Support Machine “Table Type I” is used to quickly calculate the Consumption Rate.

121
Component Each finished frame consists of one component (the plastic sheet).
Packing This is a Type II Resource Group and “Table Type II” is used to determine the bottleneck of this group
in order to determine its consumption. Below we see that unique resource number 10 in this group
(shrink wrap) is the bottleneck as it has the lowest weekly capacity. The consumption rate is shown for
the bottleneck and represents the consumption rate of the Resource Group.
Now all the consumption rates are inserted into the Capacity Calculation sheet. If there were other
Product Groups sharing the production line then the same method would be used to determine their
consumptions for each Resource Group.

122
Defect rate and downtime rate The average defect rate per Product Group and the average downtime rate per Resource Group for
Tolsby is entered. The average for the two Type III Resource Groups are calculated as follows:
Injection Frame 𝐴𝑣𝑒𝑟𝑎𝑔𝑒 𝐷𝑜𝑤𝑛𝑡𝑖𝑚𝑒 = !"#∗!,!"#!!∗!"#∗!,!"
!∗!"#= 0,02125 = 2,125%
Injection Base 𝐴𝑣𝑒𝑟𝑎𝑔𝑒 𝐷𝑜𝑤𝑛𝑡𝑖𝑚𝑒 = !∗!"#∗!,!"#!!"#∗!,!"
!∗!"#= 0,01625 = 1,625%
Capacity Now the weekly capacity for each Resource Group is determined and entered.
Raw Material: 50 tons (50000 Kg) per week dedicated to this production line Injection Frame: 4 machines * 138 hours per week = 552 hours Injection Foot: 4 machines * 138 hours per week = 552 hours Support Machine: 1 machine * 138 hours per week = 138 hours Component: 500000 components per week Packing: (Determined by shrink wrap) 1 machine * 138 hours per week = 138 hours
Average need Finally the average need per week for the Product Group is entered calculated from the SPI according to
the instructions.
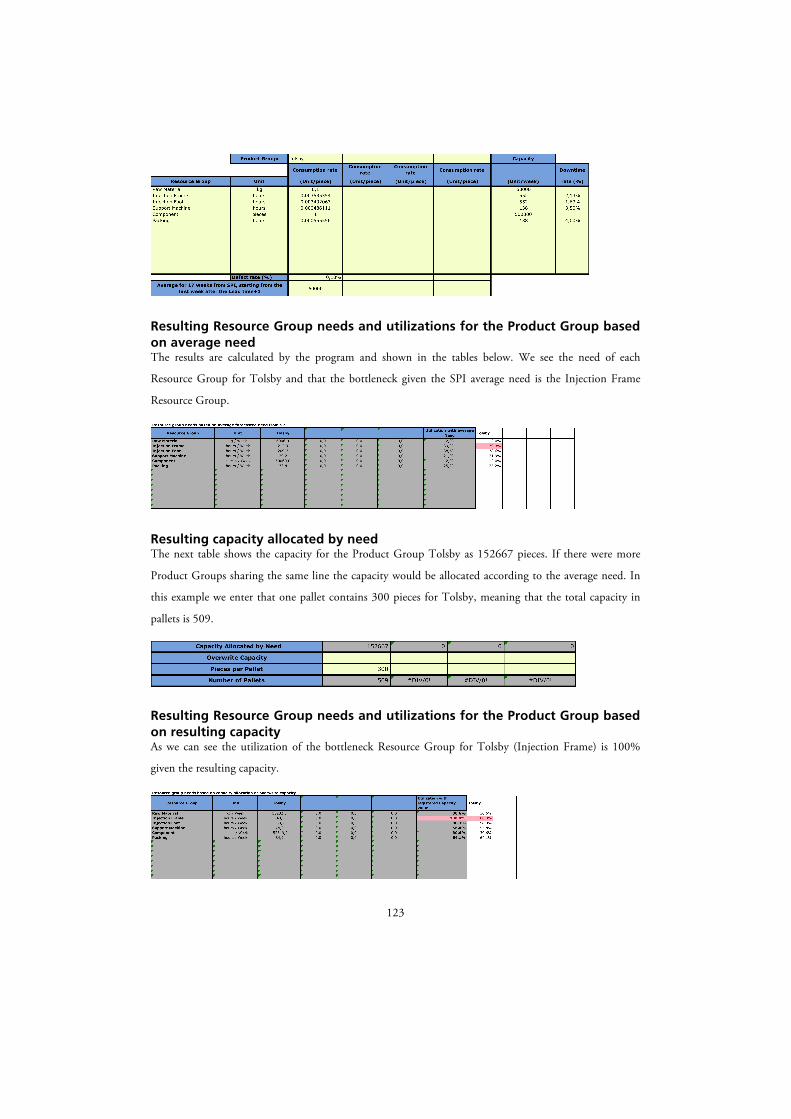
123
Resulting Resource Group needs and utilizations for the Product Group based on average need The results are calculated by the program and shown in the tables below. We see the need of each
Resource Group for Tolsby and that the bottleneck given the SPI average need is the Injection Frame
Resource Group.
Resulting capacity allocated by need The next table shows the capacity for the Product Group Tolsby as 152667 pieces. If there were more
Product Groups sharing the same line the capacity would be allocated according to the average need. In
this example we enter that one pallet contains 300 pieces for Tolsby, meaning that the total capacity in
pallets is 509.
Resulting Resource Group needs and utilizations for the Product Group based on resulting capacity As we can see the utilization of the bottleneck Resource Group for Tolsby (Injection Frame) is 100%
given the resulting capacity.

124
Exceptions There may be circumstances where the method of using the Capacity Calculation Template is not
straightforward due to complex productions.
Exception 1. Some but not all unique resources in a Type III Resource Group are shared. The exception is illustrated in the following example where one of Tolsbys injection machines for frames
is shared with another product Fantastisk.
In cases such as this it should be assumed in the template that Fantastisk can use the entire IM Tolsby
Frame Resource Group. A separate Resource Group must then be created that constrains the capacity of
Fantastisk so that it cannot use all injection machines in the Resource Group simultaneously. The new
Resource Group should have the same downtime rate and the consumption rate for Fantastisk should be
the same for both groups. In the case of plastic production the contraining factor limiting the use of an
entire Resource Group is the amount of tools, and hence the new Resource Group created should be a
tool group. This is shown in the following figure:
d"
Tolsby"
Injec.on"frame"1"
IM"frame"normal"mould"
Injec.on"frame"2"
Injec.on"frame"2"
Injec.on"foot"1" Injec.on"foot"2"
Injec.on"foot"1"
Injec.on"foot"1"
RM"
Support"Machine"
Packing"
RM2"
Packing2"
Injec.on"frame"2"
IM"Tolsby"Foot""
IM"Tolsby"Frame""
Fantas.sk"
Component"

125
Exception 2. If one Resource Group is used more than once for a Product Group If for example a Product Groups is worked in a machine and then later worked again in that machine, the
consumption rate is the sum of the consumption rates of each of these two jobs.
Exception 3. If one Resource Group processes parts for several Product Groups simultaneously If this is the case that Resource Group should be split into identical Resource Groups, one for each
Product Group that uses it.
d"
Tolsby"
Injec.on"frame"1"
Injec.on"frame"2"
Injec.on"frame"2"
Injec.on"foot"1" Injec.on"foot"2"
Injec.on"foot"1"
Injec.on"foot"1"
RM"
Support"Machine"
Packing"
RM2"
Packing2"
IM"Tolsby"Foot""
IM"Tolsby"Frame""
Fantas.sk"
Component"
Tool"Fantas.sk"
Injec.on"frame"2"