imposed vs. chosen change: a vision for the future of the ... ppt change jharvey final3 use...a...
TRANSCRIPT

Imposed vs. chosen change: A vision for the future of the
pavement enterprise
Rasmus S. Nordal Lecture
John Harvey University of California Pavement Research Center
10th Bearing Capacity of Roads, Railways and Airfields Conference, Athens, 28 June 2017

Outline
• Stationarity? • Drivers of change • Responses to change • Takeaways and summary

Is Stationarity a Good Assumption?
• Stationarity – Assumption in time series data that mean, variance
and autocorrelation structure do not change over time
– Should we be designing, constructing and managing pavements assuming that the conditions under which they operate and the functionality desired by the public will be similar to now?
• An exploration of these questions for my state, which may have implications for others

What Causes Institutional Change?
• Changes in institutional choice set – Knowledge of ways to organize your enterprise
• Changes in technology • Long-run changes in relative factor and
product prices • Changes in other institutional arrangements
– Societal changes that interact with your enterprise
AN ECONOMIC THEORY OF INSTITUTIONAL CHANGE: INDUCED AND IMPOSED CHANGE Justin Yifu Lin, Cato Journal, 9:1, 1989

What is Chosen (Induced) vs. Imposed Change?
• Change that we choose because it benefits us
• Change that is imposed by others or circumstances
• We are instinctively opposed to making changes that we haven’t chosen for ourselves
• Hypothesis: pavement enterprise needs to proactively choose to change or it will be imposed, with negative consequences
Philip Cox-Hynde, UK Civil Service Training Journal, 2017 https://www.trainingjournal.com/articles/opinion/imposed-vs-chosen-change-managing-change-business ; cartoon: hrdevelopmentinfo.com

Major Drivers of Change in the Pavement Enterprise:
• Population growth, changes in freight vehicle travel, vehicle ownership, urbanization and de-ruralization,
• Sustainability and population growth – Resource depletion, toxicity – Climate change, resilience
• Automation and vehicle technology, information technology • Cost, financing and lack of confidence in government to
deliver pavement efficiently • Jobs, workforce • The forgotten half • Pavement values: what do our customers want? Are we
communicating with them?

Truck traffic axle weights increasing?
• State-wide average axle loads (115 WIM stations) virtually unchanged in 10 years
• Gross vehicle weights slightly reduced
0
10
20
30
0 20 40 60 80 100 120
Dis
trib
utio
n (%
)
Axle Load (kN)
Load Spectra (Single Axle)
Year 2005 Year 2010 Year 2015
0
10
20
30
0 40 80 120 160 200 240
Dis
trib
utio
n (%
)
Axle Load (kN)
Load Spectra (Tandem Axle )
Year 2005 Year 2010 Year 2015

Freight Traffic is Increasing and Changing
• Freight is increasing – Economic growth, increasing population – Trade-driven economy, good jobs without college
• Changes in patterns of freight: – Last mile
• Increasing household deliveries on local streets of purchases from internet
• More short-haul delivery trucks in residential areas
• Will be increasingly natural gas or electric

Freight growth: more trucks
• 62% increase in truck counts vs 14% growth in population
• Short-haul: 69% increase
• Long-haul: 59% increase UCPRC/Caltrans WIM data

What kind of pavement will we need in the future?
Millennials driving the trend; may not just be recession Less interested in cars; use of technology to connect instead of travel; more interested in walkable, bikeable cities
NCST white paper, Feb 2016, What affects US passenger travel? Current trends and future perspectives; US PIRG, Oct 2014, Millennials in Motion

How much pavement will we need in the future? Annual travel per driver by age category
NCST white paper, Feb 2016, What affects US passenger travel? Current trends and future perspectives; US PIRG, Oct 2014, Millennials in Motion
Millennials show longer term downward trend
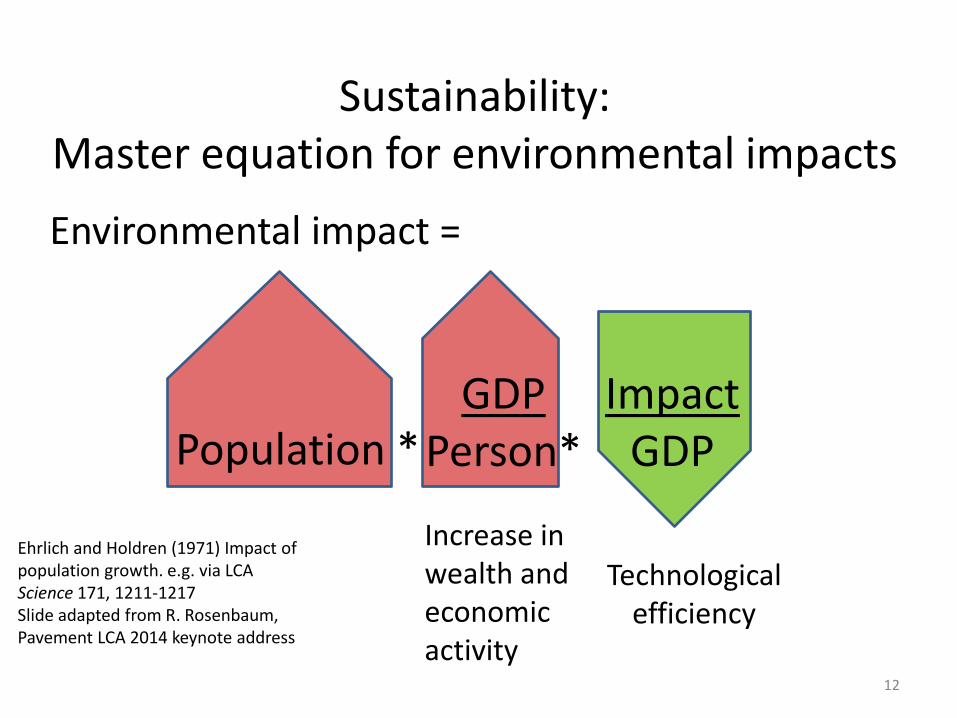
Environmental impact =
Sustainability: Master equation for environmental impacts
12
Ehrlich and Holdren (1971) Impact of population growth. e.g. via LCA Science 171, 1211-1217 Slide adapted from R. Rosenbaum, Pavement LCA 2014 keynote address
Population * GDP
Person* Impact
GDP
Increase in wealth and economic activity
Technological efficiency

Climate Change: are state goals achievable based on response to climate change law passed
in 2006? • Population
growth: – 1990:
30 million
– 2017: 39 million
– 2055: 50 million

Climate Change: road transport related strategies planning to 2030 and 2050
• Vehicle fuel vehicle changes: Natural gas, Electric • Complete streets
Air Resources Board Climate Scoping Plan
2006

What Should be Done for Sustainability?
• Many alternatives to improve sustainability • How to prioritize? • Cost from Life Cycle Cost Analysis (LCCA) • Environment from Life Cycle Assessment (LCA)

Maintaining competition in pavement California Relative Asphalt and Concrete Costs
1978-2017
0.60
0.70
0.80
0.90
1.00
1.10
1.20
1.30
1.40
1978 1988 1998 2008
AC/P
CC c
ost r
atio
Year

Hauling our road materials damages the roads Projected Growth in Freight Ton and Values 2012 to 2040
• Freight mass throughput +47%, value +95% • Demolition, gasoline, gravel and crushed stone, crude oil
California Freight Mobility Plan 2014 http://www.dot.ca.gov/hq/tpp/offices/ogm/CFMP/Dec2014/2-3_123014.pdf#zoom=75

How do Pavements Contribute to California GHG Emissions?
• Out of 459 MMT CO2e in 2013 – On road vehicles 155 MMT
• Optimizing smoothness, texture, deflection energy on state network reduces by 1% of this
– Refineries 29 MMT • Paving asphalt about 1 % of
refinery production – Cement plants 7 MMT
• Paving cement about 5 % of cement plant production
– Commercial gas use 13 MMT • Very small amounts for asphalt
mixing plants – Mining 0.2 MMT
• Large portion for aggregate mining
http://www.arb.ca.gov/cc/inventory/data/data.htm
Possible Pavement Reductions MMT/year
Rolling resist to optimum 1.5 Cement use 50% 0.2 Asphalt use 50% 0.7
Demo, oil, stone haul 10% 0.6 TOTAL 2.9

Air Pollution Toxicity • Transportation related factor of most importance is air pollution, especially diesel trucks Requiring changes in vehicle fuel sources
https://www.uschamber.com/issue-brief/ozone-national-ambient-air-quality-standards
http://graphics.latimes.com/responsivemap-pollution-burdens/

Pavement Materials Resource Depletion and Replacement
• Aggregate: – Local future shortages and quality issues – Large quantities of aggregate moved on the roads,
lots of fuel, high levels of damage • Bitumen:
– US: supply and demand balanced, because large amounts of asphalt are coked for liquid fuels
– Europe: oversupply of asphalt? – If oil demand for
transportation fuel diminishes, there is a nearly infinite future supply of asphalt
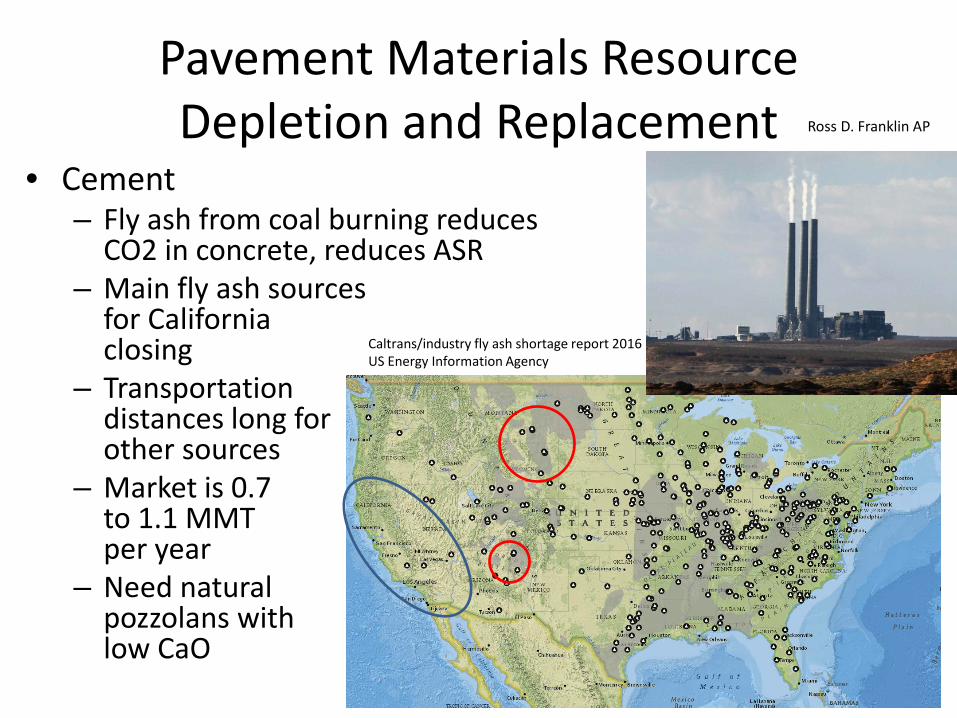
Pavement Materials Resource Depletion and Replacement
• Cement – Fly ash from coal burning reduces
CO2 in concrete, reduces ASR – Main fly ash sources
for California closing
– Transportation distances long for other sources
– Market is 0.7 to 1.1 MMT per year
– Need natural pozzolans with low CaO
Ross D. Franklin AP
Caltrans/industry fly ash shortage report 2016 US Energy Information Agency
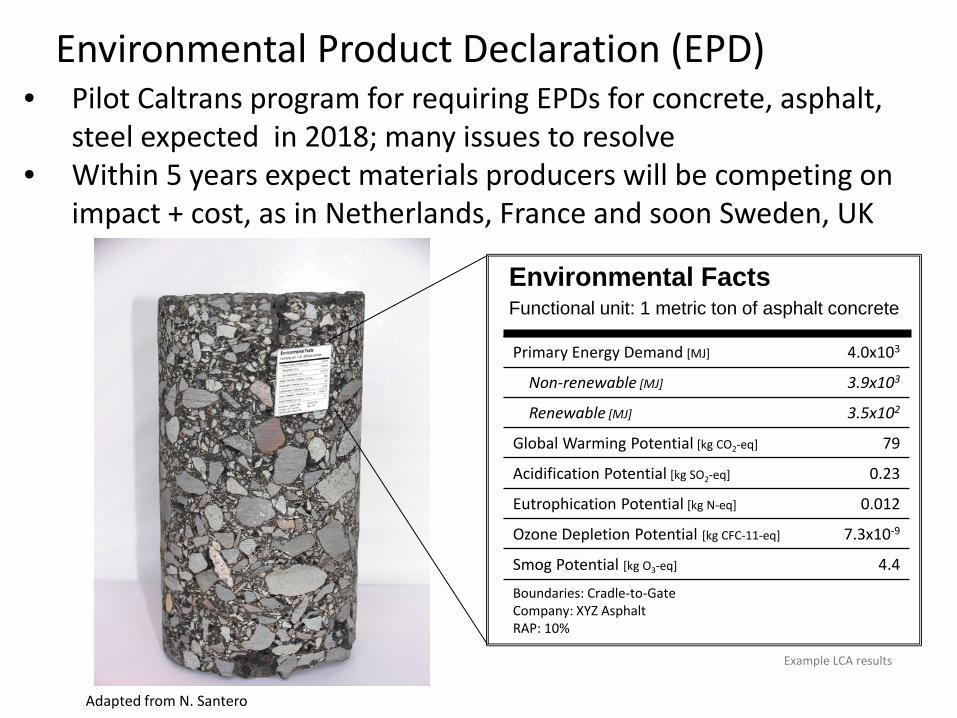
Environmental Facts Functional unit: 1 metric ton of asphalt concrete
Primary Energy Demand [MJ] 4.0x10³
Non-renewable [MJ] 3.9x10³
Renewable [MJ] 3.5x10²
Global Warming Potential [kg CO2-eq] 79
Acidification Potential [kg SO2-eq] 0.23
Eutrophication Potential [kg N-eq] 0.012
Ozone Depletion Potential [kg CFC-11-eq] 7.3x10⁻⁹
Smog Potential [kg O3-eq] 4.4
Boundaries: Cradle-to-Gate Company: XYZ Asphalt RAP: 10%
Adapted from N. Santero
Example LCA results
Environmental Product Declaration (EPD) • Pilot Caltrans program for requiring EPDs for concrete, asphalt,
steel expected in 2018; many issues to resolve • Within 5 years expect materials producers will be competing on
impact + cost, as in Netherlands, France and soon Sweden, UK

Climate Change and Air Pollution: diesel to natural gas then electric vehicles
• Natural gas trucks as 20 year bridge to electric – Trucks: Increase vehicle weight by 250 to 750 kg
depending on range
• Electric vehicles – Cars: currently about 30% heavier for about 30%
of the range – Trucks: small trucks available, tractors for semi-
trucks under development; likely heavier than diesel
Fred Lambert, 7 June 2017 https://electrek.co/guides/tesla-semi/
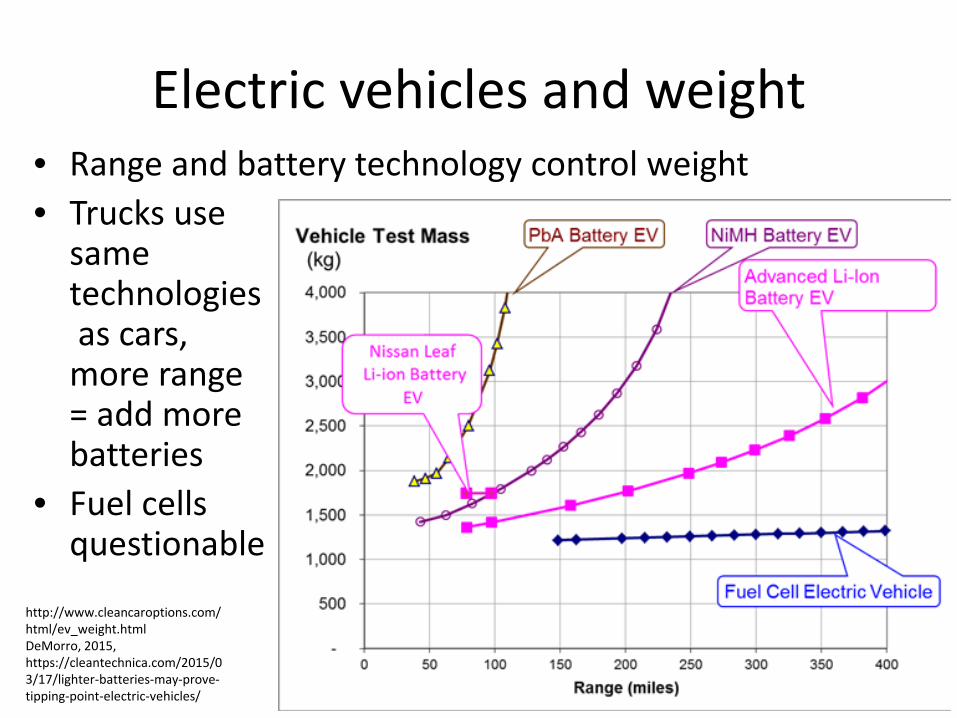
Electric vehicles and weight • Range and battery technology control weight • Trucks use
same technologies as cars, more range = add more batteries
• Fuel cells questionable
http://www.cleancaroptions.com/html/ev_weight.html DeMorro, 2015, https://cleantechnica.com/2015/03/17/lighter-batteries-may-prove-tipping-point-electric-vehicles/

Long-haul truck shown at Tesla shareholders meeting June 2017

Autonomous Vehicle Technology • List of companies with autonomous vehicle testing permits in
California (15 June 2017): – Volkswagen Group of America, – Mercedes Benz, – Waymo – Delphi Automotive – Tesla Motors – Bosch – Nissan – GM Cruise LLC – BMW – Honda – Ford – Zoox, Inc. – Drive.ai, Inc. – Faraday & Future Inc. – Baidu USA LLC – Wheego Electric Cars Inc.
– Valeo North America, Inc. – NextEV USA, Inc. – Telenav, Inc. – NVIDIA Corporation – AutoX Technologies Inc – Subaru – Udacity, Inc – Navya Inc. – Renovo.auto – UATC LLC (Uber) – PlusAi Inc – Nuro, Inc – CarOne LLC – Apple Inc. – Bauer’s Intelligent Transportation – Pony.AI – TuSimple – Jingchi Corp

• Automated Vehicles Symposium2017 – One presentation that
mentions infrastructure • Infrastructure focus on
detection and guidance, not pavement condition
• Will cause increase in car travel?
Autonomous Vehicle Technology

Autonomous Vehicle Technology: effects on pavements
• Fully automated truck platooning expected to deploy starting 2020 and broad implementation by 2030 – 3 to 13% fuel savings
• Asphalt surfaced pavement – Channelized traffic if wander is not programmed into
guidance, faster rutting and fatigue – Truck platooning will reduce thixotropic recovery times at
high speeds, larger strains • Concrete surfaced pavement
– Can program trucks off of the slab edge, lower stresses – Difficulties discerning marking paint
ATA future truck white paper White Paper: Automated Driving and Platooning Issues and Opportunities Sept 2015; fuel savings various Freightliner, Volvo,
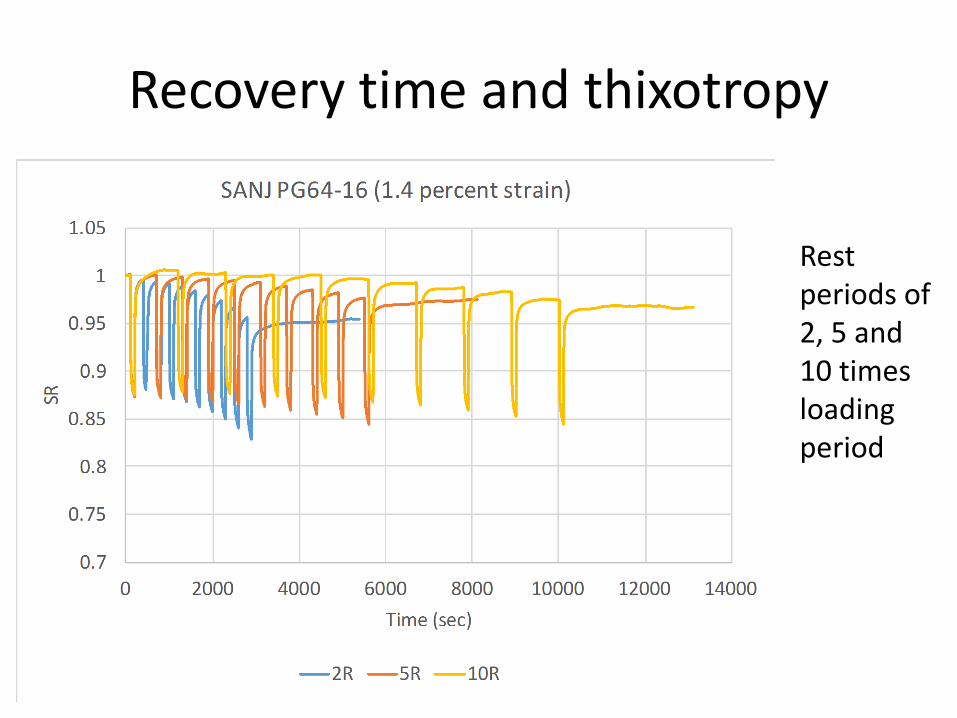
Recovery time and thixotropy
Rest periods of 2, 5 and 10 times loading period

Information technology and pavement • Freight and personal users will soon have better
information about pavement and use it to make route decisions using cell phone apps: – Smoothest route – Least fuel use route – Least freight damage route
• Pavement roughness condition will soon be crowd-sourced to public and road owner with $500 systems – Can get IRI using calibrations
like Class 1 profilers
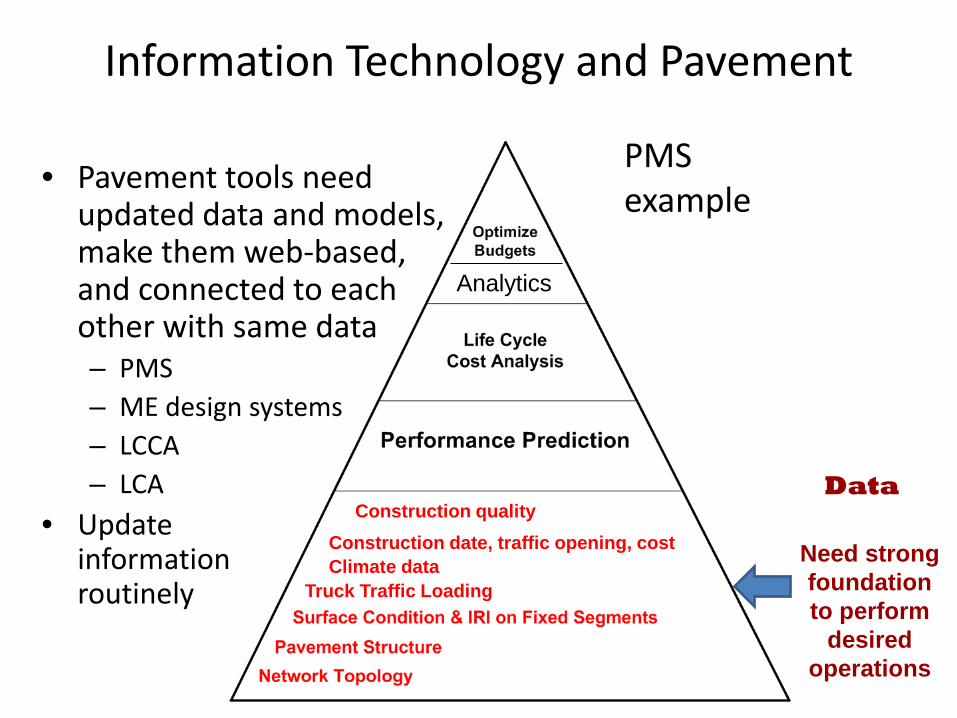
Need strong foundation to perform
desired operations
Data
Truck Traffic Loading
Construction quality Construction date, traffic opening, cost Climate data
Analytics
Information Technology and Pavement
• Pavement tools need updated data and models, make them web-based, and connected to each other with same data – PMS – ME design systems – LCCA – LCA
• Update information routinely
PMS example
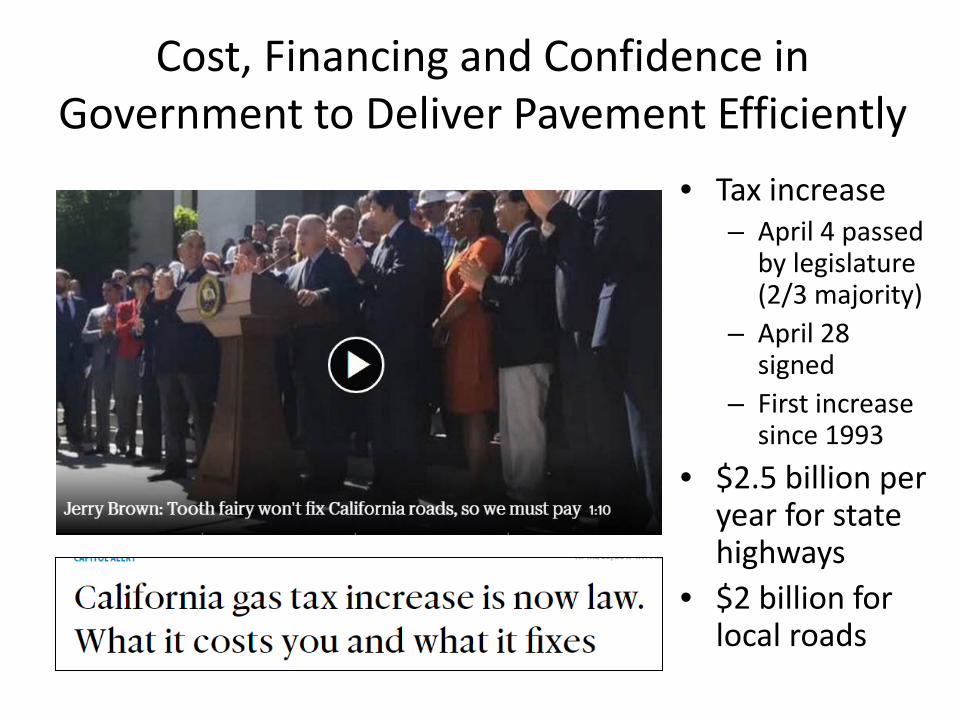
Cost, Financing and Confidence in Government to Deliver Pavement Efficiently
• Tax increase – April 4 passed
by legislature (2/3 majority)
– April 28 signed
– First increase since 1993
• $2.5 billion per year for state highways
• $2 billion for local roads
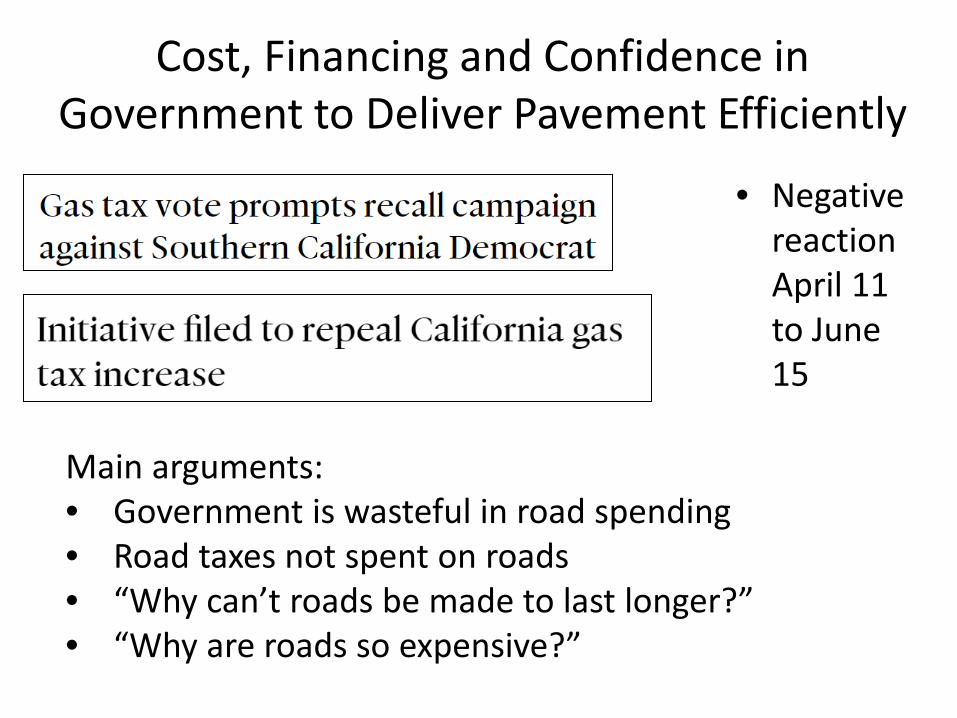
Cost, Financing and Confidence in Government to Deliver Pavement Efficiently
• Negative reaction April 11 to June 15
Main arguments: • Government is wasteful in road spending • Road taxes not spent on roads • “Why can’t roads be made to last longer?” • “Why are roads so expensive?”

Cost, Financing and Confidence in
Government to Deliver Pavement Efficiently
• Poll taken June 8

The Forgotten Half of Our Pavements
National $ Spent on Transportation in 2008 (US Census Bureau)

Urban pavements fail because of utilities • Most urban pavements are scaled down highway
pavements • Invent new materials and structures to handle
utilities?

Pavements are an important part of the urban environment
39%
19%
29%
Pavements
Roofs
Vegetation
14% Other
Sacramento
Akba
ri et
al.
2003
<do
i:10.
1016
/S01
6920
46(0
2)00
165-
2>

Other issues with current approach to urban pavement
• Active transportation – Street geometric and surface
designs generally don’t consider it – Bike path and trails are scaled down
highway pavement designs • Urban forests
– Impermeability – Pavement and root growth
• Noise – Tire pavement noise at higher speeds – Non-absorptive for noise
Land8.com

Pavements = urban hardscape not just roads and streets
• Stormwater management, groundwater infiltration • Tire pavement noise • Human thermal comfort • Pedestrian and bicycle functionality • Better interaction with urban forestry
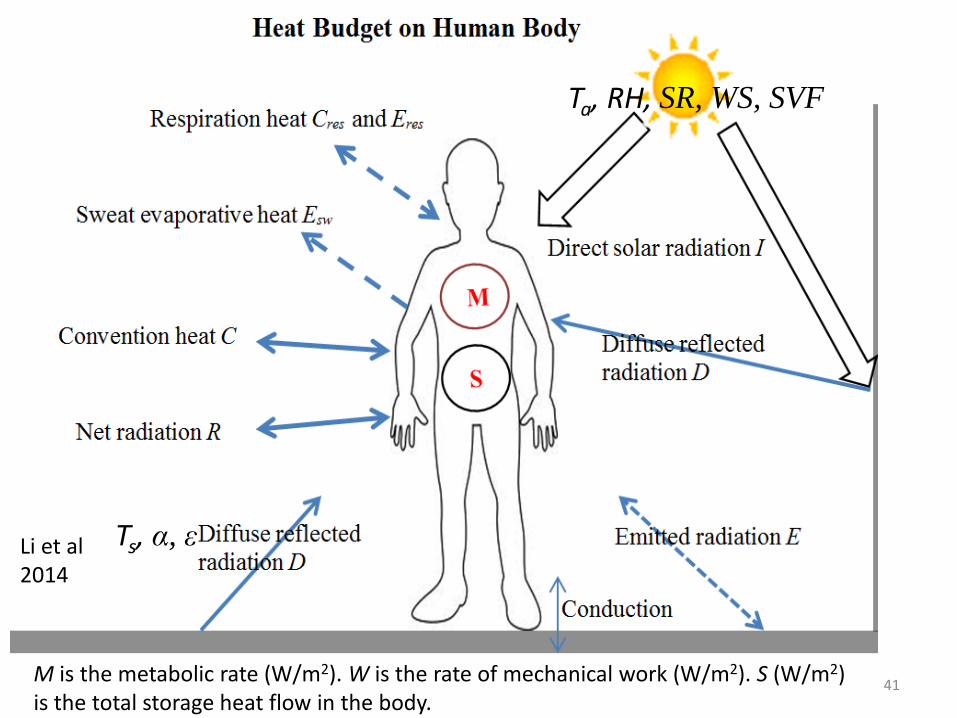
41
Ts, α, ε
Ta, RH, SR, WS, SVF
Li et al 2014
M is the metabolic rate (W/m2). W is the rate of mechanical work (W/m2). S (W/m2) is the total storage heat flow in the body.

Thermal Impacts of Albedo and Reflection
42
More reflective asphalt? Thin reflective coatings for asphalt? Thin concrete with high SCM?
Asphalt (B1), 60 °C
Concrete (C1), 45 °C
Wall, 52 °C
Wall, 55 °C
13:00 8/15/2012

Status of local government pavement knowledge in California
• Agencies – Some agencies have some staff with university training in
pavement; other agencies have no staff with university or other formal pavement training
– Heavy reliance on consultants
• Consultants – Some have excellent staff – Many have no staff with university or other formal training
• Issues: – Old, poorly understood specifications, design methods – Construction quality control for most important issues:
compaction, concrete mix designs
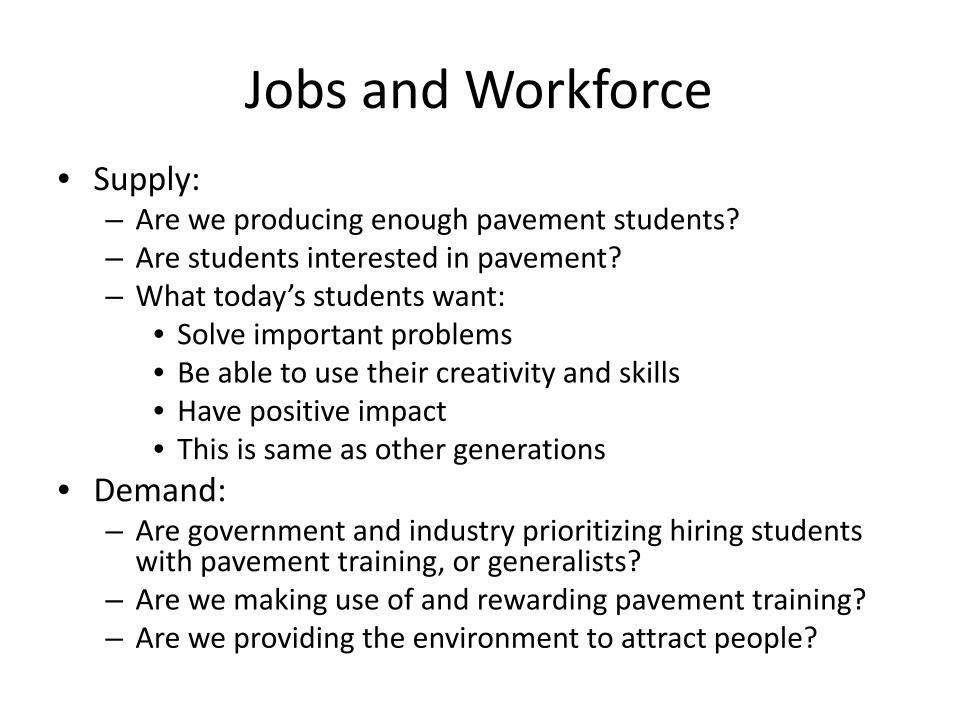
Jobs and Workforce • Supply:
– Are we producing enough pavement students? – Are students interested in pavement? – What today’s students want:
• Solve important problems • Be able to use their creativity and skills • Have positive impact • This is same as other generations
• Demand: – Are government and industry prioritizing hiring students
with pavement training, or generalists? – Are we making use of and rewarding pavement training? – Are we providing the environment to attract people?

Takeaways: do we have stationarity? • Stationarity is not always true
– Demands on pavements can change, potentially rapidly – People want more from pavement, and more people are
involved in decision-making • Changes in California
– Number of trucks increasing rapidly • Especially last mile due to internet purchase deliveries
– Electric vehicles and natural gas may increase loads some – Autonomous vehicles may cause important loading
patterns in space and time – Increasing attention to local roads, multi-functionality – Users will soon have much better information about
pavement and make decisions with it – Low willingness to pay for state-wide tax for pavement

Takeaways: what do our customers want? • Pavements we deliver must do more:
– More sustainable • Cost • Smooth • Construction delay • Small CO2e impacts, more important local effects
• Handle multiple modes and purposes in urban areas – Think of pavement as hardscape, not just for vehicles
• Active transportation (bikes, walking) • Local thermal environment, tree-compatible pavement • Stormwater • Utilities

Takeaways: what do we need to do differently?
• Make pavement last longer for same cost, faster repairs • Make all tools and data web-based for continuous update • Deliver innovation and training that is developed to match
the capabilities of the workforce – Do $5 of development for each $1 of research – Find solutions for local government
• Increase the capabilities of the work force, and put value on pavement knowledge in employment
• Think beyond asphalt vs concrete, think pavement • Find a way to communicate to public about pavement
– Rightly or wrongly, government is not seen as cost-effective deliverer of these services
– Communicate the science and technology innovations – They are interested!

Change Management in Government: Obstacles
• Leaders are chosen based on command of policy, technical expertise, or political connections, not ability to lead change
• Leaders usually have limited time in office • Rules in place to limit corruption also tend to
limit flexibility • Penalties for failure are always larger than any
rewards for success • In a democracy there are many stakeholders with
different goals to manage Frank Ostroff, Harvard Business Review, 2006 https://hbr.org/2006/05/change-management-in-government

Change Management in Government: Steps to Success
• Identify improved performance against mission as the fundamental objective of the transformation effort
• Win over internal and external stakeholders • Create a road map
– Vision, priorities, program – Make the road map a part of the culture of the
organization • Take a comprehensive approach
– leadership, structure, processes, infrastructure (including technology), people, and performance management
• Need leaders – Reward their efforts
Adapted from Frank Ostroff, Harvard Business Review, 2006

Change Management in Government: Communicating with the Public
• What is our message about what is being done that is positive and better
• Livability and Quality of Life, relate to people’s lives – Access by different modes, shared prosperity,
environmental impact, public participation, safe and healthy communities, wise use of resources
• Relate to people’s pocketbooks • Set goals and measure and report progress • Have the right messengers
– Trusted messengers who are informed about pavement progress, not necessarily pavement engineers!
Catherine Hurley, Argonne Nat Lab, ISIE conference 2017

California Pavement Research Road Map Areas
• Design, materials and construction – Mechanistic-empirical design – Performance based specifications – Construction quality
• Environmental, maintenance – Recycling technologies – Life cycle assessment (LCA)
• Maintenance – Preservation technologies – Pavement management
• Pavement management system (PMS) • Life cycle cost analysis (LCCA)

Communication of pavement road map • Entire program communicated in plain language on two
A3 pages

Research arc in detailed road maps for each subject area

Local Government: the forgotten 50%
State and federally funded research and development for highways
Training, development
of appropriate technology, specialized
research for local
governments
Technical Advisory Group: League of Cities,
Association of Counties
Partnered with teaching universities
Modeled on Minnesota, Iowa programs

Selection of Closure Type for Concrete Freeway Reconstruction using CA4PRS
TotalClosures
ClosureHours
UserDelay
AgencyCost
TotalCost
1 RoadbedContinuous 2 400 5.0 15.0 20.0 80
72-Hour WeekdayContinuous 8 512 5.0 16.0 21.0 50
55-Hour WeekendContinuous 10 550 10.0 17.0 27.0 80
10-Hour Night-timeClosures 220 2,200 7.0 21.0 28.0 30
Max.PeakDelay(Min)
ConstructionScenario
ScheduleComparison
Cost Comparison ($M)

Yes,70%
No,30%
Before- construction After-construction
I-15 Devore Web-Surveys Public Perception Changes
Do you support future “Rapid-Rehab” projects?
OtherNegative
11%
No,Nighttime or
weekend64%
No, Cancelproject
14%
Adding lane,4%
Continuousclosures, 7%
Do you support 72-h (3-weekday) Weekday closures?

Expectations for Transportation Segment of the Economy
S. David Freeman UCLA Seminar: Infrastructure Investment for Sustainable Growth (October, 2010)
– Transportation sector about to enter a period of profound change similar to energy sector in 1970s and 1980s
– Regulations will be implemented requiring increasing energy efficiency and environmental performance
– Transformation necessary to maintain economic competitiveness of US
– We are no longer rich enough to make many mistakes and still be able to achieve our goals
– I would add: we need to better focus our research, translate our results into practice, and communicate to the public to achieve our goals

Thanks to many colleagues
Questions?