importance of accurate dna structures in solution: the jun–fos
TRANSCRIPT
doi:10.1016/j.jmb.2008.07.047 J. Mol. Biol. (2008) 382, 956–970
Available online at www.sciencedirect.com
Importance of Accurate DNA Structures in Solution: TheJun–Fos Model
Brahim Heddi1, Nicolas Foloppe⁎, Christophe Oguey2
and Brigitte Hartmann1⁎
1Laboratoire de BiochimieThéorique, CNRS UPR 9080,Institut de Biologie Physico-Chimique, 13 rue Pierre et MarieCurie, 75005 Paris, France2Laboratoire de PhysiqueThéorique et Modélisation,Université de Cergy-Pontoise,95031 Cergy-Pontoise, FranceReceived 9 May 2008;received in revised form11 July 2008;accepted 19 July 2008Available online25 July 2008
*Corresponding authors. E-mail [email protected]; Brigitte.HPresent address: N. Foloppe, 51 N
CB1 3NY, UK.Abbreviations used: MD, molecul
nuclear Overhauser enhancement; Rcoupling; X-disp, X-displacement; Telement; g−, gauche minus; g+, gauchpercentage.
0022-2836/$ - see front matter © 2008 P
Understanding the recognition of DNA sequences by proteins requires anaccurate description of the structural dynamics of free DNA, especiallyregarding indirect readout. This involves subtle sequence-dependent effectsthat are difficult to characterize in solution. To progress in this area, weapplied NMR and extensive simulations to a DNA sequence relevant to theJun–Fos system. The backbone and base behaviors demonstrate thatunrestrained simulations with major force fields (Parm98, Parmbsc0, andCHARMM27) are not reliable enough for in silico predictions of detailedDNA structures. More realistic structures required molecular dynamicssimulations supplemented by NMR restraints. A new methodological ele-ment involved restraints inferred from the phosphate chemical shifts andfrom the phosphate dynamics. This provided a detailed and dynamic viewof the intrinsic properties of the free DNA sequence that can be related to itsrecognition, by comparison with a relevant DNA–protein complex. Weshow how to exploit the relationship between phosphate motions andhelicoidal descriptors for structure determination toward an accuratedescription of DNA structures and dynamics in solution.
© 2008 Published by Elsevier Ltd.
Keywords: TRE site; DNA conformation; DNA recognition; force fields; BIIsequence effect
Edited by D. CaseIntroduction
Many proteins deform DNA upon binding. There-fore, one surmises that specific DNA–protein recog-nition is informed by the intrinsic mechanicalproperties of DNA, which would facilitate itsdeformation in the complex (indirect readout).These intrinsic mechanical properties would revealthemselves by influencing the structure of DNAwhen free in solution. Hence, understanding indir-ect readout mechanisms requires accurate DNAstructures in solution. However, this has remained amajor challenge in structural biology because it
resses:[email protected] Road, Cambridge
ar dynamics; NOE,DC, residual dipolarRE, TPA-responsivee plus; %BII, BII
ublished by Elsevier Ltd.
involves subtle and dynamic structural variationsalong the DNA sequence.X-ray crystallography has revealed a wealth of
information about DNA architecture, but the finestructural variations thus derived must be ap-proached with great care. It is documented thatsuch fine structures are influenced by the lattice andcrystallization conditions.1–3 Furthermore, theymostly offer a static representation. Despite theselimitations, statistical analyses of DNA structures incrystals4,5 and solution5,6 have unveiled similartrends in mechanical couplings between backboneconformations and helicoidal parameters. Theseconfirmed the notion of intrinsic mechanical proper-ties distinctive of a given DNA sequence. Thesestatistical trends, however, are not sufficient to predictaccurately the fine structure of a DNA sequence insolution.NMR has emerged as a powerful method to
investigate the fine structure of DNA in solution,providing experimental restraints that can becombined with modern molecular simulations.With unlabeled DNA, it probes short interprotondistances via nuclear Overhauser enhancement(NOE) measurements. These suffer from a low den-

957Importance of Accurate DNA Structures Solution
sity of protons, limiting the number of measurabledistances. It remains unclear how precisely thesedata alone determine the DNA structure.7,8 In thiscontext, the derived structure may depend on therefinement protocols, including the molecular forcefield and representation of the solvent.9 Nucleic acidNMR in general has recently benefited from newdevelopments, including 31P chemical shift aniso-tropy10 and residual dipolar coupling (RDC),11–13
that practically require labeled DNA. However, forvarious reasons, the incorporation of such restraintsinto classic simulations may not significantlyimprove the structural refinements.14 The exploita-tion of such restraints in the refinement proceduresis more difficult for DNA than for proteins;14 forexample, simulations using RDC need a tensor ofanisotropy that is not yet experimentally accessiblefor DNA. Using a van der Waals-based potentialcould overcome this problem but necessitates aradius of gyration restraint to compensate for thelack of translational information in RDC. Thismethod is efficient with globular proteins but isprone to artificial distortions (essentially bending) ofthe global DNA structure.This inspired a new approach based on potentials
of mean force that, under numerous RDCs, chemicalshift anisotropy, scalar couplings, and distancerestraints, reproduced well the extensive NMR andlarge-angle X-ray scattering data obtained on theEcoRI dodecamer.14,15 Yet, the generality of thisapproach may still be limited by the amount andsophistication of the required input experimentaldata. On the other hand, progress has recently beenmade in quantifying the populations of the DNAbackbone BI and BII states by routine NMR insolution6 on unlabeled DNA. These backbone statesare sequence dependent and intimately coupled tothe DNA helicoidal parameters,4–6,16–19 which definemuch of DNA fine structure and intrinsic mechanicalproperties. It is therefore of great interest to investi-gate how the BI/BII populations can be used to aid inthe refinement of DNA structures in solution, asaddressed in the present work. Given the dynamicnature of the BI↔BII equilibrium and the associatedDNA deformations, such refinement is combinedwith molecular dynamics (MD) simulations.MD simulations in explicit solvent have the
potential to characterize DNA structure and dyna-mics in atomic detail. However, the informationderived from such simulations is only as reliable asthe underlying force fields. Major efforts have beendevoted to the development of DNA force fields. Thelast decade haswitnessed impressive progress in thisarea, particularly with the CHARMM27 potential20
and the AMBER family21,22 of force fields. Forinstance, it has become possible to obtain stablesimulations of double-stranded DNA in solution, tosimulate the DNA preference for its A or B form,23–25
and to start addressing the role of counterionsaround DNA26 and DNA flexibility in solution.27
Comparison between simulations and solutionNMRobservables, particularly with respect to sugarpuckers and χ angles, can be used to show that
simulations provide a fair representation of featurestypical of the B-DNA form.9,28,29 These remarkablesuccesses have reinvigorated the general interest inDNA structures in solution, even fueling expecta-tions that they may now be obtained solely from firstprinciples.30,31However, the rarity of accurate reference DNA
structures in solution means that uncertaintyremains regarding the force-field representations offine, but salient, details and their sequence depen-dency, such as helicoidal variations at each basestep. Indeed, recent studies have started to unveillimitations regarding the detailed representation ofDNA32,33 and its constituents29 in solution by thelatest generation of force fields. One study32 foundthat order parameters for C–H vectors in unrest-rained MD simulations agreed poorly with 13CNMR measurements. There was a closer agreementbetween NMR and simulations when MD simula-tions were performed under 1H NMR-deriveddistance restraints, suggesting that the unrestrainedMD simulations suffered from inadequacies in thepotentials. Another study33 obtained X-ray diffrac-tion fingerprints in solution, compared with theirequivalent calculated from MD simulations. Thesimulations did not resolve the sequence dependen-cies in fingerprints identified experimentally. Thatwork demonstrated that the discrepancies betweensimulations and experiments were rooted in theDNA force field and not the amount of samplingduring the MD simulations. Reducing complexmolecular ensembles to fingerprints provides anelegant way to test DNA force fields; however, thisapproach may be less apt at identifying thestructural details differing between simulated andreal structures. Indeed, one would like to go beyondthe detection of deficiencies and to provide accurateDNA structures in solution to guide the refinementof force fields.Given the abovementioned general context, we
embarked on solving the detailed structure of aDNA sequence in solution that would combinestructural, methodological, and biological interests.The selected sequence is that of the Jun–Fosoligomer. Structural interest in it stems from thedistinctive propensity of some of its phosphates toadopt the BII state.6 This is more than a physico-chemical curiosity because the BI↔BII equilibrium ismechanically coupled to the DNA helicoidal para-meters [e.g., roll, twist, andX-displacement (X-disp)]and therefore to its overall structure.4–6,16–19 Thismay have general far-reaching implications forDNA–protein recognition. However, a practicaland accurate characterization of these effects forDNA in solution has been lacking, if only because ofdifficulties in measuring the BII populations. Suchpopulations were quantified for the first time withthe Jun–Fos oligomer6 and shown to be modulatedby the nature of monovalent cations.34 Thus, theJun–Fos oligomer has emerged as a leading modelsystem to understand the BI↔BII equilibrium insolution and its implications for DNA structure andrecognition in general. Elucidating the behavior of

958 Importance of Accurate DNA Structures in Solution
such a sequence in solution would start to shed lighton its dynamic structural repertoire, revealed by thebackbone flexibility. This leads to a second metho-dological strand by providing an original andstringent test of DNA force fields. It also offers anopportunity to explore how the experimental BI/BIIpopulations may be harnessed to aid in the refine-ment of DNA structures in solution.In addition, the free Jun–Fos oligomer structure
would offer a basis onwhich to begin understandingthe factors underpinning the specific recognition ofthis DNA sequence by its cognate transcriptionfactors. Indeed, the Jun–Fos DNA oligomer containsthe TRE (TPA-responsive element) site, one of theAP-1 sequences found in the regulatory regions ofnumerous genes, including oncogenes.35 TRE bindswith the highest affinity to the heterodimer Jun–Fos,one of the many eukaryotic AP-1 transcriptionfactors.36 The TRE sequence is TGAGTCA, withtwo TGA•TCA half-sites separated by a G•C basepair. The crystal structure of the Jun–Fos basicleucine zipper domain bound to TRE37 showed thatTRE can bind Jun–Fos in two opposite orientations(Jun or Fos on the TGAG part) and that the basicregions of Jun and Fos make base-specific contacts inthe TRE major groove. Measurements in solutionshowed that sequences flanking TRE affect theheterodimer orientation,38,39 which in turn influ-ences transcription via interactions with otherfactors.39,40 These results suggest that the interactioninterface extends beyond TRE itself. Sequencesflanking a binding site may still influence bindingindirectly via induced structural features, as demon-strated on the nuclear factor-κB system.41–43 Thus, toinvestigate the recognition of TRE and its flankingbases, we studied the 14-bp GCATTCTGAGTCAGsequence centered on the junction between TRE(boldface) and its GCATTC 5′ extension.In sum, several motivations led to the present
analysis of the structure and dynamics of the Jun–Fos oligomer free in solution. The structure wasderived from NMR measurements combined withsimulation work. Although only routine NMR datafrom unlabeled DNA were used, these weresupplemented by a novel methodological element,namely, active use of the experimentally determinedphosphate BI/BII populations. Thus, these popula-tions were used i) as additional restraints on themolecular dynamics, ii) to select representativeensembles of the DNA structure from the simula-
Table 1. Nomenclature for the MD simulations of the Jun–Fo
NMR restraintApplication of
restraints Par
None NA A982 distances in the Res_direct set Instantaneous A9100 distances in the Res_extra set Instantaneous A9
Time averaged A9
A98 and Absc refer to the AMBER Parm98 and Parmbsc0 force fiel(unrestrained) MD simulations are designated with “f.” Restrained MDon the restraints listed in the table. Time is the duration of the MD sim
tions. Many simulations were generated, with andwithout experimental restraints, each with threemodern DNA force fields.20–22 This offered a specialopportunity to use established simulation protocolsto test and compare these force fields for theirdetailed representation of DNA in solution, byreference to experiments. It emerged that the fineDNA structure is not represented by any of theunrestrained force fields. However, when experi-mental restraints and filters are applied, extensiveMD simulations do lead to a detailed view of theJun–Fos oligomer dynamics in solution. This freestructure forms a basis for comparison with itscounterpart bound to the Jun–Fos heterodimer. Theresults of this comparison, together with themethodological developments on which they rest,demonstrate the importance of accurate character-izations of DNA structures in solution.
Results
Overview of the simulations
A total of 11 MD simulations of the oligomer wasperformed with the Parm98, Parmbsc0, andCHARMM27 force fields. The nomenclature for thesimulations and associated conditions are shown inTable 1. UnrestrainedMD simulations were obtainedwith each force field. The other simulations werecarried out under two sets of restraints,Res_direct andRes_extra (Materials and Methods, Table 2 and TableS1 in Supplementary Material). Each simulation wasperformed for at least 15 ns, which is sufficient forconvergence (Materials and Methods). In each MDsimulation, the root mean square deviations(RMSDs) between the snapshots and canonical B-DNA and A-DNAwere b2.8 and N5 Å, respectively.So, the overall simulated structures were stable,staying in the B form, consistent with the NMR data.
Measured versus simulated distances
NMR measurements on the Jun–Fos oligomeryielded numerous intranucleotide (intrasugar andsugar to base) and internucleotide (basei/basei+1and sugari/basei+1) distances. A common estimateof the agreement between experimental NMR(d_exp) and theoretical MD (d_theor) distances is to
s oligomer
Force field
Time (ns)m98 Parmbsc0 CHARMM27
8_f Absc_f C27_f 308_r1 Absc_r1 C27_r1 158_r2 Absc_r2 C27_r2 158_r3 Absc_r3 NA 15
ds, respectively. C27 refers to the CHARMM27 force field. Freesimulations are designated with “r1,” “r2,” and “r3,” dependingulations in nanoseconds. NA indicates not applicable.
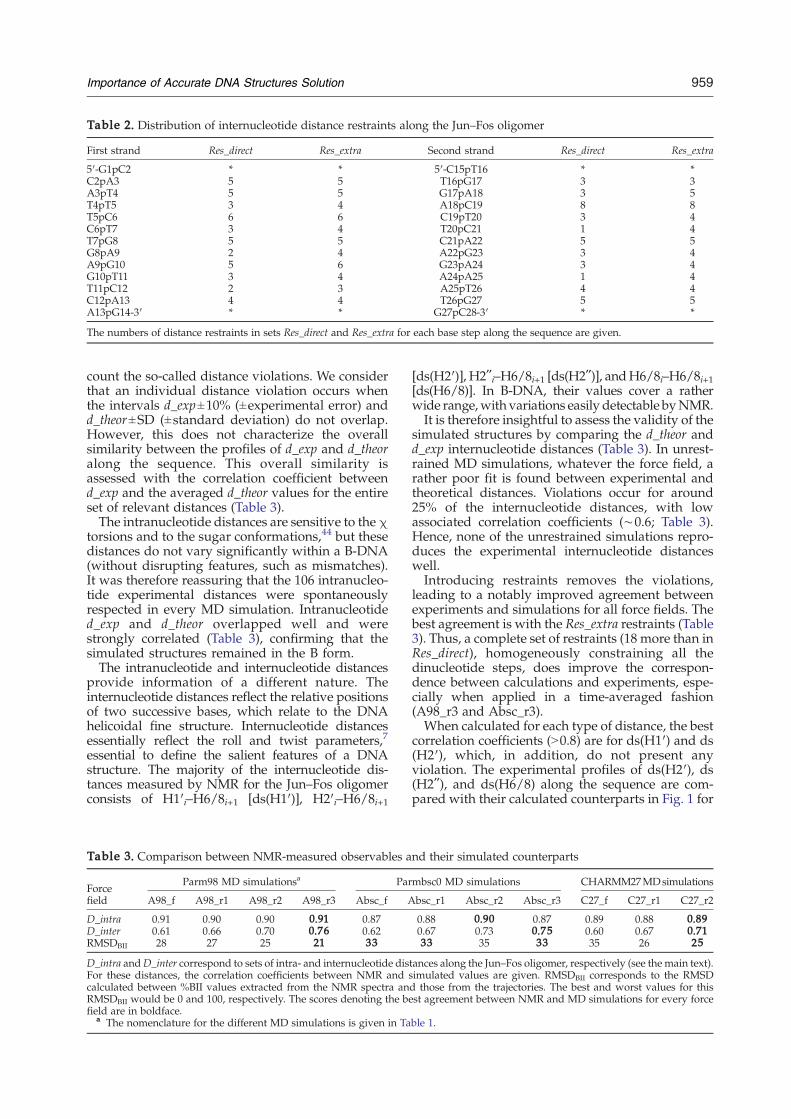
Table 2. Distribution of internucleotide distance restraints along the Jun–Fos oligomer
First strand Res_direct Res_extra Second strand Res_direct Res_extra
5′-G1pC2 * * 5′-C15pT16 * *C2pA3 5 5 T16pG17 3 3A3pT4 5 5 G17pA18 3 5T4pT5 3 4 A18pC19 8 8T5pC6 6 6 C19pT20 3 4C6pT7 3 4 T20pC21 1 4T7pG8 5 5 C21pA22 5 5G8pA9 2 4 A22pG23 3 4A9pG10 5 6 G23pA24 3 4G10pT11 3 4 A24pA25 1 4T11pC12 2 3 A25pT26 4 4C12pA13 4 4 T26pG27 5 5A13pG14-3′ * * G27pC28-3′ * *
The numbers of distance restraints in sets Res_direct and Res_extra for each base step along the sequence are given.
959Importance of Accurate DNA Structures Solution
count the so-called distance violations. We considerthat an individual distance violation occurs whenthe intervals d_exp±10% (±experimental error) andd_theor±SD (±standard deviation) do not overlap.However, this does not characterize the overallsimilarity between the profiles of d_exp and d_theoralong the sequence. This overall similarity isassessed with the correlation coefficient betweend_exp and the averaged d_theor values for the entireset of relevant distances (Table 3).The intranucleotide distances are sensitive to theχ
torsions and to the sugar conformations,44 but thesedistances do not vary significantly within a B-DNA(without disrupting features, such as mismatches).It was therefore reassuring that the 106 intranucleo-tide experimental distances were spontaneouslyrespected in every MD simulation. Intranucleotided_exp and d_theor overlapped well and werestrongly correlated (Table 3), confirming that thesimulated structures remained in the B form.The intranucleotide and internucleotide distances
provide information of a different nature. Theinternucleotide distances reflect the relative positionsof two successive bases, which relate to the DNAhelicoidal fine structure. Internucleotide distancesessentially reflect the roll and twist parameters,7
essential to define the salient features of a DNAstructure. The majority of the internucleotide dis-tances measured by NMR for the Jun–Fos oligomerconsists of H1′i–H6/8i+1 [ds(H1′)], H2′i–H6/8i+1
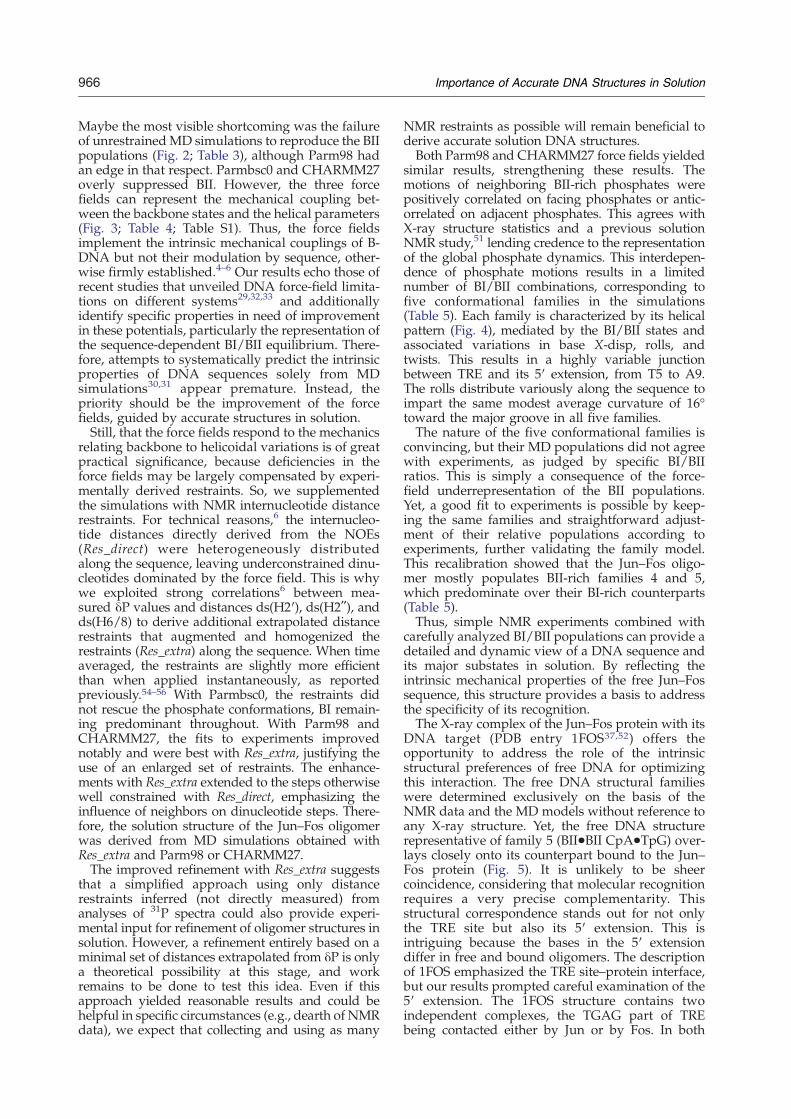
Table 3. Comparison between NMR-measured observables a
Forcefield
Parm98 MD simulationsa Par
A98_f A98_r1 A98_r2 A98_r3 Absc_f A
D_intra 0.91 0.90 0.90 0.91 0.87D_inter 0.61 0.66 0.70 0.76 0.62RMSDBII 28 27 25 21 33
D_intra andD_inter correspond to sets of intra- and internucleotide disFor these distances, the correlation coefficients between NMR andcalculated between %BII values extracted from the NMR spectra anRMSDBII would be 0 and 100, respectively. The scores denoting the bfield are in boldface.
a The nomenclature for the different MD simulations is given in Ta
[ds(H2′)], H2ʺi–H6/8i+1 [ds(H2ʺ)], andH6/8i–H6/8i+1[ds(H6/8)]. In B-DNA, their values cover a ratherwide range,with variations easily detectable byNMR.It is therefore insightful to assess the validity of the
simulated structures by comparing the d_theor andd_exp internucleotide distances (Table 3). In unrest-rained MD simulations, whatever the force field, arather poor fit is found between experimental andtheoretical distances. Violations occur for around25% of the internucleotide distances, with lowassociated correlation coefficients (∼0.6; Table 3).Hence, none of the unrestrained simulations repro-duces the experimental internucleotide distanceswell.Introducing restraints removes the violations,
leading to a notably improved agreement betweenexperiments and simulations for all force fields. Thebest agreement is with the Res_extra restraints (Table3). Thus, a complete set of restraints (18 more than inRes_direct), homogeneously constraining all thedinucleotide steps, does improve the correspon-dence between calculations and experiments, espe-cially when applied in a time-averaged fashion(A98_r3 and Absc_r3).When calculated for each type of distance, the best
correlation coefficients (N0.8) are for ds(H1′) and ds(H2′), which, in addition, do not present anyviolation. The experimental profiles of ds(H2′), ds(H2ʺ), and ds(H6/8) along the sequence are com-pared with their calculated counterparts in Fig. 1 for
nd their simulated counterparts
mbsc0 MD simulations CHARMM27MDsimulations
bsc_r1 Absc_r2 Absc_r3 C27_f C27_r1 C27_r2
0.88 0.90 0.87 0.89 0.88 0.890.67 0.73 0.75 0.60 0.67 0.7133 35 33 35 26 25
tances along the Jun–Fos oligomer, respectively (see the main text).simulated values are given. RMSDBII corresponds to the RMSDd those from the trajectories. The best and worst values for thisest agreement between NMR and MD simulations for every force
ble 1.

Fig. 1. Average values (in angstrom) of the internucleotide distances ds(H2′), ds(H2ʺ), and ds(H6/8) along the Jun–Fosoligomer sequence. The experimental data ( ) are plotted along their counterparts extracted fromMD simulations A98_r3(■), Absc_r3 (▴), and C27_r2 (*), as defined in Table 1. The bars cover experimental errors for the NMR data and standarddeviations for the MD simulations. ds(H2ʺ) values are virtually identical with the three force fields.
960 Importance of Accurate DNA Structures in Solution
the most realistic simulations (A98_r3, Absc_r3, andC27_r2). For ds(H2′) and ds(H2ʺ), the profile ofd_exp versus that of d_theor are very similar with allforce fields. For ds(H2ʺ), there is a systematic shift of0.3 Å between d_exp and d_theor; however, whenderived by NMR, these distances are known to beoverestimated as compared with X-ray data.45–47
For ds(H6/8), the agreement between experimentand calculations seems less good. However, takingthe experimental error bars into account, there isonly one violation between d_exp and d_theor.Incidentally, the added distances in Res_extra
(versus Res_direct) do not act only on the stepswhere they are applied (not shown). The improve-ments are distributed on the whole sequence,reflecting the conformational interdependence ofsuccessive base pairs.In sum, the simulations require restraints to fit the
experimental data. Therefore, none of the force fieldstested here would, alone, predict accurately thestructure of the Jun–Fos oligomer in solution. Next,we analyze the behavior of sugars and phosphategroups, which are never restrained in the MDsimulations.
Sugar puckerings
Given the 3JH1′–H2′ scalar couplings,6 no sugarcould be more than 10%–15% in north. Indeed, thesimulated sugars remained predominantly in southwith Parm98 and CHARMM27. The sugars linked topurines were also mainly in south with Parmbsc0. Inthis potential, however, the sugars attached topyrimidines oscillated between south (∼50%) andeast (∼50%).The intrasugar distances H4′i–H1′i are sensitive to
the east and south conformers44,48 but suffer from
severe proton overlaps in NMR spectra, here and ingeneral. This prevents a comparison betweenexperiment and simulation for these distances andtheir use as restraints. In addition, the 3JH1′–H2′ scalarcouplings are not sufficiently accurate to distinguishsouth and east conformers. Thus, the validity of eastpuckers with Parmbsc0 remains an open question.Yet, it is remarkable that the reparametrization of theα/γ torsions in Parmbsc0 had such a strong indirecteffect on the behavior of the sugars, by comparisonwith Parm98.
Backbone conformations
The DNA backbone comprises two groups oftorsions, α/β/γ and ε/ζ, none of which wasconstrained in the simulations. In B-DNA, α/β/γgenerally is in gauche minus (g−)/trans/gauche plus(g+).4,49 Indeed, the NMR did not detect unusualconformations of α/β/γ in the Jun–Fos oligomer.6
Although Parm98 has a propensity to drive α/γ inthe unusual g+/trans conformations,21,31,49 α/β/γremained canonical in the present MD simulations.The torsions ε and ζ in B-DNA are strongly
correlated. Two conformational combinations, BI(ε= trans, ζ=g−, with ε–ζ=−90°) and BII (ε=g−,ζ = trans, with ε–ζ=+90°), exist in the B form. TheBI/BII ratios have been rarely considered until nowin the NMR refinement procedures, essentially dueto difficulties in converting the 31P chemical shiftvalues (δP) into precise structural information.However, a methodology was presented6 to inter-pret the δP quantitatively in terms of BI/BIIpopulations. On the other hand, it is straightforwardto extract the corresponding populations from theMD simulations. Therefore, the Jun–Fos oligomeroffers a unique opportunity for a direct comparison

961Importance of Accurate DNA Structures Solution
of the BI/BII populations obtained from NMR andMD simulations, providing a key test of the under-lying force fields.The influence of the sequence on BI/BII popula-
tions was observed in crystals4,5 and solution,5,6
revealing a variety of behaviors for the phosphategroups. There are base-step categories (YpY, TpA,ApR, and RpY, but not GpC; Y for pyrimidines, andR for purines) in which the phosphate group isessentially trapped in BI. In contrast, YpR (but notTpA), GpR, and GpC are conducive to BII. The Jun–Fos NMR data reflect these general sequence effectson the BI/BII ratios, the BII-rich steps being the threeCpA steps (69%–85% of BII), their complementaryTpG steps (26%–52% of BII), and the three GpAsteps (32%–52% of BII).6
The experimental BI/BII populations and theirsequence dependence are not reproduced by thetested force fields in the unrestrained simulations(Fig. 2, “Unrestrained”). So, the RMSDs between theBII percentages (%BII; RMSDBII) extracted from theNMR data and those from the trajectories are high(Table 3). Irrespective of that, the correlationbetween ε and ζ is, however, well retrieved (notshown). Unrestrained Parmbsc0 and CHARMM27
Fig. 2. %BII values along the Jun–Fos oligomer sequencounterparts from the Parm98 (■, □) Parmbsc0 (▴, △), ansimulations. Bottom: MD simulations under restraints Res_dapplied instantaneously (open symbols) or in a time-averaged
allow little BII character. Globally, Parm98 confers agreater flexibility to the phosphates, but thesequence effects are not respected: the %BIIs of theGpA phosphates are overestimated by 20%; con-versely, the CpA and TpG phosphates were con-fined in BI, although their experimental %BIIcounterparts are ∼80% and 40%, respectively.In NMR, the ds(H2′), ds(H2ʺ), and ds(H6/8)
distances are strongly correlated to the δP valuesof the corresponding base steps, which in turn aredirectly related to the BI/BII ratios.6 Also, thesedistances correlate with the %BII in the unrestrainedsimulations (not shown). This suggested that intro-ducing these experimental distances as restraintswould act on the backbone behavior in the simula-tions, in addition to bringing these distances in theexperimental regime (see above). The effect of therestraints can be seen by comparing calculated andexperimental BI/BII populations (Fig. 2; Table 3).With Parmbsc0, the restraints are respected but haveno effect toward reproducing the experimental BI/BII populations. With CHARMM27, the tworestraint sets give similar results, clearly improvingthe BI/BII phosphate populations. However, thebest fit to the experiment is with Parm98 in
ce. The experimental data ( ) are plotted along theird CHARMM27 (*) force fields. Top: Unrestrained MDirect (left) and Res_extra (right). Res_extra restraints werefashion (filled symbols).

962 Importance of Accurate DNA Structures in Solution
conjunction with the time-averaged application ofRes_extra (Table 3), A98_r3 being in reasonableagreement with the NMR %BII.Overall, in the absence of restraints, the force
fields do not reproduce, even qualitatively, the BIIpopulations in the Jun–Fos oligomer. We expect thisto be the case in general because it reflects intrinsicproperties of the potentials. The force fields can besupplemented with experimental internucleotidedistance restraints that should influence the BI–BIIequilibrium indirectly, via the DNA mechanicalresponse. However, this is not a quick, convenientfix for the force-field deficiencies, if only because theDNA response is force field dependent. Yet, it isreassuring that, under the restraints, CHARMM27and Parm98 produced structures in closer agree-ment with the experimental %BII. This is of clearpractical interest, considering the general impor-tance of the BI–BII equilibrium for the structure ofDNA. Therefore, we examined the impact of the BIIconformations on the helical properties of the Jun–Fos oligomer.
Correlations between backbone states andhelical structure
Rather than the BI/BII state of a single phosphate,it is the combination of phosphate conformationsfacing each other across the strands (BI•BI, BI•BII,or BII•BII) that influences the helical roll and twistparameters. Statistics on X-ray DNA structures4 andmodeling5 showed that the greater the BII characterof a complementary dinucleotide, the higher thetwist and the more negative the roll. The basedisplacements are also dependent on the conforma-tions of the facing phosphates. In MD simulations ofthe Jun–Fos sequence, these relationships areretrieved on all the CpA•TpG and GpA•TpC BII-rich steps (Fig. S1 in Supplementary Material). Theaverage twist and roll values for these steps from X-ray statistics and the present MD simulations areshown in Table 4 for the three backbone conforma-tions. Comparing with X-ray, Parm98 and Parmbsc0underestimate the BI•BI twist and favor overly
Table 4. Influence of the backbone conformation on selected
X-ray Parm98
Twist Roll Twist Ro
CpA•TpGBI•BI 33.7 (5) 4.7 (2) 23.6 (6) 11.4BI•BII 38.2 (5) −0.7 (4) 36.6 (4.5) 2.9BII•BII 49.0 (2) −9.6 (5) 47.0 (3.5) −3.8
GpA•TpCBI•BI 34.7 (5) 2.4 (5) 33.5 (8) 1.9BI•BII 38.7 (4) −0.5 (4) 38.9 (6) 1.2BII•BII 49.8 (2) −10.1 (5) 43.3 (4) −6.5
Average values of twist (in degrees) and roll (in degrees) in X-ray and Mthe three possible facing backbone conformations (BI•BI, BI•BII, and Bare in brackets. The X-ray statistics from high-resolution DNA strsimulation counterparts, using all the MD simulations listed in Tablpopulated with Parmbsc0 MD simulations, and the corresponding vapplicable because there was no BII•BII in those trajectories.
positive rolls, particularly for CpA•TpG steps. TheBII•BII steps, almost absent with Parmbsc0, have aless negative roll with Parm98 compared with X-rayand CHARMM27. Indeed, CHARMM27 reproducesthe crystallographic values well, except the twistassociated with BII•BII, underestimated by 10°. Still,each force field reflects the general trend: BI-richsteps associated with low twists/positive rolls andBII-rich steps associated with high twists/negativerolls.Another helical descriptor is the base pair X-disp,
of special interest because it relates to groovedimensions and therefore base accessibilities. X-dispis influenced by the BII conformers.4,5,18,41 Displace-ment of bases toward the major groove (more posi-tive X-disp) is enhanced when several proximalphosphates are in BII and propagate to neighboringbases to maintain sufficient stacking.19,50 Therefore,the globalX-disp values are sensitive to the density ofBII steps. In the simulations, the number of BII phos-phates at any time varies and everyMD snapshot canthus be characterized by its fraction of BII phosphatestogether with its global X-disp. Indeed, the displace-ment of the bases toward the major groove increaseswith the fraction of BII phosphates (Fig. 3). Thesedisplacements shape a shallower major groove in BII-rich snapshots (depth around 3.5 Å) than in BI-richsnapshots (depth around 4.5 Å). In high-resolution X-ray structures,4 the global X-disp of a purely BIoligomer was −1.4 Å, a value well reproduced byCHARMM27. In this reference state, the AMBERforce fields have a notably more negative X-disp, anoffset carried over to higher BII fractions.Overall, analysis of the relationships between the
backbone ε/ζ conformations and helical para-meters in the Jun–Fos oligomer reinforced thenotion that the BII states dramatically influencethe overall DNA structure. All tested force fieldscaptured this fundamental aspect of B-DNA me-chanics; however, their representations of thehelicoidal parameters vary. The simulated popula-tions were sufficiently large to highlight the cumu-lated effect of increasing numbers of BII sites onthe overall DNA structure.
helicoidal parameters
Parmbsc0 CHARMM27
ll Twist Roll Twist Roll
(6) 28.7 (7) 11.0 (6) 32.8 (5) 6.5 (6)(6) 38.6 (4) 1.25 (6) 37.0 (4) −1.7 (7)(4.5) NA NA 39.0 (4) −9.0 (8)
(8) 31.6 (5) 3.5 (5) 37.9 (4) −1.2 (5)(8) 39.7 (3) −2.1 (5) 39.4 (4) −3.9 (5)(7) 39.5 (2) −8.2 (5) 39.5 (4) −8.1 (4)
D simulations for the CpA•TpG and GpA•TpC steps that adoptII•BII) in the Jun–Fos oligomer are given. The standard deviationsuctures (see Materials and Methods) are compared with theire 1, categorized by force field. State BII•BII GpA•TpC is poorlyalues (italics) are only given for completeness. NA indicates not

Table 5. Conformational families defined by the BI/BIIcombinations in the 3′-TpGpA-5′ TRE half-sites
Conformationalfamily
BI/BIIconfigurations
A98_r3 C27_r2 NMR
1 TpGpA 33 35 b15ApCpT
2 TpGpA 28 34 b15ApCpT
3 TpGpA 16 21 b15ApCpT
4 TpGpA 14 5 33–48ApCpT
5 TpGpA 5 2 37ApCpT
The dominant phosphate configurations (BI in boldface and BII inbold italics) observed on each of the TpGpA TRE half-sites aregiven. The populations (percentage) of these conformationalfamilies in the central half-site in the A98_r3 and C27_r2 MDsimulations are compared with the corresponding upper andlower limits deduced from the NMR data (values shown in thelast column).
Fig. 3. Influence of BII conformations on the X-disphelical parameters in the Jun–Fos oligomer. Percentage ofBII phosphate (%PBII: number of BII phosphates/totalnumber of phosphates) versus average X-disp (in ang-strom) from all the MD simulations (Table 1) carried outwith Parm98 (■), Parmbsc0 (▴), and CHARMM27 (*).
963Importance of Accurate DNA Structures Solution
Dynamic structure of the Jun–Fos oligomer insolution
In the previous sections, the Jun–Fos oligomer wasused as a model system to gain general insightsregarding the influence of the BII states on DNAstructure and flexibility and to assess their represen-tation by current DNA force fields. An additional aimwas to derive a structure of the Jun–Fos oligomer insolution, toward a better understanding of thestructural biology of this important DNA sequence.Given the abovementioned, only MD simulations
obtained with Res_extra and Parm98 (A98_r3) orCHARMM27 (C27_r2) are now considered. Thesimulated conformational ensembles allow to specifyand interpret the dynamic features of the Jun–Fossequence, especially regarding correlations betweenthe phosphate states that significantly populate BII(%BIIN30 in NMR). In theMD simulations, G23pA24is not correlated with other BII-rich steps. All the BIITpG steps are mainly associated with BII in theircomplementary CpA. In addition, two phosphatesadjacent on a stranddonot stay in BII simultaneously.These couplings echoprevious experimental findings,contributing to validate the dynamics uncovered bythe MD simulations. Indeed, NMR-derived S2 orderparameters51 highlighted that a BII-rich phosphateprecludes high BII populations in its 5′ and 3′neighbors while favoring high BII in its opposingphosphate.Also, no successiveBII phosphate is foundin theDNAX-ray structures (Materials andMethods),whereas BII TpG steps are systematically concomitantwith complementary BII CpA. Hence, our resultsstrengthen the notion that the conformations ofneighboring phosphates are interrelated via simplerules. Such correlations give rise to distinct confor-mational families.For the Jun–Fos oligomer, it turns out that each
TGA•TCA half-site, containing three BII-rich steps,is in equilibrium between the five BI/BII combina-tions in Table 5. In both A98_r3 and C27_r2trajectories, ∼97% of the instantaneous snapshots
can be categorized according to these five conforma-tional families. The populations for these familiesare equivalent across the two force fields (Table 5),confirming that these MD simulations are con-verged. This agreement across potentials, combinedwith plausible correlations between phosphatemotions, is a very strong indication that the natureof these five families is qualitatively correct. Thetwist and roll profiles along the Jun–Fos sequence,plotted for each conformational family in Fig. 4,show that the BI↔BII exchanges make the T5–A9region highly variable, reflecting the intrinsic DNAmechanics explained above.Comparedwith theNMRdata, A98_r3 andC27_r2
trajectories underestimate the global %BII of TpGandCpA steps and slightly overestimate that of GpAsteps (Fig. 2). Therefore, the simulated populationsneed empirical adjustments to improve agreementwith experiments (Table 5). Because BI CpA does notexceed 15% in the NMR, the sum of families 1 and 2cannot exceed 15% in whole; however, their indivi-dual populations cannot be ascertained. BII TpG is37% by NMR; hence, this population must beassigned to the corresponding family 5. The 48% ofBII GpA in NMR has to be divided between families1 (b15% in NMR) and 4, leading to lower (33%) andupper (48%) limits for the population of family 4.Finally, family 3 is at most 15%, since the total of BIICpA is 85%. Hence, five conformational familiesprovide the simplest model consistent with NMRwhen their populations are corrected to represent theglobal BI/BII experimental ratios (Table 5). Thedramatic underrepresentation of families 4 and 5 intheMD simulations reflects the instability of BII CpAand TpG in the force fields, but these families couldstill be characterized structurally. Accepting theexperimental population, the oligomer and its cen-tral part mainly populate conformational families 4
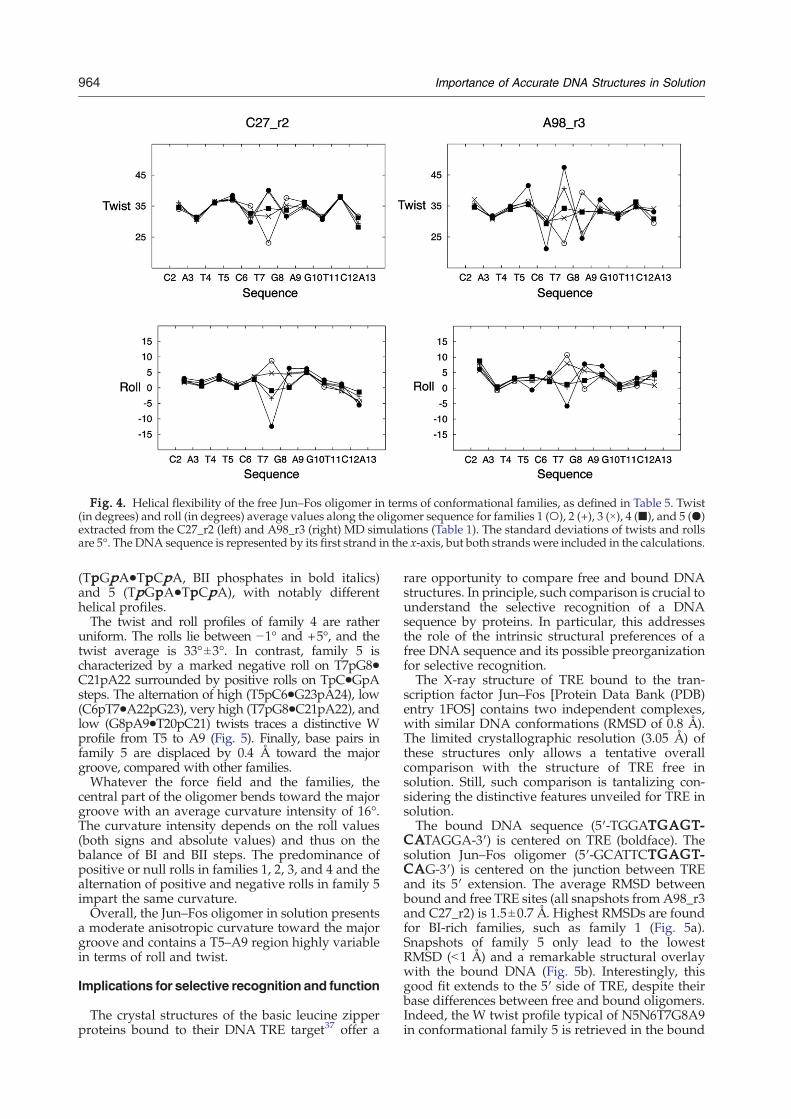
Fig. 4. Helical flexibility of the free Jun–Fos oligomer in terms of conformational families, as defined in Table 5. Twist(in degrees) and roll (in degrees) average values along the oligomer sequence for families 1 (○), 2 (+), 3 (×), 4 (■), and 5 (●)extracted from the C27_r2 (left) and A98_r3 (right) MD simulations (Table 1). The standard deviations of twists and rollsare 5°. The DNA sequence is represented by its first strand in the x-axis, but both strands were included in the calculations.
964 Importance of Accurate DNA Structures in Solution
(TpGpA•TpCpA, BII phosphates in bold italics)and 5 (TpGpA•TpCpA), with notably differenthelical profiles.The twist and roll profiles of family 4 are rather
uniform. The rolls lie between −1° and +5°, and thetwist average is 33°±3°. In contrast, family 5 ischaracterized by a marked negative roll on T7pG8•C21pA22 surrounded by positive rolls on TpC•GpAsteps. The alternation of high (T5pC6•G23pA24), low(C6pT7•A22pG23), very high (T7pG8•C21pA22), andlow (G8pA9•T20pC21) twists traces a distinctive Wprofile from T5 to A9 (Fig. 5). Finally, base pairs infamily 5 are displaced by 0.4 Å toward the majorgroove, compared with other families.Whatever the force field and the families, the
central part of the oligomer bends toward the majorgroove with an average curvature intensity of 16°.The curvature intensity depends on the roll values(both signs and absolute values) and thus on thebalance of BI and BII steps. The predominance ofpositive or null rolls in families 1, 2, 3, and 4 and thealternation of positive and negative rolls in family 5impart the same curvature.Overall, the Jun–Fos oligomer in solution presents
a moderate anisotropic curvature toward the majorgroove and contains a T5–A9 region highly variablein terms of roll and twist.
Implications for selective recognition and function
The crystal structures of the basic leucine zipperproteins bound to their DNA TRE target37 offer a
rare opportunity to compare free and bound DNAstructures. In principle, such comparison is crucial tounderstand the selective recognition of a DNAsequence by proteins. In particular, this addressesthe role of the intrinsic structural preferences of afree DNA sequence and its possible preorganizationfor selective recognition.The X-ray structure of TRE bound to the tran-
scription factor Jun–Fos [Protein Data Bank (PDB)entry 1FOS] contains two independent complexes,with similar DNA conformations (RMSD of 0.8 Å).The limited crystallographic resolution (3.05 Å) ofthese structures only allows a tentative overallcomparison with the structure of TRE free insolution. Still, such comparison is tantalizing con-sidering the distinctive features unveiled for TRE insolution.The bound DNA sequence (5′-TGGATGAGT-
CATAGGA-3′) is centered on TRE (boldface). Thesolution Jun–Fos oligomer (5′-GCATTCTGAGT-CAG-3′) is centered on the junction between TREand its 5′ extension. The average RMSD betweenbound and free TRE sites (all snapshots from A98_r3and C27_r2) is 1.5±0.7 Å. Highest RMSDs are foundfor BI-rich families, such as family 1 (Fig. 5a).Snapshots of family 5 only lead to the lowestRMSD (b1 Å) and a remarkable structural overlaywith the bound DNA (Fig. 5b). Interestingly, thisgood fit extends to the 5′ side of TRE, despite theirbase differences between free and bound oligomers.Indeed, the W twist profile typical of N5N6T7G8A9in conformational family 5 is retrieved in the bound

Fig. 5. Free Jun–Fos DNA oligomer compared with itscounterpart bound to the Jun–Fos transcription factor. (a)Superimposition of the X-ray DNA structure bound toJun–Fos (black, PDB entry 1FOS, DNA chain AB) with arepresentative snapshot extracted from conformationalfamily 1 (green). (b) Superimposition of the X-ray DNAstructure bound to Jun–Fos (black, PDB entry 1FOS, DNAchain AB) with a representative snapshot extracted fromconformational family 5 (red). (c) Average twist (indegrees) along the free Jun–Fos oligomer sequence forconformational family 5 from the C27_r2 (blue) andA98_r3 (red) trajectories. The values averaged on thetwo 1FOS X-ray bound DNAs (DNA chains AB and CD)are shown in black. The DNA sequence is represented byits first strand in the x-axis, but both strands were includedin the calculations. Bases N3–N6 are ATTC in the free Jun–Fos oligomer and TGGA in the bound DNAs.
965Importance of Accurate DNA Structures Solution
1FOS structures (Fig. 5c), as well as in the crystalstructure of a composite DNA AP-1 site interactingwith Jun–Fos and the transcription factor NFAT52
(PDB entry 1A02), stressing the relevance of thetwist profile for binding of the protein Jun–Fos. Thejunction between TRE and its 5′ outer region is notmarkedly distorted in the X-ray complexes. Never-
theless, the curvature of 12° toward the majorgroove at this junction in 1FOS DNA mirrors that inthe free oligomer. The sequence differences in the 5′extension of TRE make the correspondence inhelicoidal parameters between free and boundDNA even more striking, suggesting that theconservation of this helicoidal pattern may bemore important than that of a specific sequence.The most populated family 5 in solution, with
CpA•TpG in BII•BII, is to a surprising degreestructurally consonant with the bound DNA,despite uncertainties due to the resolution of the X-ray structure. Hence, its particular backbonedynamics allows the Jun–Fos oligomer to frequentlypopulate a shape similar to the bound DNAconformation, limiting the energetic penalties uponprotein binding. This indicates that a particulardynamics and the implied indirect readout arefactors contributing significantly to the recognitionof specific DNA sequences by the Jun–Fos protein, inaddition to direct readout.
Discussion
The main objective of this work was to solve thedetailed structure of the Jun–Fos DNA oligomer insolution, which contains the recognition TRE site formany transcription factors.35,36 In addition to itsbroad biological relevance, this sequence was select-ed for its special structural and methodologicalinterests, which surfaced in previous NMR stu-dies.6,34 The well-resolved spectra allowed us toextract numerous internucleotide distances and toquantify for the first time the BI/BII ratios associatedwith every phosphate.6 Therefore, the NMR dataprovided information on both the backbone andbase dynamic behaviors and their interdependence.The detailed structure and dynamics of the Jun–
Fos oligomer in its free (unbound) form provideseveral new crucial insights. First, they offer aspecific and stringent test of force fields optimizedfor the simulation of DNA in aqueous solution.Second, they document specifically the subtle butsignificant relationship between helicoidal descrip-tors and the phosphate dynamics. Third, theyillustrate how the experimentally quantified BI/BIIratios can be used to refine the oligomer structure interms of conformational families. Fourth, they startto relate these structural features to their recognitionby proteins, by comparison with a relevant DNA–protein complex.A key test of force fields is the comparison of NMR
observables with their counterparts from MDsimulations. We investigated three leading forcefields,20–22 initially with unrestrained MD simula-tions on time scales sufficient for the BI↔BIIequilibrium to take place.53 Reassuringly, the intra-nucleotide NMR distances, robust within an overallB form, were retrieved in unrestrained MD simula-tions. However, there were numerous discrepanciesbetween simulated and experimental internucleo-tide distances and BI/BII populations (Table 3).
966 Importance of Accurate DNA Structures in Solution
Maybe the most visible shortcoming was the failureof unrestrained MD simulations to reproduce the BIIpopulations (Fig. 2; Table 3), although Parm98 hadan edge in that respect. Parmbsc0 and CHARMM27overly suppressed BII. However, the three forcefields can represent the mechanical coupling bet-ween the backbone states and the helical parameters(Fig. 3; Table 4; Table S1). Thus, the force fieldsimplement the intrinsic mechanical couplings of B-DNA but not their modulation by sequence, other-wise firmly established.4–6 Our results echo those ofrecent studies that unveiled DNA force-field limita-tions on different systems29,32,33 and additionallyidentify specific properties in need of improvementin these potentials, particularly the representation ofthe sequence-dependent BI/BII equilibrium. There-fore, attempts to systematically predict the intrinsicproperties of DNA sequences solely from MDsimulations30,31 appear premature. Instead, thepriority should be the improvement of the forcefields, guided by accurate structures in solution.Still, that the force fields respond to the mechanics
relating backbone to helicoidal variations is of greatpractical significance, because deficiencies in theforce fields may be largely compensated by experi-mentally derived restraints. So, we supplementedthe simulations with NMR internucleotide distancerestraints. For technical reasons,6 the internucleo-tide distances directly derived from the NOEs(Res_direct) were heterogeneously distributedalong the sequence, leaving underconstrained dinu-cleotides dominated by the force field. This is whywe exploited strong correlations6 between mea-sured δP values and distances ds(H2′), ds(H2ʺ), andds(H6/8) to derive additional extrapolated distancerestraints that augmented and homogenized therestraints (Res_extra) along the sequence. When timeaveraged, the restraints are slightly more efficientthan when applied instantaneously, as reportedpreviously.54–56 With Parmbsc0, the restraints didnot rescue the phosphate conformations, BI remain-ing predominant throughout. With Parm98 andCHARMM27, the fits to experiments improvednotably and were best with Res_extra, justifying theuse of an enlarged set of restraints. The enhance-ments with Res_extra extended to the steps otherwisewell constrained with Res_direct, emphasizing theinfluence of neighbors on dinucleotide steps. There-fore, the solution structure of the Jun–Fos oligomerwas derived from MD simulations obtained withRes_extra and Parm98 or CHARMM27.The improved refinement with Res_extra suggests
that a simplified approach using only distancerestraints inferred (not directly measured) fromanalyses of 31P spectra could also provide experi-mental input for refinement of oligomer structures insolution. However, a refinement entirely based on aminimal set of distances extrapolated from δP is onlya theoretical possibility at this stage, and workremains to be done to test this idea. Even if thisapproach yielded reasonable results and could behelpful in specific circumstances (e.g., dearth of NMRdata), we expect that collecting and using as many
NMR restraints as possible will remain beneficial toderive accurate solution DNA structures.Both Parm98 and CHARMM27 force fields yielded
similar results, strengthening these results. Themotions of neighboring BII-rich phosphates werepositively correlated on facing phosphates or antic-orrelated on adjacent phosphates. This agrees withX-ray structure statistics and a previous solutionNMR study,51 lending credence to the representationof the global phosphate dynamics. This interdepen-dence of phosphate motions results in a limitednumber of BI/BII combinations, corresponding tofive conformational families in the simulations(Table 5). Each family is characterized by its helicalpattern (Fig. 4), mediated by the BI/BII states andassociated variations in base X-disp, rolls, andtwists. This results in a highly variable junctionbetween TRE and its 5′ extension, from T5 to A9.The rolls distribute variously along the sequence toimpart the same modest average curvature of 16°toward the major groove in all five families.The nature of the five conformational families is
convincing, but their MD populations did not agreewith experiments, as judged by specific BI/BIIratios. This is simply a consequence of the force-field underrepresentation of the BII populations.Yet, a good fit to experiments is possible by keep-ing the same families and straightforward adjust-ment of their relative populations according toexperiments, further validating the family model.This recalibration showed that the Jun–Fos oligo-mer mostly populates BII-rich families 4 and 5,which predominate over their BI-rich counterparts(Table 5).Thus, simple NMR experiments combined with
carefully analyzed BI/BII populations can provide adetailed and dynamic view of a DNA sequence andits major substates in solution. By reflecting theintrinsic mechanical properties of the free Jun–Fossequence, this structure provides a basis to addressthe specificity of its recognition.The X-ray complex of the Jun–Fos protein with its
DNA target (PDB entry 1FOS37,52) offers theopportunity to address the role of the intrinsicstructural preferences of free DNA for optimizingthis interaction. The free DNA structural familieswere determined exclusively on the basis of theNMR data and the MD models without reference toany X-ray structure. Yet, the free DNA structurerepresentative of family 5 (BII•BII CpA•TpG) over-lays closely onto its counterpart bound to the Jun–Fos protein (Fig. 5). It is unlikely to be sheercoincidence, considering that molecular recognitionrequires a very precise complementarity. Thisstructural correspondence stands out for not onlythe TRE site but also its 5′ extension. This isintriguing because the bases in the 5′ extensiondiffer in free and bound oligomers. The descriptionof 1FOS emphasized the TRE site–protein interface,but our results prompted careful examination of the5′ extension. The 1FOS structure contains twoindependent complexes, the TGAG part of TREbeing contacted either by Jun or by Fos. In both

967Importance of Accurate DNA Structures Solution
cases, positively charged side chains of either Jun(Arg281 and Lys277) or Fos (Arg146 and Lys153)extend to two phosphates of the 5′ extension andpenetrate its major groove (Lys267 of Jun andArg143 of Fos). Thus, the DNA–protein interfaceextends beyond TRE to its 5′ extension, covering theN3TGAG fragment (T4 to G10 in the Jun–Fosoligomer). In the free oligomer, this region fre-quently adopts (∼37% of the time, family 5) aconformation that coincides well with the boundDNA. This suggests that the Jun–Fos protein selectsa preformed conformation of TRE and its 5′extensions, a contributing indirect readout mechan-ism. Higher-resolution X-ray structures of the DNA–protein complexes would help toward a firmeranalysis of the role of DNA preorganization forrecognition.In sum, we have shown how routine NMR
experiments combined with a quantitative analysisof the BI/BII populations and their counterparts inextensive simulations can be harnessed towardobtaining detailed dynamic DNA structures in solu-tion. This addresses the intrinsic and subtle sequence-dependent mechanical DNA properties, which haveproved to be very difficult to tackle in a solutionenvironment. Such accurate structures will be crucialto inform improvements in DNA force fields, as wedemonstrated that they are not yet reliable enough foraccurate predictions in the absence of experimentalrestraints. Specifically, the representation of theBI/BII equilibrium requires major improvements.Accurate structures of free DNA in solution will alsoprovide a necessary reference state to understand theselective recognition of DNA sequences, particularlywhen indirect readout is involved.We have started toillustrate these principles with the Jun–Fos system,but the generality of themethodology implies that it isbroadly transferable.
Materials and Methods
DNA sequence
The analyzed DNA structure has the 14-bp sequence 5′-d(G1 C2A3 T4 T5C6 T7G8A9G10 T11 C12A13 G14 )-3′•5′-d(C15 T16G17A18 C19 T20 C21A22 G23A24A25 T26 G27C28 )-3′. It is called the Jun–Fos oligomer and wasconstructed initially with a canonical B-DNA conformationfor MD simulations (a summary of all MD simulations isgiven in Table 1). Each force field was tested with MDprotocols known to be appropriate for this force field.
MD simulations with the AMBER Parm98 andParmbsc0 force fields
Simulations with the Parm9822 and Parmbsc021 forcefields were performed using the AMBER 8 program57. TheJun–Fos oligomer in standard B-DNA conformation wasneutralized with 26 Na+ ions and hydrated with 6770TIP3P water molecules in a truncated octahedron.Simulations were performed at constant temperature(300 K) and pressure (1 bar) using the Berendsenalgorithm.58 The integration time step was 2 fs, and
covalent bonds involving hydrogens were constrainedusing SHAKE.59 Long-range electrostatic interactionswere treated using the particle mesh Ewald approach60
with a 9-Å direct space cutoff. The nonbonded pair list wasupdated heuristically, and the center-of-mass motion wasremoved every 10 ps.The water molecules and ions were energy minimized
and equilibrated at 100 K around the fixed DNA for 100 psin the NVT ensemble; the entire system was then heatedfrom 100 to 300 K in 10 ps by 5-K increments withharmonic restraints of 5.0 kcal/mol/Å2 on the soluteatoms. The simulation was continued in NPT, withoutnoticeable change in volume. These positional restraintswere gradually removed over 250 ps and followed by thesimulations presented here (Table 1).An unrestrained simulation was obtained. Starting
from the unrestrained snapshot at 1 ns, NMR distancerestraints, described below, were applied for 15 ns.These restraints were parabolic potentials of forceconstant 5 kcal/mol/Å2 for Parm98 and force constant10 kcal/mol/Å2 for Parmbsc0, around central flat-bottomed wells covering the experimental range of thedistances, including experimental errors (d_exp±10%).With 2 kcal/mol/Å2, several critical restraints were notrespected. The weakest force constants that allowed toenforce the restraints without notably reducing thestandard deviations of helical parameters comparedwith the unrestrained MD simulations were 5 kcal/mol/Å2 for Parm98 and 10 kcal/mol/Å2 for Parmbsc0.The restraints were applied either instantaneously or ina time-averaged manner.55,61 The time-averagedrestraints on property R were applied with the follow-ing equation:
R ¼ ð1=CÞ�Z
exp½ðt� tVÞ=s�rðtVÞ�idtV��1=i
where t is the current time, r(t′) is the internalcoordinate at time t′, and C is a normalization factor.The damping constant τ was set to 10 ps, and, followingtests, the best results were for i=1 used here.Convergence of the MD simulations with respect to the
DNA structure was achieved. Thus, the RMSDs calculatedbetween snapshots and either the starting or the averagestructures are very stable after 1 ns of simulation. Inaddition, statistics for different DNA descriptors, such assugar and backbone conformations, give identical resultswhen they are extracted from different parts of the tra-jectories: the first 10 ns, from 5 to 15 ns, and the wholetrajectories.
MD simulations with the CHARMM27 force field
Energy minimizations and MD simulations wereperformed with the program CHARMM,62 version 27 ofits nucleic acid force field,20 and atom-based nonbondedinteractions truncated beyond 12 Å with force shift,63
which works well.64,65 Nonbonded lists were maintainedto 14 Å and updated heuristically.These MD simulations used the same initial oligomer
structure as with AMBER. This B-DNA oligomer, neu-tralized with 26 Na+ ions, was overlaid with a truncatedoctahedron of preequilibrated CHARMM TIP3P watermolecules.66,67 The water molecules with their oxygenatom closer than 2.7 Å from any solute atom wereremoved, leaving 6593 water molecules. Periodic bound-ary conditions were applied, and covalent bonds invol-ving a hydrogen were constrained with SHAKE.59 Thewater molecules were then energyminimized, keeping the
968 Importance of Accurate DNA Structures in Solution
solutes fixed. The water molecules, ions, and oligomerwere relaxed in a second round of energy minimization.The simulations used the leap-frog integrator and a 2-fs
time step. The first 26 ps of equilibration (NVT ensemble)was common to all subsequent MD simulations. Heatingwas performed from 0 to 300 K in 6 ps by 5-K increments,with the oligomer atoms harmonically restrained to theirinitial position with a force constant of 1.0 kcal/mol/Å2.The simulation was then pursued at 300 K for 20 ps,keeping the harmonic restraints on the oligomer. Thisprovided the branching point for all derived MD simula-tions (Table 1). Each MD was run for a further 20 ps inNVT, with or without experimental restraints (see below).Then, MD simulations were pursued in the NPTensemble,keeping the same set of restraints. The volume of thesystem did not change significantly when switching fromthe NVT condition to the NPT condition.The distance restraints were applied as in the AMBER
simulations, with the NOE module of CHARMM, via aparabolic potential around a central flat-bottomed wellthat covered the experimental range of the distances.Several force constants were tested, which yieldedessentially similar results. Here, we present resultsobtained with a force constant of 5 kcal/mol/Å2.
NMR distance restraints
MDsimulationswere carried out under two sets of NMRinternucleotide restraints termed Res_direct and Res_extra(Table 2 and Table S1 in SupplementaryMaterial), obtainedas reported previously.6 The 106 intranucleotide distanceswere not restrained since they were spontaneouslyrespected in the unrestrained MD simulations. TheRes_direct set contained 82 internucleotide distancesdirectly derived from well-resolved NOE spectroscopycross-peaks in the 2H2O spectra, extracted, and integratedwith particular care. This set was essentially composedof the internucleotide distances H1′i–H6/8i+1 [ds(H1′)],H2′i–H6/8i+1 [ds(H2′)], H2ʺi–H6/8i+1 [ds(H2ʺ)], and H6/8i–H6/8i+1 [ds(H6/8)]. However, these restraints wereheterogeneously distributed along the sequence, leavingsome dinucleotides underconstrained (Table 2). Hence, asecond restraint set (Res_extra) was devised. This set tookadvantage of strong distance–distance and distance–δPcorrelations6 to infer ds(H2′), ds(H2ʺ), or ds(H6/8) dis-tances not directly measured from measured distances orfrom the corresponding δP. Thus, Res_extra included 18extrapolated internucleotide distances in addition to thosein Res_direct, such that all the dinucleotide steps becamehomogeneously constrained (Table 2). The listing of theapplied restraints is given in Table S1 in SupplementaryMaterial.
Structural descriptors
The internucleoside backbone linkages were character-ized with torsion angles ε to γ defined conventionallyfollowing the threefold staggered torsional pattern: g+(60°±40°), trans (180°±40°), and g− (300°±40°). The sugarring conformations are categorized according to theirpseudorotation phase angle: north (300°–50°), east (50°–120°), and south (120°–220°).DNA structures and helicoidal parameters were ana-
lyzed with the Curves 6.1 algorithm,68 following theCambridge convention. Only the 12 central base pairswere analyzed to avoid end effects. The first nanosecondof each MD simulation was discarded.
Crystallographic data
The crystal structures described in section Correlationsbetween backbone states and helical parameter and Table 4included 19 B-DNA oligomers with a resolution ≤2 Å inthe PDB (codes 431D, 436D, 460D, 461D, 463D, 476D,1D8G, 1DPN, 1EN3, 1EN8, 1EN9, 1ENE, 1ENN, 1EI4,1FQ2, 5DNB, 1D23, 1D49, and 355D).
Supplementary Data
Supplementary data associated with this articlecan be found, in the online version, at doi:10.1016/j.jmb.2008.07.047
References
1. Dickerson, R. E., Goodsell, D. S. &Neidle, S. (1994). “…the tyranny of the lattice…”. Proc. Natl Acad. Sci. USA,91, 3579–3583.
2. Hartmann, B. & Lavery, R. (1996). DNA structuralforms. Q. Rev. Biophys. 29, 309–368.
3. Ulyanov, N. B. & James, T. L. (1995). Statisticalanalysis of DNA duplex structural features. MethodsEnzymol. 261, 90–120.
4. Djuranovic, D. & Hartmann, B. (2003). Conforma-tional characteristics and correlations in crystal struc-tures of nucleic acid oligonucleotides: evidence forsub-states. J. Biomol. Struct. Dyn. 20, 771–788.
5. Djuranovic, D. & Hartmann, B. (2004). DNA finestructure and dynamics in crystals and in solution: theimpact of BI/BII backbone conformations. Biopoly-mers, 73, 356–368.
6. Heddi, B., Foloppe, N., Bouchemal, N., Hantz, E. &Hartmann, B. (2006). Quantification of DNA BI/BIIbackbone states in solution. Implications for DNAoverall structure and recognition. J. Am. Chem. Soc.128, 9170–9177.
7. Lefebvre, A., Fermandjian, S. & Hartmann, B. (1997).Sensitivity of NMR internucleotide distances to B-DNA conformation: underlying mechanics. NucleicAcids Res. 25, 3855–3862.
8. Schmitz, U. & James, T. L. (1995). How to generateaccurate solution structures of double-helical nucleicacid fragments using nuclear magnetic resonance andrestrained molecular dynamics.Methods Enzymol. 261,3–44.
9. Konerding, D. E., Cheatham, T. E., 3rd, Kollman, P. A.& James, T. L. (1999). Restrained molecular dynamicsof solvated duplex DNA using the particle meshEwald method. J. Biomol. NMR, 13, 119–131.
10. Wu, Z., Delaglio, F., Tjandra, N., Zhurkin, V. B. & Bax,A. (2003). Overall structure and sugar dynamics of aDNA dodecamer from homo- and heteronucleardipolar couplings and 31P chemical shift anisotropy.J. Biomol. NMR, 26, 297–315.
11. MacDonald, D. & Lu, P. (2002). Residual dipolarcouplings in nucleic acid structure determination.Curr. Opin. Struct. Biol. 12, 337–343.
12. Getz, M., Sun, X., Casiano-Negroni, A., Zhang, Q. &Al-Hashimi, H. M. (2007). NMR studies of RNAdynamics and structural plasticity using NMR resi-dual dipolar couplings. Biopolymers, 86, 384–402.
13. Lipsitz, R. S. & Tjandra, N. (2004). Residual dipolarcouplings in NMR structure analysis. Annu. Rev.Biophys. Biomol. Struct. 33, 387–413.

969Importance of Accurate DNA Structures Solution
14. Kuszewski, J., Schwieters, C. & Clore, G. M. (2001).Improving the accuracy of NMR structures of DNA bymeans of a database potential of mean force describ-ing base–base positional interactions. J. Am. Chem. Soc.123, 3903–3918.
15. Schwieters, C. D. & Clore, G. M. (2007). A physicalpicture of atomic motions within the Dickerson DNAdodecamer in solution derived from joint ensemblerefinement against NMR and large-angle X-rayscattering data. Biochemistry, 46, 1152–1166.
16. Hartmann, B., Piazzola, D. & Lavery, R. (1993). BI–BIItransitions in B-DNA. Nucleic Acids Res. 21, 561–568.
17. Srinivasan, A. R. & Olson, W. K. (1987). Nucleic acidmodel building: the multiple backbone solutionsassociated with a given base morphology. J. Biomol.Struct. Dyn. 4, 895–938.
18. van Dam, L. & Levitt, M. H. (2000). BII nucleotides inthe B and C forms of natural-sequence polymericDNA: a newmodel for the C form of DNA. J. Mol. Biol.304, 541–561.
19. Winger, R. H., Liedl, K. R., Pichler, A., Hallbrucker, A.& Mayer, E. (1999). Helix morphology changes in B-DNA induced by spontaneous B(I)⇔B(II) substrateinterconversion. J. Biomol. Struct. Dyn. 17, 223–235.
20. Foloppe, N. & Mackerell, A. D. (2000). All-atomempirical force field for nucleic acids: I. Parameteroptimization based on small molecule and condensedphase macromolecular target data. J. Comput. Chem.21, 86–104.
21. Perez, A., Marchan, I., Svozil, D., Sponer, J., Chea-tham, T. E., 3rd, Laughton, C. A. & Orozco, M. (2007).Refinement of the AMBER force field for nucleic acids:improving the description of alpha/gamma confor-mers. Biophys. J. 92, 3817–3829.
22. Cheatham, T. E., 3rd, Cieplak, P. & Kollman, P. A.(1999). A modified version of the Cornell et al. forcefield with improved sugar pucker phases and helicalrepeat. J. Biomol. Struct. Dyn. 16, 845–862.
23. Cheatham, T. E., 3rd (2004). Simulation and modelingof nucleic acid structure, dynamics and interactions.Curr. Opin. Struct. Biol. 14, 360–367.
24. Mackerell, A. D., Jr (2004). Empirical force fields forbiological macromolecules: overview and issues. J.Comput. Chem. 25, 1584–1604.
25. Orozco, M., Perez, A., Noy, A. & Luque, F. J. (2003).Theoretical methods for the simulation of nucleicacids. Chem. Soc. Rev. 32, 350–364.
26. Ponomarev, S. Y., Thayer, K. M. & Beveridge, D. L.(2004). Ion motions in molecular dynamics simulationson DNA. Proc. Natl Acad. Sci. USA, 101, 14771–14775.
27. Perez, A., Lankas, F., Luque, F. J. & Orozco, M. (2008).Towards a molecular dynamics consensus view of B-DNA flexibility. Nucleic Acids Res. 36, 2379–2394.
28. Arthanari, H., McConnell, K. J., Beger, R., Young,M. A.,Beveridge, D. L. & Bolton, P. H. (2003). Assessment ofthe molecular dynamics structure of DNA in solutionbased on calculated and observed NMR NOESYvolumes and dihedral angles from scalar couplingconstants. Biopolymers, 68, 3–15.
29. Foloppe, N. & Nilsson, L. (2005). Toward a fullcharacterization of nucleic acid components in aqu-eous solution: simulations of nucleosides. J. Phys.Chem. B, 109, 9119–9131.
30. Beveridge, D. L., Barreiro, G., Byun, K. S., Case, D. A.,Cheatham, T. E., 3rd, Dixit, S. B. et al. (2004). Moleculardynamics simulations of the 136 unique tetranucleo-tide sequences of DNA oligonucleotides: I. Researchdesign and results on d(CpG) steps. Biophys. J. 87,3799–3813.
31. Dixit, S. B., Beveridge, D. L., Case, D. A., Cheatham,T. E., 3rd, Giudice, E., Lankas, F. et al. (2005).Molecular dynamics simulations of the 136 uniquetetranucleotide sequences of DNA oligonucleotides:II. Sequence context effects on the dynamical struc-tures of the 10 unique dinucleotide steps. Biophys. J.89, 3721–3740.
32. Isaacs, R. J. & Spielmann, H. P. (2004). Insight into G–Tmismatch recognition using molecular dynamics withtime-averaged restraints derived from NMR spectro-scopy. J. Am. Chem. Soc. 126, 583–590.
33. Zuo, X., Cui, G.,Merz, K.M., Jr., Zhang, L., Lewis, F. D.& Tiede, D. M. (2006). X-ray diffraction “fingerprint-ing” of DNA structure in solution for quantitativeevaluation of molecular dynamics simulation. Proc.Natl Acad. Sci. USA, 103, 3534–3539.
34. Heddi, B., Foloppe, N., Hantz, E. & Hartmann, B.(2007). The DNA structure responds differently tophysiological concentrations of K(+) or Na(+). J. Mol.Biol. 368, 1403–1411.
35. Karin, M., Liu, Z. & Zandi, E. (1997). AP-1 functionand regulation. Curr. Opin. Cell Biol. 9, 240–246.
36. Lemon, B. & Tjian, R. (2000). Orchestrated response: asymphony of transcription factors for gene control.Genes Dev. 14, 2551–2569.
37. Glover, J. N. & Harrison, S. C. (1995). Crystal structureof the heterodimeric bZIP transcription factor c-Fos–c-Jun bound to DNA. Nature, 373, 257–261.
38. Leonard, D. A. & Kerppola, T. K. (1998). DNAbending determines Fos–Jun heterodimer orientation.Nat Struct. Biol. 5, 877–881.
39. Ramirez-Carrozzi, V. R. & Kerppola, T. K. (2001).Long-range electrostatic interactions influence theorientation of Fos–Jun binding at AP-1 sites. J. Mol.Biol. 305, 411–427.
40. Ramirez-Carrozzi, V. R. & Kerppola, T. K. (2001).Control of the orientation of Fos–Jun binding and thetranscriptional cooperativity of Fos–Jun–NFAT1 com-plexes. J. Biol. Chem. 276, 21797–21808.
41. Tisne, C., Delepierre, M. & Hartmann, B. (1999).How NF-kappaB can be attracted by its cognateDNA. J. Mol. Biol. 293, 139–150.
42. Tisne, C., Hartmann, B. & Delepierre, M. (1999). NF-kappa B binding mechanism: a nuclear magneticresonance and modeling study of a GGG→CTCmutation. Biochemistry, 38, 3883–3894.
43. Wecker, K., Bonnet, M. C., Meurs, E. F. & Delepierre,M. (2002). The role of the phosphorus BI–BII transitionin protein–DNA recognition: the NF-kappaB complex.Nucleic Acids Res. 30, 4452–4459.
44. Wüthrich, K. (1986).NMR of Proteins and Nucleic Acids.Wiley Interscience, New York, NY.
45. Lefebvre, A., Mauffret, O., Hartmann, B., Lescot, E.& Fermandjian, S. (1995). Structural behavior ofthe CpG step in two related oligonucleotidesreflects its malleability in solution. Biochemistry, 34,12019–12028.
46. Mauffret, O., Hartmann, B., Convert, O., Lavery, R. &Fermandjian, S. (1992). The fine structure of two DNAdodecamers containing the cAMP responsive elementsequence and its inverse. Nuclear magnetic resonanceand molecular simulation studies. J. Mol. Biol. 227,852–875.
47. Tisne, C., Hantz, E., Hartmann, B. & Delepierre, M.(1998). Solution structure of a non-palindromic 16base-pair DNA related to the HIV-1 kappa B site:evidence for BI–BII equilibrium inducing a globaldynamic curvature of the duplex. J. Mol. Biol. 279,127–142.
970 Importance of Accurate DNA Structures in Solution
48. Wijmenga, S. S. & van Buuren, B. N. M. (1998). The useof NMRmethods for conformational studies of nucleicacids. Prog. Nucl. Magn. Reson. Spectrosc. 32, 287–387.
49. Varnai, P., Djuranovic, D., Lavery, R. & Hartmann, B.(2002). Alpha/gamma transitions in the B-DNAbackbone. Nucleic Acids Res. 30, 5398–5406.
50. Bertrand, H., Ha-Duong, T., Fermandjian, S. &Hartmann, B. (1998). Flexibility of the B-DNA back-bone: effects of local and neighbouring sequenceson pyrimidine–purine steps. Nucleic Acids Res. 26,1261–1267.
51. Isaacs, R. J. & Spielmann, H. P. (2001). NMR evidencefor mechanical coupling of phosphate B(I)–B(II) transi-tions with deoxyribose conformational exchange inDNA. J. Mol. Biol. 311, 149–160.
52. Chen, L., Glover, J. N., Hogan, P. G., Rao, A. &Harrison, S. C. (1998). Structure of the DNA-bindingdomains from NFAT, Fos and Jun bound specificallyto DNA. Nature, 392, 42–48.
53. Gorenstein, D. G. (1994). Conformation and dynamicsof DNA and protein–DNA complexes by 31P NMR.Chem. Rev. 94, 1315–1338.
54. Aramini, J. M., Mujeeb, A., Ulyanov, N. B. &Germann, M. W. (2000). Conformational dynamicsin mixed alpha/beta-oligonucleotides containingpolarity reversals: a molecular dynamics study usingtime-averaged restraints. J. Biomol. NMR, 18, 287–302.
55. Pearlman, D. A. & Kollman, P. A. (1991). Are time-averaged restraints necessary for nuclear magneticresonance refinement? Amodel study for DNA. J. Mol.Biol. 220, 457–479.
56. Yao, L. J., James, T. L., Kealey, J. T., Santi, D. V. &Schmitz, U. (1997). The dynamic NMR structure of theT psi C-loop: implications for the specificity of tRNAmethylation. J. Biomol. NMR, 9, 229–244.
57. Case, D. A., Cheatham, T. E., 3rd, Darden, T., Gohlke,H., Luo, R., Merz, K. M., Jr et al. (2005). The Amberbiomolecular simulation programs. J. Comput. Chem.26, 1668–1688.
58. Berendsen, H. J. C., Postma, J. P. M., van Gunsteren,W. F., DiNola, A. & Haak, J. R. (1984). Moleculardynamics with coupling to an external bath. J. Chem.Phys. 91, 3684–3690.
59. van Gunsteren, W. F. & Berendsen, H. J. C. (1977).Algorithms for macromolecular dynamics and con-straint dynamics. Mol. Phys. 34, 1311–1327.
60. Darden, T., York, D. & Pedersen, L. (1993). Particlemesh Ewald: an N·log(N) method for Ewald sums inlarge systems. J. Chem. Phys. 98, 10089–10092.
61. Torda, A. E., Scheek, R. M. & van Gunsteren, W. F.(1990). Time-averaged nuclear Overhauser effectdistance restraints applied to tendamistat. J. Mol.Biol. 214, 223–235.
62. Brooks, B. R., Bruccoleri, R. E., Olafson, B. D., States,D. J., Swaminathan, S. & Karplus, M. (1983).CHARMM: a program for macromolecular energy,minimization and dynamics calculations. J. Comput.Chem. 4, 187–217.
63. Steinbach, P. J. & Brooks, B. R. (1994). New spherical-cutoff methods for long-range forces in macromole-cular simulation. J. Comput. Chem. 15, 667–683.
64. Beck, D. A. C., Armen, R. S. & Daggett, V. (2005).Cutoff size need not strongly influence moleculardynamics results for solvated polypeptides. Biochem-istry, 44, 609–616.
65. Norberg, J. & Nilsson, L. (2000). On the truncation oflong-range electrostatic interactions in DNA. Biophys.J. 79, 1537–1553.
66. Jorgensen, W. L., Chandrasekhar, J., Madura, J. D.,Impey, R. W. & Klein, M. L. (1983). Comparison ofsimple potential functions for simulating liquid water.J. Chem. Phys. 79, 926–935.
67. Reiher, W. E., III. (1985). Theoretical Studies of HydrogenBonding, PhD thesis, Harvard University.
68. Lavery, R. & Sklenar, H. (1988). The definition ofgeneralized helicoidal parameters and of axis curva-ture for irregular nucleic acids. J. Biomol. Struct. Dyn. 6,63–91.