implications of electric vehicle penetration on federal...
TRANSCRIPT
Implications of Electric Vehicle Penetration on Federal and State Highway Revenues
Kevin Schleith
Florida Solar Energy Center 1679 Clearlake Road
Cocoa, FL 32922-5703 E-mail: [email protected]
Submitted as: Final Research Project Report
EVTC Project 1 – Implications of Electric Vehicle Penetration on State and Federal Highway Revenues
Submitted to:
Ms. Denise Dunn Research and Innovative Technology Administration 1200
New Jersey Avenue, SE Washington, DC 20590
E-mail: [email protected]
Contract Number: DTRT13-G-UTC51 FSEC Report Number: FSEC-CR-2052-17
February 2017
The contents of this report reflect the views of the authors, who are responsible for the facts and the accuracy of the information presented herein. This document is disseminated under the sponsorship of the U.S. Department of Transportation’s University Transportation Centers Program in the interest of information exchange. The U.S. Government assumes no liability for the contents or use thereof.

2
Acknowledgements This report is a final research report for the Implications of Electric Vehicle Penetration on State and Federal Highway Revenues project of the Electric Vehicle Transportation Center (EVTC) at the University of Central Florida (UCF). The Electric Vehicle Transportation Center is a University Transportation Center funded by the Research and Innovative Technology Administration of the U.S. Department of Transportation. The EVTC is a research and education center whose projects prepare the U.S. transportation system for the influx of electric vehicles into a sustainable transportation network and investigate the opportunity these vehicles present to enhance electric grid modernization efforts. The EVTC is led by UCF's Florida Solar Energy Center with partners from UCF’s Departments of Electrical Engineering and Computer Science and Civil, Environmental and Construction Engineering, the University of Hawaii, and Tuskegee University.
The objective of the Implications of Electric Vehicle Penetration on State and Federal Highway Revenues project was to evaluate the impact that increased use of electric vehicles will have on federal and state highway revenue sources. The work identified existing laws and policies that govern highway, gas, and vehicle taxes. It also examined fees imposed on vehicles and summarized current trends and make policy recommendations that may both influence the growth of the electric vehicle market and impact highway revenues. The work was conducted by Kevin Schleith of the UCF’s Florida Solar Energy Center.

3
Implications of Electric Vehicle Penetration on State and Federal Highway Revenues
Kevin Schleith
Florida Solar Energy Center February 2017
1.0 Abstract This report summarizes the results of research conducted to determine if current and near future electric vehicle (EV) sales will have an impact on motor fuel tax revenues as part of the Federal Highway Trust Fund (HTF). Gasoline and diesel fuel taxes account for $31.1 billion or about 87% of the HTF. The project results were accomplished by conducting a review of existing industry and government reports that detail fuel tax revenues and an analysis of EV sales from 2010 through 2016. Results show, that as of January 2017, the lost fuel tax revenue from EV sales of 560,000 vehicles is shown to be $111.8 million or a loss to the HTF of 0.36%. Although EVs, at present, have little impact on the HTF, calculations for EV sales growth rates of 10% show a 5% reduction in the HTF in about 20 years. Thus, new policies and programs that aim to increase revenue streams for highway funding as a result of EVs are under discussion in some states. Options being considered are fee based travel, increased direct taxes and surcharges on vehicle purchases. 2.0 Research Results This final research report presents the results from the EVTC project titled Implications of Electric Vehicle Penetration on State and Federal Highway Revenues. The original project results were presented in the EVTC report titled Implications of Electric Vehicles on Gas Tax Revenues. This report is included here as Attachment 1 for completeness. Presented in the Attachment 1 report are discussions on the following two topics:
1. Highway Trust Fund Overview 2. Electric Vehicle’s Impact on Highway Funding
The major points of the Attachment 1 work are reviewed in the following sections which give a summary of the research results with updates on the EV sales figures for 2016 and state gas tax changes as of January 1, 2017. Highway Trust Fund Overview --The Highway Trust Fund Overview section presented results on the Highway Trust Fund, on Future Highway Funding Implications and on State Funding and Measures to Increase Funds. The Federal Highway Trust Fund - The Highway Trust Fund (HTF) collects and distributes money dedicated to the nation’s highway and transit projects. It is funded primarily by the federal and state taxes on gasoline and diesel fuel, which are $0.184 and $0.243 per gallon, respectively. According to numerous references, the HTF has experienced a continuing shortfall that is attributed to three major factors; more fuel

4
efficient internal combustion engine (ICE) vehicles, inflation of the dollar and the fact that federal gas rates has not risen since 1993 and the increased cost in highway construction and repairs. The report covers some of the revenue generation options in place and under consideration as well as the pros and cons of each. For the future, if the fuel tax is to remain the major source of highway funding, then both federal and state level policy officials most likely will need to create and implement transportation revenue generation strategies that may not rely entirely on the fuel tax. The U.S. Congress passed and President Obama signed, in December 2015, a $305 billion, five year, transportation bill that funds the nation’s highways and other infrastructure. This long-term bill was called the FAST Act (Fixing America’s Surface Transportation). The legislation does not raise the gas tax of $0.184/gallon, but relies on short-term financing measures. The Congressional action will temporarily fix the federal part of the Trust Fund, but the long-term stability of the federal funding has still not been completely addressed. Future Highway Funding Implications – From Attachment 1, the implications of long-term Highway Trust Fund revenues and future projections are presented. Shown are the Congressional Budget Office (CBO) figures that the cost of a six-year transportation bill at current funding levels plus inflation would require approximately $85 billion in additional revenues to be transferred into the fund. In addition are a Conditions and Performance (C&P) Report of DOT that estimates the U.S. highway needs at $85 to $177 billion annually, a American Road and Transportation Builders Association (ARTBA) report which shows that nine states have retracted or delayed projects totaling $366 million due to the uncertainty of federal funding and a White House report prepared by the National Economic Council that states inadequate infrastructure results in American businesses paying $27 billion a year in extra freight transportation costs, increasing shipping delays and raising prices on everyday product. All these reports show needs well above current trust fund revenues. State Funding and Measures to Increase Funds – This section showed tax rate results for the various states which comprise the balance of the gas tax funding. It was noted that on the average, states collect $0.31/gallon as compared to the federal rate of $0.184/gallon. Recent articles (Reference 1) show that as of January 1, 2017, 6 states have increased their gas tax rates while 2 have decreased. Pennsylvania saw the largest increase at 7.9 cents per gallon, followed by Michigan at 7.3 cents per gallon. Nebraska increased its rate to 2.7 cents per gallon as part of November 2016 legislation. The states of Georgia, North Carolina, Indiana and Florida have increases of less than 1 cent per gallon based on automatic adjustments. The two states to decrease were New York at 0.8 cents and West Virginia at 1 cent, both due to automatic adjustments. Pennsylvania has the largest tax at 58.2 cents per gallon and Alaska the lowest at 12.25 cents. Also discussed were alternate state tax options such as the use of a vehicle miles traveled (VMT) tax that accounts for the type and weight of a vehicle and the location and time of its use and the requiring of additional highway usage tolls. Oregon was

5
noted as the first state to pass legislation that will allow a voluntary VMT tax to be administered instead of a gas tax. The data for this voluntary program is under evaluation. The report also covers some of the revenue generation options in place and under consideration as well as the pros and cons of each. Electric Vehicle’s Impact on Highway Fund – Data recording EV sales by year are available from numerous sources. The data presented here is taken from Reference 2 and is presented in Table 1. Table 1 shows the sales by year of EVs and plug-in EVs (PEVs) with the total sales for each year.
Table 1 – EV Sales per Year Year PEVs EVs TOTAL 2016 72,837 84,275 157,112 2015 42,958 71,064 114,022 2014 55,357 63,416 118,773 2013 49,008 47,694 96,702 2012 38,584 14,251 52,835 2011 7,671 10,064 17,735 2010 326 19 345
TOTAL 266,741 290,783 557,524 Percent 47.8% 52.2%
Summing the yearly values in Table 1 gives a total of 557,524 EV vehicles on the road as of December 31, 2016 (Rounded to 560,000). Using the calculation process as described in Attachment 1, the average gas tax paid per vehicle is $247. This value is derived from annual average miles driven of 12,000 miles per year and an average gas mileage of 24 miles/gallon, giving an average yearly usage of 500 gallons of gasoline. The average gas tax is $0.494/gallon (state plus federal). For EVs, the revenue loss (all electric and plug-in’s) may be calculated by assuming that the split between all electric and plug-in electric is 52%, 48%, respectively, and the plug-in uses electricity for 60% of the vehicle miles traveled. The calculated revenue lost for 560,000 EVs is $111.8 million/year. The results are shown in Table 2.
Table 2- Estimated Tax Revenue Lost From EV Sales
Tax Revenue Lost From EV Sales in the US (Through 1/17)
Average Gas Tax paid per Car $247
Cumulative Total of EV's in the US 560,000
Average Gas Tax Revenue Lost from EV Sales $111.8 Million
*Total Net Gas Tax Receipts $31.1 Billion
**Percentage Tax Revenue Lost from EV's 0.36% *Net gas tax receipts reported from October 2014 through September 2015.
**Lost revenue percentage calculation based upon the gasoline/diesel makeup of 87% of total tax receipts.
6
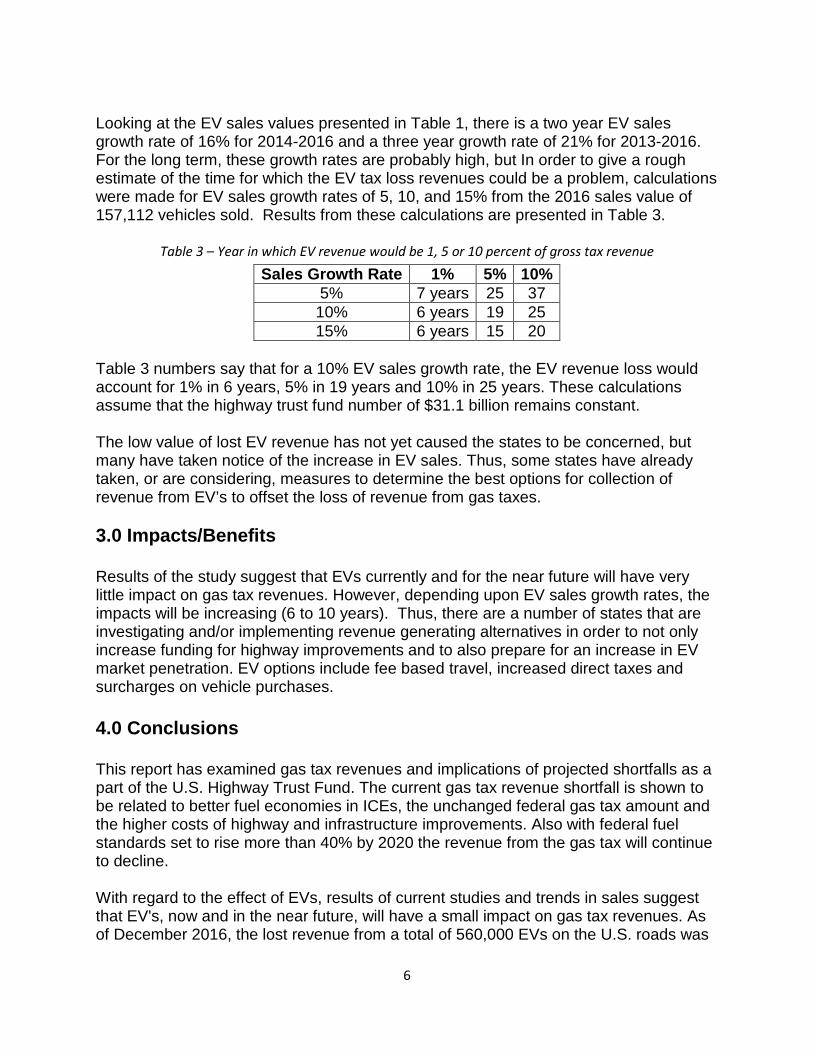
Looking at the EV sales values presented in Table 1, there is a two year EV sales growth rate of 16% for 2014-2016 and a three year growth rate of 21% for 2013-2016. For the long term, these growth rates are probably high, but In order to give a rough estimate of the time for which the EV tax loss revenues could be a problem, calculations were made for EV sales growth rates of 5, 10, and 15% from the 2016 sales value of 157,112 vehicles sold. Results from these calculations are presented in Table 3.
Table 3 – Year in which EV revenue would be 1, 5 or 10 percent of gross tax revenue Sales Growth Rate 1% 5% 10%
5% 7 years 25 37 10% 6 years 19 25 15% 6 years 15 20
Table 3 numbers say that for a 10% EV sales growth rate, the EV revenue loss would account for 1% in 6 years, 5% in 19 years and 10% in 25 years. These calculations assume that the highway trust fund number of $31.1 billion remains constant. The low value of lost EV revenue has not yet caused the states to be concerned, but many have taken notice of the increase in EV sales. Thus, some states have already taken, or are considering, measures to determine the best options for collection of revenue from EV’s to offset the loss of revenue from gas taxes. 3.0 Impacts/Benefits Results of the study suggest that EVs currently and for the near future will have very little impact on gas tax revenues. However, depending upon EV sales growth rates, the impacts will be increasing (6 to 10 years). Thus, there are a number of states that are investigating and/or implementing revenue generating alternatives in order to not only increase funding for highway improvements and to also prepare for an increase in EV market penetration. EV options include fee based travel, increased direct taxes and surcharges on vehicle purchases. 4.0 Conclusions This report has examined gas tax revenues and implications of projected shortfalls as a part of the U.S. Highway Trust Fund. The current gas tax revenue shortfall is shown to be related to better fuel economies in ICEs, the unchanged federal gas tax amount and the higher costs of highway and infrastructure improvements. Also with federal fuel standards set to rise more than 40% by 2020 the revenue from the gas tax will continue to decline. With regard to the effect of EVs, results of current studies and trends in sales suggest that EV's, now and in the near future, will have a small impact on gas tax revenues. As of December 2016, the lost revenue from a total of 560,000 EVs on the U.S. roads was

7
calculated to be $111.8 million per year. This amount compares to total gas tax revenues of $31.1 billion or is a loss of 0.36%. Results show that if the EV sales growth rate is 10%, then the EV revenue loss would account for drop in the gas tax of 1% in 6 years, 5% in 19 years and 10% in 25 years. It is important to note that the rate at which revenue declines depends on many factors, such as the rate of fuel economy gains, timing of fuel economy gains, VMT, and total vehicle fleet size. The relationship among these factors is complex and continued investigation is warranted to better understand vehicle fleet mix, fuel economy, and fuel tax revenue. 5.0 References 1. USA Today, http://www.usatoday.com/story/news/2016/12/27/state-gas-tax-
changes/95788702/ 2. Electric Drive Transportation Association,
http://electricdrive.org/index.php?ht=d/sp/i/20952/pid/20952

8
Attachment 1 -Implications of Electric Vehicles on Gasoline Tax Revenues Electronic reference: Schleith, K. (2015) Implications of Electric Vehicles on Gasoline Tax Revenues (FSEC Rep No. FSEC-CR-2011-15). Cocoa, FL: Florida Solar Energy Center
Implications of Electric Vehicles on Gasoline Tax Revenues
Kevin Schleith
Florida Solar Energy Center 1679 Clearlake Road
Cocoa, FL 32922-5703 E-mail: [email protected]
Submitted to:
Ms. Denise Dunn Research and Innovative Technology Administration 1200
New Jersey Avenue, SE Washington, DC 20590
E-mail: [email protected]
Contract Number: DTRT13-G-UTC51 FSEC Report Number: FSEC-CR-2011-15
December 2015
The contents of this report reflect the views of the authors, who are responsible for the facts and the accuracy of the information presented herein. This document is disseminated under the sponsorship of the U.S. Department of Transportation’s University Transportation Centers Program in the interest of information exchange. The U.S. Government assumes no liability for the contents or use thereof.

2
Implications of Electric Vehicles on Gasoline Tax Revenues
Kevin Schleith Florida Solar Energy Center
December, 2015 I. Summary
This report summarizes the results of research conducted to determine if current and near future EV sales will have an impact on gasoline (gas) tax revenues as part of the Federal Highway Trust Fund (HTF). Gasoline taxes account for $31.1 billion or about 87% of the HTF. The project results were accomplished through a review of existing industry and government reports that detail fuel tax revenues and through analysis of EV sales from 2010 to 2015. Results for electric vehicle (EV) market penetration have shown increasing sales, but EVs have resulted in very little impact on gas tax revenues. As of August 2015, the lost gas tax revenue from EV sales of 365,000 vehicles is shown to be $71.9 million or a loss of 0.23% Current assessment is that in 15 to 25 years EVs could make an impact on revenue. Policies and programs that aim to increase revenue streams for highway funding as a result of EVs are under discussion in some states. Options being considered are fee based travel, increased direct taxes and surcharges on vehicle purchases The report also examines the implications and needs in HTF funding. According to numerous references, the HTF has experienced a continuing shortfall that is attributed to three major factors; more fuel efficient internal combustion engine (ICE) vehicles, the fact that federal gas rates has not risen since 1993 and the increased cost in highway construction and repairs. In recent breaking news, the U.S. Congress has passed a $305 billion, five year, transportation bill that funds the nation’s highways and other infrastructure. This long-term bill is called the FAST Act (Fixing America’s Surface Transportation). The legislation does not raise the gas tax of $0.184/gallon, but relies on short-term financing measures. For the future, if the gas tax is to remain the major source of highway funding, then both federal and state level policy officials most likely will need to create and implement transportation revenue generation strategies that may not rely entirely on the gasoline tax. The report covers some of the revenue generation options in place and under consideration as well as the pros and cons of each.

3
II. Highway Trust Fund Overview
1. The Federal Highway Trust Fund The Highway Trust Fund (HTF) collects and distributes money dedicated to the nations highway and transit projects. It is funded primarily by the federal and state taxes on gasoline and diesel fuel, which are $0.184 and $0.243 per gallon, respectively. 1
Figure 1- Highway Trust Fund Revenue Projections
As illustrated in Figure 1, the fund is made up of various taxes but relies primarily on both federal and state taxes on motor fuel for about 87% of its revenue. The Highway Trust Fund numbers are a total of $35.7 billion for federal fiscal year 2015 (October 1, 2014 to September 30, 2015).2 Thus, the gas tax portion of the Trust fund is $31.1 billion. The federal rate has remained the same since 1993 which has led to a decrease in the purchasing power of the revenue over time — $0.184 buys only 60% today than it did in 19933. Additionally, states are seeing a higher demand for roadway improvements and ever increasing annual construction spending4,5. This coupled with increased construction costs have led to a large demand for funding which is burdening an already depleted highway trust fund. In addition to this, higher fuel efficiencies and a recent trend of U.S. drivers driving less miles per year have resulted in decreased fuel use and thus less taxes to cover highway funding.6,7 In recent breaking news, the U.S. Congress has passed a $305 billion, five year, transportation bill that funds the nation’s highways and other infrastructure. This long-term bill is called the FAST Act (Fixing America’s Surface Transportation) and was

4
signed by President Obama on December 4, 2015. The legislation does not raise the gas tax of $0.184/gallon, but relies on short-term financing measures such as use of private collection agencies to recoup certain outstanding taxes, the sale of 66 million barrels of oil from the Strategic Petroleum Reserve, cuts in annual dividend payments from the Federal Reserve and the use of dollars from the Federal reserve rainy-day fund. The Congressional action will temporarily fix the federal part of the Trust Fund, but the long-term stability of the federal funding is still not completely addressed. 2. Future Highway Funding Implications The US DOT publishes an objective appraisal of the physical conditions, operational performance, and financing mechanisms of highways, bridges, and transit systems based on both their current state and under future investment scenarios. In the most recent Conditions and Performance (C&P) Report, DOT estimates the U.S. needs $85 to $177 billion annually which is well above current trust fund revenues.8 The Congressional Budget Office (CBO) has also examined the implications of long-term Highway Trust Fund revenues. The CBO projections show that the cost of a six-year transportation bill at current funding levels plus inflation would require approximately $85 billion in additional revenues to be transferred into the fund. Figure 2 below shows a CBO history and future predictions of trust fund revenues and expenditures along with the expected cash flow shortfalls through 2024.9
Figure 2- Highway Trust Fund Revenues & Expenditures
This projected shortfall in highway funding has led to many states curtailing their long term transportation projects and, as a result, there is cause for uncertainty in the continuation of road repair projects and future roadway improvements. Other implications can be considered as both economic and social. The American Road and Transportation Builders Association (ARTBA) reported that in 2014, nine states

5
retracted of delayed projects totaling $366 million due to the uncertainty of federal funding.10 Additionally, a White House report prepared by the National Economic Council reported that inadequate infrastructure results in “American businesses pay $27 billion a year in extra freight transportation costs, increasing shipping delays and raising prices on everyday products.11 The report also stated that there were more than 33,000 traffic fatalities last year alone and roadway conditions are a significant factor in approximately one-third of traffic fatalities. Social implications to inadequate or poor highway infrastructure include job creation in the highway workforce. The Center for American Progress reported that for every $1 billion invested in infrastructure, the nation creates between 10,000 and 15,000 jobs.12 3. State Funding and Measures to Increase Funds Figure 3 shows the various state tax rates which comprise the balance of the gas tax funding.13 It is noted that on the average, states collect $0.31/gallon as compared to the federal rate of $0.184/gallon. The highest state rates are shown by the dark colors.
Figure 3- State Gasoline Tax Rates

6
As a direct result of the shortfalls in funding, a number of states have begun enacting legislation to raise transportation revenues through such measures as additional taxes on car registration, roadway bonds, increased toll roads and additional state taxes on fuels and other commodities. Most recently, as depicted in Figure 4 below, drivers in Idaho, Georgia, Maryland, Rhode Island, Nebraska and Vermont will be charged more at the pump as a result of laws taking effect at the start of the states' new fiscal year.14
Figure 4 – State Gasoline Tax Changes
Also as shown in Figure 4, the gasoline tax rate will fall by $0.06 in California as a result of old laws linking its gas tax rates to gas prices (a unique quirk in California’s law will cause the diesel tax to rise by $0.02). California still has one of the highest tax rates in the country. Other state options include replacing or adding to the gas tax a vehicle miles traveled (VMT) tax that accounts for the type and weight of a vehicle and the location and time of its use (Oregon, California, Minnesota, Nevada) or requiring additional highway usage tolls. The VMT tax would provide strong incentives for efficient use of highways and would be better aligned with the costs imposed by users. Research shows the implementation of a VMT system offers significant potential benefits such as:15
• Fairness--all drivers pay for the true use and therefore the actual benefits derived from the use of the highway system.
• Stability of revenue--as gas prices increase there is a corresponding increase in the use of more fuel efficient cars and trucks, hybrids, and even electric vehicles. Less fuel is used resulting in lower gas tax collection even though the mileage travelled remains relatively constant. With a VMT system revenue remains relatively constant.

7
• Flexibility--additional factors such as time of day, congestion, and vehicle weight into the fees charged to road users.
• Higher revenue yield possible--value-added options, improved roads, and a direct correlation between benefit received and fee incurred will make the public more willing to accept higher user fees.
On the negative side, the cost to implement the YTM tax could be large due to factors such as installation of black boxes, tracking and recording mileage, and the overhead required to enforce and collect fees. The VMT concept also raises possible fairness issues of a greater burden imposed on low-income and rural users. As of now, Oregon is the first state to pass legislation that will allow a VMT tax to be administered instead of a gas tax. The tax is in the final testing phase and is being administered to a small select group of vehicle owners in Oregon.16 The program has been in a “test phase” in order to address issues such as vehicle tracking administrative cost and privacy when reporting miles driven. It is a voluntary demonstration program involving 5,000 vehicle owners who would have been charged 1.5 cents per mile road usage charge for travel on public roads. The data is under evaluation. III. Electric Vehicle’s Impact on Highway Funding 1. EV Sales As depicted in Figure 5, Electric Vehicle (EV) sales have increased significantly over the past five years.
Figure 5 - EV Sales Trend

8
According to research from InsideEVs.com, approximately 123,049 electric vehicles and plug-in electric vehicles were sold in the United States in 2014, a 23% jump from 2013 and a 128% jump from 2012.17 Of course, despite the increase, electric and plug-in electric vehicles still represent a small portion of the US auto market. With total vehicle sales for 2014 coming in at around 16.5 million, EVs made up less than 1% of total sales. Sales through October 2015 are reported to be 92,347 which is a slight decrease from 2014 sales. Additionally, EV sales forecasting by Navigant predicts a compound annual growth rate as high as 20.9%, with moderate estimates closer to 16%.18
In order to calculate the effect of EVs on the gas tax, information on taxes paid by ICE drivers is used as the basis for the calculations. As depicted in Table 1 and using information from the Federal and State Gasoline Tax rates and the US DOT and DOE, the average ICE driver pays approximately $245 per year in gas taxes.19 This is derived from annual average miles driven of approximately 12,000 miles per year and an average gas mileage of 24 miles/gallon, giving an average yearly usage of 500 gallons of gasoline. See Table 1.
Table 1 -Average Per Car Gas Tax Charge
Average Per Car Gas Tax Charge
Average State Tax $0.31
Federal Tax $0.18 Average Total Tax to Support Federal Highways $0.49
* Average Gallons Used per Car (12,000/24) 500
*Average Cost of Tax per Car (500 x $.49) $245
*DOT/DOE reported 24 MPG for 2014 Average and Average miles driven per year of 12,000 Using the gas tax per vehicle value of $245 as the average an EV would pay, then the revenue lost by EVs (all electric and plug-in’s) may be calculated. The calculation assumes that the split between all electric and plug-in electric is 51-49 and the plug-in uses electricity for 60% of the vehicle miles traveled. The calculated revenue lost for 365,000 EVs is $71.9 million/year. The results are shown in Table 2.

9
Table 2- Estimated Tax Revenue Lost Form EV Sales
Tax Revenue Lost From EV Sales in the US (Through 8/15)
Average Gas Tax paid per Car $245
Cumulative Total of EV's in the US 365,000
Average Gas Tax Revenue Lost from EV Sales $71.9 Million
*Total Net Gas Tax Receipts $31.1 Billion
**Percentage Tax Revenue Lost from EV's 0.23% *Net gas tax receipts reported from October 2014 through September 20151
**Lost revenue percentage calculation based upon the gasoline/diesel makeup of 87% of total tax receipts (see Figure 1)
2. EV Tax Measures to Support Highway Funding The low value of lost EV revenue has not caused the states to be concerned, but many have taken notice of the increase in EV sales. Thus, some states have already taken, or are considering, measures to determine the best options for collection of revenue from EV’s to offset the loss of revenue from gas taxes. There are select West Coast markets that may be impacted by the loss in tax revenues as a result of EVs. The governments in California, Oregon, Washington, and Hawaii have each enacted policies to aggressively encourage the adoption of electric vehicles. These states most likely will experience the gas tax loss earlier and may see roadway funding impacts at a different level than other states not impacted by EV market shares. From the National Conference of State Legislatures, many states are adopting or considering measures to add revenues as a result of EV market increases.20 For example, Washington State has begun charging EV owners a $100 annual fee to supplement roadway funding that is traditionally obtained through the state’s gas tax. Their current gas tax is set at $0.375/gallon and is the largest source of transportation revenue. At $0.375/gallon for a vehicle owner who drives an average of 12,000 miles with a fuel economy of 23–25 MPG, the total expected tax to be paid annually would be equal to $180–$200 or about twice the EV fee. The $100 annual fee was enacted by Washington State House Bill 2660, which went into effect February 1, 2013. It is important to note that this charge applies only to those with fully electric vehicles. Those with hybrid EVs, who use gasoline partially, are not subject to this fee. In Oregon, a state law has been passed that requires both hybrid and fully electric vehicles to pay a four-year or two-year registration fee of $172 or $86 respectively. A summary of EV specific actions being conducted by the various state governments is presented in Table 3 below.
10
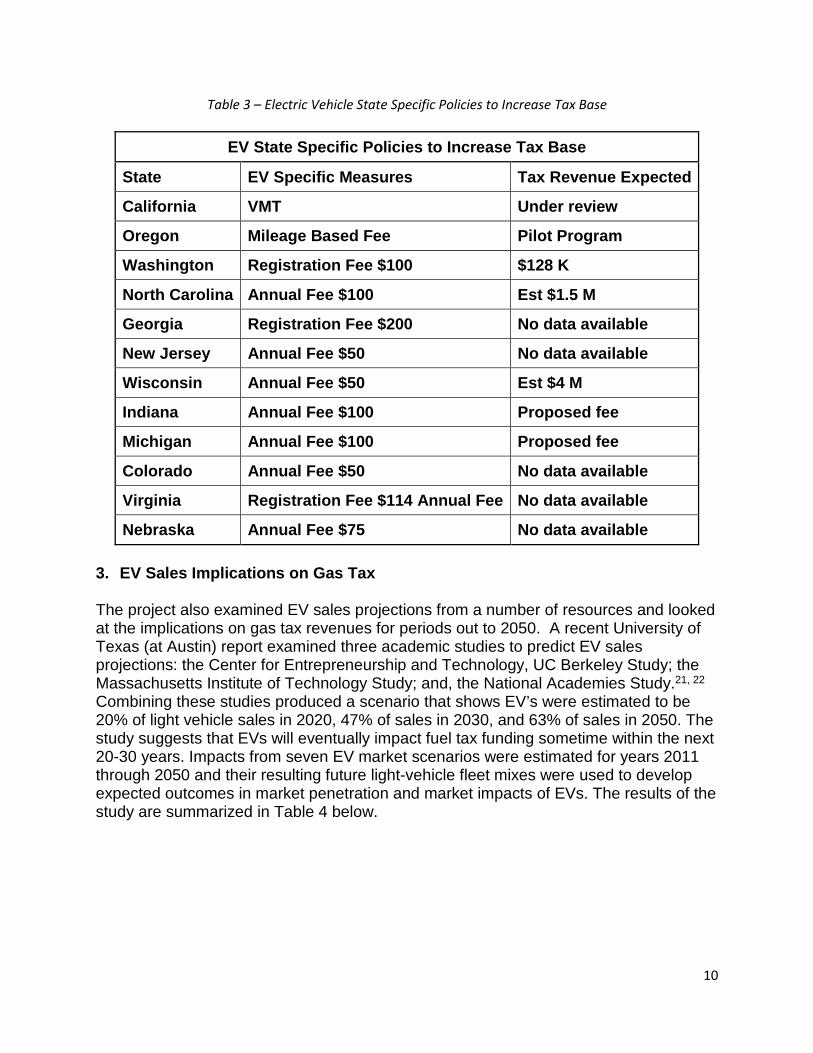
Table 3 – Electric Vehicle State Specific Policies to Increase Tax Base
EV State Specific Policies to Increase Tax Base
State EV Specific Measures Tax Revenue Expected
California VMT Under review
Oregon Mileage Based Fee Pilot Program
Washington Registration Fee $100 $128 K
North Carolina Annual Fee $100 Est $1.5 M
Georgia Registration Fee $200 No data available
New Jersey Annual Fee $50 No data available
Wisconsin Annual Fee $50 Est $4 M
Indiana Annual Fee $100 Proposed fee
Michigan Annual Fee $100 Proposed fee
Colorado Annual Fee $50 No data available
Virginia Registration Fee $114 Annual Fee No data available
Nebraska Annual Fee $75 No data available 3. EV Sales Implications on Gas Tax The project also examined EV sales projections from a number of resources and looked at the implications on gas tax revenues for periods out to 2050. A recent University of Texas (at Austin) report examined three academic studies to predict EV sales projections: the Center for Entrepreneurship and Technology, UC Berkeley Study; the Massachusetts Institute of Technology Study; and, the National Academies Study.21, 22 Combining these studies produced a scenario that shows EV’s were estimated to be 20% of light vehicle sales in 2020, 47% of sales in 2030, and 63% of sales in 2050. The study suggests that EVs will eventually impact fuel tax funding sometime within the next 20-30 years. Impacts from seven EV market scenarios were estimated for years 2011 through 2050 and their resulting future light-vehicle fleet mixes were used to develop expected outcomes in market penetration and market impacts of EVs. The results of the study are summarized in Table 4 below.

11
Table 4- University of Texas at Austin Study Results Years 2030-2050
University of Texas Study Results
2030 2050
Expected EV % of Sales 47% 63% Expected Fuel Revenue ($billions)* 13.1 - 22.9 14.7-29.7
Funds Lost due to EV market share* 18 - 56% 20-56%
Cumulative Revenue ($billions)* 312-422 600-949
Cumulative Loss ($billions)* 5.4-100.7 30.2-350
Cumulative Loss Ratio* 5-27% 12-42%
*Includes both fuel advancement and non-advancement of ICE's Other studies have also concluded that given the current market, the 2030 and beyond time period will most likely see a large EV market penetration. It is important to note that the rate at which revenue declines depends on many factors, such as the rate of fuel economy gains, timing of fuel economy gains, VMT, and total vehicle fleet size. The relationship among these factors is complex and continued investigation is warranted to better understand vehicle fleet mix, fuel economy, and fuel tax revenue. An equitable tax solution that accounts for EV’s needs to be devised in order to keep pace with highway funding needs. IV. Conclusions This report has examined gas tax revenues and implications of projected shortfalls as a part of the U.S. Highway Trust Fund. The current gas tax revenue shortfall is shown to be related to better fuel economies in ICEs, the unchanged federal gas tax amount and the higher costs of highway and infrastructure improvements. Also with federal fuel standards set to rise more than 40% by 2020 the revenue from the gas tax will continue to decline. The U.S. Congress has passed a $305 billion, five year, transportation bill that funds the nation’s highways and other infrastructure. This long-term bill is called the FAST Act (Fixing America’s Surface Transportation) and will temporarily fix the federal part of the Trust Fund. The long-term stability of the federal funding is still not completely addressed. If the gas tax is to remain the primary source of future highway funding, then federal and state officials need to create and implement transportation revenue generation strategies that will meet the funding needs. Suggested solutions are to tie actual roadway use to the amount of taxes paid by a driver in the form of a value added tax or VMT.

12
With regard to the effect of EVs, results of current studies and trends in sales suggest that EV's, now and in the near future, will have a small impact on gas tax revenues. As of August 2015, the lost revenue from a total of 365,000 EVs on the U.S. roads was calculated to be $71.9 million per year. This amount compares to total gas tax revenues of $31.1 billion or is a loss of 0.23%. Results from a University of Texas study on EV market share suggest that over 50% of gas tax funds may be lost by 2050. It is important to note that the rate at which revenue declines depends on many factors, such as the rate of fuel economy gains, timing of fuel economy gains, VMT, and total vehicle fleet size. The relationship among these factors is complex and continued investigation is warranted to better understand vehicle fleet mix, fuel economy, and fuel tax revenue. Finally, there are a number of states that are investigating and/or implementing revenue generating alternatives in order to not only increase funding for highway improvements and to also prepare for an increase in EV market penetration. EV options include fee based travel, increased direct taxes and surcharges on vehicle purchases. V. References 1. Congressional Research Service: Federal Excise Tax on Motor Fuels and the
Highway Trust Fund, http://nationalaglawcenter.org/wp-content/uploads/assets/crs/RL30304.pdf
2. US Department of Transportation, http://www.fhwa.dot.gov/highwaytrustfund/docs/fe-1_sep15.pdf
3. Peterson Foundation, Budget Explainer, http://www.pgpf.org/budget-basics/budget-explainer-highway-trust-fund
4. Governing, How State and Local Construction Dollars are Spent, http://www.governing.com/topics/transportation-infrastructure/gov-how-state-and-local-construction-dollars-are-spent.html
5. ARTBA, U.S. Transportation Construction Market Forecast 2014 http://www.artba.org/Media/PDFs/2014artbaforecastfinal.pdf
6. Bureau of Transportation Statistics, http://www.rita.dot.gov/bts/sites/rita.dot.gov.bts/files/publications/national_transportation_statistics/html/table_04_23.html
7. Business Insider, US Vehicle Miles Driven Have Sunk To A New Post-Crisis Low, http://www.businessinsider.com/vehicle-miles-driven-2013-2
8. US Department of Transportation C&P Report, https://www.fhwa.dot.gov/policy/2013cpr/pdfs/cp2013.pdf
9. Trust or Bust: Fixing the Highway Trust Fund, http://crfb.org/sites/default/files/trust_or_bust_fixing_the_highway_trust_fund_final.pdf
10. ARTBA, Looming Highway Trust fund Crisis, http://www.artba.org/wp-content/uploads/2014/03/ARTBA-HTF-Uncertainty-Report-05-27-2015.pdf
11. National Economic Council, Economic Analysis of Transportation Infrastructure,https://www.whitehouse.gov/sites/default/files/docs/economic_analysis_of_transportation_investments.pdf
13
12. Center for American Progress, Understanding the Highway Trust Fund and the Perils of Inaction, https://www.americanprogress.org/issues/economy/report/2014/02/20/84314/understanding-the-highway-trust-fund-and-the-perils-of-inaction/
13. Tax Foundation, State Tax Rates, http://taxfoundation.org/blog/map-state-gasoline-tax-rates-2014
14. Institute on Taxation and Economic Policy, http://www.taxjusticeblog.org/archive/2015/06/gas_tax_changes_take_effect_ju.php
15. Switching from a Gas Tax to a Mileage-Based User Fee, Center for American Progress, Kevin DeGood and Michael Madowitz, July 2014, https://www.americanprogress.org/issues/tax-reform/report/2014/07/11/93657/switching-from-a-gas-tax-to-a-mileage-based-user-fee/
16. Oregon’s New Vehicle Miles Traveled Tax, http://usa.streetsblog.org/2013/09/24/ten-questions-and-answers-about-oregons-new-vmt-charge/
17. Inside EVs Monthly Plug-In Sales Scorecard, http://insideevs.com/monthly-plug-in-sales-scorecard/
18. Hybrid Cars, http://www.hybridcars.com/1-million-annual-u-s-plug-in-sales-expected-by-2024/
19. US DOE Alt Fuel Center, http://www.afdc.energy.gov/data/ 20. National conference of State Legislatures, Proposals Under Consideration in
2014 Legislative Sessions, http://www.ncsl.org/research/fiscal-policy/2014-tax-change-proposals.aspx
21. Transportation Revenue Impacts from a Changing Light-Duty Vehicle Fleet, The University of Texas at Austin, Report 600451-00073-1, Andrea Hall, Michael Walton and Peter Jin, September 2013
22. A New Model with Forecasts to 2030, Center for Entrepreneurship & Technology (CET), Thomas A. Becker, Technical Brief, Number: 2009.1.v.2.0, August 24, 2009