electric vehicle charging technologies analysis...
TRANSCRIPT

Electric Vehicle Charging Technologies Analysis and Standards
Doug Kettles, Richard Raustad
Electric Vehicle Transportation Center Florida Solar Energy Center
1679 Clearlake Road Cocoa, FL 32922-5703
[email protected] [email protected]
Submitted as:
Final Research Project Report EVTC Project 3 – Electric Vehicle Charging Technologies
Analysis and Standards
Submitted to: Ms. Denise Dunn
Research and Innovative Technology Administration 1200 New Jersey Avenue, SE
Washington, DC 20590 E-mail: [email protected]
Contract Number: DTRT13-G-UTC51 EVTC Report Number: FSEC-CR-2057-17
February 2017
The contents of this report reflect the views of the authors, who are responsible for the facts and the accuracy of the information presented herein. This document is disseminated under the sponsorship of the U.S. Department of Transportation’s University Transportation Centers Program in the interest of information exchange. The U.S. Government assumes no liability for the contents or use thereof.

2
Acknowledgements
This report is a final research report for the Implications of Electric Vehicle Charging Technologies Analysis and Standards project of the Electric Vehicle Transportation Center (EVTC) at the University of Central Florida (UCF). The Electric Vehicle Transportation Center is a University Transportation Center funded by the Research and Innovative Technology Administration of the U.S. Department of Transportation. The EVTC is a research and education center whose projects prepare the U.S. transportation system for the influx of electric vehicles into a sustainable transportation network and investigate the opportunity these vehicles present to enhance electric grid modernization efforts. The EVTC is led by UCF's Florida Solar Energy Center with partners from UCF’s Departments of Electrical Engineering and Computer Science and Civil, Environmental and Construction Engineering, the University of Hawaii, and Tuskegee University.
The objectives of Electric Vehicle Charging Technologies Analysis and Standards project was to assess current and emerging technologies, codes and standards associated with Electric Vehicle Service Equipment (EVSE), Electric Vehicles (EVs) and the related costs and infrastructure. Project output was to recommend policies and best practices to advance both vehicle and EVSE deployment and to collect EV charging data in order to evaluate electrical power usage. The work was conducted by Doug Kettles and Richard Raustad, Co-Principle Investigators, of the Florida Solar Energy Center.

3
Final Research Project Report
Electric Vehicle Charging Technologies Analysis and Standards
Doug Kettles, Richard Raustad
Electric Vehicle Transportation Center February 2017
1.0 Abstract
This project has evaluated the technologies and standards associated with Electric Vehicle Service Equipment (EVSE) and the related infrastructure, and the major cost issue related to electric vehicle (EV) charging -- the cost of utility power. The technology assessment report evaluated safety standards for infrastructure, highway and vehicles and the barriers and challenges of deploying an expanded network of EV charging stations. The report also made recommendations to help standardize and expedite EVSE infrastructure and charging network deployment.
For the cost analyses, the issue of demand charges for utility power are examined for two case studies – one assumes that a dedicated utility electric meter connection for the EV charging station, the second case assumes that the EV charging station is part of the total electrical service for a commercial or industrial building complex. The costs associated with EV charging are the electricity used to charge the vehicle, the equipment needed to provide the electricity and charging station maintenance. Both studies use a life cycle cost analysis. The cost analysis shows that these high-power charging stations can significantly add to the facilities monthly electric bill because of utility demand charges and underutilization of the charging facility. A most important result from this work is that an energy management system (EMS) can lend itself to reducing or eliminating the portion of the electric bill associated with charger electrical demand. The detailed results from this project are presented in three reports.
2.0 Research Results
The research results for this project are presented in three reports that are posted on the EVTC website. The citations for these three reports are as follows:
1. Kettles, D., (2015). Electric Vehicle Charging Technology Analysis And Standards, (FSEC Report No. FSEC-CR-1996-15). Cocoa, FL: Florida Solar Energy Center.
2. Raustad, R., (2016). Cost Analysis of Workplace Charging for Electric Vehicles, (FSEC Report No. FSEC-CR-2030-16). Cocoa, FL: Florida Solar Energy Center.
3. Raustad, R., (2016). EV Workplace Charging Energy Use and Cost Case Study, (FSEC Report No. FSEC-CR-2037-16). Cocoa, FL: Florida Solar Energy Center.
A summary of the findings from each of these reports follow.

4
Report 1 -- Electric Vehicle Charging Technology Analysis and Standards The infrastructure element that provides the crucial link between an electric vehicle with a depleted battery and the electrical source that will recharge those batteries is the Electric Vehicle Supply Equipment (EVSE). EVSE delivers electrical energy from an electricity source to charge an EV’s battery and communicates with the EV to ensure that an appropriate and safe flow of electricity is supplied. EVSE units are commonly referred to as charging stations. The basic EVSE equipment is connected to an electrical power source that provides the alternating current (AC) or the direct current (DC) to supply the electrical charge to the vehicle’s traction batteries. EVSE charging capacity options are an important consideration as they have a direct bearing on how fast the batteries can be recharged. As an example, Level 2 or DC EVSEs are available in 20, 30 and 40 amp or higher capacities, and higher amperage equates to faster recharge times. However, the EV’s onboard charger must have the ability to match the full output of the EVSE to realize the fastest recharge times. The technologies and standards assessment work included discussions of the following five areas:
1. Electric Vehicle Supply Equipment Technologies – Section contains: Basic EVSE Components, EVSE Charger Classifications, PEV Battery Systems, EVSE/PEV Signaling and Communications, PEV Battery Charging Frequency, PEV Battery Charging Duration, PEV Battery Charging Networks, PEV Battery Charging Expense, Wireless Charging, EVSE Power Source and Vehicle-To-Grid (V2G).
2. EVSE and Infrastructure and Safety Codes and Standards – Section contains: ANSI, The Occupational Health and Safety Administration (OSHA) and Nationally Recognized Testing Laboratories (NRTL), Environmental, Infrastructure and Vehicle Design.
3. EVSE Infrastructure Development– Section contains: EVSE Deployment Metrics, Governmental EVSE Deployment Programs and Resources and Commercial and Public EVSE Deployment
4. Barriers to EVSE Infrastructure Expansion
5. Recommendations for Accelerated EVSE Infrastructure Expansion.
The vast majority of recharging takes place in the home garage but most EV owners will eventually use EVSE installed at public charging facilities. Public facilities range from a Level 1 residential type electrical outlet at a local restaurant to a DC Fast Charge facility in a parking garage. Their use can be free or require payment. Deployed EVSE are primarily owned and operated by private network providers, but many local governmental entities have installed chargers at locations such as libraries or other public facilities. According to the U.S. Department of Energy’s Alternative Fuels Data Center, there are currently over 15,489 EV recharging stations with over 40,779 charging outlets in the

5
United States (Reference 1). Finding the location of public charging stations is almost totally dependent on having access to the Internet or a smartphone with a location finder application. With regard to need, attention needs to be focused on the development of the EV recharging infrastructure for the urban and multifamily environments. According to the Federal Highway Administration almost 80% of the U.S. population resides in an urban area (Reference 2). EVs are ideally suited to the travel requirements of these areas, and the largest positive impacts to the environment and U.S. energy independence will be realized in urban population areas. At present, EV owners do not enjoy the benefits of the standardized refueling facilities familiar to the owners of conventionally fueled vehicles. The development of standards to support the expansion of EVSE infrastructure has been slow and frequently interrupted. Combining the lack of physical layer standardization with the proprietary nature of existing EV recharging networks, results in a challenge for the average motorist when considering the switch to an electric vehicle. For public and workplace charging, both standardization and incentives are needed for establishing off-peak electrical power rate schedules. Charging costs are evaluated in the next two sections of this report. To promote the goal of true Zero Emissions, incentives are also needed that specifically support the inclusion of photovoltaic supplied energy for EVSE installations. Restoring federal tax credits for the installation of public and private EVSE infrastructure encourage EV adoption.
EV technologies, including advanced battery technologies, are providing a travel range equal to conventionally fueled vehicles, and at significant cost reductions as manufacturing volume increases. The available model selections for EVs have expanded quickly and the commitment of major car manufactures continues to intensify. Expanded recharging infrastructure is a requirement for continued growth and acceptance of EVs. Promising research in wirelessly charging is underway, and more attention is needed to help realize the promise of untethered recharging of EVs. The successful development and deployment of wireless technology will provide the convenience of pulling into a garage or a parking spot and having the EV recharged without the need to connect and disconnect a cable. There is also the possibility of embedding wireless charging in the roadway as a method of continuously recharging the vehicle while in transit; a system that would allow a dramatic reduction in battery size and extend the travel range of EVs. In the effort to focus attention on some of the key elements needed to stabilize and accelerate the establishment of a nationwide EV re-charging infrastructure, the following recommendations were made:

6
1. Policy and decision-makers: a) Overall EVSE network expansion strategy, b) Governmental incentives tied to the deployment and ROI of the EVSE
infrastructure to support a deployment business model, c) Attention to the development of the EV recharging infrastructure for the urban
and multi-family environments, d) Requirements establishing an EVSE network within the federal highway
system, e) Adoption of infrastructure reliability and performance standards similar to those
required of conventional refueling stations, f) State and local strategies for the deployment of EVSE in primary travel
corridors, airports and significant public gathering places, g) Research and development of wirelessly charging EVs h) Intensified research and development of Vehicle-To-Grid (V2G) applications, i) Public awareness campaigns for EV and EVSE, j) Standardized methodology for establishing off-peak electrical power rate
schedules or allowing public EVSE operators to charge by kilowatt hours for EV owners,
k) Incentives for the installation of photovoltaic supplied energy for public EVSE, l) Restoration of tax credits for the installation of public and private EVSE.
2. Industry support groups and stakeholders:
a) EVSE network expansion strategy, b) Public awareness campaigns for EV and EVSE, c) Strategies for the deployment of EVSE in primary travel corridors, airports and
significant public gathering places, d) Non-Internet based recharge station location capabilities for EV owners who lack
Internet access or Smartphones, e) Models for the strategic deployment of EVSE, f) Improved coordination among stakeholder groups in promoting the expansion of
EVSE infrastructure.
3. Auto Manufacturers, Standards developers and EVSE vendors:
a) Payment processes and back-office communications and interfaces, b) Public EVSE network-to-network communications, c) EVSE V2G communications, d) Performance measurements of station reliability and availability.
7
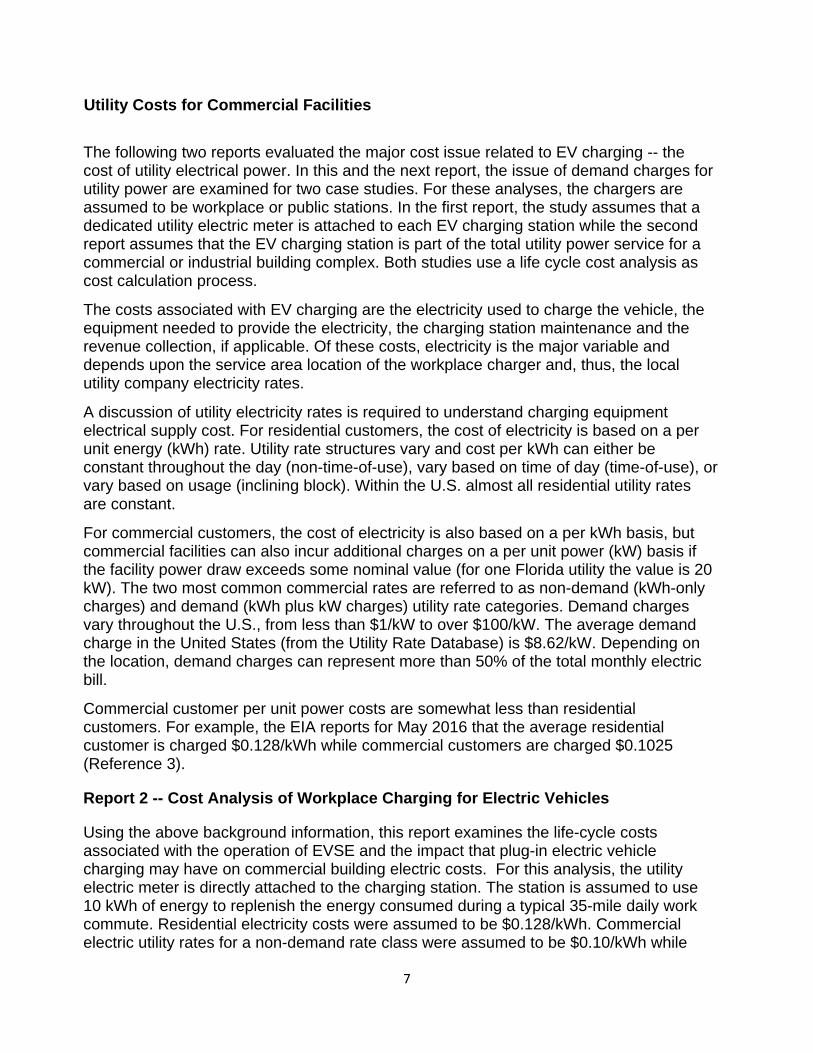
Utility Costs for Commercial Facilities
The following two reports evaluated the major cost issue related to EV charging -- the cost of utility electrical power. In this and the next report, the issue of demand charges for utility power are examined for two case studies. For these analyses, the chargers are assumed to be workplace or public stations. In the first report, the study assumes that a dedicated utility electric meter is attached to each EV charging station while the second report assumes that the EV charging station is part of the total utility power service for a commercial or industrial building complex. Both studies use a life cycle cost analysis as cost calculation process.
The costs associated with EV charging are the electricity used to charge the vehicle, the equipment needed to provide the electricity, the charging station maintenance and the revenue collection, if applicable. Of these costs, electricity is the major variable and depends upon the service area location of the workplace charger and, thus, the local utility company electricity rates.
A discussion of utility electricity rates is required to understand charging equipment electrical supply cost. For residential customers, the cost of electricity is based on a per unit energy (kWh) rate. Utility rate structures vary and cost per kWh can either be constant throughout the day (non-time-of-use), vary based on time of day (time-of-use), or vary based on usage (inclining block). Within the U.S. almost all residential utility rates are constant.
For commercial customers, the cost of electricity is also based on a per kWh basis, but commercial facilities can also incur additional charges on a per unit power (kW) basis if the facility power draw exceeds some nominal value (for one Florida utility the value is 20 kW). The two most common commercial rates are referred to as non-demand (kWh-only charges) and demand (kWh plus kW charges) utility rate categories. Demand charges vary throughout the U.S., from less than $1/kW to over $100/kW. The average demand charge in the United States (from the Utility Rate Database) is $8.62/kW. Depending on the location, demand charges can represent more than 50% of the total monthly electric bill.
Commercial customer per unit power costs are somewhat less than residential customers. For example, the EIA reports for May 2016 that the average residential customer is charged $0.128/kWh while commercial customers are charged $0.1025 (Reference 3).
Report 2 -- Cost Analysis of Workplace Charging for Electric Vehicles
Using the above background information, this report examines the life-cycle costs associated with the operation of EVSE and the impact that plug-in electric vehicle charging may have on commercial building electric costs. For this analysis, the utility electric meter is directly attached to the charging station. The station is assumed to use 10 kWh of energy to replenish the energy consumed during a typical 35-mile daily work commute. Residential electricity costs were assumed to be $0.128/kWh. Commercial electric utility rates for a non-demand rate class were assumed to be $0.10/kWh while

8
costs for a commercial demand rate class are $0.06/kWh plus a monthly peak demand cost of $11/kW.
Why look at electrical utility demand charges? Owners of EVs predominantly charge their vehicles at home. Although only a small percentage of EV owners charge away from home, a large majority of those away-from-home charging events will occur at work. A recent analysis of the National Household Travel Survey data shows that over fifty percent of EV owners would likely charge their vehicle when the traction battery state-of-charge drops below 50% and between 10% and 30% of these drivers will likely choose to charge at the workplace (Reference 4).
Workplace charging also provides an encouragement for EV adoption. When using both at-home and workplace charging, the electric-only range of EVs is easily extended. In addition, when at-home chargers are not available, for example apartment complexes, workplace charging will provide a convenient location for EV owners. The business owner could also promote workplace charging as an employee benefit. Additionally, workplace charging is a viable site for future vehicle-to-grid applications (V2G), where the building power demand may be offset through utilization of the energy within the EV battery.
Commercially available EV charging stations come in three basic forms: AC Level 1 (1-2 kW AC), AC Level 2 (2-20 kW AC), and high speed DC chargers (20-100 kW DC). These charging stations provide either an alternating current (AC) or direct current (DC) through the charging cable to the vehicle. Charging stations external to the vehicle provide higher charge rates, however, they come at higher first (capital and installation) costs and added maintenance costs. Higher charging rates (and cost) are achieved with DC fast chargers, although this type of charger is mainly used to facilitate long-distance travel and will rarely, if ever, be used for home or workplace charging.
For the complete documented details of the life-cycle cost calculations, the reader is referred to Report 2. These calculations include considerations for charger equipment capital and installation costs, operating and maintenance costs, recurring annual fees and charger operational characteristics that include session utilization numbers and charging frequency. All calculations are done over a 10-year life cycle period, for 10 kWh of energy and for the three levels of charging - AC Level 1, AC Level 2 and DC Level 2.
The life-cycle cost calculations are presented in Table 1 which shows the electrical service supply cost for an individual vehicle charging session, assuming the station is fully utilized throughout the workday or underutilized if used only once per day.
From Table 1, the cost to charge an EV at home using an AC Level 1 charging station is $1.79 per charging session, while charging at work would cost $1.53 if utility demand charges were not part of the electric bill, or $1.79 if demand charges were incurred. Charging the PEV at higher power levels (e.g. AC Level 2 or DC Level 2) results in much higher costs when charging stations are used only once per day. The underutilized costs shown in Table 1 are representative of how some charging stations are presently operated.
One key finding of this analysis was that electric utility demand charges can greatly increase charging station operating expense for underutilized equipment. If the facility

9
demand charge can be minimized or avoided then workplace charging can ultimately be the lowest cost option.
Table 1. 10-Year Life-Cycle and Electricity Costs for PEV Charging Stations
Station Type
(10 kWh’s/day per vehicle)
Per Session Life-Cycle Costs
Fully Utilized Underutilized
Life-Cycle Electricity Cost1
Life-Cycle Electricity Cost1
AC Level 1 – R $1.79 $1.28 $1.79 $1.28
AC Level 1 – C $1.53 $1.00 $1.53 $1.00
AC Level 1 – D $1.79 $1.29 $1.79 $1.29
AC Level 2 – C – No fee $1.32 $1.00
$2.60 $1.00
AC Level 2 – C – Fee $2.24 $6.28
AC Level 2 – D – No fee $1.67 $1.39
$5.07 $3.77
AC Level 2 – D – Fee $2.59 $8.75
DC Level 2 – D $2.39 $1.26
$30.15 $11.16
DC Level 2 – T $2.75 $35.93
R – residential, C – commercial non-demand, D – commercial demand, T – commercial demand with new transformer. No fee – no annual or per payment processing fees, Fee – annual or per payment processing fees Fully utilized: AC Level 1 – 1 vehicle per day, AC Level 2 – 4 vehicles per day, DC Level 2 – 16 vehicles per day Note: 1 – dollar values represent year 1 actual cost
From the results, commercial property owners considering proposed stations need to evaluate the number of cars using the stations and the electricity and demand costs. If this evaluation shows high electricity demand costs, then techniques for lowering demand charges need to be considered. Methods for mitigating the impact EV charging stations have on facility electricity use can include: installation of photovoltaics (PV) or energy storage devices, use of demand management strategies and selection of charging stations with the lowest power output or those with selectable output power. The next report examines different demand management strategies.
The amount of time an employee is regularly parked also allows for selection of the most cost effective charging rate. Although this analysis presented three common PEV charging rates, intermediate charging rates are possible. For example, a part-time employee might have a short commute that could be accommodated at an AC Level 2 rate of 3 kW in place of the normal 6 kW charge. Choosing the lowest charging rate possible would guarantee the lowest possible electricity costs. This analysis assumed that only the commute energy would be replaced on a daily basis. However, in the event

10
of longer daily travel or shorter dwell time, a slightly higher charging rate could be chosen to more fully charge an employee vehicle while still providing the lowest possible costs. This suggests that when an employer is considering installation of on-site charging stations, an analysis of potential employee usage may be prudent in order to assess the impact on the building energy profile. On an individual case basis, either the business owner or the employee could provide the financial support to create such an infrastructure.
Regardless of the station type, workplace charging can be economical if the electric utility demand charges can be minimized or avoided. Commercial demand charges apply only when the facility electricity needs exceed some minimum power requirement, usually 20 or 25 kW. A small business may not qualify for a commercial demand electricity rate, however, adding multiple EV charging stations could increase the facility maximum power demand sufficiently to require a change to a commercial demand rate category.
The costs associated with EV energy transfer (i.e. kWh) will always be part of the total life-cycle cost equation, however the total costs must also consider the demand charges that are specific to the particular electric utility rate structure at the charging facility. The costs associated with electric utility demand (i.e., kW) can be addressed up to a point. For a small number of vehicles, the demand costs can usually be mitigated through scheduling or active control. For larger numbers of vehicles, for example a large commercial application, adding to the facility’s existing peak demand may be unavoidable. In this case Report 3 helps define the limits of those costs.
Report 3 -- EV Workplace Charging Energy Use and Cost Case Study
The second case study examines the costs to provide workplace charging station services where chargers are a part of a facilities total electric bill. For this study, results are presented using data from five EV chargers located at the Florida Solar Energy Center (FSEC). Also presented are options for minimizing the electrical demand costs of the facility. These results show that electrical charging costs can be minimized if the workplace chargers are operated using a building energy management system (EMS) to control electricity use. In addition, the equipment costs will need to be capitalized through station use from multiple vehicles. Otherwise workplace charging can be costly.
A most important result from this work is that a simple energy management system (EMS) can lend itself to reducing or eliminating the portion of the electric bill associated with charger electrical demand. This EMS system has the two goals of minimizing the facility electricity demand and maximizing workplace charger availability. If EV chargers are not controlled, higher than expected utility demand costs can occur.
DC Fast Charger Results
The Florida Solar Energy Center located at Cocoa, Florida was fortunate to receive a donation from Nissan North America when Nissan purchased and paid for the installation of a Signet FC50K-CC 45 kW DC fast charger. The DC fast charger was part of Nissan’s campaign to provide more public charging stations for their customers. This station was installed at the FSEC site in December 2014. The 45 kW DC fast charger has 2 plugs, a CHAdeMO and SAE Combo connector that allows all models of U.S. EVs

11
to quick charge if the vehicle is so equipped. Only one vehicle may be actively charged at any given time. As part of this installation, an AC Level 2 public charging station was also included to provide charging for those vehicles not equipped with fast charging capability. A ChargePoint CT-4021GW single pedestal, dual-plug unit operates at 208 volts with two dedicated 30 amp breakers and provides 6 kW of charging capability per plug. Both of these stations are publically available and include payment systems which manage the charging session and payment processing. A photo of the stations are shown in Report 3.
The public charging stations include payment systems which collect and record the revenue. Charging stations that collect revenue will typically include recurring operating costs for the payment system. The DC fast charger is connected to the Green Lots payment network while the AC Level 2 chargers are connected to the Charge Point network. The fees for these networks are discussed in Report 3.
The public charging stations have been used regularly since their installation, albeit at a low level of use. Records collected from the network providers indicate that each calendar month these charging stations draw between 5 to 12 users and are used between 9 and 32 times per month. Monthly energy use ranges from 92 to 375 kWh and revenue collected ranges from $16 to $60.
Six months of data from the DC Fast Charger has now been recorded and analyzed. Plots of the FSEC electrical monthly peak load day (February 24, 2015 and March 19, 2015 are shown below in Figures 1 and 2).
These two graphs show that the installation of the fast charger increased the monthly peak demand by 23.4 kW in February and by 2.1 kW in March. The total facility peak demand for the two months was 278.4 kW and 285.8 kW, respectively. FSEC’s utility costs are comprised of a cost/kWh ($0.0545/kWh) and a cost for the highest kW demand/month ($10.61/kW). Thus, the DCFC charger cost an extra $248 and $28 per month, respectively. The data also revealed that the DCFC is a low use facility, with only one use occurring on the February day and two uses on the March day. The data has also shown no increases in monthly demand attributable to the DCFC for the months of March, April, May and June, 2015.

12
Figure 1 - FSEC facilities electrical load profile for peak load day of February 2015.
Figure 2 - FSEC facilities electrical load profile for peak load day of March 2015.
13
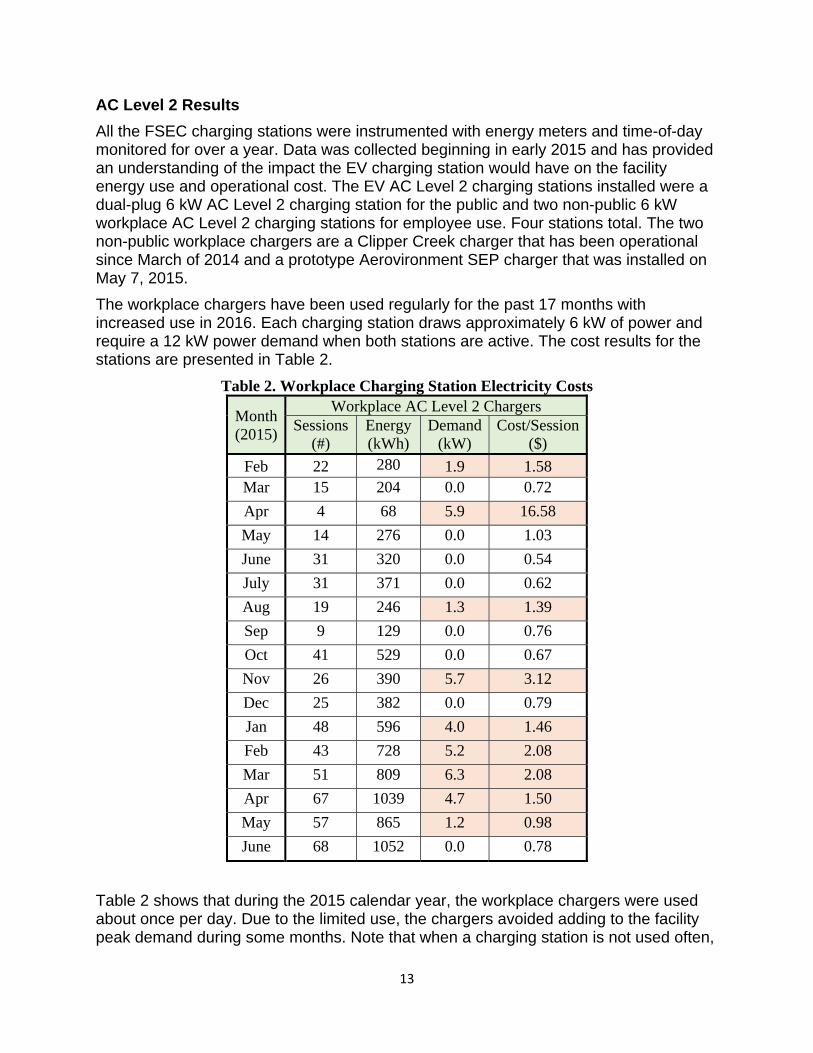
AC Level 2 Results
All the FSEC charging stations were instrumented with energy meters and time-of-day monitored for over a year. Data was collected beginning in early 2015 and has provided an understanding of the impact the EV charging station would have on the facility energy use and operational cost. The EV AC Level 2 charging stations installed were a dual-plug 6 kW AC Level 2 charging station for the public and two non-public 6 kW workplace AC Level 2 charging stations for employee use. Four stations total. The two non-public workplace chargers are a Clipper Creek charger that has been operational since March of 2014 and a prototype Aerovironment SEP charger that was installed on May 7, 2015.
The workplace chargers have been used regularly for the past 17 months with increased use in 2016. Each charging station draws approximately 6 kW of power and require a 12 kW power demand when both stations are active. The cost results for the stations are presented in Table 2.
Table 2. Workplace Charging Station Electricity Costs
Month (2015)
Workplace AC Level 2 Chargers Sessions
(#) Energy (kWh)
Demand(kW)
Cost/Session ($)
Feb 22 280 1.9 1.58 Mar 15 204 0.0 0.72
Apr 4 68 5.9 16.58
May 14 276 0.0 1.03
June 31 320 0.0 0.54
July 31 371 0.0 0.62
Aug 19 246 1.3 1.39
Sep 9 129 0.0 0.76
Oct 41 529 0.0 0.67
Nov 26 390 5.7 3.12
Dec 25 382 0.0 0.79
Jan 48 596 4.0 1.46
Feb 43 728 5.2 2.08
Mar 51 809 6.3 2.08
Apr 67 1039 4.7 1.50
May 57 865 1.2 0.98
June 68 1052 0.0 0.78
Table 2 shows that during the 2015 calendar year, the workplace chargers were used about once per day. Due to the limited use, the chargers avoided adding to the facility peak demand during some months. Note that when a charging station is not used often,

14
for example, in April 2015, the cost to charge each vehicle is quite high, if added demand costs occur. When the charging station is used more regularly, electricity costs fall dramatically since demand costs are spread over a greater number of vehicles.
Energy Management System
An energy management system (EMS) monitored the facility’s electric utility meter and controlled the non-public workplace charging stations to avoid increased electric utility bills due to electrical demand charges. The maximum average power, known as the monthly peak demand, is calculated based on the maximum average power experienced during a 30-minute interval that occurs once during the monthly billing period.
The FSEC EMS system was operational beginning August 2015 using a simplified algorithm which disabled workplace chargers if the 30-minute average peak demand exceeded the historic monthly peak demand. This algorithm was improved in early May 2016 to include the aggressive rate-of-change of the 30-minute demand control strategy.
A simple EMS system can be developed to reduce or avoid the portion of the electric bill associated with utility electrical demand. The one developed herein has two goals:
Minimize facility electricity demand, and
Maximize workplace charger availability.
If a simple control scheme is used where the charging station is turned off only when the historical monthly peak is exceeded, unexpectedly high utility demand costs can occur since the charging station is active just prior to the peak event and would therefore be included in the 30-minute average. For this reason, a more sophisticated control algorithm is needed. The control algorithm design was implemented by analyzing the following control techniques:
Exceeding peak – workplace chargers would be turned off when the facility 30-minute demand was equal to or greater than the historic monthly demand
Imminent Peak – the workplace chargers would be turned off when the facility 30-minute demand was within X kW of the historic monthly demand where X = the current power draw of the workplace chargers in kW
Aggressive Rate-of-Change – workplace chargers would be turned off when the rate-of-change of the 30-minute demand predicted a peak event in the near future
Combined algorithm – workplace chargers would be turned off when a combination of the above control techniques anticipated a peak demand event
The analysis used historic measured facility energy use to create a realistic facility baseline energy profile. The measured energy use was adjusted for charging station operation by subtracting charging station measured energy from the measured facility energy use. This gives a normal baseline energy profile which allows for 12 kW of charging station operation scheduled from 8 A.M. to 5 P.M. (normal facility operating hours) to represent 2 AC Level 2 workplace chargers operating continuously.

15
The first objective was to determine the extent to which the workplace chargers would add to the monthly electric utility bill. The control methodology where charging stations would not be controlled (there is no control) is implemented by simply scheduling the workplace chargers to be on during the day and adding that energy use to the baseline data and then comparing the new calculated monthly electric demand to the baseline data. The results show that during winter months the workplace chargers are expected to add an additional 12 kW to the electric utility bill monthly demand. This result is not unexpected since it involves the absence of a HVAC increased summer peak. After review of the measured facility energy use, the additional demand charges are usually not present during summer months since the facility typically exhibits the peak earlier than 8 A.M. during HVAC system startup. The HVAC system uses an early start predictive algorithm to pre-cool the building prior to occupancy. This algorithm would start the HVAC system early, which occurs before the employees arrive at work at 8 A.M.
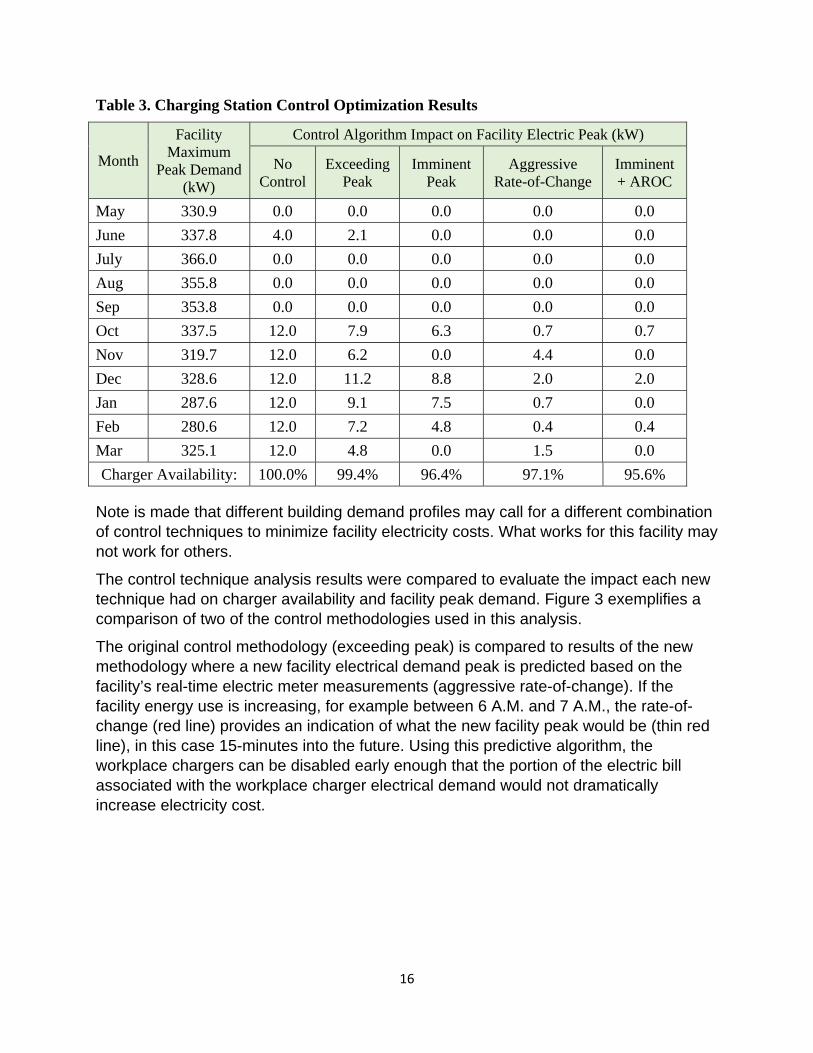
The next objective was to test the remaining control techniques to see which scenario caused the greatest reduction in monthly peak demand. Waiting for facility electricity use to exceed the historic monthly peak demand before turning off the charging stations provided only a moderate reduction in monthly peak demand since the charging stations were active just prior to the peak event and therefore still added to the monthly peak demand. This control technique is only active a few times during the month and provides a high charger availability rate of 99.4%. A more proactive approach was to turn off the charging stations when a demand event was imminent and within 12 kW of the historic peak demand. This technique further reduced facility peak demand but did not eliminate it entirely. Charger availability is also reduced since the charging stations are inactive anytime the facility electrical demand approaches the historic peak demand. These results are shown in Table 3.
For a utility company with a monthly peak based on a 30-minute interval, the charging stations must be off for at least 30 minutes prior to the peak event. Thus, intelligent control of these charging events requires a predictive algorithm. For this reason, the rate-of-change of the peak demand signal was used to predict the future facility demand. The rate-of-change of the 30-minute demand is multiplied by the number of minutes into the future the prediction is to occur and then added to the current 30-minute average demand. If this prediction exceeds the historic peak demand the workplace chargers are disabled. Using this control methodology the facility monthly demand impact is greatly reduced and charging station availability is still high at 97.1%.
The final control technique uses a combination of the imminent peak and aggressive rate-of-change control strategies. If either is true, the workplace chargers are disabled. This combined control method provides a much greater reduction in facility peak demand than the previous techniques and still maintains a 95.6% charger availability rating. See Table 3.
16
Table 3. Charging Station Control Optimization Results
Month
Facility Maximum
Peak Demand (kW)
Control Algorithm Impact on Facility Electric Peak (kW)
No Control
Exceeding Peak
Imminent Peak
Aggressive Rate-of-Change
Imminent + AROC
May 330.9 0.0 0.0 0.0 0.0 0.0
June 337.8 4.0 2.1 0.0 0.0 0.0
July 366.0 0.0 0.0 0.0 0.0 0.0
Aug 355.8 0.0 0.0 0.0 0.0 0.0
Sep 353.8 0.0 0.0 0.0 0.0 0.0
Oct 337.5 12.0 7.9 6.3 0.7 0.7
Nov 319.7 12.0 6.2 0.0 4.4 0.0
Dec 328.6 12.0 11.2 8.8 2.0 2.0
Jan 287.6 12.0 9.1 7.5 0.7 0.0
Feb 280.6 12.0 7.2 4.8 0.4 0.4
Mar 325.1 12.0 4.8 0.0 1.5 0.0
Charger Availability: 100.0% 99.4% 96.4% 97.1% 95.6%
Note is made that different building demand profiles may call for a different combination of control techniques to minimize facility electricity costs. What works for this facility may not work for others.
The control technique analysis results were compared to evaluate the impact each new technique had on charger availability and facility peak demand. Figure 3 exemplifies a comparison of two of the control methodologies used in this analysis.
The original control methodology (exceeding peak) is compared to results of the new methodology where a new facility electrical demand peak is predicted based on the facility’s real-time electric meter measurements (aggressive rate-of-change). If the facility energy use is increasing, for example between 6 A.M. and 7 A.M., the rate-of-change (red line) provides an indication of what the new facility peak would be (thin red line), in this case 15-minutes into the future. Using this predictive algorithm, the workplace chargers can be disabled early enough that the portion of the electric bill associated with the workplace charger electrical demand would not dramatically increase electricity cost.

17
Figure 3. Charging Station Control Algorithm Optimization Analysis (November 7, 2015)
3.0 Impacts/Benefits
Life cycle costs for EV charging shows the potential for reducing transportation costs if properly applied. Data has been collected on facility and EV charger electrical energy usage. The data shows that both DC and AC Level 2 fast chargers can increase electrical demand loads and EV charging costs. However, if the EVSE is properly managed, the EV “re-fueling” costs can be minimized. Methods to minimize the demand loads and resulting costs are presented for commercial building account environments and provide guidance to the proper use and management of EVSE equipment.
4.0 References
1. Alternative Fuels Data Center, Electric Vehicle Charging Station Locations, http://www.afdc.energy.gov/fuels/electricity_locations.html
2. United States Census Bureau FAQ, https://ask.census.gov/prweb/PRServletCustom/YACFBFye-rFIz_FoGtyvDRUGg1Uzu5Mn*/!STANDARD
3. U.S. Energy Information Administration, Independent Statistics and Analysis, Electric Power Monthly, retrieved August 2016.
4. Brooker, P, Qin, N., “Identification of potential locations of electric vehicle supply equipment”, Journal of Power Sources 299, 2015, 76-84.