implementing a randomization-based curriculum for introductory statistics robin h. lock, burry...
TRANSCRIPT
Implementing a Randomization-Based
Curriculum for Introductory Statistics
Robin H. Lock, Burry Professor of StatisticsSt. Lawrence University
Breakout PanelUSCOTS 2011 - Raleigh, NC

Intro Stat (Math 113) at St. Lawrence
• 26-29 students per section• 5-7 sections per semester• Only 100-level (intro) stat course on campus• Backgrounds: Students from a variety of majors• Setting: Full time in a computer classroom• Software: Minitab and Fathom• Randomization methods: Only token use until
one section in Fall 2010…
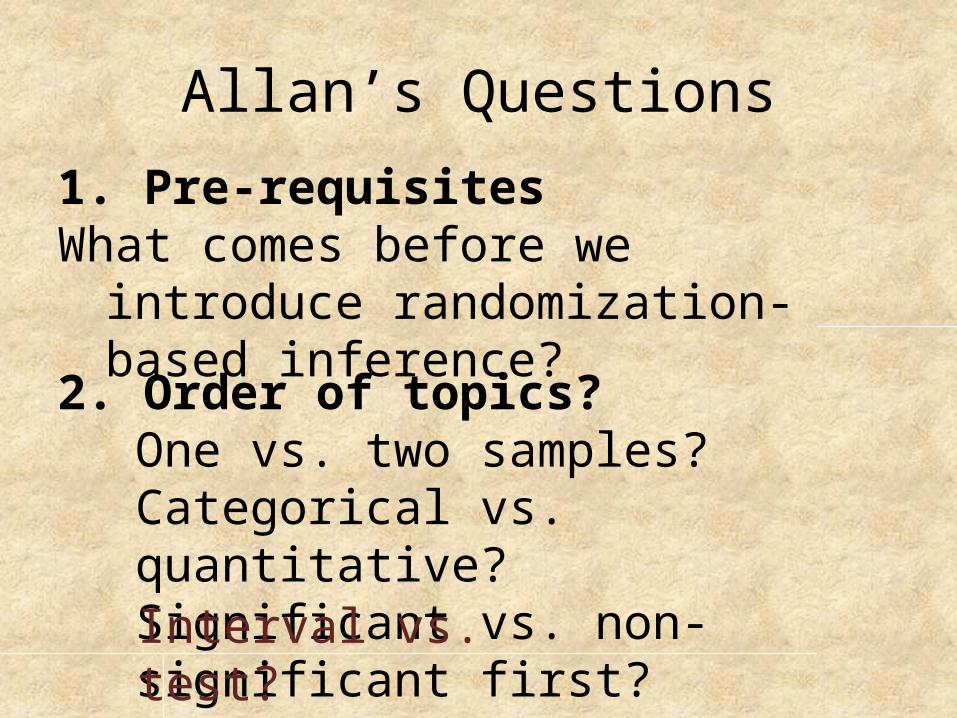
Allan’s Questions
1. Pre-requisitesWhat comes before we introduce
randomization-based inference?
2. Order of topics?One vs. two samples?Categorical vs. quantitative?Significant vs. non-significant first?Interval vs. test?
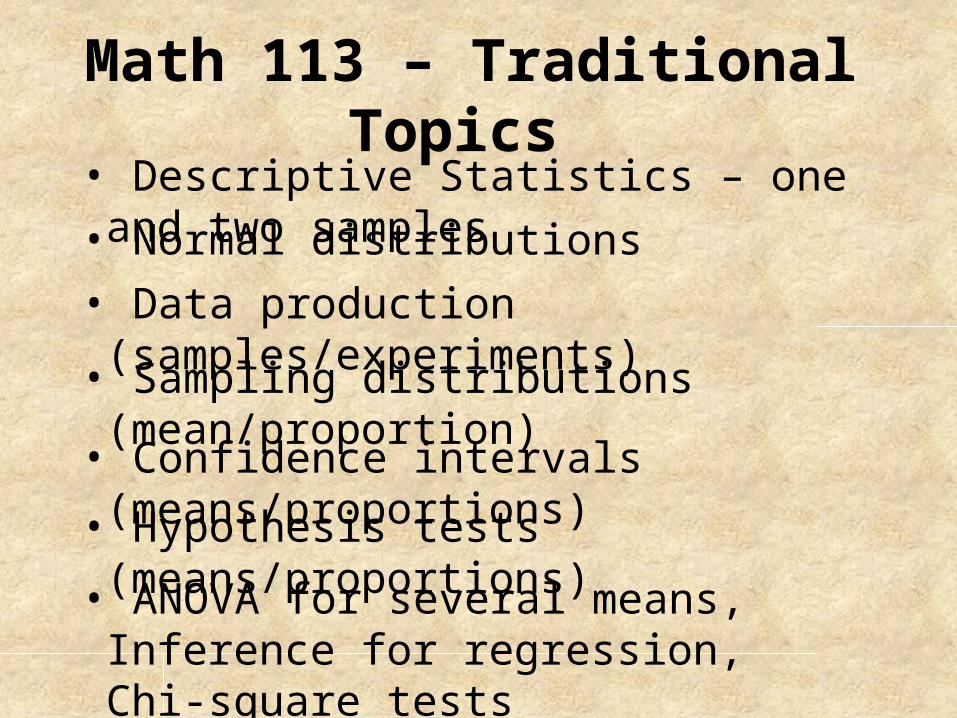
Math 113 – Traditional Topics • Descriptive Statistics – one and two samples• Normal distributions• Data production (samples/experiments)
• Sampling distributions (mean/proportion)
• Confidence intervals (means/proportions)
• Hypothesis tests (means/proportions)
• ANOVA for several means, Inference for regression, Chi-square tests
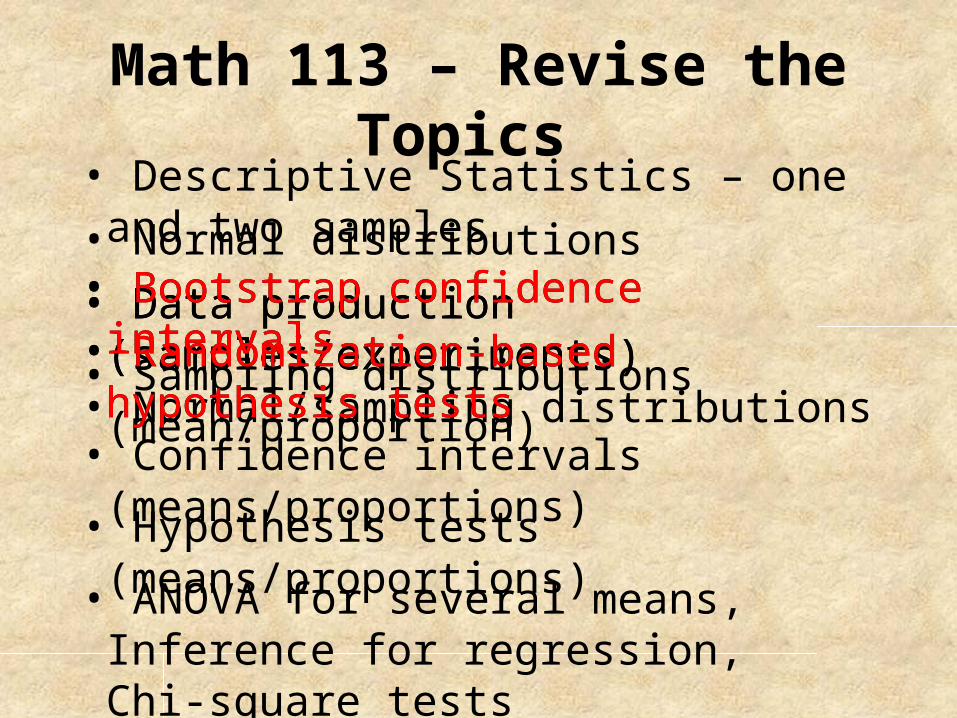
Math 113 – Revise the Topics • Descriptive Statistics – one and two samples• Normal distributions• Data production (samples/experiments)
• Sampling distributions (mean/proportion)
• Confidence intervals (means/proportions)
• Hypothesis tests (means/proportions)
• ANOVA for several means, Inference for regression, Chi-square tests
• Data production (samples/experiments)• Bootstrap confidence intervals• Randomization-based hypothesis tests• Normal/sampling distributions
• Bootstrap confidence intervals• Randomization-based hypothesis tests
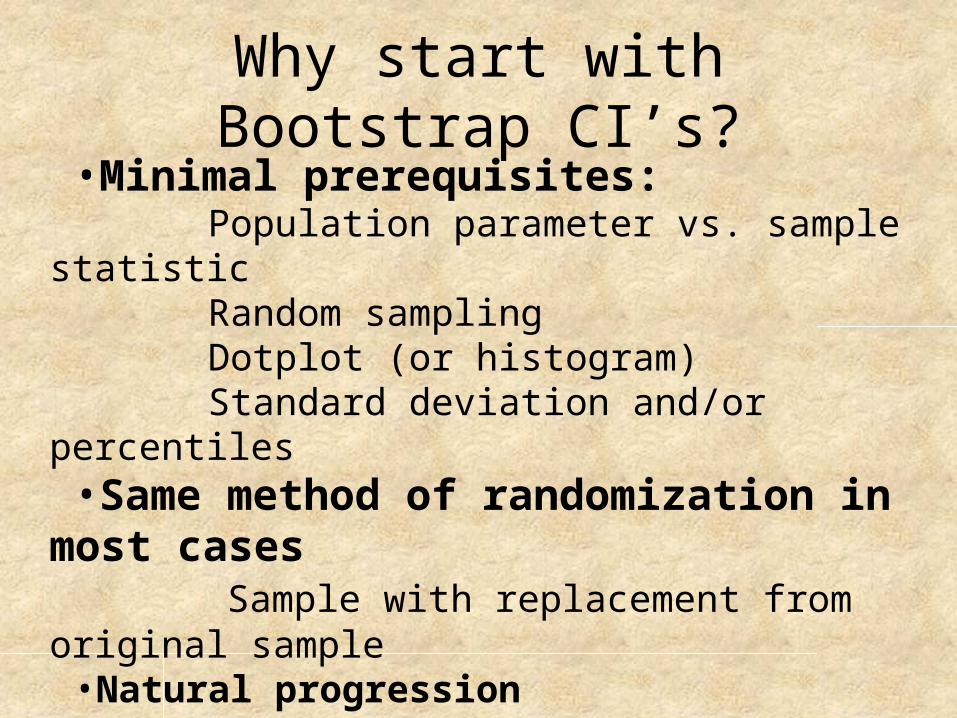
Why start with Bootstrap CI’s?•Minimal prerequisites: Population parameter vs. sample statistic Random sampling Dotplot (or histogram) Standard deviation and/or percentiles•Same method of randomization in most cases Sample with replacement from original sample•Natural progression Sample estimate ==> How accurate is the estimate?•Intervals are more useful? A good debate for another session…
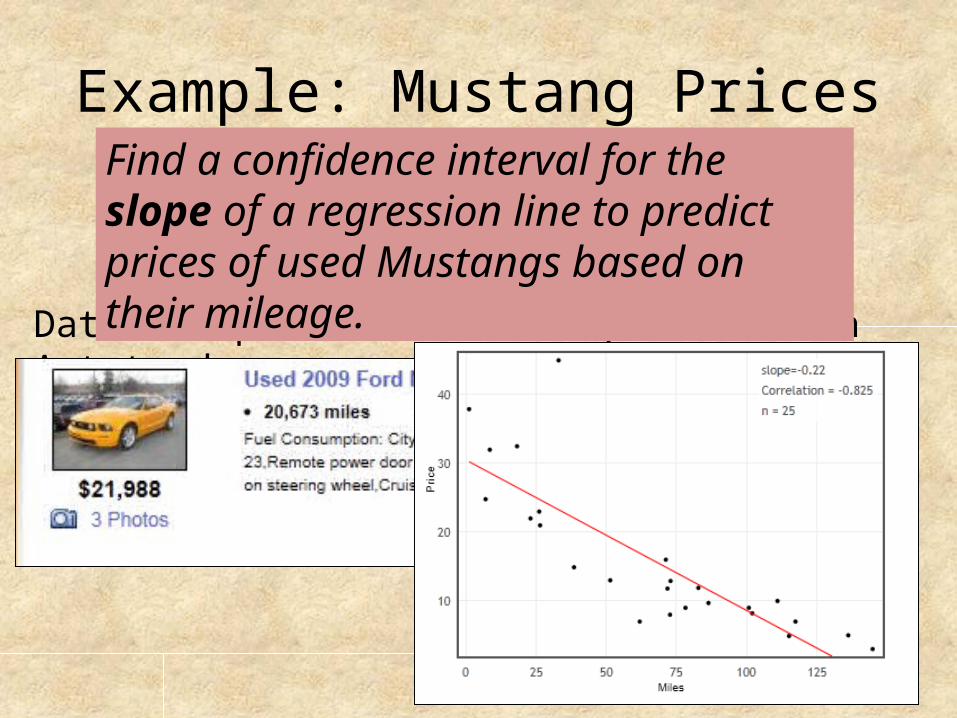
Example: Mustang Prices
Data: Sample of 25 Mustangs listed on Autotrader.com
Find a confidence interval for the slope of a regression line to predict prices of used Mustangs based on their mileage.
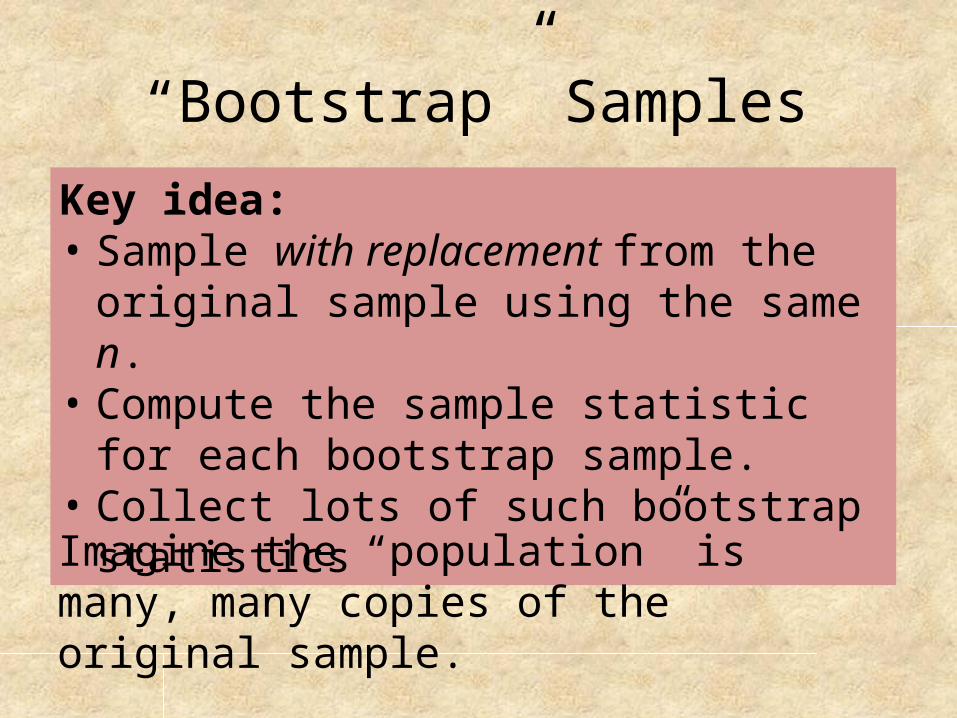
“Bootstrap” Samples
Key idea: • Sample with replacement from the original
sample using the same n. • Compute the sample statistic for each
bootstrap sample.• Collect lots of such bootstrap statistics
Imagine the “population” is many, many copies of the original sample.

Distribution of 3000 Bootstrap Slopes
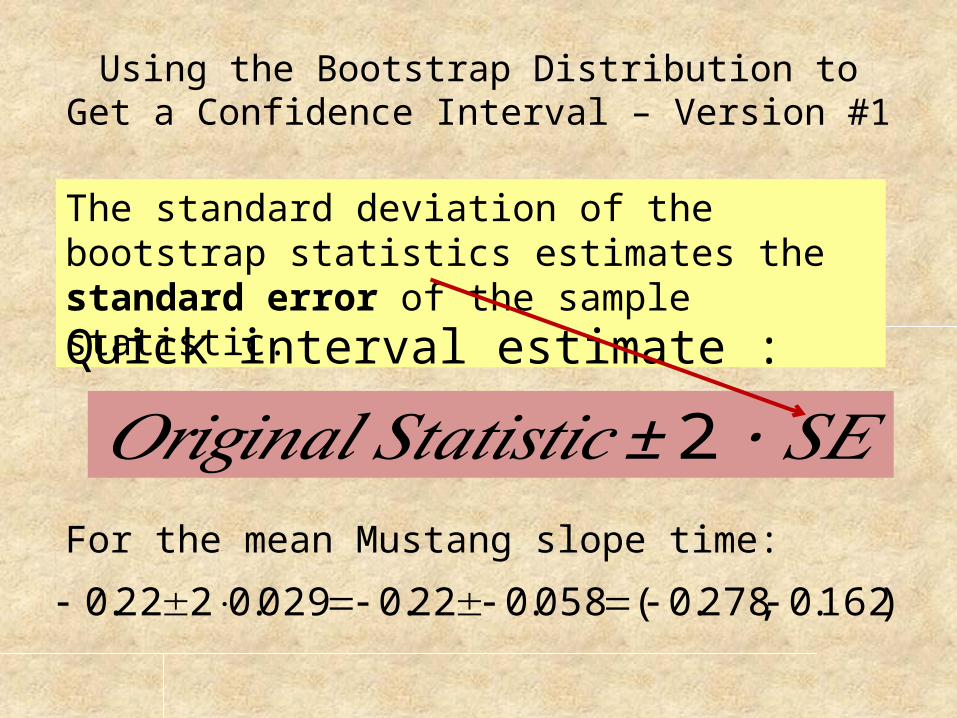
Using the Bootstrap Distribution to Get a Confidence Interval – Version #1
The standard deviation of the bootstrap statistics estimates the standard error of the sample statistic.
Quick interval estimate :
𝑂𝑟𝑖𝑔𝑖𝑛𝑎𝑙 𝑆𝑡𝑎𝑡𝑖𝑠𝑡𝑖𝑐±2 ∙𝑆𝐸For the mean Mustang slope time:
)162.0,278.0(058.022.0029.0222.0
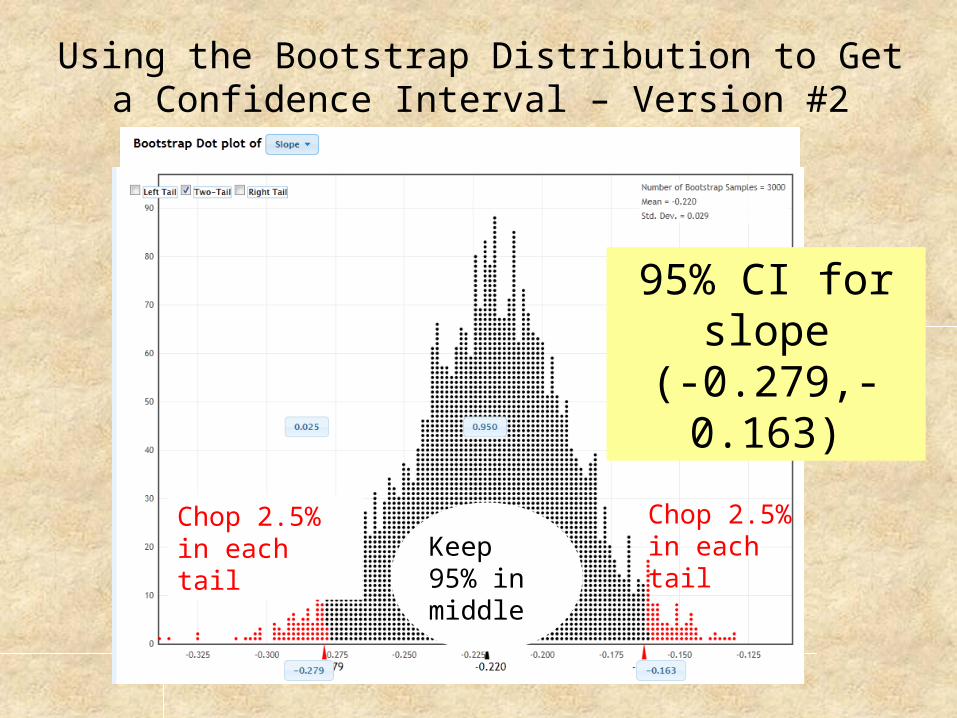
Using the Bootstrap Distribution to Get a Confidence Interval – Version #2
Keep 95% in middle
Chop 2.5% in each tail
Chop 2.5% in each tail
95% CI for slope(-0.279,-0.163)
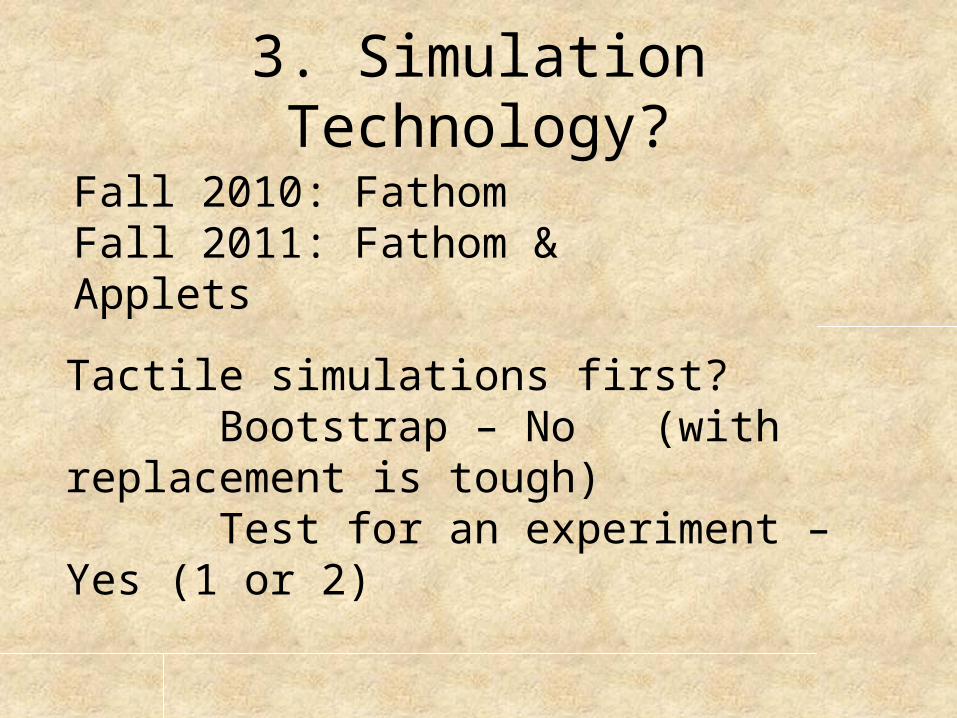
3. Simulation Technology?
Fall 2010: Fathom Fall 2011: Fathom & Applets
Tactile simulations first? Bootstrap – No (with replacement is tough) Test for an experiment – Yes (1 or 2)
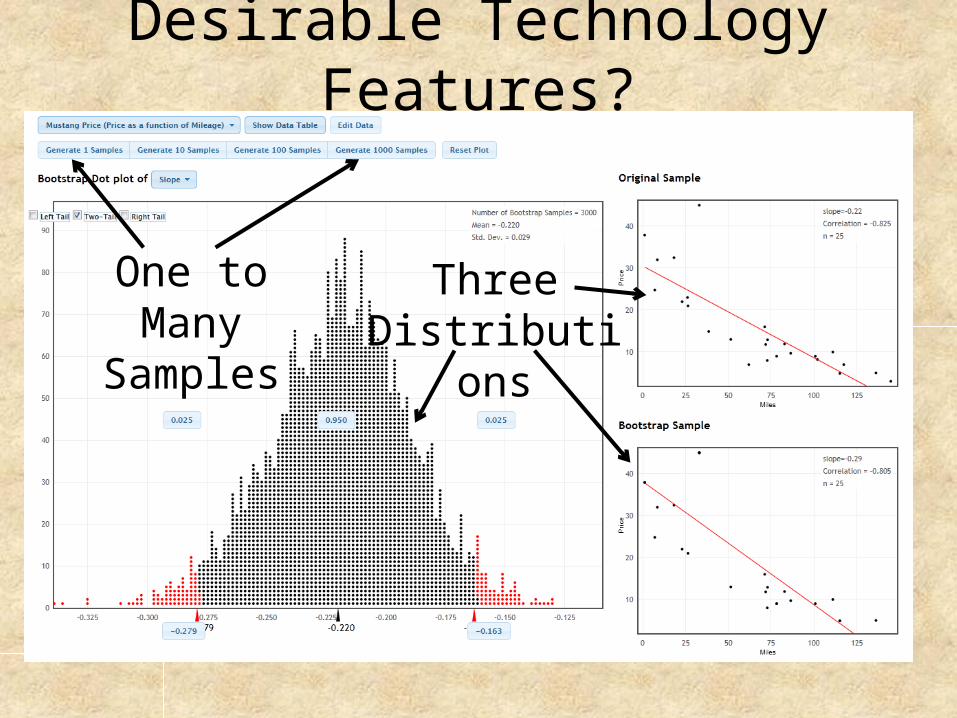
Desirable Technology Features?
Three Distributions
One to Many Samples
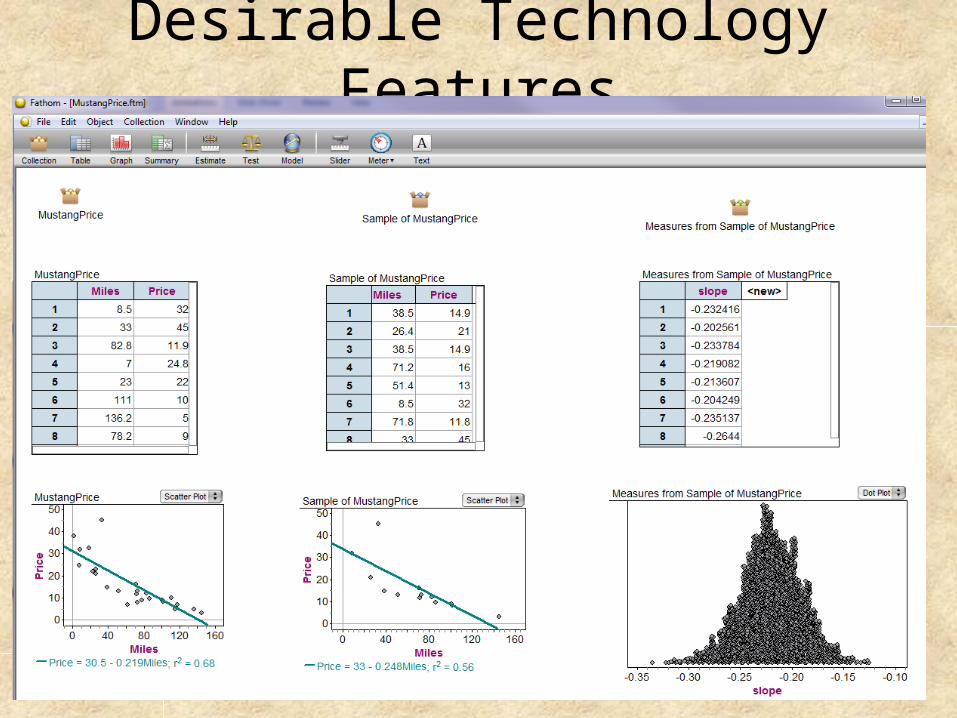
Desirable Technology Features
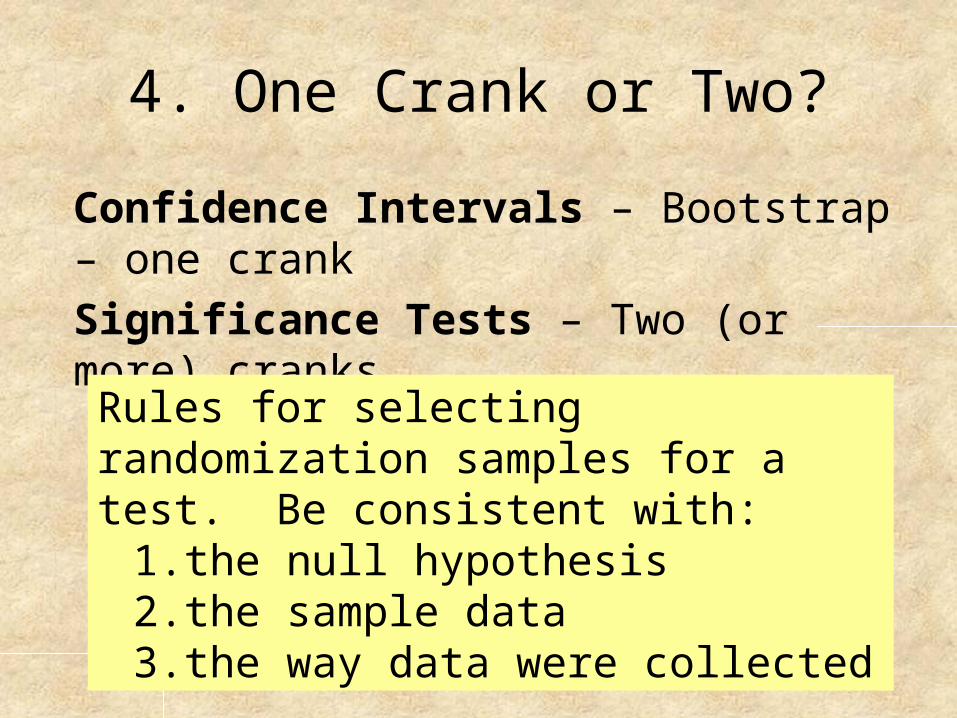
4. One Crank or Two?
Confidence Intervals – Bootstrap – one crank
Significance Tests – Two (or more) cranks
Rules for selecting randomization samples for a test. Be consistent with:
1. the null hypothesis2. the sample data3. the way data were collected

Randomization Test for Slope

5. Test for a 2x2 Table
First example: A randomized experiment
Test statistic: Count in one cell
Randomize: Treatment groups
Margins: Fix both
Later examples vary, e.g. use difference in proportions or randomize as independent samples with common p.
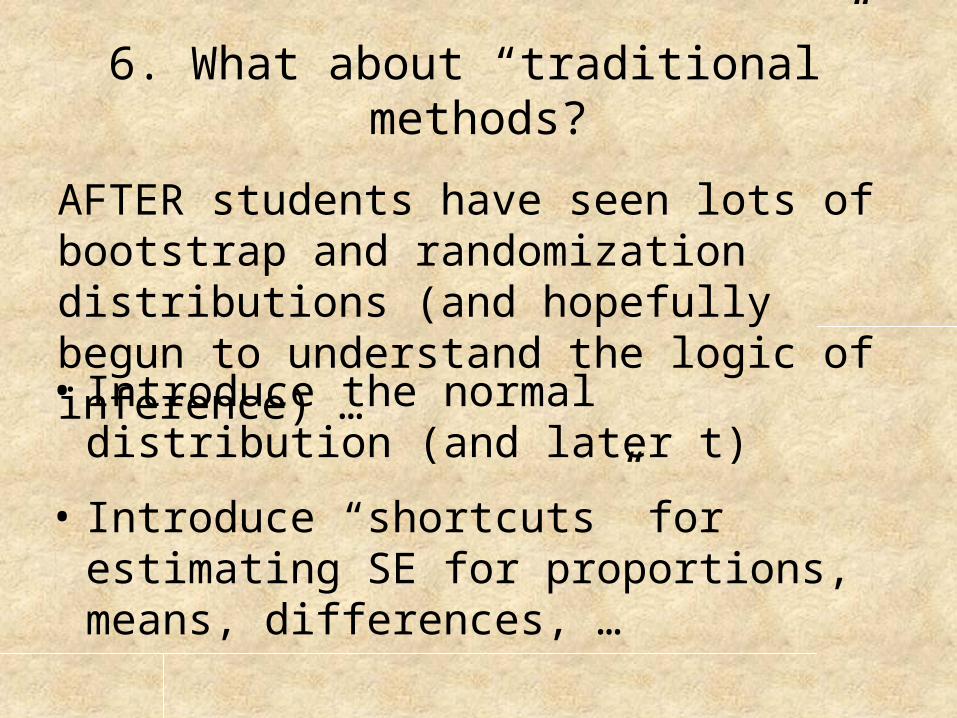
6. What about “traditional” methods?
AFTER students have seen lots of bootstrap and randomization distributions (and hopefully begun to understand the logic of inference) …
• Introduce the normal distribution (and later t)
• Introduce “shortcuts” for estimating SE for proportions, means, differences, …
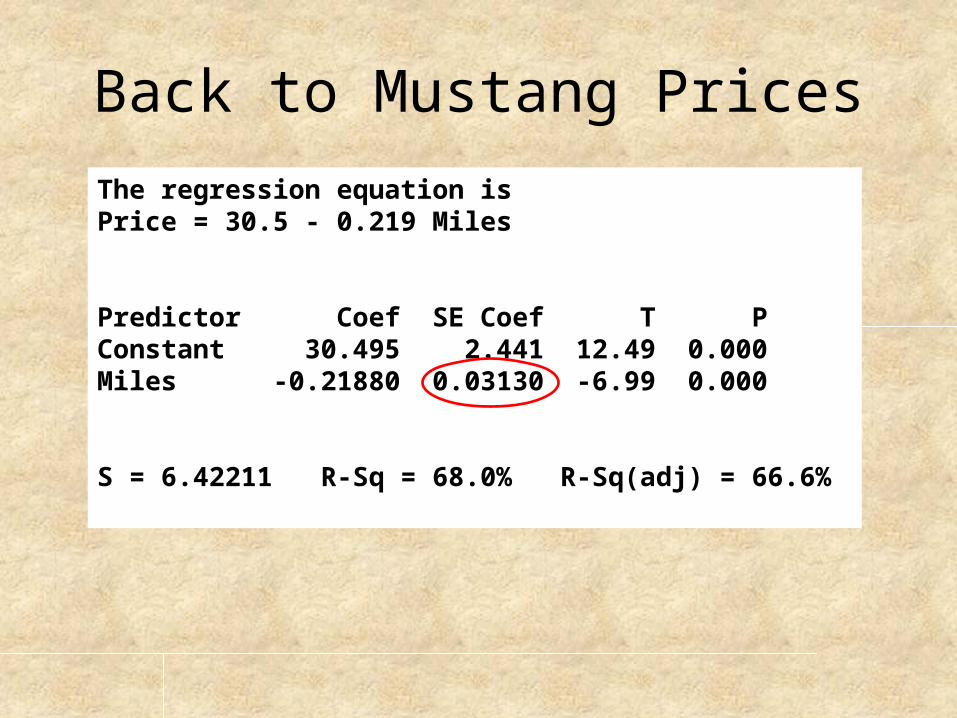
Back to Mustang PricesThe regression equation isPrice = 30.5 - 0.219 Miles
Predictor Coef SE Coef T PConstant 30.495 2.441 12.49 0.000Miles -0.21880 0.03130 -6.99 0.000
S = 6.42211 R-Sq = 68.0% R-Sq(adj) = 66.6%
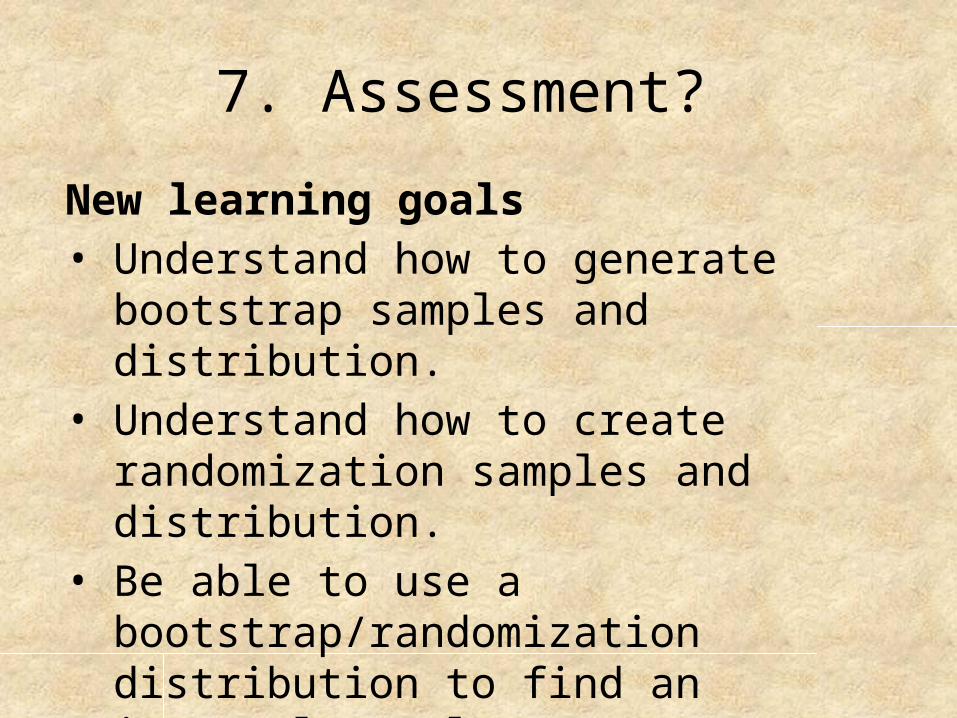
7. Assessment?
New learning goals• Understand how to generate bootstrap
samples and distribution. • Understand how to create randomization
samples and distribution.• Be able to use a bootstrap/randomization
distribution to find an interval/p-value.
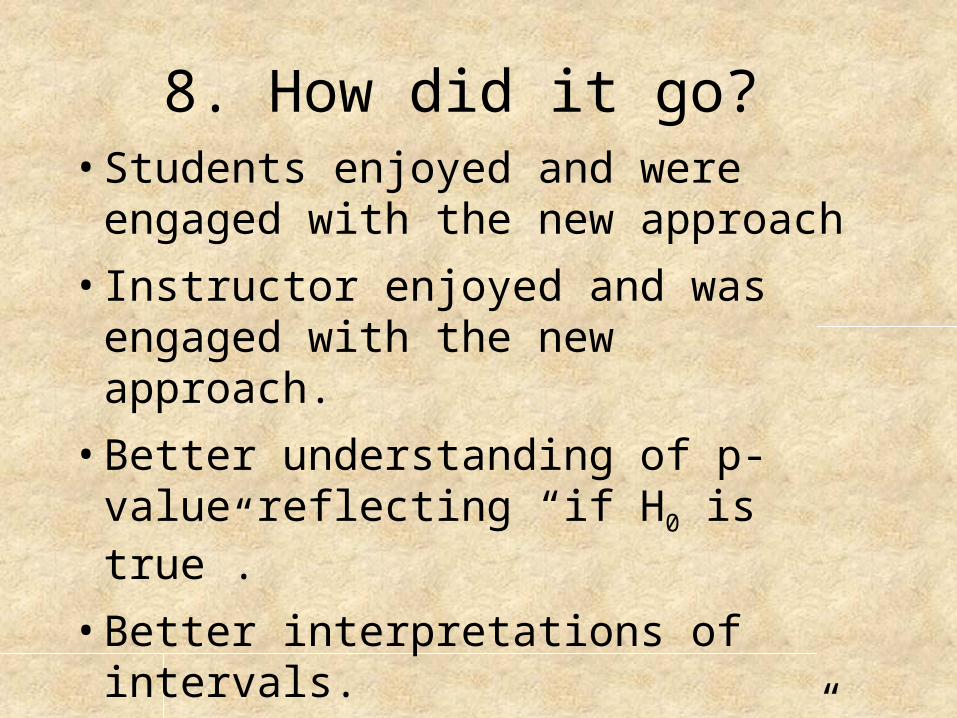
8. How did it go? • Students enjoyed and were engaged with
the new approach• Instructor enjoyed and was engaged with
the new approach. • Better understanding of p-value reflecting
“if H0 is true”.
• Better interpretations of intervals.• Challenge: Few “experienced” students to
serve as resources.
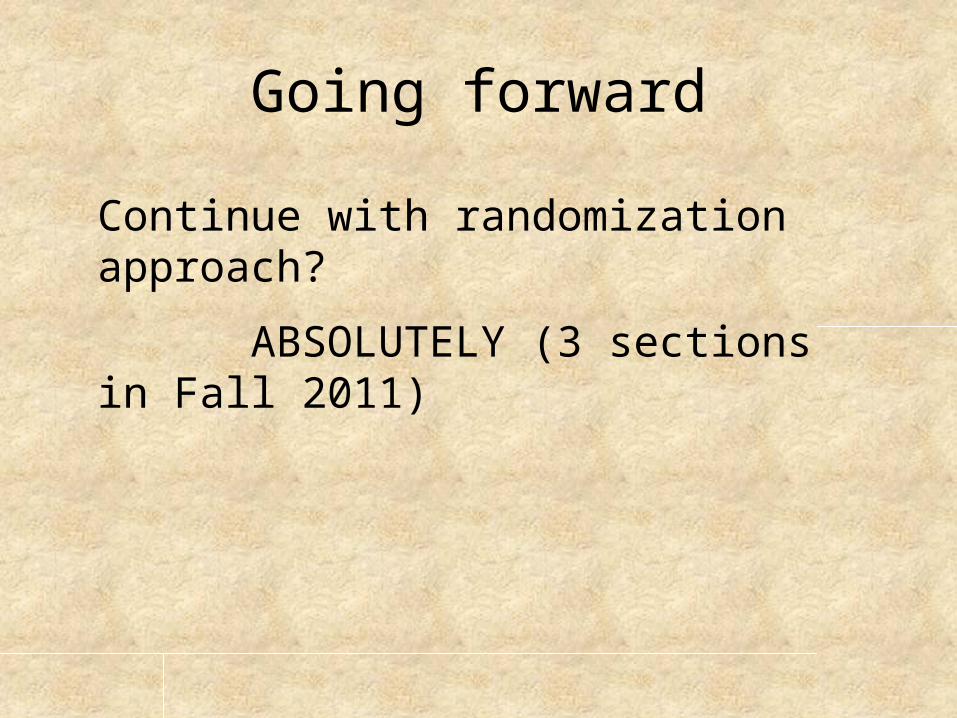
Going forward
Continue with randomization approach?
ABSOLUTELY (3 sections in Fall 2011)