implementation of the experiential training, internship ... of agriculture, forestry and fisheries...
TRANSCRIPT

agriculture,forestry & fisheriesDepartment: Agriculture, Forestry and FisheriesREPUBLIC OF SOUTH AFRICA
Implementation of the Experiential Training, Internship and Professional Development Programme
2010/11
Annual report
DEPARTMENT OF AGRICULTURE, FORESTRY AND FISHERIES
Implementation of the Experiential Training, Internship and professional Development Programme
2010/11
Annual report

2011
Printed and published by Department of Agriculture, Forestry and Fisheries Directorate: Communication Services Private Bag X144, Pretoria 0001
ISBN 978-1-86871-341-7

iii
CCONTTEENT
Acronyms................................................................................................................................................................. vii
Definition of terms.................................................................................................................................................... vii
1. Background and objectives ............................................................................................................ 1
1.1 Introduction and background ......................................................................................................... 1
1.2 Objectives of the programme ......................................................................................................... 1
2. Recruitment and selection ............................................................................................................ 1
2.1 Needs analysis .............................................................................................................................. 1
2.2 Advertisement of internship vacancies .......................................................................................... 2
2.3 Shortlisting and interviews ............................................................................................................. 2
3. Arrival programme of 2010/11 interns/trainees .............................................................................. 2
3.1 Arrival ............................................................................................................................................ 2
3.2 Orientation and induction programme ........................................................................................... 2
4. Analytical reports on the implementation of various categories of the Experiential Training, Internship and Professional Development Programme ................................................................. 3
4.1 Conventional .................................................................................................................................. 3
4.2 Agri-export Technologist Programme ............................................................................................ 7
4.3 Young Professional Development Programme .............................................................................. 10
5. Fields of study and placement of young professionals for the 2010 academic year ..................... 12
5.1 Fields of studies of young professionals for the 2010 academic year ........................................... 12
5.2 Period of participation of young professionals in the programme ................................................... 14
5.3 Placement of young professionals during the 2010 academic year .............................................. 14
6. Summary of profiles of all categories of the Experiential Training, Internship and Professional Development Programme .............................................................................................................. 15
7. Monitoring and evaluation .............................................................................................................. 18
7.1 Monthly and quarterly progress reports ......................................................................................... 18
7.2 Monthly claims and stipends .......................................................................................................... 18
7.3 Monitoring visits ............................................................................................................................. 18
7.4 Success indicators of the programme ........................................................................................... 19
7.5 Analysis of exit interview forms ...................................................................................................... 24
8. Summary of beneficiaries of the programme from inception in 2003 to 2010 ............................... 24
9. Status of expenditure...................................................................................................................... 25
10. Summary of beneficiaries of the 2010/11 Internship Programme implemented by provincial departments of agriculture ....................................................................................... 27
11. Conclusion ..................................................................................................................................... 27
iv
TABLES
Table 1: Breakdown by race, gender and disability of conventional interns (n = 134) ........................................ 3
Table 2: Breakdown according to age of conventional interns (n = 134) .............................................................. 3
Table 3: Breakdown according to placement of conventional interns (n = 134) ................................................... 4
Table 4: Analysis of conventional interns according to placements within the DAFF line and support functional units (n = 134)) ....................................................................................................................... 4
Table 5: Breakdown according to provinces where conventional interns are coming from (n =134) ................... 5
Table 6: Breakdown according to municipalities or districts where conventional interns are coming from (n = 134) ......................................................................................................................................... 5
Table 7: Breakdown according to number of conventional interns per academic institution where they graduated (n = 134) ................................................................................................................................ 6
Table 8: Breakdown of level of qualifi cations according to gender of conventional interns (n = 134) .................. 7
Table 9: Classifi cation of educational study matter (CESM) of conventional interns ........................................... 7
Table 10: Breakdown by race, gender and disability of AETP interns (n = 15) ...................................................... 8
Table 11: Breakdown according to age of AETP interns (n = 15) .......................................................................... 8
Table 12: Breakdown according to placement of AETP interns (n = 15) ................................................................ 8
Table 13: Breakdown according to provinces where AETP interns are coming from (n = 15) ............................... 9
Table 14: A breakdown according to municipality where AETP interns are coming from (n = 15) ......................... 9
Table 15: Breakdown according to number of AETP interns per academic institution where they graduated ...... 10
Table 16: Analysis of qualifi cation level of AETP interns (n = 15) .......................................................................... 10
Table 17: Breakdown by race, gender and disability of PDP interns (n = 26) ....................................................... 10
Table 18: Breakdown according to age of PDP interns (n = 26) ............................................................................ 11
Table 19: Breakdown according to provinces where PDP interns are coming from (n = 26) ................................. 11
Table 20: Breakdown according to municipalities where PDP interns are coming from (n = 26) ........................... 11
Table 21: Breakdown according to number of PDP interns per academic institution where they graduated (n = 26) ........................................................................................................................... 12
Table 22: Analysis of fi elds of studies registered by young professionals during the 2010 academic year according to race and gender (n = 26) ................................................................................................... 12
Table 23: Analysis of academic institutions where PDP interns registered for further studies in 2010 (n = 26) ..... 13
Table 24: Analysis of the year/level of study for the young professionals during the 2010 academic year (n = 26) ................................................................................................................................................... 14
Table 25: Breakdown according to placement of young professionals (n = 26) ..................................................... 15
Table 26: Breakdown by race, gender and disability of all interns/trainees (n = 175) ............................................. 15
Table 27: Breakdown according to age of all interns/trainees (n = 175) ................................................................ 15
Table 28: Breakdown according to provinces where all interns/trainees are coming from (n = 175) .................... 16
Table 29: Breakdown according to municipalities or districts from which all interns/trainees are coming (n = 175) ................................................................................................................................................. 16
Table 30: Status of employment according to organisation (n = 32) ...................................................................... 20
Table 31: Analysis of period of stay before securing employment (n = 32) ............................................................ 20
Table 32: Analysis of levels of employment of interns (n = 32) .............................................................................. 20
Table 33: Analysis of the 2010 academic performance of young professionals (n = 26) .................................. 21
Table 34: Analysis of young professionals whose performance was satisfactory in 2010 (n = 24) ........................ 21

v
Table 35: Analysis of young professionals whose performance was not satisfactory in 2010 (n = 2) .................... 22
Table 36: Analysis of young professionals who completed their studies and graduated in 2010 (n = 12 .............. 23
Table 37: Analysis of the whereabouts of the young professionals who completed their studies in 2010 (n = 12) .......................................................................................................................................... 23
Table 38: Analysis of the young professionals whose performance was satisfactory but could not complete their studies in 2010 (n = 7) .................................................................................................................... 24
Table 39: Analysis of benefi ciaries of the Experiential Training, Internship and Professional Development Programme from 2003 to 2010 (n = 1 223) ............................................................................................ 25
Table 40: Status of expenditure ............................................................................................................................. 25
Table 41: Summary of benefi ciaries of the 2010/11 internship implemented by provincial departments of agriculture (n = 644) ............................................................................................................................... 26
GRAPHS
Graph 1: Analysis of status of employment of all interns (n = 32) ......................................................................... 19
Graph 2: Analysis of status of employment by gender (n = 32) ............................................................................ 20

vi
AACROONNYMS
AETP Agri-export Technologist Programme
AgriBEE Agricultural Black Economic Empowerment
B.Sc. Bachelor of Science
B.V.Sc. Bachelor of Veterinary Science
CESM Classifi cation of Education Study Matter
DAFF Department of Agriculture, Forestry and Fisheries
DEXCO Departmental Executive Committee
DPSA Department of Public Service and Administration
ETES Education, Training and Extension Services (name of directorate)
Hons Postgraduate degree (Honours)
NQF National Qualifi cations Framework
PDP Professional Development Programme
Ph.D. Postgraduate degree (Doctorate)
PoE Portfolio of Evidence
PPECB Perishable Products Export Control Board
SAQA South African Qualifi cations Authority

vii
DDEFINNITTION OOF TEERMMS
Internship
A structured workplace experience programme that is agreed to between the intern and the supervisor/line manager who is delegated this responsibility by a department
Intern
Also called a graduate intern; a person who is contracted with a department to engage in an internship programme
Trainee Also called student intern; a student who is currently studying towards a higher education qualifi cation and has to undertake work experience in order to fulfi l the requirements of the qualifi cation
Mentor A person who is trained and appointed to offer advice, knowledge, wisdom and insight that may be useful to the protégé’s professional and personal development
Contract A legitimate agreement between the department and the intern, describing the conditions of employment
Youth
A person who is between the ages of 18 and 35 years

1
1. BBAACKGROUNND AND OBJJJECTIVVVES
1.1 Introduction
In 2003, the Department of Public Service and Administration (DPSA) issued a circular, No. 2003/1, which called for all government departments to place a number of unemployed graduates with the requisite skills equal to 5% of their total staff complement as interns in their various functional units as part of the strategy to combat the rising levels of unemployment among qualifi ed youth; the term “youth” being defi ned in the National Youth Commission Act, 1996 (Act No. 19 of 1996).
Even before the DPSA issued the circular, the DAFF had already developed a policy as well as the Experiential Training, Internship and Professional Development Programme which was approved by DEXCO in 2003. In developing the policy for the programme, the DAFF was guided by legislation and national strategies on skills development such as the Skills Development Act, 1998 (Act No. 79 of 1998), the Skills Development Levies Act, 1999 (Act No. 9 of 1999) and the National Human Resources Development Strategy for the Public Service.
Since the inception of the programme, 1 223 qualifi ed unemployed graduates participated in the programme. A total of 395 programme benefi ciaries were able to secure permanent employment during their period of participation in the programme. Of this total, the DAFF was able to employ 155 interns.
During these eight years of implementation, the programme underwent rigorous restructuring and revitalisation in order to respond to new trends in the agriculture, forestry and fi sheries sector and economic value chain. As part of efforts to re-vamp the programme, the Young Professional Development Programme pillar was introduced in 2008/09. This innovative part of the programme targets young graduates in requisite science degrees and sponsors them to study towards Honours, Masters and Ph.D. degrees. This is viewed as a critical contribution to the research base in the country.
For the 2010/11 fi nancial year, 175 interns/trainees were recruited to undergo rigorous training in order to acquire work-related experience so that their chances for real employment can be enhanced. Interns/trainees are allocated experienced mentor(s) to guide and supervise their structured on-the-job training and the logbook system is used to manage their prog-ress effectively and effi ciently.
1.2 Objectives of the programme
• Contribute to accelerated service delivery by government through the improved introduction of skilled personnel in the public service
• Afford learners at tertiary institutions an opportunity of practical work experience as a requirement for them to obtain their qualifi cations
• Enhance the employability of unemployed agriculture, forestry, fi sheries and other graduates
• Develop the skills and capacity of previously disadvantaged people to direct commercially viable enterprises and engage effectively with the markets
• Resolve the general shortage of qualifi ed and skilled people in the workforce by encouraging graduates to equip themselves with the necessary practical experience
• Bridge the gap that exists between school and work by taking stock of skills gaps
• Ensure the long-term sustainability of the agriculture, forestry and fi sheries sector in South Africa by ensuring the meaningful participation of graduates from previously disadvantaged groups
• Actualise the government’s job creation strategy and voluntarism
• Promote the recruitment, development and retention of a sustainable cadre of scientists, technologists, technicians and other associated professionals and management support in the DAFF
• Provide the DAFF with highly-skilled people and address the skills gaps within the agriculture, forestry and fi sheries sectors
• Promote linkages with external bodies and strengthen the capabilities of the workforce to contribute towards a pros-perous agriculture, forestry and fi sheries sector
2. RREECRUIITMENNT ANDD SELLECTIOOON
2.1 Needs analysis
Each year a needs analysis survey is conducted to determine the number and requirements of interns/trainees each direc-torate or functional unit within the DAFF or agribusiness can accommodate. For 2010/11, a needs analysis questionnaire was sent to all directorates within the DAFF as well as commodity organisations and agribusinesses. The information re-

2
ceived was captured and analysed accordingly. Based on the information received on the needs analysis questionnaires, a total of 175 internship opportunities were allocated to various categories of the programme as follows:
• Conventional: 134 interns
• Agri-export Technologist Programme: 15 interns
• Young Professional Development Programme: 26 interns
2.2 Advertisement of internship vacancies
From the needs analysis, an advert with internship opportunities for 2010/11 was compiled and published in the following national newspapers:
• Daily Sun: 02/10/2009
• City Press: 04/10/2009
The internship opportunities were also advertised on the website of the DAFF and invariably the advertisement specifi ed the different areas where interns/trainees were required based on information obtained from the needs analysis question-naires. A total of 10 099 applications were received in response to the advert nation wide. The applications were screened, captured and sorted according to requirements specifi ed on the advertisement and preliminary schedules of shortlisted applicants were compiled.
2.3 Shortlisting and interviews
The preliminary schedules of shortlisted candidates together with the applications were forwarded to relevant directorates for further shortlisting in November 2009. A brief guide on how to conduct shortlisting and interviews was also sent with the applications to ensure that directorates execute the process within approved recruitment and selection prescripts. Interviews were conducted from November 2009 to January 2010 and the Directorate: Education, Training and Extension Services rendered secretariat services. All successful candidates were issued with appointment letters to resume their training on 1 February 2010.
3. AARRRIVAAL PROOGGRAMME OOOF 20110/11 INNTERNNS/TTRAAINEESS
3.1 Arrival
Interns/trainees reported for their internship training on 1 February 2010. The fi rst day was dedicated to administrative matters. Contracts were signed and all relevant documents like certifi ed copies of IDs, Z56 forms for electronic payments of stipend into their banking accounts and workplans from mentors were received. The contents of the forms were also explained to interns in order to give them a better understanding of the agreements entered into.
3.2 Orientation and Induction Programme
The orientation and induction session of interns/trainees was held at the Arcadia Hotel from 16 to 19 February 2010. The purpose of the session was to give new interns/trainees a broad overview of the programme and the expected outputs. Over and above, it was also meant to lay the foundation for participants to have a better understanding of the department, its values and the work ethics.
Offi cials from various functional units in the DAFF such as Financial Administration, Security Services, Agricultural Informa-tion Services, Information and Communication Technology, Employee Development, Facilities and Travel Management, Strategic Planning, the Transformation Unit and Human Resources Management, were invited to make presentations in order to inform interns/trainees in detail about the roles of their units.
The following aspects were covered during the session:
• Landscape of the DAFF Experiential Training, Internship and Professional Development Programme
• Code of conduct and dress code
• Subsistence and travel allowances (domestic and foreign) and claims
• Management of losses
• Security management access cards and theft
• Experiential Training, Internship and Professional Development Programme Policy
• Code of conduct and disciplinary procedures
• Grievance procedure and protocol

3
• The logbook/management tool
• Monthly progress reports, claims and quarterly performance assessments of interns
• Intern monitoring visits
• Internal and external communication, media protocol, telephone and table etiquette, etc.
• Telephone and internet policy
• Health, wellness and employee assistance programmes
• Procedures with regard to government vehicles and accommodation
• Overview of the structure of the DAFF and the DAFF Strategic Plan
4. AANNALYTTICALL RREPOORTS ON TTHHE IMPLEMEENTTATTION OFFF VARRRIOUS CCATEGGOORIEES OFF TTHHE EXXPERIENNTIAAL TRAAAININGGG, INTERNSHHIP ANND PROOOFESSSSIONAL DEVELLOPMENTT PPRROGRAMMEE
The programme catered for three major categories of interns/trainees in 2010/11.
4.1 Conventional
• Job seekers: targeted qualifi ed unemployed graduates who need practical hands-on experience in order to enhance their chances of employability.
• Experiential training: targeted students who need experiential training as a requirement for obtaining formal qualifi -cations at an institution of higher learning.
A total of 134 interns/trainees were recruited and recommended for placement as conventional interns and they consti-tuted 76,6% of the 2010/11 total intake. Of the 134 conventional interns/trainees, 11 were doing experiential training. Once recruited, they are placed with relevant functional units or directorates within the DAFF for a period of 12 months for their training. Interns are allocated a mentor(s) to systematically guide their training. A logbook system is used to record the planning and progress of interns/trainees. The profi les of the 2010/11 conventional interns/trainees are presented in the following tables:
TABLE 1 Breakdown by race, gender and disability of conventional interns/trainees (n = 134)
Race Gender Number Disabled Total
African Male
Female
51
78
1
1
52
79
Coloured Male
Female
2
0
0
0
2
0
Indian Male
Female
0
0
0
0
0
0
White Male
Female
1
0
0
0
1
0
Total 132 2 134
Table 1 shows that the majority of the benefi ciaries of the programme are Africans (131) followed by Coloureds (2) and White (1). The table further shows that 79 females (58,9%) and 55 males (41,04%) were appointed as conventional interns. Out of the 134 conventional interns recruited, two were disabled, which refl ects the serious challenge of recruiting people with disabilities.
TABLE 2 Breakdown according to age of conventional interns/trainees (n = 134)
20–25 years 26–30 years 31–35 years 35+ Gender
Grand total
Female Male Female Male Female Male Female Male Female Male
47 34 28 18 3 3 1 0 79 55 134
Table 2 shows that the majority (81) of conventional interns/trainees recruited were between the ages of 20–25, followed by 46 between ages of 26–30 and seven above 31 years.

4
TABLE 3 Breakdown according to placement of conventional interns/trainees (n = 134)
Directorate/Industry
Gender
Total
Female Male
Agricultural Development Finance
Agricultural Information Services
Agricultural Engineering Services
Animal Health
Animal Production
Agricultural Product Inspection Services
Economic Services
Employee Development
Education, Training and Extension Services
Financial Administration
Food Security
Forestry Regulation and Oversight
Food Security and Quality Assurance
Genetic Resources
Human Resources Management
Information Communication Technology
International Relations
International Trade
Intergovernmental and Stakeholder Relations
Karan Beef (Pty) Ltd
Land Settlement
Land Use and Soil Management
Manstrat
Ministry
Monitoring and Evaluation
Offi ce of the Director-General
Plant Health
Plant Production
QK Meats (Pty) Ltd
Research and Technology Development
Supply Chain Management
Strategic Planning
Water Use and Irrigation Development
2
1
1
0
4
3
0
4
3
2
2
0
5
0
6
4
1
1
1
0
3
1
4
1
2
2
2
3
2
15
0
1
3
2
2
0
1
2
2
2
3
2
1
1
6
3
2
0
2
1
1
1
3
2
2
1
0
0
0
1
2
1
7
2
0
0
4
3
1
1
6
5
2
7
5
3
3
6
8
2
6
6
2
2
2
3
5
3
5
1
2
2
3
5
3
22
2
1
3
Total 79 55 134
Table 3 shows that the Directorate: Research and Technology Development accommodated the highest number of con-ventional interns/trainees, namely 22 followed by the Directorate: Food Safety and Quality Assurance with eight.
TABLE 4 Analysis of conventional interns/trainees according to placements within the DAFF line and support functional units (n = 134)
Line function (core technical units) Support function (non-core technical units)
Total
Female Male Female Male
53 44 26 11 134
Table 4 shows that the majority of the participants (97) were placed within technical line function units and 37 were placed within support function directorates of the DAFF.

5
TABLE 5 Breakdown according to provinces where conventional interns/trainees are coming from (n = 134)
Province
Gender
Total
Female Male
KwaZulu-Natal
Northern Cape
Eastern Cape
Free State
Mpumalanga
North West
Limpopo
Gauteng
Western Cape
4
0
5
5
7
7
42
9
0
6
1
2
2
8
7
20
9
0
10
1
7
7
15
14
62
18
0
Total 79 55 134
Table 5 shows that the highest number of conventional interns come from Limpopo Province (62) followed by Gauteng and Mpumalanga with 18 and 15 respectively.
TABLE 6 Breakdown according to municipalities or districts where conventional interns/trainees are coming from (n = 134)
Municipality/District
Gender
Total
Female Male
Aganang
Albert Luthuli
Amahlathi
Bojanala
Botlhabela
Buffalo City
Bushbuckridge
Capricorn
City of Johannesburg
Dinokeng tsa taamane
Dr J.S. Moroka
Durban Metro
Ekurhuleni
Elias Motswaledi
Fetakgomo
Greater Giyani
Greater Tzaneen
Kai Garib
Kungwini
Lekwe
Lepelle Nkumpi
Lephalale
Madibeng
Mafi keng
Makhado
Makhuduthamaga
Malelane
Maluti a Phofung
Mangaung
Matlosana
Mathole
Maruleng
Mbombela
Middelburg
2
1
1
1
0
1
1
4
0
1
3
1
3
2
1
1
2
0
0
1
2
2
1
0
2
2
0
1
0
0
0
1
1
0
0
0
0
0
1
0
1
4
1
0
1
0
0
0
0
1
1
1
1
0
0
0
1
1
2
1
1
0
2
1
1
0
1
1
2
1
1
1
1
1
2
8
1
1
4
1
3
2
1
2
3
1
1
1
2
2
2
1
4
3
1
1
2
1
1
1
2
1

6
Municipality/District
Gender
Total
Female Male
Mkhanyakude
Modiri Molema
Mogalakwena
Mogale City
Molemole
Mopani
Moretele
Moses Kotane
Motheo
Mutale
Ndlambe
Ngqushwa
Nkomazi
Msunduzi
O.R. Tambo
Polokwane
Ratlou
Rustenburg
Sabie
Sedibeng
Sisonge
Soweto
Taung
Thoyandou
Thulamela
Tshwane
Tubatse
Ukhahlamba
Umhlathuze
Umzinyathi
Vhembe
Waterberg
1
0
3
0
2
2
2
1
4
1
0
1
0
2
2
2
0
0
0
1
0
0
2
1
5
4
1
0
0
0
3
1
0
1
1
1
0
2
0
0
0
0
1
0
1
0
0
2
1
2
1
0
1
1
0
0
5
5
0
1
3
1
1
0
1
1
4
1
2
4
2
1
4
1
1
1
1
2
2
4
1
2
1
1
1
1
2
1
10
9
1
1
3
1
4
1
Total 79 55 134
Table 6 shows that the majority of conventional interns/trainees (10) came from Thulamela district followed by Tshwane municipality with nine.
TABLE 7 Breakdown according to number of conventional interns/trainees per institution where they graduated (n = 134)
Name of institution Number of interns/trainees
Cape Peninsula University of Technology
Central University of Technology
Durban University of Technology
Nelson Mandela University
Tompi Seleka College of Agriculture
Tshwane University of Technology
University of Fort Hare
University of Potchefstroom
University of Pretoria
University of South Africa
University of the North West
University of Venda
University of Zululand
23
6
1
1
7
21
2
1
2
1
7
2
41

7
Name of institution Number of interns/trainees
Vaal University of Technology
Venda University of Technology
Walter Sisulu University
University of Free State
University of Johannesburg
University of KwaZulu-Natal
University of Limpopo
1
5
1
3
1
2
6
Total 134
Table 7 shows that, in terms of the academic institution where the benefi ciaries of the programme graduated from, Tsh-wane University of Technology has the highest number of (41) followed by University of Limpopo and University of Venda with 23 and 21 respectively.
TABLE 8 Breakdown of level of qualifi cations according to gender of conventional interns/trainees (n = 134)
Qualifi cations Female Male Total
National diploma
National certifi cate
Bachelor’s degree
Hons degree
Master’s degree
18
2
30
4
1
29
1
41
6
2
47
3
71
10
3
Total 55 79 134
Table 8 shows that the majority of the conventional interns (71) graduated with bachelor degrees. The table further indi-cates that out of the total of 134 benefi ciaries, 47 graduated with national diplomas, three with national certifi cates and 13 with post graduate degrees.
TABLE 9 Classifi cation of Educational Study Matter (CESM) of conventional interns/trainees (n = 134)
Category Number of interns/trainees
Agriculture and Renewable Resources
Business Commerce
Forestry
Health and Health Care
Humanities
83
35
9
3
4
Total 134
Table 9 indicates that according to the CESM, the majority (83) graduated in fi elds of study related to Agriculture and Re-newable Resources followed by 35 in Business Commerce and nine in Forestry.
4.2 Agri-export Technologist Programme (AETP)
This category of internship was introduced in 2006 as part of the Agricultural Black Economic Empowerment (AgriBEE) initiative to support an incubator programme targeting young people with the urge and vision to become Agri-export Tech-nologists. The department implements the programme in collaboration with the Perishable Products Export Control Board (PPECB). The Agri-export Technologist Programme is a career development programme within the agricultural export market designed to expose learners at a theoretical and practical level on the agri-export supply chain and to provide them with a head start in advancing themselves professionally within the thriving export sector.
A total of 15 interns/trainees were recruited and recommended for placement as AETP interns and constituted 8,5% of the total 2010/11 intake. Once recruited, interns are placed in various regional offi ces of PPECB for a period of 12 months for practical exposure and mentorship with regard to the export industry.
The level of exposure and training for interns is aligned with that of a junior inspector employed at PPECB. The training is conducted on various aspects including product standard requirements for export and inspection methodologies which take place at pack-houses, depots, farms and airports serviced by PPECB. It comprises of on-the-job training by knowl-

8
edgeable inspectors who also conduct ongoing assessment of knowledge and skills gained through written tests and practical assessments.
While attached to regional offi ces of PPECB for training, interns are also registered for the NQF and a unit standard aligned National Certifi cate: Perishable Produce Export Technology to empower them with valuable technical skills needed in the export industry. The training towards the attainment of the national certifi cate is conducted as follows:
• Learners converge for three weeks in a central place to complete the theoretical component comprising the funda-mental and core units of the National Certifi cate: Perishable Produce Export Technology.
• The fundamental units are facilitated by CVS College and the core units by PPECB subject matter experts.
• Learners have a choice of two product electives to be completed and it is dependent on the region in which the learner is placed because products differ from region to region.
• Electives are therefore completed in their region as part of the practical training with support and guidance by the inspector.
• Learners also submit a Portfolio of Evidence (POE) for assessment and moderation in order to be declared compe-tent.
All 15 learners submitted their POEs and were all deemed competent which is a good return on investment. The profi les of the 2010/11 AETP interns/trainees are presented in the following tables:
TABLE 10 Breakdown by race, gender and disability of AETP interns (n = 15)
Race Gender Number Disabled Total
African Male
Female
6
6
0
0
6
6
Coloured Male
Female
1
2
0
0
1
2
Indian Male
Female
0
0
0
0
0
0
White Male
Female
0
0
0
0
0
0
Total 15 0 15
Table 10 shows that the majority of the benefi ciaries of the programme are Africans (12) followed by Coloureds (3). The table further indicates that eight females and seven males were appointed as AETP interns and no Indians, Whites or people with disabilities were recruited.
TABLE 11 Breakdown according to age of AETP interns (n = 15)
20–25 years 26–30 years 31–35 years 35+ Gender
Grand total
Female Male Female Male Female Male Female Male Female Male
06 02 02 04 00 00 00 01 08 07 15
Table 11 shows that the majority (8) of the AETP interns recruited were between the ages of 20–25, followed by six be-tween ages of 26–30 and only one was above 35 years.
TABLE 12 Breakdown according to placement of AETP interns (n = 15)
PPECB regional offi ces
Gender
Total
Female Male
Ceres
Durban
Groblersdal
Hoedspruit
Kempton Park
Malelane
1
2
0
1
0
1
1
0
1
0
2
0
2
2
1
1
2
1

9
PPECB regional offi ces
Gender
Total
Female Male
Nelspruit
Paarl
Port Elizabeth
Tzaneen
1
1
1
0
0
1
0
2
1
2
1
2
Total 8 7 15
Table 12 shows that the highest number of AETP interns (2) was accommodated in Ceres, Durban, Kempton Park, Paarl and Tzaneen regional offi ces.
TABLE 13 Breakdown according to provinces where AETP interns are coming from (n = 15)
Province
Gender
Total
Female Male
KwaZulu-Natal
Northern Cape
Eastern Cape
Free State
Mpumalanga
North West
Limpopo
Gauteng
Western Cape
2
0
1
0
2
0
1
0
2
0
0
0
0
1
0
2
2
2
2
0
1
0
3
0
3
2
4
Total 8 7 15
Table 13 indicates that the majority of interns (4) are coming from the Western Cape, followed by Limpopo and Mpuma-langa provinces with three each.
TABLE 14 Breakdown according to municipality where AETP interns are coming from (n = 15)
PPECB regional offi ces
Gender
Total
Female Male
City of Johannesburg
Durban Metro
Hoedspruit
Maruleng
Malelane
Makhado
Mbizana
Mutale
Overberg
Stellenbosch
Thoyandou
Tshwane
Umzinyathi
Wineland
0
1
1
1
0
0
1
0
1
0
1
0
1
1
1
0
0
0
1
1
0
1
0
1
0
1
0
1
1
1
1
1
1
1
1
1
1
1
1
1
1
2
Total 8 7 15
Table 14 shows that the majority of the programme benefi ciaries (2) are from the Wineland Municipality.
10
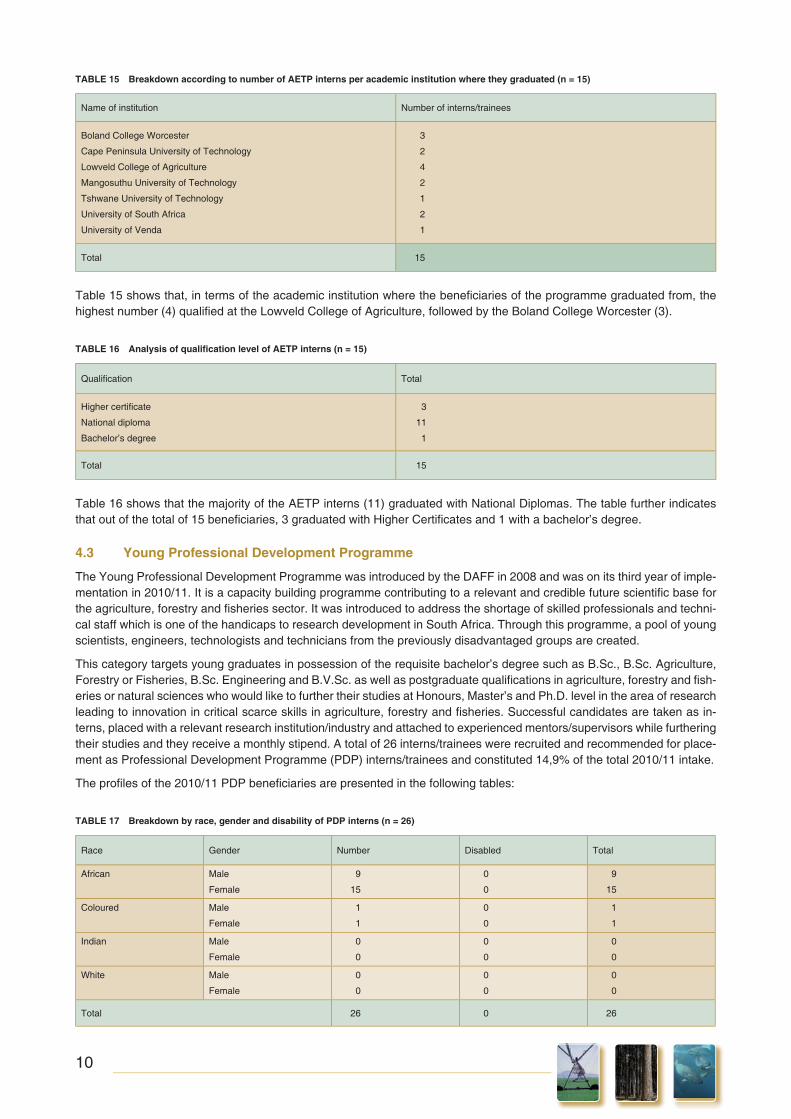
TABLE 15 Breakdown according to number of AETP interns per academic institution where they graduated (n = 15)
Name of institution Number of interns/trainees
Boland College Worcester
Cape Peninsula University of Technology
Lowveld College of Agriculture
Mangosuthu University of Technology
Tshwane University of Technology
University of South Africa
University of Venda
3
2
4
2
1
2
1
Total 15
Table 15 shows that, in terms of the academic institution where the benefi ciaries of the programme graduated from, the highest number (4) qualifi ed at the Lowveld College of Agriculture, followed by the Boland College Worcester (3).
TABLE 16 Analysis of qualifi cation level of AETP interns (n = 15)
Qualifi cation Total
Higher certifi cate
National diploma
Bachelor’s degree
3
11
1
Total 15
Table 16 shows that the majority of the AETP interns (11) graduated with National Diplomas. The table further indicates that out of the total of 15 benefi ciaries, 3 graduated with Higher Certifi cates and 1 with a bachelor’s degree.
4.3 Young Professional Development Programme
The Young Professional Development Programme was introduced by the DAFF in 2008 and was on its third year of imple-mentation in 2010/11. It is a capacity building programme contributing to a relevant and credible future scientifi c base for the agriculture, forestry and fi sheries sector. It was introduced to address the shortage of skilled professionals and techni-cal staff which is one of the handicaps to research development in South Africa. Through this programme, a pool of young scientists, engineers, technologists and technicians from the previously disadvantaged groups are created.
This category targets young graduates in possession of the requisite bachelor’s degree such as B.Sc., B.Sc. Agriculture, Forestry or Fisheries, B.Sc. Engineering and B.V.Sc. as well as postgraduate qualifi cations in agriculture, forestry and fi sh-eries or natural sciences who would like to further their studies at Honours, Master’s and Ph.D. level in the area of research leading to innovation in critical scarce skills in agriculture, forestry and fi sheries. Successful candidates are taken as in-terns, placed with a relevant research institution/industry and attached to experienced mentors/supervisors while furthering their studies and they receive a monthly stipend. A total of 26 interns/trainees were recruited and recommended for place-ment as Professional Development Programme (PDP) interns/trainees and constituted 14,9% of the total 2010/11 intake.
The profi les of the 2010/11 PDP benefi ciaries are presented in the following tables:
TABLE 17 Breakdown by race, gender and disability of PDP interns (n = 26)
Race Gender Number Disabled Total
African Male
Female
9
15
0
0
9
15
Coloured Male
Female
1
1
0
0
1
1
Indian Male
Female
0
0
0
0
0
0
White Male
Female
0
0
0
0
0
0
Total 26 0 26

11
Table 17 shows that the majority of young professionals came from the previously disadvantaged designated groups which is in line with the objectives of the programme. However, the major challenge is the recruitment of people with disabilities. Worth noting from the table above, is the high number of female benefi ciaries (16).
TABLE 18 Breakdown according to age of PDP interns (n = 26)
20–25 years 26–30 years 31–35 years 35+ Gender
Grand total
Female Male Female Male Female Male Female Male Female Male
4 4 7 4 3 1 2 1 16 10 26
Table 18 indicates that eight programme benefi ciaries were within the age range of 20–25, 11 within the age range of 26–30, four within the age range of 31–35 and three are above 35 years.
TABLE 19 Breakdown according to provinces where PDP interns are coming from (n = 26)
Province
Gender
Total
Female Male
KwaZulu-Natal
Northern Cape
Eastern Cape
Free State
Mpumalanga
North West
Limpopo
Gauteng
Western Cape
1
3
1
2
2
3
3
1
0
4
0
2
0
2
1
1
1
7
1
4
2
5
4
2
Total 16 10 26
Table 19 shows that the majority of the young professionals (7) come from the Eastern Cape followed by Limpopo Province with fi ve.
TABLE 20 Breakdown according to municipalities where PDP interns are coming from (n = 26)
Municipality/District
Gender
Total
Female Male
Bellville
Bushbuckridge
City of Johannesburg
Ekurhuleni
Ethekwini
Greater Tzaneen
Lepelle Nkumpi
Makhado
Mbizana
Mgquma
Moses Kotane
Motheo
Nkobonkoe
Nkomazi
Nyandeni
O.R. Tambo
Phalaborwa
Ramotshere
Steve Tshwete
1
1
1
1
1
1
1
0
0
0
1
1
1
1
0
2
1
1
0
0
0
0
0
0
0
0
1
1
1
0
0
0
1
1
1
0
0
1
1
1
1
1
1
1
1
1
1
1
1
1
1
2
1
3
1
1
1

12
Municipality/District
Gender
Total
Female Male
Thulamela
Tshwane
Witzenberg
0
1
0
1
1
1
1
2
1
Total 16 10 26
Table 20 shows that the majority of the young professionals (3) come from O.R Tambo municipality.
TABLE 21 Breakdown according to number of PDP interns per academic institution where they graduated (n = 26)
Name of institution Number of interns/trainees
University of Free State
University of Pretoria
University of the North West
University of Swaziland
University of Fort Hare
University of Limpopo
Rhodes University
Grootfontein College of Agriculture
Cape Peninsula University of Technology
University of Venda
Nelson Mandela Metropolitan University
University of Western Cape
University of Stellenbosch
2
2
2
2
2
4
1
1
3
1
3
1
2
Total 26
Table 21 shows that the majority of the young professionals (4) graduated at the University of Limpopo followed by the Cape Peninsula University of Technology and Nelson Mandela Metropolitan University with 3 each.
5. FIELDS OF STUDY AAND PPLACCEMMEENNT OFFF YYOUUNNG PRROOFFEESSSIONALS FOR THE 2010 ACADEMIC YEAR
5.1 Fields of studies of young professionals for 2010 academic year
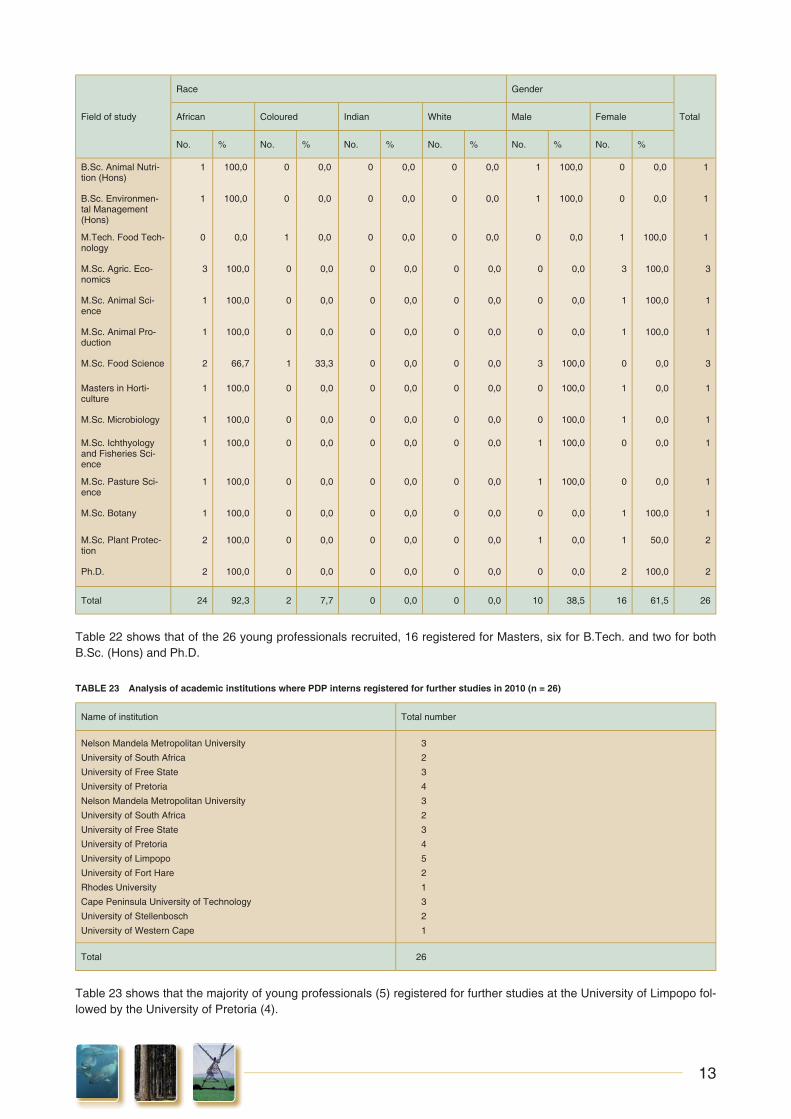
One of the conditions set for participation in the Young Professional Development Programme, is to register for post gradu-ate studies in one of the identifi ed scarce and critical skills in agriculture, forestry fi sheries approved by the DAFF while placed with the relevant industry or research institution for practical hands on experience. The table below depicts fi elds of study registered by young professionals during the 2010 academic year.
TABLE 22 Analysis of fi elds of study registered by young professionals during the 2010 academic year according to race and gender (n = 26)
Field of study
Race Gender
TotalAfrican Coloured Indian White Male Female
No. % No. % No. % No. % No. % No. %
B.Tech. Food Tech-nology
1 100,0 0 0,0 0 0,0 0 0,0 0 0,0 1 100,0 1
B.Tech. Food and Consumer Science
1 100,0 0 0,0 0 0,0 0 0,0 0 0,0 1 100,0 1
B.Tech. Agricultural Management
1 100,0 0 0,0 0 0,0 0 0,0 0 0,0 1 100,0 1
B.Tech. Forestry 3 100,0 0 0,0 0 0,0 0 0,0 2 75,0 1 25,0 3
13
Field of study
Race Gender
TotalAfrican Coloured Indian White Male Female
No. % No. % No. % No. % No. % No. %
B.Sc. Animal Nutri-tion (Hons)
1 100,0 0 0,0 0 0,0 0 0,0 1 100,0 0 0,0 1
B.Sc. Environmen-tal Management (Hons)
1 100,0 0 0,0 0 0,0 0 0,0 1 100,0 0 0,0 1
M.Tech. Food Tech-nology
0 0,0 1 0,0 0 0,0 0 0,0 0 0,0 1 100,0 1
M.Sc. Agric. Eco-nomics
3 100,0 0 0,0 0 0,0 0 0,0 0 0,0 3 100,0 3
M.Sc. Animal Sci-ence
1 100,0 0 0,0 0 0,0 0 0,0 0 0,0 1 100,0 1
M.Sc. Animal Pro-duction
1 100,0 0 0,0 0 0,0 0 0,0 0 0,0 1 100,0 1
M.Sc. Food Science 2 66,7 1 33,3 0 0,0 0 0,0 3 100,0 0 0,0 3
Masters in Horti-culture
1 100,0 0 0,0 0 0,0 0 0,0 0 100,0 1 0,0 1
M.Sc. Microbiology 1 100,0 0 0,0 0 0,0 0 0,0 0 100,0 1 0,0 1
M.Sc. Ichthyology and Fisheries Sci-ence
1 100,0 0 0,0 0 0,0 0 0,0 1 100,0 0 0,0 1
M.Sc. Pasture Sci-ence
1 100,0 0 0,0 0 0,0 0 0,0 1 100,0 0 0,0 1
M.Sc. Botany 1 100,0 0 0,0 0 0,0 0 0,0 0 0,0 1 100,0 1
M.Sc. Plant Protec-tion
2 100,0 0 0,0 0 0,0 0 0,0 1 0,0 1 50,0 2
Ph.D. 2 100,0 0 0,0 0 0,0 0 0,0 0 0,0 2 100,0 2
Total 24 92,3 2 7,7 0 0,0 0 0,0 10 38,5 16 61,5 26
Table 22 shows that of the 26 young professionals recruited, 16 registered for Masters, six for B.Tech. and two for both B.Sc. (Hons) and Ph.D.
TABLE 23 Analysis of academic institutions where PDP interns registered for further studies in 2010 (n = 26)
Name of institution Total number
Nelson Mandela Metropolitan University
University of South Africa
University of Free State
University of Pretoria
Nelson Mandela Metropolitan University
University of South Africa
University of Free State
University of Pretoria
University of Limpopo
University of Fort Hare
Rhodes University
Cape Peninsula University of Technology
University of Stellenbosch
University of Western Cape
3
2
3
4
3
2
3
4
5
2
1
3
2
1
Total 26
Table 23 shows that the majority of young professionals (5) registered for further studies at the University of Limpopo fol-lowed by the University of Pretoria (4).

14
5.2 Period of participation of young professionals in the programme
All the recruited young professionals are requested to enter into an agreement with the DAFF committing them to serve the department or its entities after completion of the programme and to complete their studies within a prescribed period of participation as outlined below:
B.Tech. and Honours degree: 2 years
Master’s degree: 2 years
Ph.D.: 3 years
TABLE 24 Analysis of the year/level of study for the young professionals during the 2010 academic year (n = 26)
Field of study
Year of study
Total duration
1 2 3 Total
B.Tech. Food Technology 1 0 0 1 1
B.Tech Food and Consumer Science 1 0 0 1 2
B.Tech. Agricultural Management 0 1 0 1 2
B. Tech. Forestry 3 0 0 3 1
B.Sc. Animal Nutrition (Hons) 0 1 0 1 2
B.Sc. Environmental Management (Hons) 0 1 0 1 2
M.Tech. Food Technology 0 1 0 1 2
M.Sc. Agric. Economics 0 3 0 3 2
M.Sc. Animal Science 1 0 0 1 2
M.Sc. Animal Production 0 1 0 1 2
M.Sc. Food Science 0 3 0 3 2
Masters in Horticulture 0 1 0 1 2
M.Sc. Microbiology 0 1 0 1 2
M.Sc. Ichthyology and Fisheries Science 0 1 0 1 2
M.Sc. Pasture Science 0 1 0 1 2
M.Sc. Botany 0 1 0 1 2
M.Sc. Plant Protection 0 2 0 2 2
Ph.D. 1 0 1 2 3
Total 7 18 1 26
Table 24 shows that the majority of the young professionals (18) were doing the second year of their postgraduate studies.
5.3 Placement of young professionals during the 2010 academic year
All young professionals are required to be placed with the relevant institution to be exposed to various research and tech-nological methodologies so that they can be equipped with hands-on experience of the research and technological environ-ment. The table below indicates areas where the young professionals were placed to carry out research projects relevant to their fi elds of study. Each young professional was assigned to a mentor who worked together with the supervisor at the institution of higher learning in the interest of the student’s academic progress. The supervisors of young professionals who were placed in laboratories of universities for the projects, also served as their mentors.
15
TABLE 25 Breakdown according to placement of young professionals (n = 26)
Name of institution
Gender
Total
Female Male
Grootfontein Agricultural Development Institute
Agriculture Research Council
Department of Agriculture, Forestry and Fisheries
Limpopo Department of Agriculture
Rhodes University
University of Pretoria
University of Limpopo
University of Fort Hare
Cape Peninsula University of Technology
University of Free State
Nelson Mandela Metropolitan University
University of Western Cape
University of Stellenbosch
1
1
1
2
0
3
2
1
3
0
1
1
0
2
0
0
0
1
0
1
1
0
1
2
0
2
3
1
1
2
1
3
3
2
3
1
3
1
2
Total 16 10 26
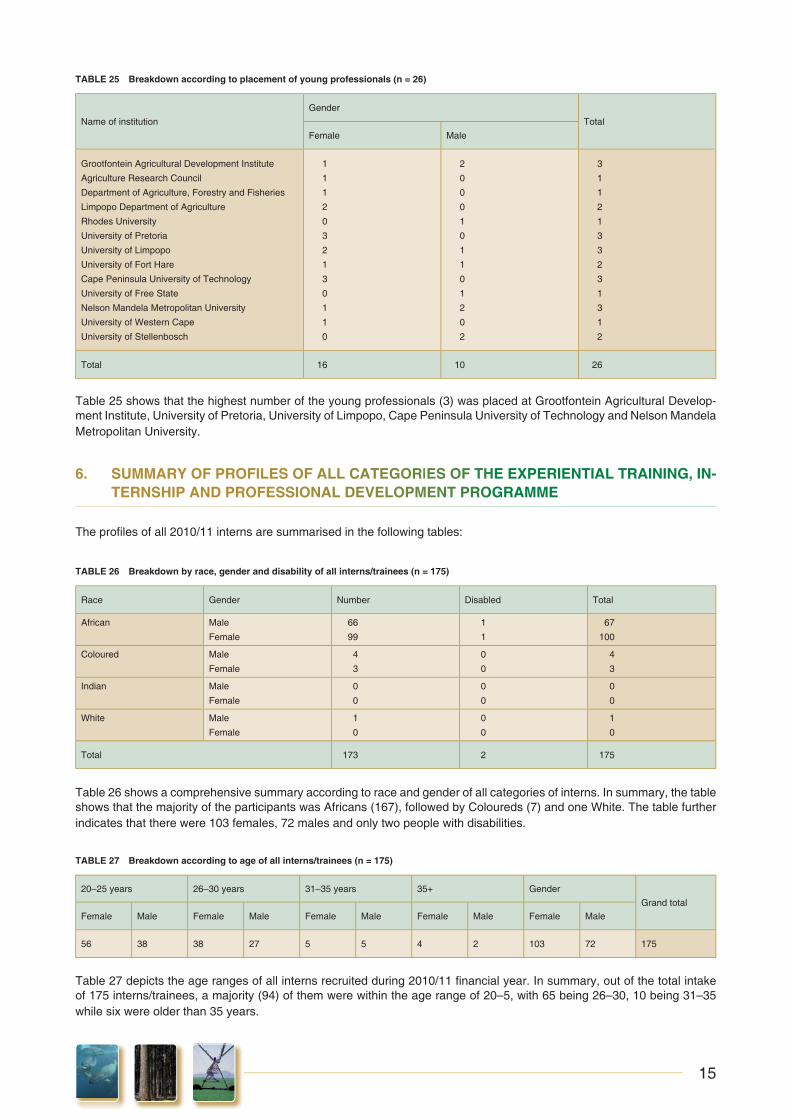
Table 25 shows that the highest number of the young professionals (3) was placed at Grootfontein Agricultural Develop-ment Institute, University of Pretoria, University of Limpopo, Cape Peninsula University of Technology and Nelson Mandela Metropolitan University.
6. SUMMARY OF PROFILES OOF AALL CCATEGGOOORIIESS OOOF TTTHHHE EEXXXPPERIENTIAL TRAINING, IN-TERNSHIP AND PROFESSSIONAAL DDEEVVELLLOPPPMMENNTT PRRROOOGRAAAMMME
The profi les of all 2010/11 interns are summarised in the following tables:
TABLE 26 Breakdown by race, gender and disability of all interns/trainees (n = 175)
Race Gender Number Disabled Total
African Male
Female
66
99
1
1
67
100
Coloured Male
Female
4
3
0
0
4
3
Indian Male
Female
0
0
0
0
0
0
White Male
Female
1
0
0
0
1
0
Total 173 2 175
Table 26 shows a comprehensive summary according to race and gender of all categories of interns. In summary, the table shows that the majority of the participants was Africans (167), followed by Coloureds (7) and one White. The table further indicates that there were 103 females, 72 males and only two people with disabilities.
TABLE 27 Breakdown according to age of all interns/trainees (n = 175)
20–25 years 26–30 years 31–35 years 35+ Gender
Grand total
Female Male Female Male Female Male Female Male Female Male
56 38 38 27 5 5 4 2 103 72 175
Table 27 depicts the age ranges of all interns recruited during 2010/11 fi nancial year. In summary, out of the total intake of 175 interns/trainees, a majority (94) of them were within the age range of 20–5, with 65 being 26–30, 10 being 31–35 while six were older than 35 years.
16
TABLE 28 Breakdown according to provinces where all interns/trainees are coming from (n = 175)
Province Gender
Total
Female Male
KwaZulu-Natal
Northern Cape
Eastern Cape
Free State
Mpumalanga
North West
Limpopo
Gauteng
Western Cape
7
0
9
6
11
9
46
12
3
6
1
6
2
11
7
24
12
3
13
1
15
8
22
16
70
24
6
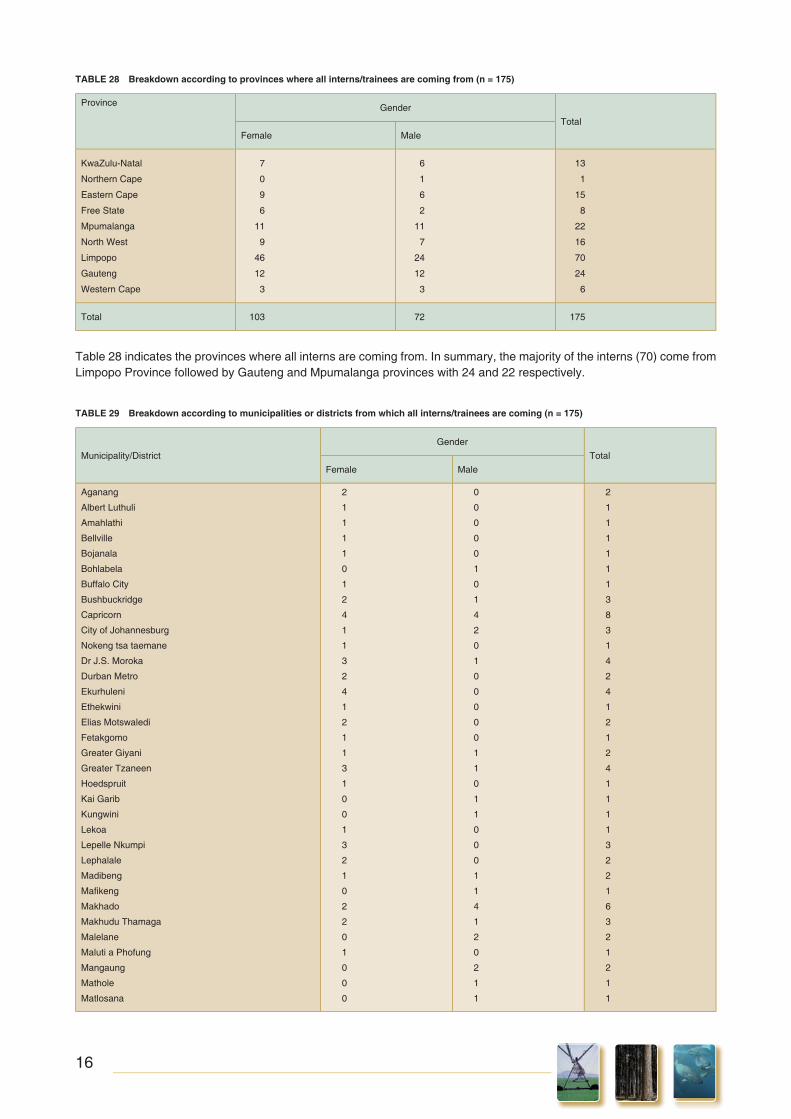
Total 103 72 175
Table 28 indicates the provinces where all interns are coming from. In summary, the majority of the interns (70) come from Limpopo Province followed by Gauteng and Mpumalanga provinces with 24 and 22 respectively.
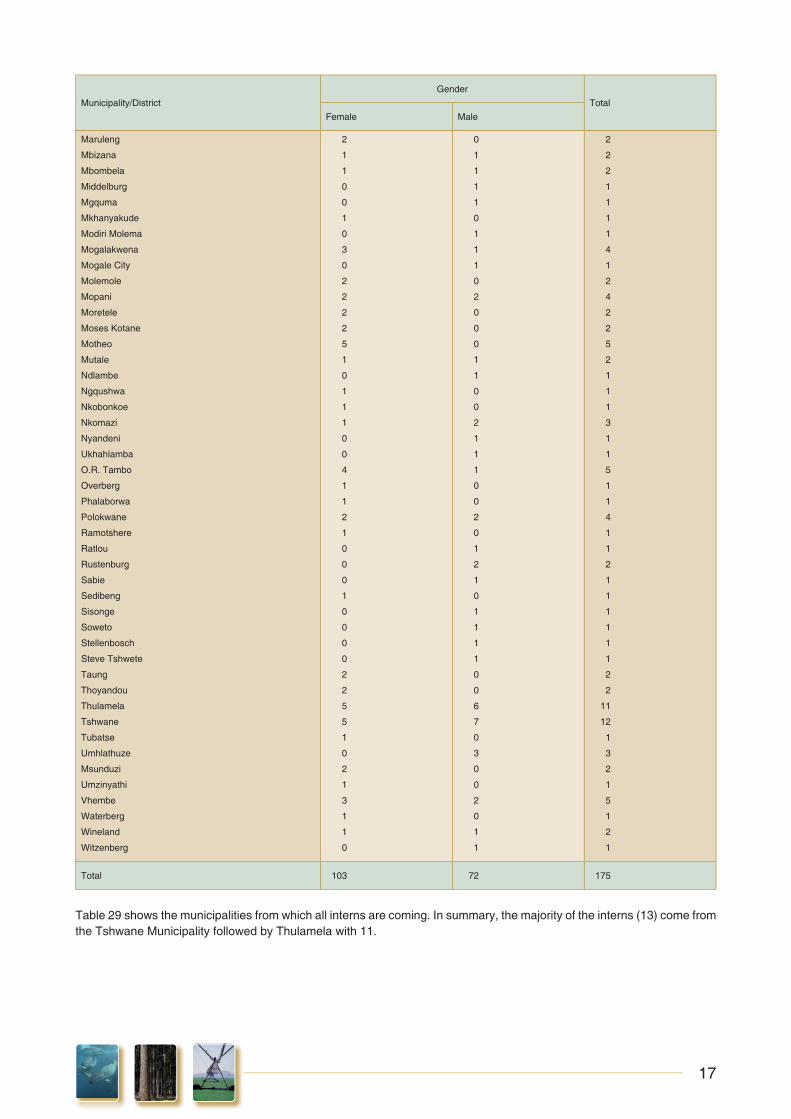
TABLE 29 Breakdown according to municipalities or districts from which all interns/trainees are coming (n = 175)
Municipality/District
Gender
Total
Female Male
Aganang
Albert Luthuli
Amahlathi
Bellville
Bojanala
Bohlabela
Buffalo City
Bushbuckridge
Capricorn
City of Johannesburg
Nokeng tsa taemane
Dr J.S. Moroka
Durban Metro
Ekurhuleni
Ethekwini
Elias Motswaledi
Fetakgomo
Greater Giyani
Greater Tzaneen
Hoedspruit
Kai Garib
Kungwini
Lekoa
Lepelle Nkumpi
Lephalale
Madibeng
Mafi keng
Makhado
Makhudu Thamaga
Malelane
Maluti a Phofung
Mangaung
Mathole
Matlosana
2
1
1
1
1
0
1
2
4
1
1
3
2
4
1
2
1
1
3
1
0
0
1
3
2
1
0
2
2
0
1
0
0
0
0
0
0
0
0
1
0
1
4
2
0
1
0
0
0
0
0
1
1
0
1
1
0
0
0
1
1
4
1
2
0
2
1
1
2
1
1
1
1
1
1
3
8
3
1
4
2
4
1
2
1
2
4
1
1
1
1
3
2
2
1
6
3
2
1
2
1
1
17
Municipality/District
Gender
Total
Female Male
Maruleng
Mbizana
Mbombela
Middelburg
Mgquma
Mkhanyakude
Modiri Molema
Mogalakwena
Mogale City
Molemole
Mopani
Moretele
Moses Kotane
Motheo
Mutale
Ndlambe
Ngqushwa
Nkobonkoe
Nkomazi
Nyandeni
Ukhahlamba
O.R. Tambo
Overberg
Phalaborwa
Polokwane
Ramotshere
Ratlou
Rustenburg
Sabie
Sedibeng
Sisonge
Soweto
Stellenbosch
Steve Tshwete
Taung
Thoyandou
Thulamela
Tshwane
Tubatse
Umhlathuze
Msunduzi
Umzinyathi
Vhembe
Waterberg
Wineland
Witzenberg
2
1
1
0
0
1
0
3
0
2
2
2
2
5
1
0
1
1
1
0
0
4
1
1
2
1
0
0
0
1
0
0
0
0
2
2
5
5
1
0
2
1
3
1
1
0
0
1
1
1
1
0
1
1
1
0
2
0
0
0
1
1
0
0
2
1
1
1
0
0
2
0
1
2
1
0
1
1
1
1
0
0
6
7
0
3
0
0
2
0
1
1
2
2
2
1
1
1
1
4
1
2
4
2
2
5
2
1
1
1
3
1
1
5
1
1
4
1
1
2
1
1
1
1
1
1
2
2
11
12
1
3
2
1
5
1
2
1
Total 103 72 175
Table 29 shows the municipalities from which all interns are coming. In summary, the majority of the interns (13) come from the Tshwane Municipality followed by Thulamela with 11.
18
7. MMONITOORINGG AAND EVALUUATIOOON
7.1 Monthly and quarterly progress reports
Monitoring and evaluation of the progress of interns/trainees is crucial and fundamental in the implementation of the pro-gramme. For conventional and AETP interns, a day prior to the beginning of each month, the intern/trainee and the mentor agreed on the learning outcomes and key performance areas for the ensuing month and compiled a monthly workplan. Flowing from the workplan, the interns/trainees recorded all daily activities executed on the basis of the roadmap provided by the workplan.
The compulsory weekly review meetings between mentor and intern/trainee were held to evaluate the progress of interns at that level. At the end of every month, all interns compiled their monthly progress reports on the basis of activities execut-ed during that particular month. Such reports were forwarded to the internship unit for evaluation and assessment. Many interns/trainees struggled to produce quality reports during the fi rst three months of their participation in the programme. Through the interventions made during monitoring visits of the fi rst quarter, the quality of reports improved signifi cantly.
With regard to the young professionals, monthly progress reports on activities executed signed by their supervisors/men-tors were also received and analysed accordingly. In addition, half yearly and end-of-year examination results were also receive from respective institutions of higher learning where they enrolled for their postgraduate studies.
7.2 Monthly claims and stipends
All interns/trainees had to complete claim forms (timesheets) that indicated all the days worked in a particular month. Men-tors and Senior Managers were responsible for managing the system at their respective workstations. A few days before the end of each month, reminders were sent to all interns/trainees, mentors and Senior Managers to advise them on how the timesheet should be completed. All completed claim forms, leave forms and progress reports were sent on monthly basis to the Directorate: Education, Training and Extension Services for assessment before being forwarded to the Direc-torate: Financial Administration for further processing. Since the stipends of interns/trainees are linked to a specifi c notch of a particular salary level of public servants as guided by the DPSA, their stipends were also increased from 1 July 2010 when the DPSA increased salaries of public servants.
7.3 Monitoring visits
Monitoring visits constituted an important monitoring mechanism of the programme. Such visits were arranged between the mentors and interns/trainees and were conducted on a quarterly basis according to a planned schedule and when the need arose. However, because of limited human resources such schedules were not always adhered to. The purpose of the monitoring visits during the fi rst quarter was to establish how the interns/trainees were settling in at their work stations and to outline important administration aspects of the programme.
Issues dealt with during other monitoring visits included spot checks on logbooks, leave records and presentations of quarterly reports by interns/trainees. Mock interviews were also conducted with interns to assess their performance in an interview setup and to give them feedback and advise on how best to respond to questions during the interviews. The mock interview exercise was meant to improve the performance of interns during interviews and subsequently improve their chances of being employed. Interns were given a dummy advert for a position two weeks before the date of the monitoring visit (interview) and they were requested to apply for the advertised post using the Z83 form and to prepare themselves for interviews. The following was established during the interviews held with interns:
• The majority of the interns were nervous and could not express themselves eloquently in response to questions posed to them
• In responding to questions, the majority of the interns struggled to link their experiences with qualifi cations, require-ments and duties of the advertised positions
• On questions like “Why do think you are the right candidate for the position?” the majority of the interns failed to convince the panel because they were very brief with their answers without explaining their attributes and expertise relevant to the duties of the advertised positions
• Feedback sessions were held with interns after the interviews to discuss their interview performance• During the feedback sessions, interns were given hints on how to respond to questions during interviews
PowerPoint presentation sessions were also conducted during the third quarter monitoring visits. The main purpose of pre-sentations was to expose interns with regards to presentation skills and to evaluate the layout and format of their presenta-tions. It is further meant to build the confi dence of interns and to measure the extent at which they respond to questions asked based on their presentations. Two weeks before the date of the monitoring visit, interns were requested to compile progress reports from 01 February 2010 when they commenced with their internship programme to 30 September 2010 and to highlight the following in the report:

19
• Activities executed
• Skills learned
• Highlights
• Challenges and recommendations
They further used information in the report to prepare a PowerPoint presentation. During the presentation session, each intern was given 20 minutes to deliver the presentation and questions based on the presentation were asked at the end. The following was established during the presentation sessions:
• The quality and standard of presentations by some interns were generally good
• Interns struggled to maintain good eye contact with audience during their presentations
• There was information overload on some slides of interns and some used a very small font size which was not clearly visible
• At the end of the presentation session, interns were given advice and tips on how best they can improve in future
7.4 Success indicators of the programme
7.4.1 Employment status
The major success indicator of the programme is the number of participants who secure employment or establish their own businesses during their training programme. The interns were expected to be very aggressive in their approach to look for employment and business opportunities. Therefore, monitoring employment was an important tool to evaluate the impact of the programme and a comprehensive database to track the employment of these interns was established and continu-ously updated. The employment database consisted of the following elements:
• Personal details of the interns
• Organisation or directorates where they are placed
• Period of stay in the programme
• Organisation where employment is secured
• Position and salary level
Out of the 175 interns who participated in the programme, 32 (18,3%) secured employment while 143 (81,7%) could not secure employment. The rate of employment of interns during the 2010/11 programme was lower compared to the 39 interns who secured employment during 2009/10. This could be attributed to the impact of the global economic recession that severely affected the availability of jobs worldwide, even in South Africa. The analysis of the status of employment is outlined in the following graphs:
FIG. 1 Analysis of status of employment of all interns (n = 32)
Fig. 1 above shows that out of the total intake of 175 interns/trainees, 32 (18,3%) secured employment while 143 (81,7%) could not secure permanent employment.
81,7
18,3
Employment status (%)
Unemployed
Employed
81,7
18,3
Employmennt statuss (%)
Unemployed
Employed

20
FIG. 2 Analysis of status of employment by gender (n = 32)
Fig. 2 shows that out of the 32 interns/trainees who secured employment, 20 (62,5%) were females and 12 (37,5%) were males.
TABLE 30 Status of employment according to organisation (n = 32)
Organisation Number %
DAFF
Other government departments
Private sector
12
6
14
37,5
18,7
43,8
Total 32 100
Table 30 shows that most of the interns 18 (56,2%) secured employment within the public service of which the DAFF ap-pointed 12 (37,5%). The table further indicates that 14 (43,8%) were employed by the private sector.
TABLE 31 Analysis of period of stay before securing employment (n = 32)
Period of participation Total
1–3 months
4–6 months
7–9 months
10–12 months
03
04
13
12
Total 32
Table 31 indicates that the majority of the interns/trainees 13 (43,4%) secured employment during the third quarter (7–9 months) of their participation in the programme.
TABLE 32 Analysis of levels of employment of trainees/interns (n = 32)
Salary level Number of interns/trainees
SL 11
SL 10
SL 8
SL 7
SL 6
03
01
04
08
07
37,5
62,5
Employment by gender (%)
Female
Male
37,5
62,5
Employment by gender (%)
Male
Female
37,53
62,5
Employmennt by geender (%)
Male
Female
21
Salary level Number of interns/trainees
SL 5
SL 4
SL 2
01
06
02
Total 32
Table 32 indicates the levels at which trainees/interns secured employment during their participation in the programme. The table further shows that the majority of interns (8) secured employment at salary level 7 followed by seven at salary levels 6. It is worth noting that eight of them (25,0%) were appointed at middle management level.
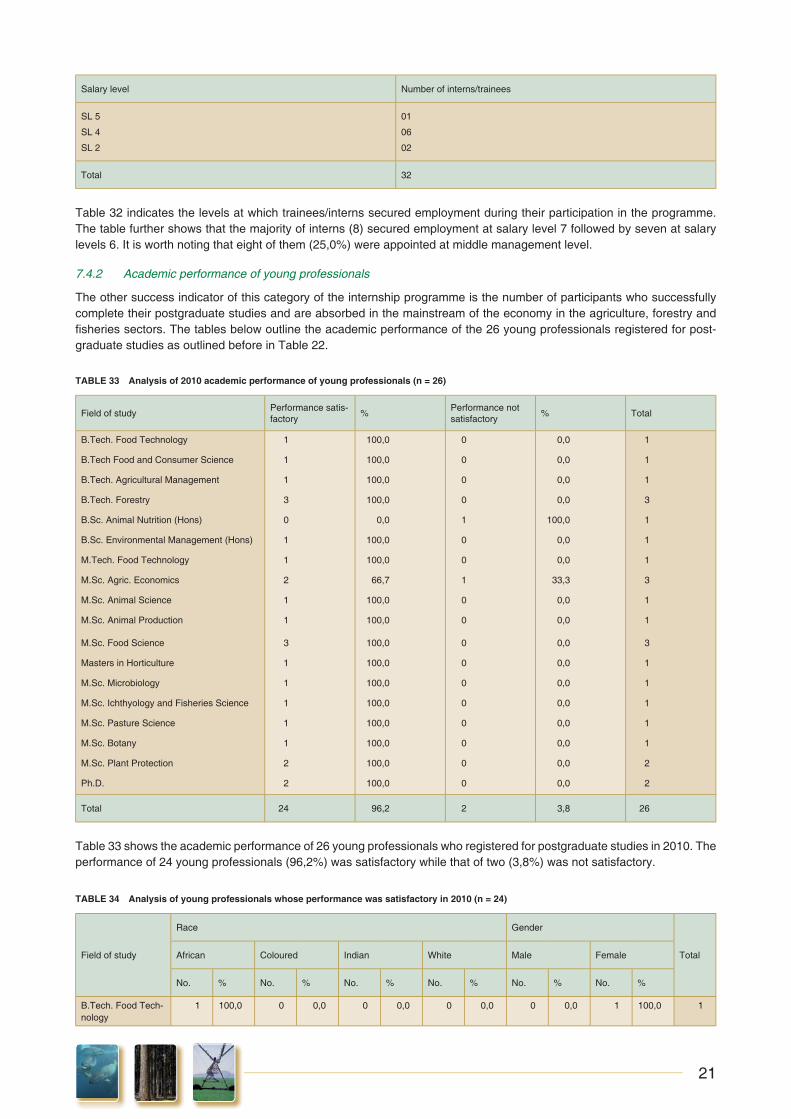
7.4.2 Academic performance of young professionals
The other success indicator of this category of the internship programme is the number of participants who successfully complete their postgraduate studies and are absorbed in the mainstream of the economy in the agriculture, forestry and fi sheries sectors. The tables below outline the academic performance of the 26 young professionals registered for post-graduate studies as outlined before in Table 22.
TABLE 33 Analysis of 2010 academic performance of young professionals (n = 26)
Field of studyPerformance satis-factory
% Performance not satisfactory
% Total
B.Tech. Food Technology 1 100,0 0 0,0 1
B.Tech Food and Consumer Science 1 100,0 0 0,0 1
B.Tech. Agricultural Management 1 100,0 0 0,0 1
B.Tech. Forestry 3 100,0 0 0,0 3
B.Sc. Animal Nutrition (Hons) 0 0,0 1 100,0 1
B.Sc. Environmental Management (Hons) 1 100,0 0 0,0 1
M.Tech. Food Technology 1 100,0 0 0,0 1
M.Sc. Agric. Economics 2 66,7 1 33,3 3
M.Sc. Animal Science 1 100,0 0 0,0 1
M.Sc. Animal Production 1 100,0 0 0,0 1
M.Sc. Food Science 3 100,0 0 0,0 3
Masters in Horticulture 1 100,0 0 0,0 1
M.Sc. Microbiology 1 100,0 0 0,0 1
M.Sc. Ichthyology and Fisheries Science 1 100,0 0 0,0 1
M.Sc. Pasture Science 1 100,0 0 0,0 1
M.Sc. Botany 1 100,0 0 0,0 1
M.Sc. Plant Protection 2 100,0 0 0,0 2
Ph.D. 2 100,0 0 0,0 2
Total 24 96,2 2 3,8 26
Table 33 shows the academic performance of 26 young professionals who registered for postgraduate studies in 2010. The performance of 24 young professionals (96,2%) was satisfactory while that of two (3,8%) was not satisfactory.
TABLE 34 Analysis of young professionals whose performance was satisfactory in 2010 (n = 24)
Field of study
Race Gender
TotalAfrican Coloured Indian White Male Female
No. % No. % No. % No. % No. % No. %
B.Tech. Food Tech-nology
1 100,0 0 0,0 0 0,0 0 0,0 0 0,0 1 100,0 1

22
Field of study
Race Gender
TotalAfrican Coloured Indian White Male Female
No. % No. % No. % No. % No. % No. %
B.Tech Food and Consumer Science
1 100,0 0 0,0 0 0,0 0 0,0 0 0,0 1 100,0 1
B.Tech. Agricultural Management
1 100,0 0 0,0 0 0,0 0 0,0 0 0,0 1 100,0 1
B.Tech. Forestry 3 100,0 0 0,0 0 0,0 0 0,0 2 75,0 1 25,0 3
B.Sc. Environmen-tal Management (Hons)
1 100,0 0 0,0 0 0,0 0 0,0 1 100,0 0 0,0 1
M.Tech. Food Tech-nology
0 0,0 1 0,0 0 0,0 0 0,0 0 0,0 1 100,0 1
M.Sc. Agric. Eco-nomics
2 100,0 0 0,0 0 0,0 0 0,0 0 0,0 2 100,0 2
M.Sc. Animal Sci-ence
1 100,0 0 0,0 0 0,0 0 0,0 0 0,0 1 100,0 1
M.Sc. Animal Pro-duction
1 100,0 0 0,0 0 0,0 0 0,0 0 0,0 1 100,0 1
M.Sc. Food Science 2 66,7 1 33,3 0 0,0 0 0,0 3 100,0 0 0,0 3
Masters in Horti-culture
1 100,0 0 0,0 0 0,0 0 0,0 0 100,0 1 0,0 1
M.Sc. Microbiology 1 100,0 0 0,0 0 0,0 0 0,0 0 100,0 1 0,0 1
M.Sc. Ichthyology and Fisheries Sci-ence
1 100,0 0 0,0 0 0,0 0 0,0 1 100,0 0 0,0 1
M.Sc. Pasture Sci-ence
1 100,0 0 0,0 0 0,0 0 0,0 1 100,0 0 0,0 1
M.Sc. Botany 1 100,0 0 0,0 0 0,0 0 0,0 0 0,0 1 100,0 1
M.Sc. Plant Protec-tion
2 100,0 0 0,0 0 0,0 0 0,0 1 50,0 1 50,0 2
Ph.D. 2 100,0 0 0,0 0 0,0 0 0,0 0 0,0 2 100,0 2
Total 22 91,7 2 8,3 0 0,0 0 0,0 9 37,5 15 62,5 24
In terms of the data presented in Table 34, the performance of 24 young professionals was satisfactory and they would pro-ceed to the next level of study in 2011.Out of these 24 young professionals, 11 completed their studies and their analysis is further outlined in Table 36 below.
TABLE 35 Analysis of young professionals whose performance was not satisfactory in 2010 (n = 2)
Field of study
Race Gender
TotalAfrican Coloured Indian White Male Female
No. % No. % No. % No. % No. % No. %
B.Sc. Animal Nutri-tion (Hons)
1 100,0 0 0,0 0 0,0 0 0,0 1 100,0 0 0,0 1
M.Sc. Agric. Eco-nomics
1 100,0 0 0,0 0 0,0 0 0,0 0 0,0 1 100,0 1
Total 2 100,0 0 0,0 0 0,0 0 0,0 2 100,0 0 0,0 2
In terms of the data presented in Table 35, the performance of two young professionals was unsatisfactory and they are to be suspended from the programme in 2011.

23
TABLE 36 An analysis of young professionals who completed their studies and graduated in 2010 (n = 12)
Field of study
Race Gender
TotalAfrican Coloured Indian White Male Female
No. % No. % No. % No. % No. % No. %
B.Tech. Food Tech-nology
1 100,0 0 0,0 0 0,0 0 0,0 0 0,0 1 100,0 1
B.Tech. Agricultural Management
1 100,0 0 0,0 0 0,0 0 0,0 0 0,0 1 100,0 1
B.Sc. Environmen-tal Management (Hons)
1 100,0 0 0,0 0 0,0 0 0,0 1 100,0 0 0,0 1
B.Tech. Forestry 2 100,0 0 0,0 0 0,0 0 0,0 1 50,0 1 50,0 2
M. Tech. Food Technology
0 0,0 1 0,0 0 0,0 0 0,0 0 0,0 1 100,0 1
M.Sc. Agric. Eco-nomics
1 100,0 0 0,0 0 0,0 0 0,0 0 0,0 1 100,0 1
M.Sc. Animal Pro-duction
1 100,0 0 0,0 0 0,0 0 0,0 0 0,0 1 100,0 1
M.Sc. Food Science 2 66,7 1 33,3 0 0,0 0 0,0 3 100,0 0 0,0 3
M.Sc. Pasture Sci-ence
1 100,0 0 0,0 0 0,0 0 0,0 1 100,0 0 0,0 1
Total 10 83,3 2 16,7 0 0,0 0 0,0 6 50,0 6 50,0 12
Table 36 shows that 12 young professionals completed their studies during the 2010 academic year. The table further indicates that the majority of those who completed their studies are Masters students (7) followed by four B.Tech. students and one Honours student.
TABLE 37 Analysis of the whereabouts of the young professionals who completed their studies in 2010 (n = 12)
Young professionals Whereabouts
B.Tech. Food Technology Offered DAFF bursary to further study (B.Tech. Food Technology) at Cape Peninsula University of Technology
B.Sc. Environmental Management (Hons) Appointed at Grootfontein Agricultural Development Institute
B.Tech. Agricultural Management Appointed at Grootfontein Agricultural Development Institute
B.Tech. Forestry (2 students) Appointed by DAFF as interns
M.Tech. Food Technology Offered DAFF bursary to further study (Ph.D.) at the University of Stellenbosch
M.Sc. Agric. Economics Appointed by DAFF as an intern
M.Sc. Animal Production In the process of being appointed by DAFF
M.Sc. Food Science (3 students) One is appointed by Westfalia Fruit Estate (Tzaneen)
One is appointed by Lake International Technologies (Sandton)
One is appointed by DAFF as an intern
M.Sc. Pasture Science Offered DAFF bursary to further study (Ph.D.) at the University of Fort Hare
Table 37 shows that out of the 12 young professionals who completed their studies, four were appointed by the DAFF as interns, four secured permanent employment, three furthered their studies and one is in the process of being appointed by DAFF.
24
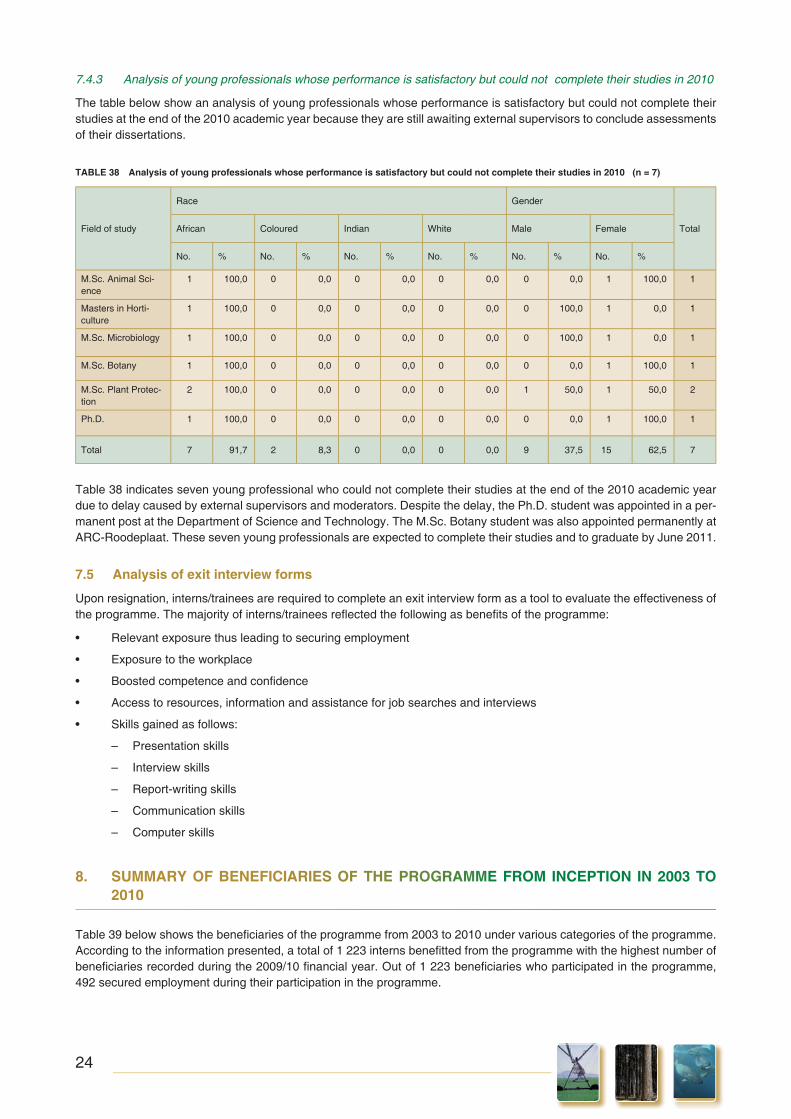
7.4.3 Analysis of young professionals whose performance is satisfactory but could not complete their studies in 2010
The table below show an analysis of young professionals whose performance is satisfactory but could not complete their studies at the end of the 2010 academic year because they are still awaiting external supervisors to conclude assessments of their dissertations.
TABLE 38 Analysis of young professionals whose performance is satisfactory but could not complete their studies in 2010 (n = 7)
Field of study
Race Gender
TotalAfrican Coloured Indian White Male Female
No. % No. % No. % No. % No. % No. %
M.Sc. Animal Sci-ence
1 100,0 0 0,0 0 0,0 0 0,0 0 0,0 1 100,0 1
Masters in Horti-culture
1 100,0 0 0,0 0 0,0 0 0,0 0 100,0 1 0,0 1
M.Sc. Microbiology 1 100,0 0 0,0 0 0,0 0 0,0 0 100,0 1 0,0 1
M.Sc. Botany 1 100,0 0 0,0 0 0,0 0 0,0 0 0,0 1 100,0 1
M.Sc. Plant Protec-tion
2 100,0 0 0,0 0 0,0 0 0,0 1 50,0 1 50,0 2
Ph.D. 1 100,0 0 0,0 0 0,0 0 0,0 0 0,0 1 100,0 1
Total 7 91,7 2 8,3 0 0,0 0 0,0 9 37,5 15 62,5 7
Table 38 indicates seven young professional who could not complete their studies at the end of the 2010 academic year due to delay caused by external supervisors and moderators. Despite the delay, the Ph.D. student was appointed in a per-manent post at the Department of Science and Technology. The M.Sc. Botany student was also appointed permanently at ARC-Roodeplaat. These seven young professionals are expected to complete their studies and to graduate by June 2011.
7.5 Analysis of exit interview forms
Upon resignation, interns/trainees are required to complete an exit interview form as a tool to evaluate the effectiveness of the programme. The majority of interns/trainees refl ected the following as benefi ts of the programme:
• Relevant exposure thus leading to securing employment
• Exposure to the workplace
• Boosted competence and confi dence
• Access to resources, information and assistance for job searches and interviews
• Skills gained as follows:
– Presentation skills
– Interview skills
– Report-writing skills
– Communication skills
– Computer skills
8. SUMMARY OF BENEEFICIAARRIESS OFF TTHEEE PPROOGRRAAMMEE FFRRROOOM INCEPTION IN 2003 TO 2010
Table 39 below shows the benefi ciaries of the programme from 2003 to 2010 under various categories of the programme. According to the information presented, a total of 1 223 interns benefi tted from the programme with the highest number of benefi ciaries recorded during the 2009/10 fi nancial year. Out of 1 223 benefi ciaries who participated in the programme, 492 secured employment during their participation in the programme.
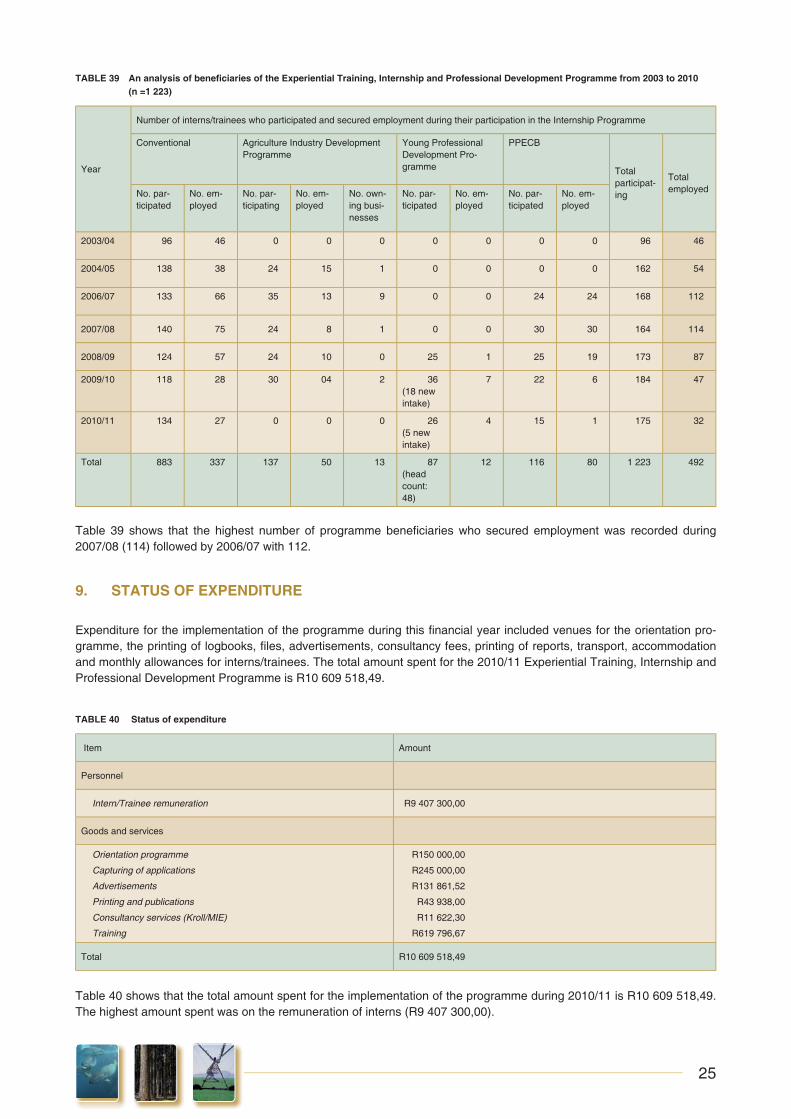
25
TABLE 39 An analysis of benefi ciaries of the Experiential Training, Internship and Professional Development Programme from 2003 to 2010 (n =1 223)
Year
Number of interns/trainees who participated and secured employment during their participation in the Internship Programme
Conventional Agriculture Industry Development Programme
Young Professional Development Pro-gramme
PPECB
Total participat-ing
Total employedNo. par-
ticipatedNo. em-ployed
No. par-ticipating
No. em-ployed
No. own-ing busi-nesses
No. par-ticipated
No. em-ployed
No. par-ticipated
No. em-ployed
2003/04 96 46 0 0 0 0 0 0 0 96 46
2004/05 138 38 24 15 1 0 0 0 0 162 54
2006/07 133 66 35 13 9 0 0 24 24 168 112
2007/08 140 75 24 8 1 0 0 30 30 164 114
2008/09 124 57 24 10 0 25 1 25 19 173 87
2009/10 118 28 30 04 2 36 (18 new intake)
7 22 6 184 47
2010/11 134 27 0 0 0 26 (5 new intake)
4 15 1 175 32
Total 883 337 137 50 13 87 (head count: 48)
12 116 80 1 223 492
Table 39 shows that the highest number of programme benefi ciaries who secured employment was recorded during 2007/08 (114) followed by 2006/07 with 112.
9. STATUS OF EXPENDDITURREE
Expenditure for the implementation of the programme during this fi nancial year included venues for the orientation pro-gramme, the printing of logbooks, fi les, advertisements, consultancy fees, printing of reports, transport, accommodation and monthly allowances for interns/trainees. The total amount spent for the 2010/11 Experiential Training, Internship and Professional Development Programme is R10 609 518,49.
TABLE 40 Status of expenditure
Item Amount
Personnel
Intern/Trainee remuneration R9 407 300,00
Goods and services
Orientation programme
Capturing of applications
Advertisements
Printing and publications
Consultancy services (Kroll/MIE)
Training
R150 000,00
R245 000,00
R131 861,52
R43 938,00
R11 622,30
R619 796,67
Total R10 609 518,49
Table 40 shows that the total amount spent for the implementation of the programme during 2010/11 is R10 609 518,49. The highest amount spent was on the remuneration of interns (R9 407 300,00).

26
TA
BL
E 4
1 S
um
mar
y o
f b
enefi
cia
ries
of
the
2010
/11
inte
rnsh
ip im
ple
men
ted
by
pro
vin
cial
dep
artm
ents
of
agri
cult
ure
(n
= 6
44)
Pro
vinc
e
Num
ber
of b
enefi
cia
ries
Tot
al e
m-
ploy
edA
fric
anC
olou
red
Indi
anW
hite
Tot
al
Tot
al b
en-
efi c
iarie
s
Pro
vinc
ial
depa
rt-
men
t
Oth
er g
ov-
ernm
ent
depa
rt-
men
ts
Priv
ate
sect
orO
wn
Bus
i-ne
ssM
ale
Fem
ale
Mal
eF
emal
eM
ale
Fem
ale
Mal
eF
emal
eM
ale
Fem
ale
Eas
tern
Cap
e44
670
00
00
044
6711
10
01
01
Gau
teng
310
00
00
00
310
130
013
013
Kw
aZul
u- N
atal
520
00
00
00
520
255
10
17
Fre
e S
tate
1617
00
00
00
1617
333
11
05
Wes
tern
Cap
e30
2742
370
08
680
7015
00
13
04
Lim
popo
118
133
00
00
00
118
133
251
85
80
21
Mpu
mal
anga
3229
00
00
00
3229
610
113
314
Tot
al24
830
342
370
08
629
834
664
416
1929
165
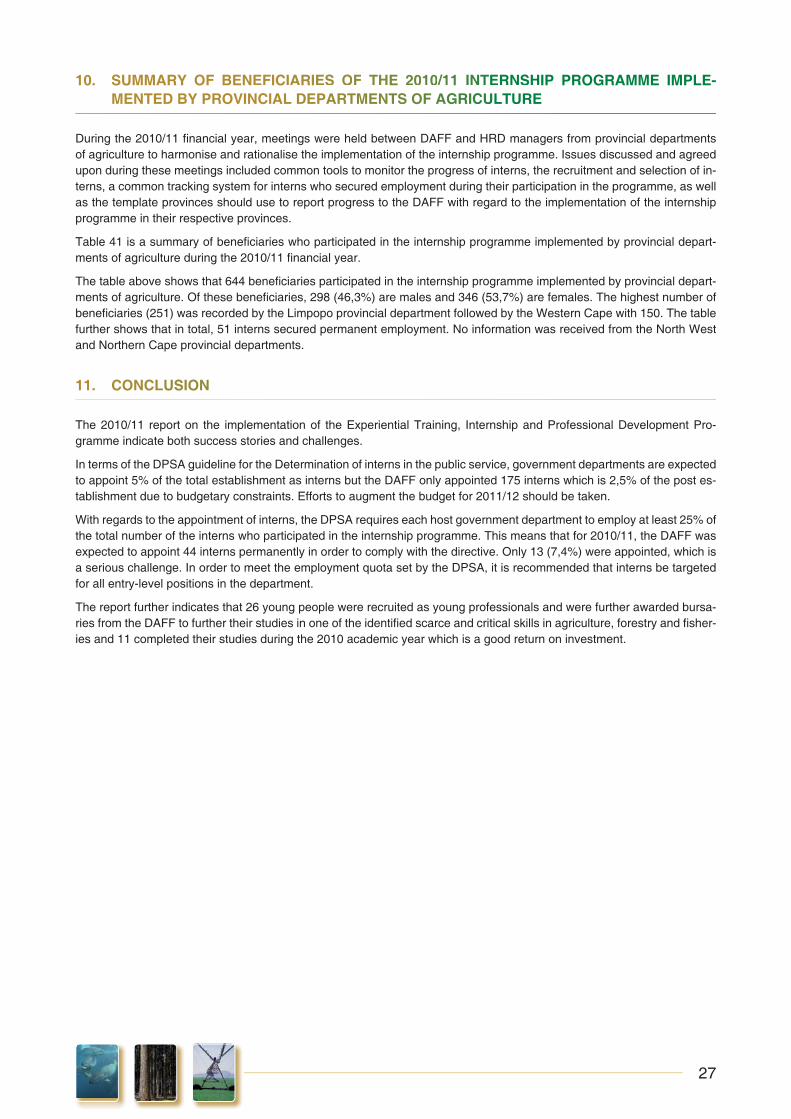
27
10. SUMMARY OF BENEEFICIAAARIESS OOFF TTHE 2220110//11 INNNTTTERRNNNSSHHIP PROGRAMME IMPLE-MENTED BY PROVINCIAL DDEPAARTTMMEENTTTS OFF AAGGRRICCCUUULTTUUURRRE
During the 2010/11 fi nancial year, meetings were held between DAFF and HRD managers from provincial departments of agriculture to harmonise and rationalise the implementation of the internship programme. Issues discussed and agreed upon during these meetings included common tools to monitor the progress of interns, the recruitment and selection of in-terns, a common tracking system for interns who secured employment during their participation in the programme, as well as the template provinces should use to report progress to the DAFF with regard to the implementation of the internship programme in their respective provinces.
Table 41 is a summary of benefi ciaries who participated in the internship programme implemented by provincial depart-ments of agriculture during the 2010/11 fi nancial year.
The table above shows that 644 benefi ciaries participated in the internship programme implemented by provincial depart-ments of agriculture. Of these benefi ciaries, 298 (46,3%) are males and 346 (53,7%) are females. The highest number of benefi ciaries (251) was recorded by the Limpopo provincial department followed by the Western Cape with 150. The table further shows that in total, 51 interns secured permanent employment. No information was received from the North West and Northern Cape provincial departments.
11. CCOONCLUUSIONN
The 2010/11 report on the implementation of the Experiential Training, Internship and Professional Development Pro-gramme indicate both success stories and challenges.
In terms of the DPSA guideline for the Determination of interns in the public service, government departments are expected to appoint 5% of the total establishment as interns but the DAFF only appointed 175 interns which is 2,5% of the post es-tablishment due to budgetary constraints. Efforts to augment the budget for 2011/12 should be taken.
With regards to the appointment of interns, the DPSA requires each host government department to employ at least 25% of the total number of the interns who participated in the internship programme. This means that for 2010/11, the DAFF was expected to appoint 44 interns permanently in order to comply with the directive. Only 13 (7,4%) were appointed, which is a serious challenge. In order to meet the employment quota set by the DPSA, it is recommended that interns be targeted for all entry-level positions in the department.
The report further indicates that 26 young people were recruited as young professionals and were further awarded bursa-ries from the DAFF to further their studies in one of the identifi ed scarce and critical skills in agriculture, forestry and fi sher-ies and 11 completed their studies during the 2010 academic year which is a good return on investment.