impacts of participant related factors a thesis …
TRANSCRIPT

1
IMPACTS OF PARTICIPANT RELATED FACTORS
ON REBAR SUPPLY CHAIN PERFORMANCE IN SMEs
A THESIS SUBMITTED TO
THE GRADUATE SCHOOL OF NATURAL AND APPLIED SCIENCES
OF
MIDDLE EAST TECHNICAL UNIVERSITY
BY
ZELİHA BANU YAVUZ
IN PARTIAL FULFILLMENT OF THE REQUIREMENTS
FOR
THE DEGREE OF DOCTOR OF PHILOSPHY IN BUILDING SCIENCE
IN
ARCHITECTURE
SEPTEMBER 2012

ii
Approval of the Graduate School of Natural and Applied Sciences
___________________
Prof.Dr.Canan Özgen
Director
I certify that this thesis satisfies all the requirements as a thesis for the degree
of Doctor of Philosophy.
__________________
Assoc. Prof. Dr. Güven Arif Sargın
Head of Department
This is to certify that we have read this thesis and that in our opinion it is fully
adequate, in scope and quality, as a thesis for the degree of Doctor of Philosophy.
__________________
Assoc. Prof. Dr. Soofia Tahira Elias-Ozkan
Supersivor
Examining Committee Members
Prof. Dr. Murat Gündüz (METU, CE ) ______________
Assoc. Prof. Dr. Soofia Tahira Elias-Ozkan (METU, ARCH) ______________
Assoc. Prof . Dr. Ali Murat Tanyer (METU, ARCH) ______________
Asst. Prof . Dr. Cengiz Özmen (Çankaya University, ARCH) ______________
Asst. Prof . Dr. Aslı Akçamete (METU, CE) ______________

iii
PLAGIARISM
I hereby declare that all information in this document has been obtained and
presented in accordance with academic rules and ethical conduct. I also declare
that, as required by these rules and conduct, I have fully cited and referenced
all material and results that are not original to this work.
Name, Last Name :Zeliha Banu Yavuz
Signature :

iv
ABSTRACT
IMPACTS OF PARTICIPANT RELATED FACTORS
ON REBAR SUPPLY CHAIN PERFORMANCE IN SMEs
Zeliha Banu Yavuz
Ph. D., Department of Architecture in Building Science
Supervisor: Assoc. Prof. Dr. Soofia Tahira Elias-Özkan
September 2012,187 pages
The improvement of construction systems and management systems do not
move together in construction industry, not using the effective management
approaches decrease the productivity of the work. The firms both in national and
international area in manufacturing industry use supply chain management to
preserve their competitive force.
As material costs account for a high percentage of the overall cost, the success
of a project is heavily dependent on material related factors and processes. In Turkey
because of extensively using in-situ concrete in construction, the supply chain for
reinforcement and concrete is very important. One of the components of concrete is
“re-bar” and its supply chain, rbSC (rebar supply chain) was investigated within the
scope of this research.
In this study a framework was developed on the basis of the information from
a literature survey and a field-test consisting of face-to-face interviews and
questionnaire to determine the factors affecting the rbSC externally and those related

v
to the supply chain participants. The developed rbSC performance framework was
analyzed with Structural Equation Modeling rules. LISREL software was used, and
the outputs of LISREL were evaluated by relationing with the information obtained
from literature survey. The developed framework can be used to maximize both
effectiveness of the rbSC process and efficiency of time and cost related issues in the
rbSC. rbSC performance was associated with the project performance at the end of
the study to reach a higher-level scale.
The difference between the performance ratings obtained by self-assessment of
a participant and those obtained through assessment done by the others was used to
determine the affects of cultural issues on performance. Common reasons for the
lower performance were analyzed due to cultural context and recommendations were
set down for rbSC participants to solve the problems.
Keywords: supply chain management, construction industry, factors in rbSC, rebars,
culture in construction, LISREL.

vi
ÖZ
KÜÇÜK VE ORTA ÖLÇEKLİ FİRMALARDA
İNŞAAT DEMİRİ TEDARİK ZİNCİRİ KATILIMCILARININ
İNŞAAT DEMİRİ TEDARİK ZİNCİRİ PERFORMANSINA
ETKİLERİ
Zeliha Banu Yavuz
Doktora, Mimarlık Bölümü, Yapı Bilimleri
Tez Danışmanı: Doç. Dr. Soofia Tahira Elias-Ozkan
Eylül 2012, 187 sayfa
İnşaat sektöründe, yapım sistemleriyle yönetim sistemlerinin birbirine parallel
ilerlememesi ve sektörde etkin yönetim anlayışının kullanılmaması yapılan işteki
verimliliği düşürmektedir. Tedarik zinciri yönetimi, günümüzde imalat sektöründe,
ulusal ve uluslararası alanda rekabet gücünü korumak isteyen firmaların kullandığı
ve çok yarar sağladığı yaklaşım olmuştur.
İnşaat malzemelerinin toplam maliyet içinde önemli bir yüzdeye sahip
olmaları, inşaat projelerinin başarılarının malzemeye bağlı faktörlerden etkilendiğini
göstermektedir. Türkiye‟de inşaat yapımında yerinde döküm betonun yaygın olarak
kullanılıyor olması betonarme ile ilgili tedarik zincirlerinin önemini arttırmaktadır.
Betonarmenin bileşenlerinden biri olan inşaat demiri ve inşaat demirinin tedarik
zinciri (idTZ) çalışma konusu olarak ele alınmıştır.
Bu tezde literatür çalışmasından ve saha çalışmalarından elde edilen verilerle
inşaat demiri tedarik zincirine etki eden faktörlerin tedarik zinciri performansına
etkileri modellenmiştir. Modelleme yapısal eşitlik modelleme kuralları ile LISREL

vii
program ortamında çalıştırılmış, elde edilen sonuçlar yorumlanmıştır. Yapılan bu
çalışma inşaat demiri tedarik zincirini etkileyen faktörleri ve bunların ilişkilerini
gösterdiği için tedarik zincirinin performansını arttırmak için kullanılabilecektir.
Çalışmanın sonunda inşaat demiri tedarik zincirinin performansı proje performansı
ile ilişkilendirilmiştir.
Firmaların kendileri için yaptıkları performans değerlendirmeleri ve diğer
firmaların onlar için yaptıkları değerlendirmelerde çıkan fark, inşaat demiri tedarik
zinciri üzerinde kültür ile ilgili konuların etkisini araştırmada kullanılmıştır. Düşük
performans için ortak nedenler kültürel bağlamda incelenmiş ve tedarik zinciri
katılımcılarına karşılaştıkları problemleri çözmek için önerilerde bulunulmuştur.
Anahtar Kelimeler: tedarik zinciri yönetimi, inşaat sektörü, idTZ faktörleri, inşaat
sektöründe kültür, inşaat demiri, LISREL.

viii
To my parents,
my daughter Elif Duru and my husband İbrahim

ix
ACKNOWLEDGEMENTS
First of all, I would like to express my gratitude toward my advisor, Assoc. Prof. Dr.
Soofia Tahira Elias-Ozkan, for her invaluable support, guidance and encouragement
about my PhD career and special life. She was considerate and supportive. She has
always been a model for me not only with her academic character, but also with her
life perspective.
I would like to express my appreciation to Assoc. Prof. Dr. Arda Düzgüneş, Prof. Dr.
Murat Gündüz, Assoc. Prof. Dr. Ali Murat Tanyer, Asst. Prof. Dr. Cengiz Özmen
and Asst. Prof. Dr. Aslı Akçamete for their invaluable suggestions and comments.
I am indebted to my husband who is the champion of support. He has always been
with me along the endless nights and shared my anxiety.
I want to thank to Burak Doğruyol for his help with statistical analyses.
I would like to express my gratitude to the companies and their staff for their
cooperation during the data collection process of this study, for sparing time to
answer questions and for my interviews.
Last but never the least; I want to express my gratitude to my parents, my sisters and
my brother.

x
TABLE OF CONTENTS
PLAGIARI
ABSTRACT .......................................................................................................................... iv
ÖZ ...................................................................................................................................... vi
ACKNOWLEDGEMENTS .................................................................................................. ix
LIST OF TABLES ......................................................................................................... ….xiii
LIST OF FIGURES ............................................................................................................ xvi
LIST OF ABBREVIATIONS ......................................................................................... xviii
CHAPTERS
1. INTRODUCTION ............................................................................................................ 1
1.1 Argument ............................................................................................................... 1
1.2 Objectives ............................................................................................................... 3
1.3 Procedure .............................................................................................................. 4
1.4 Disposition ............................................................................................................. 5
2. SURVEY OF LITERATURE ........................................................................................... 6
2.1 Overview of Construction Industry ............................................................. 6
2.2 Supply Chain Management in Construction Industry .......................... 10
2.3 Factors impacting rbSC performance and project performance ..... 15
2.3.1 Contractor related factors ................................................................................. 16
2.3.2 AE company related factors .............................................................................. 18
2.3.3 Sub-contractor related factors ......................................................................... 19
2.3.4 Supplier related factors ...................................................................................... 20
2.3.5 External factors ...................................................................................................... 21
2.3.6 rbSC Performance ................................................................................................. 22
2.3.7 Project Performance ............................................................................................ 23

xi
2.4 Overview of Culture ............................................................................................. 24
2.4.1 Organisational Culture ............................................................................................ 28
2.4.2 Culture in Construction ........................................................................................... 30
2.4.3 Culture and Supply Chain ....................................................................................... 33
2.4 Structural Equation Modeling ......................................................................... 34
2.4.1 Definition of Terms............................................................................................... 36
2.4.2 Steps of SEM ............................................................................................................ 37
2.4.3 The Goodness of fit Criteria for Structural Equation Modeling ......... 37
3. MATERIAL AND METHOD........................................................................................ 39
3.1 Material .................................................................................................................... 39
3.2 Method ...................................................................................................................... 41
3.2.1 Tests of Hypotheses.................................................................................................. 44
4. DATA COLLECTED ...................................................................................................... 46
4.1 Information obtained through face-to-face interviews .......................... 46
4.2 Roles of the rbSC participants ...................................................................... 48
4.3 Theoretical framework developed ............................................................. 49
4.4 Development of factors used in the questionnaire ............................... 50
4.5 Evaluated project characteristics ................................................................ 56
4.6 Descriptive Statistics ....................................................................................... 57
5. RESULTS AND DISCUSSION ..................................................................................... 58
5.1 Comparative Statistics ..................................................................................... 58
5.1.1 T-test ............................................................................................................................... 58
5.1.2 Comparison of the assessments of performance ......................................... 67
5.1.3 Basic Difference Statistics for Three or More Groups (ANOVA) ............ 81
5.2 Confirmatory factor analyses of the measurement models............... 89
5.3 Analysis of Structural Model ...................................................................... 104
5.4 Test of Hypotheses ......................................................................................... 114
6. CONCLUSIONS AND RECOMMENDATIONS ...................................................... 119
6.1 Conclusions ...................................................................................................... 119
6.2 Limitations........................................................................................................ 124
6.3 Contribution of the study ............................................................................ 126
6.4 Recommendations for Contractors.......................................................... 127
6.5 Recommendations for AE companies ..................................................... 127

xii
6.6 Recommendations for Sub-Contractors ................................................. 128
6.7 Recommendations for Suppliers .............................................................. 128
6.7 Recommendations for Future Works ..................................................... 129
LITERATURE CITED .................................................................................................... 130
APPENDICES
A1. QUESTIONNAIRE ABOUT THE ANALYSIS OF THE IMPACTS OF THE
FACTORS ON rbSC PERFORMANCE ................................................................. 136
A2. İNŞAAT DEMİRİ TEDARİK ZİNCİRİ PERFORMANSINA ETKİ EDEN
FAKTÖRLERİN ANALİZİ ANKETİ .................................................................... 145
B. DESCRIPTIVE STATISTICS ................................................................................... 154
C. RAW DATA ................................................................................................................. 157
CURRICULUM VITAE ................................................................................................... 187

xiii
LIST OF TABLES
TABLES
Table 2.1 Comparison of the cultures (construction industry and
manufacturing industry)…………………………………….………….........31
Table 4.1 Role of rbSC participants……………………………..….....….….48
Table 4.2Factors studied in literature………………………..…….…...........51
Table 4.3 External factors……………………………..…………………..….54
Table 4.4 rbSC and project performance related factors ………………....….54
Table 4.5 Participant related factors ………………………………………....55
Table 5.1 Importance and performance levels for rbSC performance related
factors…………………………………………………………….…..……..59
Table 5.2 Importance and performance levels for project performance
related factors ……………………………………….……………..………..60
Table 5.3 Importance and performance levels for contractor related
factors ……………………………………………..……………………......61
Table 5.4 Importance and performance levels for AE company related
factors ……………………………………………..…………………….......62
Table 5.5 Importance and performance levels for sub-contractor related
factors………………………………………………………..........................64
Table 5.6 Importance and performance levels for supplier related
factors …………………………………………………….............................65
Table 5.7 Importance and performance levels for external factors……..........66
Table 5.8 Performance assessments of project evaluated by all
participants (Contractor and AE company).................................…………...78
Table 5.9 Performance assessments of project evaluated by all
participants (Sub-contractor).................................…......................………...79
Table 5.10 Performance assessments of project evaluated by all
participants (Supplier).................................…................................……….....80
Table 5.11 rbSC performance impact by project characteristics.....................82

xiv
Table 5.12 Project performance impact by project characteristics…..…........84
Table 5.13 Contractor related factors performance impact by project
characteristics ………………………………..............................................85
Table 5.14 AE company related factors performance impact by project
characteristics ……………………………………….…..……………….… 87
Table 5.15 Sub-contractor related factors performance impact by project
characteristics ……………………………………….…..……………….… 88
Table 5.16 Supplier related factors performance impact by project
characteristics ……………………………………….…..…………….…….89
Table 5.17 Fit indices for contractor related factors ………………….……...92
Table 5.18 Fit indices for AE company related factors ………………...…....94
Table 5.19 Fit indices for sub-contractor related factors ………………........95
Table 5.20 Fit indices for supplier related factors ………………………......98
Table 5.21 Fit indices for external factors ……………………………….....100
Table 5.22 Fit indices for rbSC performance factors ………………...….....101
Table 5.23 Fit indices for project performance factors ……………….........102
Table 5.24 Fit indices for proposed structural model …………..……..........104
Table 5.25 Fit indices for the parceled model ……………...…..……..........108
Table 5.26 Comparison of the fit indices for models ……………...…..…..110
Table 5.27 Factor loadings of sub-factors for the final model……………....112
Table 5.28 Fit indices for IV(Independent variable) model………………....115
Table 6.1 Critical success factors for rbSC ………………………………....121
Table 6.2 The relationships between rbSC indicators, determinants,
project characteristics and site location …………………….………….......122
Table 6.3 The relationships between main problem areas and their
reasons for contractor and AE company related factors…………….……...123
Table 6.4 The relationships between main problem areas and their
reasons for sub-contractor and supplier related factors……………….…....124
Table B.1 Legal status of the companies………………………..…….…....155
Table B.2 Type of the companies ………………………....…………….....155
Table B.3 Responsibilities of the respondents……………………………....156
Table B.4 Experience in years …………………….…………………….....156
Table B.5 Expertise areas of the respondent companies...…………...….....157
Table B.6 Annual turnover for the respondent companies ………...……....157

xv
Table C.1 Raw data for project characteristics and rbSC performance
related factors……………..………...……………............................……...159
Table C.2 Raw data for project characteristics and project performance
related factors………………………………….....................……………..162
Table C.3 Raw data for project characteristics and contractor
related factors…………………………………..….....…………..............165
Table C.4 Raw data for project characteristics and sub-contractor
related factors…………………………..………….……………..............170
Table C.5 Raw data for project characteristics and supplier
RelateDfactors…………………………………................……………......175
Table C.6 Raw data for project characteristics and AE company
related factors…………………………………….………...………...…...180
Table C.7 Raw data for project characteristics and external factors…........185

xvi
LIST of FIGURES
FIGURES
Figure 2.1 Construction industry supply chain (adopted from oracle.com.tr)..12
Figure 4.1 rbSC process and participants ......................................................... 46
Figure 4.2 Framework developed for defining the relationships between the
various participants related factors and their influence on the
performance of rbSC and overall project success..........................49
Figure 5.1 Performance assessments of contractor related factors ................... 70
Figure 5.2 Performance assessments of AE company related factors .............. 71
Figure 5.3 Performance assessments of sub-contractor related factors ............ 73
Figure 5.4 Performance assessments of supplier related factors ...................... 76
Figure 5.5 Impacts of sub-factors on contractor related factors with t-values
(before confirmatory factor analysis)………………………….......91
Figure 5.6 Impacts of sub-factors on contractor related factors with t-values
(after confirmatory factor analysis) ………………………………92
Figure 5.7 Impacts of sub-factors on AE company related factors with t-values
(before confirmatory factor analysis) …………...………………..93
Figure 5.8 Impacts of sub-factors on AE company related factors with t-values
(after confirmatory factor analysis) ………………………………94
Figure 5.9 Impacts of sub-factors on SUBCONT related factors with t-values
(before confirmatory factor analysis) ……………………………..95
Figure 5.10 Impacts of sub-factors on SUBCONT related factors with t-values
(after confirmatory factor analysis) ………………………………96
Figure 5.11 Impacts of sub-factors on supplier related factors with t-values
(before confirmatory factor analysis) ……………………..….….97
Figure 5.12 Impacts of sub-factors on supplier related factors with t-values
(after confirmatory factor analysis) ………………………….…..98
Figure 5.13 Impacts of sub-factors on external factors with t-values
(before confirmatory factor analysis) ………………………..…..99

xvii
Figure 5.14 Impacts of sub-factors on external factors with t-values
(after confirmatory factor analysis) ……………………….….…100
Figure 5.15 Impacts of sub-factors on rbSC performance with t-values
(before confirmatory factor analysis) …………………………...101
Figure 5.16 Impacts of sub-factors on rbSC performance with t-values
(after confirmatory factor analysis) ……………………………..101
Figure 5.17 Impacts of sub-factors on project performance with t-values
(before confirmatory factor analysis) …………………………...102
Figure 5.18 Developed structural model with path coefficients and
t-values (brackets). (Solid lines refer to significant relations, dashed
lines refer to insignificant relations at p<0.05
level…..………........................................................................…105
Figure 5.19 Parceled model with path coefficients and t-values (brackets)...109
Figure 5.20 Final model with path coefficients and t-values (brackets) .......111
Figure 5.21 Independent variable model with path coefficients and t values
(in brackets) .................................................................................114
Figure 5.22 Hypothesized model with path coefficients and t values
(in brackets) ................................................................................119

xviii
LIST OF ABBREVIATIONS
AE Architectural/Engineering
BOQ Bill of Quantity
B2B Business to Business
CAD Computer Aided Design
CFA Confirmatory Factor Analysis
CFI Comparative Fit Index
CONT Contractor Related Factors
CSC Construction Supply Chain
CSLP Construction Layout Planning
CS² Construction Supply Chain Simulator
EXT External Factors
GA Genetic Algorithm
GFI Goodness of Fit Index
HTML Hypertext Markup Language
MMAS Max-Min Anr System
NFI Normed Fit Index
PROJ Project Permance Factors
rbSC Re-bar Supply Chain
RCC Reinforced Cement Concrete
RMSEA Root Mean Square Error of Approximation

xix
SC Supply Chain
SCC Supply Chain Council
SCM Supply Chain Management
SUBCONT Sub-Contractor Related Factors
SCOR Supply Chain Operations Reference
SEM Structural Equation Modeling
SMEs Small and Medium Enterprise
SOAP Simple Object Access Protocol
SRB Supply Chain of Steel Reinforced Bars
SUP Supplier Related Factors
TÜİK The Turkish Statistics Agency
XML Extensible Markup Language
XSL Extensible Stylesheet Language
UDDI Universal Description, Discovery and Integration

1
CHAPTER 1
INTRODUCTION
In this chapter are first presented, under respective sub-headings, the argument
for and objectives of the study being reported on herein. Again under a dedicated
sub-heading, it continues with a brief overview of the general procedure followed in
its conduct and ends with a succint description of what is covered in each of the
remaining chapters, under the sub-heading titled “Disposition''.
1.1 Argument
The complexities, pitfalls and ordeals of the construction industry at large are
only too well known to its practitioners, worldwide. Yet no simple and
straightforward means of avoiding these at one go from the onset to the very end has
so far been developed and put into effect. As Kalu (2003) pointedly notes, the rate at
which the construction industry adopts “modern” management techniques
particularly in relation to the planning and execution of large projects continues to
be relatively low when compared to other similarly “complex” ones. As with almost
all other industries, one innocent obstacle that lies in the way of “progress” is the
diversity of the work force both white and blue collar involved in the process.
Another in some contrast to how it is in those others is the factor of location:
The simple fact that what is to be made becomes absolutely fixed in place once all
the „making‟ actually starts. There is no simple „production line‟ where everything
gets fitted as the „product to be‟ moves step by step on, to finally end up „on the
market‟. The production usually starts „on demand'. The situation in the construction
industry is almost impossible to manage effectively.
Be this as it may, Dubois & Gadde (2000) point out that a good number of
solutions both technical, (such as pre-fabrication and modularization) and
managerial (such as the `just-in-time' and the `total quality management'

2
systems)have nevertheless been proposed and put into occasional practice, albeit
with limited success.
One system that has emerged over the last two decades. According to Fotwe,
Thorpe and McCaffer (2001), strong claims to have finally “fit the bill “especially
where the construction industry is concerned has been called Supply Chain
Management (SCM). O'Brien (1998) describes this as a system that takes a holistic
view of all production activities-including those of autonomous units (sub-
contractors and the like) and seeks an overall optimization of these. This is in sharp
contrast to the more conventional approaches of planning and contracting that
merely seek to optimize individual activities.
Many authors (e.g., Bertelsen & Nielsen, 1997; Othman & Rahman, 2010)
concur that for the construction industry material costs account for roughly 50% of
overall cost. Labor coming in second at 30%, management and supervision third at
15% and heavy equipment last at 5%. Among the overall cost of all materials as
might go into any given building of a utilitarian nature, that with by far the greatest
share is devoted to making just one component, which itself also happens to be
almost completely hidden from view. The structure in Turkey, with the exception of
certain large-scale industrial and public buildings, fire codes prescribe this structure
to be in reinforced cement concrete (RCC). Statistical data from the Türkiye
İstatistik Kurumu (the Turkish Statistics Agency, TÜİK) shows that this amounts to
roughly 98% of all construction in terms of built floor area while of this total, about
93% consists of construction where concrete was placed in situ; in other words, with
the supply chain for both the reinforcement and for the concrete of the rcc
combination extending all the way to the site.
A perhaps more serious repercussion for the latter case is that the two
components are not independent of each other since no concrete can be poured until
all reinforcement called „re-bars‟ for short is in place. An aspect of even greater
import in this vein, i.e., use of in-situ concrete, that further extends the re-bar supply
chain (rbSC) arises from the additional site work brought on by way of what is
known as the `bending schedule'.

3
Even this brief overview immediately suggests that potentially large
economies of significant magnitude are reducing both waste of time and material in
the rbSC and most so for RCC buildings put up using the in-situ method of
construction. Be this as it may, a crucial aspect noted by Gunasekaran, Patel and
McGaughey (2004) is that not many construction companies have actually
succeeded in fully realizing this potential simply because they have failed to develop
the performance measures and metrics needed by the supply chain (SC) system for
maximization of both effectiveness and efficiency. Lee and Billington (1992) even
earlier observed that the discrete sites in a supply chain cannot contribute to such
maximization if each were to pursue goals independent of each other.
Such being the overall situation for RCC, by itself the most costly component
of building construction, it seemed only worthwhile to further pursue the matter, in
order to first define relevant factors for effecting rbSC. From this would then be
developed a more comprehensive checklist to serve as a framework for not just
rbSC, but also for the general case of all building components. This framework
would then have to be field-tested in terms of 'real' projects so as to demonstrate the
value of rbSC for the building industry in realizing the potential mentioned above.
As the evaluation of the rbSC related factors differ for importance levels and
performance ratings for self-assessment and the other participant‟s assessments, it
was noticed that there was a need to investigate. The main problem areas and the
causes behind them in cultural perspective. Specific cultural dimensions were
associated with the difference between the assessments of factors.
1.2 Objectives
In accordance with the salient points raised in the preceding section, the major
objectives of the study in question were to:
Review and evaluate current concepts and methods of SCM in the
building industry with its sub issues.
Determine rbSC process for SMEs (Small and medium enterprises);
Construct a framework that consists of rbSC performance and project
performance and participant related factors and their relationships;

4
Analyse the impacts of participant related factors on rbSC
performance;
Analyse the impacts of cultural dimensions of rbSC participants to
determine the causes of the problems in the chain;
Develop a model on the basis of Structural Equation Modeling (SEM)
to evaluate field data, as compiled by a purpose designed
questionnaire, and determine the impacts of rbSC indicators on rbSC
and project performance; and
Set down germane recommendations for the perusal of construction
participants in order to increase the efficiency of their SCM
procedures.
1.3 Procedure
In fulfilling the objectives cited above, the procedure adopted here inevitably
resolved itself into a number of discrete phases. The first of these covered a germane
literature survey on SCM and the associated performance measurement phenomena,
both for the general case and for the rbSC, in particular.
A preliminary field investigation was then done to determine the sample space
for those construction companies considered to be qualified respondees. This was in
preparation for the next phase-which consisted of a questionnaire survey and
informal face-to-face interviews with the sample companies on their evaluation of
proposed performance criteria.
Responses from the previous phase (data) were then compiled so as enable
evaluation by the SEM technique building up “the framework” mentioned above.
Self-assessment and other participant‟s assessments of participant related factors
were used to analyze the affects of culture on rbSC participant‟s behavior.
Conclusions were then formulated in order to implement specific aspects of the
revised model, as different cases warranted.

5
1.4 Disposition
There are five chapters to this report. This first, containing the argument, the
objectives and the procedure of the investigation along with this disposition, which
sums up what follows in the remaining chapters, gives a broad overview of its most
salient features.
The second presents a summary of literature on the construction industry at
large with subtopics of site management, materials management and supply chain
management, and the specific factors that have impacts on rbSC with the related
subjects to rbSC performance.
The third chapter is where a thorough description of study material as both the
physical setting and the potentials of this setting are provided, together with the
method used in first defining the study sample and then in arriving at results.
While the fourth sets out the data collected and five sets out specific results
obtained from the analyses described in the preceding chapter and discusses these in
view of its objectives and the reports in the literature. The sixth concludes the study
by summarizing its findings evaluates the significance of these and offers pertinent
and practical recommendations for future applications.

6
CHAPTER 2
SURVEY OF LITERATURE
This literature review covers a total of 87 sources and 3 websites. It consists of
topics related to construction industry in general, supply chain management in
construction industry, factors related to supply chain performance, culture in
construction and structural equation modeling.
2.1 Overview of Construction Industry
According to Vrijhoef and Koskela (1999) construction industry is a specific
type of project industry with certain peculiarities which influence the characteristics
of constructed products, ways of production and the industry itself. The peculiarities
of the construction industry were discussed in three topics by the same authors.
These topics are as below:
Site production: Product dependent organization on outdoor conditions.
One-of-a kind production: The uniqueness of the products according to
its location, environment and etc.
Temporary organization: The organizations usually formed as part of
the products constructed.
Harbhajan (2009) defined construction as a process of building infrastructures
which may be in the form of residential / commercial / institutional buildings, roads,
bridges, airports, and factories. The same author determined the resources to succeed
in the process of building infrastructures in six groups. These are;
construction materials,
man power-skilled and unskilled labor,
construction equipment-machinery,
power,

7
construction space,
funds.
Building projects are very complex, involving hundreds of parts and
components, mostly made or assembled on site usually without any standardization
(Lee, Kim, Cho and Kang, 2009). The features of construction products mentioned
by Vrijhoef and Koskela (2005) are immobility, complexity, long product life
cycles, high capital intensity, and high impact on surroundings. The same authors
further specified the most important characteristics of the industry as fragmentation
level and the low level of the efficiency.
Site management activities, construction planning and scheduling activities
and material related activities are the main topics that need to be taken into
consideration. Zhang, Ma and Cheng (2001) specified that site activities are not only
complex but also time-consuming. Site set-up is defined by Zhang et al. (2001) as
site space allocation for material storage, working areas, units of accommodation,
plant positions, general circulation areas, and also access and egress for deliveries
and emergency services. According to Zhang et al. (2001) construction site
management involves rational layout of site facilities, optimum usage of space, and
dynamic management of plants with three main issues in management, resource,
time and cost. The same authors specified that organizing, planning and managing
these resources influences security, machine running, material supply and power
supply which in turn influence the construction progress and its cost. On the other
hand Thomas, Riley and Messner (2005) specified resource planning (labor,
material, and equipment), time planning and space planning as the main concerns of
the site management.
For visual and intelligent management of the construction site Zhang et al.,
(2001) developed a 4D visualization construction site management by linking a
construction activity schedule to a 3D visualization model. By the way the site
managers can dynamically plan temporary facilities layout and control the use of site
space according to construction schedules or construction progress and relevant
resource requirement.

8
Zhongli, Nakagava and Kensei(2010) developed a construction site work
management system. It reduces the burden of input from mobile phones from the
viewpoint of user-centered design to eliminate the troublesome task of writing and
retyping data. By this system the foremen, the project manager, the engineers, the
workers at the head offices of the contractor and sub-contractors join together to do
the activities.
On the other hand Hinze (2008) defined planning as the process of defining
goals, developing strategies, and utilizing tasks, schedules and resources to attain
them. All construction projects require planning. They usually require their
designers and constructors to produce something large and unique over a long time
scale, in the open air, in a place where few or even no production facilities exist
before the project starts (Vrijhoef & Koskela, 2005). Hamzeh (2009) specified that
the term planning can be applied to the whole of a construction project, from
beginning to end, from inception and feasibility study to final commissioning and
handing over the completed works to the client. There are too many complex
considerations made during the clients and contractors planning process.
Mubarek (2010) defined scheduling as the determination of the timing and
sequence of operations in the project and their assembly to give the overall
completion time which shows the result that scheduling focuses on one part of the
planning effort. The same author determined the reasons of contractors scheduling
the projects as below:
To calculate the project completition date.
To calculate the start and end of a specific activity.
To coordinate among trades and subcontractors and expose and adjust
conflicts.
To predict and calculate the cash flow.
To improve work efficiency.
To serve an effective project control tool.
To evaluate the effect of changes.
To prove delay claims.

9
Key topics in scheduling of the projects are the completition of work, key
procurement and subcontracting dates and completition of various phases like;
construction, start up/commissioning, demobilization and project closeout (Douglas,
2009).
Several researchers deal with materials in the construction industry. Shmanske
(2003) specified that materials constitute a large proportion of the total cost of
construction and managing material related issues play a significant role in
enhancing the effectiveness of a contractor. Perdomo (2004) emphasized that
materials are one of the most important areas that require special attention while
creating a project's master plan as well as the daily construction progress. In the
study, the author developed a framework that identifies and describes all phases of
materials management with detail mappings of essential decisions such as type and
amount of material needed, place of material procurement, way of delivery and place
of storing on site.
Hellman and Gadde (1996) specified that purchased goods and services
account for more than two-thirds of total construction costs. Further they pointed out
the considerable amount of indirect costs in total, which are related to the materials
supply. Manufactured materials must be stored, transported and restored before it is
assembled or “consumed” at the construction site.
Navon and Berkovich (2005) divide the problems associated with materials
into two categories. The first group is about the problems related with the purchasing
and supply of materials (scheduling the supply of materials to the site, and disparity
between the order and the materials actually arriving to the site. The second group
problems are related to the logistics (monitoring materials on site, follow up the
movement of materials around the site and hauling of materials).
Perdomo (2004) points out that the procurement and purchasing activities are
important to minimize the waste of time, labor and money. Not finishing the
construction within the given duration in the contract results in penalties. Managing
the flow of materials delivered to the site and within the site by means of materials
handling is important to decrease the total time and cost. Warehousing activities

10
need taking care to minimize material wastage because of wrong site set up,
unsuitable storage conditions, double handling, theft and loss. Recording the arriving
and remaining materials timely and accurately is also important to decrease the
waste amount and prevent payment delays (Perdomo, 2004).
The material related problems mentioned above find solutions in the
definitions of supply chain management (SCM) offered by different authors. Stevens
(1986) defined the SCM as “a management system to synchronize the requirements
of the customer with the flow of materials from suppliers in order to affect a balance
between what are often seen as conflicting goals of high customer service, low
inventory management, and low unit cost”.
According to Monezka, Trent and Handfield (1998), SCM traditionally
separate materials functions to report to an executive responsible for coordinating
the entire material process, and also requires joint relationships with suppliers across
multiple tiers. The primary objective of SCM is to integrate and manage the
sourcing, flow and control of materials using a total systems perspective across
multiple functions and multiple tiers of suppliers”.
Similarly Jones and Riley (1985) noted that “SCM deals with the total flow of
materials from suppliers through end users''. Tan et al. (1998) stated that supply
chain management encompasses materials / supply management from the supply of
basic raw materials to final product. Min and Zhou (2002) defined a supply chain as
“a combination of two main processes which are material management (inbound
logistics) and physical distribution (outbound logistics) aiming to coordinate all
operations within the two main processes.
2.2 Supply Chain Management in Construction Industry
Vrijhoef and Koskela (2000) defined construction supply chain (CSC) with
three specific peculiarities. First one is related with the place of the activities
materialized - construction factory. Second is about the instability, fragmentation,
separation of the activities (e.g. design and construction process) in the supply chain.
The third one is about the procurement system of the supply chain that it is make-to-
order supply chain. Construction supplies chains characterized by the involvement

11
of many companies from a wide variety of types. A construction project involves a
diverse group of participants including contractors, architects, engineers, laborers
and developers (Issa, Flood and Caglasin, 2003).
Meng (2012) specified that a construction supply chain is more complex and
involves a larger number of key participants such as project client, consultants, main
contractor, specialist contractors and various suppliers. The author added that main
contractor is both supplier of project client and the customer of specialist
contractors. According to Mengs‟ (2012) point of view client-contractor relationship
is upstream while main contractor-specialist contractor relationship is downstream.
The planning and management of supply chains require properly specifying
the participating members and relationships among them. Cheng, Law, Bjornson,
Jones and Sriram (2010) determined that construction supply chains consist of
numerous participants and are complex in structure.
Xue, Wang, Shen and Yu (2007) defined CSC as consisting of all construction
business processes, from the demands of the client, conceptual, design and
construction to maintenance, replacement and eventual decommission of building,
and organizations and added that CSC is a flow of information, materials, services
and the flow of funds between client, designer, contractor and supplier.
SCs can be analyzed from different point of views to increase the effectiveness
and the efficiency of the process. Some authors concentrated on the areas of
improving business and supply chain processes, the technologies used during the
flow of process (Hong-Minh, Barker and Naim, 2001; Edum-Fotwe, Thorpe and
McCaffer, 2001). Some others specified the most important issues in SC as cost,
purchasing behaviour and sustainability (Proverbs and Holt, 2000; Ofori, 2000;
Dubois and Gadde, 2000). One other part that was frequently analyzed by the
authors was the participants of SCs, their relationships and their evaluation in the SC
(Akintoye, McIntosh, Fitzgerald, 2000; Briscoe, Dainty and Millet, 2001; Carter,
Smeltzer and Narasimhan, 1998).

12
In this section of the study, models developed for construction supply chain
are examined. Different models have been proposed for construction supply chain
focusing on different topics in SC.
The Oracle Company developed (www.oracle.com.tr) a framework (Figure
2.1) that includes the participants of construction supply chain and determined the
value adding participant groups in the chain. Types of relationships were also
determined in the framework by arrows presented with different line types. The
framework is developed for large size companies. The supply chains‟ for large
companies usually have more participant groups than supply chains formed by
SMEs. As it is seen in Figure 2.1 the process is mostly managed by the main
contractor, who in turn sub-contracts the separate work packages.
.
The Supply Chain Council (SCC) (1998), developed a framework called
Supply Chain Operations Reference (SCOR) modelling for supply chain
standardization, measurement, and improvement based on five key supply chain
processes which are plan, source, make, deliver and return. This model was used
both in manufacturing industry and construction industry.
Figure 2.1 Construction industry supply chain (adopted from www.oracle.com.tr)

13
Cheng et al. (2010) studied on construction supply chains. They used SCOR
frameworks and developed a performance monitoring framework. This framework
was adopted to service oriented areas. By this model participants relationships
within the structure of supply chain determined in a coordinated way.
Min and Bjornsson (2008) developed an “agent based Construction Supply
Chain Simulator (CS²) that leverages computer agent‟s technology for modelling a
virtual construction supply chain”. Material and information simulation can be done
by this simulator. Information was collected in a global repository. Each network
joint can just access to the information they required for their work process. The
contractors use this system through a web browser and order their materials from the
global repository.
London (2004) developed a construction supply chain model that accentuates
procurement activities within the construction supply chain. Strategic supply chain
procurement model is concerned with organizing and managing the assets along the
supply chain for effective leverage for the client against the interests of other
participants.
Perdomo (2004) developed a framework to identify and describe all phases of
materials management for an integrated, holistic view of all factors that affect the
total cost of materials and material shortages.
Huang (2003) developed a simulation model for a beam assembly line of steel
fabrication to organize the SCM in steel fabrication construction. A lineer regression
model is used to provide a more precise measured unit in the steel-manufacturing
phase.
Ericsson (2001) developed a simulation model of construction supply chain
called “chainsim” based on a large standard project data allowing cyclical activities.
The model simulated the site office, the construction site, the design offices, the
subcontractors‟ office and the transport company. The simulation demonstrated that
better scheduling and use of resources are the most important issues in the process.

14
Morledge et al. (2004) identified a number of problems within the UK
construction industry that come into being through the use of SCM as below:
Fragmentation of participants
Adversarial relations
Project uniqueness
Separation of design and production teams
Competitive tendering.
According to Bresnen (2007) SCM is underdeveloped in construction and
added that there is a need to develop learning and to move away from a project-
based mindset towards a supply-chain mindset.
The objective of supply chain management is determined as minimizing the
chain members total cost of manufacturing, materials, labor, transportation,
inventory, and information, for all parties concerned (Schary and Skjöt-
Larsen,1995). Different authors interested in different SCs in construction industry.
To reach the objective written above Ericsson (2001) pointed out the importance of
the relationships and the necessity of opening the companies‟ books to each other, to
compare the cost of each stage in the chain, and to strive jointly towards a minimum
cost for the whole. Below are some important studies done for construction SCM
which are helpful to provide an approach for rbSC.
Polat (2005) developed a simulation-based decision support tool for
contractors to assist them in selecting the most economical materials management
system by recommending buffer sizes, a scheduling practice, and lot sizes given the
special conditions of the project. The author focused on the supply chain of
reinforcing steel bars (rebar). Three case studies were taken into account to take
decisions about buffer size (large, medium, small) and scheduling practice
(optimistic, neutral or pessimistic) and lot size (large and small). In the case studies,
using the developed simulation-based decision support tool provided the contractor
with a cost saving of 4.2-7.3%.
Castro (2003) concentrated in the development of a business-to-business
(B2B) e-work solution for the integration of the supply chain of rebar. Supply chain

15
of steel reinforced bars (SRB) was analyzed and an e-Business solution was
developed for the integration of quantity take-off and procurement of SRB by using
HTML, XML, XSL and Javascript. The expectation and satisfaction for the B2B e-
work system determined to analyze the performance of the proposed B2B e-work
solution among the users (designer, contractor and rebar supplier). Electronic tools,
new approaches in information exchange and integration is composed in this B2B e-
work solution.
Tserng et al. (2006) developed a rebar supply chain model of a steel factory
that can be used by raw material suppliers, owners and steel factories. Optimization
of the process decrease the inventory cost.
Anson and Wang (1998) made a research to utilize the labor and equipment
resources in situ concreting of buildings in Hong Kong. Construction sites and ready
mixed plants were observed to obtain productivity information. Planting rates, pour
size, type of pour, supply of concrete have been studied and benchmarks have been
produces for Hong Kong and comparison with other countries with other countries
were made.
Although different researchers have analysed the SC for different materials to
increase the effectiveness of the process there is a gap in the area of developing a
model that consist of participants of rebar supply chain and their inter relationships.
Especially for SMEs. Therefore, this study focused on the performance of rbSC on
the role of participants in small and medium sized projects.
2.3 Factors impacting rbSC performance and project performance
This section focuses on the factors that have impacts on the rebar supply chain
(rbSC) performance and project performance in order to determine the participants
of the rebar supply chain. The factors studied in literature were analysed to
determine the factors that will be used in the questionnaire survey of this study. The
participants of rbSC for SMEs were determined through the literature survey and
through the evaluation of this literature survey with the contractors who were
interviewed before preparing the questionnaire. For this study the factors effecting
rbSC performance were grouped as participant related factors and external factors.

16
The main participants of rbSC are main contractors, who undertake the construction
of the project and are referred to as the contractor in this study; sub-contractors,
suppliers and AE companies. The information gathered from literature for the factors
determined were summarized in the following sections.
2.3.1 Contractor related factors
Polat (2005) specified the contents of the activities of rbSC with the designing,
detailing, reckoning, milling, fabricating, delivery and assembly. The details that
were written under the activities were analysed according to the doer of the activity
by the help of the interviews. The activities of contractors in rbSC can be listed as
follows:
Analyzing the projects (architectural, mechanical, electrical),
Preparing quantity surveys,
Prepare the order according to master supply schedule,
Prepare the procurement process of rebar,
Negotiate with the rebar fabricator and approve it,
Control the installed rebar,
Plan and manage the financial issues about the procurement of
suppliers and sub-contractors (Polat, 2005).
Problems related to managing the flow of materials can be found in every
organization. Materials account for a big part of products and project costs
(Perdomo, 2004).
Past experience of the contractor is an important variable for measuring
performance. Past performance focuses on the quality of the contractor's past work.
Holt, Olomolaiye and Harris (1994) specified that contractors past experience in
terms of size of the projects completed plays an important role in the overall
satisfaction of the client with the construction projects.
Briscoe et al. (2001) specified the issues related to problem solving in
construction industry with the words of “Problem solving often involves a set of
specific knowledge-based abilities to overcome design, production, and plant and

17
transport difficulties. Many SME companies, which engage in highly specialized
activities, are likely to exhibit strong skills in these areas, but often such skills will
have been acquired through learning-by-doing.“ (Briscoe et al., 2001)
A number of attributes that will affect contractor related factors, including
insurance cover, operating and machinery, communication system, efficiency of
cash flow methods are related to the economic power of the contractor and have
affects on SC success (Chan et al., 2004).
Palaneeswaran, Kumaraswamy and Zhang (2001) identified a generic source
selection process among those „competent‟ and „credible‟ applicants whose
performance can be expected to best meet the clients‟ requirements. In this paper
source selection processes along different construction supply chain routes were
examined. Source selection was used as a generic term including the selection of
contractor, suppliers, vendors and design builders. To reach the best performance by
the determined source selection was the main aim in the paper. Past experience, past
performance, financial capabilities (annual turnover, net tangible assets, liquidity),
quality concerns (ISO 9000 certification), organization and management system
(documentation system, communication system, project management, design and
construction control, organizational structure, organizational culture, staff
motivation, staff training, materials management), team relationships, technology
using capacity (specialized equipment), insurance cover (coverage of defects
liability, coverage of workers, coverage of damages/injuries), equipment (ownership
of equipment), human resources (qualification and amount of qualified managers),
partnering (partnering experience and performance), location of the head office are
the measures used in the framework developed by Palaneeswaran et al. (2001) to
reach best source selection in the supply chain that consists contractor, designer,
sub-contractor and vendor.
A wide range of generic skills in use across all industrial sectors was
formulated by the recent British Skills Survey (Ashton, Davies, Felstead and Green,
1999). Briscoe, Dainty and Millet (2001) examined the skills requirements necessary
for effective supply chain partnerships in accordance with the British Skills Survey
in the construction industry. The skills related to contractors are;

18
Client-contractor relationships,
Planning and problem solving capability of the contractor (work scheduling-
networking, trouble shooting and problem solving),
Manual skills of the contractor (operating and machinery).
2.3.2 AE company related factors
Analyzing technical documents, preparing pre-designs, structural design of the
project, preparing detailed cut and bent rebar drawings, preparing design changes
were specified as the AE companies workloads in rbSC by Polat (2005). Specialized
expertise of design team, their usage of information and CAD technologies, their
organizational culture to form a coordination with the other participants and working
related with work schedules to prevent design delays were assessed as important
points in the survey as Palaneeswaran et al.(2000) mentioned in their paper.
With the use of internet, data can be exchanged effectively in spite of
geographic constraints. Web-based technologies developed such as Extensible
Mark-up Language (XML), Simple Object Access Protocol (SOAP), Universal
Description, Discovery and Integration (UDDI) and e-work, the Internet provides a
suitable platform for the success deployment of e-Business in the construction
industry (Castro, 2003).
Formal and informal design communication, design completeness in the
beginning of construction process, level of modularization, level of automation and
design control meetings are some of the critical success factors determined by Kog
and Loh (2012) that are related to instructiveness of the design group.
Skill requirements for designer participants in construction supply chain are
collected under design communication heading (Briscoe et al., 2001). The authors
emphasize that design companies need to communicate effectively with those other
participants and transfer drawings and details in the supply chain by using computer
technology.

19
2.3.3 Sub-contractor related factors
Chun et al. (1999) defined project participants as the key players, including
project manager, client, contractor, consultants, sub-contractors, supplier and
manufacturers. The rebar sub-contractors duty can be summarized as to prepare the
rebar according to the technical drawings and place the cut and bent rebar in
formwork (Polat, 2005). Their duty starts just after the excavation of the site.
Briscoe et al. (2001) explored some skills for the participant of the supply chain for
more efficient supply networks. For sub-contractors, skills to increase the efficiency
were divided into two main categories: “hard” skills of vocational nature and “soft”
skills which are generic and are applied most commonly in non-manual works.
Skills related to sub-contractors that were determined by Briscoe et al. (2001)
for effective supply chain partnerships in the construction industry are as follows:
Writing and reading skills: Managers of the participants of the supply
chains do not have further and higher education qualifications.
Writing/reading technical documents are essential for successful
partners.
Teamwork: Leadership and motivation of workforce are critical for
success of the groups. For smaller companies that take role in the
supply chain having managers that have ability to lead their staff
through the process and achieve good relationships within their
working groups is very important.
Gunasekaran, Patel and Mc Gaughey (2004) specified the importance of
performance measurement and metrics in setting objectives, evaluating performance.
The authors developed a framework to promote a better understanding of importance
of SCM performance measurement and metrics. Performance measures and metrics
were presented considering the four major supply chain process (plan, source,
make/assemble/ and deliver) in this study. Percentage of defects, capacity utilization,
was two metrics used under make/assemble activities.
Hanafi, Khalid, Razak and Abdullah (2010) identified the main factors
influencing labor productivity in the operation of the installation of prefabricated

20
components at construction sites. The authors used 42 factors to assess the labor
productivity and identified the most important factors as follows:
Planning and scheduling of work
Availability of machinery and components
Project design team professionalism
Competency of site supervisor
Skilfulness of workforce
Availability of precise tools and workforce
Adequate information and implementation control level of fixing the
component at construction sites.
Jiukenetal (2009) identified 83 factors affecting construction labor through two
latent variable groups. The first group was related to direction, coordination,
engineering and drawing management, construction equipment and material. The
second group consists of project management related factors, foremen competency,
training, worker qualification.
2.3.4 Supplier related factors
Suppliers play important roles in supply chains. Perdomo (2004) specified the
relationship between the contractor and supplier crucial for the success of a project.
He added that the good relationship with the suppliers, increase the expectation of
better prices and more reliable delivery dates. Good relationships are important for
lower costs. Ordering materials with lower prices without problem is possible on
good terms. On the other hand bad relationships caused late and wrong deliveries
which effect the total cost and completion day of the product.
Capability of supplier, competency of supplier‟s proposed team, supplier team
turnover rate, supplier top management support, supplier track record, suppliers‟
level of service are the supplier related success factors determined by Kog and Loh
(2012).
Price stability, total cost, failures prevention, appearance and function, on time
delivery, technical assistance and support, cooperation and communication, buyer-

21
supplier relationship, capability, reliability, flexibility, payment terms, reputation,
and past records were the criteria developed for an effective and efficient material
supplier selection for property developers by Lam, Tao and Lam (2010). The model
was used for four material purchases for validation and the results revealed that the
model can be adopted in construction materials supplier selection by the property
developers.
As mentioned under sub-contractor related factors, Gunasekaran et al. (2004)
developed performance related metrics related to four supply chain activities. The
metrics specified under source and delivery activities were mostly related to the
suppliers. “Supplier delivery performance, supplier lead-time against industry norm,
supplier pricing against market, efficiency of purchase order cycle time, efficiency
of cash flow method were the metrics defined for source activities. Quality of
delivered goods, on time delivery of goods, effectiveness of delivery invoice
methods, number of faultless delivery notes invoiced, percentage of urgent
deliveries, delivery reliability performance were the metrics defined under delivery
process.” (Gunasekaranet al.,2004)
Briscoe et al. (2001) determined supplier communication as a skill
requirement for effective supply chain in the construction industry. Since the
profitability of the companies in the chain determined by the ability to obtain
supplies of right quality, on time at the most favoured prices purchasing and order
chasing and product knowledge were found to be important attributes.
2.3.5 External factors
Chan and Chan (2004) specified the importance of “environment” since it has
an effect on project performance. In their papers, the authors described
“environment” as all external influences on the construction process, including
social, political, and technical systems. The variables used to measure this factor
were specified as economic, social, political, physical, industrial environment and
the level of technology advanced (Chan and Chan, 2004).
Kog and Loh (2012) determined different critical success factors (CSFs) for
different components of construction projects as perceived by different professions.
22
Political risk, economic risk, approval authorities and legal issues related risks are
the ones related to external issues.
2.3.6 rbSC Performance
Gunesekaran et al. (2001) specified that the efficiency of the process is one of
the key factors of SC, the amount of missing / wrong / damaged / defective products
are important to minimize the unit cost of the product. To increase the profitability
of the project the amount of missing/wrong/damaged/defective products should be
low.
Responsiveness to customers is about the time between the demand and its
delivery to the customer. It is important for customer satisfaction and schedule
performance of the project (Chen et al., 2004).
Kumar et al. (2006) specified the importance of the flexibility in supply chain.
The authors added that flexibility is mandatory for company‟s competitiveness and
saw flexibility as a reaction to environmental uncertainty. On the other hand Upton
(1994) specified flexibility as “the ability to change or react with little penalty in
time, effort, cost or performance”. Supply chain flexibility was analysed in three
topics. The first one was about the product flexibility which was about the ability to
customize product or service to meet customer specification. Second one was the
volume flexibility that was about the ability to adjust capacity to meet changes in
demand. And lastly new product flexibility was deal with the ability to rapidly
introduce new products (Agus, 2011).Volume flexibility is important for all of the
SC participants, as it is about the ability to increase and decrease the production or
material amount. New product flexibility is mostly related to the AE companies as it
deals with the ability of planning, producing new projects (Agus, 2011).
Frohlich and Westbrook (2001) classified supply chain integration into two
types. Coordination and integration of the suppliers, manufacturers and customers
for the flow of materials was in the scope of the first type. The second type was
about the backward flow of information from customers to the raw material
manufacturers. Stock et al. (2000) analysis supply chain integration with the groups
take part in.

23
Lee (2000) suggested three key dimensions that constitute supply chain as;
1. Information integration (sharing information and knowledge among
supply chain members),
2. Coordination (redeployment of decision making authority, work and
resources),
3. Organizational linkage (tight organizational relationships with
supplier).
Stock et al. (2000) analysed SC integration for both information flow and
collaboration of the participants. Good communication and information flow are the
keys to the effectiveness of the execution of integration. SC integration is important
for measuring the level of the SC strategy perception. As it is difficult to implement
a SC system with its rules, competitive advantage through other companies in the
sector will be the result. Without integration, each company will continue to
maximise the achievement of its own objectives (Qrunfleh, 2010).
2.3.7 Project Performance
Chan and Chan (2004) specified that process success should be estimated
according to its confirmatory to the specifications determined for the project.
Reaching to the specified outcomes is an ultimate goal for every project. Different
researchers determined different factors to measure project success. According to
Parfitt and Sanvido (1993) “success is an intangible perceptive feeling, which varies
with different management expectations, among persons with the phases of the
project.”Chan and Chan (2004) specified some basic criteria for project success as
cost, time and quality. Pinto and Pinto (1991) add project psychosocial outcomes
like satisfaction of interpersonal relations and satisfaction of the participants with the
outcomes to the measures of project performance. Subjective measures such as
participants‟ satisfaction level are known as “soft” measures (Chan &Chan, 2004).
Kometa, Olomolaiye and Harris (1995) used a more comprehensive approach
to assess project success by including safety, economy (construction cost),
running/maintenance cost, time and flexibility to users. Kumaraswamy and Thorpe
(1996) included meeting budget, schedule, quality of workmanship, client and

24
project manager‟s satisfaction, transfer of technology, friendliness of environment,
health and safety to the basic measures (time, cost and quality).
Atkinson (1999) divided the project in two stages to assess the project success.
The first stage namely, delivery stage the measures were defined to reach the aim
“doing it right”. This aim consisted of cost, time, quality and efficiency. Then, in the
first post delivery stage the aim is “getting it right” with the meaning of benefitting
all stakeholders. In the second post delivery stage the aim is “getting them right” that
pointed the customer and success of business.
2.4 Overview of Culture
Baskerville (2003) pointed out the difficulties in giving a specific definition
for the term “culture” since the points of views differ for different disciplines.
Hofstede and Hofstede (2005) defined culture as the collective programming of the
mind that distinguishes the members of one group or category of people from
another. On the other hand Maloney and Federle (1991) defined culture as „„the set
of assumptions shared by members of the organisation about the desired and
appropriate behaviours, including how these assumptions are reinforced and how
they are communicated to members, old and new‟‟.
According to Hofstede and Hofstede (2005) there are four terms that covers
the total concept to describe cultural differences. These are symbols, heroes, rituals
and values. Symbols are used for the words, gestures, pictures, or objects that have a
meaning only recognized by those who share the culture. Heroes are defined as the
persons, alive or dead, real or imaginary that serves as models for behaviour. On the
other hand, rituals are collective activities to reach desired ends within a culture.
Finally, values are defined as the broad tendencies to prefer certain states of affairs
over others.
A different statement was that “culture involves at least three components:
what people think, what they do, and the material products they produce. Thus,
mental processes, beliefs, knowledge and values are aspects of culture. Culture also
has several properties: it is shared, learned, symbolic, transmitted cross-

25
generationally, adaptive and integrated.” (Bodley, 1994). Bodley (1994) also added
that a human can learn culture.
Group property instead of individuals, dealing with emotions and intellect,
sharing experiences of groups from the history, using symbols, changeability
because of the changing circumstances of groups, fuzziness because of
contradictions, paradoxes, ambiguities and confusion are the aspects identified by
Cameron and Quinn (2005) that are widely concurred by the researchers studied on
this issue.
Ankrah and Langford (2005) pointed out the different culture dimensions
mapping the cultural differences. They did this by values and practices adopted by
the organization. Hofstede and Hofstede (2005) defined a dimension as an aspect of
a culture that can be measured relative to other cultures.
The survey administered by Hofstede between 1967-1973 was answered by
the respondents more than fifty countries which meant that a large sample. First of
all four basic problem areas corresponding to four dimensions were defined. After
some research Hofstede (2001) added the fifth dimension to his study. The five
dimensions developed by Hofstede are described below (Hofstede and Hofstede,
2005).
Power distance: The equality between the members of the institutions or
organizations is the main expectations for the countries. The family, the
school and community are the groups that can be specified under institutions
and the spaces where the people work can be specified under organization
term.
Collectivism versus individualism: Individualism refers to weak
interrelations for individuals and collectivism refers to strongly related
individuals or groups.
Femininity versus masculinity: Masculine society is the one which there is a
distinction between man and women and on the other hand in femine
societies the roles are overlapped for the genders (Hostede and Hofstede,
2005).

26
Uncertainty avoidance: The essence of uncertainty is related to the
subjective experience of a feeling.
Long-term versus short-term orientation: In long-term orientation future
related issues are important. On the other hand, short-term orientation deals
with the past and present issues.
Another well-known classification used in the business world is done by
Trompenaars (1993). According to the results gathered from a survey conducted in
39 countries, a seven dimensions group was developed to differ the values between
cultures. These dimensions are:
1) universalism versus particularism,
2) individualism versus communitarianism,
3) diffuseness versus specificity,
4) affectivity versus neutrality,
5) achievement versus ascription,
6) relation to nature and
7) time orientation.
The universalism-particularism dimension addresses the significance of rules
versus relationships. People in universalistic cultures believe general rules, codes,
values, and standards take precedence over particular needs. The law is considered
more significant than human-being‟s relationships universalistic cultures.
Particularistic cultures view the ideal culture in terms of human friendship,
extraordinary achievements, and intimate relationships (Trompenaars and
Woolliams, 1999).
As for the individualism versus communitarianism dimension, people in
individualistic cultures are more concerned about their personal growth.
Communitarianism cultures are more concerned about the overall good of the group
(Trompenaars and Woolliams, 1999).
Specific individuals concentrate on hard facts, standards, and contracts. In
diffusely-oriented cultures, all relationship elements are related to each other.
(Trompenaars and Woolliams, 1999).

27
The affective versus neutral dimension deals with emotions‟ concealing or
showing. In an affective culture, people do not object to the display of emotions. In a
neutral culture, it is incorrect to express feelings overtly (Trompenaars and
Woolliams, 1999).
The inner- directed versus outer-directed dimension explains the differences
in perception to whether people control the environment or vice versa. The way
people relate to their environment is linked to how they control their own lives and
destiny. Internalistic people see nature as a complex machine controlled with the
right expertise. They do not believe in luck or predestination. Externalistic people
see mankind as one of nature's forces, so they should operate in harmony with the
environment. They do not believe they can shape their own destiny. Dilemmas
arising include being driven by conscience or responding to outside influence and
creation of one‟s own strategy or diffusing with others (Trompenaars and
Woolliams, 1999).
The sequential versus synchronic time dimension describes if things are
completed one after the other or altogether. Every culture has developed its own
response to time. In a sequential approach, time moves forward in a straight line
with one thing achieved at a time. Time commitments are a must and plans are rigid.
In a synchronism approach, time moves round in cycles, with people doing several
things at a time. Time is flexible and plans are easily changed to complete
interactions satisfactorily. Promptness depends on the type of relationship
(Trompenaars and Woolliams, 1999).
The third important study on culture was done by Schwarts (1999). Schwartz
(1999) identified seven types of values, structured along three polar dimensions.
These are;
conservatism versus intellectual and affective autonomy,
hierarchy versus egalitarianism,
mastery versus harmony.
Conservatism was defined as a cultural emphasis on maintenance of the
status, propriety, and restraint of actions and inclinations by Schwartz (1999). With

28
this definition one pole of the first dimension is related to the cultures in which the
person is viewed as an entity that is embedded in the collectivity and find meanings
through social relations. Autonomy in the first issue was defined as a cultural
emphasis on the desirability of individuals independently pursuing their own ideas
and intellectual directions by Schwarts (1999). The opposite pole in the first
dimension is related to the cultures in which the person is viewed as an autonomous,
bounded entity who finds the meaning in his or her own uniqueness. Hierarchy was
defined as the cultural emphasis of the legitimacy of an unequal distribution of
power, roles and resources by Schwarts (1999). The pole related to hierarchy uses
power differences relying on hierarchical systems. On the other hand egalitarianism
was defined as a cultural emphasis on transcendence of selfish interests in favour of
voluntary commitment to promote the welfare of others by the same author.
Opposite to hierarchy in egalitarianism basic interests and resources are shared. In
mastery the aspiration to change the world through active self assertation rather than
trying to fit as it was in harmony is the main issue (Schwartz, 1999).
The Global Leadership and Organizational Behaviour Effectiveness (GLOBE)
research project focuses on relationships between societal culture, organizational
culture and leadership (Hostede, 2001). Power distance, uncertainty avoidance,
social collectivism, in-group collectivism, gender egalitarianism, assertiveness,
future orientation, performance orientation, and humane orientation are the nine
dimensions that the project consists.
2.4.1 Organisational Culture
Culture within organizations is reflected in the way that people perform
tasks, set objectives and administer the necessary resources to achieve objectives.
Culture affects the way that people make decisions, think, feel and act in response to
the opportunities and threats affecting the organisation (Thompson, 1993).
Hofstede and Hofstede (2005) indicated that organizational culture has
become as fashionable a topic as organizational structure, strategy and control and
added that most definitions related to that topic consisted of the issues as holistic
(referring to a whole more than the sum of its parts), historically determined
(reflecting the history of the organization), rituals, symbols, socially constructed

29
(created and preserved by the group of people who together form the organization),
soft and difficult to change. With the help of these issues the authors defined
organizational culture as the collective programming of the mind that distinguishes
the members of one organization from another.
According to Hostede and Hofstede (2005) national cultures are part of the
mental software we acquired during the first ten years of our lives, in the family, in
the living environment, and at school. On the other hand they pointed out that the
organizational cultures are acquired when we enter a work organization.
Every organization has its own culture or shared systems of meanings that
differentiate its members from other organizations‟ members (Hofstede and
Hofstede 2005). Hofstede et al.‟s (1990) organizational culture dimensions are
defined as follows (Hofstede, 1998):
1. Process-oriented versus results-oriented is related to the peoples‟ behaviour
to risky situations. In process-oriented cultures the main aim is to avoid the risks but
in result-oriented cultures, people perceived themselves as comfortable in unfamiliar
situations and as putting in maximal effort;
2. Employee-oriented versus job-oriented culture is related to the value given
to the employee. In employee-oriented cultures organizations took a responsibility
for employee welfare. Oppositely in a job-oriented culture to complete the job is the
first aim.
3. Professional versus parochial culture is about the level of members feeling
of organization‟s norms covering their behaviour. Parochial culture member‟s
behaviour usually covered with their organization‟s norms both at home and on the
job. On the other hand professional culture members considered their private lives
out of the job;
4. Open system versus closed system is about the openness of the organization
to a new employee. Open system cultures help the new employee to feel at home but
in closed system cultures the organization and its people are secretive, only very
special people fitted into the organization;
30
5. The loose control versus tight control dimension refers to the tightness
degree of the organization. In loose control units the thought of cost, meeting times
were only kept approximately and jokes were frequently made. In tight control units
the work is cost conscious, meeting times were kept punctually, and jokes were rare.
6. The normative versus pragmatic dimension deals with the popular notion of
customer orientation. Pragmatic units were market-driven whereas for the normative
units the major emphasis was on organizational procedures which were more
important than results.
Cameron and Quinn (2005) determined four types of organizational culture
based on two dimensions. The first dimension distinguishes effectiveness criteria
that emphasises flexibility and dynamism from criteria that emphasise stability order
and control. The other dimension differentiates effectiveness criteria that emphasise
an internal orientation, integration and unity from criteria that emphasise an external
orientation. Cameron and Quinn (2005) defined four clusters of criteria to make
judgments about organisations. These are clan, adhocracy, hierarchy and market.
2.4.2 Culture in Construction
There is a growing interest in the studies on the culture of the construction
industry, projects, and the effects of culture and cultural differences on construction.
According to Harvey and Ashworth (1993) the construction industry has different
from all other industries. The special characteristics that are seen in construction are
listed below:
the nature of the product done;
make-to- order product;
unique;
temporary organisations;
organisation structure and price determination in the industry.
Burthorpe, Duncan and Miller (2000) studied the subject of “culture” in
literature, the construction industry culture view. The issues related to crisis,
conflict, masculinity and embracing a casual approach to the work norms of
punctuality, commitment and safety were come front for construction culture.

31
Architects, surveyors and clients were found to have significant roles in the culture
of the construction industry.
Ngowi (2000) discussed the effects of cultural differences between the TQM
approach and the cultural context at both industry and national levels. Botswana
construction industry was analyzed to determine the implementation of TQM with
cultural characteristics. At the end it was indicated that TQM implementations
usually conflicts with the national culture.
Brockmann and Birkholz (1999) evaluated the professional culture of civil
engineers and mechanical engineers and specified that two professional cultures are
as distinctively different as their organization, their management and their
technology. By the interviews administered with construction industry members and
automobile industry members, the authors identified that there are significant
differences between these two industries. The comparison done for two industries
due to culture is shown below.
Table 2.1 Comparison of the cultures (construction industry and manufacturing
industry)
Culture
Construction industry Manufacturing industry
Not well defined Well defined
Highly communicative Little communicative
Result oriented Process oriented
Professional Organizational
Pragmatic Normative
Rahman, Kumaraswamy, Rowlinson and Sze (2003) indicated that
improving internal critical success factors of construction companies provide
harmonious work among parties in the chain and build required project cultures both
for short term project success and for long term organizational and industry
improvements. They specified the key requirements as the “flexible organizational
cultures” of the involved organisations.

32
Ankrah (2007) developed a theoretical model including the relationship
between organizational culture and performance of the construction industry.
Lorenz and Marosszeky (2007) addressed cultural issues in global
construction sector and determined the differences in technical and cultural practices
between markets, knowledge of local regulations and practices which are important
for success of global construction businesses.
Ankrah and Proverbs (2008) analysed the impacts of factors on culture of a
construction project organization through the data obtained from 64 questionnaires
filled by the experienced practitioners in the construction industry in UK. Five
principal cultural dimensions were developed. These dimensions were workforce
orientation, performance orientation, team orientation, client orientation and project
orientation. The results revealed that these five dimensions are associated with some
project characteristics like project size, complexity, influence of participants like the
quantity surveyor, client and main contractor, level of importance of cost, health and
safety, location.
Yazıcı, Giritli, Oraz and Acar (2007) examined the cultural profile of
construction organizations within the context of Turkish construction industry. The
authors developed a questionnaire based on Organizational Culture Assessment
Instrument (OCAI) which was developed by Cameron and Quin (1999) and
collected data from 134 construction companies. The findings in this study revealed
that the Turkish construction industy has been dominated by firms with a mixture of
clan and hierarchy cultures. Moreover, the the results specified that type, size, age of
the firm cause differences at organizational level.
Ozorhon, Arditi, Dikmen, Birgonul (2008) analyzed the effect of cultural
similarity/difference for international joint ventures (IJV). The results of this study
revealed that differences in organizational culture have an impact on IJV
performance with the view point of national and organizational characteristics of
partner companies.
Kıvrak (2010) investigated the effects of cultural differences on management
practices of Turkish construction companies. By examining cross-cultural

33
knowledge management applications in these projects and observed that national
culture differences have a direct affect on some project management practices like;
knowledge management, time management, human resource management,
negotiation and contract management.
In the scope of this study, culture is used for evaluation of the assessments of
the projects. The effects of cultural related issues were not analysed for participants
of supply chains in the previous studies. It was seen that the performance of
participants in supply chains within the construction industry has not been analysed
from the point of view of cultural aspects & attitudes. In this study the survey data
was used to highlight culture in construction.
2.4.3 Culture and Supply Chain
McAfee, Glassman and Honeycut (2002) provided a guidance to effectively
implement human resource management (HRM) policies that result in the desired
logistical and supply chain strategies. To reach this aim cultural characteristics of the
SC participants and their relationships were examined. The result of this study
revealed that the internal consistency between culture and HRM policies is a pre-
requisite for the conscious development of a successful supply chain strategy.
Moreover they drew up the difficulties in providing consistency as follows:
Shared attitudes, beliefs and patterns of behaviour develop over a long period
of time and as a result don‟t change quickly.
Some managers are less capable of implementing HRM policies to their
companies.
A firm‟s culture is effected from different factors (external pressures, internal
potentials, responses to critical events).
Yunus and Tadisina (2010) proposed organizational culture as a potential
determinant of supply chain integration effectiveness and investigated the impact of
different types of organizational culture (group, developmental, hierarchical and
rational) on supply chain integration. Flexibility-control orientation and internal-
external focus were the dimensions of culture and logistics synchronization,
information sharing, incentive alignment and collective learning were the

34
dimensions of supply chain integration used in study done by Yunus and Tadisina
(2010). The results of study revealed that developmental culture is the most effective
one in implementing supply chain integration.
Burtonshaw-Gunn and Ritche (2007) examined the impacts of cultural norms,
behaviour and practices on supply chain management and propose actions to
overcome barriers to successful implementation of supply chain management in
construction industry.
2.5 Structural Equation Modeling
Ullman (1996) defined structural equation modeling (SEM) as follows:
“SEM is a collection of statistical techniques that allow a set of relationships
between one or more independent variables, either continuous or discrete, and one
or more dependent variables, either continuous or discrete, to be
examined.”(Ullman, 1996)
Tabachnick and Fidell (1996) specified the advantages to use of SEM as
examining the relationships among factors free of measurement error and examining
complex relationships.
The differences between statistical data analysis techniques such as regression
analysis, ANOVA, ANCOVA, time series analysis, panel data analysis, factor
analysis, simultaneous equation systems, and SEM are the scales of dependent and
independent variables and configurations of how they are organized to mimic the
structure behind observed covariance (Tabachnick and Fidell, 1996). SEM deals
with the covariance among the measured variables or observed sample covariance
matrices. Hair et al. (1996) also specified that SEM could handle multiple
hypothesized relationships simultaneously.
The measurement model and the structural model are the two components of
structural equation modeling (Byrne, 1994). The measurement model is the
component of the general model in which latent variables are prescribed It describes
how well the observed variables serve as a measurement instrument for the latent

35
variables Confirmatory Factor Analysis (CFA) can be used for measurement models.
There are straight arrows from the latent variables to their respective indicators and
also straight arrows from the error and disturbance terms to their respective variables
(Tabachnick and Fidell, 1996).
CFA used to determine if the number of factors and the loadings of the
observed variables on them conform to what is hypothesized. In CFA, a certain
number of factors are specified along with which factors are correlated, and which
observed variables measure each factor (Schumacker and Lomax, 2004). The factor
loadings are the correlation coefficients between the variables and factors. The
squared factor loading is the percent of variance in that variable explained by the
factor. Variance percentage in all the variables accounted by each factor can be
found by adding the sum of the squared factor loadings and divide by the number of
variables. This is the same as dividing the factor‟s eigenvalue by the number of
variables.
The Cronbach‟s alpha value is used to test the extent to which multiple
indicators for a latent variable belong together. The range for Cronbach‟s alpha is
between 0 to 1. The minimum value recommended by Nunally (1978) for it is 0.70.
A higher value indicates higher reliability of the scale used to measure the latent
variable.
The structural model is the component of the general model that prescribes
relations between latent variables and observed variables that are not indicators of
latent variables (Hoyle, 1995). Direct and indirect relationships among latent
variable that describe the amount of explained and unexplained variance can be seen
in the structural model. Schumacker & Lomax (2004) pointed that the structural
model is an indication of the extent to which hypothesized relationship is supported
by the data.
LISREL, SAS CALIS, AMOS, and EQS are the software programs used for
SEM. In this study LISREL was used. Tabachnick and Fidell (1996) specified
LISREL as below:

36
“LISREL is a set of three programs; PRELIS, SIMPLIS and LISREL. Prelis
pre-processes data, SIMPLIS allows models to be specified with equations and
finally LISREL specifies SEM models with matrices. Some models become
complicated to specify when using this method. LISREL offers residual diagnostics,
several estimation methods, and many fit indices.” (Tabachnick and Fidell, 1996)
2.5.1 Definition of Terms
Some definitions about SEM and the analysis of SEM are given below for
better understanding of related issues.
Path Diagram: “They are fundamental to SEM because they allow the
researcher to diagram the hypothesized set of relationships. The diagrams are helpful
in clarifying a researcher‟s ideas about the relationships among variables and they
can be directly translated into the equations needed for the analysis.” (Tabachnick
and Fidell, 1996)
Observed Variables: “Observed variables also called measured variables,
indicators, or manifest variables are represented by squares or rectangles.”
(Tabachnick and Fidell, 1996)
Latent Variables: “Latent variables, constructs, or unobserved variables are the
factors that have two or more indicators and represented by circles or ovals in path
diagrams.” (Tabachnick and Fidell, 1996)
Latent Dependent Variables: Latent dependent variables are affected by other
latent variables in the model and their measurement depends on the observed
dependent variables (Schumacker & Lomax, 2004).
Latent Independent Variables: Latent independent variables are not affected
by any other latent variables in the model and their measurements depend on the
observed independent variables (Schumacker & Lomax, 2004).
Direct Effect: The direct effect is a directional relation between two variables
that is the characterization of the relation between an independent and a dependent
variable. The path coefficients, which represent the direct effects in the model, are
the building blocks of the structural equation models (Schumacker & Lomax, 2004).

37
Indirect Effect: The indirect effect is the effect of an independent variable on
dependent variable through one or more mediating variable (Hoyle, 1995).
Total Effect: The total effect is the sum of direct and indirect effects of an
independent variable on a dependent variable (Schumacker & Lomax, 2004).
2.5.2 Steps of SEM
Model specification, identification, estimation, testing model fitness, and
modification are the steps of SEM. In model specification step, hypothesis based on
previous studies conducted. The second step, identification, is checked the
completeness of information and/or constraints. The third step, estimation uses
various estimation techniques to represent the relationship between the variables.
The fourth step, model fitness, checks the performance of the model with numerous
model fitness measures. It shows how well the model reproduces its data. The fifth
step, modification, takes place if the parameter estimations may not meet the
expectations. Misspecifications can be corrected or modification indexes, which are
provided by the software, are used to change the parameter estimated.
2.5.3 The Goodness of fit Criteria for Structural Equation Modeling
Goodness of fit for the models of Structural Equation Modeling can be
assessed by examining the results of some criteria. Interpretations of goodness-of-fit
criteria are given below in detail:
Chi-Square (²): Chi-square is a measure of overall fit of the model to the data
(Jöreskog and Sörbom, 1993). In this view, it indicates that there is no significant
discrepancy between the covariance matrix implied by the model and the population
covariance matrix. A nonsignificant chi-square implies that the model fits the data;
hence the population covariance matrix can be reproduced by the model (Kelloway,
1998). The chi-square is sensitive to sample size that it decreases as the sample size
increases. In other words, the chi-square criterion tends to indicate a significant
probability level when the sample increases, generally above 200 (Schumacker &
Lomax, 2004).

38
Goodness of Fit Index (GFI): The GFI measures how much better the model
fit as compared to no model at all (Jöreskog & Sörbom, 1989). It is based on a ratio
of the sum of the squared discrepancies to the observed variances. Range of the
values is between 0 (poor fit) and 1 (perfect fit).
Comparative Fit Index (CFI): It compares the model of interest with some
alternative, such as the null or independence model. The CFI is also known as the
Bentler Comparative Fit Index. Specifically, the CFI compares the fit of a target
model to the fit of an independent model, which is a model in which the variables
are assumed to be uncorrelated. In this context, fit refers to the difference between
the observed and predicted covariance matrices, as represented by the chi-square
index. In short, the CFI represents the ratio between the discrepancies of this target
model to the discrepancy of the independence model. Roughly, the CFI thus
represents the extent to which the model of interest is better than is the independence
model. Values that approach 1 indicate acceptable fit. CFI is not too sensitive to
sample size (Fan, Thompson, and Wang, 1999).
Normed Fit Index (NFI): The NFI equals the difference between the chi-square
of the null model and the chi-square of target model, divided by the chi-square of the
null model. In other words, an NFI of .90, for example, indicates the model of
interest improves the fit by 90% relative to the null or independence model. When
the samples are small, the fit is often underestimated (Schumacker & Lomax, 2004).
Root Mean Square Error of Approximation (RMSEA): It is a measure of
discrepancy per degree of freedom. Values below 0.10 indicate a moderate fit to the
data, values below 0.05 indicate a good fit to the data and values below 0.01 indicate
an outstanding fit to the data (Schumacker & Lomax, 2004).
39
CHAPTER 3
MATERIAL AND METHOD
The two aspects of the study cited in this chapter title are presented here under
discrete sections. The first covers succinct descriptions of the subject material-
including criteria used in its selection and a detailed iteration of specific data derived
there from. The second then gives an account of the operational procedures used for
deriving the data in question as well as for its compilation and subsequent analysis.
3.1 Material
The study of factors impacting rbSC and project performance was based on
face-to-face interviews and a questionnaire. Face-to-face interviews were carried out
with three contractor companies. The questionnaire, which is given in Appendix A,
was developed according to the information gathered from the informal face-to-face
interviews and from the literature survey. The questionnaire was administered to 33
construction contractors, 20 AE companies, 16 sub-contractors and 9 suppliers. The
software used for statistical analyses were LISREL and SPSS 17 for windows.
In order to determine the rebar supply chain with its sub factors, 3 contractor
companies were visited and two technical staff members from two companies and
the owner of the third company who knew the rebar procurement processes for their
companies were interviewed. They were asked to comment on the rbSC process, the
problems encountered during execution of the process, the response systems of the
participants in the chain, and their interrelationships.
The questionnaire was prepared in accordance with an in depth literature
review and the outcomes of the informal face-to-face interviews. Appendix A shows
an example of a blank questionnaire. The questionnaire consists of three sections
and a figure of framework. The first section was about the general information about
the respondent companies and consists of seven questions. The first part of the

40
second section consists five questions about characteristics of projects‟ evaluated.
The questions related to rbSC performance (four questions) and project performance
(three questions) and factors impacting performance of rbSC(50 questions) in the
second section and the third section of the questionnaire were evaluated in a Liker
format that has 6 scale to prevent choosing the middle. These questions were
evaluated under two headings. The first heading consisted of the importance
evaluations starting from (1) Not at all important to (6) Very important. The second
group heading consisted of project specific performance evaluations, ranging from
(1) Unacceptable, (2) Low performance, (3) Needs improvement, (4) Satisfactory,
(5) Good and finally, (6) Excellent. The third section was about the participant
(contractor, AE company, sub-contractor, supplier) related factors and external
factors (economic stability of the country, transportation cost, legal, client,
environment, market related issues) that have impact on rbSC performance. At the
end of the questionnaire a theoretical framework was also given to outline the
relationships among the factors that were being investigated. This framework was
used in the questionnaire to provide a better understanding of the questions by the
respondents (rbSC participants). The questions in each section are described in detail
as written below.
Section 1: The questions in this section give some information on participants‟
companies. The working area and size of the company, type of the projects that they
construct, contract types they use are the main topics in this section. There are seven
questions in this section.
Section 2:Concentrates on the characteristics of projects‟ evaluated (project
type, project size due to its rebar need, project location, construction site distance
from rebar supplier, the place where rebar prepared) and continued with rbSC and
project performance related factors. Five questions for project characteristics, four
questions for rbSC performance and three questions for project performance were
used.
Section 3: Concentrates on the factors that are proposed to have impacts on the
level of rbSC performance. The factors are grouped under five categories, which are;
“contractor related factors”, “sub-contractor related factors”, “supplier related

41
factors”, “AE(Architectural/Engineering) company related factors” and “external
factors”. There are 50 questions in this section.
3.2 Method
Face-to-face interviews were conducted with three contractors that were
selected randomly from a list obtained from the Gaziantep Chamber of Commerce,
in order to determine the rbSC process and factors affecting it in construction
projects. The two technical staff that was interviewed was site managers and the
owner interviewed was a civil engineer. During the interviews, technical staff / or
the owner of the company were asked to describe the current process of preparing
structural drawings, detailed cut and bent drawings, procuring process of rebar from
the suppliers; and the process of placing cut and bent rebar in the formwork. In
addition to these questions, the list of factors that can be seen in the fourth section of
chapter four was prepared according to their orientations. The interviewees comment
on the list of factors obtained from literature survey. Although the information
obtained through interviewees were consistent with the one obtained through
literature survey some exclusions were made due to the reasons described in the
fourth section of chapter four. A list of these factors along with the reasons for
inclusion or exclusion in the questionnaire is presented in Table 4.2.
A theoretical framework was developed based on the literature survey and
informal face-to-face interviews to outline the relationships among the seven latent
constructs namely, external factors, participant (contractor, sub-contractor, AE
company, supplier) related factors, rbSC performance and project performance. The
hypotheses, testing the impact of the factors on rbSC performance were based on
this theoretical framework. The factors in this framework were measured by the sub-
factors identified through literature survey and face-to-face interviews. These sub-
factors constitute each question under the factors in the questionnaire developed.
The questionnaire was used for the data collection.
In total the list of Gaziantep Chamber of Commerce consists of 313 contractor
companies name. Fifty contractors were selected randomly and only 33 answered the

42
questionnaire. The respondents filled the questionnaire for 52 projects. These
contractors were then asked to contact the other participants (AE company, sub-
contractor, and supplier) with whom they had worked in rbSC process, for
evaluating the same projects. Twenty AE companies filled the questionnaires for 30
projects, 16 sub-contractors filled the questionnaires for 21 projects, and 9 suppliers
filled the questionnaires for 12 projects. Thus, 78 companies filled 115
questionnaires for 52 projects.
One of the objectives of this study was to conduct a comparative analysis for
importance level and performance ratings of the determined sub-factors under seven
factor constructs. To reach this objective, respondents were asked to evaluate each
factor under two headings: importance and performance level. Under importance
level respondents were asked to evaluate the importance of factors for his/her
company. Under the performance level the respondents were asked to evaluate the
achieved level of performance of each factor, for the project that was evaluated. The
comparative analyses were carried out to determine whether the importance and
performance levels are significantly different or not. The findings under this section
can help companies to measure and improve their performance. t-test was applied
for this group of hypotheses as this test is commonly used to evaluate the difference
between two sets of data. The level of significance for t-test was accepted to be 0.05.
The analyses were carried out using SPSS 17 software (for Windows).
The first five questions related to projects (project type, project location,
projects‟ rebar need, construction site distance from rebar supplier, place where
rebar were prepared) under section two were used to test whether these
characteristics have an effect on rbSC performance, project performance and
participant related factors (contractor, AE company, sub-contractor and supplier
related factors). The one-way analysis of variance (ANOVA) was used to test
differences caused by project characteristics. The level of significance for ANOVA
was 0.05. For significant differences, a post hoc test (Games-Howell) was performed
as a second stage of ANOVA test to determine specific groups that were different.
The main aim of this study was to determine the impacts of participant related
factors and external factors on rbSC performance. The questions related to the

43
factors, were analyzed using Structural Equation Modeling (SEM) methodology to
determine the relationships among external factors, participant related factors, rbSC
performance and project performance. The questions of this section were grouped
under seven constructs (latent variables) namely, rbSC performance related factors,
project performance related factors, contractor related factors, AE company related
factors, sub-contractor related factors, and supplier related factors and external
factors. The hypotheses developed for each relationship were analyzed statistically
to evaluate the magnitude and pattern of the impact. The general null hypothesis
(Ho) for this section is; there is no impact on the determined factor and the
alternative hypothesis, (Ha) states that there is an impact on the determined factor.
The statistical analysis of these constructs was done by SEM. SEM is a statistical
technique that combines confirmatory factor analysis and path analysis at same time.
The capability of simultaneous analysis and showing all relationships between the
factors in the same picture differs from SPSS program outputs. Firstly, confirmatory
factor analysis for the latent variables was conducted to select the factors that have
low loadings. t-values and goodness-of-fit indices gathered from the outputs of
LISREL software were used. The critical value of 1.96, was the minimum t-value
that we need for a significance at p<0.05 level was used to test the relationship
among the factors. The higher the t-value is the more likely the impact is significant.
The GOF for each construct was analyzed through the goodness-of-fit index (GFI),
the comparative index (CFI), Non-normed fit index (NNFI), the adjusted goodness-
of-fit index (AGFI), the root mean square error of approximation (RMSEA) and the
ratio for χ2/df (degree of freedom). Number of factors determined in the
questionnaire was 57 and it was decreased to 38 after confirmatory factor analysis.
Then the developed framework outlining the relationships among the factors and
rbSC performance was revised in order to reach the appropriate level of GOF
measures. Parcelling and deleting the paths that showed a low relationship and had
t-value lower than 1.96 were used to revise the framework. Purified factors under the
constructs were parceled according to their conceptual relationships. The paths,
which were not significant at p<0.05 level were deleted. After these modifications a
final model with appropriate GOF indices was developed. All the hypothesized
relationships were tested at a time by SEM and the paths with t-values higher than

44
1.96 were accepted as significant at p<0.05 level and the path coefficient of the path
was used to evaluate the magnitude of the impact. Based on these results, a set of
recommendations related to the factors affecting rbSC performance was formulated
for rbSC participants.
At the end of the study the differences between assessments of participants for
importance levels and performance ratings of the specified factors push us to analyze
the reasons of the lower levels of performance. With this point of view comparison
of assessments were done through the data obtained from the questionnaire.
The comparison of the assessment between the groups was performed through
paired t-test and stacked charts drawn by Excel did evaluation of self-assessment. A
checklist for participants of rbSC was developed according to the assessments and
recommendations for rbSC participants were formulated to improve the rbSC
process of SMEs.
3.2.1 Tests of Hypotheses
The hypotheses developed were a reflection of the statements in the proposed
framework, which has been explained in Chapter 4 and given in Figure
4.2.Ninehypotheses were formulated in order to see whether there exists a
relationship between the factors or not; these are:
H01: External factors have no impact on AE company related factors
H02: External factors have no impact on sub-contractor related factors
H03: External factors have no impact on supplier related factors
H04: External factors have no impact on contractor related factors
H05: AE company related factors have no impact on contractor related factors
H06 : Sub-contractor related factors have no impact on contractor related
factors
H07: Supplier related factors have no impact on contractor related factors

45
H08: Contractor related factors have no impact on rbSC performance
H09: rbSC performance has no impact on project performance

46
CHAPTER 4
DATA COLLECTED
Data obtained through face-to-face interviews, roles of the rbSC participants,
theoretical framework obtained, development of factors used in the questionnaire,
the characteristics of projects evaluated and descriptive statistics are presented in this
chapter.
4.1 Information obtained through face-to-face interviews
Informal face-to-face interviews were performed with three contractor
companies whose main offices were in Gaziantep. The companies were small and
medium sized limited or private contractor companies of Gaziantep.
The information provided from the staff was generally same for three
companies as they use build and sell system mostly. Furthermore, these companies
entered tenders opened by government and build for the private sector with lump
sum contracts. As the main aim of the interviews was to identify the rbSC process
for SMEs the questions related to factors impacting were asked. The current rbSC
process can be summarized by the figure below.
Figure 4.1. rbSC process and participants
Preparing quantity
survey and
shop drawings
Structural
design Bidding Fabrication
and delivery of
rebar
Assembly
Contractor
Contractor
AE
companies Contractor
Supplier
Contractor
Contractor
Contractor

47
The engineers in the Architectural/Engineering or Engineering
companies prepared structural design. In this step engineers prepared
structural designs and details according to the architectural drawings
and draw the details of the structural system showing the shapes and
length of rebar used.
Technical staff in the contractor companies prepared the quantity
surveys according to the structural reinforcement drawings.
The contractor companies use Bill of Quantities (BOQ) to obtain offers
from minimum three rebar suppliers.
After the negotiation with the suppliers the contractor approves the
most appropriate bid, which is usually the lowest one.
The projects with rebar need of up to 200 tons were evaluated as small,
201-500 tons were evaluated as medium and more than 500 tons were
evaluated as large projects.
If the offer was for cut and bent rebar the suppliers delivered the
required material of the project (usually from Iskenderun). The rebar
cut and bend division of the supplier or the second tier supplier
produces steel reinforcement bars and stirrups in the required lengths
and bent shapes for use in reinforced concrete structures and then
deliver it to the site. The production process is automated through the
use of specialized machinery to enable high volume production. If it
was supplied in bars it was transported with 2-3 ton packages to the site
again from the steel mills Iskenderun or from the distributors located in
Gaziantep city.
The rebar delivered in bars to the site were cut & bent according to the
projects by sub-contractor (cut and bent labor).
SC ends before assembly as other actors (formwork sub-contractor)
enter the scene.

48
4.2 Roles of the rbSC participants
According to the information gathered through face-to-face interviews roles of
the participants can be listed as below (Table 4.1):
Table 4.1 Roles of rbSC participants
Participant Roles
Contractor
Plan and program the rbSC process
Preparing bidding documents for AE services
Preparing BOQ (Bid of Quantity),
Preparing the order process of rebar,
Negotiating with the rebar supplier,
Finalizing the procurement process,
Managing the financial issues related to AE company,
sub-contractor and supplier.
Negotiating with the rebar sub-contractor (steel
worker),
Controlling the delivered rebar,
Controlling the assembled rebar.
AE Company
Analyzing the clients requirements,
Preparing preliminary design,
Preparing shop drawings,
Designing the structure of the project,
Preparing detailed drawings,
Preparing change order drawings.
Sub-contractor
(steel work, labor)
Preparing the production area,
Cutting and bending the rebar according to the
structural drawings,
Transporting the rebar to site,
Placing the cut and bent rebar in formwork.
Supplier Supplying the rebar according to specifications to the
site.

49
4.3 Theoretical framework developed
The importance of rbSC for the building industry was deduced from the
literature review. As the aim of the study was to find the impacts of factors on rbSC,
identifying the factors was the first step. rbSC was analyzed with its participants in
this study. The relationships of rbSC participants and their evaluation in the supply
chain were analyzed and theoretical framework was developed (Fig. 4.2) based on
the literature review literature survey and informal face-to-face interviews. This
framework outlined the relationships among the contractor related factors, AE
company related factors, sub-contractor related factors, and supplier related factors,
external factors, rbSC performance and project performance.
Figure 4.2. Framework developed for defining the relationships
between the various participants related factors and their influence on the
performance of rbSC and overall project success
External
factors
AEcompany
relatedfactors
Project
performance
Supplier
related factors
Contractor
relatedfactors
Sub-contractor
relatedfactors
rbSC
performance
Latent variables
Relationships
Legend

50
4.4 Development of factors used in the questionnaire
The interviews were intended to classify the factors of the framework used
measure the impacts of participant related factors on rbSC performance through a
questionnaire survey. According to the responses of interviewees the classification of
the factors was changed for the one in literature for some factors. For example under
financial issues financial stability is considered to be an impact factor for the
suppliers because if he does not have finances he cannot purchase the material from
the producer. However this factor is not seen as an important impact factor for the
contractor because though he may be financially stable, he may not make payments
in time to the supplier or the other participants. Therefore, cash flow was more
important as a contractor related factor. Although the findings from the interviews
were consistent with what obtained in the literature survey, a few modifications were
done according to the data obtained from industry practitioners. The factors used in
literature were determined in Table 4.2 below. Table 4.2 was prepared to specify the
factors included and excluded for this study. The decision of including and excluding
the factors was given according to the face-to face interviews and it was explained in
the third column of the table.
Some studies have used the term „variables‟ and others „factors‟ for issues that
impact SC performance. In this study both have been referred to as „factors‟ and so
both have been listed as such in Table 4.2.

51
Table 4.2 Factors studied in literature
Researcher Study Name Factors Studied Reason for inclusion or exclusion
Palaneeswaran et al.
(2001)
“Reforging construction
supply chains: a source
selection perspective”
Past experience
Past performance
Finance
Organization and
management system
Team relationships
Human resources
Disputes/claims
history
Current workload
This was included only for contractors because the contractor companies
interviewed mentioned that the number of contractors worked with municipalities
and government is high for Gaziantep city. The contracts of these works were
usually lump sum and the project designs were prepared before the bid and it was
difficult to reach design teams.
This was excluded because it depends on profits/loss in the past and this data was
not available for all the projects that the companies investigated.
Finance related issues are included for contractor and supplier related factors. The
contractors constitute the main participant of the chain and the flow of money pass
through them. It is worthwhile to search the impact of the cash flow efficiency of
the contractors. For suppliers, finance related issues were analyzed according to its
stability because since they get the money from the contractor and it is important
for contractors to make themselves sure on the reliability of the company.
This was included. The organization and the management related issues for
contractors were searched. Materials management, site management, project
management, organization structure and culture, communication systems were the
questions related to this issue.
The inter group relationships were analyzed for contractor and structural designer,
contractor and supplier, contractor and sub-contractor. The inner relationships
were analyzed for sub-contractors because everyone saw their work on site and the
team relationships.
This was included. Participants‟ skills related issues were provided by the sub
factors under human resources.
This was excluded because none of the interviewees declared the absence of such
claims (legal actions) with their current partners.
This was excluded because this study focused on past/completed projects hence
the impact of current workload was irrelevant.

52
Table 4.2 Factors studied in literature (continued)
Researcher Study Name Factors Studied Reason for inclusion or exclusion
Environmental
concerns
Technology
Insurance cover
Equipment
Partnering
Location of head
office
This was included under external factors and project characteristics related
questions because the supply chain deals with a process with its environmental
issues that affects the performance.
This was included. According to the contractors interviewed technology for
contractors was important in the area of communication and equipment used. For
AE companies it comes front with the Internet technology name, consisting the
communication system of the AE companies and design information flow tool for
the AE companies.
This was included under contractor related factors because site, material and
worker insurance were the duty of the contractors.
This was included with the name of operating and machinery under contractor
related factors. The equipment used for the construction was provided by the
contractors in most of the construction supply chains.
The main aim of the supply chain is to increase the level of relations between the
participants. Relationships between the participants were analysed with the
questions in this study.
This was excluded since the limitation of this study is determined as the
companies, which were located in the city of Gaziantep.
Briscoe et al. (2001)
“Construction supply
chain partnerships:
skills, knowledge and
attitudinal
requirements”
Writing/reading skills
and Numeric/financial
skills
Client/contractor
relationships
Design
communications
Supplier
communications
Teamwork
Planning and
problem solving
Manual skills
This was included for the sub-contractor and supplier related factors due to the
orientation of the contractors interviewed. According to the contractors, these
skills are problematic usually for sub-contractors and suppliers.
The relationships between the participants were included for every relational part
as told above.
The design information flow was included for AE related factors because AE
companies design the structural project.
Product knowledge of the supplier was included under this variable as the
researcher specified.
This was included. The details for teamwork and team relationships were given
above.
This was included under contractor related factors since the contactors prepared
the main plan and programs for the rebar supply chain process.
Operating and machinery skills were included. Usually the contractors provided
the equipment‟s in the chain.

53
Table 4.2 Factors studied in literature (continued)
Researcher Study Name Factors Studied Reason for inclusion or exclusion
Castro-Lacouture
(2003)
“B2B e-work intranet
solution design for rebar
supply interactions”
Internet technology
CAD software usages
Standardization of
rebar
shapes/components
Ability to
exchange/share rebar
information
Ability to reduce
total rebar workflow
duration
This was included under AE company related factors due to the information
gathered through the contractors interviewed. In rebar supply chain, Internet was
seen as a communication tool used by the AE companies.
CAD related issues were included under AE company related factors only because
the contractor, sub-contractor used hard copies and the supplier used BOQ only.
This was included under AE companies to evaluate their success in structural
design. Also included under sub-contractor related factors because the level of
standardization affects the performance of sub-contractors.
The information flow capability was included under AE company related factors
because the information was gathered through the structural design and this
information flow was for AE companies only while the other participants were on
the receiving.
The factors affecting rebar workflow duration were analysed on the basis of
standardization of rebar shapes/components for AE companies and sub-
contractors, processing and storage area capacity of site for sub-contractors only
because the workflow duration was important only for sub-contractor related
factors. Ability of reading and writing skills were analysed for sub-contractors
since usually they were low educated.
Chan et al. (2004)
“Factors affecting the
success of a construction
project”
Project-related
factors
Project procedures
Project management
actions
Human - related
factors
External
environment
This was included because the evaluations were done on the basis of the projects
constructed. Project characteristics affecting rebar supply chain was included.
These are project type, size, and location and rebar cutting and bending place.
Procurement and tendering related issues were included under general information
on companies.
Management related issues were included under contractor related factors because
the contractors did the project management. Materials management, site
management, project management, communication system, organization structure,
organization culture, insurance cover, control and interaction of the participants
were the factors defined under the critical factors.
This was included by the ability related factors as defined above.
This was included as a separate construct that impacts rebar supply chain
performance with the sub-factors specified by the researcher.

54
The factors in the theoretical framework can be classified as contractor related
factors, AE company related factors, sub-contractor related factors, and supplier
related factors and external factors. All these topics can be defined with tangible and
intangible sub factors. External factors were listed in Table 4.3below, rbSC
performance and project performance related factors consisting of four and three sub
items are listed in Table 4.4 and participant related factors are listed in Table 4.5.
Table 4.3 External factors
Table 4.4rbSC and project performance related factors
rbSC performance (rbSCperf)
rbSCperf1Missing/wrong/damaged/defective product/production
rbSCperf2Responsiveness to customers
rbSCperf3Supply chain flexibility
rbSCperf4rbSC integration
Project performance (PROJperf)
PROJperf1 Project profitability
PROJperf2Schedule performance
PROJperf3 Satisfaction of the customer
External factors
EXT1 Economic stability in the country
EXT2 Transportation cost
EXT3 Taxes
EXT4 Legal conditions
EXT5 Client characteristics
EXT6 Environmental factors

55
Table4.5Participant related factors
Contractor related factors AE company related factors Sub-contractor related factors Supplier related factors
CONT1 Materials management
competency AE1 Design information flow
SUBCONT1 Improved communication
and learning skills SUP1 Delivery speed dependability
CONT2 Site management competency AE2 Design integration SUBCONT2 Labor utilization (
planned, weekly working
schedules)
SUP2 Delivery reliability performance
CONT3 Project management
competency AE3 Design changes
SUBCONT3 Accommodation
conditions on site SUP3 Supplier responsiveness
CONT4 Organization culture of the
contractor
AE4 Standardization of rebar shapes,
components
SUBCONT4 Education level of the
workers SUP4 Price of the material
CONT5 Organization structure of the
contractor
AE5 Delay in design definitions and
approval
SUBCONT5 Ability of reading
technical drawing SUP5 Location of the supplier
CONT6 Insurance cover AE6 Internet technologies SUBCONT6 Standardization of rebar
shapes, components SUP6 Financial stability
CONT7 Past experience of the
contractor AE7 CAD software usages
SUBCONT7 Grouping the cut rebar in
respect of length and size
SUP7 Writing and reading skills of
contract and tech. doc.
CONT8 Operating and machinery SUBCONT8 Processing area on site SUP8 Supplier/contractor relationships
CONT9 Trouble shooting and problem
solving SUBCONT9 Storage area on site SUP9 Number of faultless delivery
CONT10Communication system of the
contractor SUBCONT10 Team relationships SUP10 Quality of the material
CONT11 Interaction between
structural designer and jobsite SUBCONT11 Transportation of
material on site
SUP11 Warranties given by the
supplier
CONT12 Efficiency of cash flow
method SUBCONT12 Percentage of defects SUP12 Product knowledge
SUBCONT13 Cutting rebar in required
length

56
4.5 Evaluated project characteristics
Five criteria were determined to check if these criteria have an effect on rbSC
performance, project performance and participant related factors. These are:
1. Project type: The type of structure, processes and similar supply chain
structure depends on the type of project. It should be noted that 45.2% of the
data collected was small residential projects where the type of the structures
are not repeated many times.
2. Location: The location of the project is important for procuring rebar, storing
and preparing on site. The projects for which data were collected were
mostly located in low-density urban area (40.9%) and in suburban area
(33%).
3. Project rebar requirement: Some materials are highly prone to risk. The
contractors should focus on the procurement of the rebar, as it was one of the
risky materials in the construction industry. The amount of rebar need is
important for decreasing the transportation cost and procurement cost. To
evaluate the rbSC performance according to the rebar requirement, projects
are categorized due to its rebar need 12.2% of the projects evaluated were
small-size, 53% of them were medium and 34.8% of them were big size. The
amount of steel required affects the supply chain inversely.
4. Construction site distance from rebar supplier: As the transportation cost
for rebar constitutes a high percentage of total rebar related works, the
distance of the supplier from site is important. 43.5% of the construction
sites were 10-30km away from the rebar supplier and 30.4%of them 0-10km
away and 23.5% of them 30-50 km away from the rebar supplier.
5. Preparation of rebar: The usage of on-site and offsite cut and bend rebar has
an impact and total time and cost. As the labor cost is cheap in Turkey most
of the projects used on-site cut and bend rebar (73.9%).

57
4.6 Descriptive Statistics
The respondents characteristics and information related to their companies
were analysed usingdescriptive statistics.
The legal status of the surveyed companies was tabulated as (Table B.1);
70.51% limited company, 3.85% corporation and 25.64% individual proprietorship.
As shown in Table B.2, 42.3% of the companies are contractors, 25.6% of
them are AE companies and 20.5% of them are sub-contractors and the remaining
(11.5%) belong to suppliers.
Within the companies, the individuals who filled out the questionnaires hold
a variety of responsibilities.48.71% of them were the owners, 43.59% were technical
staff, 6.41% were sales staff and 1.28% were worker (Table B.3).
60.25% of the companies had been operating for more than 10 years. 11.54%
of companies had been operating for 5 and less than 5 years. And 28.21% of the
companies had been operating for 6-10 years (Table B.4).
The companies undertook construction jobs of various types. The expertise
areas are residential, commercial, educational, hospitals and other (social centres,
infrastructure) for all types of companies (Table B.5).
A majority of companies (30.77%) have annual volume between 2-5 billion
TL. 25.64% of the companies have annual volume between 0-1 billion TL, most of
whom are subcontractors (Table B.6).

58
CHAPTER 5
RESULTS AND DISCUSSION
In this chapter are presented the results of the various analyses of the data
collected. The data were compared using t-test, anova test, post hoc test conducted
in SPSS. Confirmatory factor analysis and structural analysis of the developed
framework were conducted in Lisrel and the results were used in hypotheses testing.
5.1 Comparative Statistics
The data were compared using t-test, excel charts and ANOVA test then the
results obtained from these comparisons were discussed.
5.1.1 T-test
Mean values and standard deviations of observed variables are reported in the
tables below to check if there is any significant difference between the means of
importance level and performance level of the variables.
The means of all rbSC performance related factors are significantly different
at p <. 05 levels Moreover, results revealed that the means of importance level were
higher than the performance ratings (Table 5.1).The results indicated that realized
efficiency and effectiveness of the supply chain is lower than the desired situation.
The factors related to the result of the process, “Missing/wrong/damaged/defective
product/construction” (rbSCperf1) and “Responsiveness to customers” (rbSCperf2)
had higher means both for importance level and ratings. As the term supply chain
was new for the respondents, factors consisting this term were found to be less
important and the realized performance for these factors was low. The main reason
for these results was the industry level culture. Construction industry is result-
oriented rather than process-oriented the reached success is the most important issue
that the companies considered.

59
Table 5.1Importance and performance levels for rbSC performance related factors
N Mean Sd df t p
rbSCperf1(Missing/wrong/damaged/defe
ctive product/construction)
Imp. 115 5.13 0.82 114 5.97 0.000
Perf. 115 4.69 0.74
rbSCperf2 (Responsiveness to customers) Imp. 115 4.92 1.01
114 5.01 0.000 Perf. 115 4.62 0.95
rbSCperf3 (Supply chain flexibility) Imp. 115 4.46 1.16
114 3.85 0.000 Perf. 115 4.1 1.12
rbSCperf4 (rbSC integration) Imp. 115 4.43 1.1
114 3.88 0.000 Perf. 115 4.09 1.05
Results indicated that the means of the “project profitability”(PROJperf1) for
company‟s importance weight and rating for project performance are not
significantly different (p ‹ .14) at p <. 05 levels “Project profitability” was found to
be the least important project performance related factor and the realized
performance was higher than the importance level. “Satisfaction of the customer”
(PROJperf3) and “schedule performance” (PROJperf2) was perceived as the prime
measures for company success. Providing to their customer with quality services
and products on time with consistency were the main aims of the companies. The
realized performance and the importance levels for the main aims (schedule
performance and satisfaction of the customer) of the companies were significantly
different at p ‹ .05 level (Table 5.2) indicating low level of achievement for these
factors. These results show the pragmatic characteristic of the industry culture rather
than normative.

60
Table 5.2 Importance and performance levels for project performance related factors
N Mean Sd df t p
PROJperf1 (Project profitability)
Imp. 115 4.45 0.91 114 1.49 0.140
Perf. 115 4.58 0.87
PROJperf2 (Schedule performance)
Imp. 115 5.12 0.73 114 5.22 0.000
Perf. 115 4.77 0.76
PROJperf3 (Satisfaction of the customer)
Imp. 115 5.17 0.87 114 3.46 0.001
Perf. 115 4.95 0.86
Results for contractor related factors revealed that only the means of
“materials management competency” (CONT1), “site management competency”
(CONT2), “Project management competency” (CONT3), “Organization culture of
contractor” (CONT4) and “trouble shooting and problem solving ability of
contractor”(CONT9) companies for importance levels and performance ratings are
significantly different at p< .05 level. Management related issues were found to be
as important factors but the realized performance for these factors was still lower
than the desired ones. This was a realistic result since the adopting new management
technique is more difficult for construction industry than the manufacturing
industry. The result for “trouble shooting and problem solving”(CONT9) factor
indicated that the importance of capturing the problems causing failed process has
not perceived by the rbSC participants and as a result the performance for this factor
is low. There is no significant difference between the remaining seven determinants
of contractor related factors (Table 5.3). Since the contractors constitute the main
construct of the chain, it was observed that attributes related to past experience like,
technical skill, size, reputation of the contractor companies had the highest mean.

61
Table 5.3 Importance and performance levels for contractor related factors
N Mean Sd df t p
CONT1 (Materials management
competency)
Imp. 115 4.74 0.8 114 4.07 0.000
Perf. 115 4.39 1.01
CONT2 (Site management competency)
Imp. 115 4.86 0.77 114 4.07 0.000
Perf. 115 4.5 1.06
CONT3 (Project management
competency)
Imp. 115 4.83 0.91 113 4.97 0.000
Perf. 115 4.43 0.93
CONT4 (Organization culture of the
contractor)
Imp. 115 4.9 0.78 114 5.03 0.000
Perf. 115 4.47 0.85
CONT5 (Organization structure of the
contractor)
Imp. 115 4.07 1.49 114 0.17 0.866
Perf. 115 4.06 1.19
CONT6 (Insurance cover)
Imp. 115 4.16 1.52 114 0.93 0.354
Perf. 115 4.06 1.19
CONT7 (Past experience of the
contractor)
Imp. 115 5.14 1 113 2.34 0.210
Perf. 115 5.31 0.8
CONT8 (Operating and machinery)
Imp. 115 5.13 0.8 114 1.93 0.056
Perf. 115 5.01 0.83
CONT9 (Trouble shooting and problem
solving)
Imp. 115 4.35 1.46 113 4.57 0.000
Perf. 115 4 1.36
CONT10 (Communication system of the
contractor)
Imp. 115 4 1.26 114 0.24
6 0.806
Perf. 115 3.97 1.15
CONT11 (Interaction between structural
designer and jobsite
Imp. 115 4.18 1.19 113 0.1 0.920
Perf. 115 4.17 1
CONT12 (Efficiency of cash flow
method)
Imp. 115 5.04 0.86 114 1.84 0.068
Perf. 115 4.9 0.86
The means of importance level and performance ratings were significantly
different at p <. 05 levels for all AE company related factors except for “internet
technologies” (AE6), which had p value of 0.245 (Table 5.4). All ratings were
around moderate levels, indicating problematic view of AE companies within the
chain. Furthermore AE companies realized performance levels were lower than
these moderate level importance levels.
The level of technology and Internet usages in AE companies is high.

62
Connecting to Internet with high speed is possible for almost all AE companies. As
a result the realized performance is higher than the importance level. High level of
Internet technology used by design companies provides a low cost network for
business-to-business transactions. The control, improvement and changes in designs
can be done and seen by the participants by using same software. Internet
technologies provide solutions that enhance the overall value of the supply chain.
Real-time communication among supply chain participants reduces cost of waiting.
rbSC participants believed that “Standardization of rebar shapes, components”
(AE4) and “Delay in design definitions and approval” (AE5) were the more
important items under AE company related factors (Table 5.4). Standardization of
rebar shapes and components can be provided by construction knowledge and
experience of AE companies in planning and engineering.
Table 5.4 Importance and performance levels for AE company related factors
N Mean Sd df t p
AE1 (Design information flow)
Imp. 114 4.44 0.8 113 4.5 0.000
Perf. 114 3.99 1.01
AE2 (Design integration)
Imp. 114 4.34 0.77 113 3.55 0.001
Perf. 114 4 1.06
AE3 (Design changes)
Imp. 114 4.32 0.91 113 2.62 0.010
Perf. 114 4.07 0.93
AE4 (Standardization of rebar
shapes,components)
Imp. 114 4.64 0.78 113 3.53 0.001
Perf. 114 4.34 0.85
AE5 (Delay in design definitions and
approval)
Imp. 114 4.62 1.49 113 4.12 0.000
Perf. 114 4.24 1.19
AE6 (Internet technologies)
Imp. 114 3.96 1.52 113 1.17 0.245
Perf. 114 4.09 1.19
AE7 (CAD software usages)
Imp. 114 4.26 1 113 3.19 0.002
Perf. 114 4.61 0.8
63
Table 5.5 revealed four significant differences between important levels and
performance ratings of sub-contractor related factors. The importance level means
for “Improved communication and learning skills” (SUBCONT1), “Labor utilization
(planned, weekly working schedules)” (SUBCONT2), “Ability of reading technical
drawings” (SUBCONT5) and “Percentage of defects” (SUBCONT12) were
significantly higher than the means of performance ratings of these factors. The
results drawn from the Table 5.5 indicated that the source of the problems was
mostly related to the sub-contractor skills. Workforce characteristics of sub-
contractors by means of education level, ability of reading technical drawings, team
relationships were deduced as significant factors that influenced rbSC performance.
Working period of labor per week is very important for the productivity level at the
construction site. As the education level of workers in the construction industry is
very low, big problems related to this issue encountered during the construction
process. Quality problems related to the works, ability of understanding technical
drawings are some of the results of the low education level. Moreover, “Grouping
the cut rebar in respect of length and size” (SUBCONT7), “Percentage of defects”
(SUBCONT12) and “Cutting rebar in required length” (SUBCONT13) were found
to be more important both for importance level and performance ratings. All ratings
when compared to those of the other constructs factors were low, indicating that
sub-contractors were not the key element of the chain. Some issues related to sub-
contractors had the lowest means both for importance level and performance ratings
espoused the weakness of the sub-contractors in the chain.

64
Table 5.5 Importance and performance levels for sub-contractor related factors
N Mean Sd df t p
SUBCONT1 (Improved communication
and learning skills)
Imp. 114 4.09 1.18 113 2.19 0.031
Perf. 114 3.9 1.2
SUBCONT2 (Labor utilization (planned,
weekly working schedules))
Imp. 114 4.34 1.1 112 3.14 0.002
Perf. 114 4.07 1.14
SUBCONT3 (Accommodation conditions
on site)
Imp. 114 3.55 1.53 113 0.70 0.485
Perf. 114 3.48 1.42
SUBCONT4 (Education level of the
workers)
Imp. 114 3.07 1.28 113 0.01 0.365
Perf. 114 2.97 1.22
SUBCONT5 (Ability of reading technical
drawings)
Imp. 114 3.77 1.46 113 2.60 0.011
Perf. 114 3.5 1.34
SUBCONT6 (Standardization of rebar
shapes, components)
Imp. 114 4.55 0.94 113 0.84 0.402
Perf. 114 4.49 0.93
SUBCONT7 (Grouping the cut rebar in
respect of length and size)
Imp. 114 4.68 0.81 113 0.98 0.329
Perf. 114 4.62 0.87
SUBCONT8 (Processing area on site) Imp. 114 4.54 0.81 113 1.30 0.197
Perf. 114 4.43 0.95
SUBCONT9 (Storage area on site) Imp. 114 4.5 0.87 113 0.99 0.323
Perf. 114 4.39 1.14
SUBCONT10 (Team relationships) Imp. 114 3.97 1.22 113 0.00 1.000
Perf. 114 3.97 1
SUBCONT11 (Transportation of material
on site)
Imp. 113 4.26 1 112 0.24 0.812
Perf. 113 4.27 0.97
SUBCONT12 (Percentage of defects) Imp. 114 4.68 0.82 113 2.90 0.040
Perf. 114 4.48 0.8
SUBCONT13 (Cutting rebar in required
length)
Imp. 114 4.73 0.81 113 0.73 0.468
Perf. 114 4.68 0.77

65
Results indicated that the means of the “price of the material” (SUP4),
“financial stability” (SUP6), “supplier/contractor relationships” (SUP8) for
importance level and rating for project performance are not significantly different at
p <. 05 levels the contractor use a negotiated process with the distributor or
manufacturer and the price they buy the rebar does not differs too much. On the
other hand mean values of the other variables for performance ratings are lower than
the mean values of importance weights (Table 5.6).
Table 5.6 Importance and performance levels for supplier related factors
N Mean Sd df t p
SUP1 (Delivery speed dependability)
Imp. 115 5.31 0.73 114 6.40 0.000
Perf. 115 4.81 0.91
SUP2 (Delivery reliability performance)
Imp. 115 5.31 0.6 114 4.82 0.000
Perf. 115 4.94 0.82
SUP3 (Supplier responsiveness)
Imp. 115 5.24 0.68 114 5.56 0.000
Perf. 115 4.82 0.92
SUP4 (Price of the material)
Imp. 115 5.07 1 114 0.50 0.622
Perf. 115 5.02 0.99
SUP5 (Location of the supplier)
Imp. 115 5 0.86 114 3.13 0.002
Perf. 115 4.7 0.89
SUP6 (Financial stability)
Imp. 115 5.07 0.99 114 0.34 0.734
Perf. 115 5.04 0.75
SUP7 (Writing and reading skills of
contract and technical documents)
Imp. 115 4.07 1.3 114 1.74 0.084
Perf. 115 4.22 1.26
SUP8 (Supplier/contractor relationships) Imp. 115 4.34 1.34 114 0.20 0.839
Perf. 115 4.37 1.12
SUP9 (Number of faultless delivery) Imp. 115 5.15 0.79 114 2.45 0.016
Perf. 115 4.98 0.75
SUP10 (Quality of the material) Imp. 115 5.07 0.73 114 2.31 0.023
Perf. 115 5.21 0.72
SUP11 (Warranties given by the supplier)
Imp. 115 4.45 1.22 114 3.65 0.000
Perf. 115 4.75 0.94
SUP12 (Product knowledge) Imp. 115 4.58 1.24 114 2.96 0.004
Perf. 115 4.82 0.92

66
“Economic stability in the country” (EXT1) and “Transportation cost”
(EXT2)were the most important dimensions of external factors both with
importance weights and performance ratings. The means of importance level and
performance ratings were significantly different except for “Environmental factors”
(EXT6) at p<.05 level (Table 5.7). Economic stability in the country is important
because of the fluctuations in the price of rebar. The price of rebar is determined
world-widely, but the country economy, supply and demand conditions of the
material affected the price. Transportation cost is important because in Turkey, rebar
transportation cost accounts a high percentage in the material cost.
Table 5.7 Importance and performance levels for external factors
N Mean Sd df t p
EXT1 (Economic stability in the country)
Imp. 115 4.91 1.03 114 2.73 0.007
Perf. 115 4.75 0.96
EXT2 (Transportation cost)
Imp. 115 5.07 0.79 114 3.35 0.001
Perf. 115 4.74 1.08
EXT3 (Taxes)
Imp. 115 3.90 1.43 114 2.10 0.038
Perf. 115 3.75 1.29
EXT4 (Legal conditions)
Imp. 115 3.85 1.52 114 2.26 0.026
Perf. 115 3.66 1.3
EXT5 (Client characteristics)
Imp. 115 3.70 0.87 114 2.33 0.021
Perf. 115 4.50 1
EXT6 (Environmental factors)
Imp. 115 4.00 1.57 114 0.40 0.694
Perf. 115 4.03 1.34
5.1.2 Comparison of the assessments of performance
rbSC participants are required to assess their performance against the factors
related to their companies role in the supply chain and assess other participants in
the supply chain. For each factor, the companies rate themselves and the others at
one of the six levels, as illustrated below.

67
Likert Scale Description
1 Unacceptable
2 Low performance
3 Needs improvement
4 Satisfactory
5 Good
6 Excellent
In essence there are three levels of satisfaction, 1 and 2 are the lower side, 3
and 4 are average while 5 and 6 are high. In this case, 1 to 3 should be regarded as
unacceptable while 4 to 6 are preferable.
The self-assessment provides the participants an opportunity to reflect its
management practices related to supply chain and identify areas where it is doing
well and areas where it needs to improve. The companies identify its strengths and
weaknesses for continuous improvement. For rbSC the evaluation of participants
self-assessments and others assessments help us to find the problematic link in the
chain and the problem areas for this link.
During the analyses it was felt that there exist a difference between the
performance ratings obtained by self assessment of a participant and those obtained
through assessment done by the others. This difference indicated that each
participant considered high own performance to be better than the others. This is
seen as a cultural issue. Hence, the literature review was extended to include topics
on construction culture. Thereafter, the same data was analyzed further by
separating performance ratings to the self-assessment and those obtained through
assessment by the others. These ratings are presented side by side in comparison
charts for each participant and separately (Figure 5.1-5.4).
This data was then analyzed statistically for significant differences in
assessments for each participant related factor. A chart was prepared for each
participant where their performance ratings are compared in two groups; i.e., the
ratings obtained through self-assessment by the participant himself and those that
were obtained by aggregating the ratings for his performance by the other

68
participants. During the analysis, if the total percentage of the performance ratings
for the unacceptable, low performance and needs improvement is higher than 20%,
this was taken as a factor that has problems in the SC.
Figure 5.1 shows the self-assessment of contractors and others‟ (AE
companies, subcontractor, and supplier) assessments of contractor related factors.
Only two of the factors are statistically different for the groups at p<.05 level. These
factors are CONT7perf (past experience of the contractor) and CONT12perf
(efficiency of cash flow method). The contractors assessments for themselves and
the others assessments for the performance of contractors for the other 10 factors are
not significantly different at p<.05 level.
77% of the contractors assessed their performance as good and excellent and
21% of contractors assessed their performance as satisfactory with efficiency cash
flow method. The reason for the statistical difference in the performance
assessments of cash flow was the absence of the strict articles related to cash flow in
contracts. This result indicated that the other participants believe that the level of
consistency in cash flow is lower for contractors than the contractors perceived.
Mobilisation of resources (labour, workforce), materials and machineries depends
on fund. The material suppliers did not give the most competitive rates if the
contractors don‟t have consistent cash flow.
Past experience is an area of concern as 88% of contractor‟s performance is
good or excellent with the requirements. The performance ratings for this factor are
almost excellent for all of the rbSC participants. Although performance assessment
level of other participants for this factor is high, the reason for the difference
encountered between the groups for this factor is inadequate information about the
contractors. In summary, the contractor culture in the area studied was seen to be
lacking in the right attitude towards management related issues. Hence there is a
need to change this attitude and truly understand the importance of management
procedure and techniques in supply chain.

69
Figure 5.1 Performance assessments of contractor related factors

70
Figure 5.2 Performance assessments of AE company related factors

71
Figure 5.2 shows the evaluation of AE company related factors by AE
companies and by the other rbSC participants (contractor, subcontractor, and
supplier). AE companies see themselves as performing very well for all issues, with
almost 60% of the companies rating themselves as very good and 30% of the
remaining AE companies considering themselves to be satisfactory.
On the other hand, the evaluation of the other participants are significantly
different for all AE company related factors at p <.05 level. The main reason for this
result is the inadequate recording of the works done by AE companies. The
contractor companies did not document the current operating system, tools,
resources and costs of AE company related factors and did not create a value stream
map to visualize how processes function and where the opportunities are. This
shows the importance of communication at the front of the process, involving all the
participants. Controlling the participants from the beginning is better than trusting
them %100 percent. Even when parties know each other well, still a risk of changing
behaviour according to the situations is remaining. Too much control can frustrate
the parties involved but there is a need for a good balance between trust and control
for AE companies in rbSC which can be achieved through a good contract which
includes clause related to additional works and work changes and their related sub-
issues like payments, duration and penalties.
The other participants‟ performance assessments of AE company related
factors are lower than the self assessments for all issues because other participants
encountered problems related to design issues on site and delivery delays of the
production drawing.

72
Figure 5.3 Performance assessments of sub-contractor related factors

73
As shown in Figure 5.3, subcontractors and the other participants (contractors,
AE companies, and suppliers) assess subcontractor‟s performance as generally
acceptable. The self-assessments and others assessments are not significantly
different for subcontractor related factors at p<.05 level. The reasons for these are
the tangible records (the works done) related to the subcontractor related factors
performance. Subcontractors play a vital role in construction process and are
directly related to project quality, time and cost. The control mechanisms on the
works done by subcontractors are more than the other participants in the supply
chain because there are clauses in their contracts regarding the amount of work,
costs, duration and penalties. The most important reason for the medium levels of
performance, for almost all factors is the subcontractor selection criteria. The
subcontractor selection criteria mostly used by contractors are the tender price and
employee competency. “Lowest price” is more important than quality based “value”
in subcontractor selection criteria for SMEs. This shows the problems related to
vision statements. Companies with developed long term missions and visions do not
take decisions just for the short term profit. To avoid the risks like project quality
non-compliance, project delays, delayed project payments and reach the planned
level of success, the contractors pay more attention to the works done by
subcontractors and strictly programme labor working schedules and put penalty
clauses in the contracts prepared for the subcontractors.
Contracts done with subcontractors are not enough to realize the projects.
Contractors do not pay attention to the weak signals of the parties involved, during
the negotiation process or during the signing the contract. The works done by
subcontractors are completely based on people and the results cannot be guaranteed
by contracts. Moreover, usually subcontractors do not pay attention to the signs and
what they expected. Mutual trust between the contractors and subcontractors as a
result of culture is good but it is logical to add the signatures to this mutual trust.

74
Subcontractors assessed themselves better for all factors except the ones
related to the other participants (SUBCONTperf6- Standardization of rebar shapes,
components, SUBCONT8perf- Processing area on site, and SUBCONTperf9-
Storage area on site). Subcontractor‟s performance is affected by these factors but
the decisions about these factors are given by contractors and AE companies.
Accordingly, the results for these factors are acceptable.
The highest self-assessment scores are for the factors SUBCONTperf2 (labor
utilization), SUBCONTperf7 (grouping the cut rebar in respect of length and size)
and SUBCONTperf13 (cutting rebar in required length).
For the suppliers (Figure 5.4), the significant differences between the self-
assessments and others (contractor, AE companies, and subcontractors) assessments
can be seen from the figure. Suppliers assessed themselves as almost excellent for
all supplier related factors, e.g. SUPperf4 (price of the material), SUPperf5 (location
of the supplier), SUPperf9 (number of faultless delivery) the difference between the
assessments are not significant at p<.05 level. These factors are the ones that are
documented strictly. Price of the material and the number of the faultless delivery
can easily be seen from the bills. The performance related to distance is also not
significant here because it is more or less the same and does not change according to
the evaluator. For the supply of rebar, there are few reliable companies in the
market. The suppliers have developed their own rules for the supply of rebar. As a
result of polychromic culture of rebar suppliers, they handled many tasks
simultaneously. Time is thought of being cyclical and it is not very important to be
punctual for suppliers. Culturally the suppliers are lack of time and resource
management.

75
Figure 5.4 Performance assessments of supplier related factors

76
In this study 52 projects were evaluated by different contractors, AE
companies, sub-contractors and suppliers; which meant that not every project was
evaluated by all four participants except for three projects. However, this data is not
significant to run a statistical test. The data for these three projects were evaluated
according to their mean values (Table 5.8 – 5.10). For example, contractors scored
their performance as 4.61/6.00 whereas the other three participants gave them a
score of 4.34/6.00, which is slightly less than the self-assessment mean. The AE
companies self-assessment score was 4.43/6.00 and the other participants score for
AE companies was 4.17/6.00 which is relatively lower. For sub-contractors self-
assessment score was 4.36/6.00. Sub-contractors got the lowest score from the others
assessment and it was 3.93/6.00. The highest score for self-assessment was given by
the suppliers. They gave themselves 5.19/6.00. Moreover, the others score for
suppliers was 4.25/6.00. The self-assessment scores and those given by the other
participants are almost the same for contractors, AE companies and sub-contractors.
However there is a significant difference between the scores for the suppliers. On the
other hand the lowest performance scores as given by the other three participants can
be seen for sub-contractors which mean that the low performance of projects is
usually attributed to the low performance of the sub-contractors.

77
Table 5.8 Performance assessments of projects evaluated by all participants (Contractor and AE company assessments)
Akasya Houses Hisar Residence Gorkem Apt. Assessments for all 3 projects
Self
Assessment
Mean of
others
assessment
Self
Assessment
Mean of
others
assessment
Self
Assessment
Mean of
others
assessment
Mean of self-
assessments
Mean of
others
assessments
CONT1 Materials management competency 4.00 4.33 5.00 4.67 5.00 4.33 4.67 4.44
CONT2 Site management competency 4.00 4.67 5.00 5.00 5.00 4.33 4.67 4.67
CONT3 Project management competency 5.00 5.00 4.00 4.33 5.00 4.33 4.67 4.55
CONT4 Organization culture of the contractor 5.00 4.00 4.00 4.33 5.00 4.33 4.67 4.22 CONT5 Organization structure of the
contractor 5.00 4.00 4.00 4.33 5.00 4.00 4.67 4.11
CONT6 Insurance cover 4.00 4.33 4.00 4.33 5.00 4.00 4.33 4.22
CONT7 Past experience of the contractor 6.00 4.67 5.00 5.33 6.00 5.00 5.67 5.00
CONT8 Operating and machinery 5.00 3.67 5.00 5.33 5.00 4.67 5.00 4.56
CONT9 Trouble shooting and problem solving 5.00 4.00 5.00 5.00 2.00 1.67 4.00 3.56 CONT10Communication system of the
contractor 5.00 5.33 4.00 4.67 3.00 2.67 4.00 4.22 CONT11 Interaction between structural
designer and jobsite 4.00 4.67 4.00 4.67 4.00 3.00 4.00 4.11
CONT12 Efficiency of cash flow method 5.00 4.33 5.00 5.33 5.00 3.67 5.00 4.44
Mean scores for contractors 4.75 4.42 4.50 4.78 4.58 3.83 4.61 4.34
AE1 Design information flow 4.00 4.33 5.00 4.67 4.00 3.67 4.33 4.22
AE2 Design integration 4.00 4.00 5.00 4.67 4.00 3.67 4.33 4.11
AE3 Design changes 5.00 4.33 5.00 4.33 4.00 3.67 4.67 4.11 AE4Standardization of rebar shapes,
components 4.00 4.33 5.00 4.67 4.00 3.67 4.33 4.22
AE5 Delay in design definitions and approval 5.00 4.33 5.00 4.33 4.00 4.00 4.67 4.22
AE6 Internet technologies 5.00 4.00 4.00 4.33 4.00 3.33 4.33 3.89
AE7 CAD software usages 5.00 4.67 4.00 4.67 4.00 4.00 4.33 4.45
Mean scores for AE companies 4.57 4.28 4.71 4.52 4.00 3.72 4.43 4.17

78
Table 5.9 Performance assessments of projects evaluated by all participants (Sub-contractor assessments)
Akasya Houses Hisar Residence Gorkem Apt. Assessments for all 3 projects
Self
Assessment
Mean of
others
assessment
Self
Assessment
Mean of
others
assessment
Self
Assessment
Mean of
others
assessment
Mean of self-
assessments
Mean of
others
assessments
SUBCONT1 Improved communication and
learning skills 3.00 4.67 6.00 4.00 3.00 2.33 4.00 3.67
SUBCONT2 Labor utilization ( planned, weekly working schedules) 5.00 5.00 5.00 4.33 5.00 2.67 5.00 4.00
SUBCONT3 Accommodation conditions on
site 5.00 4.67 5.00 3.33 2.00 1.67 4.00 3.22
SUBCONT4 Education level of the workers 3.00 4.67 5.00 3.33 3.00 2.00 3.67 3.33
SUBCONT5 Ability of reading technical
drawing 5.00 4.00 4.00 3.33 4.00 2.00 4.33 3.11
SUBCONT6 Standardization of rebar shapes, components 5.00 4.00 5.00 5.33 4.00 3.33 4.67 4.22
SUBCONT7 Grouping the cut rebar in respect
of length and size 5.00 4.33 5.00 5.33 4.00 3.00 4.67 4.22
SUBCONT8 Processing area on site 4.00 4.33 5.00 5.33 4.00 2.67 4.33 4.11
SUBCONT9 Storage area on site 5.00 4.67 5.00 5.33 2.00 3.00 4.00 4.33
SUBCONT10 Team relationships 4.00 4.67 5.00 4.33 4.00 2.67 4.33 3.89
SUBCONT11 Transportation of material on
site 4.00 3.67 5.00 5.00 4.00 3.33 4.33 4.00
SUBCONT12 Percentage of defects 4.00 4.33 5.00 5.00 5.00 4.00 4.67 4.44
SUBCONT13 Cutting rebar in required length 4.00 4.67 5.00 5.00 5.00 4.00 4.67 4.56
Mean scores for sub-contractors 4.31 4.44 5.00 4.54 3.77 2.82 4.36 3.93

79
Table 5.10 Performance assessments of projects evaluated by all participants (Supplier assessments)
Akasya Houses Hisar Residence Gorkem Apt. Assessments for all 3 projects
Self
Assessment
Mean of
others
assessment
Self
Assessment
Mean of
others
assessment
Self
Assessment
Mean of
others
assessment
Mean of 3
projects
Mean of
others
assessments
SUP1 Delivery speed dependability 4.00 4.00 6.00 4.33 6.00 4.33 5.33 4.22
SUP2 Delivery reliability performance 5.00 4.67 6.00 4.33 6.00 4.33 5.67 4.44
SUP3 Supplier responsiveness 4.00 4.33 6.00 4.33 6.00 4.33 5.33 4.33
SUP4 Price of the material 4.00 4.00 6.00 4.67 4.00 3.33 4.67 4.00
SUP5 Location of the supplier 4.00 4.33 6.00 4.67 5.00 4.33 5.00 4.44
SUP6 Financial stability 6.00 4.00 6.00 4.67 5.00 4.67 5.67 4.45
SUP7 Writing and reading skills of
contract and tech. doc. 4.00 4.00 6.00 4.00 5.00 4.00 5.00 4.00
SUP8 Supplier/contractor
relationships 5.00 3.33 4.00 3.67 4.00 4.00 4.33 3.67
SUP9 Number of faultless delivery 3.00 3.67 5.00 4.33 6.00 4.67 4.67 4.22
SUP10 Quality of the material 5.00 4.00 6.00 4.33 6.00 5.00 5.67 4.44
SUP11 Warranties given by the
supplier 5.00 4.67 6.00 4.33 5.00 3.67 5.33 4.22
SUP12 Product knowledge 5.00 4.67 6.00 4.67 6.00 4.33 5.67 4.56
Mean scores for suppliers 4.50 4.14 5.75 4.36 5.33 4.25 5.19 4.25

80
5.1.3 Basic Difference Statistics for Three or More Groups (ANOVA)
This section consisted of ANOVA tests carried out for project related
questions (project type, project location, projects‟ rebar need, construction site
distance from rebar supplier and place of rebar preparation) under the second section
of the questionnaire. ANOVA was used to test whether these characteristics have an
effect on rbSC performance, project performance related factors and rbSC
participant related factors. ANOVA test was applied to each project characteristic
and the results were presented below.
A. rbSC performance related factors impact by project characteristics
Table 5.11 revealed the results for the rbSC performance related factors by
project characteristics. Table 5.11 was composed of two parts: one part describes
results from the ANOVA and provides total number of the sample (N), mean value
for each group and p-value. The other part of Table 5.11 summarized the post hoc
test indicating the group for which the mean rbSC performance related factors was
significantly from those other groups within each category.
In the project type group category, the highest mean of rbSC performance
related factors (4.61) was calculated for residential and the lowest for education
buildings (4.23) but the means of the groups were not significantly difference at
pp<.05 level. For the location of project the mean for rbSC performance related
factors for the projects located in a low density urban area was significantly higher
than the projects those located in a high density urban area and suburban area. The
lowest mean for rbSC related factors was calculated for medium size projects (4.33)
due to its rebar need and the highest mean was calculated for big size projects (4.70).
These are significantly different at p<.05 level. However the mean for small size
project due to projects‟ rebar need had the mean of 4.36, that was vey closed to the
medium size mean (4.36), this finding lacked statistical significance because this was
based on a small sample of 14. rbSC performance related factors affected due to the
construction site distance from rebar supplier. The highest mean of rbSC
performance related factors was calculated for the projects those sites‟ located 10-

81
30km away from the rebar supplier (4.61) and the lowest mean was calculated for
the projects those sites located more than 50 km away from the rebar supplier (4.11),
however this was again based on small sample of 3. The significant difference for
this characteristic was reported for 10-30km projects and 30-50km projects at 95%
confidence interval according to Games-Howell test results. rbSC performance
related factors don‟t affected from the place of fabrication and assembly of rebar (p-
value =0.984).
Table 5.11 rbSC performance impact by project characteristics
Project
characteristics
rbSC performance related factors
ANOVA test ( p< .05) Post Hoc (CI=95%)
N Mean p-value High Low
Project type
Residential 52
1
8
4.61
4
.43
0.244
Commercial 18 4.43
Education 25
7
4.23
4
.62
No significant differences
Health 7 4.62
Other 13 4.31
Project location
high density urban area 35 4.15 0.000 Low density urban area
High density urban area
low density urban area 47 4.79 Low density
urban area Suburban area
suburban area 33 4.32
Project rebar
requirement
small 14 4.36 0.043 big medium
medium 61 4.33 big medium
big 40 4.70
Construction site
distance from
rebar supplier
0-10 km 35 4.50 0.090 10-30 km 30-50 km
10-30 km 50 4.61
30-50 km 27 4.19
50 km 3 4.11
Place of rebar
preparation
on-site cut and bend 85 4.47 0.984 No significant differences
off-site cut and bend 5 4.46
both 25 4.44

82
B. Project performance related factors impact by project characteristics
Table 5.12 summarized the analysis results for projects performance related
factors by project characteristics. When projects were sorted by project type,
residential projects had the highest project performance ratings at 4.94 and the
lowest mean was recorded for education projects (4.49). The difference is
statistically significant (p-value=0.041). Mean of project performance related factors
was significantly high for the projects constructed at a low density urban area than
the projects located at a high density urban area and suburban area (p-value=0.005).
Projects performance related factors don‟t change according to projects rebar need
(p-value = 0.567), construction site distance from rebar supplier (p-value = 0.320)
and place of rebar preparation (p-value = 0.344).

83
Table 5.12 Project performance impact by project characteristics
Project
characteristics
Project performance related factors
ANOVA test ( p< .05) Post Hoc (CI=95%)
N Mean p-value High Low
Project type
Residential 52
1
8
4.94
4
.43
0.041 Residential Education
Commercial 18 4.72
Education 25
7
4.49
4
.62
Health 7 4.62
Other 13 4.74
Project location
high density urban area 35 4.59 0.005 Low density urban area Low density
urban area
High density urban area
Suburban area low density urban area 47 4.99
suburban area 33 4.65
Projects‟ rebar
need
small 14 4.69 0.567 No significant differences
medium 61 4.73
big 40 4.85
Construction site
distance from
rebar supplier
0-10 km 35 4.79 0.320 No significant differences
No significant differences 10-30 km 50 4.85
30-50 km 27 4.64
50 km 3 4.33
Place of rebar
preparation
on-site cut and bend 85 4.77 0.344 No significant differences
off-site cut and bend 5 4.40
both 25 4.84
C. Contractor related factors impact by project characteristics
Table 5.13 showed contractor related factors impact by project characteristics.
Contractor related factors were impacted by project type. The mean for residential
projects were significantly higher than the mean for health projects (p-value =
0.002). The highest mean value of 4.90 for health projects was lack of significance
due to number of small sample size. Based on the location of the project, the mean
contractor related factors for low density urban area constructed projects was

84
significantly higher than those projects constructed in a high density urban area (p-
value = 0.000). According to Games-Howell test results, there is a significant
difference for contractor related factors performance between medium size and large
size projects due to projects rebar need at 95% confidence interval (p-value = 0.004).
Moreover, contractor related factors don‟t affected from construction site distance
from rebar supplier (p-value = 0.188) and place of rebar preparation (p-value =
0.495).
Table 5.13 Contractor related factors performance impact by project characteristics
Project
characteristics
Contractor related factors
ANOVA test ( p< .05) Post Hoc (CI=95%)
N Mean p-value High Low
Project type
Residential 52
1
8
4.82
4
.43
0.002 Residential Education
Commercial 18 4.42
Education 25
7
4.25
4
.62
Health
7 4.90 Other
13 4.51
Project location
high density urban area 35 4.28 0.000 Low density
urban area
High density
urban area
low density urban area 47 4.87
suburban area 33 4.57
Projects‟ rebar
need
small 14 4.42 0.004 big medium
medium 61 4.48
big 40 4.88
Construction site
distance from
rebar supplier
0-10 km 35 4.58 0.188 No significant differences
No significant differences 10-30 km 50 4.71
30-50 km 27 4.49
50 km 3 4.00
Place of rebar
preparation
on-site cut and bend 85 4.61 0.495 No significant differences
off-site cut and bend 5 4.27
both 25 4.64

85
D. AE company related factors impact by project characteristics
The mean value of AE company related factors for education projects was
3.06, indicating AE company related factors performance was statistically different
for education projects than residential, commercial and health projects (p-value =
0.000). Moreover, the performance of AE company related factors was statistically
different for residential and other projects according to Games-Howell test results.
Mean of AE company related factors was significantly high for the projects
constructed at a low density urban area than the projects located at a high density
urban area and suburban area (p-value=0.000). The lowest mean value for small
projects was lack of significance due to the sample number of 14. AE company
related factors performance differed according to the construction site difference
from rebar supplier. The mean value for 10-30km was significantly different from
the mean value of 0-10km and 50 km at p<.05 level. In addition, the performance
level of AE company related factors of 30-50km projects are significantly higher
than the projects those located 50 km away from rebar supplier (p-value = 0.000).
When the category of rebar preparation place was considered, the mean AE company
related factors for on-site cut and bend was higher than that of off-site cut and bend,
but this result was not significant as indicated by the p-value of 0.076 in Table 5.14

86
Table 5.14 AE company related factors performance impact by project
characteristics
Project
characteristics
AE company related factors
ANOVA test ( p< .05) Post Hoc (CI=95%)
N Mean p-value High Low
Project type
Residential 52
1
8
4.82
4
.43
0.000 Residential Education
Commercial 18 4.17 Commercial Education
Education 25
7
3.06
4
.62
Health Education
Health 7 4.71 Residential Other
Other 13 3.59
Project location
high density urban area 35 3.51 0.000 Low density
urban area
High density
urban area
low density urban area 47 4.70
suburban area 33 4.18
Projects‟ rebar
need
small 14 3.86 0.001 big medium
medium 61 3.94
big 40 4.70
Construction site
distance from
rebar supplier
0-10 km 35 3.81 0.000 10-30 km 0-10 km
10-30 km 50 4.63 10-30 km 50 km
30-50 km 27 4.07 30-50km 50 km
50 km 3 2.33
Place of rebar
preparation
on-site cut and bend 85 4.30 0.076 No significant differences
off-site cut and bend 5 3.23
both 25 4.03
E. Sub-contractor related factors impact by project characteristics
Table 5.15showed sub-contractor related factors impact by project
characteristics. The mean values of sub-contractor related factors performance for
some project types were significantly different (p-value = 0.003). The sub-contractor
related factors performance had the highest mean value for health projects and this
value was significantly different from the mean value of commercial and other

87
building types. Moreover, mean sub-contractor related factors performance for
residential buildings is significantly higher than the mean for commercial buildings
at p<.05 level. For the location of project the mean for sub-contractor related factors
for the projects located in a low density urban area was significantly higher than the
projects those located in a high density urban area at p<.05 level. There is no
significant differences in sub-contractor related factors performance due to projects‟
rebar need, construction site distance from rebar supplier and preparation place of
rebar at p<.05 level.
Table 5.15 Sub-contractor related factors performance impact by project
characteristics
Project
characteristics
Sub-contractor related factors
ANOVA test ( p< .05) Post Hoc (CI=95%)
N Mean p-value High Low
Project type
Residential 52
1
8
4.14
4
.43
0.003 Health Commercial
Commercial 18 3.50 Residential Commercial
Education 25
7
3.71
4
.62
Health Other
Health 7 4.50
Other 13 3.50
Project location
high density urban area 35 3.37 0.000 Low density urban area
High density urban area
low density urban area 47 4.30
suburban area 33 3.38
Projects‟ rebar
need
small 14 3.76 0.222 No significant differences
medium 61 3.81
big 40 4.08
Construction site
distance from
rebar supplier
0-10 km 35 3.77 0.158 No significant differences
No significant differences 10-30 km 50 4.06
30-50 km 27 3.84
50 km 3 3.13
Place of rebar
preparation
on-site cut and bend 85 3.88 0.559 No significant differences
off-site cut and bend 5 4.30
both 25 3.88

88
F. Supplier related factors performance impact by project characteristics
Table 5.16 presented that performance level of supplier related factors were
not significantly different for different project types at p<.05 level. The mean value
of supplier related factors performance for the projects those located in a low density
urban area was significantly higher than the projects located in a high density urban
area. Projects‟ rebar need had an effect on supplier related factors performance. The
performance for big projects is significantly higher than the performance of small
and medium size for suppliers. Although the mean values of supplier related factors
were different for different construction site distances and different place for
preparation the results lacked of significance according to Games-Howell test
results.
Table 5.16 Supplier related factors performance impact by project characteristics
Project
characte
ristics
Supplier related factors
ANOVA test ( p< .05) Post Hoc (CI=95%)
N Mean p-value High Low
Project
type
Residential 52
18
4.95
4.43
0.383 No significant differences
Commercial 18 4.91
Education 25
7
4.74
4.62
Health
7 5.25 Other
13 4.97
Project
location
high density
urban area
35 4.71 0.003 Low density
urban area
High density
urban area
low density
urban area
47 5.14
suburban
area
33 4.81
Projects‟
rebar
need
small 14 4.64 0.00 big small
medium 61 4.78
big 40 5.23 big medium
Construct
ion site
distance
from
rebar
supplier
0-10 km 35 4.80 0.006 No significant differences
No significant differences 10-30 km 50 5.03
30-50 km 27 4.99
50 km 3 3.83
Place of
rebar
preparati
on
on-site cut
and bend
85 4.96 0.037 No significant differences
off-site cut
and bend
5 4.23
both 25 4.92

89
5.2 Confirmatory factor analyses of the measurement models
Confirmatory factor analyses with the data of the main study were conducted
to select the observed factors(sub-factors) with low loadings in structural equation
modeling. rbSC performance model was represented by contractor related factors
(CONT-12 observed factors), AE company related factors (AE-7 observed factors),
sub-contractor related factors (SUBCONT-13 observed factors), supplier related
factors (SUP-12 observed factors), External factors (EXT-6 observed factors), rbSC
performance (RBperf-4 observed factors) and project performance (PROJperf-3
observed factors).
To verify the factor structure of contractor related factors scale, a confirmatory
factor analysis using Lisrel 8.51 was conducted. Factor analysis for the latent
variable of contractor related factors was performed through 12 items (Figure 5.5).
For purifying and reaching to fit indices for this construct items CONT2, CONT5,
CONT6, CONT9, CONT11, CONT12 were dropped for further analysis (Figure
5.6). Confirmatory factor analysis for the remaining factors yielded acceptable fit of
the confirmatory model in the data [χ2 = 2.55, p< .001, RMSEA = .106, GFI = .94,
AGFI = .87, CFI = .96, NNFI = .93] (Table 5.17).

90
Figure 5.5 Impacts of sub-factors on contractor related factors with t-values (before
confirmatory factor analysis)

91
Figure 5.6 Impacts of sub-factors on contractor related factors with t-values (after
confirmatory factor analysis)
Table 5.17 Fit indices for contractor related factors
Goodness-of-fit measure Allowable range of GOF measure Proposed Final
²/dof 3 3.462 2.283
RMSEA .01 0.147 0.106
GFI 0 (No fit) – 1(Perfect fit) 0.785 0.943
AGFI 0 (No fit) – 1(Perfect fit) 0.690 0.868
CFI 0 (No fit) – 1(Perfect fit) 0.830 0.956
NNFI 0 (No fit) – 1(Perfect fit) 0.792 0.927

92
Factor analysis for the subscale of AE company related factors was performed
through 7 items (Figure 5.7). For purifying and reaching to fit indices for this
construct items a parcel named AE8 was constructed with the mean of items AE1,
AE2, AE3. The answers given to these three items show that they are parallel in
logic. Confirmatory factor analysis for the new construct yielded acceptable fit of
the confirmatory model in the data [χ2= 77.15, p< .001, RMSEA = .00, GFI = .99,
AGFI = .95, CFI = 1.00, NNFI = 1.00] (Table 5.18). All items had loadings above
than .30, minimum loading was .49 and the maximum loading was 0.87 (Figure
5.8).
Figure 5.7 Impacts of sub-factors on AE company related factors with t-values and
path coefficients in brackets (before confirmatory factor analysis)
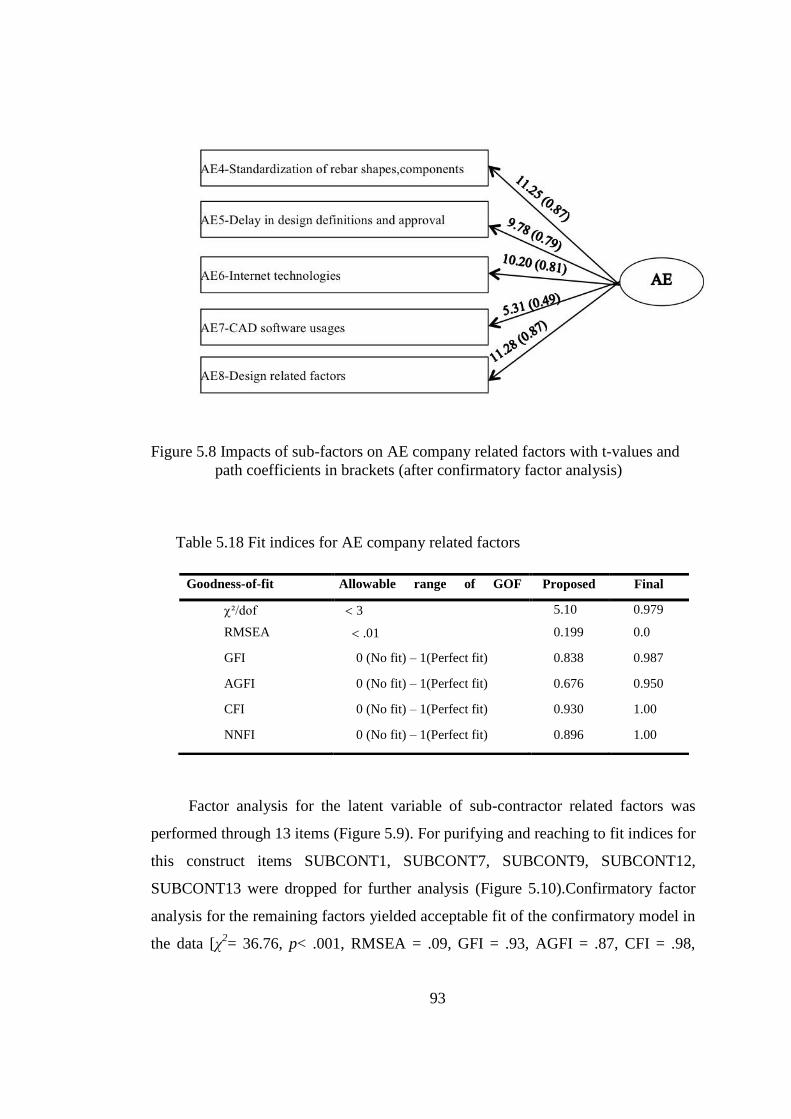
93
Figure 5.8 Impacts of sub-factors on AE company related factors with t-values and
path coefficients in brackets (after confirmatory factor analysis)
Table 5.18 Fit indices for AE company related factors
Factor analysis for the latent variable of sub-contractor related factors was
performed through 13 items (Figure 5.9). For purifying and reaching to fit indices for
this construct items SUBCONT1, SUBCONT7, SUBCONT9, SUBCONT12,
SUBCONT13 were dropped for further analysis (Figure 5.10).Confirmatory factor
analysis for the remaining factors yielded acceptable fit of the confirmatory model in
the data [χ2= 36.76, p< .001, RMSEA = .09, GFI = .93, AGFI = .87, CFI = .98,
Goodness-of-fit
measure
Allowable range of GOF
measure
Proposed Final
²/dof 3 5.10 0.979
RMSEA .01 0.199 0.0
GFI 0 (No fit) – 1(Perfect fit) 0.838 0.987
AGFI 0 (No fit) – 1(Perfect fit) 0.676 0.950
CFI 0 (No fit) – 1(Perfect fit) 0.930 1.00
NNFI 0 (No fit) – 1(Perfect fit) 0.896 1.00

94
NNFI = .94] (Table 5.19).All items had loadings above than .30, minimum loading
was .52 and the maximum loading was 0.82.
Figure 5.9 Impacts of sub-factors on sub-contractor related factors with t-values and
path coefficients in brackets (before confirmatory factor analysis)

95
Figure 5.10 Impacts of sub-factors on sub-contractor related factors with t-values and
path coefficients in brackets (after confirmatory factor analysis)
Table 5.19 Fit indices for sub-contractor related factors
Factor analysis for the latent variable of supplier related factors was performed
through 12 items (Figure 5.11). For purifying and reaching to fit indices for this
Goodness-of-fit measure Allowable range of GOF measure Proposed Final
²/dof 3 4.898 1.888
RMSEA .01 0.185 0.086
GFI 0 (No fit) – 1(Perfect fit) 0.699 0.925
AGFI 0 (No fit) – 1(Perfect fit) 0.579 0.866
CFI 0 (No fit) – 1(Perfect fit) 0.764 0.957
NNFI 0 (No fit) – 1(Perfect fit) 0.717 0.940

96
construct items SUP2, SUP7, SUP8, SUP12 were dropped for further analysis
(Figure 5.12).Confirmatory factor analysis for the remaining factors yielded
acceptable fit of the confirmatory model in the data[χ2 = 31.69, p< .001, RMSEA =
.07, GFI = .94, AGFI = .88, CFI = .96, NNFI = .94](Table 5.20). All items had
loadings above than .30, minimum loading was .53 and the maximum loading was
.81.
Figure 5.11 Impacts of sub-factors on supplier related factors with t-values and path
coefficients in brackets (before confirmatory factor analysis)

97
Figure 5.12 Impacts of sub-factors on supplier related factors (after confirmatory
factor analysis)
Table 5.20 Fit indices for supplier related factors
Goodness-of-fit measure Allowable range of GOF measure Proposed Final
²/dof 3 6.97 1.58
RMSEA .01 0.229 0.072
GFI 0 (No fit) – 1(Perfect fit) 0.645 0.935
AGFI 0 (No fit) – 1(Perfect fit) 0.487 0.883
CFI 0 (No fit) – 1(Perfect fit) 0.698 0.960
NNFI 0 (No fit) – 1(Perfect fit) 0.631 0.943
Factor analysis for the latent variable of external factors was performed
through 6 items (Figure 5.13). For purifying and reaching to fit indices for this

98
construct sub-factors EXT3 was dropped for further analysis (Figure
5.14).Confirmatory factor analysis for the remaining factors yielded acceptable fit of
the confirmatory model in the data [χ2 = 3.85, p< .001, RMSEA = .00, GFI = .99,
AGFI = .95, CFI = 1.00, NNFI = 1.00] (Table 5.21).All items had loadings above
than .30, minimum loading was .37 and the maximum loading was .63.
Figure 5.13 Impacts of sub-factors on external factors with t-values and path
coefficients in brackets (before confirmatory factor analysis)

99
Figure 5.14 Impacts of sub-factors on external factors with t-values and path
coefficients in brackets (after confirmatory factor analysis)
Table 5.21 Fit indices for external factors
Factor analysis for the latent variable of rbSC performance was performed
through 4 items (Figure 5.15). For purifying and reaching to fit indices for this
construct sub-factors RBperf3 was dropped for further analysis (Figure
5.16).Confirmatory factor analysis for the remaining factors yielded acceptable fit of
the confirmatory model in the data [χ2 = 0.00, p< .001, RMSEA = .00, GFI = 1.00,
AGFI = 1.00, CFI = 1.00, NNFI = 1.00] (Table 5.22).All items had loadings above
than .30, minimum loading was .53 and the maximum loading was .80.
Goodness-of-fit
measure
Allowable range of GOF measure Proposed Final
²/dof 3 5.176 0.963
RMSEA .01 0.191 0.00
GFI 0 (No fit) – 1(Perfect fit) 0.880 0.987
AGFI 0 (No fit) – 1(Perfect fit) 0.720 0.950
CFI 0 (No fit) – 1(Perfect fit) 0.799 1.00
NNFI 0 (No fit) – 1(Perfect fit) 0.665 1.00

100
Figure 5.15 Impacts of sub-factors on rbSC performance with t-values and path
coefficients in brackets (before confirmatory factor analysis)
Figure 5.16 Impacts of sub-factors on rbSC performance with t-values and path
coefficients in brackets (after confirmatory factor analysis)
Table 5.22 Fit indices for rbSC performance factors
Goodness-of-fit measure Allowable range of GOF measure Proposed Final
²/dof 3 16.45 0.00
RMSEA .01 0.368 0.00
GFI 0 (No fit) – 1(Perfect fit) 0.874 1.00
AGFI 0 (No fit) – 1(Perfect fit) 0.370 1.00
CFI 0 (No fit) – 1(Perfect fit) 0.873 1.00
NNFI 0 (No fit) – 1(Perfect fit) 0.619 1.00

101
Factor analysis for the latent variable of project performance was performed
through 3 items (Figure5.17). Because of having good fit indices any sub-factor was
dropped for further analysis. Confirmatory factor analysis for the factors yielded
acceptable fit of the confirmatory model in the data [χ2 = 0.00, p< .001, RMSEA =
.00, GFI = 1.00, AGFI = 1.00, CFI = 1.00, NNFI = 1.00] (Table 5.23).All items had
loadings above than .30, minimum loading was .45 and the maximum loading was
.63.
Figure 5.17 Impacts of sub-factors on project performance with t-values and path
coefficients in brackets (before confirmatory factor analysis)
Table 5.23 Fit indices for project performance related factors
Goodness-of-fit measure Allowable range of GOF measure Proposed Final
(not modified)
²/dof 3 0.00 0.00
RMSEA .01 0.00 0.00
GFI 0 (No fit) – 1(Perfect fit) 1.00 1.00
AGFI 0 (No fit) – 1(Perfect fit) 1.00 1.00
CFI 0 (No fit) – 1(Perfect fit) 1.00 1.00
NNFI 0 (No fit) – 1(Perfect fit) 1.00 1.00

102
5.3 Analysis of Structural Model
Using LISREL, the relationships were examined between the factor, rbSC
performance (a latent variable with four sub-factors) and project performance (a
latent variable with three sub-factors), and four participant related factors, namely
contractor related factors (a latent variable with twelve sub-factors), AE company
related factors (a latent variable with seven sub-factors), sub-contractor related
factors (a latent variable with thirteen sub-factors), supplier related factors (a latent
variable with twelve sub-factors) and finaly external factors (a latent variable with
six sub-factors). The hypothesized model after confirmatory factor analysis is
presented in Figure 5.18 where ovals represent latent factors, and rectangles
represent measured factors.
To specify the model in the study, the first step was to test the measurement
model, providing evidence for how well the latent variables were measured by
predefined sub-factors. Unidimensionality of the latent variables was assessed using
confirmatory factor analysis. It was necessary to re-specify the rbSC performance,
contractor related factors, AE company related factors, sub-contractor related
factors, supplier related factors and external factors as latent variables to achieve
sufficient unidimensionality. rbSC performance construct was reduced to 3 sub-
factors, contractor related factors construct was reduced to 6 sub-factors, AE
company related factors construct was reduced to 5 sub-factors, sub-contractor
related factors construct was reduced to 8 sub-factors, supplier related factors was
reduced to 8 sub-factors and finaly external factors construct was reduced to 5 sub-
factors. After reaching goodness of fit indices within allowable ranges for each
construct, each measurement construct was considered sufficiently unidimensional,
reliable and valid to support further assessment of the structural model.
Since each construct was validated and checked for reliability, the next step
was about testing the relationships between the variables within the structural model.
The developed structural model is depicted in Figure 5.18. The numbers on the
arrows in Figure 5.18 originating from the latent variables represent path

103
coefficients. All links were statistically significant at p<0.05 level, since their t-value
were higher than 1.96, except the relationships between external factors and
contractor related factors, supplier related factors and contractor related factors and
sub-contractor related factors and contractor related factors. The goodness-of-fit
results for the proposed structural model were presented in Table 5.24. The results
indicated that the model needs improvement to reach goodness-of-fit results within
the allowable range.
Table 5.24 Fit indices for developed structural model
Goodness-of-fit measure Allowable range of GOF measure Fit indices
²/dof 3 2.15
RMSEA .01 0.100
GFI 0 (No fit) – 1(Perfect fit) 0.606
AGFI 0 (No fit) – 1(Perfect fit) 0.554
CFI 0 (No fit) – 1(Perfect fit) 0.689
NNFI 0 (No fit) – 1(Perfect fit) 0.666

104
Legend
Figure 5.18 Developed structural model with path coefficients and t-values (brackets). (Solid lines refer to significant relations, dashed lines refer to
insignificant relations at p<0.05 level)
Latent variable Observed variable Existence of relationship Absence of relationship

105
In the study of finding the impacts of factors on rbSC performance to reach the
fit indices within the allowable range, the sub-factors were parceled according to
their conceptual relations. For contractor related factors, sub-factors CONT1,
CONT3, CONT4 were summed to create a total scale score for a new item called
CONA and CONT7, CONT8, CONT10 were summed to create a total scale score
for a new item called CONB. AE company related factors parceled into three sub-
factors called AEA (created by summing up AE1, AE2, AE3), AEB (created by
summing up AE4, AE5), AEC (create by summing up AE6, AE7). SUBCONT3,
SUBCONT6, SUBCONT8, SUBCONT11 as the sub-factors related to sub-
contractors were summed up to create a total score for a new sub-factor called
SUBCONTA and SUBCONT2, SUBCONT4, SUBCONT5, SUBCONT10 were
summed up to create a total score for the second new sub-factor for sub-contractor
related factor with the name of SUBCONTB. Supplier related factors parceled into
two, due to the logical relations between the items. For this reason SUP1, SUP3,
SUP6, SUP9, SUP11 were summed up to create SUPA and only SUP4 and SUP10
were summed to create SUPB. All remaining external factors were summed up to
create EXT. As it is described above there were two parcels created for each
participant except AE company related factors which had three parcels and one
parcel was created for external factors.
The path coefficients and t-values in the parceled model were presented in
Figure 5.16. Path coefficients and t-values were statistically significant at p<0.05,
except for the relationship between EXT (external factors) and CONT (contractor
related factors). The goodness-of-ft results of the parceled model were presented in
Table 5.25. The results indicated better fit indices than the proposed model but still
did not reach to the best fit indices.
“Contractor related factors” latent variable was found to have an impact on
rbSC performance. Since the contractors positioned as a mediator in the framework
with the factors parceled under CONTA and CONTB, they have power to impact
rbSC performance level. Production performance in the construction industry cannot

106
be separated from contractor‟s productivity. For the defined factors under this
construct, factor loading were found to be 0.82 for the contractor companies
management and culture related factors (CONT1, CONT3, CONT4), 0.56 for
contractor‟s resource and capability related factors (CONT7, CONT8, CONT10).
These findings show that new management philosophies play important role for all
sized contractors including small and medium sized. Materials management
competency and project management competency can make a significant
contribution to the cost effectiveness of a construction project. To reach the level of
manufacturing industry in applying the new management philosophies, it is the first
step to be aware of them.
“AE company related factors” were found to be most influential on “contractor
related factors”. AE companies are the key companies as they start and manage the
design process. Designers play a very important role as their work involves from
inception to completion of a project. “Delay in design definitions and approval” and
“standardization of rebar shapes, components” were found to be having the highest
factor loading with a value of 0.95, under this construct. Managing design process is
a core activity for the continuity of the chain. “Standardization of rebar shapes,
components” is important for all rbSC participants to save time and decrease the
percentages of wrong products. Design related factors have a loading of 0.84 and
technology and CAD usages related factors have relatively lower loading of 0.75
The skill levels of the labor in “reading technical drawings” and in handling the
cutting, bending and assembling operations with close relationships were found to be
most important indicators for sub-contractor related factors. Also utilization of the
team by their team leader and education level of the workers has impacts on sub-
contractor related factors. As a second group, availability of the good conditions and
characteristics not only for working sites but also for the constructed projects has an
impact on sub-contractor related factors with a loading of 0.81.
“Supplier related factors” were found to be having the lowest factor loading
with a value of 0.31 under the main construct. Delivery speed dependability, supplier

107
responsiveness, financial stability, number of faultless delivery and warranties given
by the supplier were the factors that have the highest factor loading of 0.95 under
supplier related factors. Price and quality of the materials also found to be important
in accordance with the issues described above. As it is seen, right delivery is the key
issue in this construct. Right delivery means that delivering the right material, at the
right time, to the right place with the best price.
“External factors” did not affected by the other factors but they had impacts on
the other latent factors as they were used as independent latent variable in the
proposed model. According to the results “external factors” have an impact on “AE
company related factors” with a factor loading of 0.52, on “sub-contractor related
factors” with a factor loading of 0.64, on “supplier related factors” with a factor
loading of 0.72. As most of the external related factors were related to economy and
cost, “supplier related factors” were influenced more than the other participants.
Economic stability in the country, transportation cost has the potential to affect the
supplier‟s price and their position in the chain. The factors used under “external
factors” construct have a high factor loading with a value of 0.89.
Table 5.25 Fit indices for the parceled model
Goodness-of-fit measure Allowable range of GOF measure Fit indices
²/dof 3 2.20
RMSEA .01 0.104
GFI 0 (No fit) – 1(Perfect fit) 0.811
AGFI 0 (No fit) – 1(Perfect fit) 0.736
CFI 0 (No fit) – 1(Perfect fit) 0.842
NNFI 0 (No fit) – 1(Perfect fit) 0.805

108
Legend
Figure 5.19 Parceled model with path coefficients and t-values (brackets)
Latent variable Observed variable Existence of relationship

109
Finally, the relationships were tested by removing the link between rbSC
performance and project performance for the proposed model. Path coefficients and
t-values were statistically significant at p<0.05 (Figure 5.17). Removing the link
between two factors improved the goodness-of-fit indices obtained in the previous
parceled model. Table 5.26 presented the comparison of the goodness-of-fit indices
obtained in the proposed model, parceled model and the final model and Table 5.27
presented the factor loadings (path coefficients) of the sub-factors in the final model.
Table 5.26 Comparison of the fit indices for models
Goodness-of-fit
measure
Allowable range of GOF
measure
Proposed
Model
Parceled
model
Final
model
²/dof 3 2.15 2.20 2.04
RMSEA .01 0.100 0.104 0.096
GFI 0 (No fit) – 1(Perfect fit) 0.606 0.811 0.876
AGFI 0 (No fit) – 1(Perfect fit) 0.554 0.736 0.798
CFI 0 (No fit) – 1(Perfect fit) 0.689 0.842 0.926
NNFI 0 (No fit) – 1(Perfect fit) 0.666 0.805 0.898

110
Legend
Figure 5.20 Final model with path coefficients and t-values (brackets)
Latent variable Observed variable Existence of relationship

111
Table 5.27 Factor loadings of the sub-factors for the final model
Factors Factor Loading
Contractor related factors
CONTA
CONT1 Materials management competency 0.81
CONT3 Project management competency 0.81
CONT4 Organization culture of the contractor 0.81
CONTB
CONT7 Past experience of the contractor 0.55
CONT8 Operating and machinery 0.55
CONT10 Communication system of the contractor 0.55
AE company related factors
AEA
AE1 Design information flow 0.84
AE2 Design integration 0.84
AE3 Design changes 0.84
AEB AE4 Standardization of rebar shapes, components 0.94
AE 5 Delay in design definitions and approval 0.94
AEC AE6 Internet technologies 0.75
AE7 CAD software usages 0.75
Sub-contractor related factors
SUBCONTA
SUBCONT3 Accommodation conditions on site 0.81
SUBCONT6 Standardization of rebar shapes,
components 0.81
SUBCONT8 Processing area on site 0.81
SUBCONT11 Transportation of material on site 0.81
SUBCONTB
SUBCONT2 Labor utilization 0.96
SUBCONT4 Education level of the workers 0.96
SUBCONT5 Ability of reading technical drawing 0.96
SUBCONT10 Team relationships 0.96
Supplier related factors
SUPA
SUP1 Delivery speed dependability 0.95
SUP3 Supplier responsiveness 0.95
SUP6 Financial stability 0.95
SUP9 Number of faultless delivery 0.95
SUP11 Warranties given by the supplier 0.95
SUPB SUP4 Price of the material 0.76
SUP10 Quality of the material 0.76
External factors
EXT
EXT1 Economic stability in the country 0.89
EXT2 Transportation cost 0.89
EXT4 Legal conditions 0.89
EXT5 Client characteristics 0.89
EXT6 Environmental factors 0.89

112
To determine the relationships between the “project performance” and the other
latent variables an IV (Independent Variable) model was tested (Figure 5.21). The
goodness-of-fit indices for this model presented in Table 5.28. As it was described
the “project performance” related factors were selected through a literature survey as
“project profitability”, “schedule performance” and “satisfaction of the customer”.
The results indicate that all sub-factors were significant at p<0.05 level. Factor
loadings for the project performance related factors range between 0.43 and 0.61,
with the highest factor loading for “satisfaction of the customer”. It is known from
the literature survey that to complete the projects regarded to the users‟ expectations
and satisfaction is essential. The results indicate that the companies believe that if
customers are satisfied, the project can be considered as successful. “Project
profitability” has the lowest factor loading in this construct. As “project
profitability” can be considered as “business benefit” the results revealed that the
companies gave more importance to the “customer benefits” than their “business
benefits”. “Schedule performance” is an indicator related to the duration of
completing the project. It can be considered as an indicator that shows the
effectiveness of the project. “Schedule performance” is not only important for
project profitability but also for the satisfaction of the customer.
It was also observed that “contractor related factors”, “AE company related
factors”, “sub-contractor related factors”, “supplier related factors” and “external
factors” did not have an impact on project performance directly. T-values for these
latent variables were not significant at p<0.05 level (Figure 5.21). Only “rbSC
performance” was found to be having an impact on “project performance”. In other
words, the higher the “rbSC performance” was, the higher level for “project
performance” was reached. The factor loading for this impact was 1.04. In the IV
model “missing / wrong / damaged / defective product /production”, “responsiveness
to customers” and “rbSC integration” were found to be indicators that measure the
“rbSC performance” with factor loadings of 0.73, 0.76 and 0.64 respectively. In
addition to the first two indicators “rbSC integration” was found to be significant in
the construct. As it was described in chapter 2, to increase the profitability of the
project, the amount of “missing / wrong / damaged / defective product /production”
should be low. “Responsiveness to customers” is important for customer satisfaction

113
and schedule performance of the project. “rbSC integration” is important for the
collaboration of the participants.
Legend
Figure 5.21 Independent variable model with path coefficients and t values (in
brackets)
Latent variable Observed variable Existence of
relationship
Absence of
relationship

114
Table 5.28 Fit indices for IV (Independent variable) model
Goodness-of-fit
measure
Allowable range of GOF
measure
IV
model
²/dof 3 2.12
RMSEA .01 0.099
GFI 0 (No fit) – 1(Perfect fit) 0.836
AGFI 0 (No fit) – 1(Perfect fit) 0.735
CFI 0 (No fit) – 1(Perfect fit) 0.866
NNFI 0 (No fit) – 1(Perfect fit) 0.808
5.4 Test of Hypotheses
The hypotheses defined in chapter 3, were tested statistically by using LISREL
program. Path coefficients of the structural model and t-values of the factors were
used to check the statistical results and observe the relations between the construct
components having p value more than 0.05 (Figure 5.22 and Figure 5.23).
Hypothesis 1
H01: External factors have no impact on AE company related factors
Hypothesis 1 was formulated to analyze the impacts of external factors on AE
company related factors. For the analysis, t-value of the link from external factors to
AE company related factors and path coefficient (standardized estimates) of the link
were used. As t-value of the link was 4.99 and significant at p<0.05 level (higher
than 1.96) hypothesis 1 was rejected. This means external factors have an impact on
AE company related factors. The path coefficient of 0.52 indicated a moderate
positive impact.
External factors were presented by all sub-factors defined in the proposed
construct for EXT latent variable except EXT3(Taxes). The sub-factor of EXT
loaded significantly on its latent variable (factor). The value of the loading was 0.89.
Additionally three sub-factors under AE company related factors loaded significantly
(t-value for AEA =.10.34, t-value for AEB =11.74, t-value for AEC = 9.18) at
p<0.05 level .For AE company related factors the parcel created by AE4

115
(standardization of rebar shapes, components) and AE5 (delay in design definitions
and approval) were found to be the most important factors with a path coefficient of
0.94. Design related issues about AE company with AEA parcel name had a path
coefficient of 0.84. The parcel created by summing up AE6 (internet technologies)
and AE7 (CAD software usages) has moderately influenced AE related factors and
its path coefficient was 0.75.
Hypothesis 2
H02: External factors have no impact on sub-contractor related factors
The relationship between external factors and sub-contractor related factors
(hypothesis 2) was significant at the 0.05 level with a path coefficient of 0.64 and t-
value of 5.63. As a result hypothesis 2 was rejected.
External factors were presented by a parcel including all sub-factors except
EXT3(Taxes). SCONT2 (labor utilization), SCONT4 (education level of the
workers), SCONT5 (ability of reading technical drawings) and SCONT10 (team
relationships) under the parcel SCONTB influenced sub-contractor related factors
significantly (t-value = 8.76) at 0.05 level and had the highest path coefficient of
0.96. SCONT3 (accommodation conditions on site), SCONT6 (Standardization of
rebar shapes, components), SCONT8 (processing area on site) and SCONT11
(transportation of materials on site) with the SCONTA parcel name had a significant
impact (t-value = 7.11) on sub-contractor related factors with the path coefficient of
0.81.
Hypothesis 3
H03: External factors have no impact on supplier related factors
The link from external factors to supplier related factors was found to be
positive and significant. As a result hypothesis 3 was rejected at 0.05 level (t-value =
7.73) The value of the impact of external factors on supplier related factors was quite
high with 0.72.
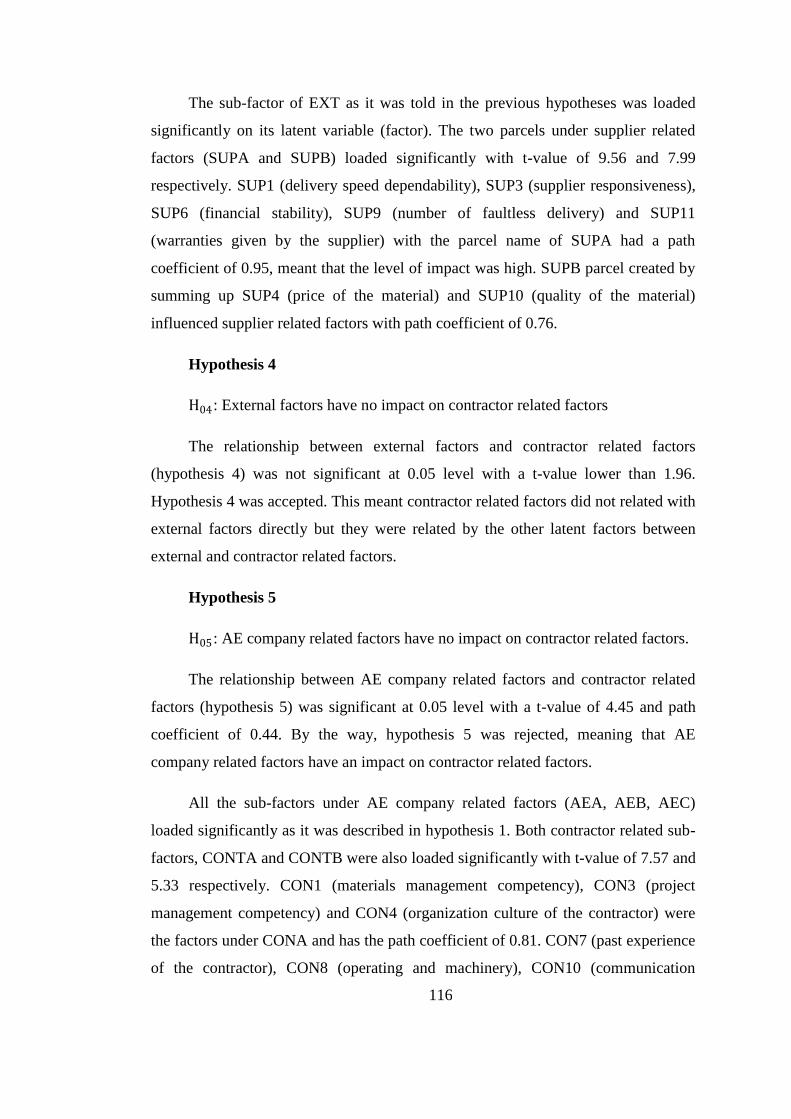
116
The sub-factor of EXT as it was told in the previous hypotheses was loaded
significantly on its latent variable (factor). The two parcels under supplier related
factors (SUPA and SUPB) loaded significantly with t-value of 9.56 and 7.99
respectively. SUP1 (delivery speed dependability), SUP3 (supplier responsiveness),
SUP6 (financial stability), SUP9 (number of faultless delivery) and SUP11
(warranties given by the supplier) with the parcel name of SUPA had a path
coefficient of 0.95, meant that the level of impact was high. SUPB parcel created by
summing up SUP4 (price of the material) and SUP10 (quality of the material)
influenced supplier related factors with path coefficient of 0.76.
Hypothesis 4
H04: External factors have no impact on contractor related factors
The relationship between external factors and contractor related factors
(hypothesis 4) was not significant at 0.05 level with a t-value lower than 1.96.
Hypothesis 4 was accepted. This meant contractor related factors did not related with
external factors directly but they were related by the other latent factors between
external and contractor related factors.
Hypothesis 5
H05: AE company related factors have no impact on contractor related factors.
The relationship between AE company related factors and contractor related
factors (hypothesis 5) was significant at 0.05 level with a t-value of 4.45 and path
coefficient of 0.44. By the way, hypothesis 5 was rejected, meaning that AE
company related factors have an impact on contractor related factors.
All the sub-factors under AE company related factors (AEA, AEB, AEC)
loaded significantly as it was described in hypothesis 1. Both contractor related sub-
factors, CONTA and CONTB were also loaded significantly with t-value of 7.57 and
5.33 respectively. CON1 (materials management competency), CON3 (project
management competency) and CON4 (organization culture of the contractor) were
the factors under CONA and has the path coefficient of 0.81. CON7 (past experience
of the contractor), CON8 (operating and machinery), CON10 (communication

117
system of the contractor) under the parcel CONB were validated in the contractor
related factors construct with a path coefficient of 0.55. This information about sub-
factors of contractor related factors was true for all hypotheses consisting the
contractor related factors.
Hypothesis 6
H06 : Sub-contractor related factors have no impact on contractor related
factors.
Sub-contractor related factors with two sub-factors have a significant
relationship with contractor related factors at the 0.05 level with a t-value of 3.19
and path coefficient of 0.32. As a result hypothesis six was rejected.
Significant sub-factors related to sub-contractors were described in hypothesis
two and sub-factors related to contractors were described in the fifth hypothesis.
Hypothesis 7
H07: Supplier related factors have no impact on contractor related factors.
The relationship between supplier related factors and contractor related factors
(hypothesis 7) was significant at the 0.05 level with a t-value of 2.82 and path
coefficient of 0.30. t-value higher than 1.96 indicated that the null hypothesis was
rejected. Although the relationship between supplier related factors and contractor
related factors was positive, the magnitude of the relationship was not high.
The two parcels under supplier related factors were loaded significantly as told
in the third hypothesis. Contractor related factors also represented by CONA and
CONB as described in the fifth hypothesis in detail.
Hypothesis 8
H08: Contractor related factors have no impact on rbSC performance.
Hypothesis 8 was formulated to analyze the impacts of the contractor related
factors on rbSC performance. The null hypothesis was rejected due to the t-value of
3.82 that was significant at 0.05 level. This means contractor related factors have an

118
impact on rbSC performance. The path coefficient for this relationship was
calculated as 0.54, meaning a moderate impact.
rbSCperf1 and rbSCperf2 were the sub-factors loaded significantly at 0.05
level under rbSC performance factor with t-value of 3.98 and 4.60 respectively.
rbSCperf2 (responsiveness to the customers) was found to have the highest path
coefficient (0.84) and rbSCperf1 (missing / wrong / damaged / defective product /
production) had a path coefficient of 0.74.
Hypothesis 9
H09: rbSC performance has no impact on project performance.
Hypothesis 9 was rejected because t-value of the link between rbSC
performance and project performance was 2.99 and it was significant at 0.05 level .
Figure 5.22 Hypothesized model with path coefficients and t values (in
brackets)

119
CHAPTER 6
CONCLUSIONS AND RECOMMENDATIONS
This study focused on the supply chain of rebars which are one of the major
and critical building materials used in contemporary construction projects. A
theoretical framework consisting of factors that have impacts on rbSC performance
and project performance was developed. The impacts were analyzed according to the
outputs gathered from LISREL. On the other hand some specific issues elicited from
the literature survey and informal face-to-face interviews were analyzed according to
their affects on rbSC performance, project performance and the other defined factors.
These were: projects location, projects rebar need, site distance from rebar supplier,
rebar fabrication and assembly place of rebar. The following paragraphs present the
conclusions, limitations and recommendations of this study.
6.1 Conclusions
In this study, face-to face interviews and data obtained from questionnaire
revealed that rbSC performance was influenced by participant related factors and
characteristics of the projects. Identification of the most important factors,
problematic issues in the SC and their causes is important for SC participants to
determine the strengths and weaknesses of these for continuous improvement.
Analysis done with LISREL according to the data obtained from respondents
revealed the critical factors which need to be considered from the beginning of the
process to increase the efficiency. These factors are given in the table below:

120
Table 6.1 Critical success factors for rbSC
Contractor related factors
CONT1 Materials management competency
CONT3 Project management competency
CONT4 Organization culture of the contractor
CONT7 Past experience of the contractor
CONT8 Operating and machinery
CONT10 Communication system of the contractor
AE company related factors
AE1 Design information flow
AE2 Design integration
AE3 Design changes
AE4 Standardization of rebar shapes, components
AE 5 Delay in design definitions and approval
AE6 Internet technologies
AE7 CAD software usages
Sub-contractor related factors
SUBCONT3 Accommodation conditions on site
SUBCONT6 Standardization of rebar shapes, components
SUBCONT8 Processing area on site
SUBCONT11 Transportation of material on site
SUBCONT2 Labor utilization
SUBCONT4 Education level of the workers
SUBCONT5 Ability of reading technical drawing
SUBCONT10 Team relationships
Supplier related factors
SUP1 Delivery speed dependability
SUP3 Supplier responsiveness
SUP6 Financial stability
SUP9 Number of faultless delivery
SUP11 Warranties given by the supplier
SUP4 Price of the material
SUP10 Quality of the material
External factors
EXT1 Economic stability in the country
EXT2 Transportation cost
EXT4 Legal conditions
EXT5 Client characteristics
EXT6 Environmental factors

121
Findings based on project related section of the questionnaire reflect the
changes in rbSC and project performance and the factors due to project type, project
location, project rebar requirement and site distance from rebar supplier. The
relationships between rbSC indicators, determinants and project characteristics and
site location are presented in Table 6.1.
Table 6.2 The relationships between factor groups, project characteristics and site
location
rbSC Project Contractor
Sub-
contractor Supplier AE Company
Performance Performance Related
Factors
Related
Factors
Related
Factors
Related
Factors
Project type
Project
location Project
rebar
requirement
Site distance
from rebar
supplier
As explained in detail in Chapter 5, problem areas in managing rbSC and their
reasons were identified according to the information gathered in section four of
Chapter 2 which concerns culture related issues in workplace. The dimensions of
culture studied by different authors were adapted to the study to determine the
reasons of the problems occurred in rbSC. Definitions of culture dimensions were
associated with the real world cases in this study. The reasons for the problematic
issues in rbSC overlap with the cultural characteristics of the rbSC participants.
These problems and their reasons for their occurrences are given in Tables 6.3 and
6.4.

122
Table 6.3 The relationships between main problem areas and their reasons for
contractor and AE company related factors
Problematic participant related factors
in rbSC
Common reasons for problems
(determined in literature)
Contractor related factors
Organization structure of the contractor
(CONT5)
Insurance cover (CONT6)
Trouble shooting and problem solving
(CONT9)
Communication system of the
contractor (CONT10)
Interaction between structural designer
and job site (CONT11)
The effects of hierarchical culture:
Leaders/owners see themselves as
being highly capable coordinators
and organizers.
Job definitions are not specified
Individualism effects: Weak
relationships among company staff
and with other participants. Not
taking responsibility for problem
solving.
Result-oriented: Less importance
given to the process related issues.
Solution alternatives for the problems
and the responsibilities for solving
the problems were not defined well.
Poor communication: About who is
responsible for what, when and
where)
Short-term orientation: Staff likely to
complete works at the last minute;
adhoc solutions adopted; long-term
vision is lacking
Loose-control organizations:
Meeting times are not kept
punctually
AE company related factors
Design information flow (AE1)
Design integration (AE2)
Design changes (AE3)
Standardization of rebar shapes,
components (AE4)
Delay in design definitions and
approval (AE5)
Internet technologies (AE6)
Result-oriented contracts: The
contracts between contractor and AE
companies don‟t include clauses
related to process -additional works,
work changes, durations and
penalties.
Loose-control organizations: Lack of
consideration for costs duration and
punctuality intervention.
Inefficient use of technology:
Between different groups with
different culture.
Low communicative: Barriers exist in
the flow of information.

123
Table 6.4 The relationships between main problem areas and their reasons for sub-
contractor and supplier related factors
Problematic participant related factors
in rbSC
Common reasons for problems
(determined in literature)
Sub-contractor related factors
Improved communication and learning
skills (SUBCONT1)
Labor utilization (planned weekly,
monthly working) (SUBCONT2)
Accommodation conditions on site
(SUBCONT3)
Education level of the workers
(SUBCONT4)
Ability to read technical drawing
(SUBCONT5)
Processing area on site (SUBCONT6)
Storage area on site (SUBCONT9)
Team relationships (SUBCONT10)
Transportation of material on site
(SUBCONT11)
Uneducated sub-contractors:
Construction teams without
qualification or training, lower the
work quality cause reworks that
increase the total cost.
Result-oriented rather than process-
oriented: Tender price is the most
important criterion for the contractors
and quality is sometimes forgotten.
Affective culture rather than neutral:
Level of expressing emotion is high.
Job-oriented culture rather than
employee oriented culture: The value
given to the sub-contractors are
usually in low levels. Contractors do
not concern about the
accommodation and working
conditions of sub-contractors, and
their aim is just completing the job.
Supplier related factors
Writing and reading technical skills of
contract and technical documents
(SUP7)
Supplier-contractor relationships
(SUP8)
Inadequate in adopting time and
resource management techniques.
Result oriented rather than process
oriented: The focus is just on the
amount of sale.
Pragmatic rather than normative:
Market driven.

124
6.2 Limitations
Firstly, the study was done at the company level and only one-person from
each company answered the questionnaire. However, the most knowledgeable and
educated person in the company was asked to respond to the questions. On the other
hand the respondees were not always able to answer questions that were related to
their field or company.
Since the study depended on data gathered from the companies located in
Gaziantep city, the data is not representative of the whole country. The size of the
city is not big and the volume of the construction is not comparable to cities like
Istanbul and Ankara. Moreover, the organization culture and the practice of
profession may be different in this region.
Finally, the sample size with 78 companies may not be sufficient to formulate
a statistical model that consists of 4 groups of participants (contractors, AE
companies, sub-contractors, suppliers).
6.3 Contribution of the Current Study
The following contributions have been achieved by this study.
Determination of the participant related factors with their impacts on rbSC
performance: By using SEM the latent variables and their sub-factors were analyzed.
The factors that should be considered for higher performance of rbSC in SMEs were
identified.
Problematic issues based on self-assessment as well as other participants’
assessments were determined: to show the current situation in the SMEs in the
construction industry.
Factors performance was associated with the project characteristics: Project
characteristics that have an effect on rbSC performance were determined.

125
6.4 Recommendations for Contractors
The main contractors need to:
Take into consideration the effects of the project type, location, rebar
requirement while preparing their bids, schedule and contracts.
Adopt communitarism culture in their business activities rather than
individualism culture for the overall good of SC.
Change their workplace structure and decrease the effects of hierarchy
in their organizations. The contractor companies need to work with
qualified technical staff at different level of the organization.
Provide long-term relation with all rbSC participants. Build up long-
term visions rather than ad hoc solutions.
Mobilize the communication system between the participants at the
outset of the process. The flow of information and flow changes should
be done systematically.
Select the sub-contractors according to their skills. Just focusing on the
tender price creates problems during the implementation of the project.
Strive to be employee-oriented rather than job-oriented. Provide better
working conditions for the sub-contractors to increase their
performance in the long-term.
Organize training programs for sub-contractors and work force to
increase their skills.
6.5 Recommendations for AE companies
The AE companies need to:
Be aware of the effects of project type, project location, rebar
requirement of the project while giving their bids, preparing their
programs and contracts.
Provide higher degree of coordination and integration to decrease the
amount of changes.

126
Prepare contracts that include clauses related to additional works, work
changes, durations and penalties.
Use internet technology more efficiently in order to improve
communication and documentation.
Strive to standardize the rebar shapes and sizes.
Avoid work changes and conflicts by integrating the design team at the
outset of the project.
6.6 Recommendations for Sub-contractors
The sub-contractors need to:
Attend the training programs to improve technical skills.
Improve skills related to reading and understanding technical
documents and numerical skills to give more realistic bids.
Be aware of the penalties that they will encounter in case of inaccurate
production.
Add clear clauses related to site, equipments and machines they need
on site and accommodation conditions in the contracts done with
contractors.
6.7 Recommendations for Suppliers
The suppliers need to:
Pay attention to time and resource management.
Create long-term relationships with contractors to share risks and
rewards.
Provide the quality conditions both for sub-standard material and the
employee worked in the company.

127
6.8 Recommendations for Future Works
The following recommendations would benefit future work on rbSC:
The framework should be analyzed for large-scale projects and
companies. The number of participants increases in large projects.
Therefore, more complex frameworks with more sub-factors need to be
developed.
The sub-factors under latent variables would be changed and the
impacts of the latent variables on rbSC performance might be analyzed
for the new factors.
This study was performed by collecting data related to the companies
located in the South East Region of Turkey. It can be expanded to the
Turkish construction companies working in other regions also where
the importance levels of the factors may change according to the region
conditions.

128
LITERATURE CITED
Agus, A. 2011. Supply chain management, supply chain flexibility and business
performance, in: Journal of Global Strategic Management, (p.134-145, 9).
Akintoye, A., McIntosh, G. and Fitzgerald, E.2000. A survey of supply chain
collaboration and management in the UK construction industry, in: European
Journal of Purchasing and Supply Management, (p.159-168, 6).
Ankrah, N. A. and Langford, D. A. 2005. Architects and Contractors: A comparative
study of organizational cultures, in: Construction Management and Economics,
23(6), 595-607.
Ankrah, N. A. 2007. An investigation into the impact of culture on construction
project performance, Ph. D. Dissertation, Universty of Wolverhampton.
Anson, M., Wang, S. Q. 1998. Performance of concrete placing in Hong Kong
buildings, in: Journal of Construction and Engineering Management, (p.116-124,
124(2)).
Ashton, D., Felstead, A. and Green, F. 2000. Skills in the British’ workplace, in
Coffield Differing Visions of a Learning Society, Bristol Policy Press.
Atkinson, R. .1999. Project management: cost, time and quality, two best guesses
and a phenomenon, its time to accept other success criteria, International Journal of
Project Management, 17 (6), 337.
Barthorpe, S., Duncan, R. and Miller, C. 2000. The pluralistic facets of culture and
its impact on construction, in:Property Management, 18(5), 335-351.
Baskerville, R. F. 2003. Hofstede never studied cultural accountings; in
Organizations and Society, (p.1-14, Vol.28, No:1).
Bertelsen, S., Nielsen, J.1997. Just in time logistics in the supply of building
materials,First International Conference on Construction Industry Development,
Singapore.
Briscoe, G., Dainty, A. and Millet, S. 2001. Construction Supply Chain Partnerships:
skills, knowledge and attidudinal requirements; in European Journal of Purchasing
& Supply Management, (p.243-255, 7).

129
Brockmann, C. and Birkholz, A. 1999. Industry culture in construction and
manufacturing; in European Journal of Management, (p.155-165, 8 (1)).
Bodley, J. H. 1994. An Anthropological Perspective, Cultural Anthropology: Tribes,
States, and the Global System.
Byrne, B. (1994). Structural equation modeling with EQS and EQS / windows: Basic
concepts, applicatitions and programming, Thousand Oaks CA, Sage.
Cameron, K. and Quin R. E. (2005). Diagnosing and changing organizational
culture based on competing values framework, John Willey and Sons Inc., USA.
Carter, J. R., Smeltzer, L., Narasimhan, R. 1998. The role of buyer and supplier
relationships in integrating TQM through the supply chain; in European Journal of
Purchasing & Supply Management, (p.223-234, 4).
Castro, D. L. 2003. B2B e-work intranet solution design for rebar supply
interactions, Ph. D. Dissertation, Purdue University.
Chan, A. P. C., Chan, A. P. L (2004). Key performance indicators for measuring
construction success; in Benchmarking: An International Journal, (p.203-221,
11(2)).
Chan, A. P. C., Scot, D. and Chan, A. P. l. 2004. Factors affecting the success of a
construction project; in: Journal of Construction Enginnering and Management,
(p.153-155).
Cheng, J. C. P., Law, K. H., Bjornson, H., Jones, A. and Sriram, R. D. 2010. A
service oriented framework for construction supply chain integration; in Automation
in Construction, in press.
Dainty, A. R. J., Millett, S. J. and Briscoe, H. G. 2001. New perspectives on
construction supply chain integration; in: Supply Chain Management: An
International Journal, (p.163-173, Vol.6(4)).
Dougles, E. E. (2009). Understanding Schedule change management; in : AACE
International Transactions.
Dubois, A., Gadde E. 2000. Supply Strategy and Network Effects: Purchasing
behaviour in construction industry; in: European Journal of Purchasing & Supply
Management, (p.207-215, 6).

130
Fotwe, F. T. E., Thorpe, A., McCaffer, R. 2001. Information procurement practices
of key actors in construction supply chains; in: European Journal of Purchasing and
Supply Management, (p.155-164, 7).
Ericsson, H. M. 2001. Managing the construction supply chain by simulation; in :
Construction Informatics Digital Library, (http://itc.scix.net/paper ecce-2001-
8.content).
Fotwe, F. T. E., Thorpe, A., McCaffer, R. 2001. Information procurement practices
of key actors in construction supply chains; in: European Journal of Purchasing &
Supply Management}, (p.155-164, 7).
Fronlich, M. T., Westbrook, R., 2001. Arcs of integration: an international study of
supply chain strategies; in: Journal of Operations and Management, (p.185-200,
19(2)).
Giritli, H., Yazıcı, E. O., Oraz, G. T. and Acar, E. 2006. Organizational culture: a
comparative analysis from the Turkish construction industry, The joint international
conference a construction culture, innovation and management (CCIM)- Sustainable
development through culture and innovation, Dubai.
Gunasekaran, A., Patel, C., McGaughey, R. E. 2004. A framework for supply chain
performance measurement; in : International Journal of Production Economics,
(p.333-347, 87).
Hair, J., Black, W., Rabin, B., Anderson, R., and Tatham, R. 2006. Multivariate data
analysis, Sixth Edition, Pearson Education, Inc., Upper Saddle River, New Jersey.
Harvey, R. C. and Ashworth, A. 1993 The Construction Industry of Great
Britain, Oxford.
Hamzeh, F. R. 2009. Improving construction workflow, the role of production
planning and control, Ph. D. Dissertation, University of California, Berkeley.
Harbhajan, S. 2009. Construction project management, Abhishek Publications.
Hellman, L. J., Gadde, L. E. 1996. Information technology and the efficiency of
materials supply: the implementation of EDI in the construction industry; ISPERA
Conference, Eindhoven University of Technology, The Netherlands.
Hinze, J. W. 2008. Construction planning and scheduling, Pearson Prentice Hall,
Upper saddle River, New Jersey.

131
Hostede, G. 1998. Identifying organizational subcultures: An empirical approach; in:
Journal of Man. Stud.,(p.1-12, 35(1)).
Hofstede, G. (2001). Culture consequences: comparing values, behaviours,
instutitions and organisations across cultures, 2nd
Edition, Sage Publications Inc.,
USA.
Hofstede, G. and Hofstede, G. J.(2005). Cultures and organizations: software of the
mind, 2nd
Edition, McGraw-Hill, New York.
Holt, G. D., Olomolaiye, P. O., and Harris, F. C. (1994). Factors influencing U.K.
construction clients' choice of contractor; in : Building and Environment, (p.241-248,
29(2)).
Hong-Minh, S. M., R., Barker, M. M., Naim. 2001. Identifying Supply Chain
Solutions in the UK House Building Sector; in : European Journal of Purchasing &
Supply Management, Vol.7, pp.49-59.
Hoyle, R. H. 1995. Structural equation modeling: concepts, issues and applications,
Thousand Oaks, CA : Sage.
Huang, C. N. 2003. Time study in two-echelon supply chain for steel framing
construction: field investigation and networking model simulation, Ph. D.
Dissertation, University of Wisconsin, Madison.
Issa, R R. A., Flood, I., and Caglasin, G. 2003. A survey of e-business
implementation in the US construction industry; ITcon, 8.
Joreskog, K. G. and Sorbom, D. 1993. Lisrel 7 users reference guide, IL: Scientific
Sofware Inc., Chicago.
Kıvrak, S. 2010. Effects of cultural differences on management practices of Turkish
construction companies and cross-cultural knowledge management in international
construction projects, Ph. D. Dissertation, Civil Enginnering Program, Anadolu
University, Eskisehir.
Kline, R. B. 1998. Principles and practice of structural equation modeling, Guilford
Press, New York, NY.
Kog, Y. C. and Loh K. P. 2012. Developing CSFs for construction projects; in
Journal of Construction Engineering and Management, ASCE 138: 520-528.
Lee, H. L. 2000. Creating value through supply chain integration; in: Supply Chain
Management Review, (p.30-36, 4(4)).

132
McAfee, R. B., Glassman, M. and Honeycutt, E.D. 2002. The effects of culture and
human resource management policies on supply chain management strategy; in :
Journal of Business Logistics, (p.1-18, 23(1)).
MacCallum, R. 1986. Quantitative methods in psychology; in : Psychological
Bulletin, (p.107-120, 100(1)).
Maloney, W. F. and Federle, M. O. 1993. Practical models for organizational
assessment; in Journal of Management Engineering, 9 (1) 64-81.
Meng, X. 2012. The effect of relationship management on project performance in
construction strategy; in : International Journal of Project Management, (p.188-198,
30(2)).
Min, J. U. and Bjornsson H. C. 2008. Agent-based construction supply chain
simulator (CS2) for measuring the value of real-time information sharing in
construction; in : Journal of Management Engineering, (p.245-254, 24(4)).
Monezka, T., Trend, R., Handfield, R. 1998. Purchasing and Supply Chain
Management, OH : South-Western College Publishing, Cincinati.
Navon, R. and Berkovich, O. 2005. Development and on site evaluation of an
automated materials management and control model; in : Journal of Construction
Engineering and Management, (p.1328-1336, 131(2)).
Ngowi, A. B.2000. Impact of culture on the application of TQM in the construction
industry in Botswana; in : International Journal of Quality and Reliability
Management, (p.442-453, 17(4)).
Nunally, J. (1978). Psychometric theory, McGraw-Hill, New York.
O'Brien, W. J. 1998. Capacity costing approaches for construction supply-chain
management, Ph. D. Dissertation, Stanford University.
Ofori, G., 2000. Greening the construction supply chain in Singapore; in: European
Journal of Purchasingand Supply Management, (p.195-206, 6).
Othman, A. A. and Rahman S.A. 2010. Supply chain management in the building
construction industry: Linking procurement process coordination, market, orientation
and performance; in : The Journal of Surveying, Construction & Property, Vol.1,
pp23-46.
Ozorhon, B., Arditi, D., Dikmen, I. and Birgonul, M. T. 2008. Implications of
culture in the performance of international construction joint ventures in : The
Journal of Construction Engineering and Management, Vol.134, pp361-370.

133
Palaneeswaran, E, M. M, Kumaraswamy, X. Q., Zhang. 2001. Reforging
Construction Supply Chains: A Source Selection Perspective; in : The Journal of
Purchasing and Supply Management, Vol.7, pp165-178.
Parfitt, M. K. and Sanvido V. E. 1993. Checklist of critical success factors for
building projects; in Journal of Management in Engineering, Vol.9, No.3. pp 243-
249.
Polat, G. 2005. A simulation-based decision support tool for economical materials
management system in the construction industry, Ph. D. Dissertation, Istanbul
Technical University, Istanbul.
Perdomo-Rivera, J. L. 2004. A framework for a decision support model for supply
chain management in the construction industry, Ph. D. Dissertation, Faculty of
Virginia Polytechnic Institue and State University, Blacksburg, Virginia.
Proverbs, D. G. and Holt, G. D. 2000. Reducing Construction Costs: European Best
Practice Supply Chain Implications; in: European Journal of Purchasing and
Supply Management, (p.149-158, 6).
Pserng, H. P., Yin S.Y.L. and Li S. 2006. Developing a resource supply chain
planning system for construction projects; in Journal of Construction Engineering
and Management, ASCE 132(4): 393-407
Rahman, M. M. and Rowlinson, S. 2003. Professionalism in construction: Culture of
High Performance, Proceedings of CIB TG23 International Conference, University
of Hong Kong, Hong Kong.
Qrunfleh, S. M. 2010. Alignment of information systems with supply chains: Impacts
on supply chain performance and organizational performance, Ph. D. Dissertation,
University of Toledo, Toledo.
Schwartz, S. H. 1999. A theory of cultural values and some impl,ications for work;
in : Applied Psychology: An International Review, (p.23-47, 48(1)).
Shmanske, S. 2003. JIT and the complementary of buffers and lot size, in: American
Business Review, (p.100-106, 21(1)).
Schumacker, R. E., Lomax, R. G. 2004. A beginner's guide to structural equation
modeling, Lawrence Erlbaum Associates, Inc., Publishers, Manwah, Mew Jersey.
Tabannick, B. G., and Fidel, L. S. 1996. Using Multivariate Statistics, NY:
Harpercollins College Publishers, New York.

134
Tan, K. C., Kannan, V.R. 1998. Supply chain management: supplier performance
and firm performance; in : International Journal of Purchasing and Materials
management, (p.2-9, 34(3)).
Thomas, H. R., Riley, D.R., and Messner, J. I. 2005. Fundamental principles of site
material management; in : Journal of Construction Engineering and Management,
(131(7)).
Tommelein, I. D., Yi Li, A. E. 1999. Just-in-time concrete delivery: mapping
alternatives for vertical supply chain integration, Proceedings IGLC-7, University of
california, Berkeley, CA, USA.
Trompenaars, F. 1993. Riding the waves of culture- Understanding cultural diversity
in business, Nicholas Brealey Publishing, London.
Trompenaars, F., and Woolliams, P. 1999. First-class accommodation,in:People
Management, 5(8), 30-37.
Xiao, H., Proverbs, D. 2003. Factors influencing contractor performance in an
international investigation; in: Engineering Construction and Architectural
Management, (p.322-332, 10).
Xue, X., Wang, Y., Shen, Q. and Yu, X. 2007. Coordination mechanisms for
construction supply chain management in the internet environment; in: International
Journal of Project Management, (p.150-157, 10).
Vrijhoef, R., Koskela, L. 1999. Roles of supply chain management in construction,
Proceedings IGLC-7, University of california, Berkeley, CA, USA.
Vrijhoef, R., Koskela, L. 2000. The Four Roles of supply chain management in
construction; in : European Journal of Purchasing and Supply Mangement, (p.169-
178, 6(3-4)).
Vrijhoef, R., Koskela, L. 2005. Revisiting the three peculiarities of production in
construction, in : Proceedings IGLC-13, Lean Construction Theory, Sydney,
Australia.
Yunus, E. and Tadisina, S. K. 2010. Organizational culture context, supply chain
integration and performance, POMS 21st Annual Conference, Vancouver, Canada.
Zhang, J. P., Ma, Z. Y., Cheng, P. 2001. 4D Visualization of construction site
management; in : Proceeding IV'01 Proceedings of the fifth International
Conference on Information Visualization, Washington, DC, USA.

135
Zhongli, K. Y. S., Nakagava, Y., Kensei, T. T. G. 2010. Cooperative software
development and usability evaluation: a web-based work management system for
construction sites; in : Journal of software, (p.259-268, 5(3)).
http://www.supply-chain.org
http://www.oracle.com
Turkish Statistics Agency (TUİK)

136
APPENDIX A1
QUESTIONNAIRE (ENGLISH)
QUESTIONNAIRE ABOUT THE ANALYSIS OF THE IMPACTS OF THE
FACTORS ON rbSC PERFORMANCE
General Instructions and Information
This survey is being conducted by Z. Banu Yavuz, a Ph. D. candidate at
METU.
This survey is done to analyse the impacts of factors on rbSC and project
performance. The proposed framework located at the end of the
questionnaire, represent the relationships between the factors and constitute
the basement of this study.
The questionnaire consists of 9 pages and it takes about15 minutes to answer
all questions.
Please answer all questions. Importance level part aims to measure the
importance level for you, and the performance want to evaluate the level of
this factor for the real projects that your company took in. Answers are in a
6-scaled likert format.1=Not at all important to 6= Very important.

137
I. GENERAL INFORMATION ABOUT THE COMPANY
1. The name and the adress of your company:
........................................................................................................................................
.....
2. What is your primary job responsibility?
[ ] Contractor
[ ] Architecture/Engineering company
[ ] Sub-contractor (rebar labor)
[ ] Supplier (rebar supplier)
3. With which contract type/s does your company work?
[ ] Lump sum [ ] Unit price
[ ] Cost+ percentage of cost [ ] Construct and sell
[ ] Other (please specify)..........................................
4. What is your primary job responsibility?
[ ] Owner [ ]Technical staff (engineer/architect/technican)
[ ] Sales staff [ ] Worker
[ ] Other (please specify)..........................................
5. How long has your company been in the construction sector?
[ ] 1-5 years [ ] 6-10 years [ ] 11-15 years [ ] 16-20 year
[ ] More

138
6. What are the prevailing type of construction projects?
(You may select more than one option)
[ ] Residental [ ] Commercial [ ] Education [ ] Health
[ ] Other (please specify).....................
7. What is your firm's annual turnover volume?
[ ] 1.000.000. TL [ ] 1.000.000 TL-2.000.000. TL [ ] 2.000.000.TL-
5.000.000.TL [ ] 5.000.000. TL -10.000.000.TL [ ] More

139
II. Rebar Supply Chain and Project Performance Related Factors
The performance factors of rbSC performance and project are listed below. In the importance
level part evaluate what is the level of importance of these variables for your company on the
performance of rbSC and project. In the performance level part, evaluate the realized performance of
your company about the factors written below, according to the outputs of the projects that your
company participated in the construction process of it. Before evaluating the indicators answer the
questions about the projects that you choose to evaluate.
The evaluated projects’;
Type of the construction [ ] Residental [ ] Commercial [ ] Education [ ] Health
[ ] Other(please specify).....................
Size (Due to the rebar need) [ ] Small [ ] Medium [ ] Big
Location [ ] High density urban area [ ] Low density urban area
[ ] Outside the city
Construction site distance [ ] 0-10km [ ] 10-30km [ ] 30-50km [ ]More than 50km
Rebar was [ ] cut and bend on site.
[ ] off-site cut and bend.
[ ] cut and bend on site and off-site.
Peformance factors of rbSC Importance Performance level
Missing/ wrong/ damaged/ defective
Product/construction.....................................…. 01 02 03 04 05 06 01 02 03 04 05 06
Responsiveness to the customers........................ 01 02 03 04 05 06 01 02 03 04 05 06
Supply chain flexibility................................... 01 02 03 04 05 06 01 02 03 04 05 06
rbSC integration............................................. . 01 02 03 04 05 06 01 02 03 04 05 06
Performance factors of project performance Importance Performance level
Project profitability.......................................... 01 02 03 04 05 06 01 02 03 04 05 06
Schedule performance................... ………….. 01 02 03 04 05 06 01 02 03 04 05 06
Satisfaction of the customer.............................. 01 02 03 04 05 06 01 02 03 04 05 06

140
III. The factors that have impacts on rbSC performance
The defined factors that have impacts on rbSC performance are listed below. In the importance
level part evaluate the factors due to their impacts on rbSC performance level. In the performance
level part, evaluate the realized performance of your company about the factors written below,
according to the outputs of the projects that your company participated in the construction process of
it.
Contractor related factors Importance Performance level
Materials management competency................. 01 02 03 04 05 06 01 02 03 04 05 06
Site management competency.................……. 01 02 03 04 05 06 01 02 03 04 05 06
Project management competency.................... 01 02 03 04 05 06 01 02 03 04 05 06
Organization culture of the contractor……….. 01 02 03 04 05 06 01 02 03 04 05 06
Organization structure of the contractor......... 01 02 03 04 05 06 01 02 03 04 05 06
Insurance cover ............................................ 01 02 03 04 05 06 01 02 03 04 05 06
Past experience of the contractor.................. 01 02 03 04 05 06 01 02 03 04 05 06
Operating and machinery..................………. 01 02 03 04 05 06 01 02 03 04 05 06
Trouble shooting and problem solving........... 01 02 03 04 05 06 01 02 03 04 05 06
Communication system of the contractor....... 01 02 03 04 05 06 01 02 03 04 05 06
Int. between structural designer and jobsite... .. 01 02 03 04 05 06 01 02 03 04 05 06
Efficiency of cash flow method...................... 01 02 03 04 05 06 01 02 03 04 05 06

141
AE company related factors Importance Performance level
Design information flow................................. 01 02 03 04 05 06 01 02 03 04 05 06
Design integration.................................……. 01 02 03 04 05 06 01 02 03 04 05 06
Design changes.............................................. 01 02 03 04 05 06 01 02 03 04 05 06
Standardization of rebar shapes, components.. 01 02 03 04 05 06 01 02 03 04 05 06
Delay in design definitions and approval…… 01 02 03 04 05 06 01 02 03 04 05 06
Internet technologies....................................... 01 02 03 04 05 06 01 02 03 04 05 06
CAD software usages..................................... 01 02 03 04 05 06 01 02 03 04 05 06
Sub-contractor-related factors Importance Performance level
Improved communication and
learning skills ................................................. 01 02 03 04 05 06 01 02 03 04 05 06
Labor utilization(planned,weekly working
schedules, relaxation allowance).................... 01 2 03 04 05 06 01 02 03 04 05 06
Accommodation conditions on site................. 01 02 03 04 05 06 01 02 03 04 05 06
Education level of the workers........................ 01 02 03 04 05 06 01 02 03 04 05 06
Ability of reading technical drawings.............. 01 02 03 04 05 06 01 02 03 04 05 06
Standardization of rebar shapes,
components..................................................... 01 02 03 04 05 06 01 02 03 04 05 06
Grouping the cut rebar in respect
of length and size ........................................... 01 02 03 04 05 06 01 02 03 04 05 06
Processing area on site................................... 01 02 03 04 05 06 01 02 03 04 05 06
Storage area on site…………………………. 01 02 03 04 05 06 01 02 03 04 05 06
Team relationships.......................................... 01 02 03 04 05 06 01 02 03 04 05 06
Transportation of material on site.................. 01 02 03 04 05 06 01 02 03 04 05 06

142
Percentage of defects................................... . 01 02 03 04 05 06 01 02 03 04 05 06
Cutting in required length..............…………. 01 02 03 04 05 06 01 02 03 04 05 06
Supplier related factors Importance Performance level
Delivery speed dependability.......................... 01 02 03 04 05 06 01 02 03 04 05 06
Delivery reliability performance..................... 01 02 03 04 05 06 01 02 03 04 05 06
Supplier responsiveness.................................. 01 02 03 04 05 06 01 02 03 04 05 06
Price of the material....................................... 01 02 03 04 05 06 01 02 03 04 05 06
Location of the supplier.................................. 01 02 03 04 05 06 01 02 03 04 05 06
Financial stability............................................ 01 02 03 04 05 06 01 02 03 04 05 06
Writing and reading skills of contract
and technical document ............................. 01 02 03 04 05 06 01 02 03 04 05 06
Supplier/Contractor relationships................... 01 02 03 04 05 06 01 02 03 04 05 06
Number of faultless delivery.......................... 01 02 03 04 05 06 01 02 03 04 05 06
Quality of the material.................................... 01 02 03 04 05 06 01 02 03 04 05 06
Warranties given by the supplier…………… 01 02 03 04 05 06 01 02 03 04 05 06
Product knowledge.......................................... 01 02 03 04 05 06 01 02 03 04 05 06

143
External factors Importance Performance level
Economic stability in the country..................... 01 02 03 04 05 06 01 02 03 04 05 06
Transportation cost.......................................... 01 02 03 04 05 06 01 02 03 04 05 06
Legal conditions.............................................. 01 02 03 04 05 06 01 02 03 04 05 06
Client characteristic.......................................... 01 02 03 04 05 06 01 02 03 04 05 06
Environmental factors...................................... 01 02 03 04 05 06 01 02 03 04 05 06
Number of firms in the same market............... 01 02 03 04 05 06 01 02 03 04 05 06

144
Figure A1.1. Theoretical framework that is proposed for rbSC.
External
factors
Sub-contractor
related factors
A/E company
related factors
Supplier
related factors
Contractor
related factors
rbSC
performance
Project
performance

145
APPENDIX A2
QUESTIONNAIRE (TURKISH)
İNŞAAT DEMİRİ TEDARİK ZİNCİRİ PERFORMANSINA ETKİ EDEN
FAKTÖRLERİN ANALİZİ ANKETİ
İÇERİK
Anket ile ilgili genel açıklamalar:
Bu anket çalışması ODTÜ Mimarlık Fakültesi‟nde doktora çalışmalarına
devam eden Z. Banu Yavuz Pelvan tarafından yürütülmektedir.
Bu çalışma, inşaat demiri tedarik zinciri performansına etki eden faktörlerin
analizini hedeflemektedir. Anketin sonunda inşaat demiri tedarik zinciri için
ilişkileri gösteren ve anket sorularının temelini oluşturan kavramsal çerçeveyi
görebilirsiniz.
Bu anket 9(dokuz) sayfadan oluşmaktadır, ve cevaplaması yaklaşık 15 dakika
sürmektedir.
Lütfen tüm soruları cevaplayınız. Önem seviyesi başlığının altındaki
kısıma ilgili maddenin sizin için oluşturduğu önemi, performans kısmına ise
uygulamış olduğunuz projelerde, ilgili maddeler için elde edilmiş performans
düzeyi işaretlenmelidir. Cevaplar altılı likert ölçektedir. 1=Hiç önemli değil,
2=Biraz önemli, 3=Önemli, 4=Oldukça önemli, 5=Çok önemli, 6=Son derece
önemli.

146
I. FİRMALAR HAKKINDA GENEL BİLGİ
1. Firmanızın adı ve adresi:
........................................................................................................................................
.....2. Firmanızın çalışma alanı nedir?
[ ] Yüklenici firma (inşaat müteahhiti)
[ ] Mimarlık/mühendislik firması
[ ] Alt yüklenici (inşaat demiri işçilik taşeronu)
[ ] Tedarikçi (inşaat demiri tedarikçisi)
3. Firmanız hangi tür sözleşmelerle iş yapmaktadır?
[ ] Götürü usül [ ] Birim fiyat
[ ] Maliyet + belirlenen % kar [ ] Yap-sat
[ ] Diğer (lütfen belirtiniz)..........................................
4. Firmadaki asıl göreviniz nedir?
[ ] İşyeri sahibi [ ] Teknik personel (mühendis/mimar/tekniker)
[ ] Satış personeli [ ] İşçi
[ ] Diğer (lütfen belirtiniz)..........................................
5. Firmanız çalıştığı alanda kaç yıldır faaliyet göstermektedir?
[ ] 1-5 yıl [ ] 6-10 yıl [ ] 11-15 yıl [ ] 16-20 yıl
[ ] Daha fazla
6. Firmanızın ilgilendiği inşaat projesi türleri nelerdir?
(Birden çok seçenek işaretleyebilirsiniz)

147
[ ] Konut [ ] Ticaret [ ] Eğitim [ ] Sağlık [ ]
Diğer(belirtiniz).....................
7. Firmanızın yıllık cirosu ne kadardır?
[ ] 1.000.000. TL [ ] 1.000.000 TL-2.000.000. TL [ ] 2.000.000.TL-
5.000.000.TL [ ] 5.000.000. TL -10.000.000.TL [ ] Daha fazla

148
2. İnşaat Demiri Tedarik Zinciri ve Proje Performans Göstergeleri
Aşağıda inşaat demiri tedarik zinciri ve proje performans göstergeleri yer almaktadır. Önem
kısmında, verilen göstergelerin inşaat demiri tedarik zinciri ve proje performansı için ne derece
önemli olduğunu değerlendiriniz. Performans düzeyi kısmında ise, firmanızın yapmış olduğu bir
projede (inşa edilmiş bir yapıda) belirtilen performans göstergelerine ne düzeyde ulaştığını
işaretleyiniz. Performans göstergelerini değerlendirmeden önce, değerlendirmeye alacağınız proje ile
ilgili aşağıdaki dört soruyu yanıtlayınız.
Değerlendirmeye alınacak projenin;
Yapı tipi [ ] Konut [ ] Ticaret [ ] Eğitim [ ] Sağlık
[ ]Diğer(belirtiniz).....................
Boyutu (demir ihtiyacına göre) [ ] Küçük [ ] Orta [ ] Büyük
Konum [ ] Şehir içinde sıkışık alanda [ ] Şehir içinde geniş alanda
[ ] Şehir dışında
Demirinin temin edildiği yerin [ ] 0-10km [ ] 10-30km [ ] 30-50km [ ] >50km
şantiyeye olan uzaklığı
Demiri [ ] Şantiyede kesilip büküldü.
[ ] Hazır(kesilip, bükülmüş) olarak şantiyeye geldi.
[ ] Hem hazır geldi hem şantiyede hazırlandı.
İnşaat demiri tedarik zinciri performans Önem Performans Düzeyi
göstergeleri
Unutulan/yanlış/hatalı/bozuk ürün/üretim 01 02 03 04 05 06 01 02 03 04 05 06
Müşteriye hitap etme.................................. 01 02 03 04 05 06 01 02 03 04 05 06
Tedarik zinciri esnekliği............................. 01 02 03 04 05 06 01 02 03 04 05 06
İnşaat demiri tedarik zinciri entegrasyonu.... 01 02 03 04 05 06 01 02 03 04 05 06
Proje performans göstergeleri Önem Performans Düzeyi
Proje karlılığı ................................................ 01 02 03 04 05 06 01 02 03 04 05 06
Çalışma programı performansı................... 01 02 03 04 05 06 01 02 03 04 05 06
Müşteri memnuniyeti................................. 01 02 03 04 05 06 01 02 03 04 05 06

149
3. İnşaat Demiri Tedarik Zincirine Etki Eden Faktörler
Aşağıda inşaat demiri tedarik zinciri performansına etki eden faktörler yer almaktadır. Önem
kısmında, verilen her faktör grubunun inşaat demiri tedarik zinciri ve proje performansı için ne derece
önemli olduğunu değerlediriniz. Performans düzeyi kısmında ise, firmanızın yapmış olduğu bir
projede (inşa edilmiş bir yapıda) belirtilen faktörler için ne düzeyde performans gösterdiğini
işaretleyiniz.
Yüklenici firma ile ilgili faktörler Önem Performans Düzeyi
Malzeme yönetimi yetkinliği..................... 01 02 03 04 05 06 01 02 03 04 05 06
Şantiye yönetimi yetkinliği....................... 01 02 03 04 05 06 01 02 03 04 05 06
Proje yönetimi yetkinliği............................ 01 02 03 04 05 06 01 02 03 04 05 06
Yüklenici firma organizasyon yapı kültürü . 01 02 03 04 05 06 01 02 03 04 05 06
Yüklenici firma yapısı.................................. 01 02 03 04 05 06 01 02 03 04 05 06
Sigorta ........................................................ 01 02 03 04 05 06 01 02 03 04 05 06
Yüklenici firmanın tecrübesi....................... 01 02 03 04 05 06 01 02 03 04 05 06
Makine ve ekipman parkı............................ 01 02 03 04 05 06 01 02 03 04 05 06
Sorun yakalama ve problem çözme ........... 01 02 03 04 05 06 01 02 03 04 05 06
Yüklenici firma iletişim sistemleri.............. 01 02 03 04 05 06 01 02 03 04 05 06
Yapı strüktür tasarımcısı ve saha
arasındaki etkileşim...................................... 01 02 03 04 05 06 01 02 03 04 05 06
Nakit akışı verimliliği................................... 01 02 03 04 05 06 01 02 03 04 05 06

150
Mimarlık/Mühendilik firmaları Önem Performans Düzeyi
ile ilgili faktörler
Tasarım bilgisi akışı................................ 01 02 03 04 05 06 01 02 03 04 05 06
Tasarımda entegrasyon............................... 01 02 03 04 05 06 01 02 03 04 05 06
Tasarım değişiklikleri................................... 01 02 03 04 05 06 01 02 03 04 05 06
İnşaat demiri şekilleri ve yapı
elemanlarında standardizasyon................. … 01 02 03 04 05 06 01 02 03 04 05 06
Tasarım ve onaylarında yaşanan gecikmeler.. 01 02 03 04 05 06 01 02 03 04 05 06
İnternet teknolojileri...................................... 01 02 03 04 05 06 01 02 03 04 05 06
CAD-çizim programları kullanımı .............. .. 01 02 03 04 05 06 01 02 03 04 05 06
Alt-Yüklenici ile ilgili faktörler Önem Performans Düzeyi
Gelişmiş iletişim ve öğrenme
becerileri......................................................... 01 02 03 04 05 06 01 02 03 04 05 06
İşçi kullanımı(planlanan, haftalık çalışma
programları, izinleri)................................…. 01 02 03 04 05 06 01 02 03 04 05 06
Şantiyede konaklama koşulları..............……. 01 02 03 04 05 06 01 02 03 04 05 06
İşçilerin eğitim seviyesi................................ . 01 02 03 04 05 06 01 02 03 04 05 06
Teknik döküman okuma becerisi...........……. 01 02 03 04 05 06 01 02 03 04 05 06
İnşaat demiri şekilleri ve yapı
elemanlarında standardizasyon...................... 01 02 03 04 05 06 01 02 03 04 0506
Kesilmiş demirlerin boy ve ölçüye göre
gruplandırılması............................................ 01 02 03 04 05 06 01 02 03 04 05 06
Şantiye sahasındaki çalışma alanı................. 01 02 03 04 05 06 01 02 03 04 05 06
Şantiye sahasındaki depolama alanları……… 01 02 03 04 05 06 01 02 03 04 05 06
Takım içi ilişkiler........................................... . 01 02 03 04 05 06 01 02 03 04 05 06
Malzemenin sahada taşınması......................... 01 02 03 04 05 06 01 02 03 04 05 06
Hatalı ürün oranı.............................................. 01 02 03 04 05 06 01 02 03 04 05 06

151
Demiri istenen ölçülerdkesmek..............………. 01 02 03 04 05 06 01 02 03 04 05 06
Tedarikçi ile ilgili faktörler Önem Performans Düzeyi
Teslim hızının güvenilirliği.....................……. 01 02 03 04 05 06 01 02 03 04 05 06
Teslim güvenililirliği performansı...........…… 01 02 03 04 05 06 01 02 03 04 05 06
Tedarikçinin cevap verme süresi.............……. 01 02 03 04 05 06 01 02 03 04 05 06
Malzemenin fiyatı...................................……. 01 02 03 04 05 06 01 02 03 04 05 06
Tedarikçinin konumu..............................……. 01 02 03 04 05 06 01 02 03 04 05 06
Finansal istikrar.......................................…… 01 02 03 04 05 06 01 02 03 04 05 06
Sözleşme ve teknik döküman okuma yazma
yeteneği........................................................... 01 02 03 04 05 06 01 02 03 04 05 06
Tedarikçi/yüklenici firma ilişklieri..........……. 01 02 03 04 05 06 01 02 03 04 05 06
Sevkedilen hatalı ürün sayısı.............................. 01 02 03 04 05 06 01 02 03 04 05 06
Malzemenin kalitesi.......................................…. 01 02 03 04 05 06 01 02 03 04 05 06
Tedarikçi tarafından verilen garantiler...........…. 01 02 03 04 05 06 01 02 03 04 05 06
Ürün bilgisi..............................................………. 01 02 03 04 05 06 01 02 03 04 05 06

152
Dışsal Faktörler Önem Performans Düzeyi
Ülkedeki ekonomik istikrar............................ 01 02 03 04 05 06 01 02 03 04 05 06
Taşıma maliyeti.............................................. 01 02 03 04 05 06 01 02 03 04 05 06
Hukuki koşullar.............................................. 01 02 03 04 05 06 01 02 03 04 05 06
Müşteri özellikleri.......................................... 01 02 03 04 05 06 01 02 03 04 05 06
Çevresel faktörler........................................... 01 02 03 04 05 06 01 02 03 04 05 06
Aynı sektördeki firma sayısı......................... 01 02 03 04 05 06 01 02 03 04 05 06

153
Şekil A2.1 İnşaat demiri tedarik zinciri için önerilen kavramsal çerçeve
Zaman Ayırdığınız için Teşekkürler...
Dışsal
Faktörler
Alt-yüklenici
ile ilgili
faktörler
M/M firması ile ilgili
faktörler
Tedarikçi ile
ilgili faktörler
Yüklenici firma ile ilgili
faktörler
İnşaat demiri tedarik zinciri
performansı
Proje
performansı

154
APPENDIX B
DESCRIPTIVE STATISTICS
Table B.1 Legal status of the companies
Table B.2 Type of the companies
Frequency Percent Valid Percent
Cumulative
Percent
Valid
Contractor 33 42.3 42.3 42.3
AE company 20 25.6 25.6 67.9
Subcontractor 16 20.5 20.5 88.5
Supplier 9 11.5 11.5 100.0
Total 78 100.0 100.0
Company Type
Total Contractor AE company Subcontractor Supplier
Legalstatus Limited company 28 18 3 6 55
Corporation 1 0 0 2 3
individual propritorship 4 2 13 1 20
Total 33 20 16 9 78

155
Table B.3 Responsibilities of the respondents
Company Type
Total Contractor
AE
company Subcontractor Supplier
Job responsibility
Owner 16 5 14 3 38
Technical staff 17 15 1 1 34
Sales staff 0 0 0 5 5
Worker 0 0 1 0 1
Total 33 20 16 9 78
Table B.4 Experience in years
Company type
Total Contractor
AE
company Subcontractor Supplier
Operation
year
1-5 years 4 4 0 1 9
6-10 years 8 6 8 0 22
11-15 years 11 8 8 1 28
16-20 years 3 2 0 5 10
More 7 0 0 2 9
Total 33 20 16 9 78

156
Table B.5 Expertise areas of the respondent companies
Company type
Total Contractor
AE
company Subcontractor Supplier
Expertise
area
Housing
21 17 13 5 56
Commercial 17 16 7 5 45
Education 16 15 12 5 48
Health 12 15 6 5 38
Other 6 4 2 6 18
Table B.6 Annual turnover for the respondent companies
Compnay type Total
Contractor AE
company
Subcontractor Supplier
Annual
volume
0-1.000.000 TL 1 3 15 1 20
1.000.000-2.000.000 TL 4 9 1 0 14
2.000.000-5.000.000 TL 16 8 0 0 24
5.000.000-10.000.000 TL 8 0 0 0 8
More 4 0 0 8 12
Total 33 20 16 9 78

157
APPENDIX C
RAW DATA

158
Table C.1 Raw data for project characteristics and rbSC performance related
factors
ID PT PS PL SD RPP rbSCperf1 rbSCperf2 rbSCperf3 rbSCperf4
1 1 2 1 1 1 4 4 5 5
2 1 2 3 1 1 4 3 4 4
3 1 2 2 1 1 4 4 3 4
4 1 2 1 1 1 4 3 5 5
5 1 3 2 2 1 4 6 6 6
6 1 3 2 2 1 5 5 5 5
7 2 3 3 3 3 5 5 4 4
8 2 3 3 3 3 5 5 4 4
9 1 3 2 2 1 6 6 6 5
10 1 2 2 2 1 5 5 3 3
11 1 2 2 2 1 6 6 6 5
12 1 3 2 2 1 6 6 6 6
13 1 3 2 1 1 6 6 6 5
14 1 3 2 1 1 5 6 5 5
15 1 2 2 2 3 4 4 5 5
16 1 2 2 2 3 5 4 4 5
17 1 3 2 1 1 6 6 6 6
18 1 2 2 1 3 6 6 5 5
19 2 3 3 1 1 6 6 6 6
20 4 3 2 1 1 6 6 5 5
21 4 3 2 1 1 6 6 5 4
22 4 3 2 1 1 5 6 5 5
23 2 2 3 4 3 4 4 3 3
24 2 2 3 4 3 5 5 4 4
25 2 2 3 4 3 5 5 2 2
26 2 2 3 2 3 5 5 5 5
27 2 2 3 2 3 5 5 5 5
28 1 2 2 2 1 6 6 5 5
29 1 2 2 2 1 6 6 5 5
30 1 3 3 2 1 4 5 4 4
31 1 2 3 3 1 5 5 4 3
32 1 3 3 3 1 4 5 5 5
33 1 2 3 3 1 5 5 4 4
34 1 2 3 3 1 5 4 3 3
35 1 2 3 3 1 5 5 5 5
36 1 2 3 3 1 5 6 5 5
37 3 2 1 2 1 5 5 5 4
38 3 2 1 2 1 6 6 3 3
39 3 2 1 1 1 5 5 4 4
ID: Questionnaire number,
PT: Project type (1:Residental, 2:Commercial, 3:Education, 4:Health, 5:Other)
PS: Project size (1:small, 2:medium, 3:big)
PL: Project location (1:high density urban area, 2:low density urban area,
3:suburban area)
SD: Construction site distance from rebar supplier (1: 0-10km, 2: 10-30km,
3: 30-50km, 4: More than 50km
RP: Rebar preparation place (1: on-site, 2: off-site, 3: both)

159
Table C.1 Raw data for project characteristics and rbSC performance related
factors (continued)
ID PT PS PL SD RPP rbSCperf1 rbSCperf2 rbSCperf3 rbSCperf4
40 3 2 1 1 1 4 4 4 4
41 3 1 1 1 1 4 4 4 4
42 3 1 1 1 1 5 5 5 5
43 3 2 1 1 1 3 4 3 3
44 3 2 1 1 1 4 4 3 3
45 5 2 1 3 1 5 4 5 5
46 5 2 1 3 1 5 3 3 3
47 5 2 1 3 1 4 4 4 4
48 5 2 1 3 1 5 3 3 3
49 3 2 3 2 1 6 2 4 6
50 3 2 3 2 1 6 4 4 4
51 1 3 2 2 1 6 6 6 6
52 1 3 2 2 1 4 4 4 4
53 1 3 2 2 1 4 4 3 3
54 1 1 1 2 1 5 5 5 5
55 1 1 1 2 1 4 4 4 4
56 1 1 1 2 1 5 5 4 4
57 1 1 1 2 1 4 4 4 4
58 5 2 1 2 1 5 5 4 4
59 5 2 1 2 1 4 5 4 4
60 5 2 1 2 1 5 5 4 4
61 3 2 1 1 1 4 4 3 3
62 3 2 1 1 1 4 4 3 4
63 3 1 3 3 2 4 4 3 3
64 3 2 3 3 2 4 4 4 4
65 3 1 3 3 2 4 4 4 4
66 5 2 2 1 1 5 5 4 4
67 3 2 1 1 1 5 5 5 5
68 3 2 1 1 1 4 4 4 3
69 3 2 1 1 1 4 4 3 4
70 2 2 3 3 1 4 4 3 3
71 2 2 3 3 1 5 5 5 5
72 1 1 2 2 1 4 4 2 2
73 1 1 2 2 1 6 6 6 6
74 1 1 2 2 1 4 4 4 4
75 1 3 3 3 1 4 4 3 3
76 1 3 3 3 1 5 5 5 5
77 1 2 2 1 1 4 4 4 4
78 1 2 2 1 1 4 4 5 4
79 5 3 2 1 3 4 4 3 3
80 5 3 2 1 3 5 5 4 4
ID: Questionnaire number,
PT: Project type (1:Residental, 2:Commercial, 3:Education, 4:Health, 5:Other)
PS: Project size (1:small, 2:medium, 3:big)
PL: Project location (1:high density urban area, 2:low density urban area, 3:suburban area)
SD: Construction site distance from rebar supplier (1: 0-10km, 2: 10-30km, 3: 30-50km, 4: More than 50km)
RP: Rebar preparation place (1: on-site, 2: off-site, 3: both)

160
Table C.1 Raw data for project characteristics and rbSC performance related
factors (continued) ID PT PS PL SD RPP rbSCperf1 rbSCperf2 rbSCperf3 rbSCperf4
81 1 3 2 1 3 5 6 5 6
82 1 2 1 1 1 4 4 3 3
83 1 2 1 1 1 4 3 4 4
84 2 3 3 3 1 4 4 3 3
85 2 3 3 3 1 4 4 5 4
86 2 3 3 3 1 5 5 4 4
87 1 3 2 2 1 4 6 6 6
88 1 3 2 2 1 5 5 4 4
89 3 2 2 2 1 5 5 5 5
90 3 2 2 2 1 5 5 4 4
91 4 2 2 2 1 4 3 3 3
92 4 2 2 2 1 4 3 3 4
93 3 3 1 1 1 4 4 3 3
94 3 3 1 1 1 4 4 3 2
95 3 2 1 2 1 5 5 5 4
96 1 3 2 2 1 5 4 3 3
97 1 2 1 2 1 4 5 2 2
98 1 2 1 2 1 4 4 2 2
99 1 2 1 2 1 4 5 2 2
100 2 3 3 3 3 5 5 1 2
101 2 3 3 3 3 5 5 2 2
102 2 3 3 3 3 5 5 1 2
103 2 3 3 3 3 4 4 3 3
104 1 2 2 2 3 4 4 5 5
105 1 2 2 2 3 4 4 4 4
106 3 3 2 2 3 4 4 5 5
107 3 3 2 2 3 4 4 5 5
108 2 3 1 2 1 5 6 5 5
109 5 1 2 1 2 6 5 4 4
110 5 1 2 1 2 6 6 6 5
111 4 3 2 2 3 4 4 4 4
112 4 3 2 2 3 5 5 5 5
113 1 2 2 2 3 5 5 5 5
114 1 2 2 2 3 4 4 4 4
115 5 1 3 3 1 4 1 3 3
ID: Questionnaire number,
PT: Project type (1:Residental, 2:Commercial, 3:Education, 4:Health, 5:Other)
PS: Project size (1:small, 2:medium, 3:big)
PL: Project location (1:high density urban area, 2:low density urban area, 3:suburban area)
SD: Construction site distance from rebar supplier (1: 0-10km, 2: 10-30km, 3: 30-50km, 4: More than 50km)
RP: Rebar preparation place (1: on-site, 2: off-site, 3: both)

161
Table C.2 Raw data for project characteristics and project performance
related factors
ID PT PS PL SD RPP PROJperf1 PROJperf2 PROJperf3
1 1 2 1 1 1 4 5 5
2 1 2 3 1 1 4 5 4
3 1 2 2 1 1 5 3 5
4 1 2 1 1 1 4 4 5
5 1 3 2 2 1 3 5 6
6 1 3 2 2 1 4 4 4
7 2 3 3 3 3 4 5 5
8 2 3 3 3 3 5 5 5
9 1 3 2 2 1 6 6 6
10 1 2 2 2 1 5 5 5
11 1 2 2 2 1 6 5 6
12 1 3 2 2 1 5 5 5
13 1 3 2 1 1 6 6 6
14 1 3 2 1 1 6 4 6
15 1 2 2 2 3 6 6 6
16 1 2 2 2 3 6 6 6
17 1 3 2 1 1 4 6 6
18 1 2 2 1 3 5 6 6
19 2 3 3 1 1 6 6 6
20 4 3 2 1 1 6 6 6
21 4 3 2 1 1 6 6 6
22 4 3 2 1 1 4 4 4
23 2 2 3 4 3 4 4 4
24 2 2 3 4 3 5 5 5
25 2 2 3 4 3 4 4 4
26 2 2 3 2 3 6 4 5
27 2 2 3 2 3 6 3 4
28 1 2 2 2 1 5 4 6
29 1 2 2 2 1 6 6 6
30 1 3 3 2 1 4 4 5
31 1 2 3 3 1 4 4 4
32 1 3 3 3 1 5 5 5
33 1 2 3 3 1 5 5 5
34 1 2 3 3 1 5 5 5
35 1 2 3 3 1 5 5 5
36 1 2 3 3 1 6 4 6
37 3 2 1 2 1 3 6 6
38 3 2 1 2 1 3 5 5
39 3 2 1 1 1 4 5 5
ID: Questionnaire number,
PT: Project type (1:Residental, 2:Commercial, 3:Education, 4:Health, 5:Other)
PS: Project size (1:small, 2:medium, 3:big)
PL: Project location (1:high density urban area, 2:low density urban area, 3:suburban area)
SD: Construction site distance from rebar supplier (1: 0-10km, 2: 10-30km, 3: 30-50km, 4: More than 50km)
RP: Rebar preparation place (1: on-site, 2: off-site, 3: both)

162
Table C.2 Raw data for project characteristics and project performance
related factors (continued) ID PT PS PL SD RPP PROJperf1 PROJperf2 PROJperf3
40 3 2 1 1 1 4 4 6
41 3 1 1 1 1 5 4 5
42 3 1 1 1 1 5 5 5
43 3 2 1 1 1 4 3 4
44 3 2 1 1 1 4 4 5
45 5 2 1 3 1 3 5 6
46 5 2 1 3 1 4 5 5
47 5 2 1 3 1 4 4 5
48 5 2 1 3 1 5 5 5
49 3 2 3 2 1 6 6 1
50 3 2 3 2 1 6 6 4
51 1 3 2 2 1 6 6 6
52 1 3 2 2 1 4 4 4
53 1 3 2 2 1 5 5 5
54 1 1 1 2 1 5 5 5
55 1 1 1 2 1 4 4 4
56 1 1 1 2 1 5 5 5
57 1 1 1 2 1 4 5 4
58 5 2 1 2 1 5 5 5
59 5 2 1 2 1 4 5 5
60 5 2 1 2 1 5 5 5
61 3 2 1 1 1 4 5 4
62 3 2 1 1 1 4 5 6
63 3 1 3 3 2 4 4 4
64 3 2 3 3 2 4 4 4
65 3 1 3 3 2 4 4 4
66 5 2 2 1 1 4 5 6
67 3 2 1 1 1 4 5 6
68 3 2 1 1 1 4 4 4
69 3 2 1 1 1 4 5 6
70 2 2 3 3 1 5 5 5
71 2 2 3 3 1 5 5 5
72 1 1 2 2 1 5 3 5
73 1 1 2 2 1 6 6 6
74 1 1 2 2 1 5 5 5
75 1 3 3 3 1 4 5 5
76 1 3 3 3 1 5 5 5
77 1 2 2 1 1 4 5 5
78 1 2 2 1 1 5 5 5
79 5 3 2 1 3 4 5 5
80 5 3 2 1 3 4 5 4
ID: Questionnaire number,
PT: Project type (1:Residental, 2:Commercial, 3:Education, 4:Health, 5:Other)
PS: Project size (1:small, 2:medium, 3:big)
PL: Project location (1:high density urban area, 2:low density urban area, 3:suburban area)
SD: Construction site distance from rebar supplier (1: 0-10km, 2: 10-30km, 3: 30-50km, 4: More than 50km)
RP: Rebar preparation place (1: on-site, 2: off-site, 3: both)

163
Table C.2 Raw data for project characteristics and project performance
related factors (continued)
ID PT PS PL SD RPP PROJperf1 PROJperf2 PROJperf3
81 1 3 2 1 3 3 6 6
82 1 2 1 1 1 4 5 5
83 1 2 1 1 1 4 5 4
84 2 3 3 3 1 5 5 5
85 2 3 3 3 1 5 5 5
86 2 3 3 3 1 4 4 4
87 1 3 2 2 1 3 5 6
88 1 3 2 2 1 5 5 5
89 3 2 2 2 1 3 4 5
90 3 2 2 2 1 4 4 4
91 4 2 2 2 1 3 4 4
92 4 2 2 2 1 4 4 3
93 3 3 1 1 1 4 4 3
94 3 3 1 1 1 4 4 4
95 3 2 1 2 1 5 5 6
96 1 3 2 2 1 5 4 5
97 1 2 1 2 1 5 3 5
98 1 2 1 2 1 5 3 5
99 1 2 1 2 1 5 3 5
100 2 3 3 3 3 4 5 4
101 2 3 3 3 3 4 5 4
102 2 3 3 3 3 5 5 5
103 2 3 3 3 3 4 4 4
104 1 2 2 2 3 6 6 6
105 1 2 2 2 3 5 5 5
106 3 3 2 2 3 5 5 5
107 3 3 2 2 3 5 5 5
108 2 3 1 2 1 5 5 6
109 5 1 2 1 2 3 4 5
110 5 1 2 1 2 6 6 6
111 4 3 2 2 3 3 5 5
112 4 3 2 2 3 4 5 5
113 1 2 2 2 3 4 5 5
114 1 2 2 2 3 5 5 5
115 5 1 3 3 1 4 6 3
ID: Questionnaire number,
PT: Project type (1:Residental, 2:Commercial, 3:Education, 4:Health, 5:Other)
PS: Project size (1:small, 2:medium, 3:big)
PL: Project location (1:high density urban area, 2:low density urban area, 3:suburban area)
SD: Construction site distance from rebar supplier (1: 0-10km, 2: 10-30km, 3: 30-50km, 4: More than 50km)
RP: Rebar preparation place (1: on-site, 2: off-site, 3: both)

164
Table C.3 Raw data for project characteristics and contractor related factors
ID PT PS PL SD RPP
CONT1per
f
CONT2per
f
CONT3per
f
CONT4per
f
CONT5per
f
CONT6per
f
CONT7per
f
CONT8per
f
CONT9per
f
CONT10per
f
CONT11per
f
CONT12per
f
1 1 2 1 1 1 4 4 5 5 5 4 6 5 5 5 4 5
2 1 2 3 1 1 4 5 5 3 3 4 5 4 4 5 5 5
3 1 2 2 1 1 4 4 5 5 4 4 4 3 3 5 5 4
4 1 2 1 1 1 5 5 5 4 5 5 5 4 5 6 4 4
5 1 3 2 2 1 6 6 6 6 6 6 6 6 6 5 5 6
6 1 3 2 2 1 5 5 5 5 4 4 5 5 5 3 4 5
7 2 3 3 3 3 5 5 5 5 4 4 5 5 5 5 5 5
8 2 3 3 3 3 5 5 5 5 4 4 5 5 5 4 5 5
9 1 3 2 2 1 6 6 5 6 6 6 6 6 1 5 4 6
10 1 2 2 2 1 5 5 5 5 5 5 5 6 3 3 4 5
11 1 2 2 2 1 6 6 5 6 6 6 6 6 1 6 4 6
12 1 3 2 2 1 5 5 5 5 5 5 5 5 3 4 3 5
13 1 3 2 1 1 5 6 6 5 6 6 6 6 6 5 6 6
14 1 3 2 1 1 5 6 5 5 5 6 6 6 6 6 5 6
15 1 2 2 2 3 4 4 4 4 5 5 6 4 6 4 3 6
16 1 2 2 2 3 4 6 4 4 4 5 6 4 5 4 3 6
17 1 3 2 1 1 6 6 6 5 6 6 6 6 5 4 5 5
18 1 2 2 1 3 6 6 5 6 6 6 6 5 4 5 4 5
19 2 3 3 1 1 6 6 6 6 4 5 4 6 6 6 6 6
20 4 3 2 1 1 6 6 6 6 6 6 6 6 6 6 6 6
21 4 3 2 1 1 5 5 5 5 1 1 5 5 3 3 3 3
22 4 3 2 1 1 4 4 4 4 3 3 3 4 4 4 4 5
23 2 2 3 4 3 4 4 4 4 4 4 5 6 4 4 4 5
24 2 2 3 4 3 4 4 4 4 2 2 5 4 3 3 3 4
25 2 2 3 4 3 3 3 2 3 2 2 5 5 3 3 3 5
ID: Questionnaire
number,
SD: Construction site distance from rebar supplier (1: 0-10km, 2: 10-30km, 3: 30-50KM, 4: More than 50km)
PT: Project type (1:Residental, 2:Commercial, 3:Education, 4:Health, 5:Other) RP: Rebar preparation place (1: on-site, 2: off-site, 3: both)
PL: Project location (1:high density urban area, 2:low density urban area, 3:suburban area)

165
Table C.3 Raw data for project characteristics and contractor related factors (continued)
ID PT PS PL SD RPP CONT1perf CONT2perf CONT3perf CONT4perf CONT5perf CONT6perf CONT7perf CONT8perf CONT9perf CONT10perf CONT11perf CONT12perf
26 2 2 3 2 3 5 5 5 5 4 4 5 5 5 4 4 5
27 2 2 3 2 3 3 3 3 3 3 3 4 4 4 4 4 4
28 1 2 2 2 1 5 4 4 5 4 4 6 5 5 4 4 6
29 1 2 2 2 1 5 5 4 5 3 3 4 4 4 3 3 5
30 1 3 3 2 1 5 5 5 5 5 5 5 5 5 5 5 5
31 1 2 3 3 1 5 5 4 4 4 4 5 5 5 4 4 5
32 1 3 3 3 1 5 5 5 5 5 5 6 6 6 6 5 6
33 1 2 3 3 1 5 5 4 4 4 4 5 5 5 4 4 5
34 1 2 3 3 1 4 4 4 4 4 4 5 5 4 4 5 5
35 1 2 3 3 1 5 5 4 4 4 4 5 5 5 4 4 5
36 1 2 3 3 1 5 6 5 5 5 5 6 6 6 6 5 6
37 3 2 1 2 1 3 3 4 4 3 3 5 4 4 4 4 3
38 3 2 1 2 1 4 4 4 4 4 4 4 5 5 4 4 3
39 3 2 1 1 1 4 4 4 4 4 4 6 6 1 1 2 6
40 3 2 1 1 1 4 4 6 4 4 4 6 5 1 3 4 4
41 3 1 1 1 1 5 5 4 4 5 4 5 5 4 3 4 4
42 3 1 1 1 1 4 5 4 4 4 4 5 5 4 3 4 4
43 3 2 1 1 1 5 5 4 4 5 4 4 3 4 3 5 5
44 3 2 1 1 1 4 4 4 4 4 4 4 4 4 3 4 4
45 5 2 1 3 1 2 2 4 4 4 3 6 6 3 2 6 6
46 5 2 1 3 1 3 3 3 3 2 2 6 6 4 3 4 4
47 5 2 1 3 1 2 2 4 4 4 4 6 6 3 3 5 5
48 5 2 1 3 1 3 3 3 3 2 2 6 6 4 3 4 4
49 3 2 3 2 1 6 5 6 6 6 3 6 5 4 3 5 6
50 3 2 3 2 1 5 5 5 5 5 4 5 5 4 4 5 5
ID: Questionnaire
number,
SD: Construction site distance from rebar supplier (1: 0-10km, 2: 10-30km, 3: 30-50KM, 4: More than 50km)
PT: Project type (1:Residental, 2:Commercial, 3:Education, 4:Health, 5:Other) RP: Rebar preparation place (1: on-site, 2: off-site, 3: both)
PS: Project size (1:small, 2:medium, 3:big)
PL: Project location (1:high density urban area, 2:low density urban area, 3:suburban area)

166
Table C.3 Raw data for project characteristics and contractor related factors (continued)
ID: Questionnaire number,
SD: Construction site distance from rebar supplier (1: 0-10km, 2: 10-30km, 3: 30-50KM, 4: More than 50km)
PT: Project type (1:Residental, 2:Commercial, 3:Education, 4:Health, 5:Other) RP: Rebar preparation place (1: on-site, 2: off-site, 3: both)
PS: Project size (1:small, 2:medium, 3:big) PL: Project location (1:high density urban area, 2:low density urban area, 3:suburban area)
ID PT PS PL SD RPP CONT1perf CONT2perf CONT3perf CONT4perf CONT5perf CONT6perf CONT7perf CONT8perf CONT9perf CONT10perf CONT11perf CONT12perf
51 1 3 2 2 1 6 6 6 6 6 6 4 6 4 6 6 4
52 1 3 2 2 1 4 4 4 4 2 2 5 5 3 5 5 5
53 1 3 2 2 1 4 4 4 4 4 4 4 4 2 3 4 4
54 1 1 1 2 1 5 5 5 5 5 5 6 5 2 3 4 5
55 1 1 1 2 1 4 4 4 4 3 3 5 4 1 2 3 4
56 1 1 1 2 1 4 4 4 4 4 4 5 5 2 3 3 4
57 1 1 1 2 1 5 5 5 5 5 5 5 5 2 3 3 3
58 5 2 1 2 1 5 5 5 5 5 5 6 6 2 2 3 4
59 5 2 1 2 1 4 4 4 4 3 3 5 4 1 2 3 4
60 5 2 1 2 1 5 5 5 5 4 4 6 6 2 4 3 5
61 3 2 1 1 1 4 4 4 4 3 3 6 3 2 4 4 4
62 3 2 1 1 1 2 2 4 4 3 4 6 5 2 4 4 4
63 3 1 3 3 2 5 5 3 4 3 3 5 5 4 3 4 5
64 3 2 3 3 2 4 4 4 4 4 4 5 6 4 4 4 5
65 3 1 3 3 2 4 6 2 4 4 4 4 4 4 4 4 4
66 5 2 2 1 1 3 3 3 3 4 3 6 6 3 3 4 6
67 3 2 1 1 1 2 2 4 4 4 3 6 6 3 3 6 6
68 3 2 1 1 1 3 3 3 3 4 4 5 5 4 4 4 5
69 3 2 1 1 1 2 2 4 4 3 5 6 4 2 3 4 4
70 2 2 3 3 1 4 4 4 4 2 2 5 4 4 2 2 5
71 2 2 3 3 1 5 5 3 5 4 4 5 5 5 3 3 5
72 1 1 2 2 1 4 4 4 4 3 3 4 4 4 4 4 4
73 1 1 2 2 1 5 5 5 5 5 5 5 5 5 5 4 4
74 1 1 2 2 1 5 5 4 5 3 4 4 4 6 4 4 6
75 1 3 3 3 1 5 4 4 5 4 4 6 5 4 5 4 4

167
Table C.3 Raw data for project characteristics and contractor related factors (continued) ID PT PS PL SD RPP CONT1perf CONT2perf CONT3perf CONT4perf CONT5perf CONT6perf CONT7perf CONT8perf CONT9perf CONT10perf CONT11perf CONT12perf
76 1 3 3 3 1 5 5 5 5 4 5 6 5 4 5 5 5
77 1 2 2 1 1 5 4 4 5 4 4 6 5 4 5 4 4
78 1 2 2 1 1 4 5 5 5 5 6 6 5 4 6 5 5
79 5 3 2 1 3 5 5 5 5 5 5 6 6 6 5 5 6
80 5 3 2 1 3 4 4 5 4 4 4 6 5 4 4 4 5
81 1 3 2 1 3 3 3 5 5 5 4 6 6 5 5 6 6
82 1 2 1 1 1 4 4 5 5 4 4 6 4 5 3 3 4
83 1 2 1 1 1 4 5 5 3 3 4 6 4 4 4 5 5
84 2 3 3 3 1 4 4 4 4 2 2 5 4 4 3 3 4
85 2 3 3 3 1 4 5 5 5 5 5 5 5 4 4 4 4
86 2 3 3 3 1 5 5 3 5 4 4 5 5 6 4 4 6
87 1 3 2 2 1 6 6 6 6 5 5 6 6 5 5 5 5
88 1 3 2 2 1 6 6 6 6 2 2 6 5 3 3 3 6
89 3 2 2 2 1 6 6 6 5 5 5 6 6 4 4 5 5
90 3 2 2 2 1 5 5 5 5 2 2 6 5 3 3 4 6
91 4 2 2 2 1 3 3 3 4 4 4 6 6 5 5 4 5
92 4 2 2 2 1 3 4 4 3 3 4 5 4 4 4 3 5
93 3 3 1 1 1 4 4 4 4 3 3 6 4 2 3 2 4
94 3 3 1 1 1 2 2 2 2 3 4 6 5 2 3 4 4
95 3 2 1 2 1 3 3 4 4 4 3 6 5 3 3 6 6
96 1 3 2 2 1 4 4 4 4 2 2 4 4 4 3 3 5
97 1 2 1 2 1 4 4 4 4 4 4 6 5 5 5 4 4
98 1 2 1 2 1 4 4 4 4 2 2 4 4 4 3 3 5
99 1 2 1 2 1 4 4 4 4 4 4 6 5 5 5 4 4
100 2 3 3 3 3 4 4 4 4 2 2 6 6 5 3 3 6
ID: Questionnaire
number,
SD: Construction site distance from rebar supplier (1: 0-10km, 2: 10-30km, 3: 30-50KM, 4: More than 50km)
PT: Project type (1:Residental, 2:Commercial, 3:Education, 4:Health, 5:Other) RP: Rebar preparation place (1: on-site, 2: off-site, 3: both)
PS: Project size (1:small, 2:medium, 3:big) PL: Project location (1:high density urban area, 2:low density urban area, 3:suburban area)

168
Table C.3 Raw data for project characteristics and contractor related factors (continued) ID PT PS PL SD RPP CONT1perf CONT2perf CONT3perf CONT4perf CONT5perf CONT6perf CONT7perf CONT8perf CONT9perf CONT10perf CONT11perf CONT12perf
101 2 3 3 3 3 4 4 4 4 4 4 4 4 4 4 4 4
102 2 3 3 3 3 4 4 4 4 2 2 6 6 5 3 3 6
103 2 3 3 3 3 4 4 4 4 4 4 4 4 4 4 4 4
104 1 2 2 2 3 4 4 4 4 4 4 6 5 5 3 3 6
105 1 2 2 2 3 4 4 4 4 4 4 4 4 4 4 4 4
106 3 3 2 2 3 4 4 4 4 5 4 6 4 4 4 4 5
107 3 3 2 2 3 4 4 4 4 4 4 4 4 4 4 4 4
108 2 3 1 2 1 5 5 6 6 5 5 3 6 4 6 5 4
109 5 1 2 1 2 3 4 3 3 3 3 6 5 1 1 2 4
110 5 1 2 1 2 5 6 6 5 6 6 6 6 6 5 6 6
111 4 3 2 2 3 6 6 6 6 6 6 6 6 6 6 6 6
112 4 3 2 2 3 5 6 5 5 6 6 6 6 6 6 6 6
113 1 2 2 2 3 5 6 5 5 6 6 6 6 6 6 6 6
114 1 2 2 2 3 6 6 6 6 6 6 6 6 6 6 6 6
115 5 1 3 3 1 6 6 6 6 6 6 6 6 4 4 6 6
ID: Questionnaire
number,
SD: Construction site distance from rebar supplier (1: 0-10km, 2: 10-30km, 3: 30-50KM, 4: More than 50km)
PT: Project type (1:Residental, 2:Commercial, 3:Education, 4:Health, 5:Other) RP: Rebar preparation place (1: on-site, 2: off-site, 3: both)
PS: Project size (1:small, 2:medium, 3:big) PL: Project location (1:high density urban area, 2:low density urban area, 3:suburban area)

169
Table C.4 Raw data for project characteristics and sub-contractor related factors
I
D
P
T
P
S
P
L
S
D
RP
P
SUBCONTP
1
SUBCONTP
2
SUBCONTP
3
SUBCONTP
4
SUBCONTP
5
SUBCONTP
6
SUBCONTP
7
SUBCONTP
8
SUBCONTP
9
SUBCONTP1
0
SUBCONTP1
1
SUBCONTP1
2
SUBCONTP1
3
1 1 2 1 1 1 4 5 6 4 4 4 3 5 4 5 3 4 5
2 1 2 3 1 1 5 5 4 5 4 4 5 4 5 5 4 4 4
3 1 2 2 1 1 3 5 5 3 5 5 5 4 5 4 4 4 4
4 1 2 1 1 1 5 5 4 5 4 4 5 4 5 4 4 5 5
5 1 3 2 2 1 6 6 5 4 6 6 6 4 6 5 6 6 6
6 1 3 2 2 1 5 5 5 3 3 5 5 4 5 5 5 5 5
7 2 3 3 3 3 5 5 5 3 3 4 5 4 6 4 5 5 5
8 2 3 3 3 3 4 4 6 4 4 5 5 5 6 5 5 5 5
9 1 3 2 2 1 4 5 1 2 3 5 5 5 6 4 5 6 6
10 1 2 2 2 1 3 3 1 1 1 4 4 4 5 4 4 4 5
11 1 2 2 2 1 6 5 1 5 5 6 6 5 6 4 5 6 6
12 1 3 2 2 1 2 3 2 2 2 4 4 4 5 3 4 5 5
13 1 3 2 1 1 5 6 5 5 4 6 5 6 6 5 5 4 5
14 1 3 2 1 1 6 6 5 5 5 6 6 6 6 6 6 5 5
15 1 2 2 2 3 5 6 4 5 4 6 4 4 3 4 4 4 5
16 1 2 2 2 3 5 6 4 5 4 6 4 4 3 4 3 6 5
17 1 3 2 1 1 6 6 4 4 5 6 6 6 5 5 5 5 6
18 1 2 2 1 3 4 4 4 3 4 4 5 4 5 4 4 4 5
19 2 3 3 1 1 5 5 6 3 4 4 4 5 6 6 6 5 5
20 4 3 2 1 1 6 6 6 2 6 3 5 4 5 6 6 4 4
21 4 3 2 1 1 4 4 5 5 4 5 6 6 5 5 6 6 6
22 4 3 2 1 1 4 3 2 2 5 5 5 5 4 4 4 4 4
23 2 2 3 4 3 2 2 4 2 2 4 4 4 4 3 4 3 4
24 2 2 3 4 3 2 2 2 2 2 3 3 3 4 2 3 3 3
25 2 2 3 4 3 3 4 4 3 4 4 4 4 4 4 4 4 5
ID: Questionnaire
number,
SD: Construction site distance from rebar supplier (1: 0-10km, 2: 10-30km, 3: 30-50KM, 4: More than 50km)
PT: Project type (1:Residental, 2:Commercial, 3:Education, 4:Health, 5:Other) RP: Rebar preparation place (1: on-site, 2: off-site, 3: both)
PS: Project size (1:small, 2:medium, 3:big) PL: Project location (1:high density urban area, 2:low density urban area, 3:suburban area)

170
Table C.4 Raw data for project characteristics and sub-contractor related factors (continued)
ID PT PS PL SD
RP
P
SUBCONT
P1
SUBCONT
P2
SUBCONT
P3
SUBCONT
P4
SUBCONT
P5
SUBCONT
P6
SUBCONT
P7
SUBCONT
P8
SUBCONT
P9
SUBCONTP
10
SUBCONTP
11
SUBCONTP
12
SUBCONTP
13
26 2 2 3 2 3 2 2 2 2 2 4 4 4 5 3 5 3 3
27 2 2 3 2 3 4 4 4 4 4 4 4 4 5 4 4 4 4
28 1 2 2 2 1 5 4 4 3 5 6 6 5 3 5 6 5 6
29 1 2 2 2 1 5 5 5 3 5 5 5 5 5 5 6 5 6
30 1 3 3 2 1 2 3 4 3 3 6 6 6 6 4 5 5 4
31 1 2 3 3 1 4 4 3 3 3 5 5 5 5 4 5 5 5
32 1 3 3 3 1 5 5 5 4 5 5 5 6 6 6 6 5 5
33 1 2 3 3 1 4 4 3 3 3 5 5 5 5 4 5 5 5
34 1 2 3 3 1 6 5 5 5 4 5 5 5 5 5 5 5 5
35 1 2 3 3 1 2 3 2 2 2 5 5 5 5 3 4 5 5
36 1 2 3 3 1 6 6 5 5 5 6 6 6 6 6 6 5 5
37 3 2 1 2 1 3 3 3 2 5 5 5 5 3 5 4 4 4
38 3 2 1 2 1 5 5 5 4 5 6 6 6 5 5 5 5 5
39 3 2 1 1 1 2 2 2 2 2 4 3 3 3 2 3 4 4
40 3 2 1 1 1 3 3 3 2 2 2 3 3 4 3 3 4 4
41 3 1 1 1 1 3 3 3 3 3 4 4 3 2 3 4 4 4
42 3 1 1 1 1 4 5 3 3 5 4 5 3 3 4 3 4 5
43 3 2 1 1 1 3 3 3 3 3 4 4 3 2 4 4 3 3
44 3 2 1 1 1 4 4 2 3 3 3 5 2 2 3 4 4 5
45 5 2 1 3 1 3 3 3 2 5 4 5 5 3 4 3 3 4
46 5 2 1 3 1 3 5 3 1 4 4 5 5 3 4 4 4 4
47 5 2 1 3 1 3 3 3 1 4 4 4 4 4 4 3 3 4
48 5 2 1 3 1 3 4 4 1 4 4 5 5 3 4 4 4 4
49 3 2 3 2 1 5 6 3 2 6 6 6 4 6 5 6 4 6
50 3 2 3 2 1 5 4 4 3 3 4 4 4 6 5 6 5 6
ID: Questionnaire number,
SD: Construction site distance from rebar supplier (1: 0-10km, 2: 10-30km, 3: 30-50KM, 4: More than 50km)
PT: Project type (1:Residental, 2:Commercial, 3:Education, 4:Health, 5:Other) RP: Rebar preparation place (1: on-site, 2: off-site, 3: both)
PS: Project size (1:small, 2:medium, 3:big) PL: Project location (1:high density urban area, 2:low density urban area, 3:suburban area)

171
Table C.4 Raw data for project characteristics and sub-contractor related factors (continued)
ID PT PS PL SD
RP
P
SUBCONT
P1
SUBCONT
P2
SUBCONT
P3
SUBCONT
P4
SUBCONT
P5
SUBCONT
P6
SUBCONT
P7
SUBCONT
P8
SUBCONT
P9
SUBCONTP
10
SUBCONTP
11
SUBCONTP
12
SUBCONTP
13
51 1 3 2 2 1 5 5 1 4 6 3 4 6 6 4 6 6 6
52 1 3 2 2 1 3 3 1 3 4 4 5 5 5 3 5 5 5
53 1 3 2 2 1 4 4 2 2 3 4 5 5 4 4 4 4 4
54 1 1 1 2 1 3 3 2 2 2 3 3 3 3 3 3 4 4
55 1 1 1 2 1 2 3 2 2 2 4 3 2 3 2 4 4 4
56 1 1 1 2 1 3 5 2 3 4 4 4 4 2 4 4 5 5
57 1 1 1 2 1 2 2 1 2 2 3 3 3 3 3 3 4 4
58 5 2 1 2 1 3 3 2 2 2 4 4 4 3 3 3 4 4
59 5 2 1 2 1 3 3 2 2 2 5 5 5 3 2 4 4 4
60 5 2 1 2 1 3 3 2 2 2 4 5 4 3 3 4 4 4
61 3 2 1 1 1 3 3 3 3 3 3 4 4 3 3 3 4 4
62 3 2 1 1 1 4 3 2 2 1 4 3 3 4 3 4 4 4
63 3 1 3 3 2 5 5 5 2 3 5 5 5 5 4 4 4 4
64 3 2 3 3 2 5 5 4 4 4 5 5 5 5 5 5 5 5
65 3 1 3 3 2 5 5 5 5 5 5 5 5 3 5 4 5 6
66 5 2 2 1 1 3 3 3 2 3 3 5 5 3 5 3 4 4
67 3 2 1 1 1 3 3 3 2 5 4 5 5 3 5 3 4 4
68 3 2 1 1 1 3 3 2 2 2 2 2 2 3 3 3 4 4
69 3 2 1 1 1 4 3 2 2 1 4 3 3 4 3 4 4 4
70 2 2 3 3 1 3 3 3 2 3 4 4 4 5 3 3 4 4
71 2 2 3 3 1 5 4 4 4 4 4 4 4 5 3 4 4 5
72 1 1 2 2 1 4 4 3 3 4 4 5 5 4 4 4 4 4
73 1 1 2 2 1 5 6 6 5 5 5 5 5 6 6 6 6 6
74 1 1 2 2 1 4 4 4 4 4 4 4 4 4 4 4 4 4
75 1 3 3 3 1 4 4 4 3 3 4 5 5 5 2 4 4 5
ID: Questionnaire number,
SD: Construction site distance from rebar supplier (1: 0-10km, 2: 10-30km, 3: 30-50KM, 4: More than 50km)
PT: Project type (1:Residental, 2:Commercial, 3:Education, 4:Health, 5:Other) RP: Rebar preparation place (1: on-site, 2: off-site, 3: both)
PS: Project size (1:small, 2:medium, 3:big) PL: Project location (1:high density urban area, 2:low density urban area, 3:suburban area)

172
Table C.4 Raw data for project characteristics and sub-contractor related factors (continued)
ID PT PS PL SD RPP
SUBCONT
P1
SUBCONT
P2
SUBCONT
P3
SUBCONT
P4
SUBCONT
P5
SUBCONT
P6
SUBCONT
P7
SUBCONT
P8
SUBCONT
P9
SUBCONTP
10
SUBCONTP
11
SUBCONTP
12
SUBCONTP
13
76 1 3 3 3 1 4 4 4 3 3 4 5 5 5 4 3 3 4
77 1 2 2 1 1 3 3 4 3 3 4 4 4 4 4 4 4 4
78 1 2 2 1 1 5 4 4 2 3 4 5 5 5 5 1 4 5
79 5 3 2 1 3 4 3 3 2 4 4 4 4 5 3 4 4 4
80 5 3 2 1 3 4 4 3 2 2 5 5 5 5 4 4 4 5
81 1 3 2 1 3 4 5 4 2 5 4 4 4 3 4 3 3 4
82 1 2 1 1 1 4 5 6 4 4 4 3 5 4 5 3 4 5
83 1 2 1 1 1 5 5 2 2 2 4 5 3 3 3 3 5 5
84 2 3 3 3 1 3 3 3 2 3 4 4 4 5 3 3 4 4
85 2 3 3 3 1 5 4 4 2 3 4 5 5 5 3 4 5 5
86 2 3 3 3 1 4 4 4 2 2 4 4 4 5 3 4 4 5
87 1 3 2 2 1 6 6 5 4 6 6 6 5 6 5 6 6 6
88 1 3 2 2 1 4 4 6 4 4 5 5 5 6 5 5 5 5
89 3 2 2 2 1 6 6 5 4 6 6 6 5 6 5 6 6 6
90 3 2 2 2 1 4 4 6 4 4 5 5 5 5 4 4 5 5
91 4 2 2 2 1 4 4 5 2 3 5 4 4 4 3 4 4 4
92 4 2 2 2 1 4 4 4 2 3 4 5 5 5 4 5 5 4
93 3 3 1 1 1 2 3 2 2 2 3 4 4 2 4 3 4 4
94 3 3 1 1 1 4 3 2 2 2 5 4 2 4 5 5 5 5
95 3 2 1 2 1 3 3 3 3 4 4 4 4 3 4 4 4 5
96 1 3 2 2 1 4 4 3 3 4 4 5 5 5 4 4 4 4
97 1 2 1 2 1 3 5 2 2 2 5 5 3 3 3 3 4 4
98 1 2 1 2 1 4 4 3 3 4 4 5 3 3 4 3 4 4
99 1 2 1 2 1 3 5 2 2 2 5 5 5 5 5 3 4 4
100 2 3 3 3 3 1 2 1 1 1 4 4 4 5 2 4 5 5
ID: Questionnaire number,
SD: Construction site distance from rebar supplier (1: 0-10km, 2: 10-30km, 3: 30-50KM, 4: More than 50km)
PT: Project type (1:Residental, 2:Commercial, 3:Education, 4:Health, 5:Other) RP: Rebar preparation place (1: on-site, 2: off-site, 3: both)
PS: Project size (1:small, 2:medium, 3:big) PL: Project location (1:high density urban area, 2:low density urban area, 3:suburban area)

173
Table C.4 Raw data for project characteristics and sub-contractor related factors (continued)
ID PT PS PL SD RPP
SUBCONT
P1
SUBCONT
P2
SUBCONT
P3
SUBCONT
P4
SUBCONT
P5
SUBCONT
P6
SUBCONT
P7
SUBCONT
P8
SUBCONT
P9
SUBCONTP
10
SUBCONTP
11
SUBCONTP
12
SUBCONTP
13
101 2 3 3 3 3 2 3 2 2 2 5 4 4 5 3 5 5 5
102 2 3 3 3 3 1 2 1 1 1 4 4 4 5 3 5 4 5
103 2 3 3 3 3 2 3 2 2 2 5 4 4 4 3 4 5 5
104 1 2 2 2 3 4 4 4 4 4 5 5 5 5 4 5 5 5
105 1 2 2 2 3 4 4 4 2 2 4 4 4 4 2 4 4 4
106 3 3 2 2 3 4 4 4 4 4 6 6 6 5 4 5 5 5
107 3 3 2 2 3 4 4 4 2 2 4 5 5 5 3 5 4 4
108 2 3 1 2 1 5 4 3 6 3 5 6 6 3 5 3 6 4
109 5 1 2 1 2 2 2 1 1 1 4 4 4 5 3 5 5 5
110 5 1 2 1 2 5 6 5 5 4 6 5 6 6 5 5 4 5
111 4 3 2 2 3 5 5 5 5 6 6 6 6 5 4 4 6 6
112 4 3 2 2 3 5 5 5 5 5 6 5 5 5 5 5 6 6
113 1 2 2 2 3 5 5 5 5 5 6 5 5 5 5 5 6 6
114 1 2 2 2 3 6 6 6 5 6 6 6 5 4 4 4 6 6
115 5 1 3 3 1 4 4 4 4 5 4 4 4 3 3 4 4 4
ID: Questionnaire number,
SD: Construction site distance from rebar supplier (1: 0-10km, 2: 10-30km, 3: 30-50KM, 4: More than 50km)
PT: Project type (1:Residental, 2:Commercial, 3:Education, 4:Health, 5:Other) RP: Rebar preparation place (1: on-site, 2: off-site, 3: both) PS: Project size (1:small, 2:medium,
3:big)
PL: Project location (1:high density urban area, 2:low density urban area, 3:suburban area)

174
Table C.5 Raw data for project characteristics and supplier related factors
ID PT PS PL SD RPP SUP1perf SUP2perf SUP3perf SUP4perf SUP5perf SUP6perf SUP7perf SUP8perf SUP9perf SUP10perf SUP11perf SUP12perf
1 1 2 1 1 1 4 5 5 3 4 4 4 3 4 4 5 5
2 1 2 3 1 1 4 4 3 5 5 3 4 5 3 3 5 5
3 1 2 2 1 1 4 5 5 4 4 5 4 2 4 5 4 4
4 1 2 1 1 1 4 5 4 4 4 6 4 5 3 5 5 5
5 1 3 2 2 1 6 6 6 6 6 6 6 6 6 6 6 6
6 1 3 2 2 1 6 6 6 6 5 6 4 5 6 6 5 5
7 2 3 3 3 3 5 5 5 6 4 6 4 4 5 6 5 5
8 2 3 3 3 3 6 6 5 6 5 6 4 5 6 6 5 5
9 1 3 2 2 1 4 4 6 6 6 6 6 6 5 6 6 6
10 1 2 2 2 1 4 4 4 4 5 5 3 4 5 5 5 5
11 1 2 2 2 1 4 4 6 6 6 6 6 6 5 6 6 6
12 1 3 2 2 1 5 5 5 6 5 5 3 3 5 5 4 4
13 1 3 2 1 1 5 6 5 5 4 5 6 5 5 6 5 6
14 1 3 2 1 1 6 6 6 6 6 6 6 5 5 6 6 6
15 1 2 2 2 3 4 5 5 6 4 4 1 4 4 6 3 4
16 1 2 2 2 3 4 4 4 6 4 4 1 4 4 5 3 3
17 1 3 2 1 1 6 6 6 5 5 5 5 5 5 6 5 5
18 1 2 2 1 3 6 6 6 6 5 6 5 6 6 6 6 6
19 2 3 3 1 1 6 6 6 3 6 6 5 6 6 6 6 6
20 4 3 2 1 1 6 6 6 6 6 6 4 6 6 6 6 4
21 4 3 2 1 1 5 5 5 6 6 6 4 4 5 5 3 3
22 4 3 2 1 1 6 6 6 6 4 5 4 5 5 5 5 6
23 2 2 3 4 3 3 3 3 4 3 5 4 4 3 4 4 4
24 2 2 3 4 3 5 4 4 4 3 5 3 3 4 5 5 5
25 2 2 3 4 3 3 3 3 3 3 5 2 2 4 4 3 3
ID: Questionnaire number,
SD: Construction site distance from rebar supplier (1: 0-10km, 2: 10-30km, 3: 30-50KM, 4: More than 50km)
PT: Project type (1:Residental, 2:Commercial, 3:Education, 4:Health,
5:Other) RP: Rebar preparation place (1: on-site, 2: off-site, 3: both)
PS: Project size (1:small, 2:medium, 3:big) PL: Project location (1:high density urban area, 2:low density urban area, 3:suburban area)

175
Table C.5 Raw data for project characteristics and supplier related factors (continued)
ID PT PS PL SD RPP SUP1perf SUP2perf SUP3perf SUP4perf SUP5perf SUP6perf SUP7perf SUP8perf SUP9perf SUP10perf SUP11perf SUP12perf
26 2 2 3 2 3 3 3 3 4 4 4 4 4 4 4 4 4
27 2 2 3 2 3 4 4 4 4 5 5 3 3 5 5 3 5
28 1 2 2 2 1 6 6 6 6 6 6 6 6 6 6 6 6
29 1 2 2 2 1 6 6 6 6 6 6 5 5 6 6 6 6
30 1 3 3 2 1 4 4 4 6 4 5 3 3 4 4 4 4
31 1 2 3 3 1 5 5 5 5 5 5 5 4 5 5 5 5
32 1 3 3 3 1 6 6 6 6 6 6 6 4 5 6 6 6
33 1 2 3 3 1 5 5 5 5 5 5 5 4 5 5 5 5
34 1 2 3 3 1 4 4 4 4 4 4 4 4 4 4 4 4
35 1 2 3 3 1 4 4 4 5 5 5 3 3 4 4 4 5
36 1 2 3 3 1 6 6 6 6 6 6 6 4 5 6 6 6
37 3 2 1 2 1 5 5 5 5 4 5 5 6 5 6 6 5
38 3 2 1 2 1 4 4 4 5 5 4 5 6 5 6 6 5
39 3 2 1 1 1 5 5 5 6 5 5 4 4 5 5 5 5
40 3 2 1 1 1 5 5 5 5 4 5 4 4 5 6 5 5
41 3 1 1 1 1 4 4 4 3 5 5 5 5 4 5 5 5
42 3 1 1 1 1 4 4 4 3 5 5 3 3 4 5 4 4
43 3 2 1 1 1 5 5 5 5 5 4 5 5 4 5 5 5
44 3 2 1 1 1 5 5 5 5 5 5 3 3 5 5 4 3
45 5 2 1 3 1 5 6 6 5 5 5 5 6 6 6 6 6
46 5 2 1 3 1 5 6 6 6 2 5 4 5 5 5 5 5
47 5 2 1 3 1 5 5 5 5 3 5 5 6 6 6 6 6
48 5 2 1 3 1 5 6 6 6 2 5 4 5 5 5 5 5
49 3 2 3 2 1 6 5 3 6 6 6 6 5 6 5 5 6
50 3 2 3 2 1 6 5 3 6 6 6 6 5 6 5 5 6
ID: Questionnaire number,
SD: Construction site distance from rebar supplier (1: 0-10km, 2: 10-30km, 3: 30-50KM, 4: More than 50km)
PT: Project type (1:Residental, 2:Commercial, 3:Education, 4:Health, 5:Other) RP: Rebar preparation place (1: on-site, 2: off-site, 3: both)
PS: Project size (1:small, 2:medium, 3:big) PL: Project location (1:high density urban area, 2:low density urban area, 3:suburban area)

176
Table C.5 Raw data for project characteristics and supplier related factors (continued)
ID PT PS PL SD RPP SUP1perf SUP2perf SUP3perf SUP4perf SUP5perf SUP6perf SUP7perf SUP8perf SUP9perf SUP10perf SUP11perf SUP12perf
51 1 3 2 2 1 6 6 6 5 6 6 6 6 6 6 5 6
52 1 3 2 2 1 5 5 5 5 5 5 5 5 5 5 5 5
53 1 3 2 2 1 5 5 5 5 5 5 3 3 5 6 3 3
54 1 1 1 2 1 5 5 5 3 5 5 3 4 5 6 4 5
55 1 1 1 2 1 4 4 4 3 4 5 5 4 5 4 4 4
56 1 1 1 2 1 4 4 4 4 4 4 4 4 4 5 3 4
57 1 1 1 2 1 6 6 6 4 5 5 5 4 6 6 5 6
58 5 2 1 2 1 4 4 4 5 4 5 3 4 5 5 5 5
59 5 2 1 2 1 4 4 4 5 4 5 5 4 5 5 5 5
60 5 2 1 2 1 4 4 4 6 4 5 3 4 5 5 5 5
61 3 2 1 1 1 4 4 4 5 5 5 4 4 4 5 4 4
62 3 2 1 1 1 4 4 3 4 4 3 5 4 5 5 5 5
63 3 1 3 3 2 2 3 3 3 4 5 2 5 5 4 3 5
64 3 2 3 3 2 3 3 3 3 4 5 4 4 5 5 4 4
65 3 1 3 3 2 2 4 6 3 5 6 2 4 5 6 4 5
66 5 2 2 1 1 5 6 6 5 5 6 5 6 6 6 6 6
67 3 2 1 1 1 5 6 6 5 5 6 5 6 6 6 6 6
68 3 2 1 1 1 4 4 4 4 4 4 4 3 4 4 4 4
69 3 2 1 1 1 4 4 3 4 4 3 5 4 5 5 5 5
70 2 2 3 3 1 5 5 5 5 5 5 4 4 5 5 5 4
71 2 2 3 3 1 6 6 6 6 6 6 6 6 6 6 6 6
72 1 1 2 2 1 5 5 5 4 5 5 4 4 5 5 5 3
73 1 1 2 2 1 5 5 5 4 5 5 5 5 5 5 3 5
74 1 1 2 2 1 6 6 6 6 6 6 6 6 6 6 6 6
75 1 3 3 3 1 4 4 4 5 2 5 3 3 4 5 4 4
ID: Questionnaire number,
SD: Construction site distance from rebar supplier (1: 0-10km, 2: 10-30km, 3: 30-50KM, 4: More than 50km)
PT: Project type (1:Residental, 2:Commercial, 3:Education, 4:Health, 5:Other) RP: Rebar preparation place (1: on-site, 2: off-site, 3: both)
PS: Project size (1:small, 2:medium, 3:big) PL: Project location (1:high density urban area, 2:low density urban area, 3:suburban area)

177
Table C.5 Raw data for project characteristics and supplier related factors (continued)
ID PT PS PL SD RPP SUP1perf SUP2perf SUP3perf SUP4perf SUP5perf SUP6perf SUP7perf SUP8perf SUP9perf SUP10perf SUP11perf SUP12perf
76 1 3 3 3 1 5 5 5 5 3 4 4 4 5 5 4 4
77 1 2 2 1 1 4 4 4 4 4 4 3 4 4 4 4 4
78 1 2 2 1 1 5 6 5 3 5 4 3 4 5 5 4 3
79 5 3 2 1 3 5 5 5 6 5 5 4 5 5 6 5 6
80 5 3 2 1 3 5 5 5 6 5 5 3 3 5 6 3 3
81 1 3 2 1 3 5 6 6 5 5 5 5 5 6 5 6 6
82 1 2 1 1 1 4 5 5 3 4 4 4 3 4 4 5 5
83 1 2 1 1 1 4 4 3 5 5 3 3 3 5 4 4 4
84 2 3 3 3 1 5 5 5 5 5 5 4 4 4 4 4 3
85 2 3 3 3 1 5 5 5 6 3 5 4 4 5 5 4 4
86 2 3 3 3 1 6 6 6 6 6 6 6 6 6 6 6 6
87 1 3 2 2 1 6 6 6 6 5 6 4 4 6 6 4 4
88 1 3 2 2 1 5 5 5 5 5 5 5 5 5 5 5 5
89 3 2 2 2 1 5 5 5 5 6 6 5 4 5 6 4 4
90 3 2 2 2 1 5 5 5 4 5 5 4 4 5 5 4 4
91 4 2 2 2 1 4 4 4 5 4 4 3 3 5 5 5 4
92 4 2 2 2 1 5 5 5 5 5 4 3 4 5 4 4 4
93 3 3 1 1 1 4 4 4 6 5 5 4 4 4 5 5 5
94 3 3 1 1 1 4 4 4 5 5 5 5 4 5 5 5 5
95 3 2 1 2 1 5 5 5 5 5 6 5 5 5 5 5 5
96 1 3 2 2 1 4 4 4 6 5 5 3 3 4 5 5 5
97 1 2 1 2 1 5 5 5 5 5 5 3 3 5 5 4 4
98 1 2 1 2 1 5 5 5 5 5 5 3 3 4 5 5 5
99 1 2 1 2 1 5 5 5 6 5 6 3 3 5 5 4 4
100 2 3 3 3 3 6 6 6 6 4 6 2 3 5 5 4 4
ID: Questionnaire number,
SD: Construction site distance from rebar supplier (1: 0-10km, 2: 10-30km, 3: 30-50KM, 4: More than 50km)
PT: Project type (1:Residental, 2:Commercial, 3:Education, 4:Health, 5:Other) RP: Rebar preparation place (1: on-site, 2: off-site, 3: both)
PS: Project size (1:small, 2:medium, 3:big) PL: Project location (1:high density urban area, 2:low density urban area, 3:suburban area)

178
Table C.5 Raw data for project characteristics and supplier related factors (continued)
ID PT PS PL SD RPP SUP1perf SUP2perf SUP3perf SUP4perf SUP5perf SUP6perf SUP7perf SUP8perf SUP9perf SUP10perf SUP11perf SUP12perf
101 2 3 3 3 3 5 5 5 6 5 5 2 3 6 5 5 5
102 2 3 3 3 3 5 5 5 6 4 5 3 3 5 5 4 4
103 2 3 3 3 3 5 5 5 6 5 5 2 3 6 5 5 5
104 1 2 2 2 3 5 5 5 5 5 5 5 5 5 5 5 5
105 1 2 2 2 3 4 4 4 4 4 4 4 4 4 4 4 4
106 3 3 2 2 3 5 5 5 5 5 5 5 5 5 5 5 5
107 3 3 2 2 3 5 5 5 6 5 5 5 5 5 5 5 5
108 2 3 1 2 1 6 6 4 5 5 4 5 6 6 6 6 5
109 5 1 2 1 2 4 4 4 4 4 4 1 1 5 4 2 3
110 5 1 2 1 2 5 6 5 5 4 5 6 5 5 6 5 6
111 4 3 2 2 3 6 6 5 6 5 5 6 6 6 6 6 6
112 4 3 2 2 3 6 6 5 6 5 5 6 6 6 6 6 6
113 1 2 2 2 3 6 6 5 6 5 5 6 6 6 6 6 6
114 1 2 2 2 3 6 6 5 6 5 5 6 6 5 6 6 6
115 5 1 3 3 1 6 6 6 6 4 6 6 6 6 6 4 4
ID: Questionnaire number,
SD: Construction site distance from rebar supplier (1: 0-10km, 2: 10-30km, 3: 30-50KM, 4: More than 50km)
PT: Project type (1:Residental, 2:Commercial, 3:Education, 4:Health, 5:Other) RP: Rebar preparation place (1: on-site, 2: off-site, 3: both)
PS: Project size (1:small, 2:medium, 3:big) PL: Project location (1:high density urban area, 2:low density urban area, 3:suburban area)

179
Table C.6 Raw data for project characteristics and AE company related factors
ID PT PS PL SD RPP AE1perf AE2perf AE3perf AE4perf AE5perf AE6perf AE7perf
1 1 2 1 1 1 5 5 5 5 4 4 5
2 1 2 3 1 1 4 4 5 4 5 5 5
3 1 2 2 1 1 4 3 4 4 4 3 4
4 1 2 1 1 1 4 4 4 4 5 5 5
5 1 3 2 2 1 5 5 6 6 6 5 6
6 1 3 2 2 1 5 5 5 5 5 6 6
7 2 3 3 3 3 4 4 4 4 4 5 6
8 2 3 3 3 3 5 5 5 6 5 5 6
9 1 3 2 2 1 5 5 5 5 5 4 6
10 1 2 2 2 1 5 5 5 5 5 5 6
11 1 2 2 2 1 4 6 6 4 6 4 6
12 1 3 2 2 1 5 5 5 5 5 5 6
13 1 3 2 1 1 5 6 5 5 5 6 6
14 1 3 2 1 1 5 5 4 5 5 6 6
15 1 2 2 2 3 3 4 3 5 4 5 4
16 1 2 2 2 3 3 4 3 5 4 5 4
17 1 3 2 1 1 5 5 5 6 5 5 6
18 1 2 2 1 3 4 4 4 4 4 4 5
19 2 3 3 1 1 6 6 6 6 6 6 1
20 4 3 2 1 1 6 6 6 6 6 6 1
21 4 3 2 1 1 4 4 5 5 5 5 5
22 4 3 2 1 1 5 5 5 5 5 3 3
23 2 2 3 4 3 2 2 2 3 3 2 2
24 2 2 3 4 3 2 2 2 3 3 3 3
25 2 2 3 4 3 2 2 2 3 2 2 2
ID: Questionnair number,
SD: Construction site distance from rebar supplier (1: 0-10km, 2: 10-30km, 3: 30-50KM, 4: More than 50km)
PT: Project type (1:Residental, 2:Commercial, 3:Education, 4:Health, 5:Other) RP: Rebar preparation place (1: on-site, 2: off-site, 3: both)
PS: Project size (1:small, 2:medium, 3:big)
PL: Project location (1:high density urban area, 2:low density urban area, 3:suburban area)

180
Table C.6 Raw data for project characteristics and AE company related factors (continued)
ID PT PS PL SD RPP AE1perf AE2perf AE3perf AE4perf AE5perf AE6perf AE7perf
26 2 2 3 2 3 3 3 3 3 3 3 3
27 2 2 3 2 3 5 5 5 5 5 5 5
28 1 2 2 2 1 5 5 5 5 6 6 6
29 1 2 2 2 1 5 5 5 5 6 5 5
30 1 3 3 2 1 5 5 5 6 5 4 4
31 1 2 3 3 1 5 5 5 5 5 4 5
32 1 3 3 3 1 5 5 4 5 5 6 6
33 1 2 3 3 1 5 5 5 5 5 4 4
34 1 2 3 3 1 4 4 4 4 3 3 4
35 1 2 3 3 1 5 5 5 5 5 4 4
36 1 2 3 3 1 5 5 4 5 5 6 6
37 3 2 1 2 1 1 1 1 5 4 6 4
38 3 2 1 2 1 4 4 4 4 4 4 5
39 3 2 1 1 1 3 3 3 3 2 2 4
40 3 2 1 1 1 4 4 4 4 4 1 1
41 3 1 1 1 1 2 2 2 2 2 1 2
42 3 1 1 1 1 4 4 4 4 4 3 3
43 3 2 1 1 1 1 1 1 2 3 1 4
44 3 2 1 1 1 4 4 4 4 4 2 2
45 5 2 1 3 1 1 1 2 3 4 1 5
46 5 2 1 3 1 1 1 1 3 3 2 5
47 5 2 1 3 1 1 1 1 3 3 1 5
48 5 2 1 3 1 1 1 1 3 3 2 4
49 3 2 3 2 1 5 4 4 3 6 3 6
50 3 2 3 2 1 2 2 2 3 5 2 5
ID: Questionnair number,
SD: Construction site distance from rebar supplier (1: 0-10km, 2: 10-30km, 3: 30-50KM, 4: More than 50km)
PT: Project type (1:Residental, 2:Commercial, 3:Education, 4:Health, 5:Other) RP: Rebar preparation place (1: on-site, 2: off-site, 3: both)
PS: Project size (1:small, 2:medium, 3:big)
PL: Project location (1:high density urban area, 2:low density urban area, 3:suburban area)

181
Table C.6 Raw data for project characteristics and AE company related factors (continued)
ID PT PS PL SD RPP AE1perf AE2perf AE3perf AE4perf AE5perf AE6perf AE7perf
51 1 3 2 2 1 6 6 6 6 4 4 6
52 1 3 2 2 1 6 6 6 6 4 4 6
53 1 3 2 2 1 5 5 5 5 4 4 4
54 1 1 1 2 1 4 4 4 3 4 4 4
55 1 1 1 2 1 4 4 4 4 4 4 4
56 1 1 1 2 1 3 3 3 4 4 3 4
57 1 1 1 2 1 4 4 4 4 4 3 4
58 5 2 1 2 1 5 5 5 5 5 5 5
59 5 2 1 2 1 5 5 5 5 5 4 5
60 5 2 1 2 1 4 4 4 4 4 4 4
61 3 2 1 1 1 3 3 3 3 3 3 3
62 3 2 1 1 1 4 4 4 3 1 1 1
63 3 1 3 3 2 1 1 3 4 4 3 3
64 3 2 3 3 2 2 2 2 4 3 4 4
65 3 1 3 3 2 2 2 2 3 3 3 3
66 5 2 2 1 1 1 1 2 3 3 1 5
67 3 2 1 1 1 1 1 2 3 4 1 5
68 3 2 1 1 1 3 3 3 3 3 3 3
69 3 2 1 1 1 2 2 2 2 1 1 1
70 2 2 3 3 1 5 5 5 4 4 5 5
71 2 2 3 3 1 5 5 5 5 5 4 5
72 1 1 2 2 1 6 6 6 6 6 6 6
73 1 1 2 2 1 5 5 5 6 5 3 3
74 1 1 2 2 1 5 5 5 5 5 5 5
75 1 3 3 3 1 5 5 5 5 4 4 6
ID: Questionnair number
SD: Construction site distance from rebar supplier (1: 0-10km, 2: 10-30km, 3: 30-50KM, 4: More than 50km)
PT: Project type (1:Residental, 2:Commercial, 3:Education, 4:Health, 5:Other) RP: Rebar preparation place (1: on-site, 2: off-site, 3: both)
PS: Project size (1:small, 2:medium, 3:big)
PL: Project location (1:high density urban area, 2:low density urban area, 3:suburban area)

182
Table C.6 Raw data for project characteristics and AE company related factors (continued)
ID PT PS PL SD RPP AE1perf AE2perf AE3perf AE4perf AE5perf AE6perf AE7perf
76 1 3 3 3 1 5 5 5 5 5 5 5
77 1 2 2 1 1 5 5 5 4 4 5 5
78 1 2 2 1 1 5 4 4 4 5 5 6
79 5 3 2 1 3 4 4 3 4 4 5 5
80 5 3 2 1 3 5 5 5 5 5 5 5
81 1 3 2 1 3 2 3 3 5 4 5 6
82 1 2 1 1 1 5 5 5 5 4 4 5
83 1 2 1 1 1 4 4 5 4 5 5 5
84 2 3 3 3 1 5 5 5 4 4 6 6
85 2 3 3 3 1 5 4 4 4 5 5 6
86 2 3 3 3 1 5 5 5 5 4 5 5
87 1 3 2 2 1 5 5 6 6 6 5 6
88 1 3 2 2 1 5 5 5 5 5 5 6
89 3 2 2 2 1 5 5 5 5 4 6 6
90 3 2 2 2 1 4 6 4 3 4 5 6
91 4 2 2 2 1 4 4 4 5 3 5 5
92 4 2 2 2 1 5 3 5 4 4 6 6
93 3 3 1 1 1 2 2 2 3 3 2 5
94 3 3 1 1 1 2 2 2 3 2 2 2
95 3 2 1 2 1 1 1 1 3 4 3 3
96 1 3 2 2 1 5 5 5 5 5 6 6
97 1 2 1 2 1 6 6 6 6 6 6 6
98 1 2 1 2 1 6 6 6 6 6 6 6
99 1 2 1 2 1 6 6 6 6 6 6 6
100 2 3 3 3 3 3 3 3 3 3 5 5
ID: Questionnairenumber
SD: Construction site distance from rebar supplier (1: 0-10km, 2: 10-30km, 3: 30-50KM, 4: More than 50km)
PT: Project type (1:Residental, 2:Commercial, 3:Education, 4:Health, 5:Other) RP: Rebar preparation place (1: on-site, 2: off-site, 3: both)
PS: Project size (1:small, 2:medium, 3:big)
PL: Project location (1:high density urban area, 2:low density urban area, 3:suburban area)

183
Table C.6 Raw data for project characteristics and AE company related factors (continued)
ID PT PS PL SD RPP AE1perf AE2perf AE3perf AE4perf AE5perf AE6perf AE7perf
101 2 3 3 3 3 4 3 4 5 4 5 5
102 2 3 3 3 3 4 4 4 4 4 5 5
103 2 3 3 3 3 4 4 4 4 4 4 4
104 1 2 2 2 3 4 4 4 4 3 2 5
105 1 2 2 2 3 4 4 4 4 4 4 4
106 3 3 2 2 3 3 3 3 3 3 2 5
107 3 3 2 2 3 4 4 4 4 4 4 5
108 2 3 1 2 1 6 5 4 4 5 5 4
109 5 1 2 1 2 1 1 3 3 3 2 4
110 5 1 2 1 2 5 6 5 5 5 6 6
111 4 3 2 2 3 4 4 4 6 4 6 6
112 4 3 2 2 3 5 4 5 5 4 5 5
113 1 2 2 2 3 5 4 5 5 4 5 5
114 1 2 2 2 3 5 5 5 6 4 6 6
115 5 1 3 3 1 3 6 6 3 6 5 3
ID: Questionnair number
SD: Construction site distance from rebar supplier (1: 0-10km, 2: 10-30km, 3: 30-50KM, 4: More than 50km)
PT: Project type (1:Residental, 2:Commercial, 3:Education, 4:Health, 5:Other) RP: Rebar preparation place (1: on-site, 2: off-site, 3: both)
PS: Project size (1:small, 2:medium, 3:big)
PL: Project location (1:high density urban area, 2:low density urban area, 3:suburban area)

184
Table C.7 Raw data for project characteristics and external factors
ID PT PS PL SD RPP EXT1perf EXT2perf EXT3perf EXT4perf EXT5perf EXT6perf
1 1 2 1 1 1 4 5 5 4 5 6
2 1 2 3 1 1 3 5 5 5 3 4
3 1 2 2 1 1 3 4 5 3 5 5
4 1 2 1 1 1 5 5 4 4 4 5
5 1 3 2 2 1 6 6 6 5 6 6
6 1 3 2 2 1 5 5 4 4 5 3
7 2 3 3 3 3 5 3 4 5 5 3
8 2 3 3 3 3 5 5 4 4 3 3
9 1 3 2 2 1 5 5 4 1 5 6
10 1 2 2 2 1 5 5 1 1 5 1
11 1 2 2 2 1 5 6 6 1 6 6
12 1 3 2 2 1 5 5 1 1 6 2
13 1 3 2 1 1 6 5 5 4 4 3
14 1 3 2 1 1 5 5 5 5 5 3
15 1 2 2 2 3 2 4 4 4 4 4
16 1 2 2 2 3 1 4 3 3 5 4
17 1 3 2 1 1 6 5 5 6 5 5
18 1 2 2 1 3 6 6 6 6 6 4
19 2 3 3 1 1 6 6 5 6 6 6
20 4 3 2 1 1 6 6 4 6 6 1
21 4 3 2 1 1 5 5 1 1 5 2
22 4 3 2 1 1 4 4 3 3 5 5
23 2 2 3 4 3 5 2 2 2 2 4
24 2 2 3 4 3 4 4 1 1 3 1
25 2 2 3 4 3 3 3 3 2 4 2
26 2 2 3 2 3 4 4 4 4 4 4
27 2 2 3 2 3 5 5 4 4 5 5
28 1 2 2 2 1 5 6 5 5 4 5
29 1 2 2 2 1 5 6 4 5 5 5
30 1 3 3 2 1 5 4 3 4 4 4
31 1 2 3 3 1 5 5 4 4 5 4
32 1 3 3 3 1 5 5 5 5 5 3
33 1 2 3 3 1 5 5 4 4 5 4
34 1 2 3 3 1 5 5 4 4 5 5
35 1 2 3 3 1 5 5 4 4 5 4
36 1 2 3 3 1 5 5 5 5 5 3
37 3 2 1 2 1 5 5 3 4 4 4
38 3 2 1 2 1 5 5 3 4 4 4
39 3 2 1 1 1 4 4 3 3 5 5
ID: Questionnaire number
PT: Project type (1:Residental, 2:Commercial, 3:Education, 4:Health, 5:Other)
PS: Project size (1:small, 2:medium, 3:big)
PL: Project location (1:high density urban area, 2:low density urban area, 3:suburban area)
SD: Construction site distance from rebar supplier (1: 0-10km, 2: 10-30km, 3: 30-50km, 4: More than 50km )
RP: Rebar preparation place (1: on-site, 2: off-site, 3: both)

185
Table C.7 Raw data for project characteristics and external factors (continued)
ID PT PS PL SD RPP EXT1perf EXT2perf EXT3perf EXT4perf EXT5perf EXT6perf
40 3 2 1 1 1 5 5 3 4 4 5
41 3 1 1 1 1 4 2 4 3 3 4
42 3 1 1 1 1 4 4 4 4 4 3
43 3 2 1 1 1 4 4 4 4 4 4
44 3 2 1 1 1 5 5 3 4 4 4
45 5 2 1 3 1 6 6 3 3 3 4
46 5 2 1 3 1 5 5 4 4 5 5
47 5 2 1 3 1 6 5 4 4 5 5
48 5 2 1 3 1 5 5 4 4 5 5
49 3 2 3 2 1 6 6 6 3 6 6
50 3 2 3 2 1 6 6 6 5 6 6
51 1 3 2 2 1 6 6 6 5 5 5
52 1 3 2 2 1 5 5 1 5 5 3
53 1 3 2 2 1 5 5 3 5 5 4
54 1 1 1 2 1 4 2 3 3 4 4
55 1 1 1 2 1 3 3 3 4 4 4
56 1 1 1 2 1 4 2 3 3 4 4
57 1 1 1 2 1 4 2 3 3 4 4
58 5 2 1 2 1 3 4 3 3 4 4
59 5 2 1 2 1 3 3 3 3 3 3
60 5 2 1 2 1 4 5 3 3 4 4
61 3 2 1 1 1 5 5 4 4 4 4
62 3 2 1 1 1 5 5 4 4 4 4
63 3 1 3 3 2 3 2 3 3 4 4
64 3 2 3 3 2 5 5 3 3 5 3
65 3 1 3 3 2 3 4 6 2 2 6
66 5 2 2 1 1 6 6 3 3 2 5
67 3 2 1 1 1 6 6 3 3 2 5
68 3 2 1 1 1 4 4 3 2 4 3
69 3 2 1 1 1 4 4 3 3 3 3
70 2 2 3 3 1 5 4 4 5 5 5
71 2 2 3 3 1 6 6 4 4 6 6
72 1 1 2 2 1 5 5 5 5 5 5
73 1 1 2 2 1 5 5 3 3 5 2
74 1 1 2 2 1 6 6 4 4 6 6
75 1 3 3 3 1 4 3 2 3 4 2
76 1 3 3 3 1 4 2 3 3 4 2
77 1 2 2 1 1 4 5 2 2 5 2
78 1 2 2 1 1 3 5 3 5 4 6
79 5 3 2 1 3 5 4 4 4 5 4
ID: Questionnaire number,
PT: Project type (1:Residental, 2:Commercial, 3:Education, 4:Health, 5:Other)
PS: Project size (1:small, 2:medium, 3:big)
PL: Project location (1:high density urban area, 2:low density urban area, 3:suburban area)
SD: Construction site distance from rebar supplier (1: 0-10km, 2: 10-30km, 3: 30-50km, 4: More than 50km )
RP: Rebar preparation place (1: on-site, 2: off-site, 3: both)

186
Table C.7 Raw data for project characteristics and external factors (continued)
ID PT PS PL SD RPP EXT1perf EXT2perf EXT3perf EXT4perf EXT5perf EXT6perf
80 5 3 2 1 3 4 4 3 3 3 3
81 1 3 2 1 3 6 6 3 4 4 4
82 1 2 1 1 1 4 5 5 4 5 5
83 1 2 1 1 1 5 6 3 3 3 3
84 2 3 3 3 1 5 4 4 5 5 5
85 2 3 3 3 1 3 5 3 5 4 4
86 2 3 3 3 1 6 6 3 3 3 4
87 1 3 2 2 1 6 6 4 4 6 6
88 1 3 2 2 1 5 5 4 4 5 3
89 3 2 2 2 1 6 6 4 4 6 6
90 3 2 2 2 1 5 5 4 4 5 3
91 4 2 2 2 1 4 5 3 2 5 4
92 4 2 2 2 1 4 4 4 4 4 1
93 3 3 1 1 1 6 6 3 4 3 4
94 3 3 1 1 1 5 6 4 4 5 4
95 3 2 1 2 1 5 5 4 4 4 5
96 1 3 2 2 1 5 5 5 2 5 5
97 1 2 1 2 1 5 5 5 2 5 5
98 1 2 1 2 1 5 5 5 2 5 5
99 1 2 1 2 1 5 5 5 2 5 5
100 2 3 3 3 3 5 5 1 1 4 2
101 2 3 3 3 3 5 4 1 2 5 2
102 2 3 3 3 3 5 5 1 1 5 1
103 2 3 3 3 3 5 4 1 2 5 2
104 1 2 2 2 3 5 4 4 4 4 4
105 1 2 2 2 3 4 5 4 3 3 3
106 3 3 2 2 3 5 4 4 4 4 4
107 3 3 2 2 3 5 5 4 3 3 3
108 2 3 1 2 1 3 5 3 6 5 6
109 5 1 2 1 2 5 2 2 2 3 2
110 5 1 2 1 2 6 5 5 4 4 3
111 4 3 2 2 3 5 6 6 6 6 6
112 4 3 2 2 3 5 6 6 6 6 6
113 1 2 2 2 3 5 6 6 6 6 6
114 1 2 2 2 3 5 6 6 6 6 6
115 5 1 3 3 1 6 6 6 6 6 4
ID: Questionnaire number,
PT: Project type (1:Residental, 2:Commercial, 3:Education, 4:Health, 5:Other)
PS: Project size (1:small, 2:medium, 3:big)
PL: Project location (1:high density urban area, 2:low density urban area, 3:suburban area)
SD: Construction site distance from rebar supplier (1: 0-10km, 2: 10-30km, 3: 30-50km, 4: More than 50km )
RP: Rebar preparation place (1: on-site, 2: off-site, 3: both)

CURRICULUM VITAE
PERSONAL INFORMATION
Surname, Name: Yavuz, Zeliha Banu
Nationality: Turkish
Date and Place of Birth: 15.12.1978, Urfa
Marital Status: Married
Phone: +90 342 211 66 66
EDUCATION
Degree Institution Year of Graduation
MS ITU Building Science 2003
BS ITU Management Engineering 2002
BS ITU Architecture 2000
High School Yukselis College, Ankara 1996
WORK EXPERIENCE
Year Place Enrollment
2011- Zirve University Research Assistant
Faculty of Architecture and Design
2010-2011 Ender İnşaat Chief (Detailed design)
2002-2011 ARY İnşaat Site Chief
2000-2001 Arıköy Construction Coop. Architect
FOREIGN LANGUAGES
Advanced Engilish, Basic German and Arabic
187