impacts of conversion of tropical peat swamp forest to oil ...eprints.nottingham.ac.uk/43906/1/tonks...
TRANSCRIPT
1
Impacts of conversion of tropical peat swamp forest to oil palm plantation on peat 1
organic chemistry, physical properties and C stocks 2
Amanda J. Tonks1, 3, Paul Aplin2, Darren J. Beriro4, Hannah Cooper1, 3, Stephanie Evers3, 3
Christopher H. Vane4 and Sofie Sjögersten1* 4
5
1The University of Nottingham, School of Biosciences, Division of Agricultural and 6
Environmental Science, Sutton Bonington Campus, Loughborough, LE12 5RD, United 7
Kingdom 8
9
2Edge Hill University, St Helens Road, Ormskirk, Lancashire, L39 4QP, United Kingdom 10
11
3The University of Nottingham Malaysia Campus, School of Biosciences, Semenyih, 12
Selangor Darul Ehsan 43500, Malaysia 13
14
4British Geological Survey, Environmental Science Centre, Keyworth, Nottingham, NG12 15
5GG, United Kingdom 16
17
*Corresponding author: S. Sjogersten 18
E-mail: [email protected] 19
Phone: +44 (0)7772993691 20
21
2
Abstract 22
23
Ecosystem services provided by tropical peat swamp forests, such as C storage and water 24
regulation, are under threat due to encroachment and replacement of these natural forests by 25
drainage-based agriculture, commonly palm oil. This study aims to quantify how the 26
chemical and physical properties of peat change during land conversion to oil palm. This will 27
be addressed by comparing four separate stages of conversion; namely, secondary peat 28
swamp forests, recently deeply drained secondary forests, cleared and deforested areas (with 29
recently planted new oil palm plantation), and mature oil palm plantation in the vicinity of 30
North Selangor Peat Swamp Forest, Malaysia. Results indicate accelerated peat 31
decomposition in surface peats of oil palm plantations due to the lowered water table and 32
altered litter inputs associated with this land-use change. This reduced sSurface organic 33
matter content and peat C stocks from 1000 Mg ha-1 in intact at secondary forest sites than to 34
500 Mg ha-1 at mature oil palm sites (C stocks were 1000 and 500 Mg ha-1 at secondary forest 35
and mature oil palm sites, respectively). Land conversion altered peat physical properties 36
such as shear strength, bulk density and porosity, with mirrored changes above and below the 37
water table. Our findings suggest close links between the degree of decomposition and peat 38
physical properties through the entire depth of the peat profile. We have demonstrated that 39
conversion from secondary peat swamp forest to mature oil palm plantation may seriously 40
compromise C storage and, through its impact on peat physical properties, the water holding 41
capacity in these peatlands. 42
43
Keyword: land use change; carbon stocks; oil palm; organic chemistry; peat decomposition; 44
soil physical properties; tropical peat swamp forest 45

3
46

4
1. Introduction 47
Ombrotrophic tropical peat swamp forests are unique ecosystems covering 247 778 km2 in 48
SE Asia and 441 025 km2 globally (Page et al., 2011). covering an estimated 2 to 2.5 million 49
perched on rich deposits of preserved organic matter are made possible by substantial rainfall, 50
coupled with suitable topography and geology, which results in waterlogging. The anoxic and 51
acidic conditions retard microbial decay (Andriesse, 1988; Page et al, 2006; Yule and 52
Gomez, 2009) resulting in peat accumulation as inputs of litter from the vegetation are 53
greater than decomposition rates (Jauhiainen et al., 2008). 54
These unique systems are valuable resources, contributing a multitude of ecosystem services. 55
Above ground, tropical rainforests maintain areas of high biodiversity by providing habitats 56
for a variety of species, many of which are endemic (Posa et al. 2011; Keddy et al., 2009). 57
Below ground, the sequestration of atmospheric carbon is interwoven into the fabric of the 58
ecosystem (Jauhiainen et al., 2008). An estimated 42,000 megatons of ancient carbon is 59
stored in 12% of the total land area of Southeast Asia alone, making this one of the largest 60
stores of terrestrial carbon on Earth (Wetlands International, 2014). Peat soil structure is 61
responsible for ecosystem processes by controlling hydrology, which regulates hydrological 62
features within the catchment. For example, its high organic matter content and low bulk 63
density allows peat to acts as a water reservoir, mitigating extreme conditions such as floods 64
and droughts (Huat et al., 2011; Wösten et al., 2008). 65
Land use change over the past century has been a key driver of peatland degradation, with 66
conversion to agriculture and forestry, and peat extraction sites, leading to artificially lowered 67
water tables (Haddaway et al., 2014). Limitations in understanding how peatland systems 68
function has led to land degradation, which, for example has caused uncontrollable burning 69
of over a million hectares of Indonesian peat during 1996, resulting from excessive land use 70
5
change by the Mega Rice Project (Page et al., 2002). Land conversion to agricultural oil palm 71
plantation represents one of the primary threats to Malaysia’s peat swamp forests (Koh et al. 72
2011). However, knowledge of the impact of the different land conversion stages involved in 73
the establishment of oil palm plantations, in terms of decomposition, C stocks and peat 74
physical properties, is extremely limited as most previous work has focused on binary 75
comparison of intact forest and mature oil palm plantations. 76
Drainage of peat swamp forests to support oil palm production intensifies peat degradation as 77
the thickness of the oxygenated zone of decay (acrotelm) is increased. This enhances rapid 78
aerobic microbial decay compared to anaerobic decomposition which predominates within 79
the anoxic zone below the water table (Anshari et al., 2010). In addition to lowered water 80
tables, deforestation removes complex vegetation structures and replaces them with a 81
monoculture of oil palm trees, which deposit far less biomass, limiting organic matter inputs 82
(Anshari et al., 2010). The combination of decreased biomass input and reduced preservation 83
of deposited biomass has caused large-scale peat degradation resulting in high atmospheric 84
CO2 emissions (Hooijer et al., 2010; Couwenberg et al., 2010). 85
A greater degree of peat decomposition results in loss of structure as fresh litter is first broken 86
down to fibrous hemic peat, and then, following sustained decomposition, to sapric peat 87
(Wüst et al., 2003). The progressing decomposition process alters the organic components 88
and chemistry due to loss of carbon and conversion of readily decomposable materials, such 89
as polysaccharides, celluloses and hemicelluloses, with only more recalcitrant compounds 90
such as lignin and humic substances remaining (Andriesse, 1988; Broder et al., 2012; Kuhry 91
and Vitt, 1996; Yonebayashi et al., 1994). Degradation of physical properties occurs through 92
subsidence as the open pore structure created by the fibrous, woody material collapses due to 93
oxidation, shrinkage and compression, reducing total porosity and increasing bulk density as 94
more solid material is concentrated per unit volume (Wösten et al., 1997; Quinton et al., 95
6
2000). As a consequence of degradation, percolation of water down the peat profile slows, 96
decreasing hydraulic conductivity (Firdaus et al., 2010). Water storage characteristics are also 97
altered by decomposition as the water holding capacity is lowered and water retention 98
increases, with implications for both the water content and gas flux rates within the peatlands 99
(Boelter, 1964). 100
Knowledge on peat chemical and physical properties, as affected by the stages of land 101
conversion for oil palm cultivation, is necessary to develop effective peatland management, 102
and in the instance of degraded peatlands, restoration plans (Jauhianen et al., 2008; GEC, 103
2014), thus conserving valuable ecosystem services. Land-use change in tropical peatlands is 104
commonly discussed from the perspective of carbon emissions, with a very limited literature 105
associated with peatland properties, and even fewer studies associated with multiple stages of 106
conversion. This study determines how peat chemical and physical properties are altered 107
during land conversion to oil palm. To achieve this we tested the following hypothesis: Land-108
use change of secondary peat swamp forests by drainage, clearance of forest and planting of 109
oil palm, and finally establishment of mature oil palm plantations, which involve lowering of 110
the water table and altered litter inputs, will accelerate peat decomposition and reduce C 111
storage in tropical peatlands. As a consequence of land-use change to oil palm plantation, we 112
predict greater peat humification and loss of carbohydrates and carboxyl compounds relative 113
to recalcitrant aromatic structures reflecting enhanced microbial decomposition in drained 114
surface peat layers. We expect this enhanced decomposition to result in (i) peat subsidence 115
and lower C stocks in mature oil palm plantations compared to secondary forest sites and 116
areas under the initial stages of conversion and (ii) highest shear strength and bulk densities, 117
but the lowest porosity at oil palm sites. 118
119

7
2. Study sites 120
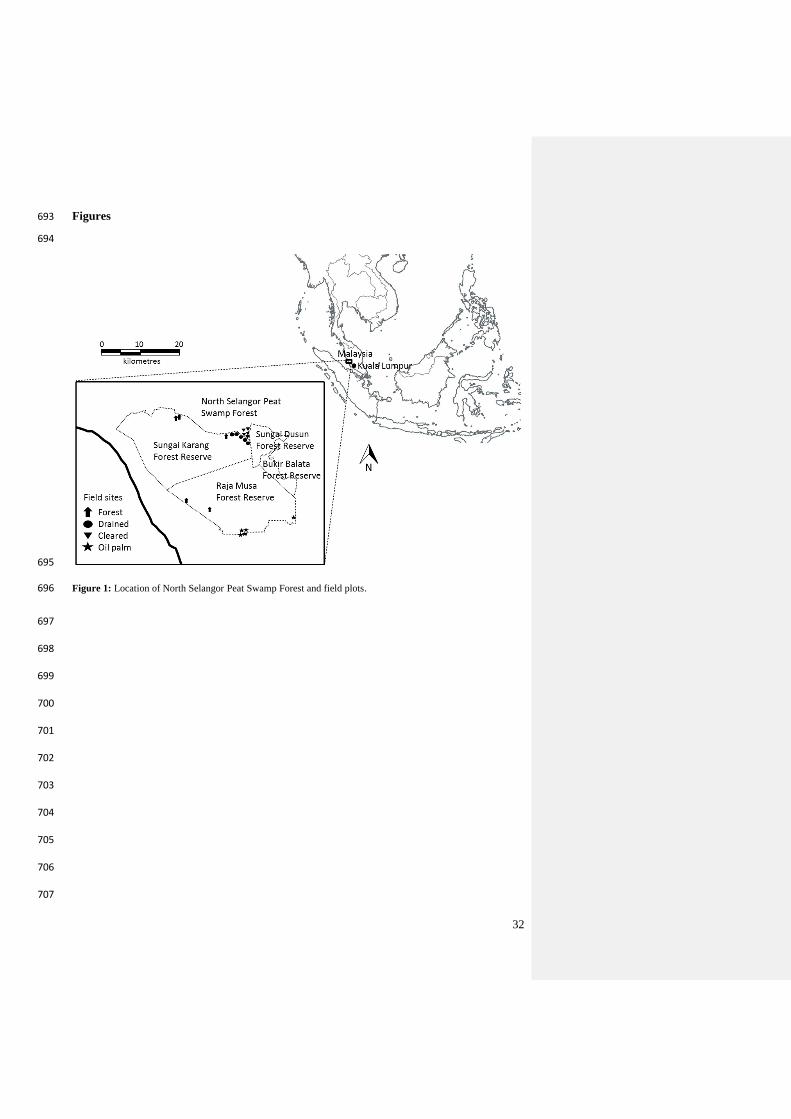
The study site of North Selangor Peat Swamp Forest (NSPSF) is situated on a flat coastal 121
plain about 10 km inland on the west coast of Peninsular Malaysia (Figure 1), (Yule and 122
Gomez, 2009). This tropical ombrotrophic peat swamp covers 73,592 ha and includes 50,106 123
ha of the Sungai Karang Forest Reserve to the north and 23,486 ha of the Raja Musa Forest 124
Reserve to the south (Ahmed, 2014). The main tree species found in the areas are: 125
Macaranga pruinosa, Campnospermacoriaceum, Blumeodendron tokbrai, Shorea 126
platycarpa, Parartocarpus venenosus, Ixora grandiflora, Pternandra galeata, Crytostachys 127
sp., and Pandanus atrocarpus (Yule and Gomez 2009). Four land conversion classes were 128
selected, with five replicate sites for each, to represent the stages involved in the process of 129
conversion (ranging from intact forest to mature oil palm): 130
131
During the early Holocene, the area was likely colonised by extensive mangrove systems, but 132
these diminished after the last Holocene interglacial marine incursion when the fresh water 133
peatland vegetation started to take hold, resulting in the deposition of acidic peat up to 5 m 134
deep, overlaying grey marine clay (Yule and Gomez, 2009). The area receives an average 135
rainfall of over 2000 mm per year, with the driest month in June measuring 76 to 191 mm 136
and the wettest month in November measuring 185 to 414 mm (Sim and Balamurugam, 137
1990; Yusop, 2002). Average shaded air temperature recorded was 28.5 °C, with an average 138
monthly relative humidity of 77.2% (Hahn-Schilling, 1994). 139
140
The study site of North Selangor Peat Swamp Forest (NSPSF) is situated on a flat coastal 141
plain about 10 km inland on the west coast of Peninsular Malaysia (Figure 1), (Yule and 142
8
Gomez, 2009). This tropical ombrotrophic peat swamp covers 73,592 ha and includes 50,106 143
ha of the Sungai Karang Forest Reserve to the north and 23,486 ha of the Raja Musa Forest 144
Reserve to the south (Ahmed, 2014). The main tree species found in the areas are: 145
Macaranga pruinosa, Campnospermacoriaceum, Blumeodendron tokbrai, Shorea 146
platycarpa, Parartocarpus venenosus, Ixora grandiflora, Pternandra galeata, Crytostachys 147
sp., and Pandanus atrocarpus (Yule and Gomez 2009). Four land conversion classes were 148
selected, with five replicate sites for each, to represent the stages involved in the process of 149
conversion (ranging from intact forest to mature oil palm): 150
Stage 1. Shallowly drained Fforest sites – prior to conversion, intact secondary peat 151
swamp forests were water tables are close to or at the surface for a large part of the year, 152
maximum water table draw down was ca. 0.5-0.6 in areas away from drainage ditches 153
(GEC 2014). 154
Stage 2. Recently deeply Ddrained forest sites – extensive drainage of peat swamp forests 155
where large drainage ditches (2-3 meters wide and ca. 2 m deep) have been dug every few 156
hundred meters in order to lower the water table, but trees and denseunderstory vegetation 157
shrubs are left relatively intacthave not been removed. In this case ditches were 158
constructed c. 6 months prior to fieldwork. 159
Stage 3. ClearedRecently planted young oil palm sites – areas in which both drainage and 160
deforestation has occurred, which subsequently is planted with oil palm seedlings (also c. 161
6 months prior to sampling). 162
Stage 4. Mature Ooil palm sites – fully mature oil palm plantations, in which drainage, 163
deforestation, and establishment of oil palm trees for 10-15 years has occurred (age range 164
of the sampling sites was estimated based on height of the oil palms). All the oil palm 165
sites are first generation of oil palm . Water table monitoring within the NSPSF indicate 166

9
maximum water table draw down to ca. 1.5 m below the surface during periods of low 167
rainfall with water tables generally being below 0.5 m below the surface (GEC 2014). 168
169
3. Materials and Methods 170
3.1.Field sampling 171
Within each of the land conversion classes, five census plots with areas of 900 m2 were 172
marked out during November and December of 2014. The broad site selection was based on 173
areal images and maps (GEC 2014). Forest sites were selected to be spatially distributed over 174
NSPSF taking accessibility into account. Recently deeply-drained forest and recently plant oil 175
palm plantations site were constrained to two areas of subject to this land use. Within these 176
areas plots were selected randomly (see below). Mature oil palm areas were chosen to be as 177
spatially distributed as possible but also site access. Random number tables were used to 178
determine the direction and distance to the south west corner of the plot, ensuring random 179
selection of the plot within the broader site. GPS coordinates were recorded for each corner; 180
locations for each plot are in Supplementary information 1. 181
In each of the census plots, a 1 dm3 block of surface peat and an entire peat core from surface 182
to underlying grey marine clay were collected. The 10x10x10 cm peat blocks were measured 183
with a ruler and carefully cut and lifted from the peat using a household bread knife and 184
trowel, before sealing in large zipper storage bags. Peat cores were extracted using a side-185
filling Russian Peat Corer (Van Walt, UK) with a 50 cm long sampling chamber, allowing for 186
the recovery of deep, uncompressed peat cores. Peat depth was determined at every site, 187
recording the distance from the peat surface to the underlying clay layer. Immediately 188
following extraction, peat samples were divided into 10 cm segments in the field. Samples 189
were bagged and sealed to avoid moisture loss. 190
10
Surface peat volumetric water content was quantified at nine random locations within each 191
plot using a ML2X ThetaProbe Soil Moisture Sensor with HH2 Moisture Meter Readout Unit 192
(Delta-T Devices Ltd). Peat surface shear strength was gauged at the same nine locations 193
using a 33 mm Shear Vane. 194
Water table height was measured with a measuring tape, either from the peat surface to the 195
water surface if positive, or from the surface down to the water table depth using the borehole 196
left by the Russian Peat Corer if negative. 197
3.2.Laboratory analysis 198
3.2.1. Methods to determine peat chemical properties 199
For total carbon (C) and nitrogen (N) determination, peat samples were first oven dried at 105 200
°C for 48 hours and then ball milled for homogenisation using a Planetary Ball Mill (Retsch-201
PM400, Castleford, UK). Analysis of C and N concentrations in the peat samples was 202
performed using a total element analyzer (Thermo Flash EA 1112, CE Instruments, Wigan, 203
UK). 204
The degree of decomposition was quantified using two methods. First, the 10-point scale of 205
von Post (1922) was used to indicate peat structure by ranking the state of decay of organic 206
matter from H1, very fibrous with little humification, to H10, very few fibres with a high 207
humification degree. The higher the number in the von Post scale, the higher the degree of 208
humification (Huat et al., 2011; Verry et al., 2011; von Post, 1922). This was determined by 209
squeezing a small sample of field-wet peat and assessing the proportion of peat which 210
extruded through the fingers, the proportion left in the hand, and the colour and turbidity of 211
the free liquid (Verry et al., 2011). The proportions of each fraction that determine the H 212
value has been translated from von Post (1922) into English and can be found in Stanek and 213
Commented [SS2]: Data was used as a covariate to the shear strength data

11
Silc (1977). H values were assessed for the surface peat blocks and through the entire peat 214
spectroscopy was used to: (i) determine the organic composition of surface peat, and (ii) 215
assess if its organic chemistry was altered by land conversion by comparing the relative 216
abundance of carbohydrates and carboxyls compounds to the abundance of aromatics. 217
Specifically we calculated the 3340/1630 and 1710/1630 ratios, where the wavenumbers 218
correspond to carbohydrates (3340), carboxyls (1710) and aromatics (1630) (Cocozza et al., 219
2003; Artz et al., 2008),. these are subsequently denoted carbohydrates/aromatic ratio and 220
carboxyl/aromatic ratio, respectively. In this instance, the higher the ratio, the higher the 221
proportion of readily decomposable compounds to aromatics, and the lower the degree of 222
decomposition. 223
Spectra were obtained using a Bio-Rad FTX3000MX series FTIR (Digilab Div., Bio-Rad 224
Laboratories, Cambridge, MA) and a diffuse reflectance auto sampler attachment (Pike 225
Technologies Inc. Madison, WI), using a similar method to that described by Vane (2003). 226
Each acquisition measured wavenumbers 4000 to 400 cm-1 with 4 cm-1 spectral resolution 227
and 40 scans. Samples were rotated 90° before repeating the analysis, allowing elimination of 228
any variation due to an uneven surface. Sample spectra were referenced against a powdered 229
potassium bromide matrix at the same instrument settings to produce a background spectra; 230
which was used to eradicate the interference of carbon dioxide and water vapour in the air. 231
All spectra were baseline corrected and the peak heights specific to readily decomposable 232
organic compounds were divided by peak heights specific to recalcitrant aromatic compounds 233
to generate decomposition indexes. 234
Surface peat pH was determined by diluting 5 cm3 of field-wet peat in 12.5 cm3 of distilled 235
water in oakridge centrifuge tubes and leaving on a rotary shaker overnight, before measuring 236
with a pH 209 benchtop pH meter (Hanna Instruments Ltd.) and combination pH electrode. 237
12
3.2.2. Methods to determine peat physical properties 238
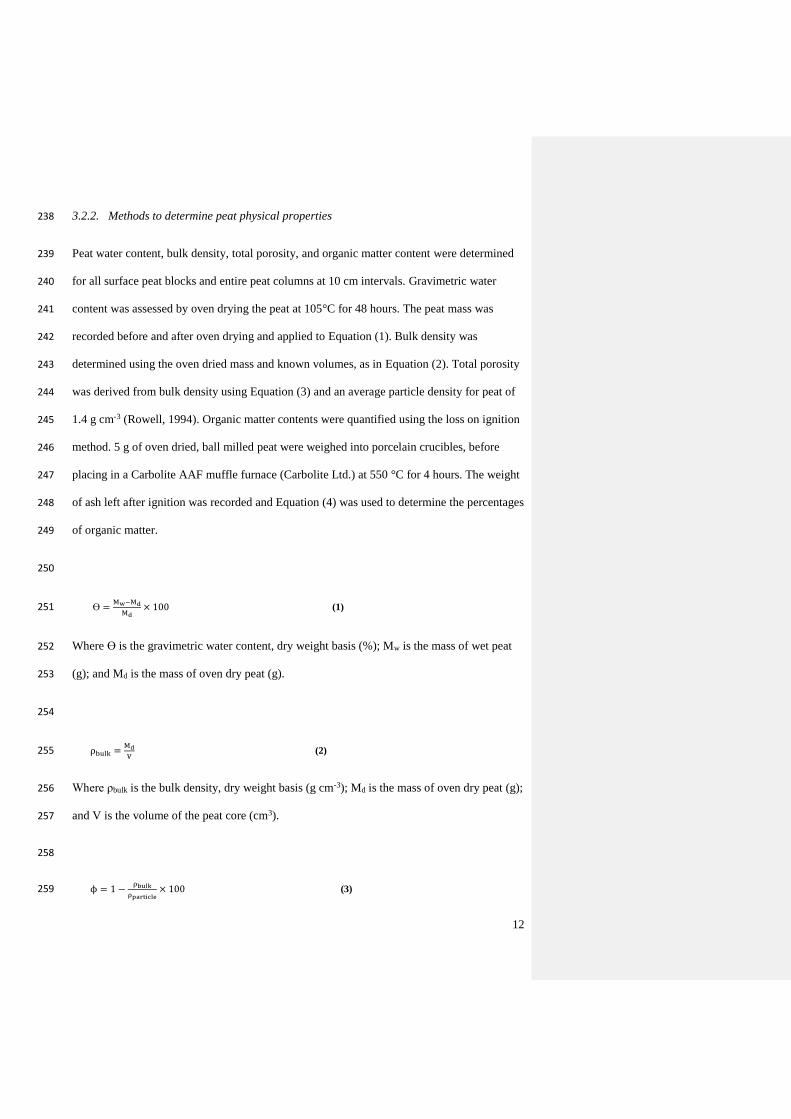
Peat water content, bulk density, total porosity, and organic matter content were determined 239
for all surface peat blocks and entire peat columns at 10 cm intervals. Gravimetric water 240
content was assessed by oven drying the peat at 105°C for 48 hours. The peat mass was 241
recorded before and after oven drying and applied to Equation (1). Bulk density was 242
determined using the oven dried mass and known volumes, as in Equation (2). Total porosity 243
was derived from bulk density using Equation (3) and an average particle density for peat of 244
1.4 g cm-3 (Rowell, 1994). Organic matter contents were quantified using the loss on ignition 245
method. 5 g of oven dried, ball milled peat were weighed into porcelain crucibles, before 246
placing in a Carbolite AAF muffle furnace (Carbolite Ltd.) at 550 °C for 4 hours. The weight 247
of ash left after ignition was recorded and Equation (4) was used to determine the percentages 248
of organic matter. 249
250
ϴ =Mw−Md
Md× 100 (1) 251
Where ϴ is the gravimetric water content, dry weight basis (%); Mw is the mass of wet peat 252
(g); and Md is the mass of oven dry peat (g). 253
254
ρbulk =Md
V (2) 255
Where ρbulk is the bulk density, dry weight basis (g cm-3); Md is the mass of oven dry peat (g); 256
and V is the volume of the peat core (cm3). 257
258
ϕ = 1 −ρbulk
ρparticle× 100 (3) 259
13
Where ϕ is the total porosity (%); ρbulk is the bulk density, dry weight basis (g cm-3); and 260
ρparticle is the particle density (g cm-3). 261
262
263
OM =M1−M2
M1× 100 (4) 264
Where OM is the organic matter content (%); M1 is the mass of oven-dry peat (g); and M2 is 265
the mass of ash left after ignition (g). 266
3.2.3 Estimating C stocks 267
We calculated C stocks at each site by predicting C concentration throughout the entire peat 268
profile using a transfer function between C content (which was analysed for 168 selected peat 269
samples) and LOI which was analysed for each 10 cm peat section. The C density in each 10 270
cm sample was then calculated using bulk density and summed over the entire peat profiles to 271
generate C stocks. Comparisons among land conversion stages were done using the stock 272
difference method (Hergoualc’h and Verchot 2011). 273
3.3.Statistical analysis 274
GenStat 17th edition statistical analysis software was used to evaluate all data generated from 275
this project. Shear strengths were analysed using linear mixed models with restricted 276
maximum likelihood (REML) to compare between land conversion classes by allowing the 277
incorporation of both fixed and random effects into the model accounting for environmental 278
variation between sites. Volumetric water content was added as a covariate when analysing 279
for differences between land conversion classes for shear strength as this variable accounted 280
for a high proportion of between-site variation. 281
14
One-way analysis of variance (ANOVA) was used to determine significant differences in the 282
3340carbohydrate/1630 aromatic and 1710carboxyl/1630 aromatic ratios among land 283
conversion class. Two way ANOVAs were used to analyse significant differences between 284
land conversion class, depth, and their interaction, allowing the incorporation of more than 285
one discrete variable into the model. Continuous profiles of data for von Post H values, 286
gravimetric water content, bulk density, porosity, ash and organic matter content with depth 287
were categorised into three distinct groups in order to run the two way ANOVA: surface peat, 288
peat just below the water table, and the deepest peat horizon within each core which was 289
above the clay layer (subsequently denoted “deep peat”), for the ANOVA three sub samples 290
from each layer from all cores were used.. 291
292
4. Results 293
4.1.Peat chemical properties 294
Peat pH values increased with conversion (F3,19 –=4.37, P < 0.05) specifically pH ranged 295
from 3.4 ± 0.06, 3.7 ± 0.06, 3.7 ± 0.08, to 3.97 ± 0.08 at forest sites, deeply drained sites, 296
recently planted and mature ooil palm sites, respectively rising to 3.7 to 4.1 at oil palm 297
plantations. 298
The peat C content did not differ significantly with either depth or among the land conversion 299
classes (Figure 2a) while the N content was highest in the surface peat and in the recently 300
drained forest area (Figure 2b). Consequently the C/N ratios were considerably higher in the 301
two deeper peat layers but did not differ overall among sites (Figure 2c). C, N and C/N ratios 302
through the individual peat profiles are shown in Supplementary information 3. 303

15
Surface peats (0-30 cm depth) from the oil palm plantations were more humified, i.e. had 304
3). Broad peaks were observed at approximately 3340 cm-1 which are associated with O–H 305
stretching of hydrogen in bonded O–H groups, specific to cellulose and other polysaccharides 306
(Vane, 2003). Two sharp peaks observed at 2920 and 2850 cm-1 were due to asymmetric and 307
symmetric C–H stretching of –CH2– groups from aliphatic compounds such as fats, waxes, 308
and lipids. Shoulders were observed at approximately 1710 cm-1 on the side of 1630 cm-1 309
peaks, associated with C=O stretching of –COOH or –COOR groups present in carboxyl 310
compounds. Broader peaks at 1630 cm-1 were assigned to aromatic C=C stretching and 311
asymmetric –COO– stretching of lignin and other aromatics. The distinct peak at 1510 cm-1 312
were assigned to aromatic C=C stretching vibrations in lignins (Vane, 2003). Three peaks of 313
similar height and width were observed at 1450, 1420, and 1370 cm-1, indicating O–H and C–314
H deformations in aliphatic and phenolic structures (Artz et al., 2008; Gandois et al., 2013; 315
Vane, 2003). 316
The decomposition indexes, i.e. the 3340/1630 (carbohydrate/aromatics) and 1710/1630 317
(carboxyl/aromatics) ratios, in the surface peat differed significantly between land conversion 318
classes (Figures 4a and 4b). Specifically, the 3340/1630 ratio were significantly higher in 319
forest and cleared sites (12.3±1.2 and 16.4±3.2 respectively), relative to drained and oil palm 320
sites (8.5±0.5 and 8.5±0.8), (F(3,16)=5.64, P=0.008, r2=0.51), indicating higher proportions of 321
aromatic structures relative to carbohydrates in drained and oil palm acrotelms (Figure 4a). 322
1710/1630 ratios were significantly higher in the surface peats of cleared sites (1.8±0.2), 323
relative to other sites with ratios between 1.0 and 1.1±0.1 (F(3,16)=5.62, P=0.008, r2=0.51), 324
which suggests higher proportions of carboxyl groups relative to aromatic compounds within 325
acrotelms at cleared sites (Figure 4b). 326
4.2 Peat depth and C stocks 327
16
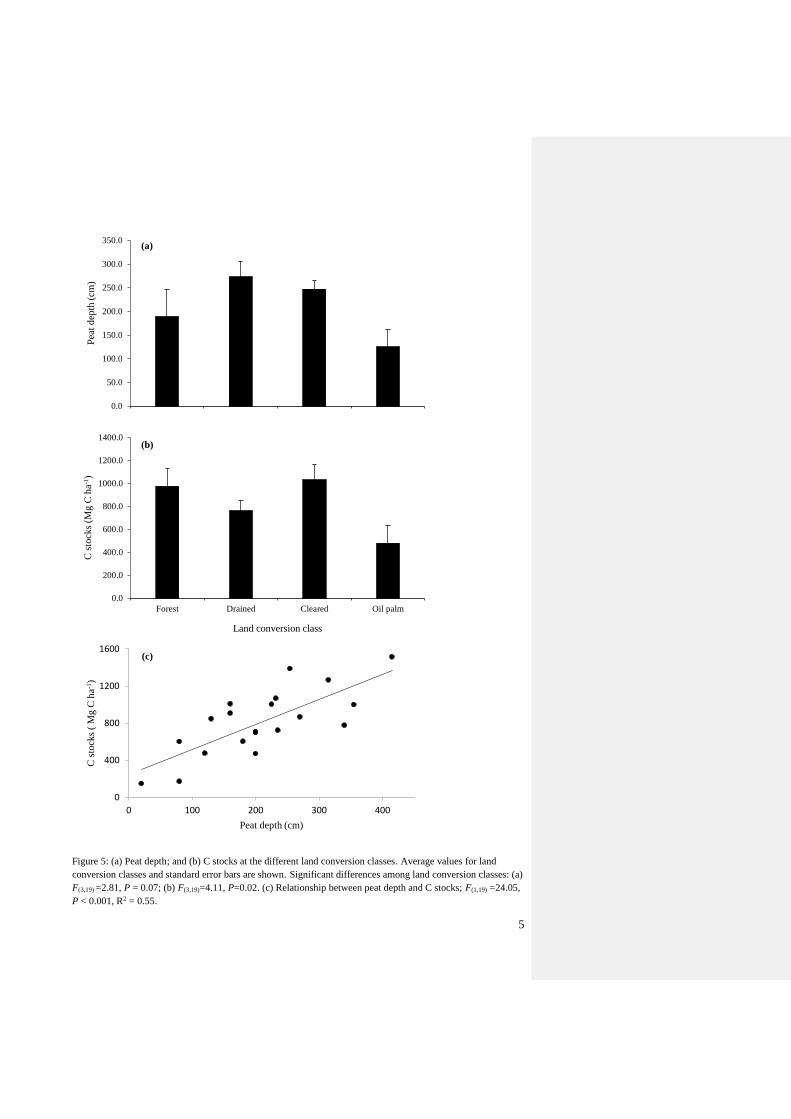
Peat depths ranged between 125 and 273 cm with the greatest accumulation of peat found at 328
the recently drained forest sites and the shallowest at the oil palm plantations (near significant 329
effect, Figure 5a). In contrast, C stocks were highest at the forest sites at ca. 1000 975 ± 151 330
Mg ha-1 and lowest at the oil palm sites at ca, 500 497 ± 157 Mg ha-1, which suggests oil 331
yield half the C stocks of those found at the forest sites (Figure 5b). Peat depth was a 332
reasonable predictor of C stocks (R2 = 0.55) (Figure 5c), however, the discrepancy between 333
peat depth and C stocks among the different land conversion classes shows that bulk density 334
and C concentrations impact the C stocks. 335
4.3 Peat physical properties 336
The position of the water table at the time the peat cores were collected was 6.0 ± 22, -14 ± 337
23, -39 ± 15, and -21 ± 18 cm at the forest, drained, cleared, and oil palm sites, respectively, 338
with positive values indicating the water surface being above the peat (F(3,44)=5.45, P<0.05). 339
The position of the water table was reflected in the volumetric surface moisture content 340
which was 82.3 ± 28, 46.3 ± 22, 33.3 ± 9, and 56.56 ± 21 % at the forest, drained, cleared, 341
and oil palm sites, respectively. Shear strength was significantly different among land 342
conversion classes (F(3,20) =3.49, P=0.035, SED=0.959 using volumetric water content as a 343
covariate), with higher values found at the oil palm plantations (9.7±0.6 kPa) than the other 344
land conversion classes (8.4±0.6, 6.8±0.9, and 7.8±0.6 kPa for forest, drained and recently 345
cleared sites, respectively). 346
Surface organic matter content was highest at forest sites (94.1±1.5%) and lowest in oil palm 347
plantations (77.3±5.9%) (Figure 6a). In line with the field measurements of volumetric soil 348
moisture content, fForest sites had significantly higher water content (627±90%) in the 349
surface layer than oil palm sites (440±42%) (Figure 6b; Supplementary information 54). Peat 350
at drained and cleared sites had higher moisture content below the water table, than at the 351

17
mature oil palm plantations. Bulk density was displayed the opposite trend with lowest at the 352
a bulk density of 0.07 g cm-3, , while surfaceand the other land conversion classes having 353
were slightly higher atbetween 0.10-0.12 g cm-3 for the other land conversion classes (Figure 354
oil palm plantations both at the surface and at the two deeper layers. 355
Surface porosity was high for all land-use classes with the highest porosity observed at 356
drained sites (95.2±0.4%) (Figure 6c6d). Porosity then dropped as land conversion 357
progressed to cleared and mature oil palm plantations across the peat profile. Bulk density 358
displayed the opposite trend with lowest surface bulk density of 0.07 g cm-3 at drained sites, 359
while surface bulk densities were slightly higher at 0.10-0.12 g cm-3 for the other land 360
conversion classes (Figure 6d). The peat then became denser at cleared and mature oil palm 361
plantations both at the surface and at the two deeper layers. 362
363
18
5. Discussion 364
5.1.Changes in peat organic chemistry, humification, and C stocks following land use 365
change 366
The higher carbohydrate/aromatic ratio3340/1630 ratio (Figure 4a) found in forest and 367
cleared surface layers suggests greater abundance of fresh litter inputs as a high ratio 368
indicates a relatively high proportion of cellulose to aromatic compounds, which is typical of 369
poorly decomposed peat (Cocozza et al., 2003). Although continual, natural levels of litter 370
inputs occurred both in forest and drained sites, only forest sites were observed to have the 371
high water tables capable of preserving the cellulose-rich organic matter. The lower 372
carbohydrate/aromatic 3340/1630 ratio at oil palm sites therefore indicates enhanced peat 373
decomposition at this site. The fact that the carbohydrate/aromatic3340/1630 ratio was 374
highest at the cleared site was unexpected. We speculate this is due to incorporation of 375
carbohydrate rich woody debris (observed during sampling), from the recent deforestation 376
into the top peat horizon during soil preparation (Andriesse, 1988). Indeed, the high 377
proportion of carboxyl structures relative to aromatics, indicated by the 378
1710/1630carboxyl/aromatic ratios in surface peat at cleared sites (Figure 4b), indicate 379
productions of carboxyls from the decomposition of recently deposited plant tissues in the 380
surface peat (Cocozza et al., 2003). 381
The higher degrees of humification (higher H values on the von Post scale, Figure 2d) and 382
lower organic matter contents (Figure 6a) in the drained surface layer at the drained, cleared 383
and oil palm sites provides further evidence that the conversion process stimulated 384
decomposition. However, the enhanced decomposition following drainage was only evident 385
when comparing forest to mature oil palm plantation, which suggests that C loss from 386
oxidative decay is controlled in part by exposure time to air, as well as being influenced by 387
fertiliser inputs, which also enhance decomposition (Wösten et al., 1997; Anshari et al., 388
19
2010; Corley et al., 2003). The greater degree of humification in surface peats relative to the 389
deeper peat layers of drained and cleared forest, and oil palm indicates loss of structure and 390
enhanced decomposition rates in surface peats (Figure 2d). This contrasts to the forested sites 391
with water tables close to or at the peat surface, where the greatest decomposition degree was 392
found in the deepest layers of peat (Kuhry and Vitt, 1996). 393
Although the H values were highest at the surface of the oil palm sites, the high degree of 394
decomposition (H values ranging from about 7 to 10) found throughout the entire forest peat 395
profiles (Appendix: Figure 1a) are intriguing as they contrast to studies of temperate and 396
boreal peatlands where surface peat tends to have much lower H values (Kuhry and Vitt, 397
1996; Frolking et al., 2001). The DRIFT spectra presented in Figure 3 display the majority of 398
peaks corresponding to temperate peatlands (Artz et al., 2008; Cocozza et al., 2003). 399
However, the latter usually show an additional broad peak between 1080 and 1030 cm-1 400
which is not prominent here. This peak is assigned to C–O stretching and O–H deformation 401
within polysaccharides (Artz et al., 2008) and its low intensity in all surface peats, including 402
forest sites, suggests rapid decomposition of polysaccharides in line with the high H values. 403
This could be due to impacts of historical logging activities prior to the 1980s or to vegetation 404
structure and litter inputs. Furthermore, peat swamp forests have both increased aeration 405
associated with large tree roots (Hoyos-Santillan et al., 2016), and an open pore structure 406
provided by the fibrous wood input (in contrast to the shallow rooted, less fibrous sphagnum 407
moss that dominates northern peatlands (Wüst et al., 2003)), which together may contribute 408
to aerobic microbial decay throughout the rhizosphere. The early decay of polysaccharides 409
observed here as compared to temperate peatlands may also be enhanced by the higher 410
ambient air temperatures in Malaysia. For example, fungal decay studies have shown that 411
aerobic oxidative degradation of polysaccharides by white and soft rot fungi (the most 412
vigorous of all wood-decay microbes) is optimal at temperatures between 20 to 40°C (Vane, 413
20
2003; Vane et al., 2001). Similarly, a study of carbon cycling in tropical mangroves showed 414
that arboreal termites cause extensive polysaccharide decay in leaf and wood litter due to 415
symbiotic bacteria; this suggests that in tropical environments, litter may undergo extensive 416
multi-phase (insectivorous and microbial) alteration prior to burial (Vane et al., 2011). 417
The forest C stocks were within the lower range of those reported from peat swamp forests in 418
The large reductions in peat depth, of up to 2 m after 25 years of oil palm cultivation on 419
drained peatland, demonstrated by Hooijer et al. (2012) further support the notion of dramatic 420
C losses due to peat oxidation following drainage. Although the original peat depths at the oil 421
palm sites are not known, peat depths in adjacent peatland areas (ca. 1-2 km away from the 422
oil palm sites) are ca. 4 m (unpublished data not included in this study, Sofie Sjogersten) 423
indicating that rapid peat subsidence and C losses have occurred during the establishment of 424
mature oil palm plantations. Importantly, C loss rates measured in our study were higher than 425
those reported for Central Kalimantan, Indonesia of 10.8 ± 3.5 Mg C ha−1 year−1 426
(Hergoualc’h and Verchot 2011) and the loss rates of 1400 Mg C ha-1 over 100 years 427
predicted by modelling studies by Kurinanto et al. (2015) indicating that substantial C loss 428
can occur quickly following conversion of peat swamp forests to oil palm plantations. Our 429
findings contrasts starkly to the minor changes in C stocks in mineral soil following 430
conversion of forest to oil palm plantation in Indonesia (53.63 ± 5.98 and 51.85 ± 18.95 Mg 431
C ha-1 in forest and oil palm plantations, respectively; Khasanah et al., 2015). Indeed, our 432
peatland study strongly refutes the concept of C neutral oil palm plantations, as suggested for 433
mineral soil systems by Khasanah et al. (2015). The large C losses from the peat shown in 434
our study, together with losses of the large tree biomass held in intact peat swamp forests 435
(ranging between 125 to 160 Mg C ha-1 assuming a 50% C content in the vegetation; 436
Kauffman et al., 2011; Kornseder et al., 2012; Toriyama et al., 2014; Schlund et al., 2015), is 437
nowhere near replaced by oil palm vegetation, which has an estimated life span above ground 438
Formatted: Font color: Accent 1

21
biomass of 30 ± 10 Mg C ha-1 (Germer and Sauerborn 2008). Indeed, this investigation points 439
The peat porosity and bulk density at forest sites were comparable to those found in tropical 440
peatlands in Malaysia and elsewhere. For example, Firdaus et al. (2010) found porosities and 441
bulk densities of 91.5±1.8% and 0.112±0.004 g cm-3, respectively, in forest surface peats. 442
Other tropical peat studies have found bulk densities ranging from 0.02 to 0.21 g cm-3, 443
correlating with this study (Page et al., 2004; Rieley and Page, 2008; Wösten et al., 2008; 444
Page et al., 2011). Decomposition decreases the proportion of coarse, hollow fibres in peat as 445
organic particle size and organic matter content (Figure 6a) is reduced with land conversion, 446
and is expected to form a dense, closed soil structure (Huat et al., 2011). In this study, 447
enhanced decomposition, potentially in combination with compaction from machinery, 448
following land conversion resulted in greater shear strength and lower soil moisture content 449
in the surface peat layer at oil palm sites. The lack of a linear response of bulk density and 450
porosityporosity and bulk density as land conversion progressed from intact peat swamp 451
forest, through forest drainage and clearance, to mature oil palm (Figures 6c and 6d), may be 452
linked to initial subsidence of the drained peat layers below the surface network of roots 453
resulting in high porosity and low bulk density. We speculate that the subsequent decreased 454
porosity and increased bulk density at the cleared and oil palm sites are due to the removal of 455
lignified root biomass during the ground preparation, together with greater decomposition 456
rates, resulting in denser peats over time (Huat et al., 2011; Quinton et al., 2000). It is also 457
worth noting that the gradual reduction in peat gravimetric moisture content and porosity 458
moving from drained to oil palm sites, is also evident below the water table, which may be 459
linked to peat subsidence following drainage (Wösten et al., 1997). 460
461
5.3 Variation in peat depth and C stocks among land conversion classes 462

22
The peat C stocks in the forest were within the lower range of those reported from peat 463
swamp forests in SE Asia (Warren et al., 2012; Comas et al., 2015; Farmer et al., 2014) and 464
the pan-tropics (Kauffman et al., 2011; Lähteenoja et al., 2012; Draper et al., 2014). The 465
comparatively low C stocks are due to the relatively shallow peat depths at the forest sites 466
around the edges of the peatlands (Figure 1). As peat depth in the central areas (not used in 467
this study) of the NSPSF are >4 m (GEC 2014), C stocks are therefore likely to be 468
substantially higher in the interior parts of the peatland than our estimates. We expected that 469
enhanced decomposition rates following conversion to oil palm plantations, would result in 470
peat subsidence and reduced C stocks compared to forest sites. This prediction was supported 471
by the shallower peat depths and C stocks found in oil palm plantations (51% reduction in C 472
stocks; Figure 5) compared to other land conversion classes. These findings suggests that 473
increased decomposition rates following drainage and establishment of mature oil palm 474
plantations have dramatically and rapidly reduced peat swamp forest C stocks. Large 475
reductions in C stocks are in line with Farmer et al. (2014) who found a 30% decrease in C 476
stock on oil palm as compared to intact peat swamp forest in Sumatra, Indonesia. 477
478
The large reductions in peat depth, of up to 2 m after 25 years of oil palm cultivation on 479
drained peatland, demonstrated by Hooijer et al. (2012) further support the notion of dramatic 480
C losses due to peat oxidation following drainage. Although the original peat depths at the oil 481
palm sites are not known, peat depths in adjacent peatland areas (ca. 1-2 km away from the 482
oil palm sites) are ca. 4 m (unpublished data not included in this study, Sofie Sjogersten) 483
indicating that rapid peat subsidence and C losses have occurred during the establishment of 484
mature oil palm plantations. Importantly, C loss rates measured in our study were higher than 485
those reported for Central Kalimantan, Indonesia of 10.8 ± 3.5 Mg C ha−1 year−1 486
(Hergoualc’h and Verchot 2011) and the loss rates of 1400 Mg C ha-1 over 100 years 487
Commented [SS4]: Check reference
23
predicted by modelling studies by Kurinanto et al. (2015) indicating that substantial C loss 488
can occur quickly following conversion of peat swamp forests to oil palm plantations. Our 489
findings contrasts starkly to the minor changes in C stocks in mineral soil following 490
conversion of forest to oil palm plantation in Indonesia (53.63 ± 5.98 and 51.85 ± 18.95 Mg 491
C ha-1 in forest and oil palm plantations, respectively; Khasanah et al., 2015). Indeed, our 492
peatland study strongly refutes the concept of C neutral oil palm plantations, as suggested for 493
mineral soil systems by Khasanah et al. (2015). The large C losses from the peat shown in 494
our study, together with losses of the large tree biomass held in intact peat swamp forests 495
(ranging between 125 to 160 Mg C ha-1 assuming a 50% C content in the vegetation; 496
Kauffman et al., 2011; Kornseder et al., 2012; Toriyama et al., 2014; Schlund et al., 2015), is 497
nowhere near replaced by oil palm vegetation, which has an estimated life span above ground 498
biomass of 30 ± 10 Mg C ha-1 (Germer and Sauerborn 2008). Indeed, this investigation points 499
towards a substantial C footprint of oil palm plantations on tropical peatlands. 500
501
These findings demonstrate that land conversion for oil palm plantations changed peat 502
physical properties over time through a combination of physical collapse of the peat structure 503
following drainage, and enhanced decomposition in the drained surface peats. It is likely that 504
such changes in peat physical properties are irreversible, particularly in the instance of 505
changes cause by enhanced decomposition. This has important implications for land 506
management policies, as some ecosystem services linked to the peat physical properties, e.g. 507
water holding capacity (Abdul Rahim & Yusop 1999), may be permanently, and negatively, 508
affected by land conversion for oil palm plantation. Indeed, peatland restoration, which is 509
currently implemented at degraded peatland sites across SE Asia (e.g. Jauhianen et al., 2008) 510
and specifically within this study catchment (GEC 2014), may recover the biodiversity, fire 511
regulation and C sink capacity of peatlands, however, this may not be the case for the water 512
24
regulation services as these closely link to peat organic matter content, structure, density and 513
porosity (Firdaus et al., 2010). 514
515
Acknowledgements 516
We thank the Royal Geographical Society (with IBG) for funding this project through the 517
Ralph Brown expedition award (to PA), with additional support from the University of 518
Nottingham. We are very grateful to the Selangor State Forestry Department for granting 519
forest reserve access and in providing field ranger support (including Mr Mohd Rosli B. Md 520
Kadim (Rosli), Mr Sabaruddin Mohd Shahid (Din) and the rest of the team at Raja Musa and 521
Sungai Karang Forestry Offices) as a follow-up to the 2013 Biodiversity Expedition 522
organised in association with Malaysia Nature Society; and also to staff at the Global 523
Environment Centre, Selangor, and especially Miss Hannah Cooper, for fieldwork assistance. 524
We also thank PKPS Agricultural Development Corporation for granting site access. We are 525
grateful to Mr James Verran, Mr Saul Vazquez Reina and Mr John Corrie for assistance in 526
the laboratory. CHV publishes with permission of the Executive Director, British Geological 527
Survey (NERC). 528
529
References 530
Abdul Rahim, N. & Yusop, Z., 1999. Hydrological impacts of forestry and land-use 531
activities: Malaysian and regional experience, 86-105. In: Water: forestry and land use 532
perspectives; Technical documents in hydrology; Vol.:70; 2004, Available at: 533
http://unesdoc.unesco.org/images/0013/001379/137954e.pdf [Accessed April 10, 2016] 534
25
Ahmad, N. (2014) Guardians of the North Selangor Peat Swamp Forest [online]. Peatlands 535
International, Issue 2.2014. Available at: 536
https://peatlandsinternational.wordpress.com/2014/06/20/peatlands-international-2-2014/> 537
[accessed 17 April 2015]. 538
Andriesse, J. (1988) Nature and management of tropical peat soils [online]. FAO Soils 539
Bulletin 59. FAO - Food and Agriculture Organization of the United Nations, Rome. 540
Available at: <http://www.fao.org/docrep/x5872e/x5872e00.htm#Contents> [Accessed 16 541
October 2014]. 542
Anshari, G., Afifudin, M., Nuriman, M., Gusmayanti, E., Arianie, L., Susana, R., Nusantara, 543
R., Sugardjito, J., and Rafiastanto, A. (2010) Drainage and land use impacts on changes in 544
selected peat properties and peat degradation in West Kalimantan Province, Indonesia. 545
Biogeosciences. Vol. 7, no. 11, pp. 3403-3419. 546
Artz, R., Chapman, S., Robertson, A., Potts, J., Laggoun-Défarge, F., Gogo, S., Comont, L., 547
Disnar, J., and Francez, A. (2008) FTIR spectroscopy can be used as a screening tool for 548
organic matter quality in regenerating cutover peatlands. Soil Biology and Biochemistry. 549
Vol. 40, no. 2, pp. 515-527. 550
Boelter, D. (1964) Water storage characteristics of several peats in situ. Soil Science Society 551
of America Journal. Vol. 28, no. 3, pp. 433-435. 552
Broder, T., Blodau, C., Biester, H., and Knorr, K. (2012) Peat decomposition records in three 553
pristine ombrotrophic bogs in southern Patagonia. Biogeosciences. Vol. 9, no. 4, pp. 1479-554
1491. 555
Corley, R. Hereward V., and Tinker, P. (2003) The Oil Palm. 4th edition. Blackwell Science 556
Ltd. 557
26
Cocozza, C., D'orazio, V., Miano, T., and Shotyk, W. (2003) Characterization of solid and 558
aqueous phases of a peat bog profile using molecular fluorescence spectroscopy, ESR and 559
FT-IR, and comparison with physical properties. Organic Geochemistry. Vol. 34, no. 1, pp. 560
49-60. 561
Douglas, I. (1996) The impact of land-use changes, especially logging, shifting cultivation, 562
mining and urbanization on sediment yields in humid tropical Southeast Asia: a review with 563
special reference to Borneo. IAHS Publications-Series of Proceedings and Reports-Intern 564
Assoc Hydrological Sciences. Vol. 236, pp. 463-472. 565
Firdaus, M., Gandaseca, S., Ahmed, O., and Majid, N. (2010) Effect of converting secondary 566
tropical peat swamp forest into oil palm plantation on selected peat soil physical 567
properties. American Journal of Environmental Sciences. Vol. 6, no. 4, pp. 402-405. 568
Frolking, S., Roulet, N., Moore, T., Richard, P., Lavoie, M., and Muller, S. (2001) Modeling 569
northern peatland decomposition and peat accumulation. Ecosystems. Vol. 4, no. 5, pp. 479-570
498. 571
Gandois, L., Cobb, A., Hei, I., Lim, L., Salim, K., and Harvey, C. (2013) Impact of 572
deforestation on solid and dissolved organic matter characteristics of tropical peat forests: 573
implications for carbon release. Biogeochemistry. Vol. 114, no. 1-3, pp. 183-199. 574
GEC (Global Environment Centre), 2014. Integrated Management Plan for North Selangor 575
Peat Swamp Forest 2014-2023 for Selangor State Forestry Department. , (June), p.183. 576
Haddaway, N., Burden, A., Evans, C., Healey, J., Jones, D., Dalrymple, S., and Pullin, A. 577
(2014) Evaluating effects of land management on greenhouse gas fluxes and carbon balances 578
in boreo-temperate lowland peatland systems. Environmental Evidence. Vol. 3, no. 1, pp. 5. 579
27
Hahn-Schilling, B. (1994) Struktur, sukzessionale Entwicklung und Bewirkschaftung selektiv 580
genuzter Moorwälder in Malaysia. Göttinger beiträge zur land- und forstwirtschaft in den 581
tropen und subtropen, Heft 94. Dissertation. Verlag Erich Goltze GmbH & Co. KG, 582
Göttingen. 583
Holden, J., Chapman, P., and Labadz, J. (2004) Artificial drainage of peatlands: hydrological 584
and hydrochemical process and wetland restoration. Progress in Physical Geography. Vol. 585
28, no. 1, pp. 95-123. 586
Huat, B., Kazemian, S., Prasad, A., and Barghchi, M. (2011) State of an art review of peat: 587
General perspective. International Journal of the Physical Sciences. Vol. 6, no. 8, pp. 1988-588
1996. 589
Jauhiainen, J., Takahashi, H., Heikkinen, J., Martikainen, P., and Vasander, H. (2005) Carbon 590
fluxes from a tropical peat swamp forest floor. Global Change Biology. Vol. 11, no. 10, pp. 591
1788-1797. 592
Jauhiainen, J., Limin, S., Silvennoinen, H., and Vasander, H. (2008) Carbon dioxide and 593
methane fluxes in drained tropical peat before and after hydrological restoration. Ecology. 594
Vol. 89, no. 12, pp. 3503-3514. 595
Keddy, P., Fraser, L., Solomeshch, A., Junk, W., Campbell, D., Arroyo, M., and Alho, C. 596
(2009) Wet and wonderful: the world's largest wetlands are conservation priorities. 597
BioScience. Vol. 59, no. 1, pp. 39-51. 598
599
Koh, L.P., Miettinen, J., Liew, S.C., Ghazoul, J. (2011) Remotely sensed evidence of tropical 600
peatland conversion to oil palm. Proceedings of the National Academy of Sciences of the 601
United States of America, 108(12), pp.5127–32. Available at: 602

28
http://www.pubmedcentral.nih.gov/articlerender.fcgi?artid=3064377&tool=pmcentrez&rende603
rtype=abstract [Accessed April 6, 2016]. 604
Kuhry, P., and Vitt, D. (1996) Fossil carbon/nitrogen ratios as a measure of peat 605
decomposition. Ecology. Vol. 77, no. 1, pp. 271-275. 606
Kumari, K. 1996. An application of the incremental cost framework to biodiversity 607
conservation: a wetland case study in Malaysia. Centre for Social and Economic Research on 608
the Global Environmental, 96-15. 609
Page, S., Siegert, F., Rieley, J., Böhm, H., Jaya, A., Limin, S. (2002) The amount of carbon 610
released from peat and forest fires in Indonesia in 1997. Nature. Vol. 420, no. 6911, pp. 61–611
65. 612
Page, S., Wüst, R., Weiss, D., Rieley, J., Shotyk, W., and Limin, S. (2004) A record of Late 613
Pleistocene and Holocene Carbon accumulation and climate change from an equatorial peat 614
bog (Kalimantan, Indonesia): Implications for past, present and future carbon dynamics. 615
Journal of Quaternary Science. Vol. 19, no. 7, pp. 625–636. 616
Page, S., Rieley, J., and Wüst, R. (2006) Lowland tropical peatlands of Southeast Asia. In: 617
Martini, P., Martinez-Cortizas, A., and Chesworth, W. (editors), Peatlands: basin evolution 618
and depository of records on global environmental and climatic changes. Amsterdam 619
(Developments in Earth Surface Processes Series): Elsevier. pp. 145–72. 620
Posa, M., Wijedasa, L.S. and Corlett, R.T., 2011. Biodiversity and Conservation of Tropical 621
Peat Swamp Forests. BioScience, 61(49), pp.49–57. 622
Price, J., and Schlotzhauer, S. (1999) Importance of shrinkage and compression in 623
determining water storage changes in peat: the case of a mined peatland. Hydrological 624
Processes. Vol. 13, no. 16, pp. 2591-2601. 625
29
Quinton, W., Gray, D., and Marsh, P. (2000) Subsurface drainage from hummock-covered 626
hillslopes in the Arctic tundra. Journal of Hydrology. Vol. 237, no. 1, pp. 113-125. 627
Rieley, J. and Page, S. (2008) Master Plan for the Rehabilitation and Revitalisation of the 628
Ex-Mega Rice Project Area in Central Kalimantan [online]. CARBOPEAT Technical 629
Review No. 1. The Science of Tropical Peatlands and the Central Kalimantan Peatland 630
Development Area. Euroconsult Mott MacDonald/Defltares/Delft Hydraulics. Available at: 631
<http://www.geog.le.ac.uk/carbopeat/media/pdf/pub_technical_review%201-science. pdf> 632
[Accessed 30 April 2015]. 633
Rowell, D. (1994) The arrangement of particles and pores: soil structure. In: Rowell, D. 634
(editor), Soil Science: Methods and Applications. Essex, England, Longman Scientific and 635
Technical, pp. 61. 636
Sim, L., and Balamurugam, G. (1990) Hydrological functions. In: Prentice, C. (editor), 637
Environmental action plan for the North Selangor peat swamp forest. AWB Publication, 638
Asian Wetland Bureau/WWF—Malaysia. 639
Stanek, W., and Silc, T. (1977) Comparisons of four methods for determination of degree of 640
peat humification (decomposition) with emphasis on the von Post method. Canadian Journal 641
of Soil Science. Vol. 57, no. 2, pp. 109-117. 642
Tipping, E., Smith, E., Lawlor, A., Hughes, S., and Stevens, P. (2003) Predicting the release 643
of metals from ombrotrophic peat due to drought-induced acidification. Environmental 644
Pollution. Vol. 123, no. 2, pp. 239-253. 645
Vane, C. (2003a) Monitoring decay of black gum wood (Nyssa sylvatica) during growth of 646
the shiitake mushroom (Lentinula edodes) using diffuse reflectance infrared 647
spectroscopy. Applied spectroscopy. Vol. 57, no. 5, pp. 514-517. 648

30
Vane, C. ( 2003b). The molecular composition of lignin in spruce decayed by white-rot fungi 649
(Phanerochaete chrysosporium and Trametes versicolor) using Pyrolysis–GC-MS and 650
Thermochemolysis with Tetramethylammonium Hydroxide. International Biodeterioration 651
and Biodegradation. Vol. 51, no 1, pp. 67-75. 652
Vane, C., Martin, S., Snape, C., Abbott, G.D. (2001) Degradation of lignin in wheat straw 653
during growth of the Oyster mushroom (Pleurotus ostreatus) using off-line 654
thermochemolysis with tetramethylammonium hydroxide and solid state 13C NMR. Journal 655
of Agriculture and Food Chemistry. Vol. 49, pp. 2709-2716. 656
Vane, C.H., Kim, A.W., Moss-Hayes V, Snape C.E, Castro-Diaz, M., Khan, N.S., Engelhart 657
S.E. and Horton, B.P. 2013. Mangrove tissue decay by arboreal termites (Nasutitermes 658
acajutlae) and their role in the mangrove C cycle (Puerto Rico): Chemical characterisation 659
and organic matter provenance using bulk δ13C, C/N, alkaline CuO oxidation-GC/MS and 660
solid-state 13C NMR. Geochemsistry, Geophysics, Geosystems Vol. 14, no 8, pp. 3176-3191. 661
Verry, E., Boelter, D., Päivänen, J., Nichols, D., Malterer, T., and Gafni, A. (2011) Physical 662
Properties of Organic Soils. In: Kolka, R., Sebestyen, S., Verry, E., and Brooks, K. (editors), 663
Peatland Biogeochemistry and Watershed Hydrology at the Marcell Experimantal Forest. 664
United States of America, CRC Press: Taylor and Francis Group, pp. 136 -137. 665
von Post, L. (1922) Sveriges Geologiska Undersöknings torvinventering och några av dess 666
hittills vunna resultat. Svenska Mosskulturföreningens, Tidskrift. Vol. 1, pp. 1-27. 667
Wetlands International (2014) Tropical Peat Swamp Forests [online]. Wetlands International, 668
Netherlands. Available at: 669
<http://www.wetlands.org/Whatarewetlands/Peatlands/Tropicalpeatswampforests/tabid/2739/670
Default.aspx> [Accessed 02 November 2014]. 671

31
Wösten, J., Ismail, A., and Van Wijk, A. (1997) Peat subsidence and its practical 672
implications: a case study in Malaysia. Geoderma. Vol. 78, no. 1-2, pp. 25-36. 673
Wösten, J., Clymans, E., Page, S., Rieley, J., and Limin, S. (2008) Peat–water 674
interrelationships in a tropical peatland ecosystem in Southeast Asia. Catena. Vol. 73, no. 2, 675
pp. 212-224. 676
Wüst, R., Bustin, R., and Lavkulich, L. (2003) New classification systems for tropical 677
organic-rich deposits based on studies of the Tasek Bera Basin, Malaysia. Catena. Vol. 53, 678
no, 2, pp.133-163. 679
Yonebayashi, K., Pechayapisit, J., Vijarnsorn, P., Zahari, A., and Kyuma, K. (1994) 680
Chemical alterations of tropical peat soils determined by Waksman's proximate analysis and 681
properties of humic acids. Soil Science and Plant Nutrition. Vol. 40, no. 3, pp. 435-444. 682
Yule, C., and Gomez, L. (2009) Leaf litter decomposition in a tropical peat swamp forest in 683
Peninsular Malaysia. Wetlands Ecology and Management. Vol. 17, no. 3, pp. 231-241. 684
Yusop, Z. (2002) Hydrological attributes of a disturbed peat swamp forest. In: Parish, F., 685
Padmanabhan, E., Lee, C., and Thang, H. (editors), Prevention and control of fire in 686
peatlands. Proceedings of workshop on prevention and control of fire in peatlands, 19–21 687
March 2002, Kuala Lumpur. Global Environment Centre and Forestry Department Peninsular 688
Malaysia. Cetaktama, Kuala Lumpur, pp. 51–56. 689
Zhang, R. (1997) Determination of soil sorptivity and hydraulic conductivity from the disk 690
infiltrometer. Soil Science Society of America Journal. Vol. 61, no. 4, pp. 1024-1030. 691
692
32
Figures 693
694
695
Figure 1: Location of North Selangor Peat Swamp Forest and field plots. 696
697
698
699
700
701
702
703
704
705
706
707

33
708
709
710
711
Figure 2: The difference in (a) carbon content; (b) nitrogen content; and (c) C/N ratio between secondary peat, 712
and (d) degree of decomposition indicated by the H-value among secondary peat swamp forests, drained peat 713
swamp forests, cleared peat swamp forests, and mature oil palm plantations at three different depths within the 714
peat profiles: surface peat (black bar); below the water table (dark grey bar); and deep peat (light grey bar). 715
Average values for land conversion classes and standard error bars are shown. 716
(a) Land conversion class: F(3,44)=1.97, P=0.133; Depth: F(2,44)=2.26, P=0.116; Interaction: F(6,44)=0.84, P=0.544 717
(b) Land conversion class: F(3,44)=3.25, P=0.031; Depth: F(2,44)=28.21, P<0.001; Interaction: F(6,44)=1.61, 718
P=0.166 719
(c) Land conversion class: F(3,44)=1.80, P=0.16; Depth: F(2,44)=47.17, P<0.001; Interaction: F(6,44)=3.25, P=0.01 720
721
0
100
200
300
400
500
600
Forest Drained Cleared Oil palm
Car
bon
con
ten
t (m
g g
-1)
Land conversion class
0
2
4
6
8
10
12
14
16
18
20
Forest Drained Cleared Oil palm
Nit
rogen
con
ten
t (m
g g
-1)
Land conversion class
Surface peat
Below water table
Deep peat
0
10
20
30
40
50
60
70
Forest Drained Cleared Oil palm
C/N
rat
io
Land conversion class
(a) (b)
(c)
3
4
5
6
7
8
9
10
Forest Drained Cleared Oil palm
von
Post
H v
alu
e
Land conversion class

34
(d) Land conversion class: F(3,269)=56.77, P<0.001; Depths: F(2,269)=92.87, P<0.001; Interaction: F(6,269)=12.08, 722
P<0.001 723

5
Figure3: DRIFT spectra of the average surface peat samples from 0-10 cm for: secondary peat swamp forests (black line), drained peat swamp forests (black dashed line),
cleared peat swamp forests (grey line), and mature oil palm plantations (grey dashed line). Vertical black lines indicate the peaks at wavenumbers 3340, 1710, and 1630 cm-1
of which significantly different ratios were found between land conversion classes, and vertical grey lines indicate the peaks at wavenumbers 2920, 2850, 1510, 1450, 1420,
and 1370 cm-1 common to tropical peats.
0.0
0.2
0.4
0.6
0.8
1.0
1.2
1.4
1.6
1.8
2.0
05001000150020002500300035004000
Abso
rban
ce
Wavenumber (cm-1)
Forest
Drained
Cleared
Oil palm

4
Figure 4: The difference in (a) 3340/1630 ratio or carbohydrate/aromatic ratio i.e. 3340/1630 ratio or; and (b)
1710/1630 or carboxyl/aromatic ratio i.e. 1710/1630 ratio between among secondary peat swamp forests, drained
peat swamp forests, cleared peat swamp forests, and mature oil palm plantations in surface peat. Average values
for land conversion classes and standard error bars are shown: (a) F(3,16)=5.64, P=0.008; (b) F(3,16)=5.62, P=0.008.
0
5
10
15
20
25
Forest Drained Cleared Oil palm
Car
boh
yd
rate
/aro
mat
ic r
atio
Land conversion class
0.0
0.5
1.0
1.5
2.0
2.5
Forest Drained Cleared Oil palm
Car
box
yl/
arom
atic
rat
io
Land conversion class
(a) (b)
5
Figure 5: (a) Peat depth; and (b) C stocks at the different land conversion classes. Average values for land
conversion classes and standard error bars are shown. Significant differences among land conversion classes: (a)
F(3,19) =2.81, P = 0.07; (b) F(3,19)=4.11, P=0.02. (c) Relationship between peat depth and C stocks; F(1,19) =24.05,
P < 0.001, R2 = 0.55.
0.0
50.0
100.0
150.0
200.0
250.0
300.0
350.0
Forest Drained Cleared Oil palm
Pea
t d
epth
(cm
)
Land conversion class
0.0
200.0
400.0
600.0
800.0
1000.0
1200.0
1400.0
Forest Drained Cleared Oil palm
C s
tock
s (M
g C
ha-1
)
Land conversion class
0
400
800
1200
1600
0 100 200 300 400
C s
tock
s (
Mg C
ha-1
)
Peat depth (cm)
(a)
(b)
(c)
6
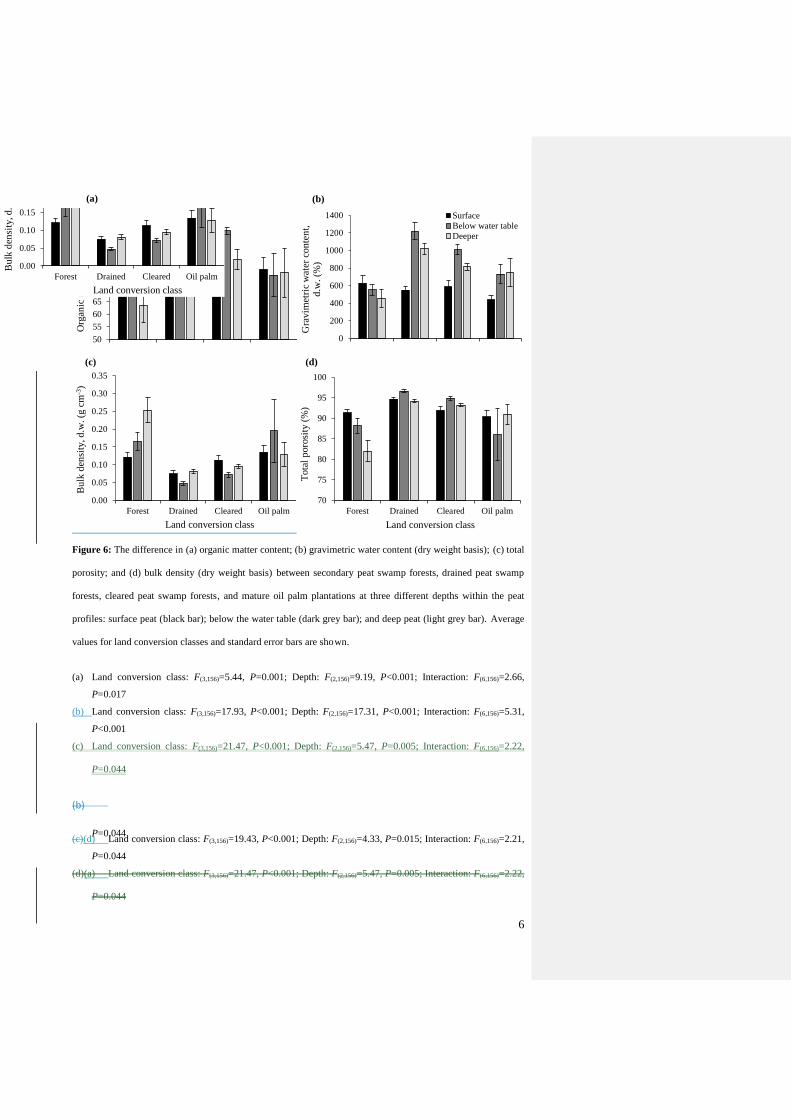
Figure 6: The difference in (a) organic matter content; (b) gravimetric water content (dry weight basis); (c) total
porosity; and (d) bulk density (dry weight basis) between secondary peat swamp forests, drained peat swamp
forests, cleared peat swamp forests, and mature oil palm plantations at three different depths within the peat
profiles: surface peat (black bar); below the water table (dark grey bar); and deep peat (light grey bar). Average
values for land conversion classes and standard error bars are shown.
(a) Land conversion class: F(3,156)=5.44, P=0.001; Depth: F(2,156)=9.19, P<0.001; Interaction: F(6,156)=2.66,
P=0.017
(b) Land conversion class: F(3,156)=17.93, P<0.001; Depth: F(2,156)=17.31, P<0.001; Interaction: F(6,156)=5.31,
P<0.001
(c) Land conversion class: F(3,156)=21.47, P<0.001; Depth: F(2,156)=5.47, P=0.005; Interaction: F(6,156)=2.22,
P=0.044
(b)
P=0.044 (c)(d) Land conversion class: F(3,156)=19.43, P<0.001; Depth: F(2,156)=4.33, P=0.015; Interaction: F(6,156)=2.21,
P=0.044
(d)(a) Land conversion class: F(3,156)=21.47, P<0.001; Depth: F(2,156)=5.47, P=0.005; Interaction: F(6,156)=2.22,
P=0.044
50
55
60
65
70
75
80
85
90
95
100
Forest Drained Cleared Oil palm
Org
anic
mat
ter
con
ten
t (%
)
Land conversion class
0
200
400
600
800
1000
1200
1400
Forest Drained Cleared Oil palm
Gra
vim
etri
c w
ater
con
ten
t,
d.w
. (%
)
Land conversion class
Surface
Below water table
Deeper
0.00
0.05
0.10
0.15
0.20
0.25
0.30
0.35
Forest Drained Cleared Oil palm
Bu
lk d
ensi
ty, d
.w. (g
cm
-3)
Land conversion class
70
75
80
85
90
95
100
Forest Drained Cleared Oil palm
Tota
l p
oro
sity
(%
)
Land conversion class
0.00
0.05
0.10
0.15
0.20
0.25
0.30
0.35
Forest Drained Cleared Oil palm
Bu
lk d
ensi
ty, d
.w. (g
cm
-3)
Land conversion class
(a) (b)
(c) (d)

7