© 2011 melinda tonks hoffman
TRANSCRIPT

© 2011 Melinda Tonks Hoffman
BIDIRECTIONAL CARGO TRANSPORT BY MICROTUBULE-BASED MOLECULAR
MOTORS
BY
MELINDA TONKS HOFFMAN
DISSERTATION
Submitted in partial fulfillment of the requirements
for the degree of Doctor of Philosophy in Physics
in the Graduate College of the
University of Illinois at Urbana-Champaign, 2011
Urbana, Illinois
Doctoral Committee:
Assistant Professor Yann Chemla, Chair
Professor Paul Selvin, Director of Research
Assistant Professor Aleksei Aksimentiev
Professor Russell Gianetta

ii
Abstract
We have reconstituted a simple in vitro system using only mammalian dynein and mammalian
kinesin attached to a single cargo. These cargoes undergo saltatory motion typically seen in vivo,
indicating that the motors engage in a tug-of-war. When the complex hits a barrier, the cargo
often reverses direction. In some cases, it tries several up-and-back motions, during which time
the dynein likely pulls the cargo onto a different protofilament, and is sometimes able to bypass
the blockage. This explains why eliminating kinesin or dynein stops motion in both directions in
vivo. We also find that mammalian dynein, but not kinesin, often takes backwards steps when
under backward force. However, yeast dynein coupled with mammalian kinesin does not display
these attributes, as expected.

iii
Acknowledgements
To Kevin, for hundreds of 100 mile trips to and from Purdue so that I could stay here and get a
Ph.D, not to mention all the love and support and doing of dishes.
And to my dad, for teaching me to love learning and for informing me how silly it was to think I
could be successful in graduate school without knowing how to program first.
To my mom, for her infinite depth of love and constant support.
And to my unborn child, for lighting a fire of urgency under my feet.
iv
Contents Chapter 1: Introduction and Background ........................................................................................ 1
Chapter 2: Materials and Methods ................................................................................................ 26
Chapter 3: Results ......................................................................................................................... 42
Chapter 4: Discussion ................................................................................................................... 53
Chapter 5: Conclusions ................................................................................................................. 55
Figures........................................................................................................................................... 57
References ..................................................................................................................................... 88
Appendix: Details of Analysis Program ....................................................................................... 94

Chapter 1: Introduction and Background
Section 1.1 Overview
All cells have the need to transport various cargoes from one place inside the cell to
another. In the small and simple prokaryotic cell, this is accomplished by means of
simple diffusion. Proteins or other cell components are created in one location and are
allowed to simply disperse by random diffusion until they reach their intended
destination. The timescale required for this to occur can be estimated by using the mean
square displacement for 3D diffusion: <x2>=6Dt. The diffusion coefficient (D) has been
measured for a small protein in a bacterial cell to be ~6 µm2/sec(1, 2). For a cell of about
2 µm in size, the time to diffuse this distance would be ~120 msec, which is on the order
of the response time for bacteria to external stimuli(1).
However, eukaryotic cells are not only vastly more complex than prokaryotic cells, but
are much larger in size—on the order of 10-100 µm as compared to the prokaryote’s ~1-5
µm (see Figure 1). In the larger, complex, and crowded eukaryotic cell, this increased
distance between and complexity of various organelles within the cell means that
diffusion simply takes too long to transverse the cell’s volume. For example, if we
assume a 50 µm diameter cell and a diffusion coefficient of 6 µm2/sec, the time scale for
a particle to diffuse this distance is ~70 seconds. This is far greater than the timescale
necessary for the cell to perform its functions and respond to stimuli. The actual time
required could even be far greater than this, in fact, as the diffusion coefficient inside the
more crowded and complex eukaryotic cell would likely be lower than that predicted for
a less crowded environment. In addition, the complex organization of the eukaryotic cell
2
organelles requires a more specific and directed approach to intracellular transport.
Therefore, eukaryotic cells require a different mechanism by which to transport proteins
and other cargoes from one place to another within the cell.
Molecular motors fulfill this capacity within eukaryotic cells. Molecular motors are a
type of protein that can bind to a cargo and carry that cargo along as they ―walk‖ from
one point to another along certain ―roadways‖ found within the cell. There are three
main types of roadways found in cells, each of which is a part of the cell’s structural
cytoskeleton: actin, intermediate filaments, and microtubules. Figure 2 illustrates one of
these three cytoskeleton components—the microtubule network. The image shows a cell
with microtubules stained in green and the nucleus stained in blue.
On the microtubule network, there are two main types of motors which carry cargo:
kinesin and dynein. In general, kinesin carries cargos from the nucleus to the outside of
the cell (the + direction), while dynein carries cargos primarily from the cell membrane
back into the nucleus (the – direction). Disruptions in organelle transport due to impaired
motor function can cause great harm to the cell and contribute to neuronal disorders such
as human peripheral neuropathy and Alzheimer’s disease(3).
Transporting a cargo to a desired location within the cell may seem a simple problem of
attaching the appropriate motor and allowing it to walk in the motor’s preferred direction
until it reaches its destination. However, in living cells, both kinesin and dynein are
attached to the same cargo, and these cargos are observed to constantly switch directions,

3
moving successively in the + and – directions with numerous pauses and direction
reversals—a phenomenon known as saltatory motion. It is as yet unknown whether there
is some external signal that mediates the cooperation of dynein and kinesin (turning one
off and the other on such that both are not simultaneously pulling on the cargo), or if the
mechanism governing saltatory motion is a simple tug-of-war between the two motors.
The main objective of this dissertation will be to answer this question and to examine the
interaction between dynein and kinesin attached to a single cargo.
Section 1.2 Microtubules
Microtubules are part of the cell’s cytoskeleton, providing not only structural support but
a roadway for molecular motors to walk upon. Microtubules have a structure like that of
long ―ropes‖ of about 25 nm in width and up to 25 µm in length, and are composed of
bundles of protofilament ―threads,‖ generally with 13 protofilments per microtubule (see
Figure 3). Each protofilament is in turn made up of polymerized tubulin subunits. The
tubulin subunit is a dimer made up of an alpha subunit and a beta subunit. The
protofilaments bundle together to form a hollow cylindrical unit with a helical pitch of
approximately 13 tubulin dimers. The subunits are oriented in such a way that the
microtubule has a distinct polarity, with a ―+‖ end (which has the alpha subunit exposed)
and a ―-― end (which has the beta subunit exposed). Microtubules are highly dynamic
inside a living cell, continually polymerizing and depolymerizing. The + end is the main
site at which monomers are added as the microtubule polymerizes. In addition,
microtubules are generally oriented radially outward from the center of the cell, with the
+ end pointing towards cell periphery, and the – end near the nucleus.

4
In the cell, microtubules have many different types of protein bound to them in addition
to motor proteins. Various microtubule associated proteins (MAPs) bind to particular
parts of the tubulin monomer and can greatly influence both microtubule dynamics and
motor motility. The tau protein is one such MAP, which is particularly important in
microtubule stabilization. Defective tau proteins can lead to diseases such as
Alzheimer’s(4). Tau has also been shown to interfere with the motility of both kinesin
and dynein, although kinesin is much more affected by tau interactions(5, 6). Tau has six
different isoforms, depending on how the exons are spliced during DNA transcription.
The longest isoform is known as 4RL, while the shortest is known as 3RS. The 3RS tau
isoform has been shown to affect kinesin motility much more drastically than the 4RL
isoform(5). Varying the tau concentration or type of isoform bound to microtubules
could be one important way that motor transport of kinesin and dynein is regulated in the
cell.
Section 1.3 Kinesin
Kinesin is a relatively simple and well-understood motor protein. Discovered in 1985,
kinesin is a ~360,000 Dalton heterotetramer made up of two identical heavy chains of
~960 amino acids, and two identical light chains (see Figure 4). The heavy chains are the
most important for motor function, and include the motor domain ―head‖ made up of
~340 amino acids, which also is the site of ATP hydrolysis. The two light chains are
involved with regulation and the binding of kinesin to cargo.

5
Each kinesin heavy chain is composed of an amino-terminal globular head region which
binds to microtubules and hydrolizes ATP as kinesin takes a step, followed by a long
alpha helical region which enables dimerization with the other identical heavy chain
through the formation of a coiled-coil structure. The coiled-coil region is followed by a
carboxy-terminal tail domain, which is the area that binds to cargo.
The coiled-coil region of the heavy chain is interrupted by two flexible hinge regions.
When not bound to a cargo, kinesin becomes inactive by folding over at these two hinge
regions, preventing ATP hydrolysis as the tail domain comes into contact with the motor
domains.
A functionally processive kinesin construct can be created by truncating the heavy chain,
leaving only about the first 400 amino acids(7). This region includes the ―head‖ and only
a short coiled-coil region, but can walk and generate force similar to full-length kinesin.
The other parts of the kinesin heavy chain and the light chain are important for regulation
and cargo binding but are not essential for motility.
Kinesin walks along a microtubule as the microtubule binding domains (or ―head‖
regions) bind and unbind from alpha-tubulin subunits along the track. Kinesin walks in
hand-over-hand motion(8), meaning that the leading head and trailing head pass each
other with each step. Kinesin is known to take 8 nm steps(9) and to hydrolyze a single
ATP molecule per step(10-12). The state of the ATP nucleotide bound to the head
determines the head’s affinity for binding to the microtubule.

6
Kinesin is extremely processive; a single kinesin motor can take ~100 steps before
dissociating from the microtubule. To achieve this processivity, the two heads must
coordinate their stepping to prevent both releasing the microtubule simultaneously (and
thereby causing the kinesin to fall off the microtubule). There is evidence to suggest that
the two heads are ―gated‖ by intramolecular strain(13-16). When the trailing head
releases from the microtubule, it creates a strain on the leading head that prevents it from
binding ATP, thus ensuring that it remains firmly bound to the microtubule until the other
head is also safely attached.
A model for the stepping cycle of kinesin goes as follows(17): ATP binding to the
leading head causes a conformational change in the neck linker region (the region
bridging the head and tail regions of the heavy chain) that generates a ―power stroke,‖
followed by a biased diffusional search of the trailing, ADP-bound head to the next
binding site on the microtubule. ADP is then released, and the new front head binds
tightly to the microtubule. This causes internal strain which prevents ATP from binding
to the front head until the rear head has hydrolyzed its ATP and the phosphate is released,
leaving the rear head bound with ADP. The affinity for microtubules is weak in the
ADP bound state, so the rear head dissociates, relieving strain and allowing the leading
head to bind ATP. This starts the cycle over again, with the two heads having exchanged
positions, and allowing the kinesin to walk in a hand-over-hand fashion.

7
The kinesin motor almost always steps towards the + end of the microtubule. As it does
so, kinesin walks along a single protofilament within the microtubule(18). A very
processive and robust motor, a single kinesin has an average run length of approximately
1 µm and moves at an average velocity of about 600-800 nm/sec(19). It can pull with a
force of up to 5-7 pN(20, 21), after which the motor stalls and ceases to take forward
steps. Kinesin has been shown to take occasional back steps under high forces(21,
22)(21)
{{59 Meyhofer,E. 1995}}, although this is rare—in general kinesin is an extremely
processive plus-directed motor.
The kinesin superfamily of proteins actually encompasses several different specific motor
proteins, each involved with a different motility-based task within the cell. Fifteen
different families of kinesin have been discovered. Kinesin-1 is known as conventional
kinesin, and is the motor involved with transporting melanophores, lipid droplets,
endosomes, and other cargos from the cell nucleus out to the periphery of the cell. Other
types of kinesin are involved in tasks such as chromosome separation, microtubule
depolymerization, retrograde organelle transport, axonal elongation, and many others, but
will not be discussed in depth in this paper. For the purposes of this paper all references
to ―kinesin‖ will refer to Kinesin-1.
Section 1.4 Dynein
Dynein, in contrast to kinesin, is a much more complicated and poorly understood motor
protein. While kinesin shares an evolutionary history with myosin (another simple motor

8
protein that walks not on microtubules but on actin filaments(23)), dynein is actually of
the AAA+ (ATPases associated with diverse cellular activities) ATPase family(24) and is
structurally very different from kinesin (see Figure 5). In fact, dynein is comparatively
monstrous in size—roughly 1.2M Daltons in molecular weight and consisting of two
heavy chains of about 520 kDa in mass (which are responsible for ATP hydrolysis and
motor activity), as well as two ~74 kDa intermediate chains, four ~55 kDa light
intermediate chains, and several light chains per motor. The function of the light and
intermediate chains is not well understood but is thought to aid in cargo binding and
regulation of the motor domains. In addition, a second protein known as dynactin is
known to associate closely with dynein in cells. Dynactin is necessary for retrograde
transport of cargos in live cells(25, 26), has been shown to increase the processivity of
dynein(27, 28), and contributes to regulation(29) and cargo recruitment(30).
Dynein does share some similarities with kinesin, in that it is formed by two main heavy
chains which dimerize together, each with a ―head‖ region that interacts with the
microtubule on one end and a dimerized ―tail‖ region which binds to various cargos on
the other. Like kinesin, dynein walks in a hand-over-hand fashion along
microtubules(31).
Unlike kinesin, however, the microtubule binding domains on the dynein heavy chains
are separated from the ATPase region by a 10-15 nm long stalk, and it is not known how
the force is transduced through this distance to generate movement. The motor domain
of dynein is ~10 times larger than that of kinesin, due to the presence of several ATP
9
binding sites. Like in other AAA+ proteins, the ATPase region of dynein forms a
ring(32, 33), with six possible ATP binding sites, known as sites 1-6. Site 1 has been
shown to be the main ATP hydrolysis site and essential for dynein motility, although sites
2-4 can also bind nucleotides and seem to influence motility and be important in
regulation of the motor(34-36). In particular, ATP binding at site 3 is necessary for
motility in vivo(37). Sites 5 and 6 have degenerate ATP binding regions and are less
likely to bind ATP but may perform structural roles.
Despite the fact that dynein was discovered nearly 20 years before kinesin, many
questions remain regarding the details of dynein’s function. Dynein (so named because
of the force that it generates, i.e. ―dyne‖-force, ―-in‖- protein)(38), was first discovered in
axonemes in 1963(39), where it functions not as processive motors but as groups of
dimers and trimers which generate force to create axoneme movement in flagella, for
instance. Twenty-four years later, in 1987, a different type of dynein known as
cytoplasmic dynein was discovered to be a processive molecular motor, moving cargos
along microtubules in the retrograde (towards the cell nucleus) direction(40). Although
many single molecule dynein fluorescence and optical trap studies have been done, they
disagree on several important points.
For instance, studies disagree as to the step size of dynein. Some studies have found that
dynein walks in 8nm steps(31), while others show a broad distribution of step sizes that
could even depend on the force which is exerted on the molecule(41). The stall force of

10
dynein is still contested as well; although the consensus generally seems to be ~1-2
pN(41), other groups have measured a stall force of ~7 pN for mammalian dynein(31).
Part of the confusion could arise due to differences between the studies in species from
which the dynein was purified. Indeed, yeast dynein and mammalian dynein certainly
behave quite differently in terms of step size (clear 8 nm steps versus a wider
distribution), velocity (~100 nm/s versus ~800 nm/s), and stall force (5-7 pN versus 1-2
pN). The discrepancies mentioned above apply to studies all done on mammalian
dynein, but it is possible that different species (porcine versus bovine, for instance) even
within the mammal kingdom differ in these key areas.
Several studies have shown that dynein is capable of taking backwards steps, either when
under backward load (yeast)(42) or even under no load at all (mammalian)(43, 44). In
mammalian dynein, this backward motion often occurs in long segments of up to >1
micron in length(43, 44). This bidirectional motion of dynein may be processive at least
some of the time and has been shown to be ATP dependent(44, 45), although much of the
observed backwards motion could be due to 1-D diffusion along the microtubule(43, 46).
Dynein is a much bigger molecule than kinesin and has a much higher degree of
flexibility. Beads carried by dynein have shown a high level (~100 nm) of ―flop‖,
particularly in the direction perpendicular to the microtubule direction(43). Importantly,
dynein (both yeast and mammalian) has been shown to take off-axis steps from one

11
protofilament to another as it traverses a microtubule track(45, 47, 48). This is in contrast
to kinesin, which always walks along a single protofilament(18).
Again unlike kinesin, cytoplasmic dynein exists as only one main type in the cell (as
opposed to a whole superfamily of kinesin types). The greater flexibility and complexity
of dynein may be due to the fact that it is called upon to perform many different types of
tasks inside the cell. In addition to the transport of cargos from the outside of the cell
towards the nucleus, dynein is also crucially important in chromosome segregation,
mitotic spindle orientation, nuclear migration, and cellular migration(49). There are
different types of kinesin which perform each comparable role, but the same dynein
molecule is able to complete a wide variety of jobs inside the cell, which may be why
such a complex and large molecule is required.
Section 1.5 Saltatory motion
One might assume, given the knowledge of kinesin and dynein as plus and minus
directed motors, that all that is required for efficient transport of cargoes inside the cell is
to attach either kinesin or dynein to a cargo, depending on its intended destination (see
Figure 6). Cargos headed towards the nucleus get picked up by a dynein, and cargos
destined for the cell periphery are attached to a kinesin, and everything moves simply
along.
In reality, however, the scenario is actually quite a bit more complicated. Cargos in
general do not have either kinesin or dynein attached to them; rather, both kinesin and
12
dynein are generally found attached to the same cargo. Additionally, vesicles and other
cargos in the cell exhibit a complex type of motion that is not simply inwards or outwards
over large distances. Instead, the cargos are seen to move back and forth along a
microtubule in a jerky stop-and-start fashion, with repeated direction reversals
interspersed throughout. This bidirectional, jerky movement is known as saltatory
motion and is common in eukaryotic cells(50).
There are various ideas to explain why this type of motion might take place instead of the
simpler smooth travel one might expect. One such theory is that this type of motion
essentially creates an active diffusion(51) within the cell, allowing cargos to spread
evenly throughout the cell, sampling a great number of locations much more rapidly than
passive diffusion would allow in such a viscous and crowded environment. Another idea
is that these pauses and reversals are caused by roadblocks within the cell, and that the
saltatory nature of the cargo movement is a mechanism whereby the motors can bypass
these obstacles(52). Also possible is that saltatory motion acts as an ―error-checking‖
method(52) whereby a cargo that is transported to the wrong destination can ―rewind‖
and try again to reach the correct one. If bidirectional motion was not possible, such a
mis-delivered cargo would be stuck at the first destination rather than being able to
sample a larger range of possible end-points until it finally finds the correct one.
Whatever the answer is to why saltatory motion occurs in cells, an equally important and
as-yet unanswered question is how this motion occurs. There are two main theories as to

13
what governs the bidirectional motion of cellular cargos: the coordinated motion model
and the tug-of-war model.
1.5.1 Coordination Model
The coordination model assumes that it would be too inefficient for the motors to be
simultaneously pulling in opposite directions, and that there is likely some sort of
mechanism in the cell to turn one set of motors on and one set of motors off at any given
instant (see Figure 7A). This mechanism could be some sort of accessory protein also
attached to the cargo, which activates and inactivates in turn the kinesin and dynein such
that they are never pulling simultaneously. Outside signals could trigger these additional
proteins to activate or inactivate a particular motor, thereby giving the cell an efficient
way of controlling the cargo behavior and of getting it to where it needs to go.
1.5.2 Tug-of-War Model
In contrast, the tug-of-war model (see Figure 7B) argues that the motors do not have any
extra mediating proteins controlling whether they are active or inactive. Instead, this
model assumes that the motors undergo a constant pulling match, and whichever motor
(or group of motors) exerts the most force ―wins‖, leading to the cargo moving in that
direction for a time. In this model, direction reversals are caused by motors dissociating
or binding from the microtubule stochastically, which tips the balance of force and leads
to one side overpowering the other. No extra mediating factors are involved in switching
the motors on or off, which means that extra energy is expended as motors work against
each other.

14
1.5.3 Evidence for Coordinated Motion
A study done on squid axon vesicles in 1996 (53) showed that only plus-end directed
movement occurred when both kinesin and dynein were present on either beads incubated
with squid axoplasm or vesicles isolated from axons. The authors concluded that dynein
was unable to compete with kinesin in a tug-of-war.
In 2002 Steven Gross’ lab found that when they mutated dynein and dynactin in a cell to
impair minus-end directed movement of liquid droplets in Drosophila cells, the result
was not an improvement in plus-end directed motion of the liquid droplets as one might
expect, but instead a severe impairment of plus-end directed motion. They concluded
that a mutation that decreased the stall force of dynein should make it easier for kinesin to
win a tug-of-war, and thus that their results were not consistent with a tug-of-war
model(54). Several similar studies have shown inhibition or depletion of kinesin
abolishes dynein driven cargo transport and vice versa (55-58).
In 2005 our lab published a paper (59) which applied FIONA to labeled peroxisomes
inside live Drosophila S2 cells and measured the step sizes of the peroxisomes as they
made bidirectional processive runs. Step sizes were found to remain constant at ~8 nm in
either direction. Because compliance in the motor stalks could cause a degradation of
step sizes if motors were acting simultaneously and in opposite directions, the constancy
of the step sizes was inferred to indicate that no tug-of-war was taking place.

15
Levi et al. found in 2006(60) that melanosomes moving inside Xenopus cells exhibited
velocity distributions with peaks corresponding to the number of active motors on the
melanosome. They found that the number of active dynein motors increased when
melanosomes traveled in the negative-end direction, while the number of active kinesin-2
motors remained the same no matter the direction of travel. They concluded that some
mechanism was regulating the number of active dynein motors in order to coordinate the
direction of movement. Because the kinesin-2 velocity profiles did not change when the
number of dynein motors increased, they asserted that the two motor types did not
compete but were carefully regulated.
A study done in 2009(61) found that microspheres positioned on the plasma membrane of
immobilized paralyzed Chlamydomonas flagella did not exhibit direction reversals, and
quiescent periods separated every transport event. The authors interpreted this to mean
that the microspheres were transported by coordinated and exclusive motion of only a
single motor type at a time.
1.5.4 Evidence for Tug of War
For some years the tug-of-war model was not favored because it was assumed that this
model would imply that the motors would spend much of the time stuck at an impasse
between balanced forces, with much energy wasted in the process. In addition, the
complexity of the saltatory motion seen in live cells in response to various stimuli or to
mutations in either motor type seemed impossible to explain via a simple tug-of-war
model.

16
However, in 2008 Lipowsky et al.(62)published a paper in which they modeled a simple
tug-of-war system with the assumption that the motors interact only mechanically via
their attachment to the same cargo. They found that rather than creating frequent, long-
lived stuck states, this model predicted a high probability of having only one motor type
engaged at a time, in agreement with in vivo motility data. This result was due to a
dynamic instability arising from the strongly nonlinear force-dependence of the single-
motor unbinding rate. In other words, as soon as the forces become unbalanced (by the
stochastic binding and unbinding of motors from the microtubule), the ―losing‖ side
motors are quickly ripped off the microtubule to give the opposing motors free reign to
walk for a time. Eventually, some or all of them will stochastically unbind and opposing
motors will bind. When the balance of forces is tipped, the new winners rip off the losers
and so forth. They found five stable states: fast plus-directed motion, plus with pauses,
no movement (stalled), minus with pauses, and fast minus-directed motion.
This paper showed that, in fact, a simple tug-of-war model could replicate many of the
complex characteristics of in vivo saltatory motion; small changes in parameters such as
stall force or microtubule affinity of each motor type led to qualitatively different types of
bidirectional motility. Thus, the cell could easily regulate the directionality of motion
simply by regulating the number of each type of motor attached to a cargo, or by altering
the motile characteristics of the motors (for instance, affecting some change that slightly
decreased the stall force of one type of motor).

17
Experimental evidence for a tug-of-war is also available. An early study done by the
Vale lab(63) showed that when both dynein and kinesin motors were attached to a glass
coverslip, microtubule movement continually switched direction, with long (micron-
scaled) unidirectional run-lengths between direction reversals. The balance of forces did
not produce little or no net movement, and the number of motors as well as their
microtubule attachment times were the determining factors in which direction
predominated.
Interestingly, Ally et al.(64) found, like earlier studies (see above), that impairment of
one motor type also inhibited motility in the other direction. However, they also found
that replacing one motor with a completely different motor type of the same polarity
rescued the cell’s ability to produce bidirectional movement. Cargos in which one type of
motor was replaced by non-functional motors of the same polarity did not display
bidirectional motion, however. This showed that plus and minus directed motors must be
mechanically activated by the presence of a functional motor of the opposite polarity on
the same cargo. It also showed that the inhibition of motion in both directions due to the
impairment of one type of motor as discussed above does not require that a mediating
protein regulates the pair of motor types. Such a mediating protein would not likely be
able to regulate the unrelated replacement motors.
Another important study(65) provides evidence in favor of the Lipowsky tug-of-war
model. Here, the authors took measurements of endosomes inside live cells, in a cell
extract, and with purified motors, and found a distinct triphasic behavior (fast movement

18
in one direction followed by a slow segment and then fast movement in the opposite
direction). The slow segments showed visible endosome elongation in the direction of
motion, showing that the two motors clearly apply opposite forces during this period.
Another recent study(66) analyzed the motion of purified neuronal transport vesicles.
They found that the vesicles generally had 1-4 motors of each type bound, and that the
purified vesicles behaved in vitro very similarly to what is seen in vivo. The vesicles
moved with robust bidirectional motion without any regulating factors present in the
cytoplasm (although a regulatory complex could have been present on the vesicles
themselves), with a small complement of motors. They found that their data was
consistent with the Lipowsky model and with Soppina et al.
Two studies published this year also have results consistent with the tug-of-war model.
In Schuster et al., bidirectional early endosome transport in fungal Ustilago maydis cells
was found to be controlled by transient binding of dynein(67). Their data was consistent
with a stochastic tug-of-war, the outcome of which was governed only by the number of
dynein bound to the cargo. Falleson et al. also supports the Lipowsky model(68). This
paper studied the force-velocity relationship of multiple kinesins transporting a
microtubule in a gliding assay. The authors found that the velocity distribution changed
under load and that under low load, the average number of bound kinesin underwent
rapid fluctuations, consistent with the predictions of the Lipowsky model.
Section 1.6 Introduction to Experimental Techniques

19
1.6.1 Total Internal Reflection Microscopy*
Total Internal Reflection (TIR) microscopy is a crucial technique in the field of single
molecule biophysics. It allows the imaging of molecules that are attached to a surface
while excluding fluorescence in the solution above the surface. With traditional
epifluorescence microscopy, a laser beam is used to excite fluorophores in a sample;
however, many fluorophores in solution above or below the focus plane are also excited,
leading to high levels of background fluorescence and therefore a poor signal-to-noise
ratio. Total Internal Reflection (TIR) microscopy solves this problem by sending the
laser beam in to the glass-water interface at such a steep angle that TIR is achieved. With
TIR, only a thin layer of light (of exponentially decreasing magnitude) called the
evanescent wave penetrates into the sample. This evanescent wave excites fluorophores
close to the surface of the slide, but will not excite any fluorophores more than about 100
nm away from the surface. In this way, excellent signal to noise ratios and high levels of
photon are achieved (see Figure 8).
1.6.2 FIONA
In order to conduct single molecule studies, researchers are confronted with the
diffraction limit of light. For visible optical microscopy, this limit is λ/(2*N.A),
where λ (the wavelength of the light) is approximately 500 nm and N.A (the numerical
aperture of the microscope objective) is about 1.4. Diffraction limited spots in a
traditional light microscope are therefore generally larger than 200 nm in diameter—
* Note: Sections 1.6.1 and 1.6.2, including Figures 8, 9, and 13 are reproduced (with some changes) with
permission from a book chapter (in press) written by the author: ―Fluorescence Imaging with One
Nanometer Accuracy: In Vitro & In Vivo‖, Single Molecule Enzymology: Methods and Protocols, Springer
Publishing Group.

20
much bigger than the molecules of interest. This resolution limit means that two identical
fluorophores in close proximity can therefore not be distinguished using traditional light
microscopy unless they are greater than ~250 nm apart. Fluorescence Imaging
with One Nanometer Accuracy (FIONA) is a simple but versatile technique for achieving
nanometer precision at biologically-relevant timescales. FIONA does not improve the
resolution of fluorophores in close proximity but instead improves the localization
accuracy of a single fluorophore.
FIONA enables the localization of a single molecule to within 1.5 nanometers and with
1-500 msec temporal resolution(69). Data can be taken inside or outside of live cells at a
timescale that is physiologically relevant, making FIONA an extremely valuable tool in
the toolbox of single molecule research techniques. The principle behind FIONA is
simple. In a typical FIONA measurement, a fluorophore is attached to some biological
molecule of interest. As the biological molecule (and the attached fluorophore) moves
through space, the center of its emission is continuously localized, making it possible to
track single biomolecules with great precision. At the core of the technique is the ability
to collect a large number of photons emitted by a single fluorophore. When we plot the
number of photons emitted by a fluorophore versus its position in the x-y plane (Figure
9), we can localize the center of the resulting Airy function much more accurately than
the width of the function. (A 2-D Gaussian function is often used to approximate the
Airy function, with little error.) Theoretically, the accuracy with which it is possible to
locate the center is the standard error of the mean, i.e., the standard deviation divided by
the square-root of the total number of counts. Thus, the accuracy of FIONA depends on

21
the collection of large numbers of photons. For 10,000 photons collected, for example,
one obtains an accuracy of approximately 250/100 = 2.5 nm.
To be slightly more quantitative, in practice the accuracy depends on three factors, as
shown in the equation below: the number of photons (N); the effective pixel size of the
detector, a, which is the pixel size divided by magnification; and the standard deviation
of the background, b:
22
2422 812/
Na
bs
N
a
N
s ii
is the uncertainty or standard error of the mean, a is the effective pixel size of the
detector (pixel size divided by magnification), b includes both the background
fluorescence and the detector noise, and si is the width of the distribution (which is
approximately 250 nm for a diffraction limited spot of visible light) in direction i, where
i=x or y. The first term (N
si
2
) is due to photon noise, the second term is the effect of a
finite pixel size of the detector, and the third term is the effect of background. Assuming
an appropriate effective pixel size (of 80-120 nm, or 16 µm divided by the magnification,
e.g. 160X) is used, the second term does not contribute significantly. When appropriate
techniques are used to minimize background noise (as discussed below), the first term
(photon noise) is the limiting factor in a FIONA measurement.
Thus, it is crucial to both decrease the background and collect as many photons as
possible from the single fluorophores in order to obtain the greatest accuracy of
localization possible. Several considerations must be made: first, an appropriate

22
fluorophore must be chosen—for accurate FIONA measurements to be made, the
fluorophore must be sufficiently bright and highly photo-stable. Oxygen scavenging
systems and other chemicals are generally needed to increase the lifetime and stability.
Second, background fluorescence must be minimized. This is typically achieved by the
use of a Total Internal Reflection (TIR) microscope, which (as discussed above) allows
the imaging of molecules that are attached to a surface while excluding fluorescence in
the solution above the surface. Hence, the excellent signal to noise ratio and high levels
of photon collection required for the FIONA technique are achieved (see Figure 8).
Careful cleaning of sample chambers and efficient surface blocking to avoid non-specific
binding of fluorescent molecules must also be employed to minimize background
fluorescence, since impurities on the surface are within the evanescent wave and can
decrease the signal- to-noise ratio, even when using TIR microscopy.
Third, sensitive photon detection is required, usually in the form of an electron multiplied
charge-coupled device (EMCCD) camera. Back-thinning of EMCCD cameras allows a
quantum efficiency of ~90%. In addition, electronic cooling to ~-70° C virtually
eliminates dark current, while electron multiplying enables very sensitive detection of
photons.
Once a sufficient number of photons can be collected, a researcher can use FIONA data
analysis techniques to localize and track the particles in the images that have been
recorded. A localization measurement with a standard error of 1-2 nm can be achieved
23
using a laser in the visible spectrum, an effective pixel size of 80-120 nm, a TIR
microscope and an EMCCD camera to minimize background, and a sufficiently bright
fluorophore to obtain ~10,000 photons per frame. These tools allow single molecule
tracking of molecular motors or other proteins with excellent spatial and temporal
accuracy.
Although a number of different enzymes can be studied using FIONA, molecular motors
are particularly well suited to this technique. Using FIONA, they can be precisely
tracked as they move in a cell or in an artificial cell-like environment. For instance, a
kinesin molecule can be tracked as it walks on microtubules laid down on a prepared
coverslip. The spatial and temporal precision gained by applying the FIONA technique
reveals valuable information about the motors, such as the distance traveled with each
step, the pause times between steps, or even details such as whether the monomers pass
each other with each step(8)—information that cannot be determined using traditional
microscopy-based measurements. The study of molecular motors can be greatly enriched
by the precise localization measurements which FIONA makes possible.
1.6.3 Optical Trapping
Optical traps are very useful tools for studying single molecules, particularly molecular
motors(70). Optical traps function by drawing in and trapping a small translucent particle
into a tightly focused, infrared laser beam. The particle’s position can be manipulated by
translating the focus of the beam, and by measuring the refraction of the laser due to the

24
presence of the bead, one can extract both the displacement of the particle away from the
center of the focus as well as the force exerted on it.
Optical traps work by taking advantage of the difference in index of refraction of a
particle (such as a polystyrene sphere) and the surrounding media (usually water). The
focus of the laser also provides a spatial photon gradient. Since the bead is composed of
dielectric material, when the light from the laser beam passes through it, it induces
electric dipoles. These induced electric dipoles will cause a force on the bead due to the
electric field gradient, causing it to be continuously pulled back to the center of the laser
beam focus, where the gradient is strongest.
This can be illustrated by a simple ray diagram (see Figure 10). The laser beam is
diffracted by the bead due to the difference in index of refraction, meaning that it exits in
a different path than it entered. The change in momentum of the light means that there
must be an equal and opposite change of momentum on the bead. If we sum up the
changes of momentum due to all the photons, we end up with a net force towards the
center of the trap (the beam’s focus.) For small displacements, the force exerted on the
bead can be modeled as a simple spring, meaning there is a restoring force proportional to
the displacement from the center of the trap. The effective spring constant is called the
trap stiffness.
Since the refraction of the light due to the bead’s presence changes the angle of the
exiting laser beam, we can measure the displacement of the bead from the center of the
25
trap by measuring the deflection of the bead with a lens and a quadrant photodiode
(QPD). Then, using the position of the bead thus measured and stiffness of the trap, we
can also determine the force exerted on the bead. All this can be done in real time, with
very fast acquisition rates (in this paper, 4000 Hz), allowing for very precise
measurements of single particle motor behavior.

26
Chapter 2: Materials and Methods
Section 2.1 Protein Purification and Preparation
2.1.1 Full Length Kinesin
Full-length kinesin was purified by collaborators (Kathy Trybus lab, University of
Vermont) as described(71). In brief, the mouse brain kinesin KIF5B heavy chain
(Invitrogen, accession number BC090841) with a C-terminal hexa-HIS tag and kinesin
light chain 2 gene (ATCC, accession number BC014845) were cloned into separate
baculovirus transfer vectors (pAcSG2, BD Biosciences). Sf9 cells were co-infected with
recombinant baculovirus coding for HIS-tagged kinesin heavy chain and YFP-tagged
light chain, and grown in suspension for 72 h. Cells were sonicated to lyse, and the cell
lysate was centrifuged at 200,000 rcf for 30 min. The supernatant was applied to a HIS-
Select® nickel affinity column (Sigma–Aldrich). The resin was washed with buffer
containing 30 mM imidazole. Kinesin was eluted from the column with 10 mM sodium
phosphate, 200 mM imidazole, pH 7.5, 0.3 M NaCl and 1 μg/mL leupeptin. The fractions
of interest were combined and concentrated, then dialyzed in 10 mM HEPES, pH 7.3, 200
mM NaCl, 50% glycerol, 1 mMDTT, 10 μM MgATP and 1 μg/mL leupeptin for storage at
−20°C.
2.1.2 Truncated Kinesin Constructs—K432 or K560
Truncated kinesin was purified in our lab by Marco Tijoe. Truncated kinesin constructs
were purified according to the procedure outlined by Pierce and Vale(72). The gene for
27
the kinesin heavy chain was truncated at either at amino acid 432 or 560, with a His tag
followed by a biotin tag at the C terminus (K432), or with a GFP and 6x His at the C
terminus (K560), and inserted into pET21a plasmid and then transformed into BL21 cells
and plated onto antibiotic selection plates. Single colonies were grown in LB media to
OD 0.4-0.8, at which point protein production was induced by addition of IPTG. 3-5
hours after induction, cultures were pelleted by centrifugation, resuspended in lysis buffer
(50 mM NaH2PO4, 300 mM NaCl , 10 mM imidazole, 40 µM MgATP, 1 mg/mL
lysozyme, 1 mM PMSF, 0.1 mL Protease Inhibitor Cocktail (Sigma Aldrich, P8849), pH
8.0), and sonicated using a probe tip sonicator. The lysate was pelleted and the
supernatant was mixed with a Ni-NTA slurry for one hour. The slurry was poured into a
column and washed three times with low imidazole concentration (20mM). The protein
was then eluted from the column with a high imidizole concentration (250mM). Protein
purification was checked with SDS-PAGE and concentration was measured using the
Bradford Assay.
2.1.3 Mammalian Dynein
Bovine brain dynein was purified by collaborators (Trina Schroer lab, Johns Hopkins
University) as described(73). Briefly, bovine brains were homogenized and centrifuged
to clarify. The supernatant was loaded onto a SP-Sephadex Fast Flow chromatography
column. The 0.5 M KCl fraction was layered over sucrose gradients and centrifuged.
The column/sucrose gradient step was repeated. Sucrose gradients were then
fractionated, with each fraction run on a SDS-PAGE gel. Fractions containing
predominantly dynein were pooled, loaded onto a Mono-Q ion exchange column, and the

28
peaks separated. The sucrose gradient fractionation and ion-exchange chromatography
was repeated until the dynein was free from any dynactin or kinesin contamination, as
seen on an SDS-PAGE gel(41).
2.1.4 Yeast Dynein
Yeast dynein was purified by collaborators (Ahmet Yildiz lab, UC-Berkley) as
described(47). To construct the truncated dynein (Dyn1331kD), the 5’ end of the
DYN1 hapolid yeast cell dynein gene was deleted by homologous recombination, leaving
base pairs 3655-12779. To artificially dimerize Dyn1331kD, a sequence encoding GST
was added just upstream of the dynein sequence. A HaloTag was also added. To allow
for purification, a ZZ tag (two copies of the IgG binding domain of protein A), a TEV
protease cleavage site with a short linker, GFP, and a 2xHA tag were added to the 5’ end
of the constructs. Truncated dynein was expressed behind the galactose promoter.
To purify the protein, yeast cells were grown to an OD600 between 1.2 and 2.0, then
harvested by centrifugation, washed once with water, resuspended in 0.2 volumes of 5X
dynein lysis buffer (1X dynein lysis buffer: 30 mM HEPES (pH 7.2), 50 mM KAcetate, 2
mM MgAcetate, 1 mM EGTA, 10% glycerol, 1 mM DTT, 0.5 mM Mg-ATP, 1 mM
Pefabloc, 10 μg/ml Leupeptin, 10 μg/ml Pepstatin A), and frozen by drops in liquid
nitrogen. The pellets were lysed by grinding with a mortar and pestle, then centrifuged at
290,000 x g for 15 min. The supernatant was then incubated with IgG sepharose
(Amersham Pharmacia) for 1 hr at 4°C. The IgG beads were washed four times with
dynein lysis buffer supplemented with 250 mM KCl, washed twice with TEV cleavage
29
buffer (10 mM Tris (pH 8.0), 150 mM KCl, 0.5 mM ATP, 1 mM DTT, 1 mM Pefabloc),
and incubated with TEV protease for 1 hr at 16°C. The resulting supernatant was then
incubated with bovine microtubules (330 μg/ml) in the presence of apyrase (6.6 U/ml)
and 20 μM paciltaxel at room temperature for 10 min. This mixture was then centrifuged
over a 40% sucrose cushion at 104,000 x g for 15 min. The resulting pellet was
resuspended in dynein lysis buffer supplemented with 100 mM KCl, 5 mM MgATP and
20 μM taxol. After incubation at room temperature for 10 min, the mixture was
centrifuged at 104,000 x g for 15 min and the resulting supernatant was aliquoted and
frozen in liquid nitrogen. Approximate yield was ~25 μg/ 1 liter culture.
2.1.5 Tau Protein
Tau protein (4RL-tau isoform) was purified by collaborators in Chris Berger’s lab
(University of Vermont, Burlington, Vermont) as described(74). Briefly, tau isoforms
were expressed in BL21-CodonPlus(DE3)-RP E. coli cells (Stratagene, La Jolla, CA)
using pET vector system (Novagen, Madison, WI). Cells were lysed, extracted proteins
were boiled, clarified by centrifugation, passed through a 0.22 µm filter, and isolated by
consecutive Q Sepherose®and SP Sepherose® Fast Flow columns (Sigma, St Louis,
MO). Purified tau was dialyzed in BRB80 buffer, and purity was assessed by SDS-
PAGE. Protein concentration was determined using the bicinchonic acid protein assay
(Pierce, Rockford, IL).
Tau protein was labeled in our lab by incubating with 10X excess DTT for 2 hours at
room temperature, followed by DTT removal by putting the sample through a Zebra

30
desalting column (Pierce, #89889), and incubation with 10X excess AlexaFluor 488
maleimide (Invitrogen, A10254). The sample was then passed through a Zebra desalting
column a second time to remove excess dye, aliquoted into 5 µl aliquots, flash-frozen in
liquid nitrogen, and stored at -80° C until just prior to use.
2.1.6 Axonemes
Axonemes were purified from sea urchin sperm as described(72). Briefly, live sea
urchins (Strongylocentrotus purpuratus, Pt. Loma Marine Invertebrates) were injected
with 0.5M KCl. Semen was collected and pelleted by centrifugation, then repeatedly
dounced in buffer 1(5 mM imidazole : CI-, pH 7.0, 100 mM NaC1, 4 mM MgSO4, 1 mM
CaC12, 0.1 mM EDTA, 0.1 mM ATP, 7 mM 2ME) with 1% Triton X-100 and repelleted.
The pellets were then resuspended and dounced in buffer 2 (5 mM imidazole: Cl-, pH
7.0, 600 mM NaCI, 4 mM MgSO4, 1 mM CaCI2, 0.1 mM EDTA, 7 mM 2ME, 1 mM
DTT) pH 8.0 with 1% Triton X-100, then again in buffer 1 repeatedly. Finally,
axonemes were resuspended in buffer 1 and mixed with 50% glycerol and stored at -80°C
(long term) or -20°C (short term).
2.1.7 Microtubules
Microtubules were prepared from commercially purchased tubulin monomers
(Cytoskeleton, TL238) by combining unlabeled tubulin with biotinylated tubulin
(Cytoskeleton, T33P) and tubulin labeled with a hiLyte 488 fluorescent tag
(Cytoskeleton, TL488M) in a 20:1:1 ratio with 50% glycerol, 1mM GTP (Cytoskeleton,
BST06), and 1mM DTT. The solution was then incubated at 37°C for 30 minutes to
31
allow the tubulin to polymerize. Paclitaxel (Cytoskeleton, TXD01) was then added at a
final concentration of 20 µM to stabilize the polymerized microtubules (paclitaxel is a
potent inhibitor of tubulin depolymerization). The solution was centrifuged at 15,000 rcf
for 30 minutes to pellet the microtubules. The supernatant was discarded, and the
microtubules were resuspended in a 20 µm paclitaxel solution and stored in the dark at
room temperature for 1-2 weeks.
Section 2.2 In vitro Fluorescence Experiments
2.2.1 Reversals
Beads with dynein and kinesin were prepared as follows (see Figure 11): Red
carbolyxlated polystyrene beads with 500 nm diameter (Invitrogen F-8812) were diluted
2:5 into a solution of 8mg/ml Bovine Serum Albumin (BSA, Sigma #A7906) in DMB
(dynein motility buffer, 30mM HEPES pH 7.2, 50mM KAcetate, 2mM MgAcetate, 1mM
EGTA) and sonicated briefly. Dynein and/or kinesin proteins were diluted to the
appropriate concentration (see below). The dynein motors were kept at ~500 nM
concentration and the kinesin was diluted in DMB with BSA (8mg/ml) plus 20mM DTT
(DL-Dithiothreitol, Sigma #D9779), then mixed with the dynein proteins at a final
concentration of 6.6 nM. Finally, 1 µL of bead solution prepared as described above was
mixed with the protein mixture and allowed to incubate at 4°C for ~30 minutes.
A ―reference kinesin‖ solution (see Figure 12) was prepared by mixing 1 µL of 200
µg/mL penta-His antibodies labeled with AlexaFluor 647 (Qiagen, #126244141) with 1
µL of ~4.4 µM K432 protein prepared as described above. The solution was allowed to

32
incubate on ice ~30 minutes. 13.5 µL of BSA (8mg/mL) in DMB buffer was then added
to dilute the protein to a concentration of ~0.28 µM.
Flow chambers were prepared by applying two pieces of double sided tape to a glass
slide, and a glass coverslip was then sandwiched on top, leaving a ~20mm X 4 mm X
0.2mm channel between them (see Figure 13). The resulting flow chamber has a volume
of ~20µL. A 1 mg/mL solution of BSA-biotin (Sigma-Aldrich, A6043) was flowed
through the chamber using capillary action and allowed to incubate for ~5 minutes. The
BSA sticks to the glass non-specifically, leaving a layer of biotin available for subsequent
binding in addition to coating the glass to prevent other proteins from binding. The
chamber was then washed with BRB80 buffer (80mM PIPES, 1mM EGTA, 1mM
MgCl2, pH 6.9), followed by a 0.5 mg/mL solution of neutravidin (Pierce, #31000),
which was incubated for ~5 minutes. Each molecule of neutravidin has four biotin-
binding sites which attach the BSA-biotin layer. The biotin-avidin linkage is extremely
stable, with a dissociation constant(75) of ~10^-14 mol/L, making the bond nearly as
stable as a covalent bond. Following the addition of neutravidin, the chamber was again
washed with BRB80, and biotinylated microtubules diluted 1:50 (final tubulin
concentration 200 nM) into BRB80 with 20µM paclitaxel were added to the flow
chamber and allowed to bind for ~10 minutes. The microtubules were then washed with
BRB80 plus 20µM paclitaxel before introducing the final imaging buffer (see Figure 14).
To prepare the final imaging buffer, the following reagents were combined: 95 µL BSA
(8mg/ml) in DMB buffer, 2 mM MgATP (Adenosine 5′-triphosphate magnesium
33
salt, Sigma #A9187), 20 mM DTT, 20 µM paclitaxel, and an oxygen scavenging system
made up of 2.5 mM PCA (3,4-Dihydroxybenzoic acid, Fluka #37580), and 50 nM PCD
(Protocatechuate 3,4-Dioxygenase, Sigma #P8279). 2 µL bead solution prepared as
described above as well as 1 µL of 0.28µM reference kinesin preparation (see above)
were then added. This imaging buffer was briefly sonicated in a bath sonicator cooled
with ice prior to introducing the solution to the flow chamber.
Data was then taken on an inverted Olympus Ixon 70 microscope with a 100X 1.45
numerical aperature objective (PlanApo 100X 1.45 NA ∞/0.17) plus an extra 1.5x
magnification. The sample was excited using TIR fluorescence (see introduction) by the
following lasers in turn: 488 nm argon-ion (Melles Griot, 60mW, 543-AP-01), 532 diode
(World Star Tech, 30 mW, model #TECGL-30), or 633 HeNe laser (Coherent HeNe
laser, 4mW, model #31-2041-000). Laser powers were adjusted by inserting neutral
density filters to achieve the desired power at the objective. Just prior to entering the
objective, laser powers were: 240 µW (488 nm), 21 µW (532 nm), and 360 µW (633 nm).
A z488/532/633rpc (Chroma) triple bandpass dichroic mirror was used inside the
microscope in combination with a z488/532/635m (Chroma) triple bandpass emission
filter. For each field of view, an image was taken using the 488 nm laser to excite the
hiLyte 488-labeled microtubules (or the alexa488 labeled tau protein attached to
microtubules) in combination with a HQ525/50M (Chroma) bandpass slide-in filter (to
eliminate emission from the 500 nm beads, which can also be excited at this wavelength).
The 633 nm laswer was then used to excite the alexa 647-labeled anti-His antibody
attached to the ―K432‖ truncated kinesin, used as a reference to tell the directionality of

34
the microbutules. The K432 movie also allowed us to exclude any microtubules of
opposite polarity that might be overlapping or too close to tell apart in the 488 nm
fluorescence image, as we could see areas with K432 traveling in both directions and
therefore exclude them. Finally, the 532 nm laser was used to excite the 500 nm beads
with motors attached. Several movies were taken using the 532 nm laser per field of
view as the behavior of the motors on the beads was observed.
Movies were recorded using an Andor iXon EM + (DV-897E-CS0) camera with the
following settings: Acquisition Mode: kinetic, Triggering: internal, Readout Mode:
image, Number Prescans: 0, Baseline Clamp: on, Vertical Pixel Speed: 3.3 µsec, Vertical
Clock Voltage Amplitude:normal, Readout Rate: 10MHz at 14 bit, Pre-amplifier Gain:
5.2x, Ouput Amplifier: Electron Multiplying, Electron Multiplier Gain: either 300 (for
488 or 633 nm excitation) or 10 (for 532 nm excitation), Acquisition Time: 0.1 second
(unless otherwise noted).
2.2.2 Yeast Dynein Bead Experiments
For experiments using yeast dynein, streptavidin coated red 500 nm beads were used in
place of carboxylated beads, and the samples were prepared as follows: 20 µL of a stock
of 0.1% w/v 0.5 µm diameter, streptavidin coated Nile red fluorescent polystyrene
particles (SVFP-0556-5, Spherotech Inc., LakeForest, IL) were added to 19 µL of DMB
buffer and sonicated for 1 min in an ice-cooled sonicator bath. 1 µL of a 1 mg/mL stock
of biotinylated anti-histidine antibody (MCA1396B, AbD Serotech, Raleigh, NC) and 10
µL of a 0.1 mg/mL stock of biotinylated anti-GST antibody (MCA1352B, AbD Serotech,

35
Raleigh, NC) were then added and allowed to react for ~30 min at 4ºC. 50 µL of
8mg/mL bovine serum albumin (BSA) dissolved in DMB was added and incubated on
ice for ~15 min and then centrifuged at 15,000 rcf for 15 min at 4ºC. The supernatant was
discarded, and the pellet was suspended in 100 µL of 8 mg/mL BSA. The sample was
again centrifuged at 15,000 rcf for 15 min at 4ºC and the supernatant discarded. The
pellet was re-suspended in 9 µL of DMB buffer with 8 mg/mL BSA, 10 µM ATP, and 10
mM DTT. The beads were then sonicated for 1 min at ~4ºC. Yeast dynein and truncated
kinesin were mixed, and 2.5 µL of this mixture was added to the beads and incubated on
ice for ~3 hours. Beads were then again briefly sonicated before diluting into imaging
buffer and flowing into the sample chamber (similar to the protocol above).
2.2.3 Tau Protein Experiments
Tau protein roadblock experiments were done as above except that microtubules were
polymerized from unlabeled tubulin and biotinylated tubulin monomers only. Tau
protein was diluted 1:1,000 to ~3.4 nM in BRB12 buffer (12mM PIPES, 1mM EGTA,
1mM MgCl2, pH 7.2) and mixed with 200 nM microtubules (final molar ratio of ~1:60)
and allowed to incubate for ~30 minutes. The microtubule wash buffer and imaging
buffer were each supplemented with tau protein as well (at the same concentration as was
mixed with the microtubules).
Section 2.3 In vivo Experiments

36
In vivo experiments were performed in our lab by Ben Blehm. A549 cells (ATCC, CCL-
185) were grown in F-12K medium supplemented with 10% Fetal Bovine Serum and
antibiotics (Penicillin-Streptomycin at 100 IU/mL), at 37°C under a 5% CO2 atmosphere.
Cells were passaged weekly with .25% trypsin .53mM EDTA solution, and for
experiments were grown on glass bottomed petri dishes (WilcoWells, HBSt-5040). The
experiments were carried out at room temperature (22°C) on an inverted Nikon TE-
2000U microscope, with a 1.2NA 60x water immersion objective, and imaged onto an
Andor iXon CCD camera (DV887DCS-BV) with an acquisition rate of either 100 msec
or 33 msec (only 50 second long, 100 msec/frame movies were analyzed for reversal
statistics). Isolated lipid droplets were identified from the movies and excised for
analysis.
Section 2.4 Optical Trap Experiments
Samples for use in the optical trap were prepared essentially as above, except that 1.2 µm
diameter non-fluorescent carboxylated polystyrene beads (SVP-10-5, Spherotech Inc.,
LakeForest, IL) were used. For dynein-only piezo step-back experiments, protein was
added at the same concentration as the fluorescence experiments (500 nM), and for
kinesin-only piezo step-back experiments, the protein was diluted 10x more than for
fluorescence experiments (0.66 nM). For mammalian dynein and kinesin experiments,
ATP concentration was reduced to 20 µM final concentration, and 2mM creatine
phosphate (Sodium creatine phosphate dibasic tetrahydrate, Sigma #27920) and 2U/ml
creatine kinase (Roche #127566) were also included in the imaging buffer in order to
create an ATP regeneration system. Reference k432 was omitted from the imaging

37
buffer, and beads were diluted an additional 20 times before adding to the imaging
solution.
Since mammalian dynein often walks backwards as discussed above, to ensure we
correctly determined the forward from backward stepping in the trap, we determined the
directionality of each axoneme before beginning the experiment. For these mammalian
dynein piezo-step back experiments, a reference kinesin sample was created by mixing
full-length kinesin with smaller (500 nm) carboxylated beads and allowed to bind for 30
min on ice. These beads were then diluted 1:80 and 1 µL was added to the imaging
buffer in addition to the larger dynein-only beads. These beads were easily distinguished
from each other by the large difference in diameters, which could be seen in the camera
using bright-field imaging. Before taking data for each dynein-only bead, a kinesin-only
bead was brought down to the axoneme and allowed to bind. The directionality of the
axoneme was determined by observing the direction of walking of the small bead. A
large dynein-only bead was then brought to the same axoneme and used for the piezo-
step back experiment.
For optical trap experiments with yeast dynein, 5 µL of a stock of 1% w/v 1.2 µm
diameter, streptavidin coated polystyrene particles (SVP-10-5, Spherotech Inc.,
LakeForest, IL) were added to 25 µL of DMB buffer and sonicated for 1 min in an ice-
cooled sonicator bath. 20 µL of a 0.1 mg/mL stock of biotinylated anti-GST antibody
(MCA1352B, AbD Serotech, Raleigh, NC) was then added and the sample was allowed
to react for ~15 min at on ice. 50 µL of 8mg/mL bovine serum albumin (BSA) dissolved

38
in DMB was added and incubated on ice for 10 min and then centrifuged at 15,000 rcf for
5 min at 4ºC. The supernatant was discarded, and the pellet was suspended in 100 µL of 8
mg/mL BSA. The sample was again centrifuged at 15,000 rcf for 5 min at 4ºC and the
supernatant discarded. The pellet was re-suspended in 9 µL of DMB buffer with 8
mg/mL BSA, 10 µM ATP, and 10 mM DTT. The beads were then sonicated for 1 min at
~4ºC, and 1 µL of yeast dynein stock was added and incubated on ice for 2-3 hours. The
beads were then again briefly sonicated. The remainder of the experiments were
performed similarly to the mammalian dynein trap experiments described below except
that the reference kinesin beads were omitted, saturating ATP concentrations were used
(because of yeast dynein’s slower stepping velocity), and the creatine phosphate and
creatine kinase were omitted.
Flow chambers for optical trap experiments were prepared using axonemes as opposed to
microtubules. To prepare the chamber, axonemes were diluted 1:30 in BRB80 buffer,
flowed in the sample chamber, and incubated upside-down at 4°C for ~10 minutes. The
surface was blocked with 8mg/mL BSA incubated for ~5 minutes. Imaging buffer was
then flowed through the chamber just prior to data collection.
A custom built optical trap in our lab by Ben Blehm (who also collected all the optical
trap data included in this study) and was used for force measurement and backward
stepping experiments. The trap consists of a 1064 nm trapping laser (SpectraPhysics,
Nd:YVO4, PN# BL-106C) and an 845nm detection laser (Lumics, PN# LU0845M150-
1G36F10A). The lasers were sent into a modified inverted Nikon TE-2000-U

39
microscope through a Nikon 60x 1.2NA water immersion objective. The trapping beam
was positioned using a one-axis Acousto-Optic Modulator (Gooch & Housego, PN#
23080-3-1.06). A Quadrant Photo Diode in a plane conjugate to the back focal plane of
the objective used for bead detection. Trap stiffness calibration was carried out by fitting
a Lorentzian to the thermal noise of a bead in the trap (data acquisition rate of 80 kHz),
while the Volts to nanometers calibration was carried out by oscillating the trap at 100Hz
and comparing the known amplitude of oscillation to the bead’s displacement as in
[Tolic-Norrelke, Review of Scientific Instruments vol 77, 2006]. Backward stepping was
simulated with a piezostage (Mad City Labs, stage PN# MCL 01069), controller PN#
NanoDrive MCL 01312). Data acquisition, AOM control, and piezo control were carried
out with a FPGA DAQ card and custom programs (National Instruments, PXI-7851R and
Labview v8.5). Experiments were all carried out at room temperature (22°C) with a
4000Hz data acquisition rate. Trap stiffness was adjusted such that the motors could
travel ~100 nm before reaching their respective stall forces.
Trap data was analyzed by first correcting for the compliance of the motors (1.06 for
mammalian dynein(41), 1.23 for kinesin(9), yeast dynein uncorrected) and then binning
by 10. The net motion of the motors were determined by subtracting the position of the
piezo stage from the position of the bead at each time point. Steps were found by running
a Student T-test fit program ―MtltyAnalysis_ttest‖ written in IDL by Sheyum Syed in our
lab in 2005. on the resulting traces. Parameters used to obtain the T-test fit were as
follows:
mingrp=2 ;min and max numbers of data to be...
maxgrp=10 ;grouped together each time for analysis

40
minthrs=0.01; statistical threshold value...minimum
maxthrs=0.05; threshold maximum used in calcs
thrspoints=5; # threshold values @ which fits will be done
Traces were then scored as having a ―snap-back‖ event if the T-test fit had at least one
step with a size larger than a given threshold limit. Threshold limits were set at 50 nm,
75 nm, or 100 nm.
Section 2.5 Data Analysis
Fluorescence bead data was analyzed using a custom-written program created in Matlab.
In brief, the program does the following (a more detailed explanation can be found in the
Appendix):
2.5.1 Fluorescence Bead Program Summary
1. Finds the microtubules in an image, fits lines to them, and makes a ―mask‖ to apply to
other files so that only the spots on microtubules are analyzed. It records the position
and angles of each microtubule.
2. Makes kymographs of labeled truncated kinesin moving on the microtubules as a
reference to determine the + end of the microtubule and to exclude areas with two
microtubules of opposite polarity that are close together or overlapping.
3. Finds moving spots on microtubules in the data files. It excises them and saves a copy
of the movie.
4. Applies FIONA to moving spots and rotates the trace so that x is along the
microtubule and y is perpendicular to it (with the + direction to the right), then plots x

41
position vs. time. Using the Recursive Douglas-Peucker Polyline Simplification
algorithm (dsimplify.m by Wolfgang Schwanghart,
http://www.mathworks.com/matlabcentral/fileexchange/21132-line-simplification), it
finds segments of roughly constant velocity and generates histograms of various
measures such as segment lengths, velocities, etc.
5. Locates places where the beads reversed direction by looking for places where the
slope changes sign with some minimum distance traveled (i.e., 250 nm or 500nm) on
either side of the slope change.
2.5.2 In vivo Analysis
For in vivo experiments, lipid droplets were analyzed with FIONA. The x position vs y
position plot was then fit to a straight line, and the axis rotated to horizontal. Lipid
droplets were determined to be moving in the + or – direction based on if they moved
mostly towards the cell periphery or interior, respectively. The x position vs. time trace
was then plotted and analyzed according to the methods described above.

42
Chapter 3: Results
Section 3.1 In Vitro Saltatory Motion
3.1.1 Fluorescence Bead Assay Results
To assess whether additional regulating factors are required to mediate the up-and-back
saltatory motion of cellular vesicles traveling on microtubules in vivo, we created a
simplified in vitro system where kinesin and dynein are both attached to a single cargo—
in this case, a 500 nm bead. Since no other accessory proteins are included in the system,
we can assume that whatever behavior we see is due to the interaction between kinesin
and dynein alone.
To this end, as described in Chapter 2:Materials and Methods, we attached both full-
length mammalian kinesin and native bovine dynein via non-specific adsorption onto a
carboxylated bead. We laid down fluorescent microtubules on a glass coverslip and
assessed the polarity of the microtubules by observing the direction of motion of
truncated kinesins attached to fluorescent anti-His antibodies. This reference kinesin also
allowed us to exclude any areas where two microtubules of opposite polarity were
overlapped or close together. We introduced the kinesin-dynein beads and observed their
trajectories as they traveled along the microtubules via TIRF microscopy. We then
applied FIONA to the point-spread functions of the beads and plotted the trajectories.
We fit these trajectories to sections of roughly constant velocity and analyzed the results.
(See Chapter 1: Introduction for information about these techniques and Chapter 2:
Materials and Methods for a more detailed description of the experimental setup and
analysis.)

43
Beads with both motors frequently exhibited bidirectional motion (See Figure 15). About
one fifth (21%) of beads with both motors were observed to have at least one direction
reversal (defined as two successive segments at least 500 nm in length with opposite
directions) per trace (traces are fifty seconds in length, or as long as the bead remained in
the field of view during the fifty second movie). This is in stark contrast to beads with
kinesin only or dynein only, of which 0% (kinesin) and 5% (dynein) had one or more
reversal (see Figure 16).
Since dynein motors are capable of walking backwards, it is important to assess whether
the bidirectional motion seen could be due to dynein motors alone rather than to the
interplay of both kinesin and dynein motors. To do this, we compared our results from
beads with dynein only to those with both dynein and kinesin. We did observe that beads
carried by dynein-alone can exhibit bidirectional motion, as previously described by other
groups(43, 44). However, beads with both kinesin and dynein exhibited more frequent
bidirectional motion of longer length scales than did those with dynein alone (see Figure
17). In addition, the beads with both kinesin and dynein behaved significantly differently
from those with dynein-only (or kinesin-only) in terms of net distance traveled (Figure
18). Even within the subset of traces exhibiting at least one reversal (see Figure 18,
inset), beads with both dynein and kinesin had a significantly different net distance
traveled than beads with dynein only. (This effectively excludes any beads in the
kinesin-and-dynein sample that were more likely to have only kinesin or only dynein
attached to that particular bead, thus excluding any effect due to simple averaging of the
44
results of dynein-only and kinesin-only beads. Instead, the dynein-and-kinesin sample
clearly shows a distinct characteristic that can only come from the interplay of dynein and
kinesin on a single bead).
The robust bidirectional motion we observed in our simplified tug-of-war system shows
that such saltatory motion does not necessarily require any external signals or mediating
proteins, as these were not present in our in vitro system.
3.1.2 Motor Concentration Determination
An important question to consider with our in vitro system is how many of each type of
motor are involved with the tug-of-war we observe. This question is difficult to answer
directly, however, because of the stochastic nature of the motor binding to the beads.
However, the number of motors per bead is actually not the relevant quantity; rather, the
number of motors which can simultaneously interact with the microtubule is the quantity
that matters in terms of our tug-of-war assay. This number is certainly much smaller than
the number of motors bound to the bead in total (since the bead is quite large, many
motors that are bound to the bead are in fact quite far away from the microtubule). This
number can also change over time. For instance, the bead might rotate slightly when one
motor releases from the microtubule, allowing motors close by that were previously
unable to bind to the microtubule to now have access.
We performed two measurements to give an indication of how many motors are
simultaneously interacting with the microtubule. First, we performed a simple optical

45
trap experiment in which a number of beads are each held in turn over a microtubule and
allowed to bind. We plotted the fraction of beads that do bind versus the relative
concentration of the motor. The resulting graph (Figure 19) was fitted to a single
Poissonian function, which shows that only a single motor is required for motility. The
concentration used for the in vitro fluorescence assays is indicated in the figure. In other
studies(6, 43), a binding fraction of this amount corresponded to 1-3 motors
simultaneously interacting with the microtubule per bead.
Second, we measured the stall forces of the motors attached to the beads. Since stall
forces are additive, a histogram of the stall forces should have peaks of n*F where F is
the stall force of a single motor and n varies from one to the maximum number of motors
simultaneously pulling on the bead. Stall forces for beads with dynein only showed
peaks at ~1.5 pN and ~3 pN, corresponding to 1 or 2 motors, respectively (see Figure 20).
Beads with both dynein and kinesin (added in the same amount as above) showed mostly
1 motor stall forces in the minus direction, with some 2 motor stall forces, and only very
rarely more than 2 (see Figure 21). Stall forces in the plus direction showed one major
peak at ~5-7 pN, corresponding to a single kinesin motor. From these stall force
histograms, we can assume that our beads generally have 1-2 dyneins and 1 kinesin
simultaneously interacting with the microtubule. This is a reasonable number when
compared to the number of motors that generally pull a single cargo within a cell.
Various studies have found ~1-5 of each motor type attached to a single in vivo cargo(65,
66).

46
Section 3.2 In Vivo Comparison
Our in vitro assay shows that there is no requirement for a regulatory protein in order to
achieve saltatory motion. To further assess if the saltatory motion seen in our in vitro
assay is similar to that seen in live cells, we observed the motion of lipid droplets inside
human epithelial cells (A549 cells). We picked lipid droplets that were separated
spatially from nearby droplets (so that they could be properly analyzed with the same
computer program with which we analyzed the bead data and so that the environment
during the observed motion was less crowded and more like that of our in vitro system.)
We then analyzed the motion of these droplets using the same techniques described
above, and compared the results to our in vitro data. We found that these lipid droplets
exhibited similar behavior to our in vitro beads, although the frequency of >500nm
reversals per 50 second trace was actually somewhat lower in vivo (11%) than in vitro
(21%) (see Figures 22-24). However, we noticed that in crowded sections of the cells,
the lipid droplets underwent more frequent reversals due to collisions with other lipid
droplets. These areas were difficult to analyze quantitatively, however, since their
crowded nature made it impossible to use our analysis program. The lower percentage of
traces with reversals could be explained as an under-estimate of the actual number of
reversals occurring in the cell, since the majority of reversals seemed to occur in crowded
areas. Additionally, the cell could be actively regulating the outcome of the tug-of-war
(in this case, inhibiting reversals) through some mechanism that would alter the motors’
individual characteristics (for instance, phosphorylation of one type of motor creating a
higher microtubule binding rate.) Other studies(65, 66) have measured much higher

47
frequencies of reversals in in vivo organelles—30-80% exhibited bidirectional motion
(although their definitions of bidirectional motion differed somewhat from our own.)
Section 3.3 Effects of Altering Motor Ratios
Next we considered how changing the ratio of kinesin to dynein would alter the outcome
of the tug-of-war. We repeated the experiment over a number of different kinesin:dynein
ratios. In one series of experiments we held the amount of kinesin constant and varied
the amount of dynein added, while in a second series of experiments we held the dynein
concentration constant and varied the dilution of the kinesin added. Figure 25 shows the
resulting histograms (for varying kinesin concentrations) of net distance traveled for each
kinesin:dynein ratio. Surprisingly, the histograms show vary little variation across a wide
range of kinesin:dynein ratios, in both the case of varying the dynein amount and the case
of varying the kinesin amount. Histograms of the average velocity of each roughly-
constant-velocity segment show slightly more of a shift with the variation of
kinesin:dynein ratio (see Figure 26), but the shift is still more subtle than might be
expected. Repeating the experiment with a constant kinesin concentration while varying
the dynein concentration showed similar results (see Figures 27-28). According to the
Lipowsky tug-of-war model, the results of the motors’ tug-of-war should be very
sensitive to changes in the motor ratio. The lack of a clear shift with motor ratio in our
data indicates that our data are not entirely compatible with the Lipowsky model.
Section 3.4 Encountering and Bypassing Obstacles

48
We observed beads with kinesin and dynein attached encounter various types of
obstacles. Two beads on the same microtubule often collided with one another (with
either both moving or, more commonly, one stuck and one moving). We compared the
collisions that occurred with beads that had both dynein and kinesin motors on them to
beads that had only one or the other (see Figure 29). Beads with only kinesin attached
generally disassociated from the microtubule upon collision with another bead. Beads
with only dynein most often became stuck in place next to the other bead, although they
sometimes reversed direction upon collision. In contrast, beads with both motors most
often reversed direction after colliding with another bead.
We also observed beads encountering an intersection with another microtubule.
Depending on which microtubule was on top, one would expect that this situation would
sometimes create an obstacle for the motors. In many cases, the beads simply passed
through or switched microtubules. Beads with both motors sometimes reversed direction
upon encountering a microtubule intersection, and in rare cases reversed direction twice,
successfully passing through the intersection on the second try (see Figure 30).
To create a more physiologically relevant scenario, we bound the 4RL isoform of the tau
MAP protein to microtubules and observed the beads interacting with these obstacles.
Tau protein forms patches of several tau proteins clustered together when mixed with
microtubules at sufficient concentrations(5, 6). Tau has been shown to cause kinesin
molecules to detach from the microtubule, while dynein molecules are likely to reverse
direction upon encountering a patch of tau(5). We observed beads with dynein and

49
kinesin often reversed direction upon encountering tau patches (Figures 31-32).
Interestingly, in some cases the multiple reversals of the beads eventually led to
successfully bypassing the tau patch obstacle (see Figure 31).
Section 3.5 Yeast Dynein Experiments
We also tested what effect replacing mammalian dynein with yeast dynein would have on
our assays. Yeast dynein has several important differences from mammalian dynein: it
has a much larger stall force (~7-8 pN, more on par with kinesin’s stall force) and has a
~10x slower velocity than mammalian dynein. In addition, yeast dynein does not
undergo frequent backwards-directed motion unless under large backward load. Yeast
dynein is not known to be involved in the transport of organelles inside yeast cells(42)—
rather, it is involved with chromosome segregation and mitotic spindle orientation(76). If
the propensity for mammalian dynein to walk backwards is indeed important for saltatory
motion to occur, one would expect assays using yeast dynein to have significantly
different results.
In experiments using truncated yeast dynein rather than full-length mammalian dynein
(along with a truncated kinesin construct), we found that reversal events were extremely
rare. Although we are not able to rule out the possibility that the truncation of the yeast
dynein contributed to its inability to generate saltatory motion in vitro, it is possible that
the fact that yeast dynein does not walk backwards easily could be an important factor in
why it does not exhibit saltatory motion when combined with truncated kinesin. (See
Chapter 4:Discussion for a more in-depth discussion on this topic.)
50
Section 3.6 Optical Trap ―Snap-Back‖ Experiments
As described above, experiments using truncated yeast dynein suggested that mammalian
dynein’s ability to step backwards is crucial to achieving saltatory motion. Based on this
finding, we hypothesized that dynein does not always detach during + directed motion
but rather walks backwards with kinesin at least some of the time. To test this idea, we
devised an optical trap experiment in which we simulated a kinesin molecule walking in
8 nm steps and pulling backwards on kinesin. (See Chapter 2:Materials and Methods).
To do this, we trapped a bead with only one type of motor in the optical trap and brought
it into contact with a microtubule on a coverslip. Then, we stepped the piezo stage (upon
which the coverslip was sitting) backwards in 8 nm steps and observed the behavior of
the motor. In the case of a ―normal‖ motor such as kinesin, which only takes slow
backwards steps when under super-stall forces(77, 78), one would expect the motor to
stay attached to the microtubule until the stepping of the piezo stage creates a force that is
close to the motor’s stall force, at which time the motor would let go of the microtubule,
causing the bead to ―snap back‖ to the center of the trap in a single clean step (see Figure
33).
3.6.1 Kinesin Snaps Back
When we performed this experiment with kinesin-only beads, this is essentially what we
saw (see Figure 34). Beads with kinesin occasionally took slow backwards steps, but
mostly stayed attached to the microtubule until the stall force was reached, after which
the bead snapped back to center.

51
3.6.2 Mammalian Dynein Walks Back
Beads with dynein motors, on the other hand, behaved quite differently. Although they
sometimes snapped back as did kinesin-only beads, the frequently exhibited a different
behavior in which the dynein took rapid, large backwards steps rather than detaching
from the microtubule (see Figure 35). These large steps are consistent with dynein’s
flexible nature and ability to take large steps. The data do seem to indicate that dynein, at
least some of the time, walks backwards with the opposing motor rather than detaching
from the microtubule when pulled backwards. This is a detail not included in the
Lipowsky model, which assumes that motors only take slow backward steps when under
super-stall forces.
3.6.1 Yeast Dynein Snaps Back
To further test this idea, we repeated this optical trap experiment using yeast dynein in
the place of mammalian dynein. If our hypothesis is correct, we would expect yeast
dynein to ―snap-back‖ rather than walk back as mammalian dynein does. Indeed, yeast
dynein did not exhibit rapid backwards stepping in our piezo step-back assay (Figure 36).
Instead it behaved more like kinesin motors, taking some slow backward steps and
eventually snapping back as the motor completely let go of the microtubule after its stall
force was exceeded. Apparently, yeast dynein holds on more tenaciously to the
microtubule does than mammalian dynein, and it does not walk as readily backward with
an opposing motor. This is consistent with our hypothesis that the ability of mammalian

52
dynein to walk backwards with kinesin rather than detaching from the microtubule is
indeed a crucial element in achieving saltatory motion.
A quantitative comparison of the frequency of ―snap-back‖ events for kinesin,
mammalian dynein, and yeast dynein was also completed (see Figure 37). Optical trap
traces were fit using Student’s T-test. Traces were then scored as having a ―snap-back‖
event if the T-test fit had at least one step with a size larger than a given threshold limit.
Threshold limits were set at 50 nm, 75 nm, or 100 nm. (It was assumed that a step of this
magnitude indicated a full release from the microtubule rather than an actual motor step.)
Mammalian dynein traces showed significantly less snap-back events at all threshold
limits, indicating that this motor type was more likely to take backward steps but remain
engaged with the microtubule rather than releasing.

53
Chapter 4: Discussion
Section 4.1 Modified Tug-of-war Model
As explained above, our results certainly support a tug-of-war model over a coordinated
motion model. Since we did not include any sort of coordination complex in our in vitro
system, we can be certain that such a regulatory system is not necessarily required to
achieve saltatory motion. However, our data was also not entirely consistent with the
simple tug-of-war as presented in the Lipowsky model. We found that outcome of the
tug-of-war did not seem to be very sensitive to the ratio of kinesin:dynein which we
added to our beads. In addition, the Lipowsky model does not account for dynein’s
tendency to walk backwards when pulled back by an opposing motor, or indeed, even
when not under any external load at all. Finally, it is not readily obvious based on the
Lipowsky model why beads so often reverse direction upon encountering obstacles.
We therefore present a modified tug-of-war model, as can be seen in Figure 38. The
main difference between this model and the Lipowsky model is the idea that dynein stays
attached to the microtubule and walks backwards with kinesin (towards the + end) rather
than detaching completely when kinesin is ―winning‖. This model also explains why
cargoes are more likely to reverse directions after collisions and provides insight into
how cargoes can successfully navigate around the significantly crowded cellular
environment.
In our modified tug-of-war model, shown in detail in Figure 39, the cargo is first being
carried in the + end direction by kinesin (Figure 39A). However, the dynein motors are

54
also attached to the microtubule and are walking backwards with kinesin. The cargo then
encounters some sort of an obstacle, such as a microtubule associated protein, at which
time the kinesin lets go of the microtubule and dissociates (which is what we found
kinesin motors most likely to do when encountering obstacles), as seen in Figure 39B.
Since the dynein motors are still attached to the microtubule and ready to take over, the
cargo then reverses direction and heads in the – end direction. Since dynein sometimes
takes off-axis steps from one protofilament to another, it is possible for it to wander to a
different protofilament during this time (Figure 39C). At some point, the kinesin motors
reattach, and the cargo again moves in the + direction, although on a new protofilament
which is not blocked by the obstacle (Figure 39D). Thus, dynein’s unique abilities to
walk backwards and to change protofilaments have enabled the cargo to successfully
bypass an obstacle without detaching from the microtubule.

55
Chapter 5: Conclusions
Section 5.1 Tug-of-war and Dynein’s Role
These results support a tug-of-war model over a coordinated motion model; they show
conclusively that no mediating proteins or coordination complex is required to achieve
saltatory motion. However, although our data indicate that external coordination factors
are not required to facilitate the back-and-forth motion of cargos within cells, a simple
tug-of-war model in which the two motors are considered to be equivalent except in
directionality is also not entirely complete. It is, in fact, too simplified. The added
complexity needed to explain saltatory motion is found within the dynein motor itself.
Dynein’s ability to walk bidirectionally is fundamentally important to a cargo’s back-
and-forth motion. In addition, dynein’s flexibility, ability to switch from one
protofilament to another as it walks, and bidirectionality are all fundamentally important
to the cell’s ability to maneuver cargos within a densely packed environment full of
obstacles and road blocks. Dynein’s role as an accommodating tug-of-war partner could
be all that is necessary to explain saltatory motion as seen in vivo.
Section 5.2 Future Work
Future work will include studying different types of kinesin or dynein motors (for
instance, variations of kinesin which have lower stall forces) to see how this affects the
outcome of the tug-of-war. A full-length yeast construct (rather than the truncated yeast
construct used here) will also be used to verify that the lack of saltatory motion observed
with this type of dynein was not simply due to the shorter stalk length.

56
Finally, it would be most helpful and interesting to be able to devise a system in which
the exact number and type of motors that are simultaneously interacting with the
microtubule for a give cargo at a given time could be unambiguously determined. Future
work could include efforts to create such a system.

57
Figures
Figure 1. Cartoon Depiction of Prokaryotic and Eukaryotic Cells. The prokaryotic cell (left) is much smaller
(~1-5 µm) and simpler than the larger (10-100 µm) and more complex eukaryotic cell (right).
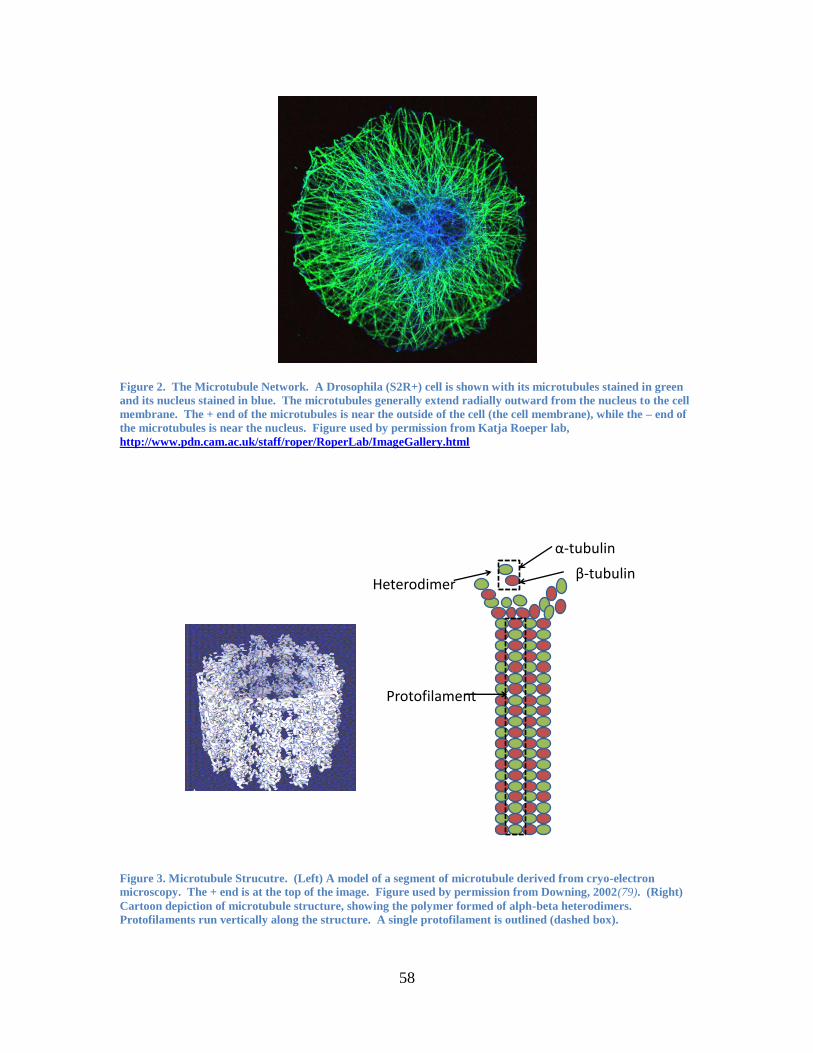
58
Figure 2. The Microtubule Network. A Drosophila (S2R+) cell is shown with its microtubules stained in green
and its nucleus stained in blue. The microtubules generally extend radially outward from the nucleus to the cell
membrane. The + end of the microtubules is near the outside of the cell (the cell membrane), while the – end of
the microtubules is near the nucleus. Figure used by permission from Katja Roeper lab,
http://www.pdn.cam.ac.uk/staff/roper/RoperLab/ImageGallery.html
Figure 3. Microtubule Strucutre. (Left) A model of a segment of microtubule derived from cryo-electron
microscopy. The + end is at the top of the image. Figure used by permission from Downing, 2002(79). (Right)
Cartoon depiction of microtubule structure, showing the polymer formed of alph-beta heterodimers.
Protofilaments run vertically along the structure. A single protofilament is outlined (dashed box).
Protofilament
Heterodimer
α-tubulin
β-tubulin

59
Figure 4. Kinesin Molecule Structure. A depiction of a kinesin motor protein, showing the two dimerized heavy
chains and light chains. Various regions of the motor—the ATPase region, the coiled-coiled region, and the
cargo binding domain--are outlined (dashed boxes). Figure used with permission (modified) from Vale,
2003(80).
Figure 5. Dynein Molecule Structure. A depiction of a dynein motor protein, including the two dimerized heavy
chains and various light and intermediate chains. Various regions of the motor—the ATPase region, the
microtubule binding domain, and the cargo binding domain--are outlined (dashed boxes). Figure used with
permission (modified) from Vale, 2003(80).
ATPase Region (“Head”) Coiled-coil Domain
(“Tail”)
Cargo-binding Domain
ATPase Region
Microtubule Binding Domain
Cargo-binding Domain

60
Figure 6. Cartoon Depiction of Motors with Cargos Bound. Kinesin (left) walks towards the + end of the
microtubule, while dynein (right) walks towards the – end. A naïve assumption would be that cargos have one
or the other type of motor attached, based on the intended direction of the destination
+-
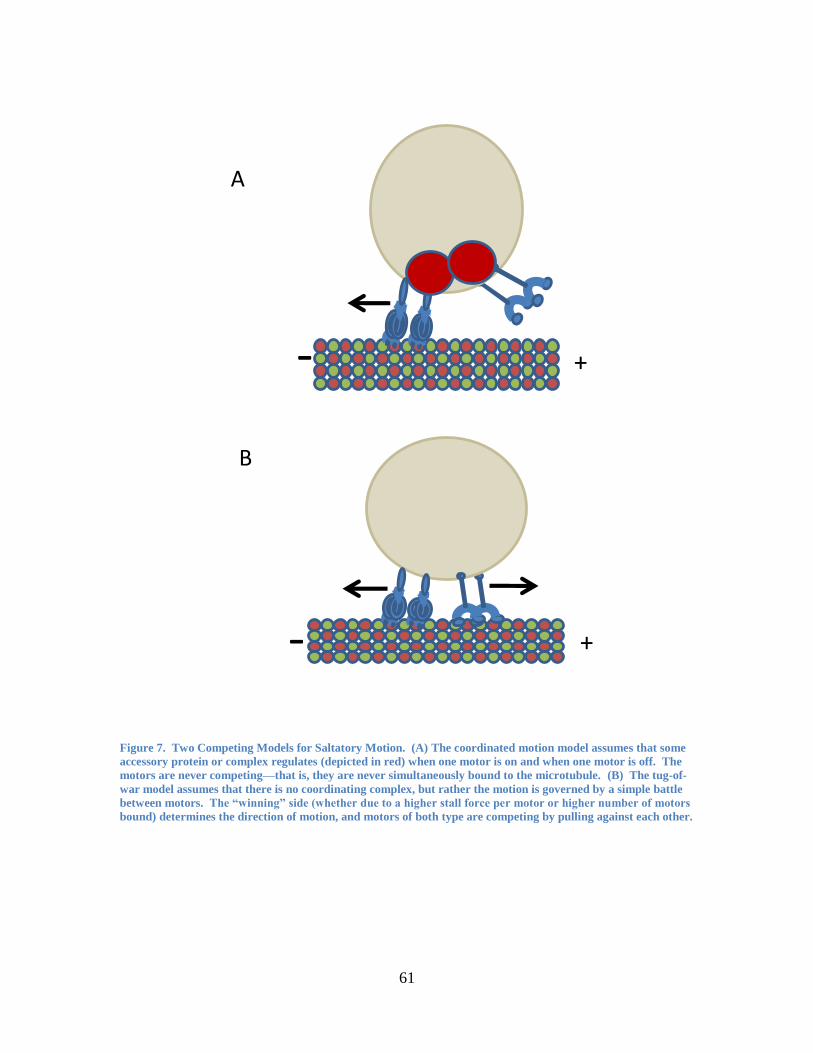
61
Figure 7. Two Competing Models for Saltatory Motion. (A) The coordinated motion model assumes that some
accessory protein or complex regulates (depicted in red) when one motor is on and when one motor is off. The
motors are never competing—that is, they are never simultaneously bound to the microtubule. (B) The tug-of-
war model assumes that there is no coordinating complex, but rather the motion is governed by a simple battle
between motors. The ―winning‖ side (whether due to a higher stall force per motor or higher number of motors
bound) determines the direction of motion, and motors of both type are competing by pulling against each other.
+-
+-
A
B

62
Figure 8. TIRF Microscopy. When the incoming laser is at the correct critical angle for its wavelength, it is
totally reflected by at the glass/water interface, and only an evanescent field penetrates into the sample. This
evanescent field loses half of its intensity every ~50nm into the sample, so effectively only flourophores within
~100m of the coverslip will be excited. This greatly minimizes background signal and will not photobleach dyes
in the bulk of the sample. The oil between the sample chamber and the objective has the same index of
refraction as the glass, and eliminates refraction of the laser which would occur if the laser traveled through air.
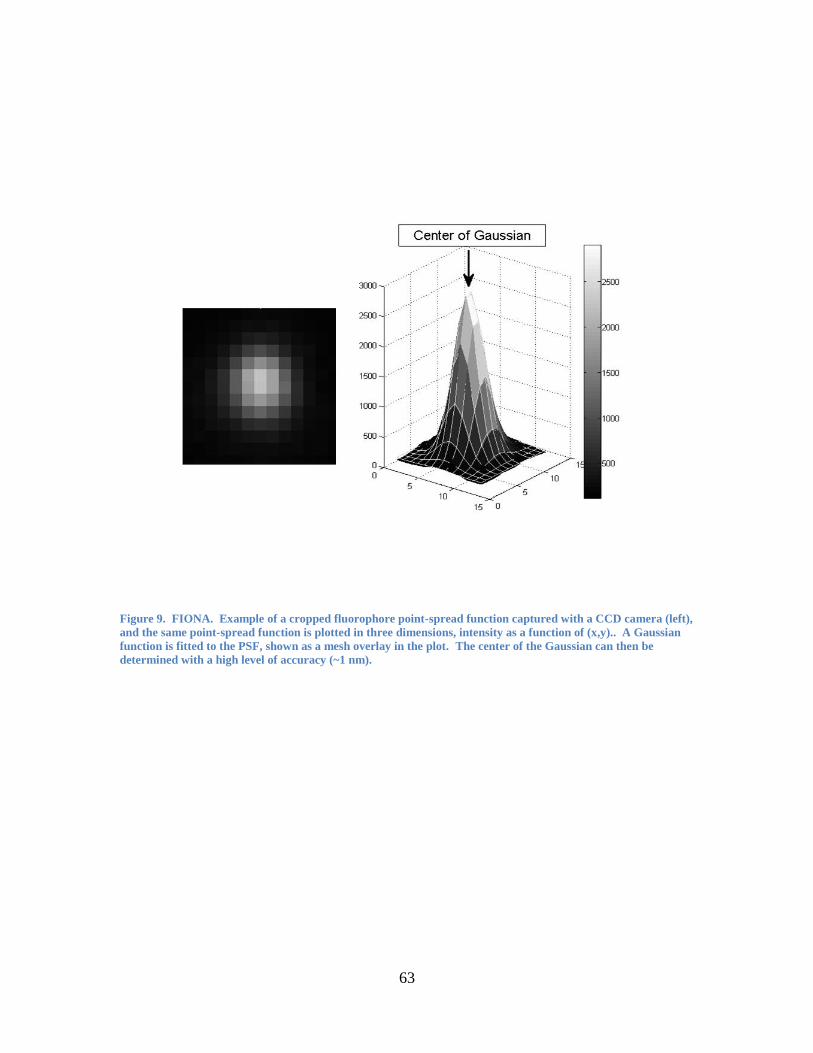
63
Figure 9. FIONA. Example of a cropped fluorophore point-spread function captured with a CCD camera (left),
and the same point-spread function is plotted in three dimensions, intensity as a function of (x,y).. A Gaussian
function is fitted to the PSF, shown as a mesh overlay in the plot. The center of the Gaussian can then be
determined with a high level of accuracy (~1 nm).

64
Figure 10. Optical Trap. A simplified ray diagram illustrating how an optical trap functions. A spherical
particle sits just below the focus of a laser beam. Two representative light rays are depicted in red, showing how
they are bent due to the refraction of the light as it passes through the transparent sphere. The resulting change
in momentum for one of the beams is shown in the inset. An equal and opposite force to this change in
momentum is applied to the sphere (green arrows), causing a net upward force that pushes the bead back
towards the focus.
In
Out
Δ
Light In
Light Out
FocusLight Momentum Change

65
Figure 11. Fluorescent Bead Sample. Dynein and kinesin motors are non-specifically bound to a 500 nm
diameter red (excited by 532 nm laser) carboxylated polystyrene bead. Motors are bound stochastically on the
surface of the bead.
Full-length mouse brain
kinesin
Bovine brain dynein (native)
500 nm CarboxylatedPolystyrene Bead
(excited by 532 nm laser)
Motors bound non-specifically,
stochastically

66
Figure 12. ―Reference Kinesin‖ Sample. A truncated kinesin construct with a histidine tag is bound to a
fluorescent anti-His antibody. This reference kinesin can then be used to distinguish the + end of the
microtubule.
Figure 13. Flow Chamber. Schematic of capillary flow chamber. The coverslip is attached using double-sided
tape, leaving a thin chamber between the tape. Solutions are flowed through the chamber from one end using
capillary action
His
Fluorescent Anti-His
(Alexa 647)
+
Solutions flowed through chamber

67
Figure 14. Experimental Setup. (Top) Cartoon depiction of the experimental setup inside the flow chamber.
Each ―layer‖ is flowed through the chamber in succession. First BSA-biotin is attached to the glass coverslip.
Neutravidin molecules are then bound to the biotin on the BSA-biotin. Biotinylated fluorescent microtubules
are then bound to the neutravidin. These can be imaged by exciting the fluorophores on the microtubules (see
example image, bottom left). Finally, the bead sample is flowed through and the motors can walk on the
microtubules (bottom right).
Glass Coverslip
NeutravidinBiotin
BSA
Microbutubule
hyLyte488 dyes

68
Figure 15. Results of In Vitro Tug-of-War Fluorescence Assay. Position versus time for motors carrying beads
on microtubules driven by 2 mM [ATP]. Traces are 50 seconds in length, or as long as the bead remained within
the field of view. (Left) Example traces of 500 nm beads with kinesin-only walking in the plus direction.
(Center) Example traces of 500 nm beads with dynein-only, walking in the minus direction. (Right) Example
traces of beads with both dynein and kinesin exhibiting bidirectional saltatory motion. The top two traces show
100 nm beads with both motors attached, while the bottom two traces are from 500 nm beads. Similar behavior
was observed for both 100 nm and 500 nm beads.
0 10 20 30 40 50-1500
-1000
-500
0
500
1000
1500
2000
2500
Both-motor Beads
Time (s)
Posi
tion (
nm
)
100 nm
100 nm
500 nm
500 nm
0 5 10 15 20 25 30-1000
0
1000
2000
3000
4000
5000
6000
Time (s)
Po
sitio
n (
nm
)
Dynein-only Beads
0 5 10 15 20 25 30-4000
-3000
-2000
-1000
0
1000
2000
3000
Kinesin-only Beads
Time (s)
Po
sitio
n (
nm
)
+ end
- end
+ end
- end
- end
+ end

69
Figure 16. Evidence of Saltatory Motion. Histogram showing the number of reversals with >500 nm run
lengths before and after the reversal per trace for beads with kinesin-only (blue), dynein-only (green), and both
motors (red). Beads with both motors were much more likely to have direction reversals than beads with dynein
or kinesin alone (21% compared to 5% or 0%, respectively).
Figure 17. Additional Analysis of Saltatory Motion. The fraction of traces (50 seconds, or as long as the bead
remained in the field of view) which exhibited at least one reversal versus the threshold segment length (i.e.
distance of runs in each direction before and after a reversal point) used to define a reversal event. Although
dynein-only beads have frequent reversals with smaller threshold values, beads with both motors clearly have
more reversals with larger segment lengths (i.e. ≥ 500 nm in each direction before and after reversal).
0 1 2 3 40
0.1
0.2
0.3
0.4
0.5
0.6
0.7
0.8
0.9
1
Number of Reversals per Trace
Norm
aliz
ed C
ount
Number of Reversals (>500nm) per Trace
Kinesin (n=33)
Dynein (n=37)
Both (n=69)
Bead Type
% of Traces with
Reversal(s)
Mean # Reversals per Trace
Mean # Revs for
Traces with ≥1 Reversal
Kinesin 0% 0 --
Dynein 5.56% 0.083 1.5
Both 20.59% 0.353 1.71
0 100 200 300 400 500 600 700 800 900 10000
0.1
0.2
0.3
0.4
0.5
0.6
0.7
0.8
0.9
1
Reversal Definition Cutoff (nm)
Fra
ction o
f T
races w
ith R
evers
al(s)
Fraction of Traces with Reversal(s) Versus Reversal Definition Cutoff
Kinesin
Dynein
Both
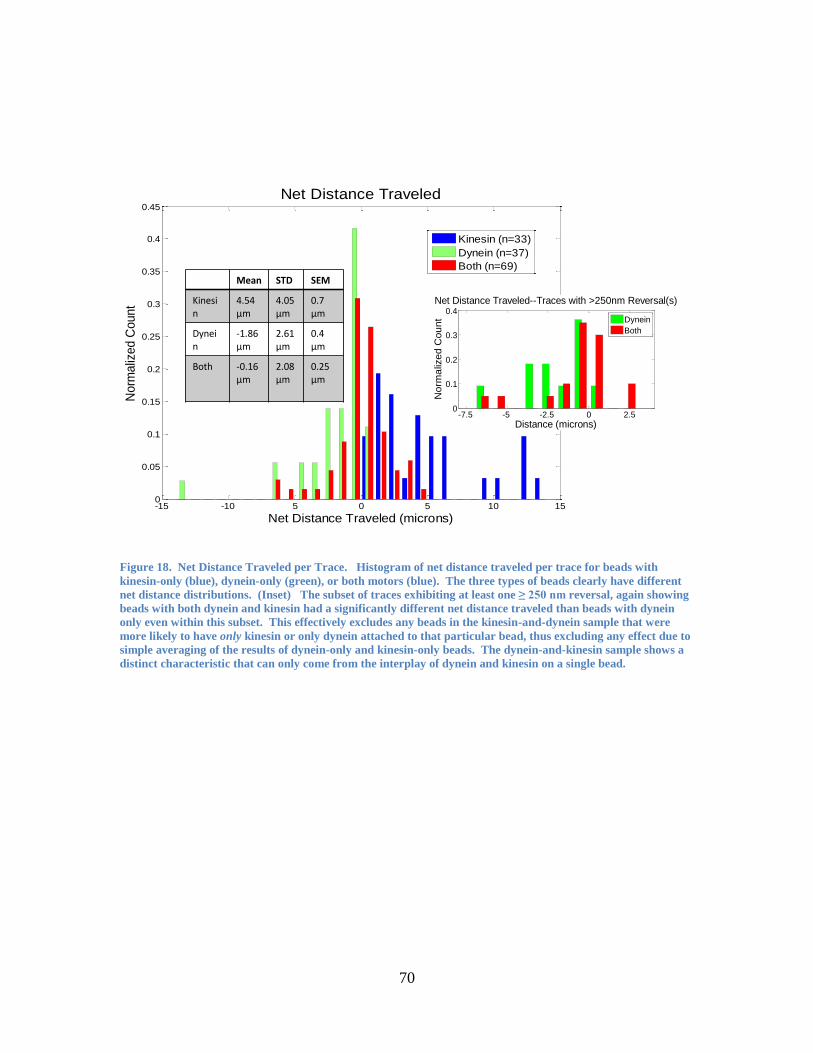
70
Figure 18. Net Distance Traveled per Trace. Histogram of net distance traveled per trace for beads with
kinesin-only (blue), dynein-only (green), or both motors (blue). The three types of beads clearly have different
net distance distributions. (Inset) The subset of traces exhibiting at least one ≥ 250 nm reversal, again showing
beads with both dynein and kinesin had a significantly different net distance traveled than beads with dynein
only even within this subset. This effectively excludes any beads in the kinesin-and-dynein sample that were
more likely to have only kinesin or only dynein attached to that particular bead, thus excluding any effect due to
simple averaging of the results of dynein-only and kinesin-only beads. The dynein-and-kinesin sample shows a
distinct characteristic that can only come from the interplay of dynein and kinesin on a single bead.
-15 -10 5 0 5 10 150
0.05
0.1
0.15
0.2
0.25
0.3
0.35
0.4
0.45
Net Distance Traveled (microns)
Norm
aliz
ed C
ount
Net Distance Traveled
Kinesin (n=33)
Dynein (n=37)
Both (n=69)
Mean STD SEM
Kinesin
4.54 µm
4.05 µm
0.7 µm
Dynein
-1.86 µm
2.61 µm
0.4 µm
Both -0.16µm
2.08µm
0.25 µm
-7.5 -5 -2.5 0 2.50
0.1
0.2
0.3
0.4
Distance (microns)
No
rma
lize
d C
ou
nt
Net Distance Traveled--Traces with >250nm Reversal(s)
Dynein
Both
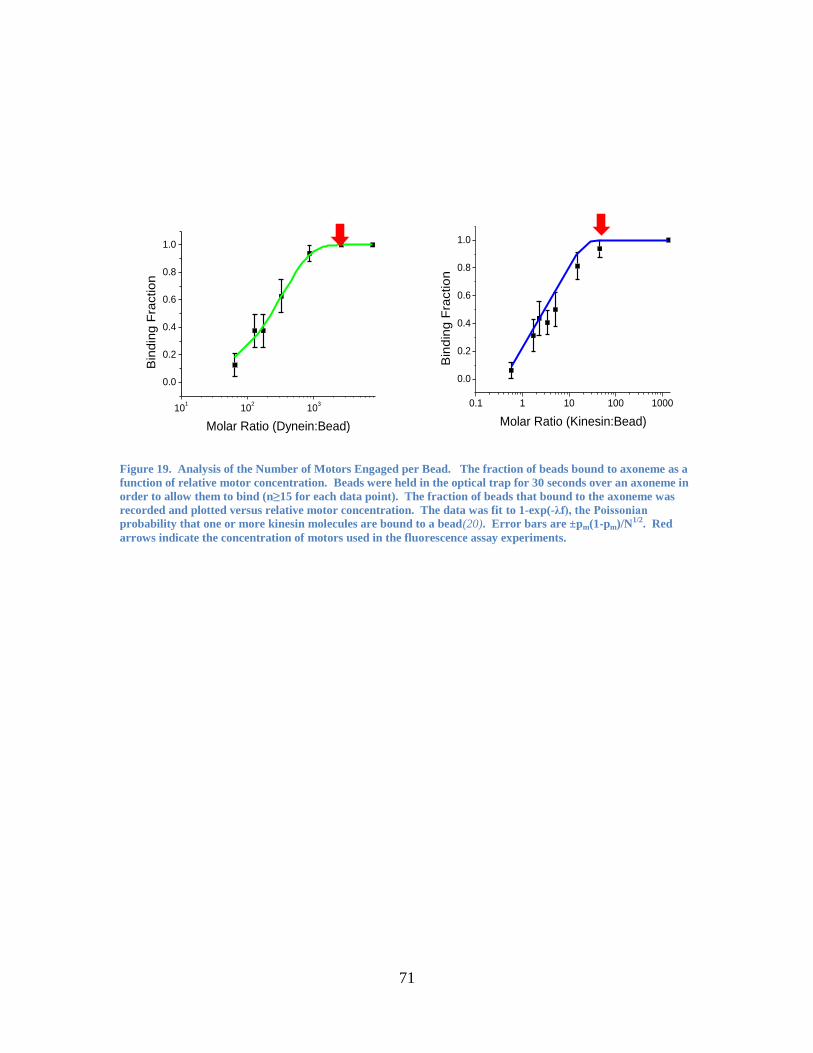
71
Figure 19. Analysis of the Number of Motors Engaged per Bead. The fraction of beads bound to axoneme as a
function of relative motor concentration. Beads were held in the optical trap for 30 seconds over an axoneme in
order to allow them to bind (n≥15 for each data point). The fraction of beads that bound to the axoneme was
recorded and plotted versus relative motor concentration. The data was fit to 1-exp(-λf), the Poissonian
probability that one or more kinesin molecules are bound to a bead(20). Error bars are ±pm(1-pm)/N1/2. Red
arrows indicate the concentration of motors used in the fluorescence assay experiments.
0.1 1 10 100 1000
0.0
0.2
0.4
0.6
0.8
1.0
Bin
din
g F
ractio
n
Molar Ratio (Kinesin:Bead)10
110
210
3
0.0
0.2
0.4
0.6
0.8
1.0
Bin
din
g F
ractio
n
Molar Ratio (Dynein:Bead)

72
Figure 20. Stall Forces for Beads with Dynein-only. Stall force histogram for beads with dynein only (with the
same dynein:bead ratio as was used in the fluorescence bead assays). Peaks at ~1-2 pN and ~3-4 pN indicate
that 1-2 motors per bead were simultaneously interacting with the microtubule. Rarely, 3 motors were
simultaneously engaged.
Figure 21. Stall Forces for Beads with Both Motors. Stall force histogram for beads with both dynein and
kinesin dynein only (with the same dynein:bead and kinesin:bead ratios as were used in the fluorescence bead
assays). Smaller (500 nm) kinesin-beads were used as a reference to designate the directionality of each
axoneme. 1.2 µm beads with both motors were then brought into contact with the same axoneme and stall forces
measured in each direction. Peaks in the – end direction at ~1-2 pN and ~3-4 pN indicate that 1-2 dynein motors
per bead were simultaneously interacting with the microtubule. The single major peak at ~5-7 pN in the + end
direction shows that a single kinesin was generally pulling the bead at a time. Thus, we conclude that our beads
had, on average, ~1-2 dyneins and ~1 kinesin simultaneously interacting with the microtubule.
0 1 2 3 4 5 60
5
10
15
Stall Force (pN)
Co
un
t
Dynein-only Bead Stalls
0 2 4 60
5
10
15
Stall Force (pN)
Co
un
t
Stall Forces in - Direction
0 2 4 6 8 10 120
2
4
6
8
10
Stall Force (pN)
Co
un
t
Stall Forces in + Direction

73
Figure 22. In Vivo versus In Vitro Comparison. Histogram showing the number of reversals with >500 nm run
lengths before and after the reversal per trace for beads kinesin and dynein in vitro (red) and for lipid droplets
in vivo (blue).
Figure 23. Fraction of Traces with Reversals for In Vivo versus In Vitro. The fraction of traces (50 seconds, or
as long as the bead remained in the field of view) which exhibited at least one reversal versus the threshold
segment length (i.e. distance of runs in each direction before and after a reversal point) used to define a reversal
event for beads in vitro (red) and lipid droplets in vivo (blue).
0 1 2 3 40
0.2
0.4
0.6
0.8
1
Number of >500nm Reversals per Trace
Norm
alized C
ount
Number of >500nm Reversals per Trace (in vivo vs. in vitro)
In vivo
in vitro
Type % of Traces with
Reversal(s)
Mean # Reversals per
Trace
Mean # Revs for Traces
with ≥1 Reversal
In Vivo 11.25% 0.2125 1.89
In Vitro 20.59% 0.353 1.71
0 100 200 300 400 500 600 700 800 900 10000
0.2
0.4
0.6
0.8
Fraction of Traces with Reversal(s)
Threshhold (nm)
Fra
ction
in vivo
in vitro
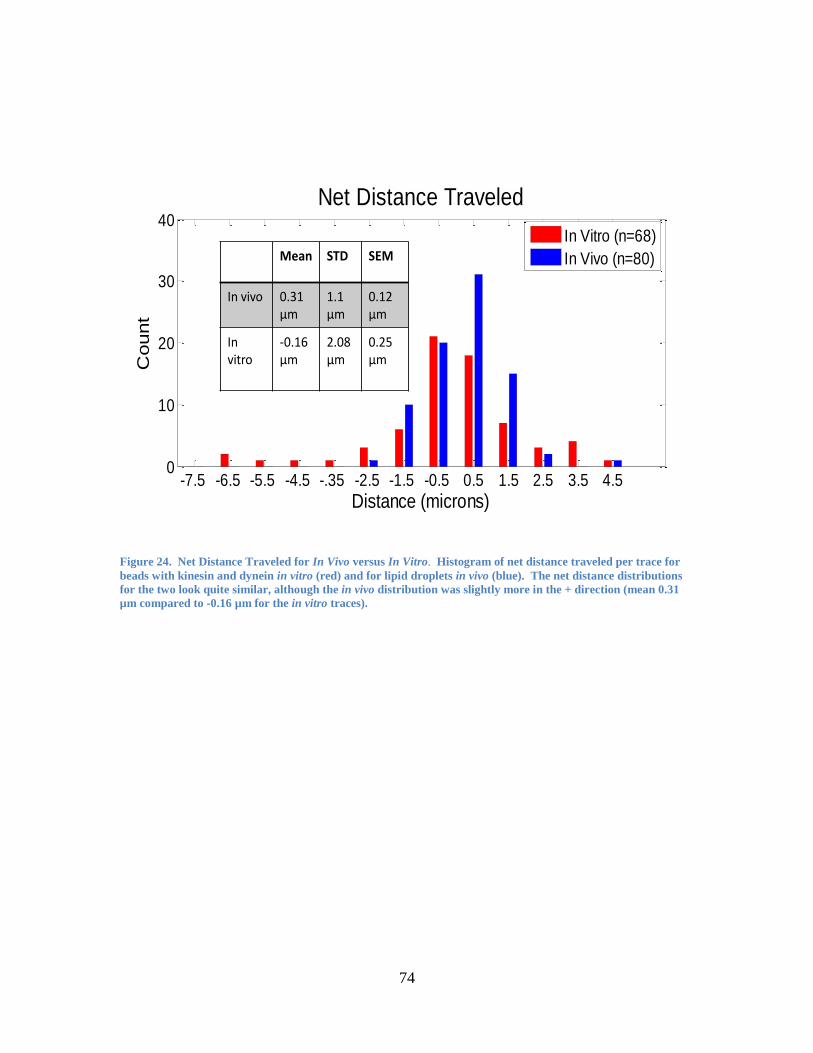
74
Figure 24. Net Distance Traveled for In Vivo versus In Vitro. Histogram of net distance traveled per trace for
beads with kinesin and dynein in vitro (red) and for lipid droplets in vivo (blue). The net distance distributions
for the two look quite similar, although the in vivo distribution was slightly more in the + direction (mean 0.31
µm compared to -0.16 µm for the in vitro traces).
-7.5 -6.5 -5.5 -4.5 -.35 -2.5 -1.5 -0.5 0.5 1.5 2.5 3.5 4.50
10
20
30
40
Distance (microns)
Count
Net Distance Traveled
In Vitro (n=68)
In Vivo (n=80)Mean STD SEM
In vivo 0.31µm
1.1 µm
0.12 µm
Invitro
-0.16µm
2.08µm
0.25 µm

75
Figure 25. Net Distances for Varying Motor Ratios—Kinesin. Results of varying the ratio of kinesin:dynein
added to the fluorescent beads. The dynein concentration was held constant (500 nM), while the relative amount
of kinesin was varied. A histogram for net distance traveled for each kinesin:dynein ratio. The top histogram
shows beads with kinesin only, and the bottom histogram shows beads with dynein only. Similar to what is seen
in Figure 27, the net distance distribution varies surprisingly little over a wide range of kinesin:dynein ratios.
Figure 26. Velocities for Varying Motor Ratios—Kinesin. A histogram showing the average velocity for
constant velocity segments of the traces for each kinesin:dynein ratio. (The y axis shows the total length of
segments for each velocity bin, normalized). Again, the top histogram shows beads with kinesin only, and the
bottom histogram shows beads with dynein only. Also similar to Supplementary Figure 6, the velocity
distribution gradually shifts with the motor ratio.
0
0.2
No
rma
lize
d C
ou
nt
Net Distances for Varying Kinesin Conc.
0
0.4
0
0.4
0
0.4
0
0.4
0
0.4
0
0.4
0
0.4
0
0.4
0
0.4
0
0.4
0
0.5
-15 -10 -5 0 5 10 15 200
0.5
Net Distance Traveled (microns)
kinesin only, n=33
8x more kinesin, n=39
4x more kinesin, n=75
2x more kinesin, n=75
1.3x more kinesin, n=40
"normal" ratio, n=69
1.25x less kinesin, n=55
1.5x less kinesin, n=30
1.75x less kinesin, n=54
4x less kinesin, n=61
8x less kinesin, n=35
16x less kinesin, n=41
dynein only, n=37
0
0.4
Velocities for Varying Kinesin Conc.
0
0.4
0
0.5
0
0.4
0
0.4
0
0.4
0
0.4
Tota
l Length
of S
egm
ents
in V
elo
city B
in (
norm
aliz
ed)
0
0.4
0
0.4
0
0.4
0
0.4
0
0.4
-2 -1.50
0.4
Velocity of Segment (microns/sec)
kinesin only, n=33
8x more kinesin, n=39
4x more kinesin, n=75
2x more kinesin, n=75
1.3x more kinesin, n=40
"normal" ratio, n=69
1.25x less kinesin, n=55
1.5x less kinesin, n=30
1.75x less kinesin, n=54
4x less kinesin, n=61
8x less kinesin, n=35
16x less kinesin, n=41
dynein only, n=37

76
Figure 27. Net Distances for Varying Motor Ratios—Dynein. Results of varying the ratio of kinesin:dynein
added to the fluorescent beads. The kinesin concentration was held constant (6.6 nM), while the relative amount
of dynein was varied. A histogram for net distance traveled for each kinesin:dynein ratio. The top histogram
shows beads with kinesin only, and the bottom histogram shows beads with dynein only. The net distance
distribution varies surprisingly little over a wide range of dynein:kinesin ratios.
Figure 28. Velocities for Varying Motor Ratios—Dynein. A histogram showing the average velocity for
constant velocity segments of the traces for each kinesin:dynein ratio. (The y axis shows the total length of
segments for each velocity bin, normalized). Again, the top histogram shows beads with kinesin only, and the
bottom histogram shows beads with dynein only. The velocity distribution shifts slightly with the motor ratio,
although still less than expected.
0
0.1
0.2
Net Distances with Varying Dynein Conc.
Norm
aliz
ed C
ount
0
0.2
0.4
0
0.5
0
0.1
0.2
0
0.2
0.4
0
0.2
0.4
0
0.5
-15 -10 -5 0 5 10 15 200
0.5
Net Distance Traveled (microns)
0
0.1
0.2
kinesin only, n=33
16x less dynein, n=20
8x less dynein, n=28
4x less dynein, n=21
2x less dynein, n=35
"normal" ratio, n=69
2x more dynein, n=33
4x more dynein, n=7
dynein only, n=37
0
0.4
Velocities with Varying Dynein Conc.
0
0.4
0
0.4
0
0.4
0
0.4
Tota
l Length
of S
egm
ents
in V
elo
city B
in (
Norm
aliz
ed)
0
0.4
0
0.4
0
0.4
-2 -1.5 -1 -0.5 0 0.5 1 1.5 20
0.4
Velocity of Segment (microns/sec)
Kinesin only, n=33
16x less dynein, n=20
8x less dynein, n=28
4x less dynein, n=21
2x less dynein, n=35
normal ratio, n=69
2x more dynein, n=33
4x more dynein, n=7
Dynein only, n=37

77
Figure 29. Results of Motors Encountering Other Beads. The outcome of bead collision events for beads with
kinesin-only (blue), dynein-only (green), or both motors (red). Beads with both motors were more likely to
reverse directions upon colliding with another bead.
Reversal Stuck Push Other Bead Dissociate0
5
10
15
Bead Collision Events
Reversal Stuck Push Other Bead Dissociate0
10
20
30
Reversal Stuck Push Other Bead Dissociate0
20
40
60
Co
unt
both
dynein only
kinesin only

78
Figure 30. Reversals Allow Successful Bypassing of Microtubule Intersection. A bead bypasses microtubule
blockade after reversing directions twice. The microtubules are labeled in blue, with a circle designating the
microtubule intersection area. The graph to the right shows the bead hitting the blockade, moving back towards
the – end, then repeating the attempt and successfully passing. Select images from the movie. Scalebar =1 µm.
+
-
+ end
0
500
1000
1500
2000
2500
3000
3500
4000
0 10 20 30
Po
siti
on
(n
m)
Time (s)- end+
-
0 s 14.5 s 15.2 s11.2 s 22.6 s

79
Figure 31. Reversals Allow Successful Bypassing of Tau Protein Obstacle. A bead is able to bypass a patch of
tau proteins. Tau proteins are labeled in blue. The graph (right) shows that the bead first moves to the right
(the + end) but reverses directions upon encountering the large tau patch. After moving towards the – end, it
again reverses and is able to pass the patch on the second try. Select images from the movie. Scalebar =1 µm.
0
500
1000
1500
2000
2500
3000
0 10 20 30 40 50
Po
siti
on
(n
m)
Time (s)-20 0 20 40
+ end
- end
+
-
0 s 30 s20 s15 s8 s+
-

80
Figure 32. Additonal Examples of Motors Encountering Tau Protein Obstacles. In both cases, the + end of the
microtubule is on the right and the – end on the left. Tau proteins are labeled in blue (microtubule are not
labeled in this instances). The kymographs below show the movement of the kinesin-and-dynein beads. Scale
bars are 2 µm (horizontal) and 2 seconds (vertical). Scalebars for movie images=1 µm. (Left) A bead bypasses
several tau patches after apparently making short, quick reversals at each one. To the right of the kymograph
are select images from the movie. (Right) A bead is unable to bypass two large patch of tau proteins. The
kymograph below shows that the bead appears to be stuck between two large tau patches, hitting one, reversing
directions, hitting the other, and reversing again. Select images from the movie are to the right of the
kymograph.
0
30
60
+-0 s
16 s
21.5 s
23 s
30 s
3.3 s
- +0
30
60
0 s
2.3 s
11.6 s
13.8 s
19 s
+-- +
AB

81
Figure 33. Optical Trap ―Snap-back‖ Experimental Setup. A cartoon depiction illustrating how trap snap-back
experiments were conducted. A bead with motors of one type is held in the optical trap and allowed to bind to
an microtubule. The piezo stage is then stepped in the direction that the motor would normally walk, which
creates a force from the trap in the backwards direction (depicted as a spring in the cartoon). As the ―spring‖ is
stretched more and more as the piezo is stepped, the backward force becomes greater and greater until the
motor reaches its stall force and releases from the microtubule. At this point, the bead snaps back to the center
of the trap, and the motor rebinds. (Right) A simplified version of the expected graph of net motor motion for a
―normal‖ motor. The motor stays bound as the piezo is stepped but eventually releases and snaps back, causing
the net motor position to suddenly jump down.
+-Piezo Stage
+-Piezo Stage
+-Piezo Stage
Time
Net
Mo
tor
Posi
tio
n
Expected Result for Kinesin

82
Figure 34. Piezo Step-Back Results for Kinesin-only Beads. Effects of stepping piezo backwards to simulate
opposing motors in the optical trap. Net position (bead position in the trap minus the position of the piezo stage
as it is stepped back) is in blue. Red line shows the Student T-test fit. The motor’s normal direction (i.e. the +
end of microtubule for kinesin) is designated as the positive end of the y-axis. The kinesin mostly holds on to the
microtubule with a few small backward steps, but then releases from the microtubule as the stall-force is
reached, causing the bead to ―snap back,‖ as expected.
34
0 0.5 1 1.50
50
100
150
200
250
300
Time (s)
Positio
n (
nm
)Kinesin with Piezo Step-Back
Net Kinesin Position
T-test Fit

83
Figure 35. Piezo Step-Back Results for Mammalian Dynein-only Beads. Effects of stepping piezo backwards to
simulate opposing motors in the optical trap for beads with mammalian dynein. Net position (bead position in
the trap minus the position of the piezo stage as it is stepped back) is in blue. Red line shows the Student T-test
fit. The motor’s normal direction (i.e. the - end of microtubule for dynein) is designated as the positive end of
the y-axis. The trace showing mammalian dynein taking rapid large backwards steps as the piezo is stepped
back. The motor does not release from the microtubule but instead rapidly walks backwards. Examples are
seen in the green circles (and corresponding zoomed in insets).
35
0 0.5 1 1.5 2-100
0
100
200
300
400
500
Time (s)
Positio
n (
nm
)
Mammalian Dynein with Piezo Step-Back
Net Dynein Position
T-test Fit0.34 0.36 0.38 0.4 0.42200
250
300
350
Time (s)
Positio
n (
nm
)
-18
-29.7
-30.6
-27 -14.8
+11.7
-8.2
1.18 1.2 1.22 1.24 1.26
80
100
120
140
160
180
200
220
Time (s)
Positio
n (
nm
)
+15.5
+12.3
-48.2
+15.7-37.4
-28.4
-22.6

84
Figure 36. Piezo Step-Back Results for Yeast Dynein-only Beads. Effects of stepping piezo backwards to
simulate opposing motors in the optical trap for beads with yeast dynein. Net position (bead position in the trap
minus the position of the piezo stage as it is stepped back) is in blue. Red line shows the Student T-test fit. The
motor’s normal direction (i.e. the - end of microtubule for dynein) is designated as the positive end of the y-axis.
A bead with yeast-dynein in place of mammalian-dynein also shows ―snap back‖ behavior. The yeast dynein
does take some backwards steps, but mostly holds on to the microtubule tenaciously until snapping back after
the stall force is reached, in contrast to mammalian dynein.
36
0 0.2 0.4 0.6 0.8 1 1.2 1.4 1.6 1.80
100
200
300
400
500
600
700
800
900
Time (s)
Positio
n (
nm
)
Yeast Dynein with Piezo Step-Back
Net Position
T-test fit

85
Figure 37. Comparison of ―Snap-Back‖ Events for Kinesin, Mammalian Dynein, and Yeast Dynein. Optical
trap traces were fit using Student’s T-test. Traces were then scored as having a ―snap-back‖ event if the T-test
fit had at least one step with a size larger than a given threshold limit. Threshold limits were set at 50 nm, 75
nm, or 100 nm. (It was assumed that a step of this magnitude indicated a full release from the microtubule
rather than an actual motor step.) Mammalian dynein traces showed significantly less snap-back events at all
threshold limits, indicating that this motor type was more likely to take backward steps but remain engaged
with the microtubule rather than releasing. (See also Figures 34-36.)
50 75 1000
10
20
30
40
50
60
70
80
90
100
"Snap back" cutoff length (nm)
Perc
ent
of
traces w
ith s
nap b
ack e
vent(
s)
"Snap back" Event Comparison
mammalian dynein (n=25)
kinesin (n=21)
yeast dynein (n=9)

86
Figure 38. Modified Tug-of-War. A depiction of our hypothesis that dynein does not release from the
microtubule while the cargo is moving in the + end direction, but rather walks backwards with kinesin. When
kinesin detaches from the microtubule, the dynein takes over and takes the cargo in the – direction.
+- +-
Dynein walks backwards with
kinesin
Kinesin detaches and dynein walks
forwards
38

87
Figure 39. Modified Tug-of-War Model Allows Cargos to Bypass Roadblocks. (A) Kinesin and dynein are both
attached to the same cargo. The cargo moves in the + end direction, with kinesin walking forward and dynein
walking backwards with kinesin. (B) The cargo encounters a roadblock, such as a microtubule-associated
protein (MAP), and the kinesin releases from the microtubule. (C) The dynein is now free to walk in its
preferred – end direction. As it does so, it wanders to a new protofilament by taking a few off-axis side steps.
(D) The kinesin reattaches to the microtubule, and the cargo starts moving in the + end direction once more.
However, it is now able to bypass the roadblock by walking past it on a different protofilament.
+
+
+
+
-
-
-
-
Road Block (MAP)
A
B
C
D

88
References
1. M. B. Elowitz, M. G. Surette, P. Wolf, J. B. Stock, S. Leibler, "Protein Mobility in the
Cytoplasm of Escherichia coli," J. Bacteriol. 181, 197 (1999).
2. K. M. Slade, B. L. Steele, G. J. Pielak, N. L. Thompson, "Quantifying Green
Fluorescent Protein Diffusion in Escherichia coli by Using Continuous Photobleaching
with Evanescent Illumination," J Phys Chem B 113, 4837 (2009).
3. N. Hirokawa, R. Takemura, "Molecular motors in neuronal development, intracellular
transport and diseases," Curr. Opin. Neurobiol. 14, 564 (2004).
4. E. Mandelkow, E. Mandelkow, "Tau in Alzheimer's disease," Trends Cell Biol. 8, 425
(1998).
5. R. Dixit, J. R. Ross, Y. E. Goldman, E. L. Holzbaur, "Differential regulation of dynein
and kinesin motor proteins by tau," Science 319, 1086 (2008).
6. M. Vershinin, J. Xu, D. S. Razafsky, S. J. King, S. P. Gross, "Multiple-motor based
transport and its regulation by Tau," Proc. Natl. Acad. Sci. U. S. A. 104, 87 (2007).
7. S. P. Gilbert, K. A. Johnson, "Expression, purification, and characterization of the
Drosophila kinesin motor domain produced in Escherichia coli," Biochemistry (N. Y. ) 32,
4677 (1993).
8. A. Yildiz, M. Tomishige, R. D. Vale, P. R. Selvin, "Kinesin Walks Hand-Over-Hand,"
Science 303, 676 (2004).
9. K. Svoboda, C. F. Schmidt, B. J. Schnapp, S. M. Block, "Direct observation of kinesin
stepping by optical trapping interferometry," Nature 365, 721 (1993).
10. W. Hua, E. C. Young, M. L. Fleming, J. Gelles, "Coupling of kinesin steps to ATP
hydrolysis," Nature 388, 390 (1997).
11. M. J. Schnitzer, S. M. Block, "Kinesin hydrolyses one ATP per 8-nm step," Nature
388, 386 (1997).
12. D. L. Coy, M. Wagenbach, J. Howard, "Kinesin Takes One 8-nm Step for Each ATP
That It Hydrolyzes," Journal of Biological Chemistry 274, 3667 (1999).
13. N. R. Guydosh, S. M. Block, "Backsteps induced by nucleotide analogs suggest the
front head of kinesin is gated by strain," Proc. Natl. Acad. Sci. U. S. A. 103, 8054 (2006).
89
14. Y. Miyazono, M. Hayashi, P. Karagiannis, Y. Harada, H. Tadakuma, "Strain through
the neck linker ensures processive runs: a DNA-kinesin hybrid nanomachine study,"
EMBO J. 29, 93 (2010).
15. E. Toprak, A. Yildiz, M. T. Hoffman, S. S. Rosenfeld, P. R. Selvin, "Why kinesin is
so processive," Proceedings of the National Academy of Sciences(2009).
16. A. Yildiz, M. Tomishige, A. Gennerich, R. D. Vale, "Intramolecular Strain
Coordinates Kinesin Stepping Behavior along Microtubules," Cell 134, 1030 (2008).
17. S. M. Block, "Kinesin motor mechanics: Binding, stepping, tracking, gating, and
limping," Biophys. J. 92, 2986 (2007).
18. S. Ray, E. Meyhöfer, R. A. Milligan, J. Howard, "Kinesin follows the microtubule's
protofilament axis." J. Cell Biol. 121, 1083 (1993).
19. K. Visscher, M. J. Schnitzer, S. M. Block, "Single kinesin molecules studied with a
molecular force clamp," Nature 400, 184 (1999).
20. K. Svoboda, S. M. Block, "Force and velocity measured for single kinesin
molecules." Cell 77, 773 (1994).
21. E. Meyhofer, J. Howard, "The Force Generated by a Single Kinesin Molecule
Against an Elastic Load," Proc. Natl. Acad. Sci. U. S. A. 92, 574 (1995).
22. N. J. Carter, R. A. Cross, "Mechanics of the kinesin step," Nature 435, 308 (2005).
23. F. J. Kull, E. P. Sablin, R. Lau, R. J. Fletterick, R. D. Vale, "Crystal structure of the
kinesin motor domain reveals a structural similarity to myosin," Nature 380, 550 (1996).
24. A. F. Neuwald, L. Aravind, J. L. Spouge, E. V. Koonin, AAA : A class of chaperone-
like ATPases associated with the assembly, operation, and disassembly of protein
complexes .
25. S. R. Gill et al., "Dynactin, a Conserved, Ubiquitously Expressed Component of an
Activator of Vesicle Motility Mediated by Cytoplasmic Dynein," J. Cell Biol. 115, pp.
1639 (1991).
26. S. W. Deacon et al., "Dynactin Is Required for Bidirectional Organelle Transport," J.
Cell Biol. 160, pp. 297 (2003).
27. S. J. King, T. A. Schroer, "Dynactin increases the processivity of the cytoplasmic
dynein motor," Nat. Cell Biol. 2, 20 (2000).

90
28. T. Culver-Hanlon, S. A. Lex, A. D. Stephens, N. J. Quintyne, S. J. King, "A
microtubule-binding domain in dynactin increases dynein processivity by skating along
microtubules," Nat. Cell Biol. 8, 264 (2006).
29. J. R. Kardon, S. L. Reck-Peterson, R. D. Vale, "Regulation of the processivity and
intracellular localization of Saccharomyces cerevisiae dynein by dynactin," Proceedings
of the National Academy of Sciences(2009).
30. C. M. Waterman-Storer et al., "The interaction between cytoplasmic dynein and
dynactin is required for fast axonal transport," Proceedings of the National Academy of
Sciences 94, 12180 (1997).
31. S. Toba, T. M. Watanabe, L. Yamaguchi-Okimoto, Y. Y. Toyoshima, H. Higuchi,
"Overlapping hand-over-hand mechanism of single molecular motility of cytoplasmic
dynein," Proceedings of the National Academy of Sciences 103, 5741 (2006).
32. S. A. Burgess, M. L. Walker, H. Sakakibara, P. J. Knight, K. Oiwa, "Dynein structure
and power stroke," Nature 421, 715 (2003).
33. M. Samsó, M. Radermacher, J. Frank, M. P. Koonce, "Structural characterization of a
dynein motor domain," J. Mol. Biol. 276, 927 (1998).
34. C. Cho, S. L. Reck-Peterson, R. D. Vale, "Regulatory ATPase Sites of Cytoplasmic
Dynein Affect Processivity and Force Generation," Journal of Biological Chemistry 283,
25839 (2008).
35. T. Kon, T. Mogami, R. Ohkura, M. Nishiura, K. Sutoh, "ATP hydrolysis cycle-
dependent tail motions in cytoplasmic dynein," Nat. Struct. Mol. Biol. 12, 513 (2005).
36. T. Kon, M. Nishiura, R. Ohkura, Y. Y. Toyoshima, K. Sutoh, "Distinct Functions of
Nucleotide-Binding/Hydrolysis Sites in the Four AAA Modules of Cytoplasmic Dynein,"
Biochemistry (N. Y. ) 43, 11266 (2004).
37. S. L. Reck-Peterson, R. D. Vale, "Molecular dissection of the roles of nucleotide
binding and hydrolysis in dynein's AAA domains in Saccharomyces cerevisiae,"
Proceedings of the National Academy of Sciences of the United States of America 101,
1491 (2004).
38. I. R. Gibbons, A. J. Rowe, "Dynein: A Protein with Adenosine Triphosphatase
Activity from Cilia," Science 149, 424 (1965).
39. I. R. Gibbons, "STUDIES ON THE PROTEIN COMPONENTS OF CILIA FROM
TETRAHYMENA PYRIFORMIS," Proceedings of the National Academy of Sciences
50, 1002 (1963).

91
40. B. M. Paschal, R. B. Vallee, "Retrograde transport by the microtubule-associated
protein MAP 1C," Nature 330, 181 (1987).
41. R. Mallik, B. C. Carter, S. A. Lex, S. J. King, S. P. Gross, "Cytoplasmic dynein
functions as a gear in response to load," Nature 427, 649 (2004).
42. A. Gennerich, A. P. Carter, S. L. Reck-Peterson, R. D. Vale, "Force-Induced
Bidirectional Stepping of Cytoplasmic Dynein," Cell 131, 952 (2007).
43. R. Mallik, D. Petrov, S. A. Lex, S. J. King, S. P. Gross, "Building Complexity: An In
Vitro Study of Cytoplasmic Dynein with In Vivo Implications," Curr. Biol. 15, 2075
(2005).
44. J. L. Ross, K. Wallace, H. Shuman, Y. E. Goldman, E. L. F. Holzbaur, "Processive
bidirectional motion of dynein-dynactin complexes in vitro," Nat. Cell Biol. 8, 562
(2006).
45. Z. Wang, M. P. Sheetz, "One-dimensional diffusion on microtubules of particles
coated with cytoplasmic dynein and immunoglobulins," Cell Struct. Funct. 24, 373
(1999).
46. M. Miura, A. Matsubara, T. Kobayashi, M. Edamatsu, Y. Y. Toyoshima,
"Nucleotide-dependent behavior of single molecules of cytoplasmic dynein on
microtubules in vitro," FEBS Lett. 584, 2351 (2010).
47. S. Reck-Peterson et al., "Single-Molecule Analysis of Dynein Processivity and
Stepping Behavior," Cell 126, 335 (2006).
48. Z. Wang, S. Khan, M. P. Sheetz, "Single cytoplasmic dynein molecule movements:
characterization and comparison with kinesin," Biophys. J. 69, 2011 (1995).
49. R. B. Vallee, J. C. Williams, D. Varma, L. E. Barnhart, "Dynein: An ancient motor
protein involved in multiple modes of transport," J. Neurobiol. 58, 189 (2004).
50. L. I. Rebhun, "Structural aspects of saltatory particle movement," J. Gen. Physiol. 50,
223 (1967).
51. S. Klumpp, R. Lipowsky, "Active diffusion of motor particles," Phys. Rev. Lett.
95(2005).
52. M. A. Welte, "Bidirectional Transport along Microtubules," Current Biology 14,
R525 (2004).
53. V. Muresan, C. P. Godek, T. S. Reese, B. J. Schnapp, "Plus-end motors override
minus-end motors during transport of squid axon vesicles on microtubules." The Journal
of Cell Biology 135, 383 (1996).
92
54. S. P. Gross, M. A. Welte, S. M. Block, E. F. Wieschaus, "Coordination of Opposite-
Polarity Microtubule Motors," J. Cell Biol. 156, pp. 715 (2002).
55. A. Uchida, N. H. Alami, A. Brown, "Tight functional coupling of kinesin-1A and
dynein motors in the bidirectional transport of neurofilaments," Mol. Biol. Cell 20, 4997
(2009).
56. M. Martin et al., "Cytoplasmic dynein, the dynactin complex, and kinesin are
interdependent and essential for fast axonal transport." Mol. Biol. Cell 10, 3717 (1999).
57. S. Ling, P. S. Fahrner, W. T. Greenough, V. I. Gelfand, "Transport of Drosophila
fragile X mental retardation protein-containing ribonucleoprotein granules by kinesin-1
and cytoplasmic dynein," Proc. Natl. Acad. Sci. U. S. A. 101, 17428 (2004).
58. A. D. Pilling, D. Horiuchi, C. M. Lively, W. M. Saxton, "Kinesin-1 and Dynein Are
the Primary Motors for Fast Transport of Mitochondria in Drosophila Motor Axons,"
Mol. Biol. Cell 17, 2057 (2006).
59. C. Kural et al., "Kinesin and Dynein Move a Peroxisome in Vivo: A Tug-of-War or
Coordinated Movement?" Science 308, 1469 (2005).
60. V. Levi, A. S. Serpinskaya, E. Gratton, V. Gelfand, "Organelle Transport along
Microtubules in Xenopus Melanophores: Evidence for Cooperation between Multiple
Motors," Biophys. J. 90, 318 (2006).
61. J. A. Laib, J. A. Marin, R. A. Bloodgood, W. H. Guilford, "The reciprocal
coordination and mechanics of molecular motors in living cells," Proceedings of the
National Academy of Sciences(2009).
62. M. J. I. Müller, S. Klumpp, R. Lipowsky, "Tug-of-war as a cooperative mechanism
for bidirectional cargo transport by molecular motors," Proceedings of the National
Academy of Sciences 105, 4609 (2008).
63. R. D. Vale, F. Malik, D. Brown, "Directional instability of microtubule transport in
the presence of kinesin and dynein, two opposite polarity motor proteins." J. Cell Biol.
119, 1589 (1992).
64. S. Ally, A. G. Larson, K. Barlan, S. E. Rice, V. I. Gelfand, "Opposite-polarity motors
activate one another to trigger cargo transport in live cells," The Journal of Cell Biology
187, 1071 (2009).
65. V. Soppina, A. K. Rai, A. J. Ramaiya, P. Barak, R. Mallik, "Tug-of-war between
dissimilar teams of microtubule motors regulates transport and fission of endosomes,"
Proceedings of the National Academy of Sciences 106, 19381 (2009).

93
66. A. G. Hendricks et al., "Motor Coordination via a Tug-of-War Mechanism Drives
Bidirectional Vesicle Transport," Current Biology 20, 697 (2010).
67. M. Schuster, R. Lipowsky, M. Assmann, P. Lenz, G. Steinberg, "Transient binding of
dynein controls bidirectional long-range motility of early endosomes," Proc. Natl. Acad.
Sci. U. S. A. 108, 3618 (2011).
68. T. Fallesen, J. Macosko, G. Holzwarth, "Force–velocity relationship for multiple
kinesin motors pulling a magnetic bead," European Biophysics Journal, 1 (2011).
69. A. Yildiz et al., "Myosin V Walks Hand-Over-Hand: Single Fluorophore Imaging
with 1.5-nm Localization," Science 300, 2061 (2003).
70. S. M. Block, L. S. Goldstein, B. J. Schnapp, "Bead movement by single kinesin
molecules studied with optical tweezers," Nature 348, 348 (1990).
71. H. Lu, Y. Ali, c. S. Bookwalter, D. M. Warshaw, K. M. Trybus, "Diffusive
Movement of Processive Kinesin-1 on Microtubules," Traffic 10, 1429 (2009).
72. D. W. Pierce, R. D. Vale, "Assaying processive movement of kinesin by fluorescence
microscopy." Meth. Enzymol. 298, 154 (1998).
73. J. B. Bingham, S. J. King, T. A. Schroer, in Methods in Enzymology, Richard B.
Valee, Ed. (Academic Press, , 1998), pp. 171-184, vol. Volume 298.
74. S. Kar, J. Fan, M. J. Smith, M. Goedert, L. A. Amos, "Repeat motifs of tau bind to
the insides of microtubules in the absence of taxol," EMBO J. 22, 70 (2003).
75. N. M. Green, "Avidin," Adv. Protein Chem. 29, 85 (1975).
76. T. Courtheoux et al., "Dynein participates in chromosome segregation in fission
yeast," Biology of the Cell 99, 627 (2007).
77. N. J. Carter, R. A. Cross, "Mechanics of the kinesin step," Nature 435, 308 (2005).
78. M. Nishiyama, H. Higuchi, T. Yanagida, "Chemomechanical coupling of the forward
and backward steps of single kinesin molecules," Nat. Cell Biol. 4, 790 (2002).
79. H. Li, D. J. DeRosier, W. V. Nicholson, E. Nogales, K. H. Downing, "Microtubule
Structure at 8 Å Resolution," Structure 10, 1317 (2002).
80. R. D. Vale, "The Molecular Motor Toolbox for Intracellular Transport," Cell 112,
467 (2003).

94
Appendix: Details of Analysis Program
Section A1: Making the Microtubule Mask
1. A movie is read in which shows the fluorescent microtubules. The program averages
the frames together to get rid of some noise, then thresholds the image to give a black
and white picture of the brightest areas (which are the microtubules, plus some noise).
The user is given the option to select microtubule areas which were missed. It then
looks for areas of white pixels that are adjoining and have a large enough area and
throws out the smaller (just background noise) areas. It labels each of the remaining
white areas, and then fits them to lines.
2. The microtubule lines are made into a rectangle of arbitrary height (in this case, 15
pixels) and the length of the microtubules. It saves the endpoint of each rectangle
along with the angle it makes with the horizontal.
3. A "mask" is created that can be applied to other movies. This is an image that is 0
(black) everywhere except where the microtubule rectangles are, where it is 1 (white).
If this mask is multiplied by an image in the data file, it "erases" spots that are not
located on the microtubules.
4. A movie of labeled truncated kinesin walking on the microtubules is then read in.
This is used to determine the directionality of the microtubules (+/- ends). First the
reference kinesin movie is summed up using the standard deviation method (the
standard deviation of each pixel is determined over time and then that value is saved

95
in that pixel position in the final summed image.) This effectively shows where the
kinesins are walking (the moving spots have a higher standard deviation, so lines of
moving kinesin are produced). Then the same line-finding method that was
previously used on the microtubule image is used to find the lines of moving kinesins
in this movie.
5. The lines of the reference kinesin movie are matched up with the lines of the
microtubules (the differences between the images are minimized) to line up the two
images and determine the offset of the microtubule image. (This is necessary because
a slide-in filter used to image the microtubules creates a significant--but not
consistent--offset between the two colors of images).
Section A2: Kymographs (determining microtubule polarity)
6. The offset-corrected mask is now applied to the full reference kinesin movie. Each
microtubule is taken individually, excised from the movie, and rotated by the angle
saved earlier to make it perfectly horizontal. Then a kymograph is created by
summing the intensity of each x position on the microtubule versus time. This shows
"tracks" of where the reference kinesin traveled. The program then fits lines to the
tracks and determines the slope to figure out which was the + direciton of the
microtubule. It sets the polarity to 0 if it is ambiguous or has traces going both ways.
(Manual input is requested to check the polarity assignment of these kymographs.)
96
7. The polarity of each microtubule is then saved along with the angle and end positions
found earlier.
Section A3: Finding Moving Spots
8. Next, the "real data" movie is read in and the mask is applied to it. The movie is then
normalized through time (the intensity of each pixel over time is summed up and then
the pixel at a given frame is divided by that intensity). This serves to eliminate (or at
least reduce) any spots that are not moving, while preserving the moving spots.
9. The normalized image is then threshholded (spots more than five times the standard
deviation of the background are kept).
10. The program then looks at the image as a 3-d matrix and finds 3-d volumes of
contiguous 1's (white areas) that are greater than the threshold volume. It also throws
out volumes that don't meet certain criteria (i.e., the path-length along the microtubule
is too short).
11. Each remaining volume is then "excised" from the stack and the corresponding area
over the corresponding frames is excised from the original data movie.
12. The excised movie is rotated by the angle of the microtubules (with the + end always
on the right) so that the microtubule direction is horizontal.

97
13. The centroid of the spot is determined as a rough estimate of the position. The y
variance of the centroid is determined for each frame. This is used to determine if the
bead is merely floating around or actually attached to the microtubule. (Floating
beads have a large y variance while attached ones have a much smaller variance.) If
the variance is too large over the whole movie, it is thrown out. If it has a "good"
section, this is trimmed out with the large variance sections cut off from the
beginning/end. The remaining movie is then written to a tiff file.
14. Matlab calls a command-line version of IDL (an image processing programming
language) to run the FIONA fitting routine typically used in our lab for FIONA
analysis (based on "Simonsin_simple_FIONA"). This is "wrapped" in a Matlab
function so that it can be called without leaving Matlab. IDL is used because its 2-D
Gaussian fitting function is vastly superior to Matlab’s.
15. The positions and errors as determined by FIONA are saved for each trace (and
written to an excel file). The program looks for errors above a given cutoff (can be set
by user) and sets the corresponding positions to NaN. If the NaN section is short
(less than 6 frames), it interpolates to find the values instead. If it is larger than 5
frames, it simply ignores that section for the rest of the analysis.
Section A4: Finding Reversals
16. Using the Recursive Douglas-Peucker Polyline Simplification algorithm, it finds
segments of roughly constant velocity and generates histograms of various measures

98
such as segment lengths, velocities, etc. Net distance traveled and ratio of net
distance to total pathlength is also calculated. Traces with a net distance of less than
50 nm are thrown out.
17. Locates places where the beads reversed direction by looking for places where the
slope changes sign with some minimum distance traveled (ie, 250 nm) on either side
of the slope change. Values such as the average distance and time between reversals
are recorded in a spreadsheet.
18. The traces are plotted in Powerpoint, and the excised movies are screened manually
to ensure the plotted trace reflects the actual movement in the movie, and to exclude
movies with multiple moving beads or other error-inducing issues.
19. Traces from experiments with identical conditions are grouped and the statistics from
the traces are compiled.