impacts and constraints evaluation of organic farming in
TRANSCRIPT
Study No. – 167
Impacts and Constraints Evaluation of Organic Farming in West
Bengal
Ranjan K. Biswas
Debanshu Majumder
Ashok Sinha
AGRO-ECONOMIC RESEARCH CENTRE
VISVA - BHARATI
SANTINIKETAN
2011

Preface The present study entitled “Impacts and constraints evaluation of Organic Farming in West Bengal” is
undertaken as a separate study designed and initiated by the Agro-Economic Research Centre, Visva – Bharati,
Santiniketan, WB. The purpose of this study is to measure the status and impacts of organic farming as an alternate
system of conventional method in West Bengal and also to identify the relevant constraints of organic farming that
hinder the adoption of this specific and scientific method of farm operation in large scale by the farming community
during the year 2009 – 10 academic programme of this centre. The study was undertaken in four villages, each from
one block. Thus four blocks from two districts (two blocks from each district) were selected for the study. The total
number of households selected for the study was 120, out of which 60 households were involved in organic farm
operation and the rest 60 households were practicing inorganic method of farming system.
In the 21st century, the ever increasing population of the country necessitates greater demand for safe and
nutritious agriculture crops and environmental amenities. Hence, efficient, equitable and sustainable use and
management of natural resources in the field of crop cultivation are necessary for economic development of region
and more so in the agrarian state like West Bengal as well as the country like India. Development, promotion and
management of appropriate technologies of organic farming have been viewed as major priorities to ameliorate the
problem of present agriculture and of natural resource degradation. This results in multiple benefits such as ensuring
food security, enhancing viability of farming and restoring ecological balance. The strategy of organic farming is to
protect and sustain the livelihoods of resource poor farmers who are experiencing production constraints due to
excessive use of off-farm production inputs in addition to problems created by soil erosion and moisture stress.
Organic farming is to ensure the maximum use of on-farm production inputs and the availability of soil moisture.
Thus organic farming helps in raising income and employment for farmers through improvement in agricultural
productivity and sustainability in agricultural production.
In the light of the above background and consideration, the present study has been undertaken in the state
of West Bengal. The result of the study showed that the overall increase in number of farms and area under organic
farming has been found higher in NGOs area in both the district, except in Jalpaiguri district where the area under
organic farming has increased more in Government activity area. The adoption of organic agriculture technologies
in the study area was found to be very poor due to unavailability of required quantity of organic production inputs
and price premium of organic farm products. The study emphasizes the urgent need for coordination between the
agencies involved in implementation of the organic farming programme, which is at present lacking, for efficient
and fruitful implementation of the programme. The comparative economics between organic and inorganic farming
showed that though the return / cost ratio for most of the crops under organic system was lower but the ratio was
favorable and mainly the higher cost of organic manure was liable for this lower return / cost ratio. It has been
proved by prevailing higher price of organic crops in the market that qualities of organic crops were good and
beneficial for health and the consumers‟ were willing to pay price premium. Organic farmers in both NGOs and
Government area were motivated to adopt organic technology in their farming activity from awareness regarding
good quality of organic product, beneficial role of organic crops in human health, high profitability of organic
farming than other system, etc. Among seventeen, constraints like high cost of organic inputs, no market for organic
product, unavailability of organic inputs , less yield and no price advantage for organic product are found to be the
major constraints according to their ranking as first, second, third, fourth and fifth.
The study was carried out under the leadership of Ranjan K. Biswas. The field survey was organized by
Ranjan K. Biswas and the field investigation work was done by him accompanied by D. Majumder. The entire
responsibility of formation of table design as well as preparation of tables, analyzing the data and drafting of the
report has been shouldered by Ranjan K. Biswas.
The secretarial assistance has been received from Mr. D. Mondal, Mr. N. Maji, Mr. Munshi A. Khalek, Mr.
P. Hazra and Mr. S. Sandhu. The duplicating of the report has been done by Mr. Amulya Ratan Patra.
On behalf of the centre, the undersigned likes to take this opportunity to thank Agriculture Assistant of
Society for Equitable Voluntary Actions (SEVA – a NGO), Director of Agriculture of Loka Kalyan Parishad (LKP –
a NGO), Assistant Director of Agriculture, Government of West Bengal for Barasat I block and Jalpaiguri Sadar
block and Deputy Director of Agriculture, Directorate of Plant Protection & Quality Control, Ministry of
Agriculture, Government of West Bengal for their kind cooperation in conducting the study. We express our deep
sense of gratitude towards all of them.
Santiniketan Debashis Sarkar
May, 2011 Director
AER Centre, Visva-Bharati
CONTENTS
Chapter Particulars Page No.
Preface
I INTRODUCTION
1.1 Prelude
1.2 Objectives of the study
1.3 Database and Methodology
1.3.1 Selection of farmers
1.3.2 Methods of data collection
1.3.3 Measurement of variables
1.4 Scheme of the chapters
1.5 Limitations of the study
II REVIEW OF LITERATURE
2.1 Organic Farming
2.2 Application of organic farming
III PROFILE OF THE STUDY AREA
3.1 Profile of the West Bengal state
3.2 Profile of the North 24 Parganas district
3.3 Profile of the Jalpaiguri district
3.4 Characteristics of selected farmers
3.5 Annual family income
3.6 Annual farm income
IV RESULTS AND DISCUSSIONS
4.1 Status of organic farming in West Bengal
4.2 Comparative economics of crop production under organic and inorganic farming
4.3.1 Economics of lady‟s finger
4.3.2 Economics of potato
4.4 Impact of organic farming in relation to quality of produces and price premium
4.4.1 Consumers‟ behavior towards the organic food products
4.4.2 Distribution of the consumers
4.4.3 Consumers‟ awareness and willingness to buy the organic products
4.4.4 Impact of price
4.4.4.1 Overall price of all crops
4.4.4.2 The Price premium
4.5 Farmers‟ awareness regarding organic farm practices
4.6 Constraints in adoption of organic farming
V SUMMARY AND CONCLUSION
References
Appendix-I

LIST OF TABLES
Table No. Title of the Table Page
3.1 Demographic profile of West Bengal 19
3.2 Net and gross cropped area and cropping intensity in WB 20
3.3 Demographic profile of North 24 Parganas district 21
3.4 Agricultural profile of North 24 Parganas district 22
3.5 Demographic profile of Jalpaiguri district 23
3.6
Agricultural profile of Jalpaiguri district
24
3.7 Family members of the sample farms 25
3.8 Land size of the sample farms 26
3.9 Irrigated land of the sample farms 27
3.10 Number of livestock of the sample farms 28
3.11 Annual family income of the sample farms 29
3.12 Annual farm income of the sample farms 30
3.13 Percentage of farm income over family income of the sample farms 31
4.1 Status of organic farming in respect to number of farms and land area in ha 33
4.2 Status of sample organic farms in respect to organic farm (area in ha) 33
4.3 Comparative cost of cultivation of lady's finger 34
4.4 Estimated t values for organic and inorganic farming practices of Lady‟s
Finger
35
4.5 Cost A1 for cultivation of lady‟s finger 36
4.6 Comparative cost of cultivation of potato 37
4.7 Estimated t values for organic and inorganic farming practices of Potato 37
4.8 Cost A1 for cultivation of potato 38
4.9 Marketwise income profile of the respondent consumers 39
4.10 Price premium (in %) that consumers‟ willing to pay for organic products 40
4.11 Comparative price (Rs/qtl) of organic & inorganic farm products in NGO
area 41
4.12 Comparative price (Rs/qtl) of organic & inorganic farm products in
Government area 41
4.13 Price premium (Rs/qtl) of organic over inorganic farm products 42
4.14 Ranking of organic farmers‟ awareness 43
4.15 Field level constraints of organic farming as perceived by the sample farms 44
4.16 Relative importance of different types of constraints of organic farming
among the sample farms 44
4.17 Socio-economic constraints of organic farming as perceived by the sample
farms
44
Table No.
Title of the Table
Page
4.18 Situational constraints of organic farming as perceived by the sample farms 45
4.19 Infrastructural constraints of organic farming as perceived by the sample
farms 45
4.20 Technological constraints of organic farming as perceived by the sample
farm
45
A1 Comparative cost of cultivation of Cauliflower 56
A2 Estimated t values for organic and inorganic farming practices of
Cauliflower
56
A3 Cost A1 for cultivation of Cauliflower 57
A4 Comparative cost of cultivation of Chilli 57
A5 Estimated t values for organic and inorganic farming practices of Chilli 58
A6 Cost A1 for cultivation of Chilli 58
A7 Comparative cost of cultivation of Cowpea 58
A8 Estimated t values for organic and inorganic farming practices of Cowpea 59
A9 Cost A1 for cultivation of Cowpea 59
A10 Comparative cost of cultivation of Brinjal 60
A11 Estimated t values for organic and inorganic farming practices of Brinjal 60
A12 Cost A1 for cultivation of Brinjal 60

Chapter I
INTRODUCTION
1.1 Prelude
The word “organic” means “the plant or animal origin”. It also refers to the organizational aspect of an
organism. So, “organic agriculture” is not a very precise term. With an understanding of the principles of organic
farming, a straight and simple definition to the concept can be suggested. In reality, organic farming is a system of
farming which devoid of chemical inputs and in which the biological potential of the soil and underground water
resources are conserved and protected from the natural and human induced degradation or depletion. It is adopted by
suitable cropping models including agro-forestry and method of organic replenishment. Besides, natural and
biological means are used for pest and disease management by which the soil life and beneficial interaction are
stimulated and sustained. The system achieves self regulation and stability as well as capacity to produce
agricultural outputs at levels which are profitable and enduring over time.
Organic Agriculture includes all agricultural systems that promote the environmental, social and
economical production of food and fibre on a sustainable basis. This system takes local soil fertility as a key to
successful production. By respecting the natural plants, animals and the landscape, it aims to optimize quality in all
aspects of agriculture and the environment. Organic agriculture dramatically reduces external inputs by refraining
from the use of chemical/synthetic fertilizers, pesticides and pharmaceuticals. Instead, it allows the powerful laws of
nature to increase both agricultural yields and disease resistance. Organic agriculture is also a rule based agricultural
system in which the operator has to follow the standards of organic farming set by the certification organization.
Organic agriculture is one of several approaches to sustainable agriculture and many of the techniques used
(e.g. inter-cropping, rotation of crops, mulching, integration of crops and livestock) are practiced under various
agricultural systems. What makes organic agriculture unique, as regulated under various laws and certification
programmes, is that (1) almost all synthetic inputs are prohibited, and (2) “soil building” crop rotations are
mandated. The basic rules of organic production are that natural inputs are approved and synthetic inputs are
prohibited. But there are exceptions in both cases. Certain natural inputs determined by the various certification
programmes to be harmful to human health or the environment are prohibited (e.g. Arsenic). As well, certain
synthetic inputs determined to be essential and consistent with organic farming philosophy are allowed (e.g. insect
pheromones). Many certification programmes require additional environmental protection measures in addition to
these two requirements. While many farmers in the developing world do not use synthetic inputs, this alone is not
sufficient to classify there operations as organic.
After continuing that type of farming practices, based on the use of inorganic and mineral components for a
long time, there has been an increasing demand for rethinking agricultural growth strategy. Agricultural
sustainability, degradation of soil (soil productivity and soil structure), bio-diversity, impact on human health and
environment as a whole are important criteria now-a-days. In the nineties of the 20th
century, a focus on long-term
sustainability of agriculture has been enhanced as an alternative to inorganic farming. Usage of bio-fertilizers and
bio-pesticides, organic farming, bio-dynamic farming, low input agriculture, permaculture, sustainable agriculture,
integrated farming practices (Integrated Pest Management and Integrated Nutrient Management) are some of the
practices having same objectives that are being espoused by proponents not only in developed countries but in
developing countries also. All these practices are alternatives of inorganic farming keeping in view the increasing
demand for green agriculture products across the world. This growing demand for green agriculture products is both
a constraint as well as window of opportunity not only for the agriculturists but also for producers, suppliers and
traders of agriculture inputs (fertilizers, pesticides, etc.) and outputs.
It is fact that organic farmers are few in number. It is also fact that consumer demand for organic food and
fibre products creates new market opportunities for cultivators and businesses around the world and thereby it
creates new challenges for Food and Agriculture Organisation (FAO). Only the private sector alone has developed
the markets for organic products for many years with great success and at present the public sector has begun to give
emphasis for the same due to the surge in consumer interest. It is to be noted that in several developed countries like
Austria, Switzerland, etc. organic agriculture has came to represent only 10% and 7.8% respectively of the food
system and many others like USA, France, Japan, Singapore, etc. are experiencing growth rates that exceed 20%
annually. In the case of developing countries, some have small domestic organic market (e.g. Egypt) and a few have
begun to seize the profitable export opportunities created by organic agriculture (e.g. export of Mexican coffee,
Ugandan cotton, etc.)
It is observed that under organic farming practice, yield of crops does not decrease. The basic fact is that
crop requires 16 nutrients for plant growth. When one applies chemical fertilizer then the assurance is only for one,
two, or three nutrients. When the application of organic manure is done, the availability of all the 16 nutrients is
assured. It has been observed that vermicompost is a rich source of macro and micro nutrients, vitamins, enzymes,
anti-biotic and growth hormones. Besides nutrients, in case of organic farming, the activity of micro-organisms
increase manifold, whereas in case of chemical farming it is ceased. It is a well known fact that nitrogen cycle,
carbon cycle; even availability of phosphorus is governed by micro-organisms. At the same time if equal quantity of
nutrient is applied through organic manure, then the question of decrease in yield does not arise. Secondly fertilizer
use efficiency will be much higher under organic conditions, the leaching and evaporation losses will be lesser.
Furthermore, the moisture retention capacity of the soil increases which helps to grow crops even under drought
condition. In view of the above, the present study has been conducted to examine the impacts and constraints of
organic farming in West Bengal. The reference period of the study is 2009-10.
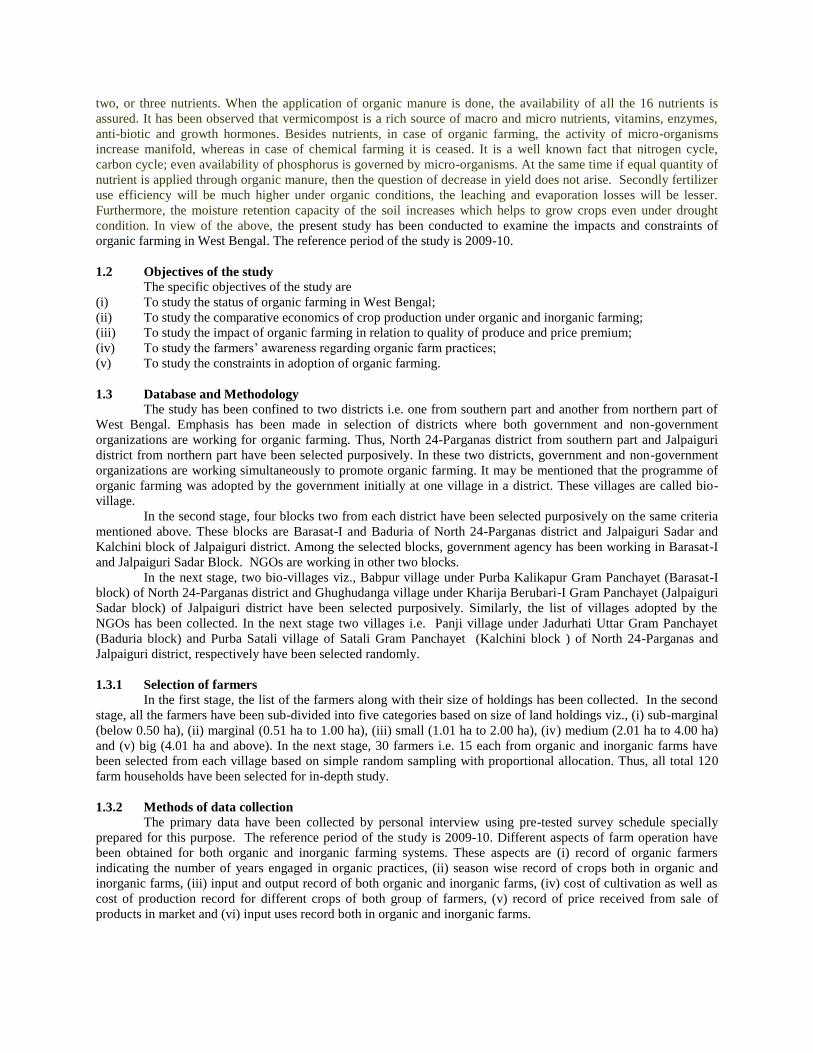
1.2 Objectives of the study
The specific objectives of the study are
(i) To study the status of organic farming in West Bengal;
(ii) To study the comparative economics of crop production under organic and inorganic farming;
(iii) To study the impact of organic farming in relation to quality of produce and price premium;
(iv) To study the farmers‟ awareness regarding organic farm practices;
(v) To study the constraints in adoption of organic farming.
1.3 Database and Methodology
The study has been confined to two districts i.e. one from southern part and another from northern part of
West Bengal. Emphasis has been made in selection of districts where both government and non-government
organizations are working for organic farming. Thus, North 24-Parganas district from southern part and Jalpaiguri
district from northern part have been selected purposively. In these two districts, government and non-government
organizations are working simultaneously to promote organic farming. It may be mentioned that the programme of
organic farming was adopted by the government initially at one village in a district. These villages are called bio-
village.
In the second stage, four blocks two from each district have been selected purposively on the same criteria
mentioned above. These blocks are Barasat-I and Baduria of North 24-Parganas district and Jalpaiguri Sadar and
Kalchini block of Jalpaiguri district. Among the selected blocks, government agency has been working in Barasat-I
and Jalpaiguri Sadar Block. NGOs are working in other two blocks.
In the next stage, two bio-villages viz., Babpur village under Purba Kalikapur Gram Panchayet (Barasat-I
block) of North 24-Parganas district and Ghughudanga village under Kharija Berubari-I Gram Panchayet (Jalpaiguri
Sadar block) of Jalpaiguri district have been selected purposively. Similarly, the list of villages adopted by the
NGOs has been collected. In the next stage two villages i.e. Panji village under Jadurhati Uttar Gram Panchayet
(Baduria block) and Purba Satali village of Satali Gram Panchayet (Kalchini block ) of North 24-Parganas and
Jalpaiguri district, respectively have been selected randomly.
1.3.1 Selection of farmers
In the first stage, the list of the farmers along with their size of holdings has been collected. In the second
stage, all the farmers have been sub-divided into five categories based on size of land holdings viz., (i) sub-marginal
(below 0.50 ha), (ii) marginal (0.51 ha to 1.00 ha), (iii) small (1.01 ha to 2.00 ha), (iv) medium (2.01 ha to 4.00 ha)
and (v) big (4.01 ha and above). In the next stage, 30 farmers i.e. 15 each from organic and inorganic farms have
been selected from each village based on simple random sampling with proportional allocation. Thus, all total 120
farm households have been selected for in-depth study.
1.3.2 Methods of data collection
The primary data have been collected by personal interview using pre-tested survey schedule specially
prepared for this purpose. The reference period of the study is 2009-10. Different aspects of farm operation have
been obtained for both organic and inorganic farming systems. These aspects are (i) record of organic farmers
indicating the number of years engaged in organic practices, (ii) season wise record of crops both in organic and
inorganic farms, (iii) input and output record of both organic and inorganic farms, (iv) cost of cultivation as well as
cost of production record for different crops of both group of farmers, (v) record of price received from sale of
products in market and (vi) input uses record both in organic and inorganic farms.

1.3.3 Measurement of variables
On the basis of extensive review of studies and consultation with the experts, the relevant variables
associated with the adoption and non-adoption of organic farming were identified. The variables related to adoption
of organic farming are measured on the basis of 5-point scale following the scoring method as very strong = 5,
strong = 4, medium = 3, low = 2 and nil = 1. Similarly, the variables related to non-adoption of organic farming are
measured as very strong = 1, strong = 2, medium = 3, low = 4 and nil = 5.
The variables as identified for the adoption of organic farming are (i) high profitable, (ii) minimum
production risk, (iii) higher employment potentiality, (iv) lower recurring cost for inputs, (v) beneficial for health,
(vi) increasing consumer demand, (vii) higher price of organic product and (viii) good quality. Similarly, identified
variables for non-adoption of organic farming are (i) not aware , (ii) no scope, (iii) small holding size, (iv) lower
profitability, (v) lower yield, (vi) high cost of organic inputs, (vii) higher production risk, (viii) lacking of price
advantage, (ix) lack of market, (x) lower employment potentiality, (xi) more recurring cost for inputs, (xii) non-
availability of suitable land, (xiii) non-availability of organic inputs, (xiv) lack of consumer demand, (xv)
inconvenience of organic techniques, (xvi) lack of experience on organic farming, (xvii) lack of training on organic
practices.
1.4 Scheme of the chapters
The entire study report has been organized into five chapters. These are (1) Introduction, (2) Review of
literature, (3) Profile of the study area, (4) Results and discussion and (5) Summary and conclusions.
1.5 Limitations of the study
Though considerable precautions and thoughts have been exercised to make the study precise, objective
and reliable, yet because of limited resources at the disposal, the study has been restricted to specific areas and could
not be extended to larger areas and more crops. Individual‟s biases and prejudices on the part of the respondents
might have influenced the findings of the study because the field level investigation was based on individual‟s
perception and expressed opinion. However, from inter-checks of different elements of the data no systematic biases
are, however apparent. However, due to its demonstration of the various issues and aspects of the problem, the study
might have much wider application and this could be extended to other similar areas.

Chapter II
REVIEW OF LITERATURE
In this Chapter an attempt has been made to gather the important findings of the previous research works
related to organic farming. For convenience, the entire review has been sub-divided into two sub-heads i.e. (1)
organic farming and (2) application of organic farming.
2.1 Organic farming Maiti (2007) stated that the past of organic Horticulture, a part of Agriculture, is very old. Agriculture was
discovered by the people of the Neolithic age about 8500 to 9500 years since now. Towards the beginning, the
technology of growing crops was very primitive. Since agriculture began on a rich virgin soil, the crops did not need
any extra manuring in the earlier days. The invigorating effect of dung, urine and other refuses of the domesticated
animals on the crop plants, were observed. The need for manuring was gradually realized. Since the people had to
stay close to their field for protecting the crop, Agriculture was instrumental to end their nomadic life. Now there is
a chance for the perennial plants, particularly the tree fruits, to have a permanent settlement. This heralded the age of
Horticulture. The inorganic materials invaded the Horticulture for about half a century and almost effaced the effect
of our organic past of 10,000 years. These fifty years was enough to make our good orchards and fields nearly
unproductive, our environment polluted and our body exposed to many serious diseases. The future of Organic
Horticulture may start conveniently from the beginning of the 21st century onwards.
Chatterjee (2005) reported that just substituting synthetic fertilizers and pesticides with organic, botanical
or microbial inputs is not „Organic Farming‟. True Organic farming is diversified integrated farming, where use of
Synthetic Agro-chemicals, Fossil fuels, Deep level groundwater and other non renewable resources, non indigenous
plant and animal species etc are minimized and cropping systems are adapted to agro ecological regions, trees
animals, aquatic organisms etc are integrated with seasonal crop production, on farm production of biofertlisers,
seeds, botanical agents etc are encouraged and soil-water conservation is accorded highest priority. Only live soil
and healthy ecosystem can produce stable high yield of nutritious food and generate higher employment per unit of
capital invested, though cash returns may be lower per unit of land.
Singh (1999) reviewed the history of organic farming attempts in Malaysia, especially during the last 15
years, covering challenges in production, marketing and consumer acceptance of organic produce [specifically
vegetables]. It then presents as overview of the current status, including efforts in kitchen gardening, and efforts by
CETDEM to mainstream organic farming. It describes the growing interest in organic produce and the challenges
faced in getting better understanding of organic farming and development of Malaysian standards.
Yadav (1999) reported that CWDS is a full member of IFOAM since 1992. Agriculture, in Nepal, is
complex due to uncertainty of monsoons, soil heterogeneity, fragile mountains with divergent ecosystems, small and
fragmented holdings and farmers with poor socio-economic base. Besides all these constraints, agriculture has
remained the dominant economic sector providing employment and livelihood to the majority of the people in the
country.
Nepal could not remain outside the domain of Green Revolution technologies and thus, 1960s experienced
the introduction of chemical inputs in agriculture system in Nepal. Despite all the efforts of the government with
technical, material and financial assistance from the aid agencies, agriculture has declined drastically in Nepal. At
present, it is characterized by the diminishing self-sufficiency in food production, economic non-viability, social and
ecological unsustainability. This crisis demonstrates the failure of almost four decades of government planning and
related activities in the agricultural sector.
Organic/sustainable/regenerative/ecological/nature/alternative/permaculture is the different forms/names or
farming practices being promoted dominantly through NGOs in Nepal, but still on a small scale. These initiatives
are local resource based for regenerating the already deteriorated farming practices and therefore, being accepted by
the farming community and slowly being appraised by the professionals which is a positive indication of its
increasing impact in the days to come. The influence of worldwide movement in organic production and marketing
is contributing significantly to the promotion of organic agriculture practice in Nepal, although at a slower pace.
At present, there are quite a good number of farmers involved in alternative farming practices and many
more are joining after realizing the ill-effects of chemical practices and the good aspects of sustainable farming
practices. Organic tea has come to the market and it is being exported. Organically produced cereals, vegetables and
seasonal fruits are available in the market. There are concerted efforts in producing organic fine rice for export.
More than these market-oriented activities, it is the general awareness and positive inclination of the farming
communities towards organic farming practices which is the positive indication for expanding organic practices in
Nepal.
Chander et al. (1999) found that the complementary, supplementary and sustainable relationship of man-
land-cattle Ecosystem in India that is close to organic farming practices. The contribution of indigenous cattle and
buffaloes in promoting sustainable agricultural practices has been discussed in the light of the well-defined organic
agriculture standards, principles and practices. The organic livestock and organic dairying per se is yet to emerge in
Asian countries including India unlike Europe but the potential is immense and this is the essence of the paper.
Debo et al. (1999) stated that China is a large agricultural country with a long history of agricultural
production. China‟s traditional farming never used any synthetic chemicals. However, since 1970s, chemicals such
as synthetic fertilizers and pesticides have become one of the indispensable agricultural production materials. The
heavy use of agro-chemicals over the past three decades caused severe environmental problems. It is found that the
input of nitrogen and phosphorus fertilizers from intensive conventional farmland is an important reason for the
eutrophication of China‟s major fresh water lakes. The reduction of biodiversity is also closely related to chemical
pesticides.
Organic farming can avoid such kinds of environmental pollution. The promotion of organic farming
especially in the ecological sensitive and fragile regions can be greatly helpful for the control of ecological
destruction and restoration of these regions. Practical experience in recent years indicates that the pollution of agro-
chemicals can be effectively controlled and that the population of natural enemies and biodiversity can be
significantly increased during the course of organic conversion from conventional farming to organic farming.
Organic farming plays an essential role in restoring and improving agricultural environment. Therefore, organic
farming has been looked as a new emerging environmental protection industry in China. It is a kind of cleaner
production in the agricultural system.
Under the stimulation of the international organic agricultural movement and the support of China‟s State
Environmental Protection Administration (SEPA), the organic food industry has been developing at a high speed in
China with the active involvement of organic farmers and traders. It is believed that the development of the organic
food industry will play a special role in accelerating the control and restoration of ecologically-destroyed regions, in
protecting rural eco-environment and in stimulating the sustainable development of rural society and economy in
China.
The professional organic farming and organic food development organization has been established since
1994, named as Organic Food Development Center (OFDC) which is run by SEPA. Having been approved by
SEPA, the technical documents which are related to organic food certification, such as “Organic Food Label
Management Regulation” and “Techniques Standards for Organic Food Production and Processing” have been
implemented during the organic food development process in China. In the light of the latest international standards
and the actual farming situations in China, OFDC is now undertaking the modification and development of these
technical documents. Organic food label in China has been registered by the Label Bureau of the National Industry
and Commerce Administration Agency. Concerning the label application requirements, detailed regulations have
been formulated. Since 1997, “Organic Food Times” (a quarterly magazine), the first periodical in China
introducing organic food development situations, has been published.
Since 1994, more and more areas in China have been organically converted and cultivated. This was
brought about by domestic and foreign organic food trade companies and the active participation of grass root level
agricultural production units. OFDC has been involved in organic certification since 1995. To date, OFDC certified
products, such as tea, honey, dairy products, soybean, sesame, buckwheat, wheat, walnut, pine seed, sunflower seed,
pumpkin seed, aniseed and Chinese herbs, have reached nearly 100 varieties. Among these certified organic foods,
some have been exported to northern American, Japan and EU countries, while some are sold in the domestic
market. Based on an incomplete survey, the national export value of organic foods has been increased from $ 0.3
million in 1995 to more than $ 8 million in 1997. At the end of 1998, there are more than 30 companies involving
organic food production and marketing, and the organic food export value has reached $ 10 million. It can be
assumed that the annual rate of increase will not be below 30% in the coming years.
Organic farming in China has been mainly driven by international market demands. Most of the organic
certified operators in the past were either from remote traditional farming areas where little chemicals have been
used or from new reclaimed farmlands. Nevertheless, the conversions from conventional farming to organic farming
in developed eastern part of China, where large amounts of chemical fertilizer and pesticide were used, have been
carried in order to solve the rural environmental problems in these areas and to meet the demands for high quality
organic foods.
The State Environmental Protection Administration (SEPA) is the administrative department under the
State Council responsible for the management of the organic industry of the whole country. The steering Committee
on Development Organic Industry is the national supervising organization composed of members from relevant
ministries and committees under the State Council. Its responsibilities focus on: steering development and trends of
the organic industry in China and solving major problems encountered in the process; co-coordinating the functions
of relevant departments; supervising and managing the organizations and professionals engaged in organic products
certification and promulgating relevant laws and regulations.
OFDC is the national organic certifier in China. In recent years, foreign certifiers from Europe and northern
American and/or their representative offices in China are also actively working in China for the purpose of export
oriented organic certification. This certainly stimulates the introduction of foreign organic farming concepts and
requirements to China and the exportation of organic food from China. The lack of a unified quality control and
supervision for organic certification poses a problem. Thus the Chinese Government is drafting the “Regulations on
Organic Industry Management” which will cover organic production, processing, certification and marketing. All of
the organic producers, processors, certifiers and traders must comply with this regulation in case it becomes
effective.
Organic farming development in China also receives the supports from Chinese and German governments.
The Sino-German co-operation project - “Promotion of Organic Farming in China” started in November of 1997 and
has been mainly implemented by OFDC. The main purposes of this project are to introduce and practice organic
farming concept in selected areas, to establish an organic farming advising service system and to build OFDC‟s
capabilities in organic inspection and certification.
Xiaodong Yang, Yuming Zhang and Zhengkun Wang (1999) observed that located amidst the Dabi
Mountains, west of Anhui Province, Yuexi County is one of the most economically backward counties in China. At
the end of 1997, a Sino-German cooperative organic farming development project was launched in Yuexi. With the
financial and technical support of GTZ and OFDC, a number of teas, kiwi and rice growing farmers began to engage
themselves in this brand new practice of setting up an organic farming system and exploring a new road to poverty
elimination, increase in job opportunity and improvement of the ecological environment in poverty-stricken regions.
2.2 Application of organic farming
In yuexi, traditional farming enjoys a long history. Since the late 1960s, when conventional farming (or
petrol farming) found its way into the domain of agricultural production, large amounts of material input plus
matching technical renovation has drastically increased the yield of grain crops and some cash crops, helping solve
the problem of food shortage in this cold high mountain region. However, while the farmers were still earnestly
carrying on the conventional farming, another problem appeared, that is, the increasing dependence on the input of
external chemical material, which has resulted in less biodiversity, deteriorated soil fertility and aggravated hazard
of pest and diseases. For years, they have been wandering in difficulty between the conventional farming and the
traditional one.
In 1997, with the help of the impetus of the Sino-German cooperative organic farming development
project, 76 farmer households in two natural villages decided to turn their production of tea and kiwi into organic.
After attending extensive training courses, they worked out a plan for organic conversion under the guidance of
experts. In line with the OFDC standards, they have developed a complete new set of farming techniques and
established an organic farming system with fertility improvement and plant protection as focus. Also developed
were the practice of organic farming techniques as kernel, and inner nutrient substances in benign circulation. For
the past two years, the farmers have been using large amounts of green manure, pig dung‟s, composted manure, and
mineral powders instead of chemical fertilizers, and implementing diversified plantation and comprehensive
measures to control pest and diseases instead of the application of herbicides and pesticides, with significant
economic and environmental benefits. With the scientific promotion of the organic conversion plan and the organic
farmers association playing a cooperative and supervisory role, the organic farming movement will be extrapolated
to the neighbouring areas through demonstration.
By various means, publicity is launched to popularize the knowledge of organic farming and organic food,
so as to improve the awareness of all sectors of the society. Further on, training of various forms is organized to
educate people so as to renovate their ideology about the situation of the country, resources, living, ecological
morality and value.
In regions with better natural ecological conditions, it is easier to popularize organic farming, since it is
faster to set up the system and easier to search out a complete set of theory and methods to guide the farming
movement in other regions. In regions with higher commercial rate of the produce, it is easier to establish the
importance of product quality in market competition, thus further promoting the establishment of the organic
farming system.

It is essential to adopt an incentive mechanism so as to divert a large group of experts into the development
of practical organic farming technique and the solution of technical problems in organic conversion. It is also
necessary to readjust relevant industrial policies, such as supporting bio-pesticides and organic manure industries, so
as to solve problems in the supply of matching material. Policies must be formulated for the protection of resources
and the environment.
Hashimoto (1999) pointed out that Teikei is the organic movement that began in Japan 25 years ago. It
means co-partnership between producers and consumers. When we talk about organic agriculture, we often tend to
focus only on the production system or its methodology. Those consumers and producers who changed production
method is not enough to realize the society where agricultural production and environment keep in harmony came
together and formed the Teikei movement. In Teikei system, all varieties of produce are distributed directly by the
producers. The price and planting area are discussed with consumers and producers considering the profitability of
farmers and the diet of consumers. Many consumers are required to visit and help farmers on the field to promote
mutual understanding. Much of the cost for marketing, such as packing and selecting, are reduced to minimum so
that the final prices become cheaper.
Recently, because the market share of organic produce increased in certain countries, international organic
trade has grown worldwide. However, some criticize that this trend leads to a situation where poorer countries serve
luxurious organic produce to richer countries causing the so called green-colonization.
The motto of the Teikei system is local production and local consumption. In this workshop, we introduce
the system, philosophy, and history of Teikei to give some ideas of forming local marketing system in many
countries as well as exchange of information in the promotion of consumer-producer partnership in different
countries.
Dilipkumar et al. (1999) conducted an investigation on the IFOAM ‟99 program embarked on a
comparative research in 1996 to compare organic, traditional and conventional farm systems in Asia, Africa, and
Latin America.
This paper presents the results of two years of data collection and analysis of four case studies and key
learning points emerging from this comparative research from India. NGOs and farmers were selected for data
collection after a workshop where the methodology and selection criteria were discussed. AME was selected to
guide the process owing to past experience in conducting similar comparative research.
The FARMS methodology developed by AME has been adapted to implement this comparative study. Data
collection was organized at a two week interval. Three training workshops were conducted imparted to data
collectors. The farmers and NGO coordinators also participated in a sharing workshop to arrive at a common
understanding on data collection and to understand the farming system. The participating NGOs send the data to
AME every two weeks. Feedback is provided to fill data gaps and improve data quality. The FARMS program gives
an opportunity to compare farm sustainability on ecological criteria (nutrient balance, energy balance, ground water
balance and bio-diversity) at farm level apart from the financial, production and labour performance on-farm. The
influence of the household system on the production system is studied through detailed socio-economic data
collection.
Comparison from the case study gives an impression that the organic farms fare better on the financial and
ecological criteria. The gross margin profits and the income per Labour Day are higher. Conventional farms have a
negative nutrient balance for major and micro-nutrients and low energy use efficiency ratio which negatively
influences sustainability. For the major comparable crops on the farm, there is not much difference in the yields.
Organic matter application holds the key to long-term sustainability. Even the organic farms in these case studies
have not applied the minimum quantity or organic matter per unit area. Organic and conventional farms have a
smaller family size, while the traditional farms have a larger family size. This influences the way labour is used on
the farm. Organic farms go in for labour saving techniques and integration of horticulture on the farm. The
traditional farms use family labour and grow food crops to meet the family food requirement for which they also
lease on land. The case studies reveal that the role of women on the farm in decision-making and sharing of work is
influenced by the caste structure prevalent in India rather than by farm types.
Thus, organic farms focus on the self-sufficiency on the production system; traditional farms go for family
food self-sufficiency while the conventional farms go for financial self-sufficiency.
The promotion of the Natural Healing Program as the best way to be healthy is based on facts. In Indonesia,
various diseases and morbidity of drug intoxication caused by insecticides or chemical fertilizers in modern
agriculture is increased.
In the Natural Healing Program, there is something interesting to be done to keep the balance of ecosystem
in which the involvement of people is very important. In the end of 1996, TIDUSANIY Foundation has been built
based on the definition of health by WHO 1946, “that to be healthy is not just physically but also mentally and
social as well”. The goal of TIDUSANIY Foundation is to make people healthy through Organic Agriculture, the
best system to save our environment and food production. We have to produce pollution free foods, the healthy
foodstuff we need. Changes the attitude from Conventional Agriculture to Organic Agriculture needs time and
energy. The 3 steps of TIDUSANIY‟s strategies are (1) to teach people the importance of being healthy, what health
food is and how to obtain it, (2) to make people aware of the benefits of correct soil management to be able to
produce health foods. And that wrong soil management could destroy our land and nutrients in our foodstuff, (3) To
urge the people to work hard to produce health foodstuff by becoming part and parcel of Organic Agriculture in
Indonesia.
The methodology used to approach the community was to provide the facts that Organic Agriculture is the
best system to keep the environment, soil and everything growing on it such as plant, animals and human, alive and
healthy. TIDUSANIY Integrated Organic Farming acts as the center of the Organic Agriculture program for the
farmers.
The PHD Foundation has been promoting activities that would help bring about Peach and Health among
grassroots people in Asia and South Pacific through human development
Our PHD movement aims to realize the world where we could make joint effort in solidarity to uplift
grassroots people‟s life in Asia and South Pacific as well as in Japan. Based on the principle “LIVING IS
SHARING”-by sharing whatever we have in terms of time, skill knowledge and money, we can join the PHD
movement and bring light to every corner of the world.
PHD, the International Human Service Movement was advocated and initiated by Noburo Iwamura in
1981. He was contributed in medical missions mainly in Nepal and other Asian countries since 1962.
We know there are a lot of grassroots people and their leaders in the third world, who are striving of uplift
their lives through their own self-reliant effort. In Japan, there are groups who are actively tackling the various
problems with fundamental solutions. If grassroots people, both in developed and developing countries, could learn
each other, and make joint-efforts for the improvement of their respective societies or communities by sharing
values, experiences, knowledge and skills, then our world community will be able to find solutions for survival. In
this context, we recognize PHD movements as catalysts to bring about PEACE and HEALTH to all Asians through
HUMAN DEVELOPMENT as well as the formation of solidarity on the grassroots level. We believe that the
practice of our principle “LIVING IS SHARING” will ensure this process of the betterment of the world.
For important markets for organic products, certification is required for appropriate market access. In an
increasing extent, this is also legally required. Certification requirements for organic agriculture are developed by
the organic sector itself (IFOAM Accreditation), drawn from generic product certification requirement (ISO 65) or
integrated in state control systems (like in Denmark). Today, focus is on the legal aspects of certification. But to be
legal may not enough: To believe that legal requirements are most important in the long run may be a mistake.
Almost all other sectors show that buyers are extending their requirements above the legal level. At the same time,
there are efforts to harmonise standards and certification and strong moves to develop local systems: One indication
is the new German Mark for organic and the EU logo for organic production. These marks are collective marketing
marks rather than certification marks. Two big questions for the future are (1) how to accommodate the need for
regional variations within an international framework? Organic Agriculture is and should be based on local
conditions. Will producers and consumers in distant markets accept that products are produced under slightly
different conditions in other countries? What are the procedures for assuring that such regional variations is still “in-
line” with the organic concepts? (2) are there possibilities to simplify certification procedures and requirements in
order to reduce the workload and the costs since they will all have to be recovered in the market place?
Costs for certification are high and are likely to increase if there is no counter power to the constant
requests for more control. Some kind of cost-benefit analysis needs to be introduced to ensure that the costs are not
out of proportion to the value of the products or the risks of fraud.
This paper introduces the status quo of organic agriculture development and certification programs (organic
standard, certifiers, certified products, market development, etc.) in China. The certification programs of small
farmers in China, including general information of the certification procedures and problems, are also mentioned
and discussed.
The last part of the paper presents practical suggestions and questions raised by the public on the
development of certification of small farmers in China.
The application of organic farming techniques, derived largely as they have been from a Euro centric
agricultural environment display a remarkable versatility when applied to the Australian agricultural and natural
environment. Whilst there are clear and notable ecological realities, which require special interpretation of organic
standards, the principles and practices of organic agriculture are robust and capable of directing Australian
agriculture towards a more sustainable future. Furthermore, the proper application of organic standards and practices

is capable of achieving both processes and endpoints, which satisfy national environmental, social and economic
policies.
Chapter III
Profile of the study area
3.1 Profile of the West Bengal state
West Bengal is one of the Eastern States of India extending from 21°31′ and 27°14′ North latitudes and
86°35′ and 89°53′ East longitudes. The land frontier of the State touches Bangladesh in the east, and is separated
from Nepal in the west. Bhutan lies in the north-east, while Sikkim is on the north. On the west there are the states
of Bihar, Jharkhand, while in the south lies Orissa, and the Bay of Bengal, washing its southern frontiers. The
Ganges and its numerous tributaries have created fertile regions in the State. West Bengal is rich in natural resources
and it has an advantage of six agro-climatic regions, fertile soil of vast bio-diversity and consistent irrigation
facilities.
The agro-climatic zones were categorised on the basis of landform hydrology – soil combinations as well
as climate variations. These are (1) Northern Hill Zone, (2) Terai – Tista Alluvial Zone, (3) Gangetic Alluvial Zone,
(4) Vindhya Alluvial Zone, (5) Coastal Saline Zone, and (6) Undulating Red and Laterite Zone.
The Ganges is the main river of West Bengal. While, one of its branches enters Bangladesh as the Padma,
the other flows through West Bengal as the Bhagirathi and Hooghly River. The other major rivers like Teesta, Torsa,
Jaldhaka and Mahananda are in the northern hilly region. Rivers such as the Damodar, Ajay and Kangsabati have
flown through the western plateau region, while the Gangetic Delta and the Sundarbans area have formed a network
of numerous rivers and creeks.
As per Census 2001, West Bengal has a population of 8.02 crores, The estimated population of West
Bengal as on 1st October 2005 stands at 8.53 crore and it is expected to reach 8.64 crore in 1st October 2006. West
Bengal has a population density of 904 inhabitants per square kilometre making it the most densely populated state
in India. The state contributes 7.81 percent of India's population. The population of West Bengal has increased from
4.43 crores in 1971 to 8.01 crores in 2001. However, the population growth rate of the state during 1990-91 to 2000-
01 is 17.84 percent which is lower than the national growth rate of 21.34 percent. According to 2001 census, rural
population of West Bengal was 72.03 percent of the total population whereas the urban population was 27.97
percent of the total population. The rate of growth of urban population has been much more than the rural
population, exhibiting a gradual trend of rural to urban migration (Table 3.1). Historically West Bengal has been an
area under Permanent Settlement during the British governance. A fertile area in the Ganjetic plains associated with
a high population density has been the very feature of West Bengal. This gave rise to fragmentation of arable land
and increase of the small holdings in the agrarian scenario of the state.
Table 3.1: Demographic profile of West Bengal
Demographic features Total number
Population
Male 4,14,65,985
Female 3,87,10,212
Total 8,01,76,197
Scheduled Castes (%) 23.02
Scheduled Tribes (%) 5.50
Population in age group 0-6 (%) 14.24
Literacy (%) 68.64
Population density 903
Sex ratio 934
Source: Census, 2001
There has been significant continual increase in the decadal literacy rates across both rural and urban areas
of West Bengal. The present literacy rate is 69.22 percent. The proportion of people living below the poverty line in
1999–2000 was 31.85 percent.

Agriculture plays such a pivotal role in the State's economy that nearly three out of every four persons is
directly or indirectly involved in agriculture. As such agriculture is the primary occupation of the state and the main
source of income for the people of West Bengal. About 70 percent of the total population depends on farming for
their livelihood. Though the state has only 3 percent of cultivable land, it accounts for 8 percent of the total food
grains produced in the nation. The total food production in the State in 2006-07 was 15820 thousand tonnes. During
2006-07, the production of rice was 14745.9 thousand tonnes, of wheat 799.9 thousand tonnes and of pulses 154.4
thousand tonnes.
The net area under cultivation in West Bengal is about 52, 96,005 ha with cropping intensity of 182
percent. There are 67.89 lakh operational holdings of different land size classes with an average size of 0.82 ha. The
cropping pattern of the state is dominated by food crops, which account for about 87 percent of the area under
principal crops in the state. The major crops grown in the state include Rice, Wheat, Jute, Tea, Potato, Sugarcane,
Pulses and Oilseeds etc. The state is the highest producer of rice in the nation.
In case of area under cultivation, West Bengal has faced a gradual shrinkage in the net cropped area over
the decades from 54.17 lakh hectares in 2000-01 to 52.96 lakh hectares in 2006-07 (as per provisional estimates) as
reflected in Table-3.2 . However, this has been more than equally compensated by a sharp rise in the cropping
intensity of the state from 168 percent to 182 percent, which in turn has resulted in an increase in the gross copped
area from 91.16 lakh hectares to 96.34 lakh hectares over the same period.
Table 3.2: Net cropped area, gross cropped area and cropping intensity in West Bengal
Year Net cropped area (ha) Gross cropped area (ha) Cropping intensity (%)
2000-01 5417382 9116597 168
2001-02 5521576 9778815 177
1002-03 5354196 9510423 178
2003-04 5427672 9661325 178
2004-05 5374704 9522930 177
2005-06 5294702 9532607 180
2006-07(P) 5296005 9634535 182
Source: Directorate of Agriculture, Government of West Bengal
West Bengal has been a state where IADP was launched in a few districts with new varieties of seeds for
rice. It was in the eve of so-called „green revolution‟. But in course of 60‟s the new technology in agriculture could
not make much headway in the state. It was only after mid 80‟s the production frontier in agricultural sector seemed
really to increase at an appreciable rate.
3.2 Profile of the North 24-Parganas district The district North 24-Parganas has a geographic extension from 22°8”N latitude to 23°16”N and 88°18”E
to 89°4”E longitude covering an area of 4,094 sq. Km. (4,317.39 sq. km. as per R. D. I. West Bengal 1991). It is
bounded on the north and east by the international boundary with Bangladesh. In its south and south-west lies the
district South 24-Parganas and Kolkata, river Hugli on the west (adjoining Haora and Hugli districts) and district
Nadia on north-west.
Tropical humid climate prevails over this southern part of West Bengal influenced by the tropical monsoon
system. The south west monsoon stream arrives here by the middle of June (Asaarh in Bengali calendar)
commencing the actual rainy season which continues till September. During this period almost 2/3rd of the normal
annual rainfall (1565 mm) occurs corresponding with a higher temperature and very high relative humidity. Hence
this is the period of sultry weather, flood and water logging. On the other hand a good monsoon rain indicates a
productive year for the dominantly agrarian economy of the district. Area of the district is 4094 sq.km.
North 24-Parganas is the second most populous district in the state and in India as well. It is the second
most urbanized district of the state having more than 54.0 per cent of the total population in the urban areas, whereas
28 per cent of the state‟s population lives in urban areas. The district North 24-Parganas is in alarming condition due
to high population growth of 22.7 percent, which is fifth highest in the state. The district has the third highest density
of population (2,182 persons per square kilometre) in the state. The sex ratio of the district (926) is well below the
state sex ratio (934). Literacy rate of the district is 78.1 per cent thereby making its position 2nd in the state (Table
3.3).

Physiographically the district encompasses both moribund and mature parts of the Ganges delta. The delta
forming process by river Hugli or Bhagirathi, which is still active down south, which has made the territory of this
district crisscrossed with a complex network of tributaries, distributaries, minor creeks and channels- charged with
local run-off and tidal inflow. The district has been divided into three physiographic zones, viz., Ichhamati-
Raimangal Plain, North Bidyadhari Plain, and The flat raised alluvium strip along the Hugli River on the west
forming the North Hugli Flat. The district is primarily composed of recent alluvium soils of great thickness
deposited during development of the Gangetic Delta, which is immensely important for agricultural activities in the
district.
Table 3.3: Demographic profile of North 24-Parganas district
Source: Census, 2001
Tropical humid climate prevails over this southern part of West Bengal including North 24-Parganas
influenced by the tropical monsoon system. The southwest monsoon stream arrives here by the middle of June
commencing the actual rainy season, which continues till September. During this period almost 2/3rd of the normal
annual rainfall (1565 mm) occurs. The two following months, October and November is the autumn season, while
the winter season comprises of December to February. It is followed by a short spring season with gradual increase
in temperature till the middle of April. Then the actual summer sets in (April-May) and continues till the outburst of
the southwest monsoon rains.
Agriculture in North 24-Parganas has witnessed a remarkable increase in food grain production, which
currently stands at 7.38 lakh tones. The North 24-Parganas District also contribute significantly towards the West
Bengal horticultural produces and is taking shape as a „Horticulture Hub‟ of West Bengal. The commercial
production of vegetables like tomato, cabbage, cauliflower, pea, brinjal, ladies finger, beans, potato etc. has grown
rapidly over the years owing to favourable agro-climatic conditions of the district. The region also offers excellent
conditions for commercial production flowers like rose, tuberose, marigold and gladioli. Fruits like mango, banana,
papaya, pine apple, guava, litchi etc. are also grown in the region in commercial scale (Table 3.4).
Table 3.4: Agricultural profile of North 24-Parganas district
Agricultural features North 24 Parganas district
Land (ha) Reporting area 3,86,524
Cultiviable land 2, 64,607 (68.46 %)
Non-cultiviable land 1, 09,935 (28.44 %)
Forest area 11,982 (3.10 %)
Plantation area 3,44,840
Cultivators (%) 10.40 %
Agricultural labours (%) 11.80 %
Major crops Rice, Wheat, Pulses, Oilseeds, Vegetables
Total foodgrains production ( „000 tonnes) 769.20
Total pulses production ( „000 tonnes) 6.50
Total oilseeds production ( „000 tonnes) 52.40
Total vegetables production ( „000 tonnes) 909.10
Cropping intensity (%) 201
Source: Census, 2001 and Statistical Abstract, 2008
3.3 Profile of the Jalpaiguri district
Demographic features Total number
Population
Male 46,38,756
Female 42,95,530
Total 89,34,286
Scheduled Castes (%) 20.6 %
Scheduled Tribes (%) 2.2 %
Literacy (%) 78.1 %
Main worker (%) 29.40 %
Population density/sq.km 2182
Sex ratio 926

Jalpaiguri district is an ethnically diverse and culturally rich district that lies at the foothills of Darjeeling.
The district is sharply divided by the river Teesta and is crisscrossed by river Torsa, Mahanda and a number of hill
rivulets. The river Sankosh demarcates the eastern border with Assam. The district lies between 26˚16' and 27˚0'
north Latitude and between 88˚4‟ and 89˚53‟ east Longitude. The district is considered under terai – tista alluvial
zone in respect of agro-climatic zone of West Bengal. The total geographical area of the district is 6,227 sq. km. Out
of this, an area of 1790 sq.km under forest and an area of 1987 sq km under tea garden has been reported. The
district has three sub-divisions with thirteen community development blocks and seventeen police stations. Annual
average rainfall of the district is 3736 mm and normal temperature varies from a maximum 37˚C to a minimum 6˚C.
Jalpaiguri is the largest district by area in the northern part of the state West Bengal. It is the most
urbanized district of the North Bengal having 34,01,173 total population, consisting 17,51,145 male and 16,50,028
female population. The district has 36.71% schedule caste and 18.87% schedule tribe population. The density of
population of the district is 546 persons per square kilometer. The sex ratio of the district (942) is high of the state
sex ratio (934). Literacy rate of the district is 54.07 per cent thereby making its position 2nd
among the districts of
North Bengal (Table 3.5).
The soil type of the district is primarily composed of recent alluvium by nature of great thickness deposited
during development of the deltas, which is immensely important for agricultural activities in the district.
Table 3.5: Demographic profile of Jalpaiguri district
Source: Census, 2001
Tropical humid climate prevails over the northern part of West Bengal including Jalpaiguri district
influenced by the tropical monsoon system. The southwest monsoon stream arrives here by the middle of June
commencing the actual rainy season, which continues till September. During this period almost 2/3rd of the normal
annual rainfall (4000 mm) occurs. The two following months, October and November is the autumn season,
while the winter season comprises of December to February. It is followed by a short spring season with gradual
increase in temperature till the middle of April. Then the actual summer sets in (April-May) and continues till the
outburst of the southwest monsoon rains.
Agriculture in Jalpaiguri district has witnessed a remarkable increase in food grain production, which
currently stands at 4.39 lakh tones. The Jalpaiguri district also contributes significantly towards the West Bengal
horticultural produces by producing 8.36 lakh tones vegetables. The commercial production of vegetables like
tomato, cabbage, cauliflower, pea, brinjal, ladies finger, beans, potato etc. has grown rapidly over the years owing to
favourable agro-climatic conditions of the district. The region also offers excellent conditions for commercial
production flowers like rose, tuberose, marigold and gladioli. Fruits like mango, banana, papaya, pine apple, guava,
litchi etc. are also grown in the region in commercial scale. The district is claimed for favour of pulses and oilseeds
production in the state also (Table 3.6).
These two districts, from two different agro-climatic zones of the state, were selected for the purpose of the
present study. As we mentioned earlier that sample at the farm level were selected for the survey.
3.4 Characteristics of selected farmers
The socio-economic characteristics of the sample farmers would provide the background information and
resource endowment position of the farmers in the selected area. This includes the information about composition of
family, size of land holding, level of irrigation, number of livestock, etc. These factors are crucial for bringing about
desirable changes in the farm economy.
It is evident that the average family size of organic farming household range from 4.60 persons to 5.33
persons in NGO area and 5.27 persons to 5.40 persons in Government area. The overall average family size is 5.18
Demographic features Total number
Population
Male 17,51,145
Female 16,50,028
Total 34,01,173
Scheduled Castes (%) 36.71 %
Scheduled Tribes (%) 18.87 %
Literacy (%) 54.07 %
Main worker (%) 30.00 %
Population density / sq.km 546
Sex ratio 942

persons per organic farm family, whereas the average family size is 4.56 persons per inorganic farm family. Thus,
average family size of organic farm households is found little higher as compared to inorganic farm households of
entire study area (Table 3.7).
Turning to land holdings, it appears that the average size of land holdings under organic farming of the
selected farm households is from 0.32 ha to 0.84 ha in NGO area and 0.47 ha to 0.86 ha in Government area. The
overall average size is 0.60 ha per organic farm.
Table 3.6: Agricultural profile of Jalpaiguri district
Agricultural Features Particulars
Land (ha) Reporting area 6,22,700
Cultiviable land 3,55,685 (57.12 %)
Non-cultiviable land 88,015 (14.13 %)
Forest area 1,79,000 (28.75 %)
Plantation area 2,02,190
Cultivators (%) 25 %
Agricultural labours (%) 16 %
Major crops Rice, Wheat, Pulses, Oilseeds, Vegetables
Total food grains production ( „000 tonnes) 439.40
Total pulses production ( „000 tonnes) 2.20
Total oilseeds production ( „000 tonnes) 13.20
Total vegetables production ( „000 tonnes) 836.28
Cropping intensity (%) 169
Source: Census, 2001 and Statistical Abstract, 2008
Table 3.7: Family members of the sample farms
Category of farms
Organic farms Inorganic farms
Sample size Family size (no.) Sample size Family size (no.)
NGO area
North 24 Parganas district
Sub-marginal 12 4.60 11 4.00
Marginal 3 4.60 3 4.33
Small - - 1 5.00
Overall 15 4.60 15 4.13
Jalpaiguri district
Sub-marginal 7 4.43 4 6.33
Marginal 2 9.00 8 4.71
Small 6 5.17 3 4.40
Overall 15 5.33 15 4.93
Government area
North 24 Parganas district
Sub-marginal 8 4.78 10 4.11
Marginal 6 6.00 5 4.00
Small 1 6.00 - -
Overall 15 5.27 15 4.07
Jalpaiguri district
Sub-marginal 3 6.00 6 4.67
Marginal 7 5.67 8 5.17
Small 5 4.80 1 5.00
Overall 15 5.40 15 4.95
All
Sub-marginal 30 4.75 31 4.47
Marginal 18 5.97 24 4.67
Small 12 5.09 5 4.64
Overall 60 5.18 60 4.56
Source: Field survey
In the inorganic system, the holding size is 0.41 ha to 0.83 ha in NGO area and 0.47 ha to 0.58 ha in
Government area with an overall average of 0.54 ha. The larger size of organic farm is the cause of more number of
small farmers in the sample under organic farming system (Table 3.8).
It appears from field level data that farms, both organic and inorganic, in North 24 Parganas get irrigation
to the tune of 100 per cent irrespective of the agencies that they are working under. Hence, in North 24 Parganas the

farms under both Government and Non-government supervision have the advantage of complete irrigation. In
contrast, the percentages of irrigated area in Jalpaiguri district are 41 per cent in NGO area and 75 per cent in
Government area under organic system while percentages of irrigated land under inorganic system are 28 per cent
and 69 per cent respectively (Table 3.9).
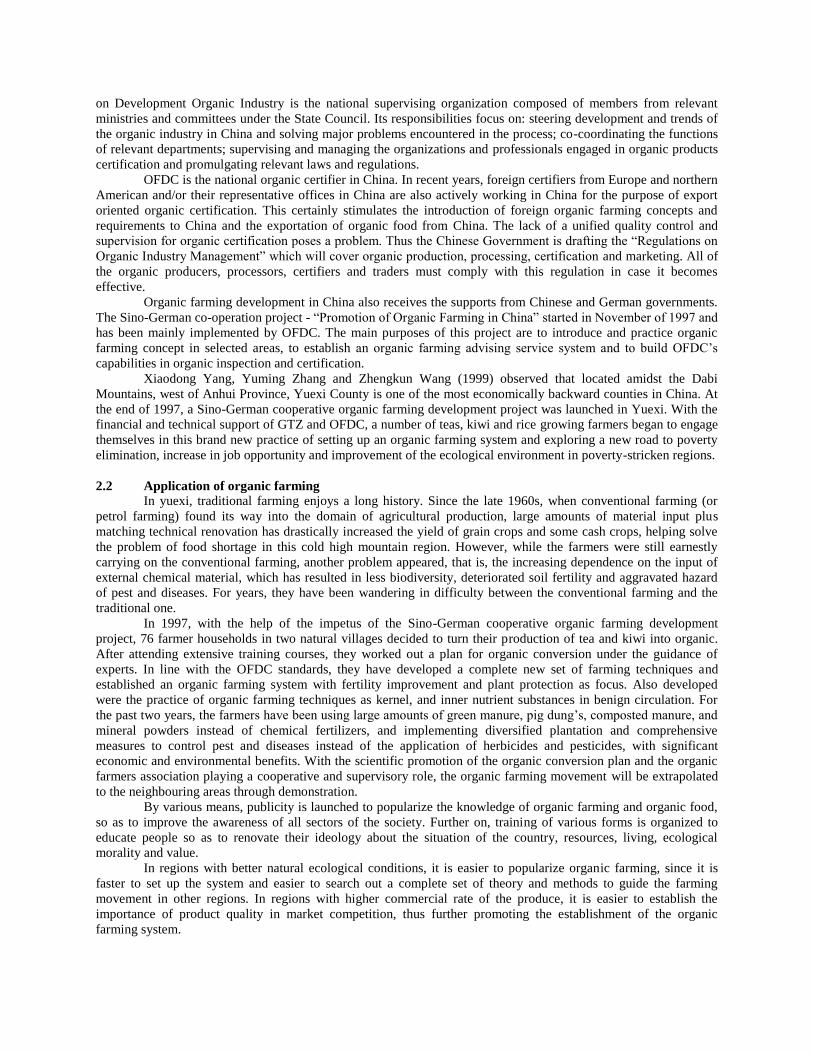
In view of pivotal role of livestock in upgrading the ecology and economy of the rural areas and to become
the main as well as only source of FYM, the most vital input for manuring the organic field and improving the soil
physical condition, the livestock population has been examined.
Table 3.8: Land size of the sample farms
Category of farms
Organic farms Inorganic farms
Sample size Land size (ha) Sample size Land size (ha)
NGO area
North 24 Parganas district
Sub-marginal 12 0.19 11 0.23
Marginal 3 0.59 3 0.80
Small - - 1 1.25
Overall 15 0.32 15 0.41
Jalpaiguri district
Sub-marginal 7 0.40 4 0.38
Marginal 2 0.70 8 0.76
Small 6 1.39 3 1.20
Overall 15 0.84 15 0.83
Government area
North 24 Parganas district
Sub-marginal 8 0.31 10 0.33
Marginal 6 0.62 5 0.67
Small 1 1.12 - -
Overall 15 0.47 15 0.47
Jalpaiguri district
Sub-marginal 3 0.40 6 0.40
Marginal 7 0.76 8 0.64
Small 5 1.15 1 1.12
Overall 15 0.86 15 0.58
All
Sub-marginal 30 0.29 31 0.31
Marginal 18 0.68 24 0.71
Small 12 1.27 5 1.19
Overall 60 0.60 60 0.54
Source: Field survey
The data clearly reveal that as compared to inorganic farm, the average number of livestock per organic
farm is not higher in the study area. It has been found that overall average numbers of livestock are 4.12 per organic
farm and 4.87 per inorganic farm (Table 3.10).
3.5 Annual family income
To get an account of the socio-economic position of the farming households within the hierarchy of the
village economy family income and household‟s income from farming sources is analyzed.
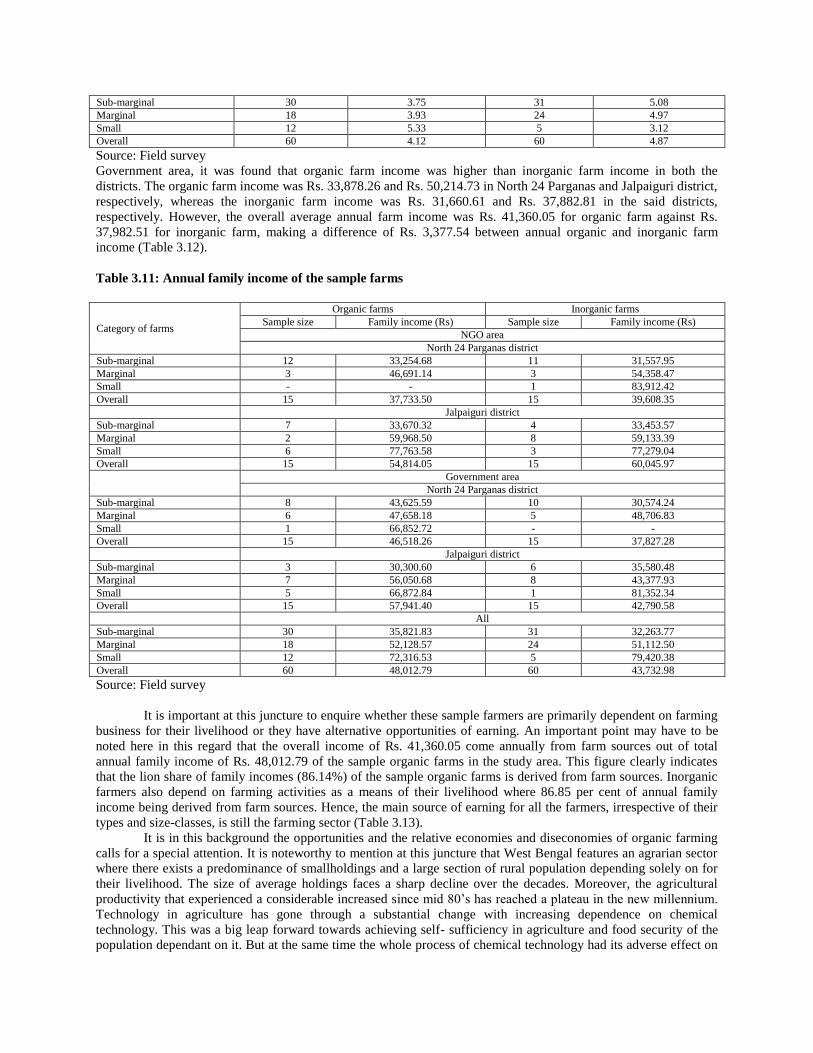
Table 3.11 reveals that the family income is lower for sample organic farms than that of sample inorganic
farms in both North 24 Parganas and Jalpaiguri districts under NGO area. The annual earning of sample organic
farms is to the tune of Rs. 37,733.50 and Rs. 54,814.05 in North 24 Parganas and Jalpaiguri districts respectively.
On the other hand, earning of the sample inorganic farms is Rs. 39,608.35 and Rs. 60,045.97 in the said districts
respectively.
The reverse picture is observed in the farms under Government jurisdiction. The sample organic farms earn
higher income per year than sample inorganic farms in both the districts. Organic farms earn Rs. 46,518.26 in North
24 Parganas and Rs. 57,941.40 in Jalpaiguri while income of the inorganic farms registers Rs. 37,827.28 and Rs.
42,790.58 in the two districts respectively. The overall average annual family income of the sample households in
the study area was Rs. 48,012.79 for organic farm, where as it was Rs. 43,732.98 for inorganic farm making an
approximate higher income of Rs. 4,279.81 of organic farm over inorganic farm.
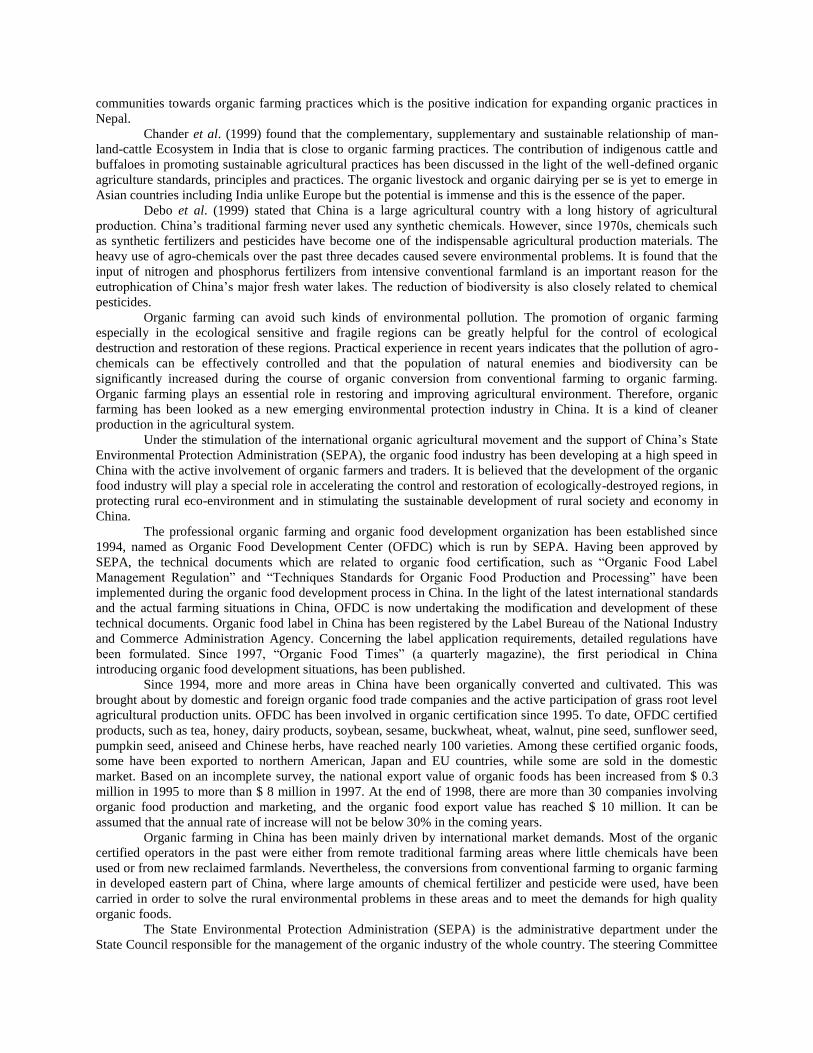
3.6 Annual farm income
It is evident from that the annual farm income was lower for organic sample farms in both North 24
Parganas (Rs. 33,240.16) and Jalpaiguri (Rs. 51,514.05) districts than that of inorganic sample farms (Rs. 34,390.23
in North 24 Parganas and Rs. 54,052.64 in Jalpaiguri district) working within NGO‟s jurisdiction. Turning to
Table 3.9: Irrigated land of the sample farms
Category of farms
Organic farms Inorganic farms
Sample size Irrigated land (ha) Sample size Irrigated land (ha)
NGO area
North 24 Parganas district
Sub-marginal 12 0.19 (100.00 %) 11 0.23(100.00 %)
Marginal 3 0.59(100.00 %) 3 0.80(100.00 %)
Small - - 1 1.25(100.00 %)
Overall 15 0.32(100.00 %) 15 0.41(100.00 %)
Jalpaiguri district
Sub-marginal 7 0.13 (33.28 %) 4 0.05 (10.28 %)
Marginal 2 0.27 (38.89 %) 8 0.22 (28.86 %)
Small 6 0.74 (51.78 %) 3 0.45 (37.03 %)
Overall 15 0.40 (41.43 %) 15 0.26 (27.86)
Government area
North 24 Parganas district
Sub-marginal 8 0.31(100.00 %) 10 0.33(100.00 %)
Marginal 6 0.62(100.00 %) 5 0.67(100.00 %)
Small 1 1.12(100.00 %) - -
Overall 15 0.47(100.00 %) 15 0.47(100.00 %)
Jalpaiguri district
Sub-marginal 3 0.27 (66.67 %) 6 0.27 (66.67 %)
Marginal 7 0.58 (76.26 %) 8 0.43 (67.49 %)
Small 5 0.85 (74.45 %) 1 0.92 (82.14 %)
Overall 15 0.65 (75.02 %) 15 0.40 (68.97 %)
All
Sub-marginal 30 0.22 (75.86 %) 31 0.27 (87.10 %)
Marginal 18 0.56 (82.35 %) 24 0.46 (64.79 %)
Small 12 0.82 (64.57 %) 5 0.70 (58.82 %
Overall 60 0.44 (73.33 %) 60 0.38 (70.37 %)
Source: Field survey
Table 3.10: Number of livestock of the sample farms
Category of farms
Organic farms Inorganic farms
Sample size No. of livestock Sample size No. of livestock
NGO area
North 24 Parganas district
Sub-marginal 12 3.60 11 6.08
Marginal 3 4.80 3 4.33
Small - - 1 4.00
Overall 15 4.00 15 5.59
Jalpaiguri district
Sub-marginal 7 2.86 4 5.33
Marginal 2 4.00 8 4.00
Small 6 5.83 3 2.20
Overall 15 4.20 15 3.67
Government area
North 24 Parganas district
Sub-marginal 8 4.67 10 3.67
Marginal 6 3.00 5 4.17
Small 1 4.00 - -
Overall 15 4.07 15 3.87
Jalpaiguri district
Sub-marginal 3 4.00 6 5.44
Marginal 7 4.33 8 6.67
Small 5 5.00 1 5.00
Overall 15 4.53 15 6.07
All
Sub-marginal 30 3.75 31 5.08
Marginal 18 3.93 24 4.97
Small 12 5.33 5 3.12
Overall 60 4.12 60 4.87
Source: Field survey
Government area, it was found that organic farm income was higher than inorganic farm income in both the
districts. The organic farm income was Rs. 33,878.26 and Rs. 50,214.73 in North 24 Parganas and Jalpaiguri district,
respectively, whereas the inorganic farm income was Rs. 31,660.61 and Rs. 37,882.81 in the said districts,
respectively. However, the overall average annual farm income was Rs. 41,360.05 for organic farm against Rs.
37,982.51 for inorganic farm, making a difference of Rs. 3,377.54 between annual organic and inorganic farm
income (Table 3.12).
Table 3.11: Annual family income of the sample farms
Category of farms
Organic farms Inorganic farms
Sample size Family income (Rs) Sample size Family income (Rs)
NGO area
North 24 Parganas district
Sub-marginal 12 33,254.68 11 31,557.95
Marginal 3 46,691.14 3 54,358.47
Small - - 1 83,912.42
Overall 15 37,733.50 15 39,608.35
Jalpaiguri district
Sub-marginal 7 33,670.32 4 33,453.57
Marginal 2 59,968.50 8 59,133.39
Small 6 77,763.58 3 77,279.04
Overall 15 54,814.05 15 60,045.97
Government area
North 24 Parganas district
Sub-marginal 8 43,625.59 10 30,574.24
Marginal 6 47,658.18 5 48,706.83
Small 1 66,852.72 - -
Overall 15 46,518.26 15 37,827.28
Jalpaiguri district
Sub-marginal 3 30,300.60 6 35,580.48
Marginal 7 56,050.68 8 43,377.93
Small 5 66,872.84 1 81,352.34
Overall 15 57,941.40 15 42,790.58
All
Sub-marginal 30 35,821.83 31 32,263.77
Marginal 18 52,128.57 24 51,112.50
Small 12 72,316.53 5 79,420.38
Overall 60 48,012.79 60 43,732.98
Source: Field survey
It is important at this juncture to enquire whether these sample farmers are primarily dependent on farming
business for their livelihood or they have alternative opportunities of earning. An important point may have to be
noted here in this regard that the overall income of Rs. 41,360.05 come annually from farm sources out of total
annual family income of Rs. 48,012.79 of the sample organic farms in the study area. This figure clearly indicates
that the lion share of family incomes (86.14%) of the sample organic farms is derived from farm sources. Inorganic
farmers also depend on farming activities as a means of their livelihood where 86.85 per cent of annual family
income being derived from farm sources. Hence, the main source of earning for all the farmers, irrespective of their
types and size-classes, is still the farming sector (Table 3.13).
It is in this background the opportunities and the relative economies and diseconomies of organic farming
calls for a special attention. It is noteworthy to mention at this juncture that West Bengal features an agrarian sector
where there exists a predominance of smallholdings and a large section of rural population depending solely on for
their livelihood. The size of average holdings faces a sharp decline over the decades. Moreover, the agricultural
productivity that experienced a considerable increased since mid 80‟s has reached a plateau in the new millennium.
Technology in agriculture has gone through a substantial change with increasing dependence on chemical
technology. This was a big leap forward towards achieving self- sufficiency in agriculture and food security of the
population dependant on it. But at the same time the whole process of chemical technology had its adverse effect on

degrading the soil and the nutrients therein in the long run. Consideration of health hazards arising out of such usage
of chemicals comes into fore. It is in this background the present study enquiring into the alternative technology in
agriculture and its prospects derives attention.
Table 3.12: Annual farm income of the sample farms
Category of farms
Organic farms Inorganic farms
Sample size Farm income (Rs) Sample size Farm income (Rs)
NGO area
North 24 Parganas district
Sub-marginal 12 27,754.68 11 25,474.62
Marginal 3 44,211.14 3 53,291.80
Small - - 1 75,757.25
Overall 15 33,240.16 15 34,390.23
Jalpaiguri district
Sub-marginal 7 33,384.61 4 29,953.57
Marginal 2 47,018.50 8 48,504.81
Small 6 74,163.58 3 76,279.04
Overall 15 51,514.05 15 54,052.64
Government area
North 24 Parganas district
Sub-marginal 8 26,825.59 10 24,963.13
Marginal 6 39,978.18 5 41,706.83
Small 1 66,852.72 - -
Overall 15 33,878.26 15 31,660.61
Jalpaiguri district
Sub-marginal 3 28,600.60 6 27,024.92
Marginal 7 44,272.91 8 41,227.93
Small 5 65,232.84 1 76,269.14
Overall 15 50,214.73 15 37,882.81
All
Sub-marginal 30 28,905.17 31 26,187.61
Marginal 18 43,136.10 24 45,261.31
Small 12 69,833.20 5 76,172.70
Overall 60 41,360.05 60 37,982.51
Source: Field survey
Table 3.13: Percentage of farm income over family income of the sample farms
Category of farms
Organic farms Inorganic farms
Sample size % of Farm income Sample size % of Farm income
NGO area
North 24 Parganas district
Sub-marginal 12 83.46 11 80.72
Marginal 3 94.69 3 98.04
Small - - 1 90.28
Overall 15 88.09 15 86.83
Jalpaiguri district
Sub-marginal 7 99.15 4 89.54
Marginal 2 78.41 8 82.03
Small 6 95.37 3 98.71
Overall 15 93.98 15 90.02
Government area
North 24 Parganas district
Sub-marginal 8 61.49 10 81.65
Marginal 6 83.89 5 85.63
Small 1 100.00 - -
Overall 15 72.83 15 83.70
Jalpaiguri district
Sub-marginal 3 94.39 6 75.95
Marginal 7 78.99 8 95.04
Small 5 97.55 1 93.76
Overall 15 86.66 15 88.53
All
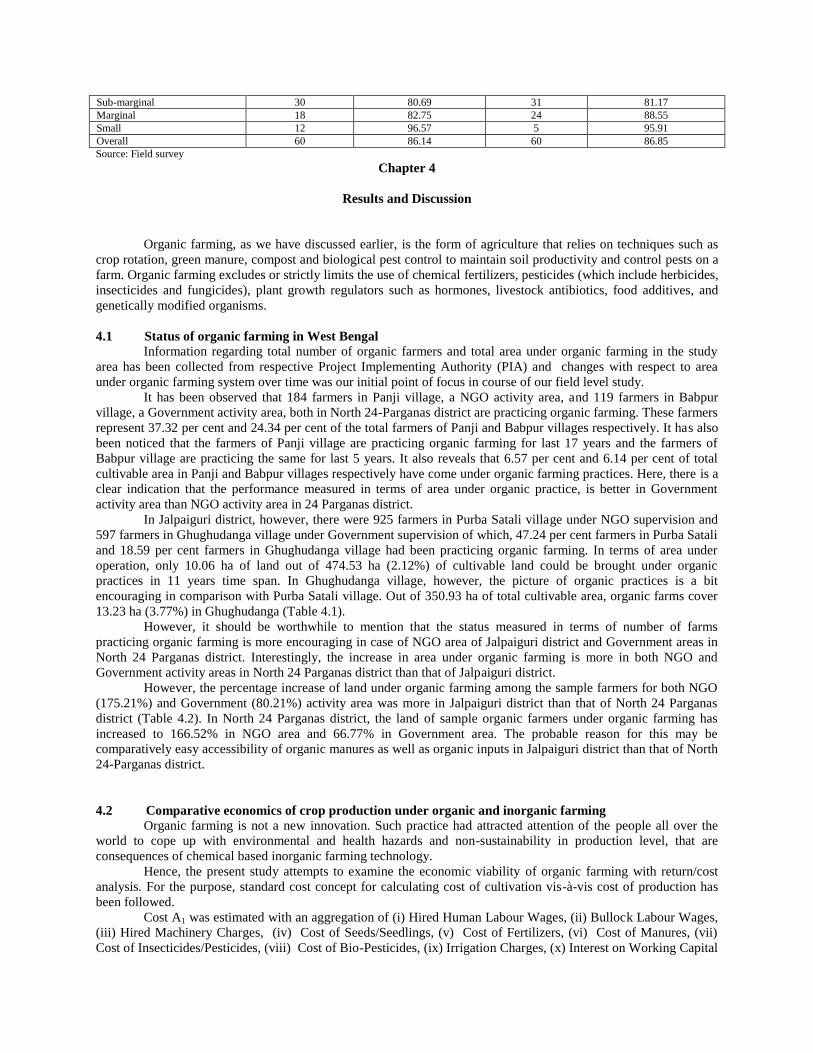
Sub-marginal 30 80.69 31 81.17
Marginal 18 82.75 24 88.55
Small 12 96.57 5 95.91
Overall 60 86.14 60 86.85
Source: Field survey
Chapter 4
Results and Discussion
Organic farming, as we have discussed earlier, is the form of agriculture that relies on techniques such as
crop rotation, green manure, compost and biological pest control to maintain soil productivity and control pests on a
farm. Organic farming excludes or strictly limits the use of chemical fertilizers, pesticides (which include herbicides,
insecticides and fungicides), plant growth regulators such as hormones, livestock antibiotics, food additives, and
genetically modified organisms.
4.1 Status of organic farming in West Bengal
Information regarding total number of organic farmers and total area under organic farming in the study
area has been collected from respective Project Implementing Authority (PIA) and changes with respect to area
under organic farming system over time was our initial point of focus in course of our field level study.
It has been observed that 184 farmers in Panji village, a NGO activity area, and 119 farmers in Babpur
village, a Government activity area, both in North 24-Parganas district are practicing organic farming. These farmers
represent 37.32 per cent and 24.34 per cent of the total farmers of Panji and Babpur villages respectively. It has also
been noticed that the farmers of Panji village are practicing organic farming for last 17 years and the farmers of
Babpur village are practicing the same for last 5 years. It also reveals that 6.57 per cent and 6.14 per cent of total
cultivable area in Panji and Babpur villages respectively have come under organic farming practices. Here, there is a
clear indication that the performance measured in terms of area under organic practice, is better in Government
activity area than NGO activity area in 24 Parganas district.
In Jalpaiguri district, however, there were 925 farmers in Purba Satali village under NGO supervision and
597 farmers in Ghughudanga village under Government supervision of which, 47.24 per cent farmers in Purba Satali
and 18.59 per cent farmers in Ghughudanga village had been practicing organic farming. In terms of area under
operation, only 10.06 ha of land out of 474.53 ha (2.12%) of cultivable land could be brought under organic
practices in 11 years time span. In Ghughudanga village, however, the picture of organic practices is a bit
encouraging in comparison with Purba Satali village. Out of 350.93 ha of total cultivable area, organic farms cover
13.23 ha (3.77%) in Ghughudanga (Table 4.1).
However, it should be worthwhile to mention that the status measured in terms of number of farms
practicing organic farming is more encouraging in case of NGO area of Jalpaiguri district and Government areas in
North 24 Parganas district. Interestingly, the increase in area under organic farming is more in both NGO and
Government activity areas in North 24 Parganas district than that of Jalpaiguri district.
However, the percentage increase of land under organic farming among the sample farmers for both NGO
(175.21%) and Government (80.21%) activity area was more in Jalpaiguri district than that of North 24 Parganas
district (Table 4.2). In North 24 Parganas district, the land of sample organic farmers under organic farming has
increased to 166.52% in NGO area and 66.77% in Government area. The probable reason for this may be
comparatively easy accessibility of organic manures as well as organic inputs in Jalpaiguri district than that of North
24-Parganas district.
4.2 Comparative economics of crop production under organic and inorganic farming Organic farming is not a new innovation. Such practice had attracted attention of the people all over the
world to cope up with environmental and health hazards and non-sustainability in production level, that are
consequences of chemical based inorganic farming technology.
Hence, the present study attempts to examine the economic viability of organic farming with return/cost
analysis. For the purpose, standard cost concept for calculating cost of cultivation vis-à-vis cost of production has
been followed.
Cost A1 was estimated with an aggregation of (i) Hired Human Labour Wages, (ii) Bullock Labour Wages,
(iii) Hired Machinery Charges, (iv) Cost of Seeds/Seedlings, (v) Cost of Fertilizers, (vi) Cost of Manures, (vii)
Cost of Insecticides/Pesticides, (viii) Cost of Bio-Pesticides, (ix) Irrigation Charges, (x) Interest on Working Capital

(it has been calculated on the basis of interest on agricultural loan for Kisan Credit Card holder and the rate is 4 %
per annum, i.e. Rs.3.30 per 1000 rupees per month), (xi) Land Revenue & Taxes (it is nil for sub-marginal, marginal
and small farmers at present as per Government Rules), (xii) Depreciation on Farm Implements & Machineries (it
has been calculated on the basis of an assumption for Rs.0.25 per day, i.e. Rs.7.50 per month (30 days) and it
depends on duration of crop period, (xii) Miscellaneous Expenses (if any).
Table 4.1: Status of organic farming in respect to number of farms and land area in hectare
Particulars Status
District North 24 Parganas Jalpaiguri
Block Baduria Barasat I Kalchini Jalpaiguri Sadar
Village Panji Babpur Purba Satali Ghughudanga
Name of the project Grow organic food Jaibo gram prakalpa Food security through
NRM Jaibo gram prakalpa
Project implementing
authority (PIA) NGO (SEVA)
Department of Agriculture,
GoWB NGO (LKP)
Department of
Agriculture, GoWB
Funding agency Indienhilfee e.g.-
(German)
Government of West
Bengal Danida (Denmark)
Government of West
Bengal
Total farmers 493 489 925 597
Number of farmers under
organic farming
184
(37.32)
119
(24.34)
437
(47.24)
111
(18.59)
Total area (ha) 121.31 182.08 474.53 350.93
Area under organic farming (ha)
7.97 (6.57)
11.18 (6.14)
10.06 (2.12)
13.23 (3.77)
Duration of organic
farming in the village (years)
17 5 11 5
Source: Farmers‟ register & Land register of PIA (Note: Figure in parentheses indicates the percentage of organic farmers & organic land to total
farmers & total land of the village)
Table 4.2: Status of sample organic farms in respect to organic farm
(area in ha.)
Organization Duration of practicing organic farming
(years) Total land (ha)
Initial
land (ha)
Present
land(ha)
Change
(ha)
in organic farms
North 24 Parganas district
NGO (SEVA) 17 0.32 0.03 (9.38) 0.08
(25.00)
0.05
(166.52)
Govt. of WB 5 0.47 0.03
(6.38) 0.05
(10.64) 0.02
(66.77)
Jalpaiguri district
NGO (LKP) 11 0.84 0.04
(4.76)
0.11
(13.10)
0.07
(175.21)
Govt. of WB 5 0.86 0.05
(5.81) 0.09
(10.47) 0.04
(80.21)
Source: Farmers‟ register & Land register of PIA (Note: Figure in parentheses indicates the percentage of organic land to total land & percentage
of change)
Cost A2 was calculated by adding the rent for leased in land with Cost A1. But, as the sample farmers of the
study area are the owner operating farmer, the value for Cost A1 and Cost A2 have been expressed by an identical
term (assuming lease rent to be zero).
Cost B1 is expressed by adding interest on fixed capital @ Rs.0.20 per day, i.e. Rs.6.00 per month of 30
days to the Cost A2.
Cost B2 was obtained by adding the rent for own land which has been calculated on the basis of rent for
leased in land prevailing at the study area during the study period to Cost B1.
Finally, adding the imputed value of family labour to Cost B2, Cost C has been calculated.
So, it is clear from the above discussion that the Cost A2, Cost B1 and Cost B2 are not so significant in
determining the cost of cultivation, irrespective of the system of farm operation. Only cost A1 does play a vital role
for variation in cost of cultivation of both organic and inorganic farming system. So in this section, despite the
analysis of total cost of cultivation, an in depth analysis of cost A1 has been undertaken for identifying the actual
factor(s) that are responsible for variation in cost of cultivation between organic and inorganic farming system.
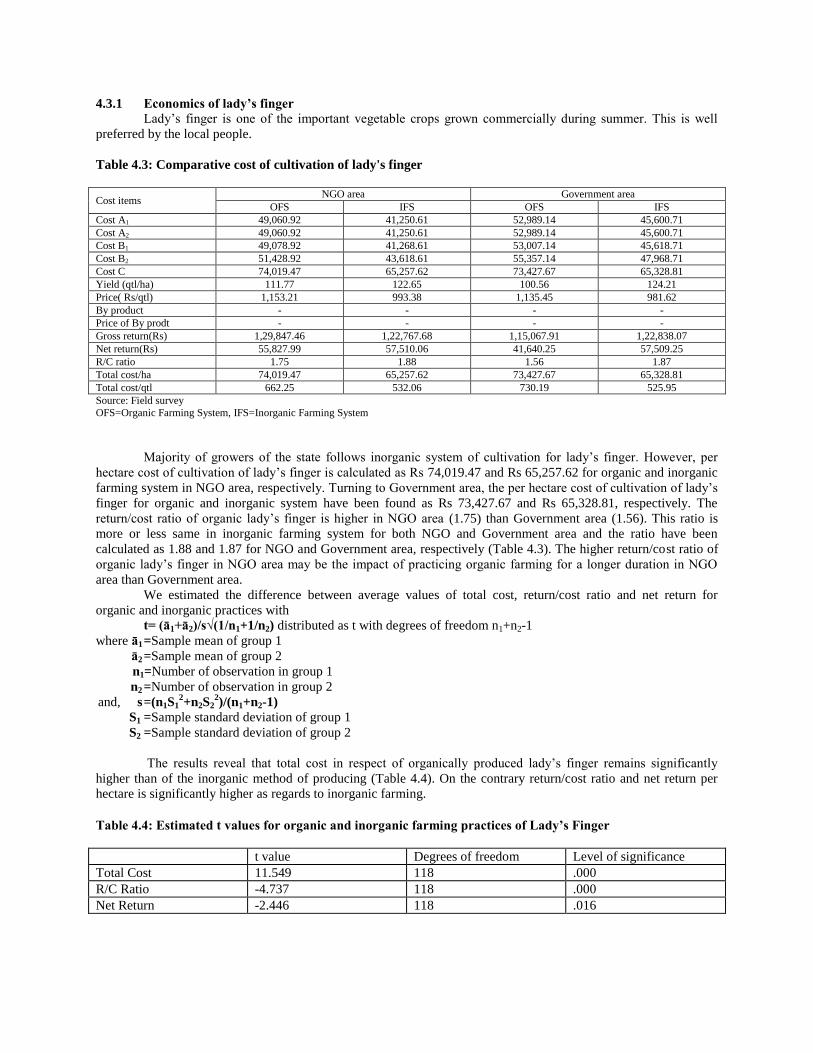
4.3.1 Economics of lady’s finger
Lady‟s finger is one of the important vegetable crops grown commercially during summer. This is well
preferred by the local people.
Table 4.3: Comparative cost of cultivation of lady's finger
Cost items NGO area Government area
OFS IFS OFS IFS
Cost A1 49,060.92 41,250.61 52,989.14 45,600.71
Cost A2 49,060.92 41,250.61 52,989.14 45,600.71
Cost B1 49,078.92 41,268.61 53,007.14 45,618.71
Cost B2 51,428.92 43,618.61 55,357.14 47,968.71
Cost C 74,019.47 65,257.62 73,427.67 65,328.81
Yield (qtl/ha) 111.77 122.65 100.56 124.21
Price( Rs/qtl) 1,153.21 993.38 1,135.45 981.62
By product - - - -
Price of By prodt - - - -
Gross return(Rs) 1,29,847.46 1,22,767.68 1,15,067.91 1,22,838.07
Net return(Rs) 55,827.99 57,510.06 41,640.25 57,509.25
R/C ratio 1.75 1.88 1.56 1.87
Total cost/ha 74,019.47 65,257.62 73,427.67 65,328.81
Total cost/qtl 662.25 532.06 730.19 525.95
Source: Field survey
OFS=Organic Farming System, IFS=Inorganic Farming System
Majority of growers of the state follows inorganic system of cultivation for lady‟s finger. However, per
hectare cost of cultivation of lady‟s finger is calculated as Rs 74,019.47 and Rs 65,257.62 for organic and inorganic
farming system in NGO area, respectively. Turning to Government area, the per hectare cost of cultivation of lady‟s
finger for organic and inorganic system have been found as Rs 73,427.67 and Rs 65,328.81, respectively. The
return/cost ratio of organic lady‟s finger is higher in NGO area (1.75) than Government area (1.56). This ratio is
more or less same in inorganic farming system for both NGO and Government area and the ratio have been
calculated as 1.88 and 1.87 for NGO and Government area, respectively (Table 4.3). The higher return/cost ratio of
organic lady‟s finger in NGO area may be the impact of practicing organic farming for a longer duration in NGO
area than Government area.
We estimated the difference between average values of total cost, return/cost ratio and net return for
organic and inorganic practices with
t= (ā1+ā2)/s√(1/n1+1/n2) distributed as t with degrees of freedom n1+n2-1
where ā1 =Sample mean of group 1
ā2 =Sample mean of group 2
n1=Number of observation in group 1
n2 =Number of observation in group 2
and, s =(n1S12+n2S2
2)/(n1+n2-1)
S1 =Sample standard deviation of group 1
S2 =Sample standard deviation of group 2
The results reveal that total cost in respect of organically produced lady‟s finger remains significantly
higher than of the inorganic method of producing (Table 4.4). On the contrary return/cost ratio and net return per
hectare is significantly higher as regards to inorganic farming.
Table 4.4: Estimated t values for organic and inorganic farming practices of Lady’s Finger
t value Degrees of freedom Level of significance
Total Cost 11.549 118 .000
R/C Ratio -4.737 118 .000
Net Return -2.446 118 .016

It is observed that the total cost of cultivation of lady‟s finger with organic technology is substantially
higher (approximately Rs 10.000/- per ha) than the total cost of cultivation under inorganic farming practices of the
crop. This is due to higher cost of organic manures that are being used for cultivation of the crop. On the other hand,
cost for plant protection material is higher in inorganic system (Rs. 5,581.24 for NGO area and Rs. 5,149.25 for
Government area) than organic system (Rs. 1,715.56 for NGO area and Rs. 1,713.48 for Government area). The
estimated cost of irrigation in inorganic farm is also higher (Rs. 2,446.81 for NGO area and Rs. 2,463.53 for
Government area) than organic farm (Rs. 2,118.91 for NGO area and Rs. 2,091.54 for Government area) (Table
4.5).
It is the cost of manure in organic farming practices, which remain substantially higher than that of
fertilizers, results in the higher cost of production as regards to organic output. Moreover, human labour component
also seems to be higher in organic method of cropping. As a matter of fact the total cost remains higher than
inorganic output. So, even if the price per quintal of lady‟s finger from organic farms are higher than that of its
inorganic counterpart and hence the gross return per hectare, the net return per hectare and return-cost ratio remains
favourable towards the inorganic farms.
Table 4.5: Cost A1 for cultivation of lady’s finger
Cost items NGO area Government area
OFS IFS OFS IFS
Hired human labour wage 16,178.08 15,479.60 12,955.54 12,443.45
Bullock labour charge 1,676.05 1,676.05 1,676.05 1,676.05
Hired machinery charge 2,173.18 2,161.03 2,191.15 2,186.15
Cost of seed / seedling 8,294.00 8,010.15 8,150.72 8,294.00
Cost of fertilizers 13,221.21 13,239.12
Cost of manures 24,424.92 23,947.04
Cost of p.p. materials 5,581.24 5,149.25
Cost of bio-p.p. materials 1,715.56 1,713.48
Irrigation charge 2,118.91 2,446.81 2,091.54 2,463.53
Interest on working capital 462.88 387.34 500.84 429.20
Land revenue & tax
Deprn.on farm implement 22.50 22.50 22.50 22.50
Miscellaneous expenses 2,240.97 2,068.44 2,331.38 2,186.15
Total 49,060.92 41,250.61 52,989.14 45,600.71
Source: Field survey
So far we have discussed about the vegetable lady‟s finger that is being grown by the farmers with organic
technology. There are also a number of other vegetables like cowpea, brinjal, cauliflower and chilly that is also
grown by the farmers with alternative technology. In all cases the total cost of organic production process remains
higher in comparison with the output produced by chemical technology. But the produce of organic farms has an
edge over others in terms of market price and hence gross return (see appendix for cost and returns for other
vegetables).
It is important at this juncture to mention that the crops, of which we are concerned, are vegetable crops.
These vegetables have a good market opportunity. But perishable nature of the produce necessitates a well-knit
network of market access and transportation. Moreover, warehousing facilities for vegetables are still meagre in the
state.
4.3.2 Economics of potato
Normally, farmers grow potato in winter season as commercial venture. The production of potato is higher
in winter season with intensive use of synthetic fertilizers in West Bengal. Potato covers 3.4 per cent of gross
cropped area of the state (2004-05).
There is a significant difference between organic and inorganic system of potato cultivation in terms of
productivity, total cost, gross return, net return and return / cost ratio. The total cost of cultivation is higher in
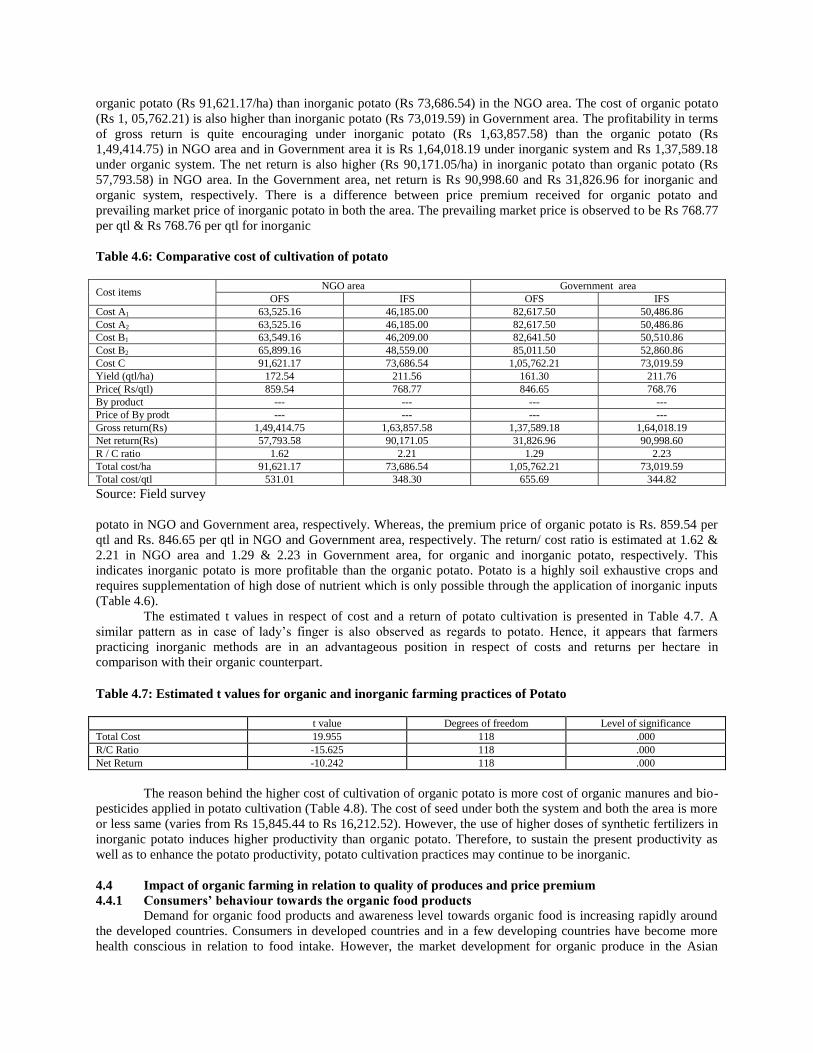
organic potato (Rs 91,621.17/ha) than inorganic potato (Rs 73,686.54) in the NGO area. The cost of organic potato
(Rs 1, 05,762.21) is also higher than inorganic potato (Rs 73,019.59) in Government area. The profitability in terms
of gross return is quite encouraging under inorganic potato (Rs 1,63,857.58) than the organic potato (Rs
1,49,414.75) in NGO area and in Government area it is Rs 1,64,018.19 under inorganic system and Rs 1,37,589.18
under organic system. The net return is also higher (Rs 90,171.05/ha) in inorganic potato than organic potato (Rs
57,793.58) in NGO area. In the Government area, net return is Rs 90,998.60 and Rs 31,826.96 for inorganic and
organic system, respectively. There is a difference between price premium received for organic potato and
prevailing market price of inorganic potato in both the area. The prevailing market price is observed to be Rs 768.77
per qtl & Rs 768.76 per qtl for inorganic
Table 4.6: Comparative cost of cultivation of potato
Cost items NGO area Government area
OFS IFS OFS IFS
Cost A1 63,525.16 46,185.00 82,617.50 50,486.86
Cost A2 63,525.16 46,185.00 82,617.50 50,486.86
Cost B1 63,549.16 46,209.00 82,641.50 50,510.86
Cost B2 65,899.16 48,559.00 85,011.50 52,860.86
Cost C 91,621.17 73,686.54 1,05,762.21 73,019.59
Yield (qtl/ha) 172.54 211.56 161.30 211.76
Price( Rs/qtl) 859.54 768.77 846.65 768.76
By product --- --- --- ---
Price of By prodt --- --- --- ---
Gross return(Rs) 1,49,414.75 1,63,857.58 1,37,589.18 1,64,018.19
Net return(Rs) 57,793.58 90,171.05 31,826.96 90,998.60
R / C ratio 1.62 2.21 1.29 2.23
Total cost/ha 91,621.17 73,686.54 1,05,762.21 73,019.59
Total cost/qtl 531.01 348.30 655.69 344.82
Source: Field survey
potato in NGO and Government area, respectively. Whereas, the premium price of organic potato is Rs. 859.54 per
qtl and Rs. 846.65 per qtl in NGO and Government area, respectively. The return/ cost ratio is estimated at 1.62 &
2.21 in NGO area and 1.29 & 2.23 in Government area, for organic and inorganic potato, respectively. This
indicates inorganic potato is more profitable than the organic potato. Potato is a highly soil exhaustive crops and
requires supplementation of high dose of nutrient which is only possible through the application of inorganic inputs
(Table 4.6).
The estimated t values in respect of cost and a return of potato cultivation is presented in Table 4.7. A
similar pattern as in case of lady‟s finger is also observed as regards to potato. Hence, it appears that farmers
practicing inorganic methods are in an advantageous position in respect of costs and returns per hectare in
comparison with their organic counterpart.
Table 4.7: Estimated t values for organic and inorganic farming practices of Potato
t value Degrees of freedom Level of significance
Total Cost 19.955 118 .000
R/C Ratio -15.625 118 .000
Net Return -10.242 118 .000
The reason behind the higher cost of cultivation of organic potato is more cost of organic manures and bio-
pesticides applied in potato cultivation (Table 4.8). The cost of seed under both the system and both the area is more
or less same (varies from Rs 15,845.44 to Rs 16,212.52). However, the use of higher doses of synthetic fertilizers in
inorganic potato induces higher productivity than organic potato. Therefore, to sustain the present productivity as
well as to enhance the potato productivity, potato cultivation practices may continue to be inorganic.
4.4 Impact of organic farming in relation to quality of produces and price premium
4.4.1 Consumers’ behaviour towards the organic food products
Demand for organic food products and awareness level towards organic food is increasing rapidly around
the developed countries. Consumers in developed countries and in a few developing countries have become more
health conscious in relation to food intake. However, the market development for organic produce in the Asian

countries is in a nascent stage. Scanty information is available for organic food market in India and the consumers‟
attitude towards these products. Mostly the organic foods in our country are produced targeting the export markets
of developed world. Along with the increase in production, marketing of the organic products, awareness level of
the consumer ultimately influences the price premium for the organic produce. Study of the behaviour of the
consumers towards the organic product is one of the important aspects for the future of the organic practices in
agriculture. Consumers may not know whether a product is produced using organic or conventional methods, not
even after repeated purchase and consumption, unless they are told so. If an individual cannot clearly differentiate
between two alternative products, a price premium on the organic product can confuse and/or affects the individual
purchase decision, in favour of the cheaper product. However, the domestic market of the organic product in India is
at the budding stage. But recently demand for organic foods in domestic market of India is also showing upward
trend and therefore, the present part is devoted to understand consumer awareness level and attitude towards the
organic foods for measuring the impact of organic farming in relation to quality of produces and price premium.
Table 4.8: Cost A1 for cultivation of potato
Cost items NGO area Government area
OFS IFS OFS IFS
Hired human labour wage 18,304.79 17,973.97 14,843.61 14,449.07
Bullock labour charge 2,259.02 2,259.02 2,234.84 2,259.02
Hired machinery charge 2,145.53 2,146.36 15,845.44 2,187.31
Cost of seed / seedling 16,066.66 16,212.52 15,845.44 15,984.10
Cost of fertilizers 6,106.59 5,897.37
Cost of manures 25,617.70 25,889.99
Cost of p.p. materials 3,843.28 3,771.02
Cost of bio-p.p. materials 1,726.19 1,752.97
Irrigation charge 4,994.44 4,812.29 5,080.26 4,506.73
Interest on working capital 792.82 559.05 784.45 614.92
Land revenue & tax
Deprn.on farm implement 30.00 30.00 30.00 30.00
Miscellaneous expenses 3,181.05 3,625.43 3,279.23 3,677.14
Total 63,525.16 46,185.00 82,617.50 50,486.86
Source: Field survey
4.4.2 Distribution of the consumers
To measure the impact on quality of organic farm product and its price, consumers‟ perception has been
studied in eight selected markets, where organic vegetables are sold by the organic farmers. These output markets
were chosen purposively for the study for the fact that agricultural produces with organic technology flow to these
markets. At the same time produce from other farms using prevailing technology have ample opportunity in these
markets, so that the consumer is at liberty to choose between organic and inorganic produces. These markets cater
the potential buyers of organic vegetables of the locality and neighbourhood. To assess the consumers‟ preference in
this regard, a sample of 126 buyers from different income group were selected (Table 4.9).
Table 4.9: Marketwise income profile of the respondent consumers
Sn Name of the market Location (within WB)
Number of respondent under monthly income group (in Rupees) Total
Up to 10,000/- >10,000/- to <20,000/- 20,000/- and above
1 Kalyan Nagar Khardah 14 6 - 20
2 Prantic Salt Lake 4 11 2 17
3 Trangular Park Salt Lake 1 4 4 9
4 Laboni Salt Lake 3 6 11 20
5 Kasba Kolkata 7 7 2 16
6 NChandan Pukur Barrackpore 5 6 - 11
7 Harishpur Basirhat 16 4 - 20
8 Atghara Baduria 12 1 - 13
Overall 62
(49.21%) 45
(35.71%) 19
(15.08%) 126
(100%)
Source: Market survey
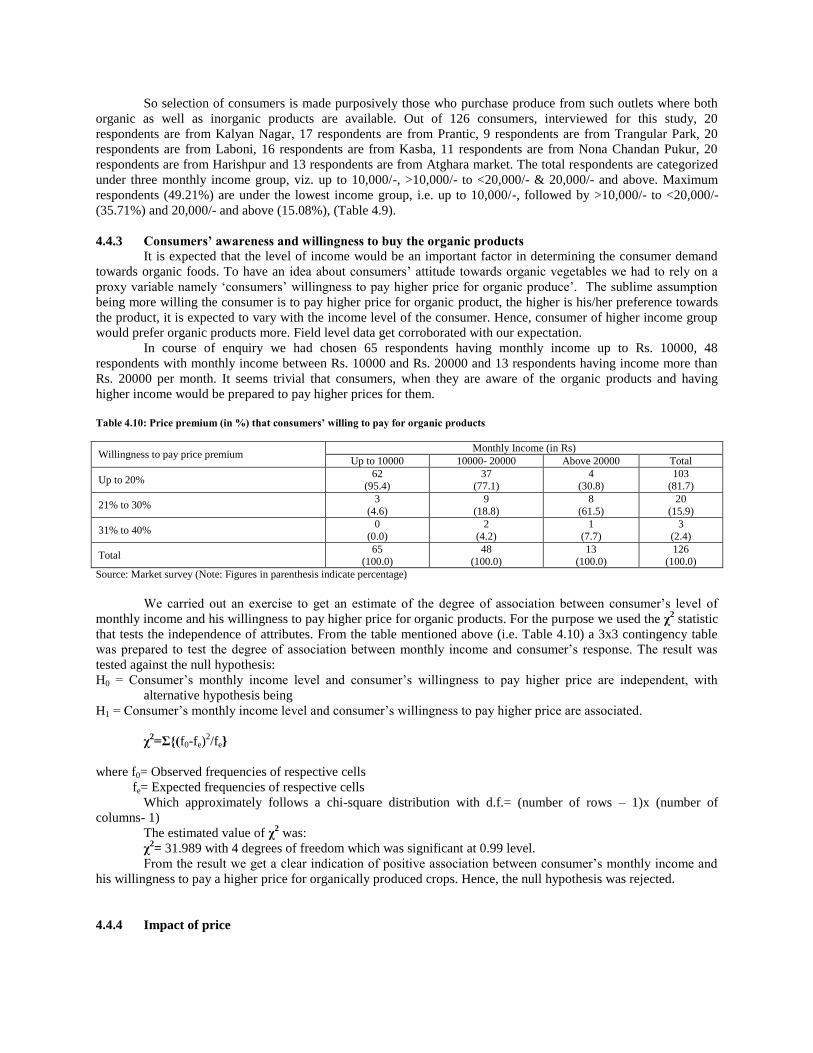
So selection of consumers is made purposively those who purchase produce from such outlets where both
organic as well as inorganic products are available. Out of 126 consumers, interviewed for this study, 20
respondents are from Kalyan Nagar, 17 respondents are from Prantic, 9 respondents are from Trangular Park, 20
respondents are from Laboni, 16 respondents are from Kasba, 11 respondents are from Nona Chandan Pukur, 20
respondents are from Harishpur and 13 respondents are from Atghara market. The total respondents are categorized
under three monthly income group, viz. up to 10,000/-, >10,000/- to <20,000/- & 20,000/- and above. Maximum
respondents (49.21%) are under the lowest income group, i.e. up to 10,000/-, followed by >10,000/- to <20,000/-
(35.71%) and 20,000/- and above (15.08%), (Table 4.9).
4.4.3 Consumers’ awareness and willingness to buy the organic products
It is expected that the level of income would be an important factor in determining the consumer demand
towards organic foods. To have an idea about consumers‟ attitude towards organic vegetables we had to rely on a
proxy variable namely „consumers‟ willingness to pay higher price for organic produce‟. The sublime assumption
being more willing the consumer is to pay higher price for organic product, the higher is his/her preference towards
the product, it is expected to vary with the income level of the consumer. Hence, consumer of higher income group
would prefer organic products more. Field level data get corroborated with our expectation.
In course of enquiry we had chosen 65 respondents having monthly income up to Rs. 10000, 48
respondents with monthly income between Rs. 10000 and Rs. 20000 and 13 respondents having income more than
Rs. 20000 per month. It seems trivial that consumers, when they are aware of the organic products and having
higher income would be prepared to pay higher prices for them.
Table 4.10: Price premium (in %) that consumers’ willing to pay for organic products
Willingness to pay price premium Monthly Income (in Rs)
Up to 10000 10000- 20000 Above 20000 Total
Up to 20% 62
(95.4)
37
(77.1)
4
(30.8)
103
(81.7)
21% to 30% 3
(4.6)
9
(18.8)
8
(61.5)
20
(15.9)
31% to 40% 0
(0.0)
2
(4.2)
1
(7.7)
3
(2.4)
Total 65
(100.0)
48
(100.0)
13
(100.0)
126
(100.0)
Source: Market survey (Note: Figures in parenthesis indicate percentage)
We carried out an exercise to get an estimate of the degree of association between consumer‟s level of
monthly income and his willingness to pay higher price for organic products. For the purpose we used the χ2 statistic
that tests the independence of attributes. From the table mentioned above (i.e. Table 4.10) a 3x3 contingency table
was prepared to test the degree of association between monthly income and consumer‟s response. The result was
tested against the null hypothesis:
H0 = Consumer‟s monthly income level and consumer‟s willingness to pay higher price are independent, with
alternative hypothesis being
H1 = Consumer‟s monthly income level and consumer‟s willingness to pay higher price are associated.
χ2=Σ{(f0-fe)
2/fe}
where f0= Observed frequencies of respective cells
fe= Expected frequencies of respective cells
Which approximately follows a chi-square distribution with d.f.= (number of rows – 1)x (number of
columns- 1)
The estimated value of χ2 was:
χ2= 31.989 with 4 degrees of freedom which was significant at 0.99 level.
From the result we get a clear indication of positive association between consumer‟s monthly income and
his willingness to pay a higher price for organically produced crops. Hence, the null hypothesis was rejected.
4.4.4 Impact of price

The above discussion of this section highlights that the price of organic farm product may play a vital role
for higher earnings from organic farm operation. So, to examine the veracity of this opinion, attempt has been
undertaken to judge the prevailing price of organic farm product in a comparative scale to inorganic farm product in
the study area.
4.4.4.1 Overall price of all crops
As compared to price of organic farm product with inorganic one, the significant higher prices registered
for organic products in both NGO and Government area. Table 4.11 reveals that the price of organic farm product
for all crops is substantially higher in comparison with the price of inorganic farm product.
Table 4.11: Comparative price (Rs/qtl) of organic & inorganic farm products in NGO area
Sn Crop
NGO area
North 24 Parganas Jalpaiguri
Organic Inorganic Organic Inorganic
1 Lady‟s finger 1201.60 1006.34 1104.82 980.42
2 Cowpea 1216.62 996.73 1185.69 990.51
3 Brinjal 791.05 700.93 771.63 690.94
4 Cauliflower 881.17 826.10 860.39 801.89
5 Potato 866.15 781.04 852.93 756.50
6 Chilli 1646.66 1526.50 1615.44 1509.53
Source: Market survey
The data furnish in Table 4.11 suggest that only cauliflower in Government area of Jalpaiguri district do
not avail higher price in organic market. Though, cauliflower is sold in premium price in Government area of North
24 Parganas district. However, all other crops in both the districts received premium price in Government area.
4.4.4.2 The Price premium
The important points are to be noted here that lady‟s finger, cowpea, brinjal and potato in NGO area of both
North 24 Parganas and Jalpaiguri district are sold over 10 % higher price as compared to inorganic farm product
though cauliflower and chilli are sold by a price of less than 10 % higher price as compared to inorganic farm
product in the same market (Table 4.12).
Table 4.12: Comparative price (Rs/qtl) of organic & inorganic farm products in Government area
Sn Crop
Government area
North 24 Parganas Jalpaiguri
Organic Inorganic Organic Inorganic
1 Lady‟s finger 1186.58 996.93 1084.32 966.30
2 Cowpea 1199.60 994.32 1126.68 983.45
3 Brinjal 786.05 653.79 768.07 739.80
4 Cauliflower 876.17 826.10 783.17 799.27
5 Potato 861.15 783.04 832.15 754.48
6 Chilli 1651.67 1526.50 1608.38 1514.58
Source: Market survey
Table 4.13: Price premium (Rs/qtl) of organic over inorganic farm products
Sn Crop NGO area Government area
North 24 Parganas Jalpaiguri North 24 Parganas Jalpaiguri
1 Lady‟s finger 195.26
(19.40)
124.40
(12.69)
189.65
(19.02)
118.02
(12.21)
2 Cowpea 219.89
(22.06)
195.18
(19.71)
205.28
(20.65)
143.23
(14.56)
3 Brinjal 90.12
(12.86)
80.69
(11.68)
132.26
(20.23)
28.27
(3.82)
4 Cauliflower 55.07
(6.67)
58.50
(7.30)
50.07
(6.06) -16.10
(- 2.01)
5 Potato 85.11
(10.90)
96.43
(12.75)
78.11
(9.98)
77.67
(10.29)
6 Chilli 120.16 105.91 125.17 93.80

(7.87) (7.02) (8.20) (6.19)
Source: Market survey (Note: Figures in parenthesis indicate price premium in percentage)
Another important observation is that though the organic products, viz. lady‟s finger, cowpea and brinjal in
Government area are sold in more than 10% higher price, yet organic cauliflower, potato and chilli are sold in less
than 10% higher price in the same market of North 24 Parganas district as compared to price of inorganic products.
In Jalpaiguri district more than 10% higher price is received for organic lady‟s finger, cowpea and potato and less
than 10 % higher price is received for organic brinjal and chilli, as compared to the price prevailed in the same
market for inorganic products.
In this area, the very interesting observation is that the organic cauliflower is sold by a price less than 2.01
% of the prevailing price of inorganic cauliflower. Perhaps the small size of organic cauliflower is the factor for
disliking of the consumers. However, the price premium in the study area of both the districts pushed up the farm
income of the organic farmers.
4.5 Farmers’ awareness regarding organic farm practices
To measure the awareness about organic farming, the sample organic farmers have been interviewed with a
structured questionnaire following 5 points ranking scale.
The awareness of the farmers in the field of organic farming is probed and the same has been ranked
through rank score method as 1 (nil), 2 (low), 3 (medium), 4 (strong), and 5 (very strong). The weighted mean of
rank score is presented in Table 4.12.
The weighted mean of rank score reveals that the organic farmers‟ awareness is maximum in relation to the
good quality of the product in both NGO and Government area followed by beneficial attributes of the organic farm
product for the human health. The interesting point may be noted here that the level of awareness of the farmers of
NGO area regarding “high profitable” is placed third by rank, i.e., the farmers of the said area believe that organic
farming system is high profitable than any other system of farming, but the farmers of the Government area consider
this phenomenon by ranking eighth. This may be the cause of practicing organic farming for a longer duration by the
farmers of NGO area. The fact is that during the conversion period from inorganic to organic farming, the yield of
crops is reduced in organic farm and at the initial years application of higher quantity of organic manures is required
for maintaining the status of nutrients in the soil. As a result higher cost involvement for manuring the soil and lower
yield leads lower profit from farm operation. Farmers of Government area are practicing organic farming for last
five years, so the level of their profit of organic farming is not equal to the level of profit that are perceived by the
farmers of NGOs area, who are practicing organic farming for over a decade.
Table 4.14: Ranking of organic farmers’ awareness
Sn Questionnaire NGO area Government area
Score Rank Score Rank
1 High profitable 3.30 3 2.23 8
2 Minimum production risk 2.77 7 2.47 6
3 Higher employment potentiality 2.80 6 3.33 4
4 Lower recurring cost for inputs 2.97 5 3.50 3
5 Beneficial for health 4.17 2 4.33 2
6 Increasing consumer demand 3.20 4 2.50 5
7 Higher price of organic product 2.53 8 2.34 7
8 Good quality 4.20 1 4.63 1
Source: Field survey
4.6 Constraints in adoption of organic farming
Despite having potential the organic farming in West Bengal is almost at nascent stage and several issues
have to be resolved for its promotion. Systematic constraints analysis from the perspective of farmers is an
important step to resolve these issues. The inorganic farmers of the study area of the state express their opinion
about the constraint encountered with organic production; the farmers‟ opinion is collected through focus group
discussion by structured questionnaire. Constraints are analyzed through using Rank Based Quotient (RBQ)
technique for ranking (Table 4.13). Based on the RBQ score, the constraints are ranked. In the next stage, these
constraints have been categorized into four sub-divisions on the basis of their nature, i.e. socio-economic,
infrastructural, environmental and situational. These constraints have been incorporated in the survey schedule using
a five point scoring pattern, i.e. “very strong”, “ strong”, “moderate”, “low” and “nil” giving numeral scores 1, 2, 3,
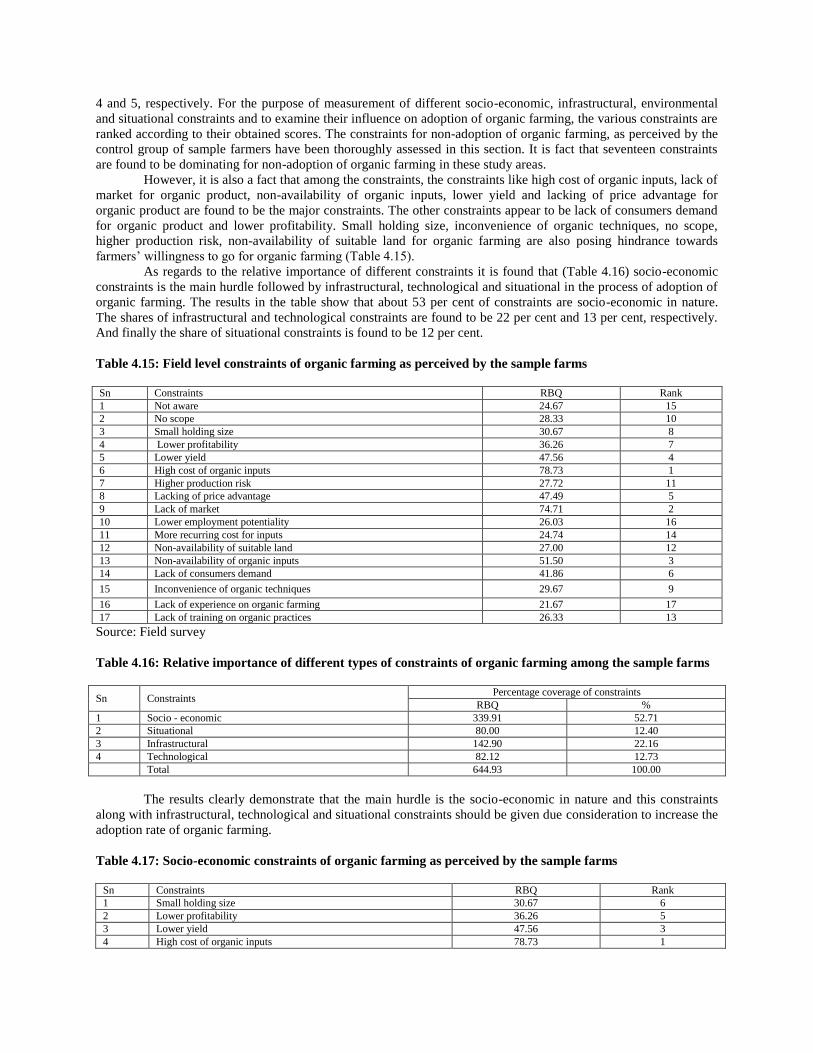
4 and 5, respectively. For the purpose of measurement of different socio-economic, infrastructural, environmental
and situational constraints and to examine their influence on adoption of organic farming, the various constraints are
ranked according to their obtained scores. The constraints for non-adoption of organic farming, as perceived by the
control group of sample farmers have been thoroughly assessed in this section. It is fact that seventeen constraints
are found to be dominating for non-adoption of organic farming in these study areas.
However, it is also a fact that among the constraints, the constraints like high cost of organic inputs, lack of
market for organic product, non-availability of organic inputs, lower yield and lacking of price advantage for
organic product are found to be the major constraints. The other constraints appear to be lack of consumers demand
for organic product and lower profitability. Small holding size, inconvenience of organic techniques, no scope,
higher production risk, non-availability of suitable land for organic farming are also posing hindrance towards
farmers‟ willingness to go for organic farming (Table 4.15).
As regards to the relative importance of different constraints it is found that (Table 4.16) socio-economic
constraints is the main hurdle followed by infrastructural, technological and situational in the process of adoption of
organic farming. The results in the table show that about 53 per cent of constraints are socio-economic in nature.
The shares of infrastructural and technological constraints are found to be 22 per cent and 13 per cent, respectively.
And finally the share of situational constraints is found to be 12 per cent.
Table 4.15: Field level constraints of organic farming as perceived by the sample farms
Sn Constraints RBQ Rank
1 Not aware 24.67 15
2 No scope 28.33 10
3 Small holding size 30.67 8
4 Lower profitability 36.26 7
5 Lower yield 47.56 4
6 High cost of organic inputs 78.73 1
7 Higher production risk 27.72 11
8 Lacking of price advantage 47.49 5
9 Lack of market 74.71 2
10 Lower employment potentiality 26.03 16
11 More recurring cost for inputs 24.74 14
12 Non-availability of suitable land 27.00 12
13 Non-availability of organic inputs 51.50 3
14 Lack of consumers demand 41.86 6
15 Inconvenience of organic techniques 29.67 9
16 Lack of experience on organic farming 21.67 17
17 Lack of training on organic practices 26.33 13
Source: Field survey
Table 4.16: Relative importance of different types of constraints of organic farming among the sample farms
Sn Constraints Percentage coverage of constraints
RBQ %
1 Socio - economic 339.91 52.71
2 Situational 80.00 12.40
3 Infrastructural 142.90 22.16
4 Technological 82.12 12.73
Total 644.93 100.00
The results clearly demonstrate that the main hurdle is the socio-economic in nature and this constraints
along with infrastructural, technological and situational constraints should be given due consideration to increase the
adoption rate of organic farming.
Table 4.17: Socio-economic constraints of organic farming as perceived by the sample farms
Sn Constraints RBQ Rank
1 Small holding size 30.67 6
2 Lower profitability 36.26 5
3 Lower yield 47.56 3
4 High cost of organic inputs 78.73 1
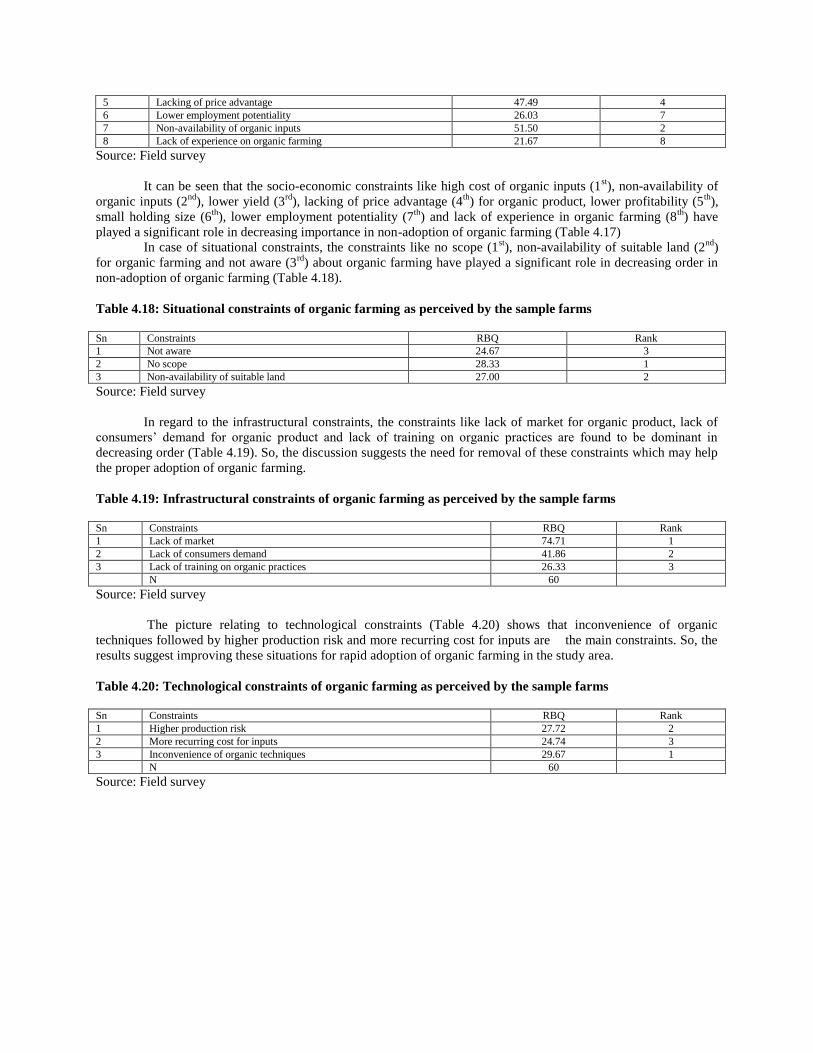
5 Lacking of price advantage 47.49 4
6 Lower employment potentiality 26.03 7
7 Non-availability of organic inputs 51.50 2
8 Lack of experience on organic farming 21.67 8
Source: Field survey
It can be seen that the socio-economic constraints like high cost of organic inputs (1st), non-availability of
organic inputs (2nd
), lower yield (3rd
), lacking of price advantage (4th
) for organic product, lower profitability (5th
),
small holding size (6th
), lower employment potentiality (7th
) and lack of experience in organic farming (8th
) have
played a significant role in decreasing importance in non-adoption of organic farming (Table 4.17)
In case of situational constraints, the constraints like no scope (1st), non-availability of suitable land (2
nd)
for organic farming and not aware (3rd
) about organic farming have played a significant role in decreasing order in
non-adoption of organic farming (Table 4.18).
Table 4.18: Situational constraints of organic farming as perceived by the sample farms
Sn Constraints RBQ Rank
1 Not aware 24.67 3
2 No scope 28.33 1
3 Non-availability of suitable land 27.00 2
Source: Field survey
In regard to the infrastructural constraints, the constraints like lack of market for organic product, lack of
consumers‟ demand for organic product and lack of training on organic practices are found to be dominant in
decreasing order (Table 4.19). So, the discussion suggests the need for removal of these constraints which may help
the proper adoption of organic farming.
Table 4.19: Infrastructural constraints of organic farming as perceived by the sample farms
Sn Constraints RBQ Rank
1 Lack of market 74.71 1
2 Lack of consumers demand 41.86 2
3 Lack of training on organic practices 26.33 3
N 60
Source: Field survey
The picture relating to technological constraints (Table 4.20) shows that inconvenience of organic
techniques followed by higher production risk and more recurring cost for inputs are the main constraints. So, the
results suggest improving these situations for rapid adoption of organic farming in the study area.
Table 4.20: Technological constraints of organic farming as perceived by the sample farms
Sn Constraints RBQ Rank
1 Higher production risk 27.72 2
2 More recurring cost for inputs 24.74 3
3 Inconvenience of organic techniques 29.67 1
N 60
Source: Field survey

Chapter 5
Summary and Conclusion
5.1 Introduction
5.1.1 Prelude
Organic farming is a system of farming which devoid of chemical inputs and in which the biological
potential of the soil and underground water resources are conserved and protected from the natural and human
induced degradation or depletion. Organic agriculture is one of several approaches to sustainable agriculture and
many of the techniques used (e.g. inter-cropping, rotation of crops, mulching, integration of crops and livestock) are
practiced under various agricultural systems. The basic rules of organic production are that natural inputs are
approved and synthetic inputs are prohibited. It is fact that organic farmers are few in number. It is also fact that
consumer demand for organic food and fibre products creates new market opportunities for cultivators and
businesses around the world and thereby it creates new challenges for Food and Agriculture Organisation (FAO). It
is observed that under organic farming practice, yield of crops does not decrease. When the application of organic
manure is done, the availability of all the 16 nutrients is assured. Besides nutrients, in case of organic farming, the
activity of micro-organisms increase manifold. If equal quantity of nutrient is applied through organic manure, then
the question of decrease in yield does not arise. Secondly fertilizer use efficiency will be much higher under organic
conditions, the leaching and evaporation losses will be lesser. Furthermore, the moisture retention capacity of the
soil increases which helps to grow crops even under drought condition.
5.1.2 Objectives of the study
The specific objectives of the study are
(i) To study the status of organic farming in West Bengal;
(ii) To study the comparative economics of crop production under organic and inorganic farming;
(iii) To study the impact of organic farming in relation to quality of produce and price premium;
(iv) To study the farmers‟ awareness regarding organic farm practices;
(v) To study the constraints in adoption of organic farming.
5.1.3 Database and Methodology
The study has been confined to two districts i.e. one from southern part (North 24 Parganas district) and
another from northern part (Jalpaiguri district) of West Bengal. In the second stage, four blocks two from each
district have been selected purposively. These blocks are Barasat-I and Baduria of North 24-Parganas district and
Jalpaiguri Sadar and Kalchini block of Jalpaiguri district. Among the selected blocks, government agency is working
in Barasat-I and Jalpaiguri Sadar Block. NGOs are working in other two blocks.
In the next stage, two bio-villages viz., Babpur village (Barasat-I block) of North 24-Parganas district and
Ghughudanga village (Jalpaiguri Sadar block) of Jalpaiguri district have been selected purposively. Similarly, Panji
village (Baduria block) and Purba Satali village (Kalchini block) of North 24-Parganas and Jalpaiguri district,
respectively have been selected randomly.
5.1.4 Selection of farmers
All the farmers have been sub-divided into four categories based on size of land holdings viz., (i) sub-
marginal (below 0.50 ha), (ii) marginal (0.51 ha to 1.00 ha), (iii) small (1.01 ha to 2.00 ha) and (iv) medium (2.01 ha
to 4.00 ha). There is no big farmer in the study area. In the next stage, 30 farmers i.e. 15 each from organic and
inorganic farms have been selected from each village based on stratified random sampling with proportional
allocation. Thus, all total 120 farm households have been selected for in-depth study.
5.1.5 Methods of data collection
The primary data have been collected by personal interview using pre-tested survey schedule specially
prepared for this purpose. The reference period of the study is 2009-10. Different aspects of farm operation have
been obtained for both organic and inorganic farming systems. These aspects are (i) record of organic farmers

indicating the number of years engaged in organic practices, (ii) season wise record of crops both in organic and
inorganic farms, (iii) input and output record of both organic and inorganic farms, (iv) cost of cultivation as well as
cost of production record for different crops of both group of farmers, (v) record of price received from sale of
products in market and (vi) input uses record both in organic and inorganic farms.
5.1.6 Measurement of variables
On the basis of extensive review of studies and consultation with the experts, the relevant variables
associated with the adoption and non-adoption of organic farming were identified. The variables related to adoption
of organic farming are measured on the basis of 5-point scale following the scoring method as very strong = 5,
strong = 4, medium = 3, low = 2 and nil = 1. Similarly, the variables related to non-adoption of organic farming are
measured as very strong = 1, strong = 2, medium = 3, low = 4 and nil = 5.
5.1.7 Scheme of the chapters
The entire study report has been organized into five chapters. These are (1) Introduction, (2) Review of
literature, (3) Profile of the study area, (4) Results and discussion and (5) Summary and conclusions.
5.1.8 Limitations of the study
Though considerable precautions and thoughts have been exercised to make the study precise, objective
and reliable, yet because of limited resources at the disposal, the study has been restricted to specific areas and could
not be extended to larger areas and more crops. Individual‟s biases and prejudices on the part of the respondents
might have influenced the findings of the study because the field level investigation was based on individual‟s
perception and expressed opinion.
5.3 Profile of the study area
5.3.1 Profile of the state West Bengal
As per Census 2001, West Bengal has a population of 8.02 crore, consisting 4.15 crore males and 3.87
crore females. The estimated population of West Bengal as on 1st October 2005 stands at 8.53 crore and it is
expected to reach 8.64 crore in 1st October 2006. West Bengal has a population density of 904 inhabitants per
square kilometre making it the most densely populated state in India. The state contributes 7.81 percent of India's
population.The population of West Bengal has increased from 4.43 crores in 1971 to 8.01 crores in 2001. However,
the state's 1990-91 to 2000-01 growth rate of 17.84 percent is lower than the national rate of 21.34 percent.
According to 2001 census, rural population of West Bengal was 72.03 percent of the total population whereas the
urban population was 27.97 percent of the total population. The rate of growth of urban population has been much
more than the rate of growth of rural population, exhibiting a gradual trend of rural to urban migration. The gender
ratio of the state has been 934 females per 1000 males. The percentage of male members was 51.72 percent and the
percentage of female members was 48.28 percent in 200
The net area under cultivation in West Bengal is about 52, 96,005 ha with cropping intensity of 182
percent. There are 67.89 lakh operational holdings of different land size classes with an average size of 0.82 ha. The
cropping pattern of the state is dominated by food crops, which account for about 87 percent of the area under
principal crops in the state. The major crops grown in the state include Rice, Wheat, Jute, Tea, Potato, Sugarcane,
Pulses and Oilseeds etc. Among various crops, rice is grown in 58, 57,000 ha followed by oilseeds in 6, 85,000 ha,
potato is grown in 30,800 ha where as pulses is grown in 2, 51,000 ha. The state is the highest producer of rice in the
nation; also there is remarkable progress in the production of jute and oilseeds. About 60 percent of the raw jute is
produced in the state. The state also produces about 28 percent of the total potatoes grown in the country. In case of
area under cultivation, West Bengal has faced a gradual shrinkage in the net cropped area over the decades from
54.17 lakh hectares in 2000-01 to 52.96 lakh hectares in 2006-07 (as per provisional estimates) as reflected in Table
4.1.3.1. However, this has been more than equally compensated by a sharp rise in the cropping intensity of the state
from 168 percent to 182 percent, which in turn has resulted in an increase in the gross copped area from 91.16 lakh
hectares to 96.34 lakh hectares over the same period.
5.3.2 Profile of North 24 Parganas district
North 24-Parganas is the second most populous district in the state and in India as well. It is the second
most urbanized district of the state having more than 54.0 per cent of the total population in the urban areas, whereas
28 per cent of the state‟s population lives in urban areas. The district North 24-Parganas is in alarming condition due
to high population growth of 22.7 percent, which is fifth highest in the state. The district has the third highest density
of population (2,182 persons per square kilometre) in the state. The sex ratio of the district (926) is well below the
state sex ratio (934). Literacy rate of the district is 78.1 per cent thereby making its position 2nd in the state
Agriculture in North 24-Parganas has witnessed a remarkable increase in food grain production, which currently
stands at 7.38 lakh tones. The North 24-Parganas District also contribute significantly towards the West Bengal
horticultural produces and is taking shape as a „Horticulture Hub‟ of West Bengal. The commercial production of
vegetables like tomato, cabbage, cauliflower, pea, brinjal, ladies finger, beans, potato etc. has grown rapidly over the
years owing to favourable agro-climatic conditions of the district. The region also offers excellent conditions for
commercial production flowers like rose, tuberose, marigold and gladioli. Fruits like mango, banana, papaya, pine
apple, guava, litchi etc. are also grown in the region in commercial scale.
5.3.3 Profile of Jalpaiguri district
Jalpaiguri is the largest district by area in the northern part of the state West Bengall. It is the most urbanized district
of the North Bengal having 34,01,173 total population, consisting 17,51,145 male and 16,50,028 female population.
The district has 36.71% schedule caste and 18.87% schedule tribe population. The density of population of the
district is 546 persons per square kilometer. The sex ratio of the district (942) is high of the state sex ratio (934).
Literacy rate of the district is 54.07 per cent thereby making its position 2nd
among the districts of North Bengal.
Agriculture in Jalpaiguri district has witnessed a remarkable increase in food grain production, which currently
stands at 4.39 lakh tones. The Jalpaiguri district also contributes significantly towards the West Bengal horticultural
produces by producing 8.36 lakh tones vegetables. The commercial production of vegetables like tomato, cabbage,
cauliflower, pea, brinjal, ladies finger, beans, potato etc. has grown rapidly over the years owing to favourable agro-
climatic conditions of the district. The region also offers excellent conditions for commercial production flowers like
rose, tuberose, marigold and gladioli. Fruits like mango, banana, papaya, pine apple, guava, litchi etc. are also grown
in the region in commercial scale. The district is claimed for favour of pulses and oilseeds production in the state
also.
5.3.4 Distribution of sample farms
It has been observed that there exist 30.79 % (771 farms) organic farms in 4 villages under 4 blocks of 2
districts under the study in 2009-10, i.e. the study period. These organic farms are categorized into 16.93 % (424
farms) sub-marginal farms, 7.35 % (184 farms) marginal farms and 6.51 % (163 farms) small farms according to the
size of land holdings. On the other hand, 69.21 % (1733 farms) inorganic farms are sub-divided into 30.63 % (767
farms) sub-marginal farms, 31.63 % (792 farms) marginal farms, 6.91 % (173 farms) small farms and 0.04 % (1
farm) medium farm in the study areas.
Inside the organic category, the farms are distributed into different size class by 424 sub-marginal (55.00 % of 771
organic farms), 184 marginal (23.86 % of 771 organic farms) and 163 small farms (21.14 % of 771 organic
farms).The sample of 60 organic farms has been formed with 30 sub-marginal (50.00 % of 60 sample organic
farms), 18 marginal (30.00 % of 60 sample organic farms) and 12 small farms (20.00 % of 60 sample organic
farms). In the limits of inorganic system, the farms are distributed into different categories by 767 sub-marginal
(44.26 % of 1733 inorganic farms), 792 marginal (45.70 % of 1733 inorganic farms), 173 small (9.98 % of 1733
inorganic farms) and 1 medium farm (0.06 % of 1733 inorganic farms). The sample of 60 inorganic farms have been
taken by 31farms from sub-marginal category (51.67 % of 60 sample inorganic farms), 24 farms from marginal
category (40.00 % of 60 sample inorganic farms) and 5 farms from small category (8.33 % of 60 sample inorganic
farms) of inorganic farms in the overall study area.
5.3.5 Characteristics of selected farmers
The important point may have to be noted that Rs. 41,360.05 come annually from farm income sources out
of total annual family income of Rs. 48,012.79. This meant that 86.14 % of the family incomes come from farm
income sources for organic farmers.
The same picture had been found in case of inorganic farm households. Inorganic farmers earned Rs.
37,982.51 from farm sources out of total annual family income of Rs. 43,732.98 which was the counterpart of 86.85
% of annual family income.
Thus, this discussion has focused on the aspect that farming is the earning sources of more than 86 % of the
total income for all the sample households in both the farming system in the study area. So, all the sample
households are involved in subsistence farming.
5.4 Results and Discussion
5.4.1 Status of organic farming in West Bengal

Number of organic farms has been extended to 37.32 per cent and 24.34 per cent in North 24 parganas
district and 47.24 per cent and 18.59 per cent in Jalpaiguri district compare to the number of farms at the beginning
stage in NGO and Government area, respectively. The overall increase in area under organic farming has been found
to be 6.57 per cent and 6.14 per cent in North 24 Parganas district and 2.12 per cent and 3.77 per cent in Jalpaiguri
district for NGO and Government activity area respectively during the similar periods. The percentage increase of
land under organic farming among the sample farmers for both NGO (175.21 %) and Government (80.21 %) activity
area is more in Jalpaiguri district than that of North 24-Parganas district. The probable reason for this may be due to
the fact of comparatively easy accessibility of organic manures as well as organic inputs in Jalpaiguri district than
that of North 24-Parganas district.
5.4.2 Comparative economics of crop production under organic and inorganic farming
Economics of organic vis-à-vis inorganic farm practices of six crops under study may be summarized as, though
cost of cultivation was higher and production was lower in organic than inorganic system for lady‟s finger, potato
and chilli, but price of the organic product was higher than inorganic in the study area. This was resulted a favorable
return / cost ratio for organic farming system. The return / cost ratio of organic cowpea was higher than inorganic
cowpea in NGO area. This was happened due to higher price of organic cowpea. In case of brinjal, though
production was lower and cost of cultivation was higher in organic system, but as the price of organic product was
higher than inorganic product, return/cost ratio for both organic and inorganic farming system was more or less
same. The same fact was replicated for cauliflower in NGO area, but in Government area organic cauliflower
exhibited lower production and same price with inorganic product and lower but favorable return/cost ratio.
5.4.3 Impact of organic farming in relation to quality of produces and price premium
It was observed from the market survey that organic produces bear higher price than the inorganic ones. It
is true that higher cost of production in case of organic farming is he reason behind. But at the same time
consumers‟ consciousness about benefits of such produces along with their capability to pay for the products do
have bearing on their choice. There exists a definite positive association between consumer‟s monthly income and
his willingness to pay higher price for organic products.
5.4.4 Farmers’ awareness regarding organic farm practices
But it was observed in the study that the organic farmers were much aware regarding good quality of
organic product, beneficial role of organic crops for human health and high profitability of organic farming than
other system.
5.4.5 Constraints in adoption of organic farming
There are seventeen constraints found to be dominating in non-adoption of organic farming in these study
areas. Among these, the constraints like high cost of organic inputs, no market for organic product, unavailability of
organic inputs , less yield and no price advantage for organic product are found to be the major constraints
according to their ranking as first, second, third, fourth and fifth. The next important constraints are found to be no
consumers demand for organic product. According to the ranking, the seventh position is obtained by less or equal
profitability. Small holding size, inconvenience of organic techniques, unavailability of the scope, higher production
risk, no suitable land for organic farming are the next important constraints by obtaining the rank eighth, ninth,
tenth, eleventh and twelfth, respectively. Lack of training of organic practices, more recurring cost for input are
found to be the next important constraints by obtaining the rank thirteenth and fourteenth. The other constraints in
order to importance are lack of awareness, low employment potentiality and lack of experience of organic farming
as these constraints obtained the rank by fifteenth, sixteenth and seventeenth. In regards to the relative importance of
different constraints it is found that socio-economic constraints is the main hurdle followed by infrastructural,
technological and situational in the process of adoption of organic farming.
5.4.6 Policy measures based on the findings of the study
1. Formation of Farmers‟ Organization may be an essential part of a sound organic strategy for a reasonable
price premium.
2. Awareness and training programmes for organic farming at a regular interval are required.
3. Recommended doses of plant nutrients to be applied.
4. The economic benefits due to application of Integrated Pest Management (IPM) strategy in organic farm
should be demonstrated to farmers.
5. Flow of credit to agriculture by Kishan Credit Card (KCC), Self Help Group (SHG)-banking linkage
programme, Farm Income Insurance Scheme (FIIS) should be developed, especially for organic farming.
6. Interlinked credit with output for organic farm production should be initiated to facilitate export in this
section and to encourage organic farmers.
7. Sound public policy should involve revolving fund for farmers to access initial financing required for
investments to vermicomposting, bio-pesticide production, livestock, etc. These are useful in integrated
systems of manures, pesticides, etc.
8. Government‟s incentives or tax exemptions on organic inputs should be applied like conventional inputs
and benefits could be channelled like extension services and support for biological pest controls.
9. The Government should provide start-up funding as subsidy for a broad scale farmer conversion
programme through kinds, i.e. inputs of organic in nature.
10. Market structure for organic products need to be developed.
11. The organic farm produce should be included under the public distribution system (PDS).
12. Proper attention should be paid by the PIA in supplying the inputs at the door step of farmers in the initial
stage.
13. Farmers and consumers should rely on a system of private self-organized producer organizations and
independent certifiers which will provide an economically-efficient mechanism of certification (e.g. PGS,
i.e. Participatory Guarantee System).
14. Marketing co-operatives by pooling the small and scattered produce of the producers‟ can improve the
bargaining strength of organic growers and can thus effectively eliminate the margin appropriated by the
market intermediaries.
15. Organic food products should be integrated into public procurement, such as in schools, hospitals, etc.,
through the requirement of at least a certain percentage of organic foods, if these are available, to stimulate
both a base market demand and improve the public information and consumer exposure to organics.
16. There is an acute need to intensify research work to develop / evolve some new varieties for organic
farming, appropriate to the agro-ecological conditions of the respective regions, in our case West Bengal.
17. Public domain research with adequate funding for sustainable agriculture is urgently necessary in
developing countries. The Government of India should set up an Organic Agricultural Research Institute
(OARI) with its all India network through different centres in different states of different agro-ecological
condition.

References
1. Alvares. C. (Edited). (2002). The Organic Farming Reader, Other India Press. Goa.
2. Bamji. M. (2005). Motivating Farmers to Produce More Pulses and Vegetables for Local Consumption.
D.C.Trust. A.P.
3. Birthal. P. (2005). Agriculture Diversification Opportunities for Small Farmers. NCAP. New Delhi.
4. Conway, G. (1998). The Doubly Green Revolution. Penguin. London.
5. Chand. R. (2005). Increasing Cultivation of Oilseeds & Production of Edible Oils. NCAP. New Delhi (Advice).
6. Chatterjee, A.S. (2005). Ecological Farming and NRM. Food and Nutrition Security Community (FAO). New
Delhi. (p 10).
7. Chander, M. and Kumar, S.(1999). Indigenous Cattle and Buffalo Wealth of India: Exploring its Role in
promoting Organic Farming Practices. 4th
Scientific Conference and General Assembly of IFOAM (asia-99).
Philippines. (p 48).
8. Dudani, A.T. (1999). Alternative to Chemical Pesticides in Tropical Countries – Sustainable Agriculture – Food
Security & Food Safety. Bigyan Prassar. New Delhi.
9. Deb. Debal (2004). Industrial vs Ecological Agriculture. Navdanya. New Delhi.
10. Dhar. B. (2005). Ensuring Food Security of Agricultural Workers. ADB. New Delhi.
11. Dand. S. (2006). Designing of Grain Banks for Enhanced Food Security. Anandi. Gujrat.
12. Dilipkumar S. C., Robins C.J., Dr. S.T.S. & Lanting, Ir. H. (1999). Farm Systems Comparison – IFOAM Case
Studies in India. 4th
Scientific Conference and General Assembly of IFOAM (asia-99). Philippines. (pp 69-70)
13. Damayanti, R. (1999). Community Approach to Rural Health and Nutrition. 4th
Scientific Conference and
General Assembly of IFOAM (asia-99). Philippines. (p 9).
14. Food and Agriculture Organization (1997). Bulletin for Organic Agriculture. FAO. UN.
15. Fujino,T. (1999). Farmer to Farmer Training. 4th
Scientific Conference and General Assembly of IFOAM (asia-
99). Philippines. (p 10).
16. Ghosh, A.K. & Deb. Debal (eds.) (2000). Mannel for Sustainable Agriculture & Biodiversity Conservation.
Navdanya. New Delhi.
17. Gunar. R. (2002). Organic Agriculture and Food Security. IFOAM Dossier-1. Theley. Germany.
18. Helsel. Z.R. (1993). Sustainable Agriculture. Technical Review. Vol. 5 No. 5.
19. Harkar. D. (2005). Expanding Opportunities in Dryland Farming. ICRISAT. Hyderabad.
20. Hashimoto, S. (1999). Teikei System. 4th
Scientific Conference and General Assembly of IFOAM (asia-99).
Philippines. (pp 65-66).
21. International Federation of Organic Agriculture Movements (1998). Guideline for Organic Agriculture.
IFOAM. Germany.
22. Institute for Integrated Rural Development (IIRD) (2001). Concepts. Principles and Basic Standards of Indian
Organic Agriculture. Kanchannagar. Aurangabad.
23. Joshi. Mukund & Prabhakarasetty. T.K. (2005). Sustainability Through Organic Farming, Kalyani Publishers.
New Delhi. Br.Off. – Kolkata.
24. Kandagal. S.S. (2005). Redressal of Environmental Health Issues in Agriculture. APFAMGS. Hyderabad.
25. Kumar. S. (2005). Improving access to irrigation by small farmers. Krishi Bharati. U.P.
26. Kolanu. T.R. & Sunil Kumar (2002). Greening Agriculture in India – An Overview of Opportunities &
Constraints. Centre for Energy Environment & Technology. Administrative Staff College of India. Bella Vista.
Hyderabad. India.
27. Lampkin. N.H. & Padel, S. (1994). Organic Farming & Agricultural Policy in Western Europe – on our view
the economics of organic farming – an international perspective. CAB International Wallingford.
28. Leigh. R.A. & Johnson, A.E. (eds.) (1994). Long Term //experiments in Agricultural and Ecological Sciences.
CAB International. Wallingford.
29. Li, D. and Xiao, X. (1999). Organic Farming Practice and Administrative System in Chaina. 4th
Scientific
Conference and General Assembly of IFOAM (asia-99). Philippines. (pp 54-56).
30. Ministry of Agriculture, Government of India. (1994). Watershed Area Rain fed System Analysis. New Delhi.
31. Maiti, R.G. (2007). Organic Horticulture in India – Its Past, Present and Future. National Workshop on „Organic
Horticulture‟ at BCKV. Mohanpur. WB. (pp 53-54).
32. May, R. (1999). Certified Organic Agriculture in Australia. 4th
Scientific Conference and General Assembly of
IFOAM (asia-99). Philippines. (p 13).
33. Palaniappan, SP. & Annadurai. K. (2003). Organic Farming (Theory & Practice). Scientific Publishers (India).
Jodhpur.
34. Patra. D. (2005). Promoting Organic Farming Utilizing the Krishi Vigyan Kendras (KVKs). Ouat. Orissa
(Advice).
35. Ramachandran. N. (2005). Restoring natural food safety nets. UNICEF. New Delhi.
36. Ranjan. R. (2005). Financing of agriculture sector. Development Alternatives. Jhansi.
37. Rundgren, G. (1999). Organic Certification in World Trade. 4th
Scientific Conference and General Assembly of
IFOAM (asia-99). Philippines. (p 12).
38. Rajaraman. B. (2006). Food Security through Panchayats. Civil Supplies & Consumer Protection Department.
Chennai (Advance).
39. Shiva, Vandana (1992). Biodiversity. Natraj Publishers. Dehradoon.
40. Shiva. Vandana (2001). The Violence of the Green Revolution. RFSTE. New Delhi.
41. Shiva. V. Pande. P. Singh. J. (2004). Principles of Organic Farming. Navdanya. New Delhi.
42. Singh, G. (1999). Organic Farming in Malaysia – Country Report. 4th
Scientific Conference and General
Assembly of IFOAM (asia-99). Philippines. (p 45).
43. United States Department of Agriculture (USDA). (1980). Report and Recommendation on Organic Farming.
US Government Printing Press. Washington. <www.usda.gov>.
44. Xiaodong, Y., Yuming, Z. and Zhengkun, W. (1999). Practice of Organic Farming in Poverty-Stricken Regions
of China. 4th
Scientific Conference and General Assembly of IFOAM (asia-99). Philippines. (pp 58-59).
45. Yadav, S.P. (1999). Organic Agriculture in Nepal: An Update. 4th Scientific Conference and General Assembly
of IFOAM (asia-99). Philippines. (p 46).
46. Zhengfang, L. (1999). Certification of Small Farmers in China. 4th
Scientific Conference and General Assembly
of IFOAM (asia-99). Philippines. (p 13).
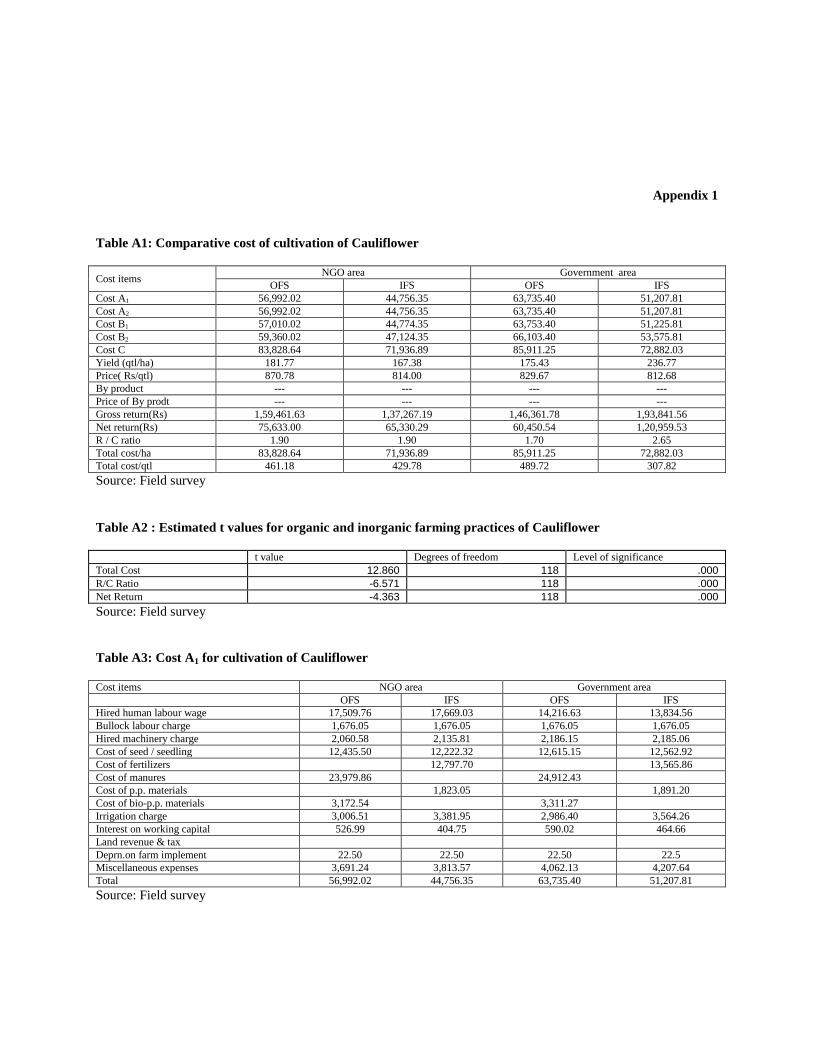
Appendix 1
Table A1: Comparative cost of cultivation of Cauliflower
Cost items NGO area Government area
OFS IFS OFS IFS
Cost A1 56,992.02 44,756.35 63,735.40 51,207.81
Cost A2 56,992.02 44,756.35 63,735.40 51,207.81
Cost B1 57,010.02 44,774.35 63,753.40 51,225.81
Cost B2 59,360.02 47,124.35 66,103.40 53,575.81
Cost C 83,828.64 71,936.89 85,911.25 72,882.03
Yield (qtl/ha) 181.77 167.38 175.43 236.77
Price( Rs/qtl) 870.78 814.00 829.67 812.68
By product --- --- --- ---
Price of By prodt --- --- --- ---
Gross return(Rs) 1,59,461.63 1,37,267.19 1,46,361.78 1,93,841.56
Net return(Rs) 75,633.00 65,330.29 60,450.54 1,20,959.53
R / C ratio 1.90 1.90 1.70 2.65
Total cost/ha 83,828.64 71,936.89 85,911.25 72,882.03
Total cost/qtl 461.18 429.78 489.72 307.82
Source: Field survey
Table A2 : Estimated t values for organic and inorganic farming practices of Cauliflower
t value Degrees of freedom Level of significance
Total Cost 12.860 118 .000
R/C Ratio -6.571 118 .000
Net Return -4.363 118 .000
Source: Field survey
Table A3: Cost A1 for cultivation of Cauliflower
Cost items NGO area Government area
OFS IFS OFS IFS
Hired human labour wage 17,509.76 17,669.03 14,216.63 13,834.56
Bullock labour charge 1,676.05 1,676.05 1,676.05 1,676.05
Hired machinery charge 2,060.58 2,135.81 2,186.15 2,185.06
Cost of seed / seedling 12,435.50 12,222.32 12,615.15 12,562.92
Cost of fertilizers 12,797.70 13,565.86
Cost of manures 23,979.86 24,912.43
Cost of p.p. materials 1,823.05 1,891.20
Cost of bio-p.p. materials 3,172.54 3,311.27
Irrigation charge 3,006.51 3,381.95 2,986.40 3,564.26
Interest on working capital 526.99 404.75 590.02 464.66
Land revenue & tax
Deprn.on farm implement 22.50 22.50 22.50 22.5
Miscellaneous expenses 3,691.24 3,813.57 4,062.13 4,207.64
Total 56,992.02 44,756.35 63,735.40 51,207.81
Source: Field survey

Table A4: Comparative cost of cultivation of Chilli
Cost items NGO area Government area
OFS IFS OFS IFS
Cost A1 43,705.86 33,198.41 48,315.29 37,329.56
Cost A2 43,705.86 33,198.41 48,315.29 37,329.56
Cost B1 43,723.86 33,216.41 48,333.29 37,347.56
Cost B2 46,073.86 35,566.41 50,683.29 39,697.56
Cost C 67,376.92 55,994.87 67,008.82 55,062.74
Yield (qtl/ha) 59.72 67.32 55.90 67.70
Price( Rs/qtl) 1,631.05 1,518.02 1,630.02 1,520.54
By product --- --- --- ---
Price of By prodt --- --- --- ---
Gross return(Rs) 98,408.91 1,03,162.76 92,034.37 1,03,924.78
Net return(Rs) 31,031.99 47,167.89 25,025.55 48,862.04
R / C ratio 1.45 1.83 1.36 1.88
Total cost/ha 67,376.92 55,994.87 67,008.82 55,062.74
Total cost/qtl 1128.21 831.77 1198.73 813.33
Source: Field survey
Table A5: Estimated t values for organic and inorganic farming practices of Chilli
t value Degrees of freedom Level of significance
Total Cost 16.215 118 .000
R/C Ratio -8.557 118 .000
Net Return -5.823 118 .000
Source: Field survey
Table A6: Cost A1 for cultivation of Chilli
Cost items NGO area Government area
OFS IFS OFS IFS
Hired human labour wage 13,804.87 12,658.02 10,272.58 9,422.35
Bullock labour charge 1,676.05 1,676.05 1,676.05 1,676.05
Hired machinery charge 2,020.18 2,117.02 2,019.20 2,162.65
Cost of seed / seedling 4,271.65 4,373.81 4,369.69 4,462.48
Cost of fertilizers 9,502.31 9,729.67
Cost of manures 21,174.58 22,095.70
Cost of p.p. materials 3,623.60 3,761.91
Cost of bio-p.p. materials 3,239.81 3,327.79
Irrigation charge 3,896.01 4,233.45 4,011.43 4,820.10
Interest on working capital 412.99 301.37 456.72 341.17
Land revenue & tax
Deprn.on farm implement 22.50 22.50 22.50 22.50
Miscellaneous expenses 1,930.32 2,707.04 2,118.15 2,815.17
Total 43,705.86 33,198.41 48,315.29 37,329.56
Source: Field survey

Table A7: Comparative cost of cultivation of Cowpea
Cost items NGO area Government area
OFS IFS OFS IFS
Cost A1 22,207.86 22,378.08 24,301.81 24,434.97
Cost A2 22,207.86 22,378.08 24,301.81 24,434.97
Cost B1 22,225.86 22,396.08 24,319.81 24,452.97
Cost B2 24,575.86 24,746.08 26,669.81 26,802.97
Cost C 34,439.41 33,942.96 34,005.29 33,193.40
Yield (qtl/ha) 54.51 55.92 51.41 60.86
Price( Rs/qtl) 1,201.15 993.62 1,163.14 988.89
By product --- --- --- ---
Price of By prodt --- --- --- ---
Gross return(Rs) 66,240.34 56,202.56 60,526.05 60,851.78
Net return(Rs) 31,800.93 22,259.60 26,520.76 27,658.38
R / C ratio 1.91 1.64 1.76 1.82
Total cost/ha 34,439.41 33,942.96 34,005.29 33,193.40
Total cost/qtl 631.80 606.99 661.45 545.41
Table A8 : Estimated t values for organic and inorganic farming practices of Cowpea
t value Degrees of freedom Level of significance
Total Cost 1.193 118 .235
R/C Ratio 1.935 118 .055
Net Return 1.994 118 .048
Source: Field survey
Table A9: Cost A1 for cultivation of Cowpea
Cost items NGO area Government area
OFS IFS OFS IFS
Hired human labour wage 6,601.10 6,196.80 4,833.25 4,178.37
Bullock labour charge 1,384.56 1,384.56 1,384.56 1,384.56
Hired machinery charge 1,042.90 1,032.81 1,094.08 1,093.08
Cost of seed / seedling 3,517.96 3,518.80 3,517.96 3,517.96
Cost of fertilizers 5470.77 5,463.99
Cost of manures 7894.89 8,081.19
Cost of p.p. materials 3,093.59 3,525.41
Cost of bio-p.p. materials 1,609.96 1,733.21
Irrigation charge 2,043.70 2,594.80 2,191.58 2,596.52
Interest on working capital 198.94 193.48 218.47 209.03
Land revenue & tax
Deprn.on farm implement 22.50 22.50 22.50 22.50
Miscellaneous expenses 2,072.04 2,794.60 2,191.66 3,279.23
Total 22,207.86 22,378.08 24,301.81 24,434.97
Source: Field survey
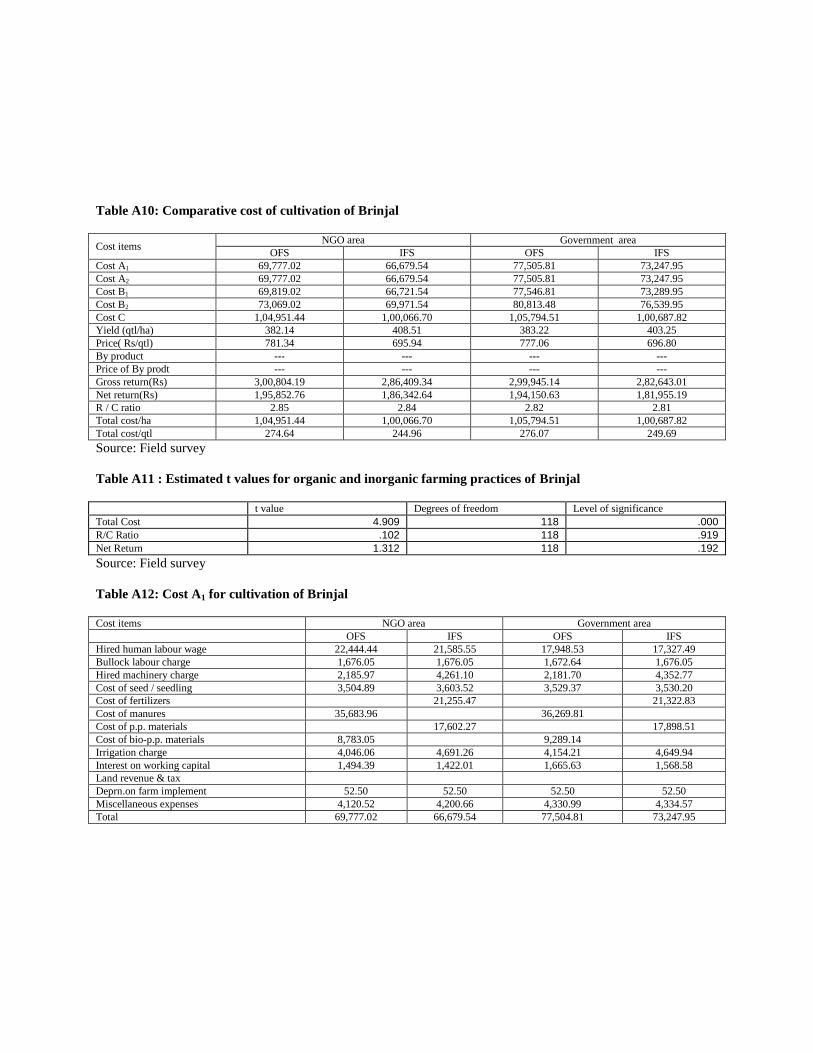
Table A10: Comparative cost of cultivation of Brinjal
Cost items NGO area Government area
OFS IFS OFS IFS
Cost A1 69,777.02 66,679.54 77,505.81 73,247.95
Cost A2 69,777.02 66,679.54 77,505.81 73,247.95
Cost B1 69,819.02 66,721.54 77,546.81 73,289.95
Cost B2 73,069.02 69,971.54 80,813.48 76,539.95
Cost C 1,04,951.44 1,00,066.70 1,05,794.51 1,00,687.82
Yield (qtl/ha) 382.14 408.51 383.22 403.25
Price( Rs/qtl) 781.34 695.94 777.06 696.80
By product --- --- --- ---
Price of By prodt --- --- --- ---
Gross return(Rs) 3,00,804.19 2,86,409.34 2,99,945.14 2,82,643.01
Net return(Rs) 1,95,852.76 1,86,342.64 1,94,150.63 1,81,955.19
R / C ratio 2.85 2.84 2.82 2.81
Total cost/ha 1,04,951.44 1,00,066.70 1,05,794.51 1,00,687.82
Total cost/qtl 274.64 244.96 276.07 249.69
Source: Field survey
Table A11 : Estimated t values for organic and inorganic farming practices of Brinjal
t value Degrees of freedom Level of significance
Total Cost 4.909 118 .000
R/C Ratio .102 118 .919
Net Return 1.312 118 .192
Source: Field survey
Table A12: Cost A1 for cultivation of Brinjal
Cost items NGO area Government area
OFS IFS OFS IFS
Hired human labour wage 22,444.44 21,585.55 17,948.53 17,327.49
Bullock labour charge 1,676.05 1,676.05 1,672.64 1,676.05
Hired machinery charge 2,185.97 4,261.10 2,181.70 4,352.77
Cost of seed / seedling 3,504.89 3,603.52 3,529.37 3,530.20
Cost of fertilizers 21,255.47 21,322.83
Cost of manures 35,683.96 36,269.81
Cost of p.p. materials 17,602.27 17,898.51
Cost of bio-p.p. materials 8,783.05 9,289.14
Irrigation charge 4,046.06 4,691.26 4,154.21 4,649.94
Interest on working capital 1,494.39 1,422.01 1,665.63 1,568.58
Land revenue & tax
Deprn.on farm implement 52.50 52.50 52.50 52.50
Miscellaneous expenses 4,120.52 4,200.66 4,330.99 4,334.57
Total 69,777.02 66,679.54 77,504.81 73,247.95