impact of the innovative pharma industry on the polish economy · within the medical community. in...
TRANSCRIPT

www.pwc.pl
Impact of the innovative pharma industry on the Polish economy
ReportSeptember 2011

2

Table of contents
Summary 5
Overview of the pharmaceuticals sector in Poland 11
The role in the economy 33
Current environment and future prospects 63
Appendices
Glossary 73


Acknowledgments
We would like to thank all the innovative pharmaceutical companies, that have devoted their time and effort to the project. Completion of the analysis would not have been possible without the quantitative and qualitative data provided by PwC survey participants.
We would like to thank IMS Health for preparing chapter two: “An overview of the pharmaceuticals market in Poland”, providing data on the pharmaceuticals market in Poland and the additional expert comments, which significantly improved the quality of this report.
We would like to express our gratitude to all respondents who shared their views on current and projected trends on the pharmaceuticals market in Poland and globally. These observations allowed us to show our analysis in a broader context, which has proved to be very valuable.
Development of this report was sponsored by the Pharmaceuticals Research and Manufacturers of America (PhRMA) and we would also like to thank PhRMA for its financial support during this project.
Methodology
In our quantitative analysis we have calculated the contribution of the pharmaceuticals industry to the Polish economy. We define the pharmaceuticals industry as manufacturing companies operating in the Polish market, both domestic and foreign, and local branches of international companies engaged in the resale of drugs on the Polish market.
In our analysis, we focused in particular on the innovative part of the industry.
Our macroeconomic analysis was based on an Input-Output model, which was then enhanced with extensive PwC experience in market modelling exercises.
We took into account both the direct and indirect influence of this contribution.
Direct impact:
• The value added to the economy generated directly by the pharmaceuticals industry, including employees compensation, direct taxes and company surpluses.
Indirect impact:
• Value added generated by the suppliers of goods and services for pharmaceuticals businesses.
• The induced effect evoked by increased consumer spending of households, due to employment in the pharmaceuticals sector or other related sectors.
Apart from the results of our empirical analysis, we believe that there are number of additional areas in which the pharmaceuticals industry influences the economy in a positive way. As those specific areas may require a greater level of commentary, we provide the latter in the qualitative part of this section.
Acknowledgments and methodology
We conducted our survey among nearly 30 innovative pharmaceutical companies operating in Poland


Jak już wspomniano, innowacja opracowana oraz wdrożona przez innowacyjne przedsiębiorstwa farmaceutyczne przynosi korzyści gospodarce oraz społeczeństwu. Z tego względu, oczywistym wydaje się, iż należy wspierać maksymalne wykorzystanie efektów procesu innowacyjnego
• Sektory farmaceutyczny i biotechnologiczny przodują w rankingu najbardziej innowacyjnych gałęzi w Europie (udział wydatków na B&R w przychodach 2009)
• Wiele badań jakościowych opartych na analizach, które zostały opublikowane w renomowanych czasopismach medycznych (np. Lichtenberg, 2001 czy Caliskan, 2009), potwierdza, że zaawansowane metody terapeutyczne mają pozytywny wpływ na długość życia, a stosowanie innowacyjnych leków przyczynia się w 40% do tego efektu
Tytuł wykresu
Nota: Źródło:
Tekst
SummarySection 1

In this report, we show that the pharmaceuticals sector in Poland, and in particular its innovative part, is important to the economy (1 of 4)
The purpose of this report was to determine the impact of innovative pharmaceutical companies on the development of the Polish economy in the form of:
• the revenues to the state budget, employment, the commission market for subcontractors, the raising competitiveness of the Polish economy through transfers of know-how, promotion of cooperation between industry and the world of science and stimulation of innovation;
• participation of companies in educational activities, corporate social responsibility (CSR) programmes, as well as charity activities in an effort to improve the condition of Polish society
and
defining the challenges facing the innovative pharmaceuticals industry.
The external environment and pharmaceuticals markets
Poland is the sixth largest pharmaceuticals market in Europe in terms of sales value, which reached PLN 20.1 billion in 2010.
Per capita expenditure on pharmaceuticals in Poland is among the lowest in Europe and amounts to EUR 114 annually, representing 52% of the average expenditure on drugs per capita in Europe. At the same time, pharmaceuticals in Poland are among the cheapest in Europe; their price being only 44% of the European average.
Expenditure on drugs accounts for more than 25% of total healthcare spending.
Co-payment for reimbursed drugs is 32%. As for the level of the patient’s co-payment for all drugs, the figure is 67%; in other European countries it ranges between 25% and 49%. This range of co-payment demonstrates the serious underfunding of Polish healthcare in the pharmaceuticals area.
In Poland, public and private healthcare expenditure amounts to 7% of gross domestic product (GDP), while in Western Europe (WE) this figure stands at 10% of GDP. Public spending on healthcare alone in Poland is 4.7% of GDP, while in WE it is estimated to be 7.5% of GDP.
Insufficient funding of the healthcare system in Poland is the main barrier limiting patients’ access not only to medicines but also to healthcare services.
Structure of the pharmaceuticals market in Poland
In Poland, there are nearly 450 pharmaceutical companies, of which 62 are innovative enterprises.
The 10 largest representatives of the pharmaceuticals market generate nearly 50% of its value. In the top 10 there are 8 innovative companies and among them there are three biggest pharma enterprises in Poland. The top three enterprises have manufacturing plants and generate 23% of the total pharmaceuticals’ market value.
6
Impact of the innovative pharma industry on the Polish economy • Report 7
Summary
In 2010, innovative pharmaceutical companies delivered products with a value of PLN 9.4 billion to the Polish market, which represents 58% of the prescription and hospital drugs market. They produce over 70% of drugs used in hospitals; in the case of the retail market, the share is 55%.
Over two-thirds of drugs in terms of value, used in Poland, are imported.
Impact on the budget and GDP
In 2010 alone, the pharmaceuticals industry contributed PLN 1 billion to the state budget in the form of taxes and other charges (according to the Central Statistical Office [GUS]), of which 60% was paid by innovative pharmaceutical companies.
Innovative companies are also accountable for 50% of the value of social security contributions paid by the Polish pharmaceuticals industry, with employment reaching one-third of this industry.
The pharmaceuticals industry contributes c.0.8% of GDP, a figure which has increased by nearly 20% over the four years since 2006. Almost 0.5% of GDP is generated by innovative pharmaceutical companies.
Commission market and cooperation with suppliers
The value of cooperation with suppliers of goods and services amounted to PLN 7.2 billion in 2010.
In 2010, 50 thousand contracts were signed, of which 95% were with national contractors.
Nearly 40% of the contracts’ value is associated with production activity of innovative pharma companies.
Employment
The pharmaceuticals industry employs 31 thousand people, of which 11 thousand work in innovative companies.
Another 80 thousand to 90 thousand jobs are in wholesalers and pharmacies entities which are inextricably linked with and dependent on sales of pharmaceuticals.
Nearly 20% employees of innovative pharmaceutical companies are employed in connection with R&D and manufacturing activities.
Most of the sales staff, constituting c. 50% of employees, are young, highly educated people, living across Poland. In this regard, pharmaceutical companies are becoming a major employer for groups threatened with unemployment, i.e. young university graduates and those living outside major urban agglomerations.
The average wage in the pharmaceuticals industry is 60% higher than the national average, reaching PLN 5.2 thousand.
In this report, we show that the pharmaceuticals sector in Poland, and in particular its innovative part, is important to the economy (2 of 4)

Investments
Seven out of sixteen pharmaceuticals factories in Poland belong to innovative pharma companies.
These factories include newly established production facilities, as well as those acquired from other entities and purchased during the privatisation of the Polish pharmaceuticals sector.
Privatisation of one of the pharmaceuticals factories by an innovative pharma company worth USD 400 million was one of the largest equity transactions during the transition period in Poland. This process has been reviewed by the Supreme Audit Office as one of the most effective sector privatisations.
In Poland, innovative companies manufacture c. 430 products at a volume of 200 million packages per year.
The value of exports in 2010 amounted to c. PLN 3.6 billion, which represents 34% of total sales of the innovative pharma industry in Poland.
About 1400 people work in the production facilities of innovative companies, which constitutes 13% of all employees in innovative pharma companies.
In 2010, these companies invested PLN 120 million to further develop and modernise their factories.
Seven functional hubs have been created. They provide services for more than 100 international markets in all areas of outsourcing services such as IT, clinical, financial and accounting services, distribution and logistics.
Thanks to clinical trials performed in Poland by innovative pharma companies, the state budget receives c. PLN 240 million annually from taxes and other charges.
Clinical trials also yield alternative cost savings to the budget of the National Health Fund (NHF), since their scope includes a large number of patients and they are financed by sponsors rather than public funds.
Innovative companies also conduct numerous activities in know-how transfer within the medical community.
In 2010, innovative companies allocated more than PLN 220 million to organise 210 thousand training courses, conferences and workshops for physicians.
Half of the training sessions were rewarded with educational points by the Polish Chamber of Doctors and Dentists (PCDD) under the compulsory, professional development of physicians.
Education and CSR
Pharmaceutical companies operating in the healthcare sector play a special role in activities aimed at improving the health of Poles.
The pharmaceuticals industry focuses on health education and shares its knowledge and experience in this area. Pharmaceutical companies have allocated PLN 20 million to conduct 60 educational campaigns, which have benefited around 620 thousand people.
Innovative pharma companies are involved in about 150 CSR initiatives.
8
In this report, we show that the pharmaceuticals sector in Poland, and in particular its innovative part, is important to the economy (3 of 4)

Impact of the innovative pharma industry on the Polish economy • Report 9
Summary
Conclusions
The unmet therapeutic needs of Polish patients, which require an increase in healthcare funding in order to reach a level of therapy availability comparable to other EU countries constitute an opportunity for increasing the engagement of innovative pharmaceutical companies in Poland.
In Poland, there is no long-term vision for an effective drug policy and its effective implementation.
Lack of consistent policy in this area, as well as insufficient public funding and delays in the processing of reimbursement decisions lead to the limited availability of innovative medicines for Polish society.
Poland is a country with some of the lowest prices for innovative medicines, as well as generic drugs. Significant price differences between countries lead to the export of Polish products to European markets.
Systematic implementation of EU regulations and the improved quality of Polish law will contribute to higher transparency of administration procedures. This is one of the key elements that determines decisions on locating of new investments.
The innovative pharma industry welcomes cooperation with local authorities. The quality of dialogue and debate with the central authorities is widely seen to be insufficient.
The recently adopted New Reimbursement Law could impact the stability of the pharmaceuticals market negatively:
• The profitability of wholesalers and pharmacies is expected to decline and consolidation at both these levels of distribution to widen.
• Due to the lack of rebate, patient co-payment may increase, and access to medicines may further deteriorate.
• The solutions implemented by the New Reimbursement Law may lead to the increase in parallel exports of medicines intended for the domestic market to other EU countries. This phenomenon may negatively impact the access of Polish patients to certain drugs.
A key factor that may significantly influence the development of commitment from innovative pharma companies in Poland is a partner dialogue with the central authorities.
The dialogue’s goal should be to clearly define the therapeutic needs of Polish society, the government’s expectations and possible responses to them by innovative pharma companies.
In this report, we show that the pharmaceuticals sector in Poland, and in particular its innovative part, is important to the economy (4 of 4)


z
Overview of the pharmaceuticals sector in Poland
Section 2
The following section was prepared by IMS Health and is based on market data and expertise of the company

12
Poland is the sixth largest European pharmaceuticals market in value terms
Per capita drug spend in Poland is one of the lowest in Europe
The Polish pharmaceuticals market versus other European countries
Market value in individual European countries
Poland is the sixth largest pharmaceuticals market in Europe and the leader in Central Eastern Europe (CEE) in terms of drug sales value.
Retail market – sales value, EUR bn – 2010 Sa
les
valu
e (E
UR b
n)
20
15
10
5
0
2521
.011
.810
.810
.34.
4
25.9
3.7
3.2
3.1
3.1
2.4
2.1
1.9
1.9
1.7 1.5
1.4
1.3
1.0
0.6
0.5
0.4
0.2
0.2
0.1
Ger
man
yFr
ance
Italy
Spai
nUK
Pola
ndG
reec
eSw
eden
*Be
lgiu
mNe
ther
land
sPo
rtuga
lAu
stria
Denm
ark*
Rom
ania
Hung
ary
Irela
ndFi
nlan
dCz
ech
Rep.
Slov
akia
Bulg
aria
Slov
enia
Lith
uani
aLa
tvia
Luxe
mbo
urg
Esto
nia
Source: IMS MIDAS, ExMan net prices (EUR), *pharmaceuticals market (drug market: retail Rx, retail OTC, and hospital markets)
Per capita market value in individual European countries
Despite being in sixth position, Poland has one of the lowest per capita drugspends in Europe, including the CEE countries (e.g. the Czech Republic,Hungary and Slovakia).
In 2010, the per capita drug spend in Poland amounted to 52% of the averageper capita drug spend in Europe.
Retail market, per capita drug spend in 2010 (EUR)
EUR 200
150
100
50
0
250
300
337
336
331
331
32535
0
317
290
257
255
249
234
226
196
187
183
168
165
128
114
110
103
99 8779
Denm
ark*
Swed
en*
Luxe
mbu
rgG
reec
eIre
land
Fran
ceG
erm
any
Belg
ium
Finl
and
Slov
enia
Aust
riaSp
ain
Portu
gal
Italy
Neth
erla
nds
Slov
akia
Hung
ary
UKCz
ech
Rep.
Pola
ndLi
thua
nia
Esto
nia
Latv
iaRo
man
iaBu
lgar
ia
350
Average EUR 218
Source: IMS MIDAS, ExMan net prices (EUR), *pharmaceuticals market (drug market: retail Rx, retailOTC, and hospital markets), EUROSTAT.

Impact of the innovative pharma industry on the Polish economy • Report 13
Due to the low level of total healthcareexpenditure in Poland,the share of drug spending in totalhealthcare expenditure is high compared to the more developed markets
Public funds for drugs are insufficient, which leads to an excessiveincrease in patient drugspending
Public drug spend
The share of spending on drugs in total healthcare expenditure is relatively high,mainly due to the low level of healthcare expenditure in Poland.
Drug spending as a percentage of total healthcare expenditure in 2009
20%
15%
10%
5%
0%
25%
30%
10%
15%
19%
13%
21%
16%19%
28%
12%
31%
22%25%
29%
21%24%
Fran
ce
Switz
erla
nd
Ger
man
y
Slov
enia
Aust
ria
Spai
n
Italy
Slov
akia UK
Hung
ary
Czec
h Re
p.
Pola
nd
Lith
uani
a
Esto
nia
Latv
ia
35%
40% WECEE
Source: WHO, BMI
Share of the public drug spend in total drug expenditure in 2009
80%
65%
40%
20%
0%
100%
68%77%
59%67%
73%67%
47%
71%
85%
57%62%
38%43%
27%
Fran
ce
Switz
erla
nd
Ger
man
y
Slov
enia
Aust
ria
Spai
n
Italy
Slov
akia UK
Hung
ary
Czec
h Re
p.
Pola
nd
Lith
uani
a
Esto
nia
Latv
ia
WECEE
Source: WHO
Overview of the pharmaceuticals market in Poland

14
Market structure – share of generic drugs
The share of generic drugs in Poland is one of the highest in Europe. In 2010, itamounted to c. 66% in value, when calculated for the total retail market (Rx andOTC drugs).
Share of generic drug sales in 2010 (PLN)
40%
30%
20%
10%
0%
50%
60%
53%
53%
46%
45%
44%
66%
44%
43%
38%
38%
37%
36%
36%
35%
34%
32%
32%
31%
30%
28%
23%
Pola
ndBu
lgar
iaCz
ech
Rep.
Slov
akia
Ger
man
yHu
ngar
yPo
rtuga
lUK Ita
lySl
oven
iaFi
nlan
dSw
eden
*De
nmar
k*Fr
ance
Aust
riaG
reec
eBe
lgiu
mSp
ain
Neth
erla
nds
Irela
ndLu
xem
burg
Esto
nia
Latv
iaLi
thua
nia
Rom
ania
70%
N/A
Source: IMS MIDAS, ExMan net prices (EUR), *pharmaceuticals market (drug market: retail Rx,retail OTC, and hospital markets)
Average drug prices in Europe
The average drug price in Poland is one of the lowest in Europe at 44% of theEuropean average. Such a low price level results mainly from the high share ofgeneric drugs, the low availability of innovative drugs and the strong pricepressure in the area of reimbursed drugs.
Average drug price in 2010, ExMan net price (EUR)
20
15
10
5
0
25
19.7
17.1
14.6
13.5
13.3
23.0
12.9
11.2
10.0
9.2
9.1 9.0
8.3
7.1 6.5
4.5
4.2
3.6
3.0
Denm
ark*
Swed
en*
Ger
man
yFi
nlan
dIre
land
Belg
ium
Luxe
mbu
rgNe
ther
land
sAu
stria
Portu
gal
Slov
enia
Gre
ece
Spai
nFr
ance
Slov
akia
Italy UK
Hung
ary
Esto
nia
Czec
h Re
p.La
tvia
Lith
uani
aRo
man
iaPo
land
Bulg
aria
Average EUR 8.2
6.6
6.4
5.9
5.9
5.5
4.7
Source: IMS MIDAS, ExMan net prices (EUR), *pharmaceuticals market (drug market: retail Rx,retail OTC, and hospital markets), EUROSTAT
Poland is at the forefront of Europe with the highest sales of generic drugs
Poland has one of the lowest average drugprices in Europe
EUR

Impact of the innovative pharma industry on the Polish economy • Report 15
The average price of bothgeneric and innovativedrugs in Poland is one of the lowest in Europe
Average price of generic drugs in Europe
In Poland, the prices of both generic and innovative drugs are among the lowest in Europe. Generics are 40% lower and innovative drugs 56% lower than theEuropean average.
Generic drugs in 2010, average ExMan net price (EUR)
8
6
4
2
0
10
12
9.8
9.5
7.8 7.5 7.0
11.5
6.5
6.0
5.7
5.7
5.3
4.7
4.6
4.4
2.8
2.0
Den
mar
k*Sw
eden
*G
erm
any
Finl
and
Belg
ium
Prtu
gal
Irela
ndG
reec
eAu
stria
Luxe
mbu
rgSl
oven
iaIta
lyN
ethe
rland
sSp
ain
Hun
gary
Slov
akia
Cze
ch R
ep.
UK
Fran
cePo
land
Bulg
aria
Esto
nia
Latv
iaLi
thua
nia
Rom
ania
14
N/A
Average EUR 4.7
4.2
4.1 3.9
3.5
3.4
EUR
Source: IMS MIDAS, ExMan net prices (EUR), *pharmaceuticals market (drug market: retail Rx, retailOTC, and hospital markets)
Average price of innovative drugs in Europe
The average price of an innovative drug in Poland is EUR 7.4. The countries withthe highest drug prices, such as Denmark, Germany and Sweden, are the potentialdirections for parallel drug exports from Poland.
Innovative drugs in 2010, average net ExMan price (EUR)
40
30
20
10
0
50
60
50.5
47.3
29.9
29.7
23.2
52.3
20.8
20.5
18.0
16.9
16.3
16.2
7.4 6.4
Den
mar
k*G
erm
any
Swed
en*
Net
herla
nds
Finl
and
Irela
ndBe
lgiu
mLu
xem
burg UK
Fran
ceSl
oven
iaAu
stria
Spai
nSl
ovak
iaPr
tuga
lG
reec
eC
zech
Rep
.H
unga
ryIta
lyPo
land
Bulg
aria
Esto
nia
Latv
iaLi
thua
nia
Rom
ania
N/A
Average EUR 16.8
12.4
11.8
10.4
8.7
8.613
.713
.9
EUR
Source: IMS MIDAS, ExMan net prices (EUR), *pharmaceuticals market (drug market: retail Rx, retailIOTC, and hospital markets)
Overview of the pharmaceuticals market in Poland

16
Price differences between an innovative drug and its generic equivalent
Poland has some of the lowest prices in both innovative and generic drugs inEurope. The significant differences in drug prices across Europe lead to theexport of drugs from Poland to other European markets. In particular, thisconcerns expensive innovative drugs, most of which are reimbursed.
In the Netherlands, the average price of a generic drug is 6.5 times lower thanthe average price of an innovative drug. In Poland, the average price of a generic drug is only 2.6 times lower than the average price of an innovative drug.
Average prices of innovative drugs versus generic equivalents in 2010 (EUR)
5.35.2
5.04.8
4.5
6.5
3.83.63.6
3.33.2
NetherlandsGermany
UKFrance
Sweden*Denmark*
FinlandIreland
LuxembourgSlovakiaBulgaria
SpainSlovenia
AustriaBelgium
Czech Rep.Poland
HungaryGreece
ItalyPortugalEstonia
LithuaniaLatvia
Romania
N/A
0 1 2 3 4 5 6 7
3.23.1
2.82.8
2.72.6
2.12.0
1.81.8
Source: IMS MIDAS, ExMan net prices (EUR), *pharmaceuticals market (drug market: retail Rx, retailOTC, and hospital markets)
The average price ofan innovative drug in Poland is only 2.6 timeshigher than the averageprice of its genericequivalent whereas in the Netherlands the average price of an innovative drug is 6.5 times higher thanthe average price of its generic equivalent

Impact of the innovative pharma industry on the Polish economy • Report 17
Overview of the pharmaceuticals market in Poland
In Poland, drug spending for the European top 30 hospital drugs is five toeight times lower than that in other Europeancountries
Compared to the major European countries, the Polish hospital market has thelowest per capita spending (EUR 4.5) for the European top 30 hospital drugs.
Of the TOP 30 hospital drugs, 26 are available on the Polish hospital market.
Hospital market value for TOP 30 hospital products in 2010, ExMan net prices (million EUR)
Number of TOP 30 hospital drugs available on the Polish market in 2010T
Per capital spending on TOP 30 hospital drugs in 2010
Italy 1 825 30 30.2 Є
Spain 1 779 28 38.7 Є
France 1 637 26 25.3 Є
UK 1 624 30 26.2 Є
Germany 962 28 11.8 Є
Poland 173 26 4.5 Є
European TOP 30 hospital drugs:
ARANESP, ATRIPLA, AVASTIN, AVONEX, CLEXANE, CRESTOR, ENBREL, GLIVEC, HERCEPTIN, HUMIRA, INEGY, KEPPRA, LANTUS, LIPITOR, LUCENTIS, LYRICA, MABTHERA, NEULASTA,
NEXIUM, PLAVIX, REMICADE, REVLIMID, SERETIDE, SEROQUEL, SINGULAIR, SPIRIVA, SYMBICORT, TAXOTERE, TRUVADA, ZYPREXA
Source: IMS MIDAS, ExMan net prices (EUR) , Hospital market

18
The pharmaceuticals market in Poland
The structure of the pharmaceuticals market is broken down into retailand hospital markets
In 2010, the value of the pharmaceuticals market in Poland (retail and hospital)reached PLN 20.1 billion in ExMan net prices. The mean annual change (CAGR)in the value of the pharmaceuticals market between 2003 and 2010 was 6.4%.
Pharmaceuticals market – sales value, PLN bn
20
15
10
5
0
2512.9
TOTAL
Retail market - Rx drugs
Sale
s va
lue
(PLN
bn)
1.5
8.7
2.7
1.5
8.9
2.8
1.7
9.6
2.9
1.9
10.0
2.9
2.1
10.8
3.2
2.3
11.9
3.4
2.7
12.9
3.8
2.8
13.4
3.8
2.9
14.2
4.3
2003 2004 2005 2006 2007 2008 2009 2010 2011*
13.2 14.2 14.8 16.1 17.6 19.4 20.1 21.4
Retail market - OTC drugsHospital market
* 2011 forecastSource: IMS Health, National Data 05/2011, ExMan net prices (PLN). Pharmaceuticals market (retail Rx, retail OTC and hospital)
Individual segments of the pharmaceuticals market
In 2010, the market for Rx drugs available in retail pharmacies represented 67%of the total pharmaceuticals market and was worth PLN 13.4 billion.
The reimbursed drugs available in the retail market made up more than half ofthe total value of the pharmaceuticals market in Poland.
The hospital market and the retail over-the-counter (OTC) market represented13.9% and 19.2% respectively of the market share in value terms.
Percentage structure and value of the retail Rx market and the hospital market in Poland in 2010, ExMan net prices (PLN)
Retail market, reimbursed Rx drugs Hospital market
10.1 bn
17.8%20.2%62.0%
Retail market, non-reimbursed Rx drugs
3.3 bn 2.9 bn
100 % = retail Rx market and hospital marketSource: IMS Health, National Data 05/2011, ExMan net prices (PLN). Pharmaceuticals market(excluding OTC drugs)
In 2010 the value of the Polish pharmaceuticals market reached PLN 20.1 billion. The mean annual change in the value of the pharmaceuticals market was +6.4% between 2003 and 2010

Impact of the innovative pharma industry on the Polish economy • Report 19
Innovative and generic companies – volume structure
The volume market share of innovative companies amounted to 38% in 2010.
Pharmaceuticals market volume by company profile
100%
80%
60%
40%
20%
0%
67%
33%
2010
Generic companies
Innovative companies
100%
80%
60%
40%
20%
0%
62%
38%
2010
Volume as thenumber of packages
Total pharmaceuticals market Pharmaceuticals market excluding OTC drugs*
100 %= Retail Rx market, OTC retail market , and hospital market;* 100 %= Retail Rx market and hospital market Source: IMS Health, National Data 05/2011, ExMan net prices (PLN). Pharmaceuticals market (excluding OTC drugs) Definition of an innovative company: the sales value of innovative drugs in the pharmaceuticals market (drug market: retail and hospital) in 2010 represented 50% or more of the company’s portfolio value. In the case of multi-organisational corporations, the sales value of the “parent” company is used
Innovative and generic companies – value structure
Due to price differences, the market share of innovative companies is significantlyhigher, amounting to 58% in 2010.
Pharmaceuticals market value by company profile
Total pharmaceuticals market Pharmaceuticals market excluding OTC drugs*
100%
80%
60%
40%
20%
0%
47%
53%
2010
Generic companies
Innovative companies
100%
80%
60%
40%
20%
0%
42%
58%
2010
Sales value on thepharmaceuticalsmarket in 2010,ExMan net prices(PLN)
PLN 9,4 bn
PLN 10,7 bn
PLN6.8 bn
PLN9.4 bn
100 % = Retail Rx market, OTC retail market , and hospital market;* 100 % = Retail Rx market and hospital marketSource: IMS Health, National Data 05/2011, ExMan net prices (PLN). Pharmaceuticals market(excluding OTC drugs)
The volume share of innovative companiesamounted to 38% of the Polish pharmaceuticals market (excluding OTC drugs)
Sales value of innovative drugs amounted to PLN 9.4 billion in 2010, whichrepresented 58% of the total market value (excluding OTC drugs)
Overview of the pharmaceuticals market in Poland

20
Innovative and generic companies in the hospital market
In 2010 innovative companies represented over 71% of the hospital market value.
Hospital market value share broken down by generic and innovative companies
80%
60%
40%
20%
0%
100%
Innovative companies
41%
71% 71%
2003 2004 2005 2006 2007 2008 2009 2010
Generic companies
59% 61% 65% 66% 69% 70%
29%29%30%31%34%35%39%
Source: IMS Health, National Data 05/2011, ExMan net prices (PLN). Hospital market Definition of an innovative company: the sales value of innovative drugs in the pharmaceuticals market (drug market: retail and hospital) in 2010 represented 50% or more of the company’s portfolio value. In the case of multi-organisational corporations, the sales value of the “parent” company is used
Innovative and generic companies in the retail Rx market
In 2010 innovative companies represented 55% of the retail Rx market value.
Retail Rx market value share broken down by generic and innovative companies
80%
60%
40%
20%
0%
100%
Innovative companies
35%
56% 55%
2003 2004 2005 2006 2007 2008 2009 2010
Generic companies
65% 60% 60% 59% 58% 57%
45%44%43%42%41%40%40%
Source: IMS Health, National Data 05/2011, ExMan net prices (PLN). Hospital marketDefinition of an innovative company: the sales value of innovative drugs in the pharmaceuticals market(drug market: retail and hospital) in 2010 represented 50% or more of the company’s portfolio value. In the case of multi-organisational corporations, the sales value of the “parent” company is used
In 2010 innovativecompanies representedover 71% of hospital market value
Innovative companiesgenerate more than half of the retail marketvalue

Impact of the innovative pharma industry on the Polish economy • Report 21
Generic drugs make up c. 60% of the retail Rxmarket in value and 76% in volume
Retail Rx market – volume share of products by registration type
The Polish pharmaceuticals market is predominantly a market of generic drugs,mainly branded generic drugs.
The access to innovative drugs is perceived as quite limited, which mainly resultsfrom the high level of patients’ co-payments connected with the limited financingof drugs by the NHF.
Product shares in the retail Rx market by registration type – volume
80%
60%
40%
20%
0%
100%
Rx generic drugs
22.7%
2003 2004 2005 2006 2007 2008 2009 2010
Rx original drugs
22.3% 22.6% 22.7% 23.4% 23.7% 23.7% 23.5%
77.3% 77.7% 77.4% 77.3% 76.6% 76.3% 76.3% 76.5%
Source: IMS Health, National Data 05/2011, ExMan net prices (PLN). retail Rx market.Original drugs: According to the IMS definition - ORIGINAL BRANDS, LICENSED BRANDSGeneric drugs: According to the IMS definition - OTHER BRANDS, PATENT N/A, UNBRANDED
Retail Rx market – Value share of products by registration type
Over the last eight years, the share of generic Rx drugs has increased from 53.8% to 59.8% in value terms. In volume terms, it fell from 77.3% to 76.5%.
Product shares in the retail Rx market by registration type – value
80%
60%
40%
20%
0%
100%
Rx generic drugs
46.2%
2003 2004 2005 2006 2007 2008 2009 2010
Rx original drugs
42.3% 40.7% 39.5% 38.9% 39.7% 39.5% 40.2%
53.8% 67.7% 59.3% 60.5% 61.1% 60.3% 60.5% 59.8%
Source: IMS Health, National Data 05/2011, ExMan net prices (PLN). retail Rx market.Original drugs: According to the IMS definition - ORIGINAL BRANDS, LICENSED BRANDSGeneric drugs: According to the IMS definition - OTHER BRANDS, PATENT N/A, UNBRANDED
Overview of the pharmaceuticals market in Poland

22
Imported drugs and locally produced drugs – sales value
In 2010, imported drug sales amounted to PLN 12.3 billion.In the same period, the value of locally produced drugs was PLN 3.9 billion.The mean annual change (CAGR) in the market value between 2003 and2010 was +7.6% for imported drugs and +4.5% for locally produced drugs.
Imported and locally produced drugs – Sales value (PLN bn)
Imported drugs
7.4
3.9
2003 2004 2005 2006 2007 2008 2009 2010
Locally produced drugs
2.9 3.4 3.6 3.8
12.311.610.4
9.38.58.0
7.38
6
4
2
0
10
12
14
3.1 3.33.9
mld
PLN
Source: IMS Health, National Data 05/2011, ExMan net prices (PLN). Pharmaceuticals market(excluding OTC drugs)
Imported and locally produced drugs – structure of sales
In 2010, the share of imported drug products in the pharmaceuticals market(excluding OTC drugs) represented 75.7%. Between 2003 and 2010, theincreased by 4 percentage points. The share of imported drugs was even largerin the hospital market – in 2010, it amounted to c. 85%. Between 2003 and2010, it increased by 18.5 percentage points.
Imported and locally produced drugs – Sales volume share
80%
60%
40%
20%
0%
100%
Imported drugs - volume
38.9%
2003 2004 2005 2006 2007 2008 2009 2010
Local drugs - volume
40.5% 43.0% 45.3% 48.2% 49.9% 51.4% 52.9%
61.1% 59.3% 57.0% 54.7% 51.8% 50.1% 48.6% 47.1%
Source: IMS Health, National Data 05/2011, ExMan net prices (PLN). Pharmaceuticals market(excluding OTC drugs)
The Polish pharmaceuticals market(excluding OTC drugs)is dominated by imported products
Domestic drug production accounts fornearly one quarter ofthe total market value. However, in recent yearsthe growth of this marketsegment has clearly slowed down

Impact of the innovative pharma industry on the Polish economy • Report 23
Imported and locally produced drugs – sales value share
80%
60%
40%
20%
0%
100%
Imported drugs - value
28.3%
2003 2004 2005 2006 2007 2008 2009 2010
Local drugs - value
30.0% 29.1% 28.7% 27.6% 26.5% 25.3% 24.3%
71.7% 70.0% 70.9% 71.3% 72.4% 73.5% 74.7% 75.7%
Source: IMS Health, National Data 05/2011, ExMan net prices (PLN). Pharmaceuticals market(excluding OTC drugs)
Average price
The change in the average price is influenced not only by changes in the pricesof drugs but also by changes in the drug consumption structure. It is particularlypronounced in the hospital market where the share of oncology drugs, which arerelatively more expensive than other drugs, has been systematically increasingover the years, thus causing an increase in the average drug price for the totalmarket.
Average drug price, ExMan net price (PLN), in the Rx retail and hospital market
35
30
25
20
0
Drug’s average price - retail Rx market
2003 2004 2005 2006 2007 2008 2009 2010
15
10
5
16.519.5
22.0
14.1 15.5 16.0 16.3 16.6 17.6
32.2
19.3
40
15.3
34.9
18.6
25.528.7
Drug’s average price - hospital market
Source: IMS Health, National Data 05/2011, ExMan net prices (PLN). Pharmaceuticals market(excluding OTC drugs)
Overview of the pharmaceuticals market in Poland
Changes in the average drug price for the whole market is influenced not only by changes in the prices of drugs, but also by changes in the drug consumption structure. The entry of new and more expensive drugs results in an increase in the average drug price
PLN

24
Elements of market value increase between 2003 and 2010
Between 2003 and 2010, the value of the retail Rx market increased by 53.5%.The vast majority of this increase resulted from the market launches of newdrugs, which accounted for 63% of this increase. The change in the drugconsumption structure, such as switching to more expensive therapies, accountedfor 17% of the increase. The change in the prices of drugs was a negative growthelement (-26%), meaning that drug prices were steadily falling. On the hospitalmarket, the prices of the products available in the market since 2003 fell by 31%.The value of the hospital market increased by over 83% in this period, with newlaunches being the major element of the increase.
Elements of market value increase in the period 2003-2010
100%
80%
60%
40%
20%
0%
New entries
Changes in the drugconsumption structure
140%
120%
-20%
-40%
63%
17%
-26%
87%
27%
-31%
+54% +83%
Changes in drug price
Rx retail Hospital
Source: IMS Health, National Data 05/2011, ExMan net prices (PLN). Pharmaceuticals market(excluding OTC drugs)
Over the last few years, the unit drug price hasbeen steadily decreasing.The markets have been growing, mainly dueto the launch of new drugs and changes inthe drug consumptionstructure, such as switching to moreexpensive therapies

Impact of the innovative pharma industry on the Polish economy • Report 25
Rx drugs account for 86% of the value ofparallel drug imports to Poland
In 2010 the value ofparallel export of drugsamounted to over PLN 810 million. As a result of the new reimbursementlaw, a further significantincrease in the scale ofparallel exports is expected
Parallel imports
Over the last few years, Poland has been systematically increasing its share of theparallel drug trade in Europe. Both directions of parallel trade, import and export,have been developing very strongly.
Retail market, sales value, and the number of drugs from parallel imports in the market
Sales value of products from parallel import
2003 2004 2005 2006 2007 2008 2009 2010
Number of available products from parallel import
160
120
80
40
0
200
PLN
bn
Number of products from
parallel im
port
96 1740 0 8 13 663619
90176
299
430
200
100
0
300
400
500
Source: IMS Health, National Data 5/2011, ExMan net prices (PLN). Retail market.Data shows parallel imports via the wholesale channel.
Parallel exports – trade balance (compared to parallel imports)
In 2010 parallel drug exports from Poland amounted to PLN 810 million.
The proposed amendments to the reimbursement law and the continuous pricing pressure on reimbursed drugs have resulted in increasing price differences across countries. This results in an increase in the value of parallel drug exports from Poland. In the near future the value of this market may reach PLN 1,5-2 billion.
In 2010, the trade balance of parallel imports and exports of Rx drugs was PLN635 million in favour of parallel drug exports out of Poland.
Value of parallel exports from and imports to Poland
100%
80%
60%
40%
20%
0%
Value of parallel exports
Value of parallel imports
-20%
291
66
534
96
810
174
201020092008
Source: IMS Poland, Sales Shot, National data 05/2011, ExMan net prices (PLN).Data shows parallel exports via the wholesale and retail channel.
Overview of the pharmaceuticals market in Poland

26
Main players on the Polish pharmaceuticals market
The top 10 players on the Polish pharmaceuticals market are responsible for 50%of total market value, while the top 30 represent more than 82.7% The remaining17.3% of the market value is divided among around 415 companies.
In volume terms, the top 10 players account for 54% of Polish drug sales. All thesecompanies have production facilities in Poland.
Of the top 30 companies, 16 have production facilities in Poland, which are mainlylocated close to the major cities such as Warsaw, Łódź and Poznań.
Market share of top 10 corporations in Poland – 2010
Sanofi-group
Novartis
Glaxosmithkline
Polpharma
Roche
Servier
Merck & Co
Pfizer
Teva
Astrazeneca
Other
0% 20% 40% 60%
Polpharma
Sanofi-group
Novartis
Glaxosmithkline
Teva
Servier
Valeant Pharma
Adamed Poland
KRKA
Gedeon Richter
Other
0% 20% 40% 60%
8.5%
8.2%
6.1%
5.2%
4.6%
3.9%
3.8%
3.4%
3.1%
3.1%
50.1%
10.8%
7.6%
7.3%
5.1%
5.1%
4.6%
3.9%
3.5%
3.2%
2.9%
46.0%
Value Volume
Source: IMS Health, National Data 05/2011, ExMan net prices (PLN). Pharmaceuticals market(excluding OTC drugs)
445 active playersoperated in the Polishpharmaceuticalsmarket (excludingOTC drugs) in 2010.The top 10 companiesgenerated 50% ofmarket value

Impact of the innovative pharma industry on the Polish economy • Report 27
Two of the TOP 10corporations on the Polish retail Rx market are Polish companies
Eight of the TOP 10corporations on the Polish hospital market are innovative companies
The definite majority of the TOP 10 corporations operating on the Polish retail Rxmarket and hospital market are innovative companies.
TOP 10 corporations on the retail Rx market in 2010 (value)
Ranking Corporationtype
Corporation name Sales value (PLN m) in 2010
Number of products(brands) on themarket in 2010
1 Original SANOFI‐GROUP 1 140 131
2 Original NOVARTIS 1 004 232
3 Original GLAXOSMITHKLINE 834 121
4 Generic POLPHARMA 716 104
5 Original SERVIER 627 69
6 Generic KRKA 489 62
7 Original MERCK & CO 478 73
8 Generic TEVA 463 167
9 Generic ADAMED POLAND 456 60
10 Original ASTRAZENECA 436 30
TOP 10 corporations on the hospital market in 2010 (value)
Ranking Corporationtype
Corporation name Sales value (PLN m) in 2010
Number of products(brands) on themarket in 2010
1 Original NOVARTIS 330 263
2 Original ROCHE 311 44
3 Original SANOFI‐GROUP 237 157
4 Original PFIZER 208 104
5 Original GLAXOSMITHKLINE 151 159
6 Original MERCK & CO 138 71
7 Generic POLPHARMA 121 130
8 Original BAYER 118 77
9 Generic WARSZAWA ZF POLFA 88 84
10 Original BRISTOL‐MYERS SQB. 84 31
Source: IMS Health, National Data 05/2011, ExMan net prices (PLN). Pharmaceuticals market(excluding OTC drugs)Definition of an innovative company: the sales value of innovative drugs in the pharmaceuticalsmarket (drug market: retail and hospital) in 2010 represented 50% or more of the company’s portfoliovalue.In the case of multi-organisational corporations, the sales value of the “parent” company is used.
Overview of the pharmaceuticals market in Poland

28
The largest players inPoland are innovativecompanies engaged inthe production of innovative and genericdrugs
In 2010 the TOP 30 corporations accounted for c. 83% of the Polish pharmaceuticalsmarket. Of the TOP 30, 16 are innovative companies responsible for 54.4% of market value
TOP 30 corporations in 2010 – pharmaceuticals market (excluding OTC drugs)
Top 30corporations
MSV* Rx-INN
Rx-Gx
OTC Production in Poland
Functional hubs(range of operations)
Sanofi-Group(incl. Zentiva)
8.5% ✔ ✔ ✔ Rzeszów, Chociw
Novartis (incl. Sandoz)
8.2% ✔ ✔ ✔ Stryków
GSK 6.1% ✔ ✔ ✔ Poznań IT Centre (global); Logistics and Distribution Centre (global)
Polpharma 5.2% ✔ ✔ ✔ Starogard Gd., Duchnie, Sieradz
Roche 4.6% ✔ ✔ ✔ IT Centre (global),Clinical Research Centre (CEE)
Servier 3.9% ✔ ✔ ✔ Warszawa
Merck (MSD) 3.8% ✔ ✔ ✔ Clinical Research Centre (EU)
Pfizer 3.4% ✔ ✔ ✔
Teva Group 3,1% ✔ ✔ ✔ Kraków, Kutno
AstraZeneca 3.1% ✔ ✔ ✔ Clinical Research Centre(CEE)
KRKA 3.0% ✔ ✔ ✔ Warszawa
Adamed (incl.Polfa Pabianice)
2.8% ✔ ✔ Pieńków, Pabianice
Bayer 2.7% ✔ ✔ ✔
Novo Nordisk 2.5% ✔ ✔ ✔
Abbott 2.5% ✔ ✔
Gedeon Richter 1.9% ✔ ✔ ✔ Grodzisk Maz.
Astellas Pharma 1.7% ✔ ✔ ✔
Valeant Pharma 1.7% ✔ ✔ Rzeszów
J&J 1.6% ✔ ✔ ✔
Eli Lilly 1.4% ✔ ✔ ✔
Biofarm 1.3% ✔ ✔ ✔ Poznań
Boehringer Ing. 1.2% ✔ ✔ ✔
UCB 1.2% ✔ ✔ ✔
Merck KGAA 1.2% ✔ ✔ ✔
Polfa Warszawa 1.1% ✔ ✔ Warszawa
Polfa Tarchomin 1.1% ✔ ✔ ✔ Tarchomin
Nycomed 1.1% ✔ ✔ ✔ Łyszkowice SSC (EU)
BMS 1.0% ✔ ✔ ✔
Lek-Am 0.8% ✔ ✔ ✔ Zakroczym
Menarini 0.8% ✔ ✔ ✔
* MSV – Sales value share in the pharmaceuticals market (excluding OTC drugs)Source: IMS Health, National Data 05/2011, ExMan net prices (PLN). Pharmaceuticals market(excluding OTC drugs)

Impact of the innovative pharma industry on the Polish economy • Report 29
Over half of the TOP 30 pharma companiesoperating on the Polish market have productionfacilities in Poland
The three largestcompanies in Poland areinnovative pharma players with productionfacilities (Novartis, Sanofi-Aventis and GSK)
Locations of the major investments (production facilities and functional hubs) of the TOP 30 pharma companies in Poland
x3
Legend
Production
Functional hub
Note: The Teva Group owns Pliva Krakow and Teva KutnoPolpharma owns three production facilities near Gdansk (one is in Medana and one waspurchased from Bioton). Polfa Pabianice is a subsidiary of Adamed.Source: Company information, PwC analysis
Undoubtedly, the range of interactions within the domestic economy increasesalongside rising investments. Some pharma companies have their productionfacilities in different regions of Poland.
Moreover, some innovative pharma companies have also established theirfunctional hubs in Poland (e.g. IT, Clinical Research and Shared Service Centres).
Market feedback indicates the absence of incentives supporting the developmentof investments at the central government level. However, overall cooperation with local authorities is very highly rated.
“We have a generally positive experience with local authorities. Their attitude hassignificantly improved in recent years. They are currently more open to welcomenew investments in their regions.”Pharma company, Poland
Overview of the pharmaceuticals market in Poland
30
In recent years total NHF spending on drugreimbursement has significantly increased.However, the NHFis expected to limit further increases inreimbursement spending and will freeze it atthe current level
In 2010 patients’ co-payment for drugs amounted to 32.3%
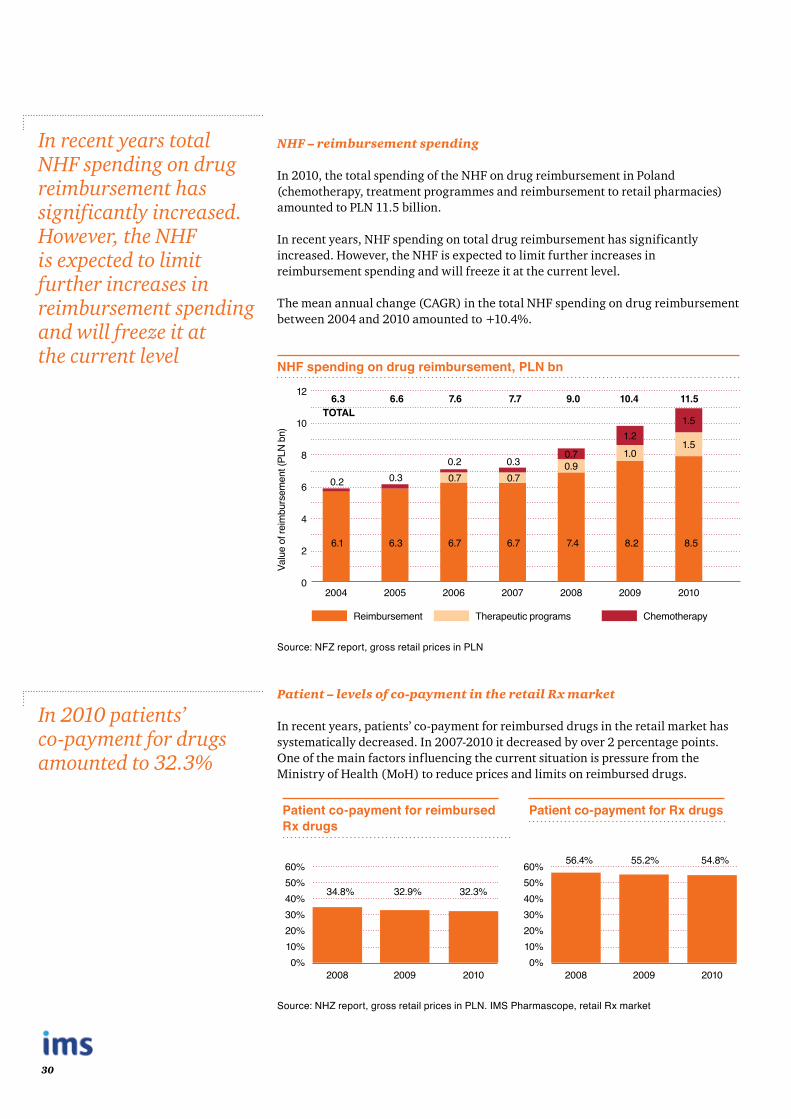
NHF – reimbursement spending
In 2010, the total spending of the NHF on drug reimbursement in Poland (chemotherapy, treatment programmes and reimbursement to retail pharmacies) amounted to PLN 11.5 billion.
In recent years, NHF spending on total drug reimbursement has significantly increased. However, the NHF is expected to limit further increases in reimbursement spending and will freeze it at the current level.
The mean annual change (CAGR) in the total NHF spending on drug reimbursement between 2004 and 2010 amounted to +10.4%.
NHF spending on drug reimbursement, PLN bn
8
6
4
2
0
10
12
Reimbursement
Valu
e of
reim
burs
emen
t (PL
N bn
)
0.2
6.1
2004
0.2
6.7
0.7
2006
0.3
6.7
0.7
2007
0.70.9
7.4
2008
1.21.0
8.2
2009
1.5
8.5
1.5
2010
Therapeutic programs Chemotherapy
2005
0.3
6.3
6.3 6.6 7.6 7.7 9.0 10.4 11.5TOTAL
Source: NFZ report, gross retail prices in PLN
Patient – levels of co-payment in the retail Rx market
In recent years, patients’ co-payment for reimbursed drugs in the retail market has systematically decreased. In 2007-2010 it decreased by over 2 percentage points. One of the main factors influencing the current situation is pressure from the Ministry of Health (MoH) to reduce prices and limits on reimbursed drugs.
Patient co-payment for reimbursed Rx drugs
Patient co-payment for Rx drugs
2008 2008
34.8% 32.9% 32.3% 40%30%20%10%0%
50%40%30%20%10%0%
50%60% 60% 56.4% 55.2% 54.8%
2009 20092010 2010
Source: NHZ report, gross retail prices in PLN. IMS Pharmascope, retail Rx market

Impact of the innovative pharma industry on the Polish economy • Report 31
Key market trends
Increasing competitionfrom generic drugs
The decline in R&D productivity and the upcoming expiry of blockbusters’ patent protection imply increased competition from generic drugs.
Strong pressure for price reductions very often leads to price negotiations with the payer.
Product portfoliodiversification
Those companies that were initially solely involved in the production of innovative drugs, increasingly engage in generics either by setting up their own production or through mergers and acquisitions.
Pricing pressures onreimbursed drugs
Since 2002 each subsequent revision of the reimbursement lists has involved significant reductions in drug prices and in limits on reimbursed drugs. Under the new law and due to the freeze on the drug reimbursement budget - this trend will continue.
Parallel tradeLow drug prices in Poland result in the increasing phenomenon of parallel exports. Parallel exports mainly concern expensive reimbursed Rx drugs. This situation may lead to reduced availability of these products on the local market.
Overview of the pharmaceuticals market in Poland


Impact of the innovative pharma industry on the Polish economy • Report 33
The role in the economy
Jak już wspomniano, innowacja opracowana oraz wdrożona przez innowacyjne przedsiębiorstwa farmaceutyczne przynosi korzyści gospodarce oraz społeczeństwu. Z tego względu, oczywistym wydaje się, iż należy wspierać maksymalne wykorzystanie efektów procesu innowacyjnego
• Sektory farmaceutyczny i biotechnologiczny przodują w rankingu najbardziej innowacyjnych gałęzi w Europie (udział wydatków na B&R w przychodach 2009)
• Wiele badań jakościowych opartych na analizach, które zostały opublikowane w renomowanych czasopismach medycznych (np. Lichtenberg, 2001 czy Caliskan, 2009), potwierdza, że zaawansowane metody terapeutyczne mają pozytywny wpływ na długość życia, a stosowanie innowacyjnych leków przyczynia się w 40% do tego efektu
Tytuł wykresu
Nota: Źródło:
Tekst
The role in the economySection 3

34
Innovation providesnumerous benefits for the economy and society…
…however, it also requires significantcapital investments
Innovation in the economy
Innovation is one of the key prerequisites of economic development. It assures itssustainability and enhances the living conditions of society.
“Innovation is most frequently defined as scientific discovery or invention, which is then commonly used in everyday life by society. It assures the sustainabledevelopment of the economy.”Report by Working Group for Innovation in Healthcare 2010
In particular, innovation in healthcare appears to be very important from the socialpoint of view. In the light of current and forecast epidemiologic trends, only thedevelopment and introduction of advanced therapies appears to have the potentialto take the technological progress in medicine forward.
• It appears that only innovative drugs can contribute to breakthroughs in therapy for some diseases, such as oncology, which still remains one of the leading causes of death; diabetes, which exhibits an increasing epidemiologic trend as well as musculoskeletal ailments, which are expected to be growing in volumes due to the ageing of the population.
• The total cost of a drug’s successful route to market exceeds EUR 1 059 million and the process itself can last up to 13 years. Thus, it requires significant business effort and innovative companies undertake such investments.
Average cost of the molecule route to market (EUR m)
0 200 400 600 800 1 000 1 200
Pre-human/Pre-clinical Phase II Approval Uncategorised
Phase I Phase III Pharmacovigilance (Phase IV)
Clinical trials
286 87 137 344 50 152 3 EUR 1 059 mlnEUR mln
Source: EFPIA, PwC analysis

Impact of the innovative pharma industry on the Polish economy • Report 35
The role in the economy
The pharmaceuticalssector is ranked as the most innovative industry in Europe
• The pharmaceuticals and biotechnology sector tops the ranking of the most innovative industries (R&D to sales ratio, 2009).
• A number of qualitative analysis-based studies, published in respected medical journals (e.g. Lichtenberg, 2001 or Caliskan, 2009), confirm that the introduction of advanced therapeutic methods has a positive impact on life expectancy, and the application of innovative drugs accounts for c. 40% of the life span.
Ranking of industrial sectors by R&D/Sales ratio, 2009
Pharma & biotech
Software & computer services
Technology hardware & equipment
Leisure goods
Healthcare equipment & services
Automobiles & parts
Electronic & electrical equipment
Aerospace & defence
All sectors
Chemicals
Industrial engineering
General industrials
Household goods
Fixed line telecom
Food producers
Oil & gas producers
0% 5% 10% 15% 20%
15.9%
9.9%
8.7%
6.5%
6.2%
4.7%
4.4%
3.9%
3.5%
3.4%
3.1%
2.6%
1.8%
1.7%
1.2%
0.4%
R&D/Sales ratio (%)
Note: Data relate to the top 1 400 companies with registered offices in the EU, Japan and the Rest of World,ranked by total worldwide R&D investmentSource: The 2010 EU Industrial R&D Investment Scoreboard, European Commission, JRC/DG Research

36
Access to this innovation appears rather limited in Poland, as confirmed by cross-European studies, which aim to index innovation development.
• Attention should be paid to the fact that Poland ranks significantly below the EU27 average.
• Even though innovation enhancement is included in the Ministry of Health’s (MoH) Green Books 2008 as one of the goals, not much progress appears to have been made. The historical growth in innovation is still very low in Poland, unlike in other emerging European markets where growth rates for the past years have been several times greater.
It appears that to be able to catch up with the more mature economies, moreemphasis should be placed on Poland’s strategic support for promoting innovation.
Innovation Union Scoreboard - Summary Innovation Index*, 2010
Growth in Summary Innovation Index*, CAGR ‘06:’10
SwitzerlandSweden
DenmarkFinland
GermanyUSA
JapanUK
BelgiumAustria
NetherlandsIreland
LuxembourgFrance
EU27CyprusIceland
SloveniaEstoniaNorway
PortugalItaly
Czech Rep.Spain
GreeceMalta
HungaryCroatiaPoland
SlovakiaSerbia
RomaniaLithuaniaBulgaria
Latvia
BulgariaPortugal
MaltaLatvia
RomaniaSlovenia
CyprusEstoniaCroatiaGreece
SwitzerlandItaly
FranceHungary
Czech Rep.Finland
GermanySerbia
NorwayNetherlands
BelgiumAustriaSpainJapan
IrelandUK
EU27USA
PolandSlovakiaIceland
DenmarkSweden
LuxembourgLithuania
0.0 0.5 1.0 0.0% 5.0% 5.0%
Summary Innovation Index* 2010 Summary Innovation Index* - GrowthCAGR ‘06:’10
Note: * Average Innovation Index is measured using a composite indicator building on data for 24 indicators related to R&D, investments, human resources, intellectual assets, etc. CAGR – Compound annual growth rateSource: Innovation Union Scoreboard 2010
The average level ofinnovation in Poland is much lower comparedto the more matureEuropean economies…
…and it has historicallygrown at a much lower pace than in most of CEEregion geographies aswell

Impact of the innovative pharma industry on the Polish economy • Report 37
The role in the economy
Areas of contribution
Patient access to drugs, which are continuously becoming more therapeuticallyadvanced, appears by far to be the very first and the most major contribution of theindustry to the welfare of society. From the economic point of view, the range ofareas of contribution is broader.
Among the pharmaceutical companies operating in our country the largestinfluence on the economy have been had by those businesses with productionfacilities in Poland. But those importing drugs from abroad also have a significantimpact on the economy and society. This consists of: business operations and jobcreation, education of physicians and patients, transfer of know-how, the generalraising of the level of medical knowledge in the country, etc.
Area of the mostsignificant contributionR&D
Education/Know-how
SSC/Functional
hubs
CSRState
budget
Labourmarket
Businessoperations
/Trade
Production /Investments
Inno
vativ
eG
ener
ic
Pure trade (Resale) Manufacture
Level of market engagement
Leve
l of i
nnov
ativ
enes
s
Source: PwC analysis
The pharma industrycontributes to economy and society in a number of ways. Firstly, it provides more advancedmethods of patienttreatment
Innovative companies with manufacturingactivity appear to have the most significantinfluence on the economy

38
Economic impact
In 2010, the total impact of pharmaceutical companies on value creation in thePolish economy, including both direct and indirect effects, was 0.80% of GDP.
• The direct contribution of the pharmaceuticals sector to the Polish economy was 0.32% of GDP.
• The indirect contribution (inter alia stimulating business for various types of companies) of the pharmaceuticals sector was 0.48% of GDP.
More than half of the effect came from indirect impact connected with costsincurred during production of pharmaceuticals in Poland (material costs, services,etc.) and generated 0.44% of GDP.
Approximately 60% of the contribution to GDP is generated by innovative pharmacompanies (0.47% of GDP).
Contribution to GDP in 2010
Total marketInnovative (% of total market)
Comment
Direct effect
Domesticmanufacture* 0.28%
0.19%(59%)
Value addition directlygenerated by pharmacompanies (both manufacture and resale)
Distribution and trade (Reselling)**
0.04%
Indirect effect
Domesticmanufacture* 0.44%
0.28%(58%)
Value addition generated by pharma companies’ suppliers of goods and services
Induced effect of anincreased consumer spend driven by employment andbusiness ties with thepharma industry (induced effect)
Distribution and trade (Reselling)**
0.04%
TOTAL EFFECT % of GDP 0.80% 0.47%(59%)
Note:*Includes contribution generated by companies with manufacturing activity in Poland;**Includes other pharma companies operating in Poland, excluding pure wholesalersTo calculate the revenue to the state budget, we used the value of taxes and fees paid by innovative firms, covering all their activities (including those related to innovative medicines, generic and OTC)Source: GUS, PwC analysis
In 2010, innovativepharma companiescontributed to c. 0.47% of Poland’s GDP, which is c. 60% of the total sector contribution

Impact of the innovative pharma industry on the Polish economy • Report 39
The role in the economy
Contribution to the labour market
In 2010, pharmaceutical companies directly employed 31 thousand people inPoland, which is c. 0.23% of the total number of people employed in Poland in2010.
Besides direct employment, pharmaceutical companies create around 80 thousand to 90 thousand jobs indirectly:
• Polish pharmacies as retail distributors of pharmaceuticals provide around 60 thousand jobs, which can all be ascribed to the activity of pharmaceutical companies.
• Pharmaceuticals wholesalers employ around 20 thousand to 30 thousand people.
• Job creation of suppliers of products and services to the pharma industry such as chemical components, machinery, marketing services, etc. is an additional contribution by the industry to the labour market.
Innovative companies employed around 11 thousand people (full-time equivalentsor FTEs), which is c. 35% of the total number of people employed in the pharmaindustry in Poland.
Contribution to labour market in 2010
Total market(% of employedpersons overall)
Innovative(% of employedpersons overall)
Comment
Direct employment
31.1 thousandjobs (0.23%)
11 thousandjobs (0.10%)
Includes direct employment inboth manufacturing and resellingcompanies
Employment inwholesale andpharamacies
c. 80-90 thousand jobs (0.64%)
Includes indirect employmentstimulated by the broader pharma sector, i.e. jobs in wholesale companies and pharmacies
Other indirectemployment (e.g.subcontractors)
Owing to pharma activity, additionaljobs are created across industries;however, the exact effect is notquantifiable
Includes jobs created insubcontracting companies providing goods and service to the pharma industry
Innovative companies, throughtheir R&D activity, also stimulatethe local CRO market and itsemployment
TOTAL EFFECT c. 110-120 thousand jobs (0.87%)
Source: GUS, ISI securities, PwC analysis
Directly, the innovativepharma industrygenerates around 11thousand jobs. However, the total effect on the labour market is much stronger
40
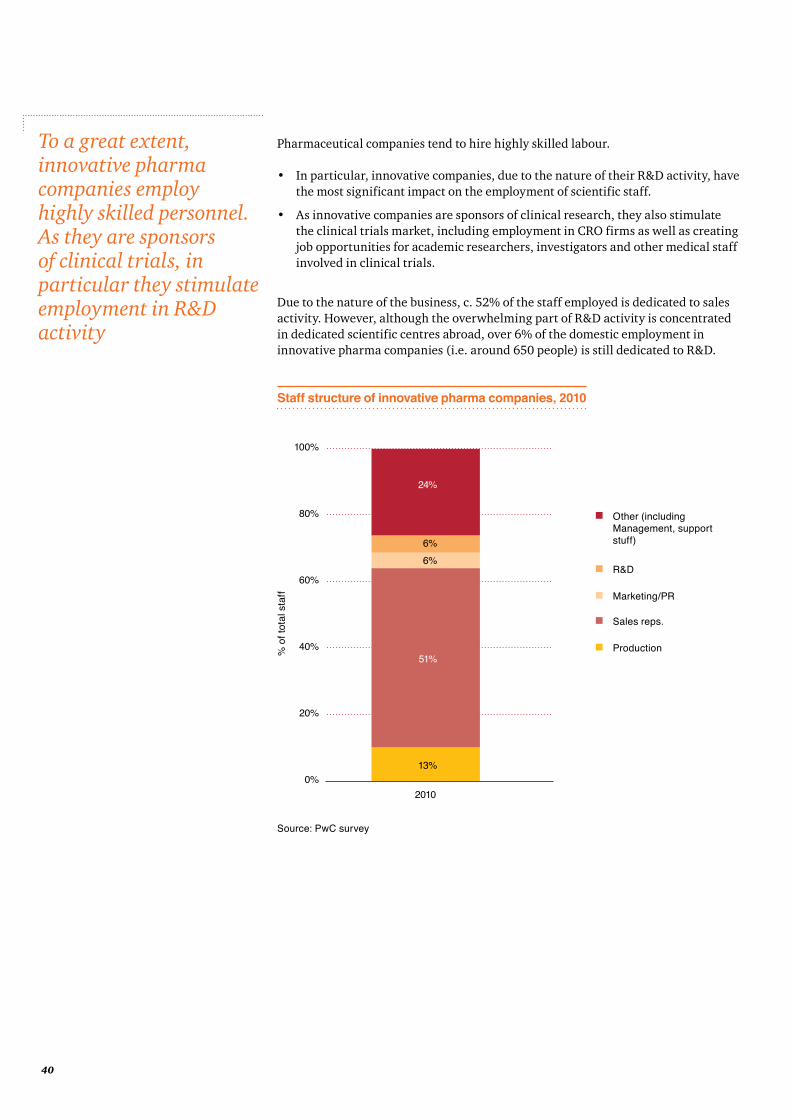
Pharmaceutical companies tend to hire highly skilled labour.
• In particular, innovative companies, due to the nature of their R&D activity, have the most significant impact on the employment of scientific staff.
• As innovative companies are sponsors of clinical research, they also stimulate the clinical trials market, including employment in CRO firms as well as creating job opportunities for academic researchers, investigators and other medical staff involved in clinical trials.
Due to the nature of the business, c. 52% of the staff employed is dedicated to sales activity. However, although the overwhelming part of R&D activity is concentrated in dedicated scientific centres abroad, over 6% of the domestic employment in innovative pharma companies (i.e. around 650 people) is still dedicated to R&D.
Staff structure of innovative pharma companies, 2010
100%
80%
60%
40%
20%
0%
24%
6%6%
51%
13%
2010
Other (includingManagement, supportstuff)
R&D
Marketing/PR
Sales reps.
Production% o
f tot
al s
taff
Source: PwC survey
To a great extent,innovative pharmacompanies employ highly skilled personnel. As they are sponsors of clinical trials, in particular they stimulate employment in R&D activity

Impact of the innovative pharma industry on the Polish economy • Report 41
The role in the economy
Employing mostly highly qualified staff corresponds to the fact that salaries in thepharmaceuticals sector are significantly higher than in other manufacturing sectorsin Poland.
• According to GUS, the average salary in the pharmaceuticals manufacturing industry in Poland is c. PLN 5.2 thousand, while Poland’s average remuneration is PLN 3.2 thousand.
• Wages in the pharma industry are c. 60% higher than Poland’s average wages.This fact also impacts the larger purchasing power of pharma industry employees, thus, leading to higher consumer spending and higher taxes paid.
GUS data shows that in 2010, all pharmaceutical companies spent, on average, c. PLN 1.5 thousand per head on the career development of their employees (i.e. both internal and external training sessions).
• PwC Survey results suggest that the average spend per employee in innovative companies is around three times higher than the overall industry average.
• Innovative companies allocated c. PLN 60 million to training internal staff in 2010.
We note that the transfer of knowledge (such as business know-how) carried out by experienced staff takes place also when they are employed outside the industry. In this way, the experience gained has a bearing on work effects in other sectors ofthe economy.
Avarage monthly wages in the pharma industry vs. the market
2006 2007 2008 2009 2010
2.4 2.5 2.7 2.72.9 2.9
4.7
5.2
3.0 3.1
5.2
3.1 3.2
Inde
x (P
L av
erag
e ’10
= 1
00)
180
140
100
60
20
160
120
80
40
0
PLN
k
6
5
4
3
2
1
0
GrowthCAGR*(‘08:‘10)
Pharma
Manufacturing
PL average
4.7%
4.6%
4.7%
Note: CAGR – Compound annual growth rateSource: GUS
Wages and career developmentopportunities in the pharma sector appear to be significantly above national averages
Innovative companies tend to invest morein human capitalthan the other pharmacompanies

42
According to independent employee satisfaction surveys (e.g. “Great place to work”), innovative pharmaceutical companies are perceived as desirable places to work.
In the most recent edition of the survey, 4 out of the 10 highest-ranked businessesare innovative pharma companies.
Such results should be appreciated even more, as the survey takes a broader range of criteria into account, apart from a purely economic aspect (i.e. abovemarket salary).
The top 10 places to work in Poland (“Great place to work” employee satisfaction survey)
2009 edition 2010 edition 2011 edition
Rank Company Rank Company Rank Company
1 Google 1 IKEA 1 Microsoft
2 Novo Nordisk 2 Alior Bank 2 EMC ComputerSystems
3 Alior Bank 3 Leroy Merlin 3 SC Johnson
4 Sabre Polska 4 BMS 4 Novartis PolandPharma
5 Eli Lilly Polska 5 Instytut Nafty i Gazu 5 Hitachi Data
Systems
6 SKOKUbezpieczenia 6 Microsoft 6 Hilti
7 Hestia 7 SC Johnson 7 Eli Lilly Polska
8 GSK 8 Medtronic Poland 8 Amgen
9 Oriflame 9 LK Dr Irena Eris 9 Ochnik
10 Instytut Nafty i Gazu 10 Novartis Poland
Pharma (Sandoz) 10 Baxter
Source: Great Place To Work ® Institute
Results of independentemployee satisfactionsurveys show that innovative pharmacompanies are appreciated for their good work environment
Impact of the innovative pharma industry on the Polish economy • Report 43
The role in the economy
Investments
Our estimates based on data from GUS and companies indicate that the pharmaceutical sector in Poland has invested c. PLN 6.7 billion in the six years between 2004 and 2009.
The top 10 spenders financed c. 40% of the total value of those investments.
• Obviously, the value of investments financed by companies with manufacturing activity in Poland accounted for the most significant part of such capital expenditure and were primarily devoted to production activity.
• However, other companies also contributed to the development of the industrial infrastructure in Poland, e.g. by building processing sites, logistics centres and warehouses.
• The top 10 most active companies invested PLN 2.8 billion which constituted c. 40% of the total investments by the pharma industry over 2004-2009.
• Of the top 10 spenders, five are innovative companies. They invested c. PLN 1.6 billion, which is c. 60% of the investments undertaken by the top 10 spenders.
Long-term investments financed by pharma industry
2004 2005 2006 2007 2008
0.430.61
1.271.10
1.38
GrowthCAGR*(‘04:‘09)
PLN
bn
2.0
1.5
1.0
0.5
0.0
1.86
2009
Investments 2004-2009: PLN 6.7bn
34.2%
Note: CAGR – Compound annual growth rateSource: GUS, PwC analysis
“I wouldn’t expect many new greenfield investments by companies that do not havemanufacturing sites in Poland yet. But those companies which already have productionfacilities may expand their operations – by building new lines or via M&A andmodernization of existing facilities.”Pharma company, Poland
Since 2004, the pharmaceuticals sector has financed investments of c. PLN 6.7 billion in Poland
Innovative companies are very active in newinvestments

44
Production activities
Innovative pharma companies are consistently growing their business in Poland,also moving production activities to our country.
• Currently, they have seven manufacturing facilities in Poland. Of these, two are in the Łódz area, while the others are in the Wielkopolska, Mazovia and Podkarpackie regions.
• These include both newly established production facilities, as well as those acquired from other companies, and bought during the privatisation of the Polish pharmaceutical industry.
• The first production plant in Poland was purchased in 1998 and the last in 2010.
• The privatisation of a pharmaceutical factory by an innovative pharma company worth USD 400 million was one of the largest equity transactions during the transition period. This process has been reviewed by the Supreme Audit Office as one of the most effective sector privatisations.
In Poland, innovative companies manufacture around 430 products and produceannually around 200 million packages. The main character of this activity isproduction of solid forms, ointments, creams and capsules.
The development of production depends to a large extent on the transfer of drugs manufacturing from other countries to Poland, and is related to subsequent investments. In 2010 alone, innovative pharma companies invested c. PLN 120 million in the development and modernisation of their production facilities.
The structure of target markets to which pharmaceuticals produced in Poland are delivered differs depending on the portfolio of manufactured drugs. Drugs derived from global corporate portfolios are in the vast majority exported.
The value of exports was c. PLN 3.6 billion in 2010, which represents 34% of thetotal sales of the innovative pharmaceuticals industry in Poland. Polish drugs aredelivered to more than 80 markets worldwide.
• It is the pharmaceutical site of the Novartis Group that allocates the largest portion of production to exports.
• The largest exporter is the factory of GlaxoSmithKline in Poznan. The value of drugs sold abroad in 2010 was PLN 3.4 billion.
• The manufacturing site of Sanofi Group in Rzeszow provides 37% of its production to foreign markets.
As mentioned earlier, through the production of pharmaceuticals in Poland,innovative companies create new jobs and become a major employer in the regionswhere factories are located. In the drug factories of innovative companies, currently around 1,400 people are employed, representing c. 13% of the staff employed in the innovative pharma companies.
Innovative companies have seven drug factories in Poland, employing c.13% of all staff. Polishpharmaceuticals are delivered to 80 marketsworldwide and the value of their exports in 2010was c. PLN 3.6 billion

Impact of the innovative pharma industry on the Polish economy • Report 45
The role in the economy
Market feedback suggests that more incentives should be launched to attractfurther investments in Poland, especially at the central government level.
• “We need to remember that nothing can be just taken for granted! The currently active players entered the market in 1990s, attracted by low labour cost and great market potential at that time. But those advantages are expiring over time as Poland develops, therefore we need to implement some incentives to make us an attractive market.”Pharma company, Poland
• “It appears no central plan or strategy exists to attract and – perhaps even more importantly – to retain investments in Poland. On the other hand, local authorities are typically quite supportive. Access to local decision makers is well organized.”Pharma company, Poland
Professional service hubs and Shared Services Centres
Apart from production activities, a number of enterprises have selected Poland asthe location for outsourcing and/or shared services centres. Frequently, such units deal with providing services to other branches located worldwide.
• Apart from additional investment in facilities and contributions to the labour market, this phenomenon underpins a technology and know-how spillover.
• “The fact that our IT hub with the coverage of the whole of the CEE region is located in Poland creates a number of opportunities for the staff working here, e.g. increase technical skills, becoming familiar with international standards of system implementations, etc.”Pharma company, Poland
(See page [28] for examples of hubs located in Poland, which are centres responsible for IT services, R&D data processing and other business services).
Another wave of investments could beexpected provided greater incentives areintroduced

46
Contribution to the state budget
The pharmaceuticals industry significantly fuels the state budget with taxes andfees, both directly incurred by pharma companies as well as indirectly paid by theiremployees and cooperating companies.
PwC Survey results show that the overall pharmaceuticals industry fuels the statebudget to the tune of c. PLN 1.0 billion and innovative pharma companies pay c.60% of this amount.
The innovative companies stimulate flows to the budget through R&D activity andthe overall clinical trials market.
We estimate that the state budget benefits by c. PLN 240 million from flowsgenerated by the clinical trials market in Poland per year (PwC report: “Clinicaltrials in Poland – Key Challenges”, November 2010). It is important to note that thesponsors of clinical trials, i.e. innovative pharma companies, primarily drive thisbudgetary inflow. This effect has been included in the calculation in the table below.
Contribution to the state budget in 2010
Total market Innovative
Income taxes (CIT, PIT) c. PLN 0.50bn PLN 0.30bn
VAT c. PLN 0.40bn c. PLN 0.25bn
Other taxes (e.g. property/real estate, duty fees, excise, etc.) c. PLN 0.03bn c. PLN 0.02bn
Regulatory payments (e.g. Registration Office fees) c. PLN 0.05bn c. PLN 0.03bn
TOTAL DIRECT EFFECT c. PLN 1.0bn c. PLN 0.6bn
+ Social contributions (ZUS) c. PLN 0.4bn c. PLN 0.2bn
+ Other taxes (additional PIT contributions, support services’ and othersuppliers’ taxes, taxes paid via spend on consumer goods, etc.)
Note: To calculate the revenue to the state budget, we used the value of taxes and fees paid byinnovative firms, covering all their activities (including those related to innovative medicines, genericand OTC)Source: PwC survey
Innovative pharmacompanies added to the state budget with c. PLN 0.6 billion of taxes and other fees in 2010

Impact of the innovative pharma industry on the Polish economy • Report 47
The role in the economy
Alternative cost savings for MoH and NHF
Pharmaceutical companies tend to provide alternative cost savings for thehealthcare system. This process appears particularly important in light of thefact that the Polish healthcare system is viewed as underfinanced.
The pharmaceuticals sector provides support to the healthcare system in a numberof areas. The most important are as follows:
Prevention programmes and screening tests The quality of diagnostics services in Poland has improved in the recent years;however, it still lags behind more mature markets.
• Specialised programmes financed (thoroughly or partially) by pharmaceutical companies enable specific groups within populations (patients with particular diseases) to benefit from early diagnosis and from a more effective treatment in the future.
• Innovative companies participated in around 60 prevention programmes in 2010 aimed at targeting around 300 thousand patients.
• The total cost of such activities amounted to c. PLN 30 million.
Source: PwC survey
R&D activity Participants of clinical trials, sponsored by innovative pharma companies, typicallyobtain therapies beyond standard treatment, which are more costly.
The oncology example shows that the treatment of c. 4% patients in this medicalarea is financed in the course of clinical trials, which may correspond to up toPLN 130 million alternative cost savings. However, as the quality of treatmentunder clinical trial is usually higher than that of the standard available therapy,the actual value of such treatment can be around four times larger, accountingfor c. 15% of the NHF spend on oncology.
Professional staff development Pharma companies contribute to the improvement of know-how of medical staff in Poland by organising training sessions and conferences for physicians, who areawarded educational points respected by the physicians’ professional self-government.
“The introduction of innovations to patients in healthcare requires cooperation on many levels. R&D activity is equally important as subsequent stages of this process, i.e. the transfer of knowledge about the features of new therapies to the healthcare community. The pharmaceutical sector is a reliable partner for the government and healthcare professionals’ self-government when communicating this knowledge to medical personnel.”Pharma company, Poland
Many standard businessoperations of innovativepharma companiesprovide alternative costsavings for the state budget

48
Business driving for other companies
The pharmaceuticals sector creates demand for goods and services provided byentities from other sectors of the economy, driving the need for their existence:
• Local providers supply raw materials to companies with manufacturing activity in Poland.
• Pharma companies in general can benefit from a broad range of services provided by domestic IT systems, marketing, logistics, business services providers and other companies.
• Local CROs can engage in projects for large international sponsors.
Outsourcing of support services additionally stimulates this phenomenon, whichappears to be an increasing general business trend.
Polish innovative pharma market total cost breakdown, 2010
80%
50%
40%
30%
10%
0%
19.2%
12.8%
38.7%
2010
20%
60%
70%
90%
100%
2.7%
3.2%
5.7%
1.4%0.5% 2.0%
4.7%
5.2%
3.9%
Production
Other cost
Therapeutical programs & education activities*
R&D
Salaries & other employee-related costs
Business services
Energy & utilities
Distribution costs (logistics & storage)
Travel & lodging
Marketing / PR
Other costs of production
Printing & packaging
Raw materials
Note: * includes spending on doctor and patient education , expenditure on preventive programmes, CSR activities and the provided discountsThe chart depicts aggregated cost breakdown of innovative pharma industry; individual companiesmay present other cost structures, especially since many firms do not possess manufacturing sitesin Poland.Source: PwC survey
Operations of pharmacompanies drive the business of a large number of companies in various markets

Impact of the innovative pharma industry on the Polish economy • Report 49
The role in the economy
In 2010, innovative pharma companies spent c. PLN 7.2 billion on contracts withsuppliers of goods and services.
Nearly 50 thousand contracts were signed for the delivery of goods and services,supplying business for other companies.
Nearly 95% of the total number of supplying agreements were concluded with domestic enterprises.
Value of contracts between innovative pharma companies and suppliers of subcontracted goods and services [PLN bn]
2008 2009 2010
5.1
6.0
7.2GrowthCAGR*(‘08:‘10)
PLN
bn
4.0
3.0
2.0
1.0
0.0
18.2%5.0
6.0
7.0
8.0
Note: CAGR – Compound annual growth rateSource: PwC survey
No. of contracts between innovative pharma companies and suppliers of subcontracted goods and services [k]
2008 2009 2010
46.8 49.5 49.1
GrowthCAGR*(‘08:‘10)
No.
of c
ontra
cts
[k]
40
30
20
10
0
2.4%
50
60
95% of thesuppliers aredomesticcompanies
Note: CAGR – Compound annual growth rateSource: PwC survey
PwC survey results show that innovative companies signed around50 thousand contracts with suppliers ofsubcontracted goods andservices for a total value of c. PLN 7.2 billion

50
R&D activity/Clinical trials
Clinical trials constitute a separate market within the broad pharmaceuticalindustry. We estimate this market in Poland was worth c. PLN 920 million in 2010(PwC Report: “Clinical trials in Poland – Key challenges”, November 2010).
While innovative pharma companies clearly contribute to the development of globalmedicine via sponsorship of clinical trials, execution of clinical trials in Poland has a corresponding impact on the local economy in particular.
Regardless of whether these expenses are borne directly by the pharmaceuticalcompanies or CRO companies, revenue from clinical trials fuels the Polisheconomy directly.
Estimated clinical trials market size, Poland
2008 2009 2010
~825
PLN
m
800
600
400
200
0
1,000
1,200
~860 ~9204%7%
Note: * Market size is defined as total expenditure on execution of clinical trialsSource: PwC report: “Clinical Trials in Poland – Key Challenges” (November 2010)
Estimated clinical trial budget breakdown, 2009
100%
80%
60%
20%
0%
11%
31%
Clinical trials budget breakdown
40%8%
31%
2%
2%14%
Other*
Medical costs (other than drugs, i.e. lab tests, scans, etc.)
CEBK fees
Ethical Committees fees
Sites remuneration
Researchers remuneration
Support services (i.e. couriers,accommodation, travels, translations, etc.)
Salaries of internal and insourced staff
1%
Note: * Other includes remaining categories not included elsewhereSource: PwC report: “Clinical Trials in Poland – Key Challenges” (November 2010)
We estimate the clinical trials market in Poland was worth c. PLN920 million in 2010

Impact of the innovative pharma industry on the Polish economy • Report 51
The role in the economy
Clinical trials provide a number of benefits, both tangible and intangible, to the host country. The most important benefits of conducting clinical trials include thefollowing:
Tangible effects
Contribution to the state budget
• We estimate that over PLN 220 million came into the state budget in the form of taxes paid directly by sponsors and CROs via Corporate Income Tax (CIT), Personal Income Tax (PIT), Value Added Tax (VAT) and other taxes, in 2009.
• Additionally, the state budget benefits from c.PLN 20 million deriving from regulatory fees collected by CEBK and the Ethical Committee.
• These figures do not include other additional taxes paid by various stakeholder groups (i.e. additional researchers’ PIT contribution and spending on consumer goods, etc.).
Alternative cost savings
• Clinical trials provide alternative cost savings for the NHF as a number of patients participate in clinical trial projects and are actually co-financed by the sponsors rather than by public funds.
• Our estimation for oncology, for example, which covers approximately one-third of clinical trial participants in Poland, suggests that in 2009, the NHF saved c. PLN 130 million in this way.
• Moreover, as participants typically obtain therapies beyond standard treatment, the value of oncology treatment under clinical research may amount up to c. PLN 0.5 billion. This amount appears to be significant compared to the total NHF budget on oncology treatment, amounting c. PLN 3.4 billion in 2009.
PWC Survey: “What are the key benefits of clinical trials?”
Access toadvanced
therapies forpatients
96%88%
58%
% o
f res
pond
ents 80%
60%
40%
20%
0%
100%
42% 42%
Contribution tothe economy /
financialincentives
Education &professional
development ofresearchers
Employmentopportunities
Transfer ofnew
technologiesand
know-how
Note: Multiple answers available; results do not sum up to 100%Source: PwC report: “Clinical Trials in Poland – Key Challenges” (November 2010)
Execution of clinical trials providesfinancial benefits to the state budget as well as alternative cost savings for the healthcaresystem

52
It also facilitates access to better standards oftreatment for patients as well as provides know-how spillover on broader medical society
Intangible effects
Facilitated access to better standards of treatment for patients
• The discrepancy in treatment methods between Poland and WE primarily stems from the underfunding of the Polish healthcare system.
• Participation in clinical trials makes very costly or even currently unavailable treatments accessible in Poland.
• Participation in clinical trial is seen to provide better access to healthcare services and an increased availability of medically advanced drugs for free.
Know-how
• Clinical research projects assume a uniform and standardised methodology of clinical investigation, data collection and reporting. In this way, local medical staff and the healthcare system, in general, can benefit from skills obtained during the research process.
• Local medical staff including doctors, their assistants, all supporting staff and nurses can benefit from skills obtained during the research process.
• In order to coordinate the clinical trials between centres located in various countries, clinical trials operators provide support in diagnostic decisions. This is relevant for phisicians, which additionally contributes to the exchange of knowledge and expertise.
Opportunities for researchers and young doctors
• Researchers in Poland appear to be more willing to participate in clinical trials investigation compared to more mature markets, because the difference between the base salary and the wages in clinical trials centers is greater.
• Financial benefits make researchers remain domestically employed, which is particularly important in light of physicians migrating abroad for job opportunities.
• Participation in clinical trials facilitates scientific work for doctors as they have the opportunity to publish articles in international medical journals and, at the same time, obtain financing from sponsors. However, recently, this factor has appeared to have lost its significance due to a deteriorating climate over clinical trials in Poland.

Impact of the innovative pharma industry on the Polish economy • Report 53
The role in the economy
The key barriers areinsufficient transparencyof rules and administrative process drawbacks
Key barriers to market development
Administrative process drawbacks/insufficient transparency of rules • Market participants stress the issue of insufficient transparency of legal rules
related to clinical trials and their enforcement.
• There is an overlapping of competencies by different regulatory/approval bodies and dealing with issues within areas not subject to their core mission, e.g. an unclear competency split, for instance, between the CEBK and Ethical Committees.
• Implementation of the EU Directive is progressing slowly, e.g. with regard to maximum clinical trial registration time and the reluctance to introduce CTFG/VHP (an initiative aimed at assuring a standardised and regular information sharing between the National Competent Authorities [NCAs]).
• Financing rules are unclear, e.g. misunderstanding between the sponsors and the NHF on who should bear the cost of patient treatment.
Long registration period
• Long registration time appears to be one of the most significant barriers in Poland, which has one of the longest average periods for trial registration compared to other European geographies.
• Due to extended administrative processes, many clinical trials that could be carried out in Poland, are performed in other CEE/SEE countries or Western Europe. It is estimated that Poland would attract c.20%-30% more clinical trials if it had shorter registration periods.
Average clinical trial registration period
0 20 40 60 80days
• CEBK estimates that the registration time in 2007-2009 was c. 65 days, on an average.
• However, this time period does not appear to include the “stop clocks”
Poland
Slovakia
Hungary
Estonia
EU Directive
Czech Rep
Romania
Lithuania
Latvia
Bulgaria
Slovenia
Source: PwC report: “Clinical Trials in Poland – Key Challenges” (November 2010)

54
Site managementissues and insufficientinformation sharing alsoappear to be a problem
Sites management
• Sponsors admit that cooperation and completion of administrative issues are normally faster in the case of non-public healthcare institutions (NZOZ).
• Difficulties in negotiations and contracting with sites are perceived as impairing proper cooperation.
• Lack of efficient standards in contract negotiations between sponsor, site and researchers usually results in delays in the entire process.
• Lack of a dedicated unit responsible for clinical trial affairs in sites makes discussion on how to launch and then process the trial more difficult.
Insufficient information sharing
• The level of information, which is widely available on clinical trials, generally appears to be insufficient.
• Scarcity of information may result in limited access to trials for potential participants.
• Image deterioration of clinical trials is caused by negative attitude adopted by some sections of the media.
PwC Survey: “What are the obstacles for execution of clinical trials in Poland”
Insufficienttransparency of
rules
84% 84%
65%
% o
f res
pond
ents 80%
60%
40%
20%
0%
100%
29%
6%
Difficultcooperation
betweensponsors and
sites
Administrativeprocess
drawbacks(incl. long
registrationperiods)
Insufficientinformation
available to thepublic
Lack of opendiscussion
between MoHand industry
Note: Multiple answers available; results do not sum up to 100%Source: PwC report: “Clinical Trials in Poland – Key Challenges” (November 2010)

Impact of the innovative pharma industry on the Polish economy • Report 55
The role in the economy
In order to maintaincompetitive growth rates,Poland needs to launch a number of initiatives,following the example of more mature markets
As the global market for clinical trials shifts eastwards to emerging geographies,where cost is lower and patient recruitment easier, it can be expected that themarket growth rates of Poland/CEE converge to USA/Canada and WE growth levelsin the medium term along with market maturation.
Currently, the key high-growth regions are Asia, CIS and the Middle East. However,it appears only moderately sustainable in the long term as sponsors may seekcountries where the clinical trial operational environment is more developed (e.g. patent protection rules are stricter and the legislative framework friendlier and more solidly based).
As participation incentives become weak, to maintain positive growth and tocontinue to operate trials at home, mature markets have implemented severalreforms such as facilitation of administrative procedures, shorter registration timesand transparent contracting standards. Poland/CEE countries are expected tolaunch such facilitating initiatives if they want to compete with fast-growing markets.
Pivotal clinical trials submitted in MMA registered at EMEA
Fast-growing marketsare expected to exhibitconverging trendtowards maturemarkets’ growth levelsin the medium to long term
-50%Growth in no. of clinical trials
0%
50%
100%
150%
200%
Emerging markets
Mature markets
Africa
CIS Middle East/Asia/Pacific
SEE (excl. Bulgaria & Romania)
Poland
CEEBulgaria &Romania
Central/SouthAmerica
EU-15Australia/NewZealand
USA/Canada
INDICATIVE
0% 30% 60% 90%
Gro
wth
in n
o. o
f par
ticip
ants
Note: Analysis is indicative, based on clinical trials sample, i.e. pivotal clinical trials submitted in MMAs registered at European Medicines Agency (EMA);Bubble size indicates average per annum number of participants in 2005-2008Source: EMA

56
One of the key areas of contribution by the innovative pharma industry is stimulatingthe transfer of know-how
Also, innovative companies remain one of the most importantchannels of education for physicians
Education of physicians/Transfer of know-how
Pharmaceutical companies launch and/or participate in a number of initiatives thatare aimed at creating professional development opportunities for medical staff.
• These initiatives include organisational and financial support for doctors to become opinion leaders by participating in conferences, seminars, expert panels and workshops, e.g. on the topics of GCP, statistics, medical writing, etc.
Pharma companies also provide direct trainings for doctors on how to applyadvanced methodologies of treatment.
• “For example, we tend to invite internationally respected professors, with great renown, specialised in some rare diseases, to provide lectures for local physicians and in this way share their knowledge with them. This year, we will do it for nearly 500 diabetologists.”Pharma company, Poland
Apart from events for physicians, innovative pharma companies tend to engage in a number of other initiatives aimed at providing knowledge for doctors and othermedical staff.
• This is exemplified by publishing source materials (both domestic and international ones) on the recent discoveries and medical technologies, etc.
• “Every year we run courses for nurses and midwives and engage them in spreading knowledge on how to deal with diabetes. They explain to inexperienced patients, in particular how to live with the disease and what they can expect.”Pharma company, Poland
Moreover, due to the nature of their products, innovative companies very oftencooperate with healthcare providers, e.g. hospitals. This cooperation facilitates the development of respected referral centres.
• “We provide grants and support for physicians who are interested in setting up their own R&D projects, so called Investigator Sponsored Studies (ISS). This allows them to develop their research and in this way they continue with their professional development.” Pharma company, Poland
• It should be emphasised that a significant part of such supporting activities goes beyond the specifics of a particular medical area in which a particular company specialises.
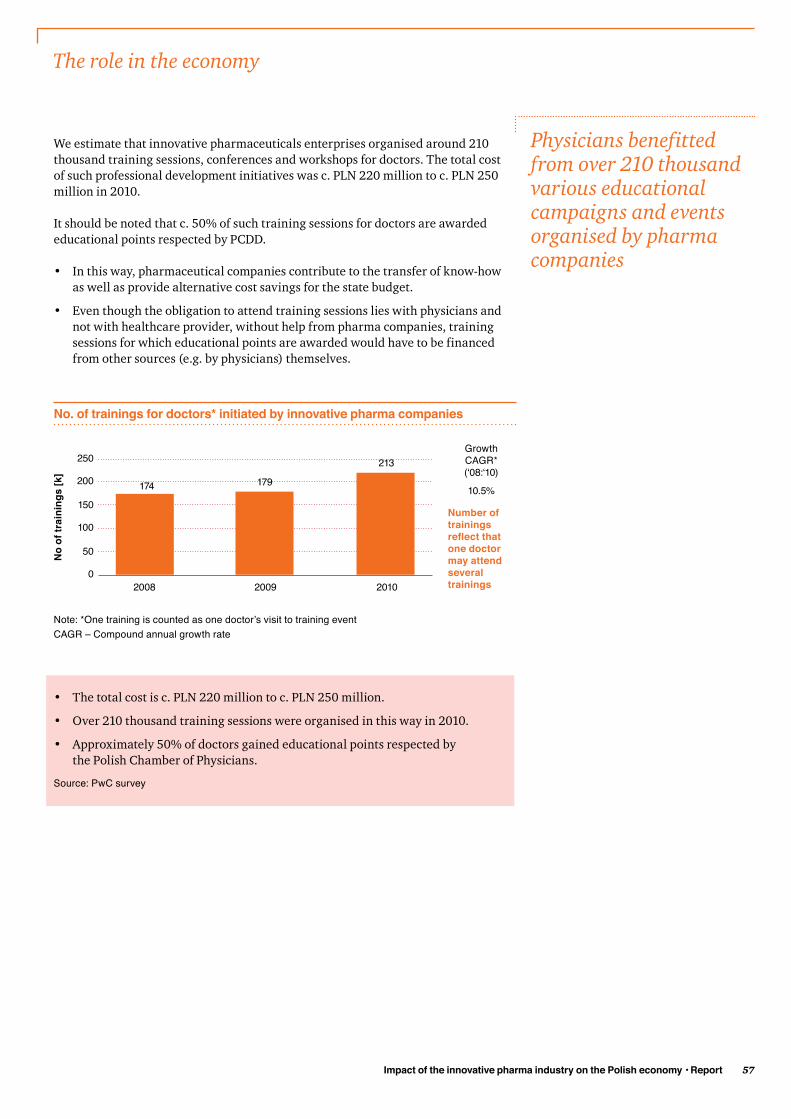
Impact of the innovative pharma industry on the Polish economy • Report 57
The role in the economy
Physicians benefitted from over 210 thousandvarious educationalcampaigns and eventsorganised by pharmacompanies
We estimate that innovative pharmaceuticals enterprises organised around 210thousand training sessions, conferences and workshops for doctors. The total costof such professional development initiatives was c. PLN 220 million to c. PLN 250million in 2010.
It should be noted that c. 50% of such training sessions for doctors are awardededucational points respected by PCDD.
• In this way, pharmaceutical companies contribute to the transfer of know-how as well as provide alternative cost savings for the state budget.
• Even though the obligation to attend training sessions lies with physicians and not with healthcare provider, without help from pharma companies, training sessions for which educational points are awarded would have to be financed from other sources (e.g. by physicians) themselves.
No. of trainings for doctors* initiated by innovative pharma companies
2008 2009 2010
174 179
213GrowthCAGR*(‘08:‘10)
No
of tr
aini
ngs
[k] 200
150
100
50
0
10.5%
250
Number oftrainingsreflect thatone doctormay attendseveraltrainings
Note: *One training is counted as one doctor’s visit to training eventCAGR – Compound annual growth rate
• The total cost is c. PLN 220 million to c. PLN 250 million.
• Over 210 thousand training sessions were organised in this way in 2010.
• Approximately 50% of doctors gained educational points respected by the Polish Chamber of Physicians.
Source: PwC survey

58
The representativesof the industry also support patients
Corporate Social Responsibility
Health education in society
The health education of society appears to be a very important area of activity.
• The popularity of preventive healthcare in Poland is very low.
• “In 2007, NHF issued 2.7m invitations to mammography tests. Only 23.5% of targeted women showed up for the screening test!.” Rynek Zdrowia, 20 December 2010
• Pharma companies organise and sponsor several diagnostics and preventive campaigns, e.g. screening tests such as blood hypertension testing campaigns, mammography tests for women in specific age groups, etc.
• For example, pharma companies together with healthcare providers (hospitals, outpatient clinics, etc.) organise “White Saturdays”/”White Sundays”, which are social campaigns aimed at providing people with a free medical consultancy in a number of specialised areas.
• In this way, these pharmaceutical companies remove the duty from state institutions that are, by definition, responsible for improving diagnostics practice.
• Pharmaceutical companies, jointly with others, develop and implement a number of health education campaigns. Most of the projects are carried out jointly with the medical community, patients’ associations, public organisations and NGOs.
In addition, selected companies organise workshops for specific patient groups,issue patient-oriented publications, launch web portals with educational contentfor people suffering from particular diseases, etc.
• “Once in a while we publish a new edition of a textbook with exercises for patients suffering from Alzheimer’s disease and guidelines for the people who take care of them. The idea is to provide people who take care after patients with some guidance on how to train memory. The results prove that condition of patients who undertake such exercises is much better.”Pharma company, Poland
These types of activities can also be perceived as supporting the healthcaresystem in general.
• “Educated patients are aware of their disease to a greater extent. They know of various treatment methods and can differentiate them. From the doctors’ perspective the relationship with such patients has a higher chance of successful treatment.”Physician, Poland
Also, pharmaceutical companies tend to provide support for patient associations. Apart from purely financial help, they provide greater support, e.g. facilitating access to sharing their views on conferences and help in publishing brochures.

Impact of the innovative pharma industry on the Polish economy • Report 59
The role in the economy
We estimate that around 620 thousand of patientsbenefitted from such help in 2010
The size of such support for patients is difficult to estimate due to the nature ofthe initiatives.
• The actual number of beneficiaries is, however, difficult to estimate as some initiatives are generally available to everybody (e.g. online campaigns and publications), and there is no credible data on the number of people who have benefitted from any given initiative.
According to our estimates, around 620 thousand patients are expected tohave benefitted from some kind of supportive activity initiated by the innovativepharma market participants.
No. of patients who benefited from trainings provided by innovative pharma companies
2008 2009 2010
404458
624GrowthCAGR *(‘08:‘10)
No
of p
atie
nts
[k]
600
400
200
0
24.2%
800
Note: CAGR – Compound annual growth rate
• In 2010, innovative companies organised around 60 initiatives directed to the patient community.
• The targeted audience was around 620 thousand patients, who benefitted from such campaigns.
• Total direct cost allocated to those activities by innovative pharma was c. PLN 20 million in 2010.
Source: PwC survey

60
Pharma companiesactively participate in various CSRactivities. Very often, these activities are notdirectly linked tohealthcare, which widensthe range of stakeholders of such initiatives
Other activities
Apart from healthcare-related initiatives, pharma companies also engage in a number of general social responsibility activities.
Such activities are very often aimed at providing benefits for local communities,where a particular pharma company is present, e.g. via its manufacturing site.
“We note that companies in our industry are trying to create conditions forsustainable development, share knowledge, engage in joint ventures, and not onlyto be a source of funding.”Pharma company, Poland
The range of the activities is very wide and depends on a specific company’sbenevolence. The selected examples include the following:
• Sponsorship of local communities (e.g. hospitals, schools, kindergartens).
• Sponsorship of charity foundations.
• Sponsorship of special care groups (e.g. orphanages, poor people), etc.
• Promotion of CSR standards and good practices among companies in Poland.
• Voluntary activity of employees in various initiatives (blood and bone marrow donations, charitable activities, mentoring, trainings, etc.).
• Campaigns aimed at promoting environment-friendly behaviour (e.g. promotion at schools, recycling campaigns, forest planting events).
• Aid to communities affected by natural disasters (e.g. flooded regions of Poland).
• Other initiatives, e.g. healthcare and non-healthcare oriented educational activities and programmes cultural and sports activities.
• Every year, innovative pharma companies are involved in around 150 different CSR activities.
• Although the volume of direct beneficiaries exceeds around 30 thousand, we believe that general social benefits can be larger. Due to the nature of activities, some are difficult to quantify (e.g. promotion of environment-friendly behaviour).
Source: PwC survey

Impact of the innovative pharma industry on the Polish economy • Report 61
The role in the economy
By being active in the industry coalition field, pharma companiescontribute to creating greater opportunitiesfor dialogue betweenstakeholders
Industry coalition
• Pharma companies are active in the field of industry organizations in order to build an alliance and unity in the industry. A common stance is relevant in order to be able to cooperate with other stakeholders, including state authorities, in an effective way.
• Such a cooperation consists in:
• Membership in various industry organisations.
• Publication of common stance reports and analyses.
• Dialogue with authorities on the issues connected to healthcare, etc.
• On average, every innovative pharma company participates in around five initiatives aimed at building industry coalition.
Source: PwC survey


Current environment and futureprospects
Section 4

64
The contribution has potential to increasefurther….
..however, it depends on the growth dynamics of the market
The impact of pharmaceutical companies on Poland’s GDP has been growingconsistently over the last five years.
The contribution of pharmaceutical companies to Poland’s GDP increased from0.67% of GDP in 2006 to 0.80% of GDP in 2010.
• The increase of direct effects leads to growth in employee wages and direct taxes for the government budget.
• Growing indirect effects show that other industries in the economy are also benefitting due to increased activity of pharmaceutical companies.
The numbers presented prove that the pharmaceuticals market has developedsignificantly faster than the whole Polish economy on average. It means thatpharmaceutical companies are gaining importance in shaping the Polish economy,with significantly higher contributions to value added from year to year.
Based on our estimations, the contribution of pharmaceutical companies to addingvalue is expected to increase further to c.1% of GDP by 2016. A key assumption inachieving this goal is continuous improvement in the healthcare system, includingfacilitation of patient access to innovation financed by public funds.
Impact of pharmaceutical companies on GDP 2006-2010
2006 2007 2008 2009 2010
% o
f GDP
0.80%
0.60%
0.40%
0.20%
0.00%
1.00%
2016
Innovative pharma industrycontributes c. 60% of the total effect of the pharma sector overall
1,00%
0.29% 0.30% 0.32% 0.31% 0.32% ~0.4%
~0.6%0.48%0.45%0.39%0.39%0.38%
0.67% 0.69% 0.71%0.76%
0.80%
If the market continues to grow faster than GDP levels (following the historical trend), the contribution may increase even up to 1% of GDP
Indirect Impact
Direct Impact
Note: The forecast reflects the expected evolution of GDP and pharma industry growth and does notinclude major changes in technology or influence of new reimbursement policy on industry performance Source: PwC analysis based on GUS data

Impact of the innovative pharma industry on the Polish economy • Report 65
Despite the continuousconvergence of Poland on mature markets,expenditures on drugs per capita are still lowerthan that in most European countries
Future growth needs to be incentivised by an appropriate business climate, drivenby a more widespread discussion between all market stakeholders and long-termvision on how the market should be supported by the authorities.
Poland exhibits lower per capita expenditure on drugs compared to more matureEuropean markets (also including selected CEE geographies, such as the CzechRepublic, Hungary or Slovakia). The Polish market, however, has experiencedmore dynamic growth, historically.
Poland can be expected to converge with more advanced markets in the long term.
• “Indeed, Poland exhibits strong potential for growth, primarily due to its large population size and still low level of expenditure on drugs per capita. However, there are not many incentives for pharma companies to grow here.” Pharma company, Poland
Pharmaceutical markets in Europe
Market growth
Second tier: Runners up
Bulgaria
INDICATIVE
Per c
apita
exp
endi
ture
on
drug
s
Russia
Romania
Third tier: Emerging markets
Lithuania
Estonia
Latvia
Poland
Slovakia
Czech Rep.
Hungary
Slovenia
Norway
Portugal
Netherlands
UK
GreeceItaly
DenmarkSpain
Austria
IrelandBelgium
Switzerland
France
Germany
SwedenFinland
Luxembourg
First tier: Mature markets
Note: Indicative analysis; Bubble size indicates market size in 2009Source: PwC analysis based on publicly available data (IMS Health, Espicom, BMI)
Current environment and future prospects
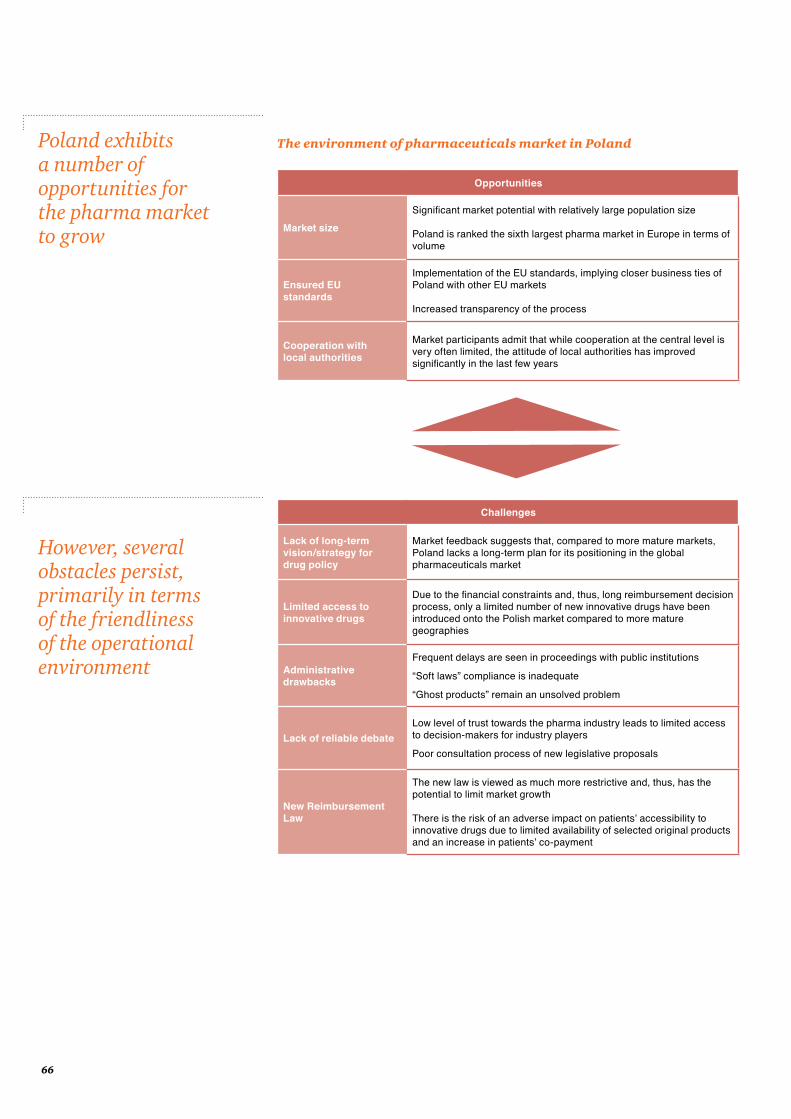
66
Poland exhibits a number of opportunities for the pharma market to grow
However, several obstacles persist, primarily in terms of the friendliness of the operational environment
The environment of pharmaceuticals market in Poland
Opportunities
Market sizeSignificant market potential with relatively large population size
Poland is ranked the sixth largest pharma market in Europe in terms of volume
Ensured EUstandards
Implementation of the EU standards, implying closer business ties of Poland with other EU markets
Increased transparency of the process
Cooperation withlocal authorities
Market participants admit that while cooperation at the central level is very often limited, the attitude of local authorities has improved significantly in the last few years
Challenges
Lack of long-termvision/strategy fordrug policy
Market feedback suggests that, compared to more mature markets, Poland lacks a long-term plan for its positioning in the global pharmaceuticals market
Limited access toinnovative drugs
Due to the financial constraints and, thus, long reimbursement decision process, only a limited number of new innovative drugs have been introduced onto the Polish market compared to more mature geographies
Administrativedrawbacks
Frequent delays are seen in proceedings with public institutions
“Soft laws” compliance is inadequate “Ghost products” remain an unsolved problem
Lack of reliable debateLow level of trust towards the pharma industry leads to limited access to decision-makers for industry players
Poor consultation process of new legislative proposals
New ReimbursementLaw
The new law is viewed as much more restrictive and, thus, has the potential to limit market growth
There is the risk of an adverse impact on patients’ accessibility to innovative drugs due to limited availability of selected original products and an increase in patients’ co-payment
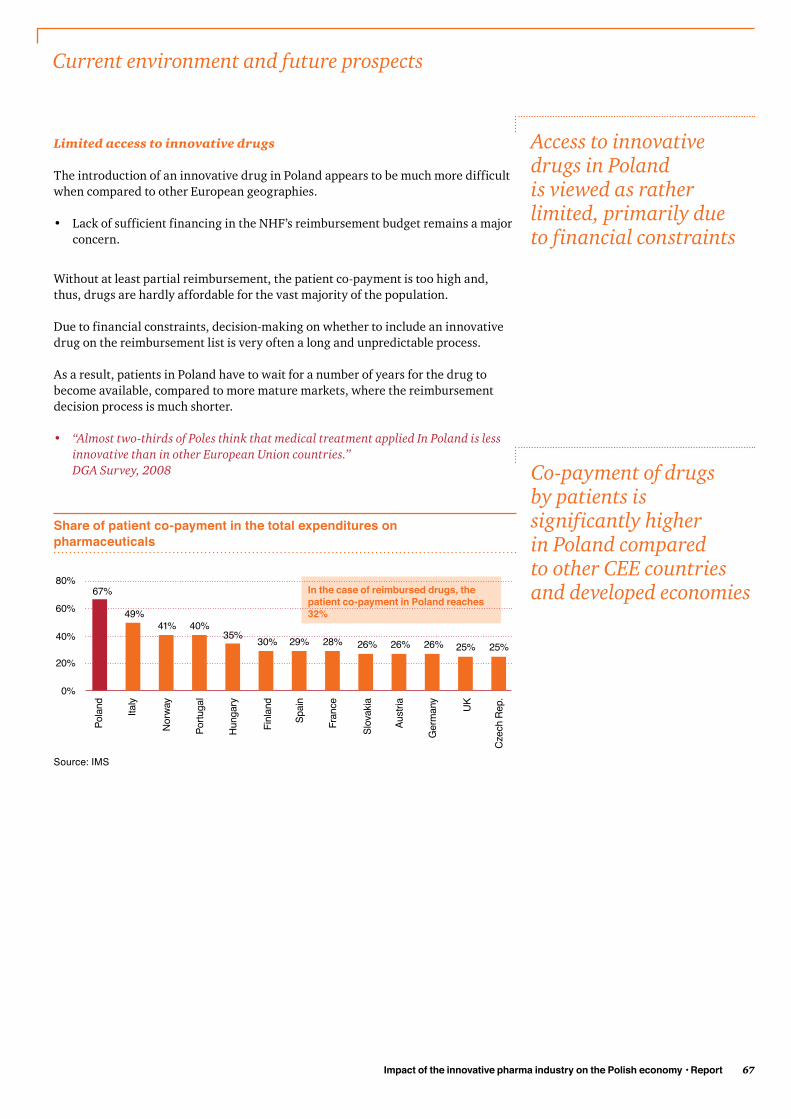
Impact of the innovative pharma industry on the Polish economy • Report 67
Access to innovativedrugs in Polandis viewed as rather limited, primarily due to financial constraints
Limited access to innovative drugs
The introduction of an innovative drug in Poland appears to be much more difficultwhen compared to other European geographies.
• Lack of sufficient financing in the NHF’s reimbursement budget remains a major concern.
Without at least partial reimbursement, the patient co-payment is too high and, thus, drugs are hardly affordable for the vast majority of the population.
Due to financial constraints, decision-making on whether to include an innovativedrug on the reimbursement list is very often a long and unpredictable process.
As a result, patients in Poland have to wait for a number of years for the drug tobecome available, compared to more mature markets, where the reimbursementdecision process is much shorter.
• “Almost two-thirds of Poles think that medical treatment applied In Poland is less innovative than in other European Union countries.” DGA Survey, 2008
Share of patient co-payment in the total expenditures on pharmaceuticals
80%
60%
40%
20%
0%
67%
28%29%30%35%40%41%
49%
Pola
nd Italy
Norw
ay
Portu
gal
Hung
ary
Finl
and
Spai
n
Fran
ce
Slov
akia
Aust
ria
Ger
man
y
UK
Czec
h Re
p.
26% 26% 26% 25% 25%
In the case of reimbursed drugs, the patient co-payment in Poland reaches 32%
Source: IMS
Current environment and future prospects
Co-payment of drugs by patients issignificantly higher in Poland compared to other CEE countries and developed economies

68
In the last 10 years, 220innovative drug applications were filed with the NHF forreimbursement…
...on average, a molecule’s waiting time in the reimbursement decision process was around two and a half years, which issignificantly longer than that in WE
An international benchmark analysis shows that Poland lags behind many countries in terms of provision for access to molecules.
In Poland, there is only 48% availability of innovative drugs compared to Germanor UK levels.
Availability of innovative products across Europe in 2010
80%
60%
40%
20%
0%
100%
Ger
man
y
Aust
ria
Fran
ce
Switz
erla
nd
Gre
ece
Swed
en
Denm
ark
Pola
nd
Hung
ary
Slov
akia
Portu
gal
Russ
ia
Lith
uani
a
100%UK
Spai
n
Belg
ium
Irela
nd
Norw
ay
Neth
erla
nds
Finl
and
Luxe
mbo
urg
Czec
h Re
p.
Turk
ey
Slov
enia
Rom
ania
Latv
iaBu
lgar
ia
100%
62%
62%
60%
59%
58%
55%
52%
52%
52%
51%
49%
49%
48%
46%
46%
46%
44%
42%
42%
41%
39%
38%
37%
36%
36%
Note: Availability for individual countries, measured relative to Germany and the UKSource: IMS
Between 2001 and 2010, around 220 innovative drugs were filed forreimbursement decisions with the NHF. On an average, around 30 months werenecessary to obtain a decision.
• “Waiting time in Poland can be 4 or 5 times longer than in WE.”Pharma company, Poland
• “In the October 2009 update to the reimbursement list, only two innovative medicines were added to the previous set of drugs. In the same time, 110 new generic drugs were introduced.” PhRMA Special 301 Submission, 2010
• Innovative pharma companies have filed 220 drugs for reimbursement decisions to the NHF in the last 10 years.
• All of them have had to wait for several months for a decision. The waiting time ranged from one to eight years and took, on an average, around 30 months.
• Currently, over 70 drugs are still awaiting a decision.
Source: PwC survey
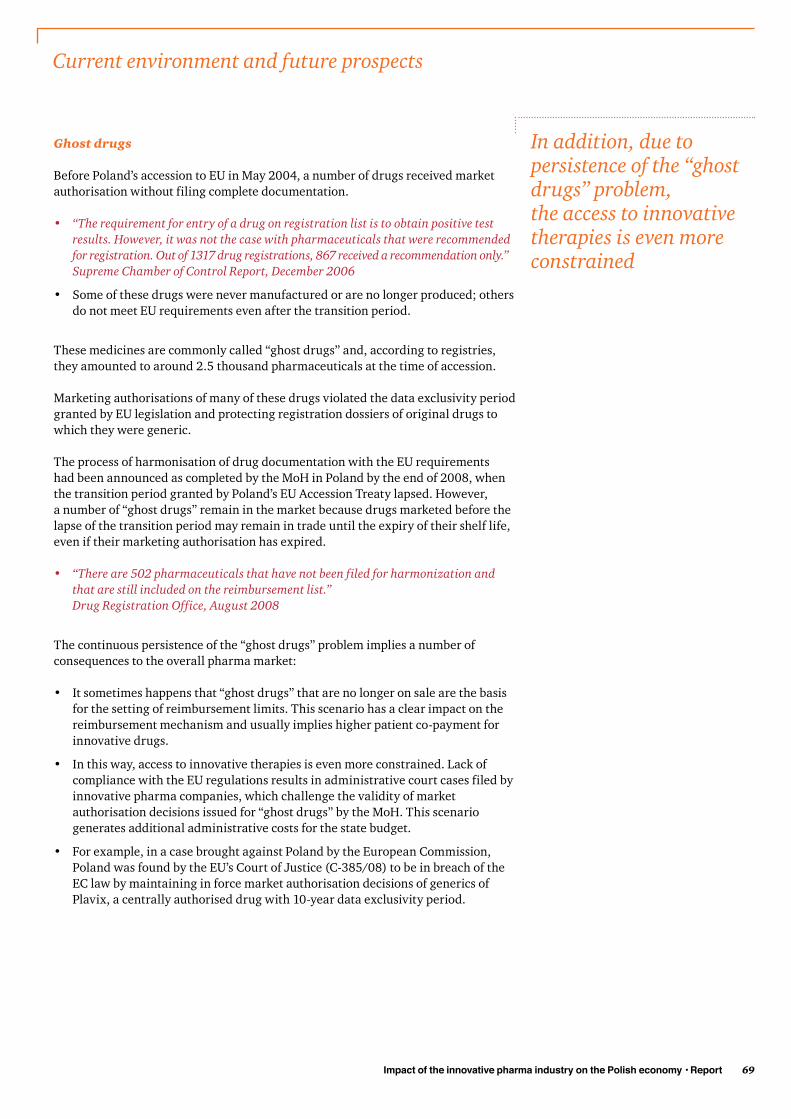
Impact of the innovative pharma industry on the Polish economy • Report 69
In addition, due to persistence of the “ghostdrugs” problem, the access to innovativetherapies is even moreconstrained
Ghost drugs
Before Poland’s accession to EU in May 2004, a number of drugs received marketauthorisation without filing complete documentation.
• “The requirement for entry of a drug on registration list is to obtain positive test results. However, it was not the case with pharmaceuticals that were recommended for registration. Out of 1317 drug registrations, 867 received a recommendation only.” Supreme Chamber of Control Report, December 2006
• Some of these drugs were never manufactured or are no longer produced; others do not meet EU requirements even after the transition period.
These medicines are commonly called “ghost drugs” and, according to registries,they amounted to around 2.5 thousand pharmaceuticals at the time of accession.
Marketing authorisations of many of these drugs violated the data exclusivity periodgranted by EU legislation and protecting registration dossiers of original drugs towhich they were generic.
The process of harmonisation of drug documentation with the EU requirements had been announced as completed by the MoH in Poland by the end of 2008, when the transition period granted by Poland’s EU Accession Treaty lapsed. However, a number of “ghost drugs” remain in the market because drugs marketed before thelapse of the transition period may remain in trade until the expiry of their shelf life,even if their marketing authorisation has expired.
• “There are 502 pharmaceuticals that have not been filed for harmonization and that are still included on the reimbursement list.” Drug Registration Office, August 2008
The continuous persistence of the “ghost drugs” problem implies a number ofconsequences to the overall pharma market:
• It sometimes happens that “ghost drugs” that are no longer on sale are the basis for the setting of reimbursement limits. This scenario has a clear impact on the reimbursement mechanism and usually implies higher patient co-payment for innovative drugs.
• In this way, access to innovative therapies is even more constrained. Lack of compliance with the EU regulations results in administrative court cases filed by innovative pharma companies, which challenge the validity of market authorisation decisions issued for “ghost drugs” by the MoH. This scenario generates additional administrative costs for the state budget.
• For example, in a case brought against Poland by the European Commission, Poland was found by the EU’s Court of Justice (C-385/08) to be in breach of the EC law by maintaining in force market authorisation decisions of generics of Plavix, a centrally authorised drug with 10-year data exclusivity period.
Current environment and future prospects

70
The introduction of the New ReimbursementLaw is expected to causesignificant changes in the operation of the market, both for companies and patients
New Reimbursement Law
Key factors
Budget for reimbursement
Budget for reimbursement limited by 17% cap of the total NHFbudget for guaranteed services
Fixed prices
Fixed statutory selling price; price-related incentives shall beforbidden
Unclear definition of which price to consider as official sellingprice in distribution chain
Fixed margins
Wholesale margins decreasing from 8.91% to a fixed level of 5%(decrease will be gradual: 7% in 2012, 6% in 2013 and ultimately5% in 2014)
Retail margin dependent on the wholesale price, which is the limit
Categories of availability and levels of reimbursement
New categories of availability and levels of reimbursement introduced
Limit groups andreimbursement limits
Broad definition of the limit group and very large limit groups(jumbo groups) still unclear in case of products with numeroustherapeutic indications
Reimbursement decision
More regulated reimbursement decision-making process
Arbitrary nature of the process
Increased fees for participation in the process
Applicant’s obligations The Pay-Back mechanism
Prohibition of trademarketingactivities
Prohibition of all incentives, trade-marketing and promotionalactivities of reimbursed products and significantly limited numberof trade and marketing tools
Potential impact on the market
DistributionMargins of wholesalers and pharmacies expected to fall
Potential of wholesale consolidation to speed up; a number ofpharmacies may be forced to quit the market
PatientDue to lack of rebates, patient co-payment expected to increase,which is believed to cause a general trend of shift towards cheaper drugs
HospitalsThe impact of the new regulatory framework significantly unclear.However, hospitals have the potential to become better off under the new pricing policy (e.g. during tenders)
ManufacturersThe impact dependent on the particular business model
Nevertheless, the new act expected to be more favourable forcheaper/generic drug manufacturers


GlossaryAppendix

74
Glossary of terms and abbreviations
Term Definition
BMI Business Monitor International
BRIC Brazil, Russia, India and China
c. circa
CAGR Compound annual growth rate
CEBK Office for Registration of Medical Products
CEE Central and Eastern Europe
CIS Commonwealth of Independent States: In the report, the region comprises Russia, Ukraine, Belarus and Kazakhstan
CIT Corporate income tax
CRO Clinical Research Organisation
CSR Corporate social responsibility
CTFG Clinical Trial Facilitation Group
EFPIA European Federation of Pharmaceuticals Industries andAssociations
EMA European Medicines Agency
e.g. Exempli gratia (for example)
EU European Union
EUR Euro
excl. Excluding
ExMan Ex Manufacturer Price
GDP Gross domestic product
Generic brands Products with status: OTHER BRANDS, PATENT N/A, UNBRANDEDaccording to IMS product definitions
Generic company Company with sales value in the pharmaceuticals market (retail and hospital) of innovative drugs in 2010 represented less than 50% of the company’s portfolio valueIn the case of multi-organisational corporations, the sales value of the“parent” company is used
GUS Central Statistical Office
Gx Generics
i.e. id est (that is)
IBNGR Gdansk Institute for Market Economics (Polish: Instytut Badan nadGospodarka Rynkowa)
IIS Investigator-initiated study
IMS Intercontinental Marketing Services
Incl. Including
Imported drugs Drugs manufactured in facilities located outside Poland and importedby local offices of responsible entities
Innovative company
Company with sales value in the pharmaceuticals market (retail and hospital) of innovative drugs in 2010 represented 50% or more of the company’s portfolio valueIn the case of multi-organisational corporations, the sales value of the “parent” company is used
IT Information technology
k thousand
Local drugs Drugs manufactured in facilities located in Poland
M&A Mergers and acquisitions
MoH Ministry of Health

Impact of the innovative pharma industry on the Polish economy • Report 75
Glossary of terms and abbreviations
Term Definition
NCA National Competent Authority
NHF National Health Fund (Polish: NFZ)
Original brands Products with status: ORIGINAL BRANDS and LICENSED BRANDSaccording to IMS product definitions
OTC Over the counter
PCDD Polish Chamber of Doctors and Dentists
PIT Personal income tax
PLN Polish Zloty
PR Public relations
R&D Research and development
Reimbursed drugs Products included in the reimbursement lists published by the Ministryof Health in December 2010, which can be sold with different levels ofreimbursement
Rx Drugs on prescription
Rx-Gx Generic drugs on prescription
RX-INN Innovative drugs on prescription
SEE South Eastern Europe
SSC Shared services centre
USD US dollar
VAT Value added tax
VHP Voluntary Harmonisation Procedure
WE Western Europe
WHO World Health Organization
ZUS Social Insurance Institution

PwC Pharma & Life Sciences
Mariusz Ignatowicz, PartnerMariusz is a PwC Pharma & Life Sciences CEE leader. He has over 16 years of experience in serving clients from the pharmaceuticals and healthcare services sector exclusively. Currently, he is responsible for over 25 industry clients operatingin Poland, advising them on financing subject to local statutory pricing control mechanisms, tax optimisation, structuring of clinical trials monitoring services and many other topics.
Telephone: +48 22 523 48 12 [email protected]
Jacek Ostrowski, Vice DirectorJacek works at the PwC Strategy Group CEE. During his 10 years in consulting work, he has gained strong experience in market reviews, commercial due diligence, strategic advice and business planning, particularly in the pharmaceuticals andhealthcare sector, working primarily for private equity clients.
Telephone: +48 22 523 18 84 [email protected]
Bartosz Wiśniewski, Senior AssociateBartosz works at the PwC Strategy Group CEE. He has four years of experience of working on market reviews, research and commercial due diligence with particular emphasis on the pharmaceuticals and healthcare industry. He has a BA fromBocconi University, Milan, Italy and an MSc from Erasmus University Rotterdam, the Netherlands.
Telephone: +48 22 523 48 95 [email protected]
Alan Deneka, AssociateAlan joined the PwC Strategy Group in 2010. From the very beginning, he was involved in analytical work, focused primarily on market research and modelling exercises. He holds an MSc from Warsaw School of Economics, Poland.
Telephone: +48 22 746 67 37 [email protected]


This publication has been prepared for general guidance on matters of interest only, and does not constitute professional advice. You should not act upon the information contained in this publication without obtaining specific professional advice. No representation or warranty (express or implied) is given as to the accuracy or completeness of the information contained in this publication, and, to the extent permitted by law,PwC, its members, employees and agents do not accept or assume any liability, responsibility or duty of care for any consequences of you or anyone else acting, or refraining to act, in reliance on the information contained in this publication or for any decision based on it.
2011 PricewaterhouseCoopers Sp. z o.o. All rights reserved. In this document, “PwC” refers to PricewaterhouseCoopers Sp. z o.o. which is a member firm of PricewaterhouseCoopers International Limited, each member firm of which is a separate legal entity.