impact of the eastward shift in the negative‐phase nao on
TRANSCRIPT

This article has been accepted for publication and undergone full peer review but has not been through the copyediting, typesetting, pagination and proofreading process which may lead to differences between this version and the Version of Record. Please cite this article as doi: 10.1029/2019JD032019
©2020 American Geophysical Union. All rights reserved.
Zhang Jie (Orcid ID: 0000-0002-9204-9834)
Impact of the eastward shift in the negative-phase NAO on
extreme drought over northern China in summer
Yibo Du1, Jie Zhang1*, Siwen Zhao1
1 Key Laboratory of Meteorological Disaster, Ministry of Education (KLME)/Joint
International Research Laboratory of Climate and Environment Change
(ILCEC)/Collaborative Innovation Center on Forecast and Evaluation of
Meteorological Disasters (CIC-FEMD), Nanjing University of Information Science &
Technology, Nanjing 210044, China
Corresponding author: Jie Zhang, [email protected]
Abstract: The frequency of extreme drought events in northern China has increased
since the mid-1990s, and such a decadal anomalous trend may have a vital influence on
national economics and food supply. Based on the analysis of observational datasets
and experiments conducted by a linear baroclinic model, this study claims that the
intraseasonal circulation anomalies related to extreme drought are linked to the
eastward shift in the negative phase of the summer North Atlantic Oscillation (SNAO).

©2020 American Geophysical Union. All rights reserved.
When the SNAO is in a negative phase, the cyclonic eddy-driven jet can enhance the
eastward extension of the North Atlantic jet stream (NAJS), contributing to a closer
connection between the NAJS and the Asian-African jet stream and enhancing the
waveguide. The cyclonic eddy in the exit of the jet stream excites anomalous Rossby
wave energy that originates from the NAJS exit and spreads to the Caspian Sea,
Mongolia, and northern China; this associated wave train, which is similar to the Silk
Road Pattern (SRP), enhances the anticyclonic anomaly over northern China,
establishing a pronounced link with extreme drought in northern China. Thus, the
negative phase of the SNAO may be a contributing driver of extreme drought in
northern China.
Key words: SNAO, extreme droughts, North Atlantic jet stream
Introduction
1. Introduction
Northern China has suffered from severe droughts since the mid-1990s; these droughts can
seriously stress the balance among the economy, society, and environment. Historical records have
shown that northern China has suffered from consecutive years of drought since the 1980s. For
example, the Yellow River and Huaihe River dried up in 1997 and 1999, respectively (Ma and Fu,
2006; Zhang et al., 2009). During the 2000s, drought events occurred in northern China in 4
consecutive years (Zhang et al., 2015). Under the background of significant global warming, the
intensity and frequency of droughts have both increased, especially in 2005 and 2010 in northern
Shanxi Province and Henan Province. These events illustrate that there is an increasing tendency in
the occurrence and duration of droughts.
Previous studies have shown that anomalies of both westerly and summer monsoon circulations can
lead to extreme drought in northern China (Huang et al., 2007; Wu et al., 2009). In terms of summer

©2020 American Geophysical Union. All rights reserved.
monsoon-related circulations, weakened Asian monsoon circulation can increase the frequency of
drought in northern China due to inadequate water vapor transport (Zhang and Zhou, 2015). In
addition, the predominant teleconnection, referred to as the Pacific-Japan (PJ) pattern (Nitta, 1987),
exhibits an anticyclonic anomaly over northern China in drought years. Considering the westerly
anomaly, drought in northern China corresponds to an enhancement in meridional circulation and
low-frequency waves, such as the Silk Road Pattern (SRP, Zhang et al.,2019), a teleconnection
pattern spanning across the Eurasian continent along the Asian westerly jet (Lu et al., 2002; Hong
and Lu. 2016). The latter could strengthen meridional circulation under the propagation of
stationary wave, which is then linked with upstream turbulence and remote forcing. Some studies
have shown that tropical heating can play a role in triggering the SRP (Chen and Huang. 2012).
Upstream of the low-frequency wave, the North Atlantic Oscillation (NAO, Walker, 1924),
characterized by the Azores high and the Icelandic low that enhance (weaken) in the positive
(negative) phase of the NAO, is the dominant mode of atmospheric variability over the North
Atlantic (Wallace and Gutzler, 1981; Hurrell, 1995). Many previous studies have shown that the
NAO phase shift can result in a wide range of weather and climate anomalies in the Northern
Hemisphere (Hurrell, 1995; Huang et al., 1998; Hurrel et al., 2003; Li et al., 2013). The phase shift
from the positive to negative NAO changes the North Atlantic storm track intensity, frequency and
path, which can cause abnormal transport and convergence of water vapor (Rogers, 1997; Hurrel
and van Loon, 1997), leading to a wet (dry) and rainy (sunny) climate in northern (southern) Europe.
In addition to the influence of the NAO on Europe, the NAO pattern also impacts the weather and
climate in Asia, and the positive phase of the NAO is favorable for a weaker Siberian high and
shallower East Asian trough, which can further result in the weakening of the East Asian winter
monsoon (Wu and Wang, 2002; Qiao and Feng, 2016).Likewise, the summer NAO (SNAO) is an
important circulation anomaly at middle and high latitudes (Folland et al., 2009). Previous studies
have shown that the SNAO has a vital influence on the climate, including the influence on summer

©2020 American Geophysical Union. All rights reserved.
air temperature and rainfall in the Northern Hemisphere (Yuan and Sun, 2009; Hurrell and Folland,
2002; Linderholm et al., 2011). Some studies have suggested that extremely wet conditions in
Northern Europe and extremely dry conditions in the Mediterranean region are related to the
location of the North Atlantic jet stream when the SNAO is in the negative phase (Blackburn et al.,
2008; Richard Hall et al., 2014). Except for the simultaneous influence of the NAO, Wu et al. (2009)
found that the positive (negative) phase of the NAO could force a tripole mode “+, -, +” (“-, +, -”)
anomaly in the North Atlantic sea surface temperature (SST) in spring and that this tripole mode
SST anomaly could persist into summer and excite the wave train teleconnection over northern
Eurasia (Gu et al., 2009; Wu et al., 2009; Zuo et al., 2013).
However, the relationships between the SNAO and climate anomalies over northern China are not
clear. Wang (2018) suggested that the SNAO has led to precipitation anomalies over northern
China by altering the thermal forcing of the Tibetan Plateau. In fact, the SNAO is a forcing source
that can cause circulation and wave anomalies and has experienced a decadal change after the 1970s,
with the southern center shifting eastward (Sun et al., 2008a; Sun et al., 2009b; Sun and Wang,
2012). Thus, the connection between the decadal change in the SNAO pattern and the frequent
occurrence of extreme events over East Asia may be strengthened. However, there is a lack of
evidence that extreme droughts over northern China respond to the impact of the SNAO.
Motivated by this uncertainty, the impact of the SNAO on extreme drought over northern China in
summer and its possible mechanisms are analyzed in this paper.
This article is organized as follows. Section 2 introduces the data and methods used. In section 3, the
relationship between the SNAO and extreme drought over northern China and its possible physical
mechanism are investigated. Finally, the conclusions are presented in section 4.

©2020 American Geophysical Union. All rights reserved.
2. Data and Methods
2.1 Datasets
The ERA-Interim reanalysis data (http://apps.ecmwf.int/datasets/) from the European Centre for
Medium-Range Weather Forecasting, including the monthly mean values of the zonal and
meridional winds, geopotential height, and air temperature, are adopted. This dataset has 1°×1°
horizontal resolution and 16 vertical levels that extend from 1000 hPa to 50 hPa. The observation
precipitation dataset, with a resolution of 2.5°×2.5°, is from the Global Precipitation Climatology
Project (GPCP). The monthly mean NAO indices are acquired from the Climate Prediction Center
(CPC) website (ftp://ftp.cpc.ncep.noaa.gov/cwlinks). The data used in the paper are mainly for the
period from 1979 to 2017. We estimate and remove the least squares linear trend of the time
dimension from all grid points before conducting the correlation and regression, which the basic
summaries can be found in Wei (2007).
Two drought indices are used here: a self-calibrating Palmer Drought Severity Index (sc-PDSI: Dai,
2011b) and the standardized precipitation index (SPI; Edwards and McKee.1997). The sc-PDSI
index is more scientific and objective than the original PDSI since the sc-PDSI calibrates the PDSI
by using local coefficients (Dai, 2011b). The sc-PDSI data used in this paper are obtained from the
Climate Data Guide website
(https://climatedataguide.ucar.edu/climate-data/palmer-drought-severity-index-pdsi) and have
2.5°×2.5° horizontal resolution. The SPI is simple to calculate and is not limited by season or terrain,
and it has been widely used in previous studies (Panagiotis Angelidis, 2012).We calculated the SPI
by fitting a gamma distribution to monthly mean GPCP precipitation value. The method apply a
2-parameter gamma distribution fit where the shape and scale parameters are maximum likelihood
estimate as described in Thom (1958). An advantage of SPI is it can be created for differing period

©2020 American Geophysical Union. All rights reserved.
of 1-to-36 months. In order to concentrate on intraseasonal character of SPI, we selected 3-month
SPI (SPI-3) because the SPI-3 provides a comparison of the precipitation over a specific 3-month
period with the precipitation totals from the same 3-month period for all the years included in the
historical record. A relatively normal 3-month period could occur in the middle of a longer-term
drought that would only be visible at longer time scales. Similarly, the resolution is same as
sc-PDSI. Detailed information about the major drought indices are shown in Table 1.
2.2 Methods
Singular value decomposition (SVD) was employed to investigate the collocation patterns of
correlation between the zonal wind and kinetic energy (Tk01) in the jet exit, and empirical
orthogonal function (EOF) analysis was employed to extract the zonal wind leading modes in the
jet exit. Both of these methods have been widely used in climate diagnosis (Wang et al. 2017; Xu
et al. 2019). To investigate stationary propagation, the method for calculating the wave activity flux
defined by Takaya and Nakamura (1997, 2001) is used in this study. Other methods, including
regression and correlation, are used to analyze the link between the physical variables and the NAO
index. Statistical significance tests were assessed through Student’s two-tailed t testing.
In our research, a localized multiscale energy and vorticity analysis (MS-EVA) (Liang, 2016; Liang
and Robinson, 2005; Liang and Anderson, 2007) based on a new functional analysis tool called the
multiscale window transform (MWT) is used to study the conversion of kinetic energy in the jet exit.
The MWT is understood as a space or time orthogonal decomposition according to different scale
ranges, where the local characteristics of a physical process can be preserved in the decomposition.
The following is the equation for kinetic energy derived from the MS-EVA theory, and the detailed
derivation process can be found in Liang (2016):
𝜕𝐾𝜛
𝜕𝑡= −𝛻 ∙ 𝑄𝐾
𝜛 − 𝛻 ∙ 𝑄𝑃𝜛 − 𝑏𝜛 + 𝛤𝐾
𝜛 + 𝐹𝐾𝜛 (1)

©2020 American Geophysical Union. All rights reserved.
Equation (1) can be represented as follows:
Kt = QK+QP+BUOY+T+R, T=T01+T21+T11+T201
Kt (𝜕𝐾
𝜕𝑡) is the rate of change in kinetic energy over time, BUOY(-𝑏) is the buoyancy conversion,
QP(−𝛻 ∙ 𝑄𝑝) is the geopotential flux, QK(−𝛻 ∙ 𝑄𝑘) is the flux of kinetic energy, and R(D) is the
dissipation friction of kinetic energy. T is the conversion of kinetic energy between different scales,
and it has been widely used previously (Lau, 1992; Hsu, 2009). T(𝛤) is the transfer of energy at
different scales. T01 is the trans-scale transmission of kinetic energy from a large scale to seasonal
average scale. T21 is the trans-scale transmission of kinetic energy in high-frequency components.
The two components T11 and T201 are not considered because T11 does not contain energy for
cross-scale transmission, and the magnitude of T201 is very small.
2.3 Model
The numerical experiments performed in this study were based on the linear baroclinic model
(LBM, Watanabe and Kimoto, 2000). The LBM is a time-dependent model, and it has a horizontal
resolution of T42 (triangular truncation of 42 waves) and 20 sigma (σ) levels in the vertical direction.
The background state used in the experiments is the August mean climatology during 1979-2017
from the ERA-interim data. The boundary and initial conditions were determined by the model.
We designed numerical experiments using an LBM forced by cyclonic anomalies at 500 hPa in the
jet exit. Since the time integration of the model response approaches a steady state after 20 days
when the dissipation terms are adopted, we selected the results of the 25th day from a 30-day
integration as the steady results. More details associated with the model can be found in Watanabe
(2004).
Table 1 Major meteorological drought indices
Index name calculation Advantage
Extreme
drought
classification
Applied

©2020 American Geophysical Union. All rights reserved.
Precipitation
anomaly
Percentage
(Zhang et
al.1998)
precipition
anomaly
precentage against
climatological
mean
Reflect the
drought induced
by a precipitation
anomaly
-80 or less
It is used in the
semihumid and
semiarid area when
the air temperature
is higher than 10°C
(Zhang et
al.1998,2006)
Palmer drought
severity
Index
(Palmer 1965;
Dai et al.1998)
Departure of
moisture balance
from a normal
condition based
on a water balance
model
It considers both
water supply and
demand and a
provides
reflection of soil
moisture deficit
or surplus
-4 or less
It is frequently
used in drought
study over China
(Zhai et al.2010)
Standardized
precipitation
index
(Edwards and
McKee.1997)
Fitting and
transforming a
long-term
precipitation
record into a
normal
distribution with
respect to the SPI
It could be
calculated on
different time
scales to display
short and long
term water
supply
-1.99 to -l.60
It is used in wet
and dry conditions
in northwestern
China and the
assessment of
drought hazard
(Zhang et al.2009;
He et al.2011)
Composite
drought index
(Zou and
Zhang.2008)
Combination of
30-day mean and
90-day mean
standardize
precipitation
index and 30-day
mean relative
moisture
Standardize
drought on
different time
scales
2.4 or less
It is used in
provincial
meterological
monitoring
(Zou and
Zhang.2008)
Effective drought
index
(Byun and
Wilhite.1999)
Defined as a lack
of in comparison
with the
climatological
average
Can determine
drought onset and
end dates
-2.0 or less
It is used in the
study of drought
occurring in the
Korea Peninsula
and Japan
(Lee et al.2012;Oh
et al.2014)
3. Results
3.1 Characteristics of drought and its relationship with SNAO

©2020 American Geophysical Union. All rights reserved.
Fig. 1 (a) The trends of the sc-PDSI (×-1) in August in China from 1979 to 2014 [units:(yr)-1]. (b)
Time series of the sc-PDSI in the key region (black box area) from 1979-2014 (the sc-PDSI is
currently updated through 2014). (c) Correlations between the August NAO index (SNAO) and
sc-PDSI. (d) Time series of the standardized values of the SNAO and sc-PDSI in the key region
from 1979-2014. The gray and black dots indicate that the trends and correlations are significant at
the 90% and 95% confidence level. The black box in (a) and (c) represents the study region in this
paper.
Fig. 1(a) shows that the trends are significantly positive in southwestern and northern China, while
the trend in eastern China is not significant. Positive trends in southwestern and northern China
indicates that drought in these regions has remarkably intensified in recent decades. Notably, the
trend of sc-PDSI in northwestern China decreases, which is opposite to the trend in the key region.
This contradiction may be associated with the drying trend in northern China and its shift (Ma and
Fu, 2006). As shown in Fig. 1(b), the variation in the sc-PDSI in the key region substantially

©2020 American Geophysical Union. All rights reserved.
decreases, implying that drought in northern China intensified during 1979-2014, and the frequency
of extreme drought events (sc-PDSI ≤-4) has increased since 2000. Fig. 1(c) shows the spatial
correlations distribution of SNAO and sc-PDSI. It can be seen that significant positive correlation
in northern China, especially in the key region. Moreover, the standardized values of the SNAO
and sc-PDSI in the key region show a positive correlation in Fig. 1(d), with a correlation
coefficient of 0.3, indicating that the drought events is more likely to occur when the SNAO is in
the negative phase.
3.2 Response of atmospheric circulation to the negative-phase SNAO
Fig. 2 (a) Time series of the standardized values of the SNAO (black line) for the period 1979-2017.
(b) Composite differences of the geopotential height (gpm; shaded) and horizontal wind (m/s;

©2020 American Geophysical Union. All rights reserved.
vectors) at 500 hPa between the negative-phase SNAO and the mean climate state. The red contours
show the climatological isolines of the geopotential heights from 5560 to 5720 gpm. (c) Same as in
(b) but for the zonal wind (m/s; shaded) and horizontal winds (m/s; vectors) at 200 hPa. The
climatological zonal wind, which is greater than 15 m/s, is represented by the black contours. (e)
and (d) are the same as in (b) but for the sc-PDSI and SPI, respectively. The black dots indicate that
the anomalies are significant at the 95% confidence level.
The SNAO shifted to a predominantly negative phase after 2000 in Fig. 2(a). Coincidentally,
extreme drought events in the key region became more frequent after the NAO phase shift (Fig.
1(b)). We defined SNAO events as negative when the SNAO index was smaller than -1.0.
Therefore, the years with negative SNAO events and extreme drought events are 2006, 2008, 2010,
2011, and 2014. Thus, these five years are selected as typical negative-phase SNAO years. Figure
2(b) shows the composite differences in geopotential height and wind at 500 hPa between the
negative-phase SNAO and mean climate state. It can be seen from Fig. 2(b) that the geopotential
height increases at 60°W near Greenland and decreases over the western coast of Europe, and this
pattern depicts a negative-phase SNAO with the southern center shifting eastward. By observing the
wind field, there is anomalous cyclonic circulation in the negative geopotential height anomaly
center (40°N-60°N, 30°W-10°E), with an anomalous east (west) wind existing near 60°N (40°N). In
addition, the negative geopotential height anomaly and anomalous cyclonic circulation are located
in the climatological trough. This configuration favors the elongation of the trough, which could
enhance positive vorticity advection transport in front of the trough and result in upward motion.
Compared with mid-level circulation, Fig. 2(c) shows the cyclonic eddy-driven jet enhances the
eastward extension of the North Atlantic jet stream (NAJS) at 200 hPa when the SNAO is in the

©2020 American Geophysical Union. All rights reserved.
negative phase, and the zonal wind exhibits a pattern of negative, positive, and negative anomalies
from north to south with the cyclonic eddy at 200 hPa. The westerly (easterly) anomalies of 40°N
(60°N) caused by the cyclonic eddy further strengthen (weaken) the climatological westerly wind.
Figures 2(d) and 2(e) show the composite differences in the sc-PDSI and SPI between the
negative-phase SNAO and mean climate state. According to drought classification of sc-PDSI, Fig.
2(d) shows that extreme drought over Ningxia, northern Shaanxi Province and east-central of Inner
Mongolia (key region). To obtain further evidence for extreme drought over the key region, the SPI
for a 3-month time scale (SPI-3) is used here. Compared with sc-PDSI, the drought classification of
SPI is weaker, but the drought distributions are similar over the key region in Fig. 2(e). This may
be related to the algorithms and applicability of the SPI (McKee et al., 1993; He et al., 2011), for
instance, the SPI are based on precipitation alone and are limited because they do not deal with the
evaportranspiration side of the issue (Trenbert et al, 2014).
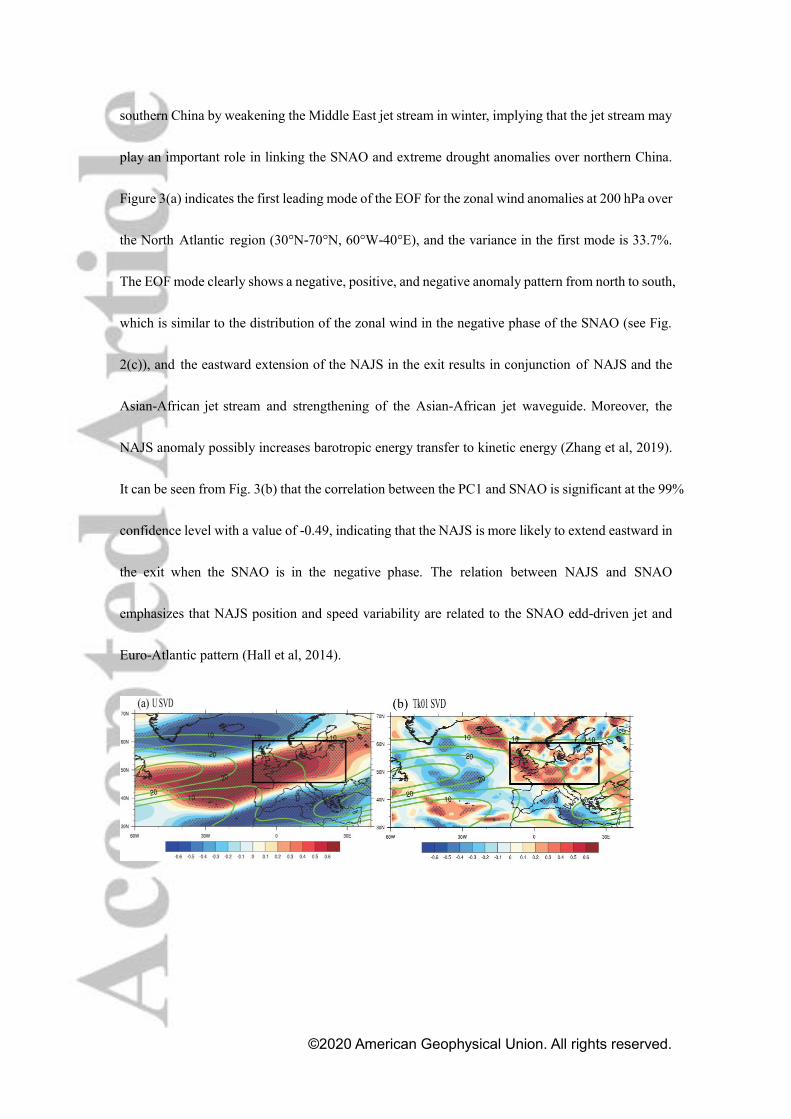
Fig. 3 (a) The leading mode of the EOF for zonal wind anomalies at 200 hPa in August and (b) the
corresponding normalized leading principal component (red line). The units are arbitrary. The
climatological zonal wind, which is greater than 15 m/s, is represented by the black contour line.
The blue line in (b) represents the SNAO. The dashed lines correspond to the results with the linear
trend removed.
Zuo et al. (2015,2016) proved that the negative-phase NAO could affect surface temperature in
©2020 American Geophysical Union. All rights reserved.
southern China by weakening the Middle East jet stream in winter, implying that the jet stream may
play an important role in linking the SNAO and extreme drought anomalies over northern China.
Figure 3(a) indicates the first leading mode of the EOF for the zonal wind anomalies at 200 hPa over
the North Atlantic region (30°N-70°N, 60°W-40°E), and the variance in the first mode is 33.7%.
The EOF mode clearly shows a negative, positive, and negative anomaly pattern from north to south,
which is similar to the distribution of the zonal wind in the negative phase of the SNAO (see Fig.
2(c)), and the eastward extension of the NAJS in the exit results in conjunction of NAJS and the
Asian-African jet stream and strengthening of the Asian-African jet waveguide. Moreover, the
NAJS anomaly possibly increases barotropic energy transfer to kinetic energy (Zhang et al, 2019).
It can be seen from Fig. 3(b) that the correlation between the PC1 and SNAO is significant at the 99%
confidence level with a value of -0.49, indicating that the NAJS is more likely to extend eastward in
the exit when the SNAO is in the negative phase. The relation between NAJS and SNAO
emphasizes that NAJS position and speed variability are related to the SNAO edd-driven jet and
Euro-Atlantic pattern (Hall et al, 2014).

©2020 American Geophysical Union. All rights reserved.
Fig. 4 Heterogeneous correlation map of the leading mode of the SVD for the (a) 200 hPa zonal
wind and (b) 200 hPa Tk01. (c) Normalized leading principal component of the zonal wind (red line)
and Tk01 (green line). The units are arbitrary. The climatological zonal wind, which is larger than 10
m/s, is represented by the green contours in (a) and (b). The black dots in (a) and (b) indicate that the
anomalies are significant at the 95% confidence level.
Some studies have found that the displacement of the jet stream is dominated by barotropic motion,
and barotropic kinetic energy in the jet exit is easily converted (Wiin and Drake, 1965; Eastin and
Vincent, 1998). Thus, the barotropic kinetic energy conversion in the jet exit may be related to the
eastward extension of the NAJS. Using the localized MS-EVA methodology to obtain the kinetic
energy (Tk01), the positive Tk01 corresponds to the conversion of barotropic kinetic energy to
seasonal scale kinetic energy, and the negative Tk01 corresponds to opposite of kinetic energy
conversion (Liang XS, 2005). To investigate the relationship between the zonal wind and Tk01, we
perform SVD analysis between the zonal wind and Tk01 at 200 hPa over the Atlantic-Eurasian
region. The results in Fig. 4 demonstrate that the first SVD (SVD1) mode of the zonal wind (Fig.
4(a)) is similar to the EOF mode of the zonal wind, especially the characteristic of eastward
extension of the NAJS. The corresponding positive Tk01 is mainly in the jet exit (Fig. 4(b)). This
indicates that the enhanced zonal wind is beneficial to the positive Tk01 in the jet exit, which can
lead to the conversion from barotropic kinetic energy to eddy kinetic energy under barotropic

©2020 American Geophysical Union. All rights reserved.
instability conditions. Therefore, the jet exit seems to be a source of kinetic energy conversion and
provide kinetic energy for cyclonic eddy growth (Sasaki et al., 2012; Liang et al., 2016). Although
the zonal wind has decreased over the southeast side of Greenland (60°N-70°N, 20°E-30°W), it
corresponds with a positive Tk01, which may be related to the enhancement of the polar front jet (Xu
and Wang, 2019). The seasonal-scale kinetic energy convert to barotropic kinetic energy near the
center of the NAJS (negative Tk01), while the zonal wind strengthens, which is probably related to
the North Atlantic SST anomaly (Woollings and Blackburn 2012). Figure 4(c) shows the
normalized leading principal component of the zonal wind (red line) and PC1 of TK01 (green line);
the correlation coefficient reaches 0.86, which demonstrates increasing zonal wind favors
barotropic energy conversion in the exit. Meanwhile, the correlation coefficients between the two
PC1s and the SNAO are -0.49 and -0.52, indicating barotropic energy conversion is associated with
SNAO eddy-drive jet.

©2020 American Geophysical Union. All rights reserved.
Fig. 5 (a) Regression maps of Tk01 at 200 hPa with regard to the U/PC1 (m²/s²; shaded). (b) Trend
in Tk01 at 200 hPa. (c) Same as (a) but at 500 hPa. (d) Same as (b) but at 500 hPa. (e)-(f) Trends of
the kinetic energy at 200 hPa and 500 hPa, respectively. The climatological zonal wind, which is
greater than 15 m/s, is represented by the green contour. The black dots indicate that the anomalies
are significant at the 95% confidence level.
To further verify the relationship between the zonal wind and Tk01 from the middle to upper
atmosphere, regression maps of Tk01 at 200 hPa and 500 hPa with regard to the U/PC1 are shown in
Figs. 5(a) and 5(c), respectively. The regressed Tk01 at 500 hPa and 200 hPa is positive over the west
coast of Europe, including the jet exit, which means that the increasing zonal wind and eastward
extension of NAJS favors barotropic kinetic energy convert to seasonal kinetic energy, thus
providing adequate kinetic energy for cyclonic eddy growth. In addition, Tk01 has an increasing
trend in recent decades in the jet exit (Figs. 5(b) and 5(d)), which means that the eastward extension
of the NAJS favors barotropic energy conversion from background state to seasonal kinetic energy.
In terms of the MS-EVA theory, Tk01 is one component of multiscale kinetic energy, is the trend of
kinetic energy same as Tk01 in the jet exit due to the eastward extension of the NAJS? The trends in
the kinetic energy at 500 hPa and 200 hPa are plotted in Figs. 5(e) and 5(f), respectively. Figs. 5(e)
and 5(f) show that the kinetic energy has been increasing in recent decades over the jet exit,
indicating that the positive trend of the kinetic energy may partly be caused by Tk01. The results

©2020 American Geophysical Union. All rights reserved.
reveal that eastward extension of NAJS favor increasing barotropic energy convert to kinetic
energy, which is helpful to cyclonic eddy growth and maintenance of the teleconnection wave
train (Williams et al, 2007).
Fig. 6 (a) Correlations between the SNAO index (×-1) and precipitation. (b) Correlations between
the U/PC1 and precipitation. (c) Composite differences in precipitation (mm/day; shaded) between
the negative-phase SNAO and the mean climate state. The climatological zonal wind, which is
greater than 15 m/s, is represented by the green contour. The black dots indicate that the
precipitation anomalies are significant at the 95% confidence level.
As described above, anomalous cyclonic circulation at 500 hPa results in the elongation of the
trough, which leads to enhanced upward motion and precipitation in the exit. Figures 6(a) and 6(b)
show the correlations of the SNAO index (×-1) (multiplications by -1 are used to represent the
negative-phase SNAO) with the U/PC1 and precipitation, respectively. The correlation maps show

©2020 American Geophysical Union. All rights reserved.
that there are positive precipitation anomalies over northern Europe, including the jet exit, and
negative precipitation anomalies over the Mediterranean region and Greenland when the SNAO is
in the negative phase (Fig. 6(a)). This configuration is in agreement with the analysis of Folland et al.
(2009) and Blackburn et al. (2008), they proposed the jet steam variability is associated with
SNAO and is also implicated in summer European climate. For instance, the summers from 2007
to 2012 produced wet condition over northern Europe, and these associated with a more negative
SNAO. In addition to the impact of the SNAO on precipitation, the eastward extension of the NAJS
leads to increased precipitation anomalies in the jet exit (Fig. 6(b)). This similar correlation between
the NAJS and precipitation has been verified. For example, some studies have found that the
southerly North Atlantic storm track is associated with the increasing frequency of floods in
northwestern Europe and the increasing frequency of heat waves in the Mediterranean region by
affecting the frequency of blocking (Dong et al., 2013; Screen J A., 2013). Figure 6(c) shows
composite differences in precipitation between the negative-phase SNAO and the mean climate
state. The precipitation anomalies are mainly located near the edge of the jet stream, with increased
precipitation (0.6 mm day-1) over the west coast of Europe (40°N-60°N, 0°E-30°E), including the
jet exit, and decreased precipitation (0.4 mm day-1) over the Mediterranean area, Greenland, and its
surroundings.
Positive precipitation anomalies are beneficial to latent heat release, which favors atmospheric
baroclinic instability, particularly in the jet exit. In fact, baroclinic instability could lead to the
intensification of atmospheric disturbance activities in the exit, and these disturbance activities
could further force the enhancement of upper westerly winds through the internal dynamic process
of the atmosphere. Furthermore, the upward motion caused by the enhancement of wind shear can

©2020 American Geophysical Union. All rights reserved.
lead to increased precipitation. This phenomenon seems to be a positive feedback mechanism in the
jet exit.
3.3 The mechanisms of the SNAO affecting extreme drought in northern China
Fig. 7 (a) Regression maps of the TNF (m2/s2; vector) and TNF divergence (m/s2; shaded) at 200
hPa with regard to the NAO index (×-1). (b) Same as (a) but for the NAJS index. (c) Composite
anomalies of TNF and TNF divergence in negative SNAO years. The climatological zonal wind,
which is greater than 15 m/s, is represented by the black contour. The black dots indicate that the
anomalies are significant at the 95% confidence level.
The cyclonic eddy-driven jet enhances the eastward extension of the NAJS, which leads to
enhanced zonal wind shear in the jet exit. The NAJS index representing the dynamic effect of
cyclonic eddy used in this study is based on the definition by Koch et al. (2006) and Barton (2009)
(NAJS positions are averaged over the longitudes 5°E-20°W and latitudes 40°N-50°N in the North
Atlantic). To verify the propagation characteristic and the forcing sources of the quasi-stationary
wave in the upper troposphere, the regression maps of the TNF and TNF divergence against the

©2020 American Geophysical Union. All rights reserved.
SNAO index (×-1) and NAJS index at 200 hPa are shown in Figs. 7(a) and 7(b), respectively. The
horizontal TNF depicts that the wave energy propagated toward the southeast between 40°N and
60°N with a positive divergence TNF centered over the jet exit, which indicates that cyclonic eddy
and enhanced wind shear in the jet exit are possible sources of wave energy. In addition, there is also
wave energy dispersion in the region with increased precipitation due to the latent heat is released
to heat atmosphere and then excite wave energy. The composites of TNF and TNF divergence at
200 hPa in the negative-phase SNAO are displayed in Fig. 7(c). Fig. 7(c) shows that the
characteristics of wave energy propagating from the jet exit into the Asian-African jet stream are
more obvious, which means that the anomalous Rossby waves excited by the cyclonic eddy may
affect northern China through upstream unstable energy fluctuations propagating into the
Asian-African jet stream.
Fig. 8 (a) The leading EOF mode of the 200 hPa meridional wind anomalies in August and (b)
normalized leading principal component (PC1). The units are arbitrary. The climatological zonal
wind, which is greater than 15 m/s, is represented by the black contour.
The anomalous Rossby waves excited in the jet exit are more likely to enter the Asian-African jet
stream, and the SRP zonal teleconnection propagation is restricted to the Asian-African jet stream
by the jet waveguide (Lu et al., 2002). What role does the SRP play in the downstream? The spatial
distribution of the leading EOF mode in Fig. 8a shows that the centers are located over the Caspian
Sea, Mongolia, and northern China, and the latitudes of the three centers are located between 40°N

©2020 American Geophysical Union. All rights reserved.
and 50°N, which is almost consistent with the meridional position of the average Asian-African jet
stream. Figure 8(b) indicates that the V/PC1 changes from negative to positive around 2000, which
is consistent with previous conclusions (Wang et al. 2017), and has a significant correlation of
-0.35 with SNAO at the 95% confidence level. The results reveal that the eastward shift in the
negative-phase NAO has a close relationship with wave amplitude.
Fig. 9 (a) Regression maps of the 200 hPa meridional wind (m/s; shaded) and TNF (m2/s2; vector)
with regard to the SNAO (×-1) index. (b) Same as (a) but for the NAJS index. (c) Regression map of
the water vapor flux (kg m/s; vector) on the SNAO (×-1) index. The dotted area in (a) and (b) and
the black arrows in (c) represent that these regressions are significant at the 95% confidence level.
In general, the anomalous wave energy is more likely to enter the Asian-African jet stream and
spread to the downstream region with the SRP. Figure 9 depicts regression maps of the 200 hPa
meridional wind and horizontal TNF with regard to the SNAO (×-1) and NAJS index, respectively.
According to the regression maps, the negative-phase SNAO and the NAJS could excite the wave

©2020 American Geophysical Union. All rights reserved.
train, similar to SRP corresponding well to magnified wave amplitude and intensity, resulting in
favorable eastward propagation of wave energy. The TNF pattern suggests that the SNAO and
NAJS-related stationary TNF activities are strong in the jet exit and the anomalous zonal wave
energy over the Eurasian continent propagate eastward to northern China. However, wave energy
propagating to the east has weakened in central Asia, indicating that there may be other processes
involved in this mechanism. From the meridional wind pattern, there are two anomalous
anticyclones over the Caspian Sea and northern China and two anomalous cyclones over West Asia
and northeastern China. Thus, under the control of anticyclonic circulation over the key region,
extreme drought events are more likely to occur. However, a small part of the region (see black box
area) is located in northeastern China, where there is anomalous cyclonic circulation. It is possible
that the extreme events in this part of the key region could be explained in terms of water vapor
transport. Figure 9(c) shows the regression map of the water vapor flux with regard to the SNAO
(×-1), suggesting that the water vapor in northern China comes from the northeast, which is
unfavorable for water vapor transportation from south to north under the background of mean
southwest wind in summer.

©2020 American Geophysical Union. All rights reserved.
Fig. 10 (a) Regression maps of the zonal and meridional wind anomalies (m/s; vector) at 200 hPa
with regard to the SNAO index (×-1). (b) Same as in (a) but for 850 hPa. (c) Composite
differences in precipitation (mm/day; shaded) between the negative-phase SNAO and the mean
climate state over North China. (d) Same as in (c) but for the vapor flux divergence
(kg/(day•m2•hPa); shaded). The climatological zonal wind, which is greater than 20 m/s, is
represented by the green contour in (a). The dots indicate that the winds, precipitation and vapor
flux divergence anomalies are significant at the 95% confidence level.
Additionally, the corresponding atmospheric circulation anomalies and climatic impacts in China
are shown in Fig. 10. The winds at 200 hPa and 850 hPa are used to characterize the high-level
subtropical westerly jet stream and low-level southwest winds of the East Asian summer monsoon
(EASM) system, respectively. The structure of the 200 hPa wind field is obvious over
eastern-central Asia with an anomalous westerly (easterly) wind near 35°N (50°N) (Fig. 10(a)),
which favors an anomalous sinking motion over North China. Meanwhile, anomalous
northeasterly winds occur at 850 hPa over North China, which is not beneficial to the
transportation of water vapor to the northern area (Fig. 10(b)). It can be concluded from the above
results that the atmospheric circulation over North China in the SNAO negative phase is favorable
for drought. However, the conditions for extreme drought are more complicated since North China
is under the influence of the EASM in summer. Therefore, the vertical precipitation and horizontal

©2020 American Geophysical Union. All rights reserved.
vapor budget are worth considering according to the vapor budget equation. Figures 10(c) and
10(d) show the composite differences in precipitation and vapor flux divergence between the
negative-phase SNAO and the mean climate state over North China. The anomalous area of
precipitation and water vapor flux divergence is similar in the northern China. The results reveal
that the decrease in precipitation and loss of water vapor over the key region further contribute to
extreme drought.
3.4 Simulation of the impact of cyclonic circulation anomalies via the LBM
Fig. 11 (a) Responses of the zonal wind (m/s; shaded) and horizontal wind (m/s; vector) at 200 hPa
and (b) the TNF (m2/s2; vector) to the idealized cyclonic anomalies at 500 hPa over the NAJS exit in
a linear baroclinic model. The climatological zonal wind, which is greater than 15 m/s, is
represented by the green contour.
Based on the results from the reanalyses and observations, we designed numerical experiments
using an LBM forced by cyclonic anomalies at 500 hPa in the jet exit. Fig. 11 displays the responses
of the zonal wind, meridional wind, and TNF to the idealized cyclone forcing. The results indicate
that the cyclonic eddy-driven jet enhances the eastward extension of the NAJS when the SNAO is in
the negative phase. The wind pattern in Fig. 11(a) is similar to that in Fig. 2(c). Fig. 11(b) shows that
the wave energy splits into two branches. One of the branches enters the Asian-African jet stream
and continues to propagate eastward along with the Asian-African jet stream. The other branch
extends from the jet exit to northern Europe and continues to propagate eastward through high

©2020 American Geophysical Union. All rights reserved.
latitudes. The propagation path of the second branch is similar to the Eurasian teleconnection
pattern, which can affect the climate of East Asia (Zhang and Chen, 2018).
4. Conclusion
Based on both statistical analyses and model simulations, the intraseasonal relationships among
the SNAO and extreme drought over northern China were investigated. Apparently, there exists a
significant teleconnection between the eastward shift in the negative-phase SNAO and extreme
drought over northern China. Negative SNAO events (SNAO index < -1.0) tend to give rise to
extreme drought over northern China, which is related to the anticyclonic anomaly over northern
China.
A possible mechanism for this connection between the SNAO and extreme drought events is
mainly dependent on cyclonic eddy in the jet exit exciting anomalous Rossby wave energy and
spreading into the Caspian Sea, Mongolia, and northern China. Under the background of a
negative SNAO, the cyclonic eddy-driven jet enhances the eastward extension of the NAJS in the
jet exit at 200 hPa, and the occurrence of barotropic instability results in the transformation of
barotropic kinetic energy to seasonal-scale kinetic energy, which provides adequate kinetic energy
for cyclonic eddy growth. Meanwhile, the eastward extension of the NAJS leads to enhanced zonal
wind shear in the jet exit. In general, upward motion caused by cyclonic circulation at 500 hPa and
upper-level wind shear are beneficial to precipitation in the jet exit, which results in the release of
latent heat during the period of precipitation, further enhancing the baroclinicity of the atmosphere
in the jet exit.
Notably, the Eurasian wave train related to the SNAO is similar to the SRP proposed by Lu (2002).
Both wave patterns propagate eastwardly via the subtropical jet stream from the North Atlantic

©2020 American Geophysical Union. All rights reserved.
downstream to the East Asian region. To prove this point, we verified a high correlation between
the SNAO and SRP index at the interannual time scale, suggesting that upstream turbulence and
remote forcing affect downstream climate anomalies under propagation of stationary wave.
Finally, it is worth noting that we have expressed the characteristics of the interannual time scale
in our study. However, some studies have emphasized that the SNAO variations on the
interdecadal time scale are also significant (Allen and Folland., 2016; Linderholm and Folland.
2017). Is there a strong correlation between the SNAO and SRP on longer time scales? What are
the possible teleconnections among the SNAO and climate anomalies over northern China on
longer time scales? These questions need to be explored in future studies.
Acknowledgments
This research was jointly supported by the National Key R&D Program of China (Grant No.
2018YFC1507101), the National Natural Science Foundation of China (Grant No. 41975083) and
the Key Program (Grant No. 41630426). The ERA-Interim data set is available online
(http://apps.ecmwf.int/datasets). The monthly mean NAO indices are acquired from website
(ftp://ftp.cpc.ncep.noaa.gov/cwlinks).The sc-PDSI data is available on line
(https://climatedataguide.ucar.edu/climate-data/palmer-drought-severity-index-pdsi).
References
Allan, R. and C, K, Folland. (2016). Atmospheric circulation. 1. Sea level pressure [in ‘‘State of
the Climate 2015’’]. Bull. Amer. Meteor. Soc., 97, S36–S38.
Barton, N. P. & Ellis, A. W. (2009). Variability in wintertime position and strength of the North
Pacific jet stream as represented by re-analysis data. International Journal of Climatology, 29,
851–862.
Blackburn, M., Methven, J., Roberts, N. (2008). Large-scale context for the UK floods in summer
2007. Weather, 63(9), 280–288.

©2020 American Geophysical Union. All rights reserved.
Byun, H, and R., D, A, Wilhite. (1999). Objective quantification of drought severity and duration.
Journal of Climate, 12, 2747-2756, doi:10.1175/1520-0442012, 2747: OQODSA.2.0.CO;2.
Chen, G., R, Huang. (2012). Excitation mechanisms of the teleconnection patterns affecting the
July precipitation in northwest China. Journal of Climate, 25, 7834-7851, doi:10.1175/
JCLI-D-11-00684.1.
Dai. (2011b). Characteristics and trends in various forms of the Palmer drought severity index
during 1900–2008. Journal of Geophysical Research, 116, D12115, doi:10.1029/2010JD015541.
Dai. K, E, Trenberth., T, R, Karl. (1998). Global variations in droughts and wet spells: 1900-1995.
Geophysical Research Letters, 25, 3367-3370, doi:10.1029/98GL52511.
Dong, B. W., Sutton, R. T., Woollings, T. & Hodges, K. (2013). Variability of the North Atlantic
summer storm track: mechanisms and impacts on European climate. Environmental Research
Letters, 8, 034037.
Eastin, M, D., Vincent, D, G. (1998). A 6-Yr Climatology of Vertical Mean and Shear Components
of Kinetic Energy for the Australian–South Pacific Jet Stream. Journal of Climate, 11(2), 283-291.
Edwards, D, C., T, B, McKee., (1997). Characteristics of 20th century drought in the United States
at multiple time scales. Department of Atmospheric Science, Colorado State University,
Atmospheric Science Paper 634, 155 pp.
Folland, C, K., Knight, J., Linderholm, H, W., Fereday, D., Ineson, S., Hurrell, J, W. (2009). The
Summer North Atlantic Oscillation: past, present and future. Journal of Climate, 22, 1082–1103.
Gu, W., Li, C., Li, W., Zhou, W., Chan, L. (2009). Interdecadal unstationary relationship between
NAO and east China's summer precipitation patterns. Geophysical Research Letters, 36, L13702,
doi:10.1029/2009GL038843.
Hall, R., Erdelyi, R., Hanna, E., Jones, J, M., Scaife, A, A. (2014). Drivers of North Atlantic Polar
Front jet stream variability. International Journal of Climatology, 35(8), 1697-1720.
He, B., A, F, Lü., J, Wu., L, Zhao., M, Liu. (2011). Drought hazard assessment and spatial
characteristics analysis in China. Journal of Geographical Sciences, 21, 235-249,
doi:10.1007/s11442-011-0841-x.
Hong, X., Lu, R., Li, S, L. (2017). Amplified summer warming in Europe–West Asia and
Northeast Asia after the mid-1990s. Environmental Research Letters, 12, 094007.
Hsu, P, C., Tsou, C, H., Hsu, H, H. (2009). Eddy Energy along the Tropical Storm Track in
Association with ENSO. Journal of the Meteorological Society of Japan, 87(4), 687-704.
Huang, R., Chen, J., Huang, G. (2007). Characteristics and variations of the East Asian monsoon
system and its impacts on climate disasters in China. Advances in Atmospheric Sciences, 24, 993–
1023.
Hurrell, J, W. (1995). Decadal trends in the North Atlantic Oscillation: Regional temperatures and
precipitation. Science, 269, 676–679.
Hurrell, J, W., H, Van, Loon. (1997). Decadal variations in climate associated with the North
Atlantic Oscillation. Climatic Change, 36, 301–326.
Hurrell, J, W., Folland, C, K. (2002). A change in the summer atmospheric circulation over the
North Atlantic. Clivar Exchanges, 25, 1–3.
Koch, P., Wernli, H. & Davies, H, C. (2006). An event-based jet-stream climatology and typology.
International Journal of Climatology, 26, 283–301.
Lau, K, H., and Lau, N, C. (1992). The Energetics and Propagation Dynamics of Tropical
Summertime Synoptic-Scale Disturbances. Monthly Weather Review, 120(11), 2523.

©2020 American Geophysical Union. All rights reserved.
Lee, S, M., H, R, Byun., H, L, Tanaka. (2012). Spatiotemporal characteristics of drought
occurrences over Japan. Journal of Applied Meteorology and Climatology, 51, 1087-1098,
doi:10.1175/JAMC-D-11-0157.1.
Linderholm, H, W., T, Ou., J-H, Jeong., C, K, Folland., et al. (2011). Interannual teleconnections
between the summer North Atlantic Oscillation and the East Asian summer monsoon. Journal of
Geophysical Research, 116, D13107, doi:10.1029/2010JD015235.
Li, J., Sun, C., Jin F. (2013). NAO implicated as a predictor of Northern Hemisphere mean
temperature multidecadal variability. Geophysical Research Letters, 40, 5497–5502,
doi:10.1002/2013GL057877.
Liang, X., and A, R, Robinson. (2005). Localized multiscale energy and vorticity analysis.
Dynamics of Atmospheres and Oceans, 38, 195–230, doi:10.1016/j.dynatmoce.2004.12.004.
Liang X. (2016). Canonical transfer and multiscale energetics for primitive and quasi-geostrophic
atmospheres. Journal of Atmospheric Sciences, 73(11), 4439-4468.
Liang, X., and A, R, Robinson. (2007). Localized multi-scale energy and vorticity analysis: II.
Finite-amplitude instability theory and validation. Dynamics of Atmospheres and Oceans, 44, 51–
76, doi:10.1016/j.dynatmoce.2007.04.001.
Linderholm, H., and C, K, Folland. (2017). Summer North Atlantic Oscillation (SNAO) variability
on decadal to palaeoclimate time scales. Past Global Changes Mag, 25, 57-60, https://
doi.org/10.22498/pages.25.1.57.
Lu, R., OH, J, H., Kim, B, J. (2002). A teleconnection pattern in upper-level meridional wind over
the North African and Eurasian continent in summer. Tellus A: Dynamic Meteorology and
Oceanography, 54(1), 44-55.
Ma, Z., Fu, C. (2006). Some evidence of drying trend over northern China from 1951 to 2004.
Chinese Science Bulletin, 51, 2913–2925.
McKee, T, B., N, J, Doesken., and J, Kleist., (1993). The relationship of drought frequency and
duration to time scales. Proc.8th Conference. on Applied Climatology, 179–184.
Nitta, T. (1987). Convective activities in the tropical western Pacific and their impact on the NH
summer circulation. Journal of the Meteorological Society of Japan, 65, 373–390.
Oh, S, B., H, R, Byun., and D, W, Kim. (2014). Spatiotemporal characteristics of regional drought
occurrence in East Asia. Theoretical and applied climatology, 117, 89-101,
doi:10.1007/s00704-013-0980-3.
Palmer, W, C. (1965). Meteorologic drought. U.S. Department of Commerce, Weather Bureau,
Research Paper 45, 58 pp.
Panagiotis, Angelidis., Fotios, Maris., Nikos, Kotsovinos., et al .(2012). Computation of Drought
Index SPI with Alternative Distribution Functions. Water Resources Management, 26, 2453–2473.
Qiao, S., Feng, G. (2016). Impact of the December North Atlantic Oscillation on the following
February East Asian trough. Journal of Geophysical Research, 121, 10074–10088,
https://doi.org/10.1002/2016J D025007.
Rogers, J, C. (1997). North Atlantic storm track variability and its association to the North Atlantic
Oscillation and climate variability of northern Europe, Journal of Climate, 10(7), 1635–1647.
Sasaki, Y, N., Minobe, S., Schneider, N. (2012). Decadal Response of the Kurishio Extension Jet
to Rossby Waves: Observation and Thin-jet Theory. Journal of Physical Oceanography,
43(2),442-456.
Screen J A. (2013). Influence of Arctic sea ice on European summer precipitation. Environmental

©2020 American Geophysical Union. All rights reserved.
Research Letters, 8,044015.
Sun, J. Q., Wang H., Yuan, W. (2008a). Decadal variations of the relationship between the summer
North Atlantic Oscillation and middle East Asian air temperature. Journal of Geophysical
Research, 113, D15107, doi:10.1029/2007JD009626.
Sun, J. Q., and Wang, H. (2012). Changes of the connection between the summer North Atlantic
Oscillation and the East Asian summer rainfall. Journal of Geophysical Research, 117, D08110,
doi:10.1029/2012JD017482.
Sun, J. Q., Wang H., and Yuan W. (2009b). A possible mechanism for the co-variability of the
boreal spring Antarctic Oscillation and the Yangtze River valley summer rainfall. International
Journal of Climatology, 29(9), 1276–1284, doi:10.1002/joc.1773.
Takaya, K., and H, Nakamura. (1997). A formulation of a wave-activity flux for stationary Rossby
waves on a zonally varying basic flow. Geophysical Research Letters. 24, 2985-2988,
doi:10.1029/97GL03094.
Takaya, K., and H, Nakamura. (2001). A formulation of a phase-independent wave activity flux
for stationary and migratory quasigeostrophic eddies on a zonally varying basic flow. Journal of
Atmospheric Sciences, 58, 608–627.
Trenberth et al. (2014). Global warming and changes in drought. Nature Climate Change, 4,
17-22.
Thom (1958). A Note on the Gamma Distribution. Monthly Weather Review, pp 117-122.
Wang, C., Yang, K., Li, Y., Wu, D., & Bo, Y. (2017). Impacts of spatiotemporal anomalies of
Tibetan Plateau snow cover on summer precipitation in eastern China. Journal of Climate, 30(3),
885–903. https://doi.org/10.1175/JCLI-D-16-0041.1
Walker, G, T. (1924) Correlation of seasonal variations in weather IX: a further study of world
weather. Mem Indian Meteor Dep 24, 275-332.
Wang, Z, Q., Yang, S. Lau, N, C., Duan, A, M. (2018). Teleconnection between summer NAO and
East China rainfall variations: a bridge effect of the Tibetan Plateau. Journal of Climate, 31(16),
6433–6444.
Wallace, J, M., and D, S, Gutzler. (1981). Teleconnections in the geopotential height field during
the Northern Hemisphere winter. Monthly Weather Review, 109(4), 784-812.
Wang, L., Xu, P., Chen, W., et al. (2017). Interdecadal Variations of the Silk Road Pattern. Journal
of Climate, 30(24), 9915-9932.
Wei,F,Y. (2007). Modern climate statistical diagnosis and prediction technology (Second Edition,
in chinese). China Meteorological Press.
Williams, R, G., Wilson, C., Hughes, C, W. (2007). Ocean and Atmosphere Strom Tracks:The
Role of Eddy Vorticity Forcing. Journal of Physical Oceanography, 37(9), 2267-2289.
Wiin-Nielsen, A. and Drake, M. (1965). On the energy exchange between the baroclinic and
barotropic components of atmospheric flow. Monthly Weather Review, 9(2), 79-92.
Woollings, T., and M, Blackburn. (2012). The North Atlantic jet stream under climate change and
its relation to the NAO and EA patterns. Journal of Climate, 25, 886-902.
Wu, B., Wang, J. (2002). Winter Arctic Oscillation, Siberian High and East Asian winter monsoon.
Geophysical Research Letters, 29, 1897, https://doi.org/10.1029/2002G L015373.
Wu, B., Zhou, T., Li, T. (2009). Seasonally evolving dominant interannual variability modes of
East Asian climate. Journal of Climate, 22, 2992-3005.
Wu, Z., Wang, B., Li, J., Jin, F. (2009). An empirical seasonal prediction model of the East Asian

©2020 American Geophysical Union. All rights reserved.
summer monsoon using ENSO and NAO. Journal of Geophysical Research, 114, D18120,
https://doi.org/10.1029/2009J D011733.
Xu, P., Wang, L., Chen, W. (2019). The British-Baikal Corridor: a teleconnection pattern along the
summertime polar front jet over Eurasia. Journal of Climate, 32(3), 877-896.
Yuan, W., and J, Q, Sun. (2009). Enhancement of the summer North Atlantic Oscillation influence
on Northern Hemisphere air temperature. Advances in Atmospheric Sciences, 26(6), 1209-1214,
doi:10.1007/s00376-009-8148-x.
Zhai, J., B, Su., V, Krysanova., T, Vetter, C, Gao., T, Jiang., (2010). Spatial variation and trends in
PDSI and SPI indices and their relation to streamflow in 10 large regions of China. Journal of
Climate, 23, 649-663, doi:10.1175/2009JCLI2968.1.
Zhang, C., B, Wang. D, Liu., Z, Cai. (1998). Research on drought and flood indices in the
northwest China (in Chinese). Plateau Meteorology, 17, 381-389.
Zhang, J., H, Chen., S, Zhao. (2019). A tripole pattern of summertime rainfall and the
teleconnections linking northern China to the Indian subcontinent. Journal of Climate, 32,
3637-3653, DOI:10.1175/JCLI-D-18-0659.
Zhang, J., H, Chen., Q, Zhang. (2018). Extreme drought in the recent two decades in northern
China resulting from Eurasian warming. Climate Dynamics, 52, 2885-2902, DOI:
10.1007/s00382-018-4312-2.
Zhang, J., Li, L., Li, D., Deng, W. (2015). Summer droughts in the north portion of the Yellow
river basin in association with recent Arctic ice loss. International Journal of Climatology, 35,
2849-2859.
Zhang, L., and Zhou, T. (2015). Drought over East Asia: a review. Journal of Climate, 28(8),
3375-3399.
Zhang, Q., X, Zou., F, Xiao. (2006). Classification of meteorological droughts. Standards Press of
China Tech, Rep, GB/T20481-2006, 17pp.
Zhang, Q., Coauthors. ( 2009). Drought (in Chinese). China Meteorological Press, 199 pp.
Zuo, J., Ren, H., Li, W. (2015). Contrasting impacts of the Arctic Oscillation on surface air
temperature anomalies in southern China between early and middle-to-late winter. Journal of
Climate, 28, 4015-4026.
Zuo, J., Ren, H., Li, W., Wang, L. (2016). Interdecadal Variations in the relationship between the
Winter North Atlantic Oscillation and Temperature in South-Central China. Journal of Climate, 29,
7477-7493.
Zuo, J., Li, W., Sun, C., Xu, L., Ren, H. (2013). Impact of the North Atlantic sea surface
temperature tripole on the East Asian summer monsoon. Advances in Atmospheric Sciences, 30,
1173-1186.
Zou, X., Q, Zhang. (2008). Preliminary studies on variations in droughts over China during past
50years (in Chinese). Journal of applied meteorology and climatology, 19, 679-687.