impact of river–lake–groundwater interaction on boundless...
TRANSCRIPT

Upper Changjiang River
Impact of river–lake–groundwater interaction on boundless carbon cycle in continental basin
Tadanobu NAKAYAMANational Institute for Environmental Studies (NIES), Japan
David SHANKMANUniversity of Alabama, USA
1. Introduction - Background & objective2. Model description – NICE model3. Water use in agriculture and river-lake-groundwater interactions4. Effect of irrigation and flood storage ability5. Impact of TGD and SNWTP on eco-hydrological process6. Conclusions and future works
AGU Fall Meeting 2012,3-7 Dec. 2012, San Francisco, GC24A-02

Droughts in north (Yellow River) and floods in south (Changjiang River) China
Changjiang RiverYellow River
Rainfall anomalies (mm) in 1998-summer
(Nakayama & Watanabe, 2008a)
June 1998
July 1998
August 1998 8006004002000
mm/month
Decreasing runoff and increasing drying-up days (Chen et al., 2003)
Natural&observed runoff(Ren et al., 2002)
Decreasing discharge(Yang et al., 2004)

Study area in Changjiang River basin
Changjiang Basin
Panzhihua
YichangDatong
Dongting Lake Poyang LakeJialingjiang Basin
Changjiangmainstream
East China Sea
Chenglingji
Luoshan
LueyangTingzikou
Jinxi
Beipei
Hukou
Datong
JingjiangReach
Three Gorges Dam (TGD)
Study Area for G.W.L. Change
Danjiangkou Dam
South-to-North Water Transfer

What is a role of inland water in biogeochemical cycle ?
Common knowledge? Terrestrial biosphere was assumed to take up most of carbon on land.
(Battin et al., 2009) (Aufdenkampe et al., 2009)
Necessity to clarify mutual interaction between hydrologic-geomorphic-ecological
processes and river-lake-groundwater.
Inland waters process large amounts of organic carbon and must be considered in strategies to mitigate climate change.

Background & Objective~Changjiang River basin~
1. Developing a new process-based model, which couples with complex sub-systems in irrigation, urban water use, stream junction, and dam/canal, in order to develop coupled human and natural systems in continental scale.
2. In Changjiang River basin, severe floodings have often occurred and caused considerable economic loss and serious damage to towns and farms. Flood storage ability of Dongting&PoyangLakes is very important to prevent the flooding damage in the basin.
3. The objective of this study is to evaluate the impact of anthropogenic activity on eco-hydrologic change and the response of river-lake-groundwater interactions to extremes in Chagjiang River basin in order to help decision-making on theThree-Gorges Dam (TGD) and the South-to-North Water Transfer Project (SNWTP).
4. This result also throws light on improvement in biogeochemical cycle along terrestrial-aquatic continuum for global environmental change.

snowsurfacelayer
freezed&thawedsoilunfreezed soil
kinematicwave model
Pw1
P
hgDg
Dn
Ab
Hb
r
qfUnsaturated⇔Saturatedlayers
Land surface
Land
Assimilation with satellite data
Atmospheric boundary-layer ⇔ Land surface
Atmosphere
P
Lake
River⇔Lake
Groundwater⇔Lake
Surface & Intermediate flows
Groundwater ⇔River
Groundwater flow
Saturated layer
Seawater intrusion
B.C.;Ocean tide
Mass transport modelVegetation succession model
Downward radiation flux, temp., humidity, wind, pressure, prec.
Upward radiation flux, momentum,sensible&latent heat-flux
Qs
Surface⇔Unsaturated layers
Drain SewerageManhole
Agricultural areaNatural area Urban area
Surface flow
Overflow
Unsaturated layer
Intermediate flow
National Integrated Catchment-based Eco-hydrology (NICE) model(Nakayama et al., WRR2004; HESSD2006; HP2006,2008,2011,2012; STOTEN2007; ECOMOD2008;
FORECO2008; GPC2008,2010; RRA2010; LAND2010; ENPO2011; AGMET2011; WST2012)
Urban canopy model
Atmosphericmodel

Crop typesSpring wheatWinter/Spring wheatWinter wheat – Summer soybeanWinter wheat – Summer maizeSummer rice – Winter wheatDouble-cropping rice – Winter wheatIrrigated field
Changjiang River basin
Yellow River basin North China Plain
East
Chi
na S
ea
Three Gorges Dam (TGD) Dongting Lake
Poyang Lake
Danjiangkou Dam
Crop types in the agricultural regions at 1990s(Nakayama, Hydrol. Process. 2011a; Agr. Forest Meteorol. 2011b;
Nakayama & Watanabe, Global Planet. Change 2008a)
Crop types simulated by NICE model : Wheat, Rice, Maize, Soybean

Wat
er-u
seW
ater
rech
arge
Prod
uctiv
ityO
ther
Obs
.R
iver
dis
char
geG
roun
dwat
er le
vel
1year (or 1cycle)
1year (or 1cycle)
dateCounty level
Agricultural model (DSSAT)
NICE model
Obs. Cal.
Obs.
Cal.
Cal.1
date
Obs.
Statistical dataComparison
Cal.2
Difference between wheat,maize, et al.
Comparison
Simulated groundwater level
Discretizedto fine mesh
Simulated water-use
Evaluation of seasonal trend
Cou
plin
g( )dlract TASfuncET ,,.=
Sr : solar radiationAl : combined crop and soil albedoTd : daytime temperature
IPARRB up ・=
Bp : potential biomass productionRu : radiation use efficiencyIPAR : fraction of PARincepted by the crop
Ba : actual biomass productionTF : temperature reduction factorWF : water deficit factorNF : nitrogen deficit factor
)1,,,min( NFWFTFBB pa=
Modeling of crop water use (Nakayama et al, Hydrol. Process. 2006)
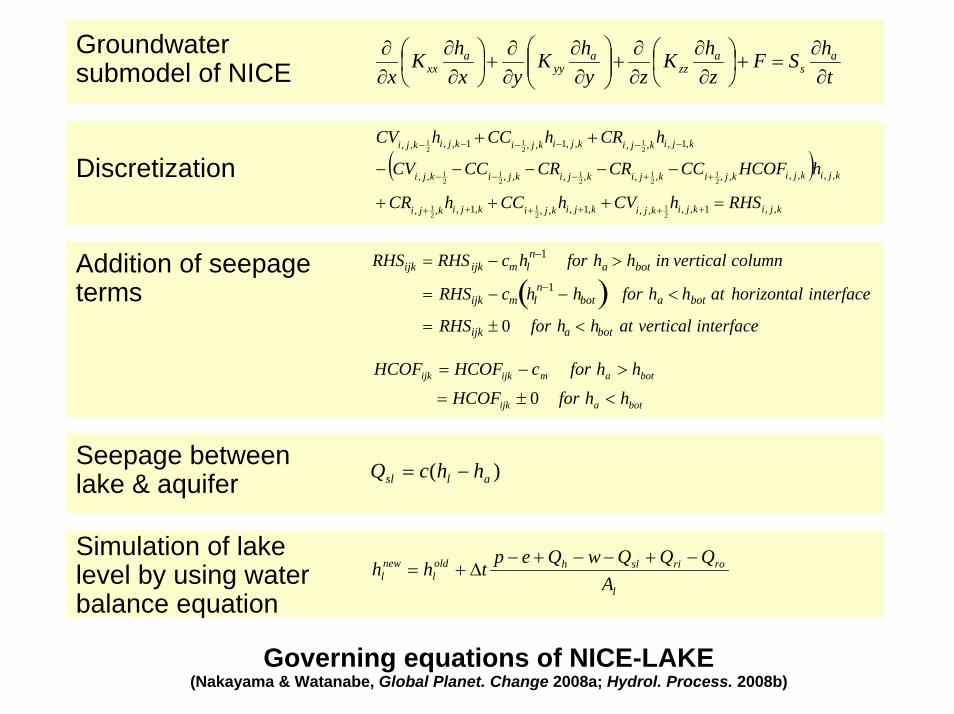
Groundwater submodel of NICE t
hSFzhK
zyhK
yxhK
xa
sa
zza
yya
xx ∂∂
=+⎟⎠⎞
⎜⎝⎛
∂∂
∂∂
+⎟⎟⎠
⎞⎜⎜⎝
⎛∂∂
∂∂
+⎟⎠⎞
⎜⎝⎛
∂∂
∂∂
( )kjikjikjikjikjikjikji
kjikjikjikjikjikjikji
kjikjikjikjikjikji
RHShCVhCChCR
hHCOFCCCRCRCCCV
hCRhCChCV
,,1,,,,,1,,,,1,,,
,,,,,,,,,,,,,,
,1,,,,,1,,1,,,,
21
21
21
21
21
21
21
21
21
21
21
=+++
−−−−−
++
++++++
++−−−
−−−−−−
Discretization
RHSijk = RHSijk − cmhln−1 for ha > hbot in vertical column
= RHSijk − cm hln−1 − hbot( ) for ha < hbot at horizontal interface
= RHSijk ± 0 for ha < hbot at vertical interface
botaijk
botamijkijk
hhforHCOF
hhforcHCOFHCOF
<±=
>−=
0
Addition of seepage terms
Seepage between lake & aquifer )( alsl hhcQ −=
Simulation of lake level by using water balance equation l
rorislholdl
newl A
QQQwQepthh
−+−−+−∆+=
Governing equations of NICE-LAKE(Nakayama & Watanabe, Global Planet. Change 2008a; Hydrol. Process. 2008b)

0 120 240 360 480 600 7200
2
4
6
8
10
12
Irrig
atio
n (m
m/d
ay)
Date
WH-MZ (Irrigated)
0
1
2
3
4 WH
(=1) or MZ(=2)
0 120 240 360 480 600 7200
10
20
30
40
50
60
70
Wat
er d
epth
(mm
)
Date
RI-RI (Irrigated)
0
1
2
3
4
RI(=3)
Impact of irrigation and ponding water depth on evapotranspiration(Nakayama, Proc. Environ. Sci. 2012)
Winter wheat - summer maize(downstream of Yellow River)
Double-cropping of rice(middle of Changjiang River)
0 120 240 360 480 600 7200
2
4
6
8
Evap
. (m
m/d
ay)
Date
RI-RI (Non-irrigated)
0
1
2
3
4R
I(=3)
0 120 240 360 480 600 7200
2
4
6
8
Evap
. (m
m/d
ay)
Date
WH-MZ (Non-irrigated)
0
1
2
3
4 WH
(=1) or MZ(=2)
0 120 240 360 480 600 7200
2
4
6
8
Evap
. (m
m/d
ay)
Date
WH-MZ (Irrigated)
0
1
2
3
4 WH
(=1) or MZ(=2)
0 120 240 360 480 600 7200
2
4
6
8
Evap
. (m
m/d
ay)
Date
RI-RI (Irrigated)
0
1
2
3
4
RI(=3)

30002500200015001000500300200100500
(m)
0 1000 2000
0
1000
2000
G.W
.L.-C
al. (
m)
G.W.L.-Obs. (m)
Groundwater Levelr2=0.937
Comparison between Obs. & Sim. data
Simulated results of annual-averaged groundwater level (a.s.l.)(Nakayama, Agr. Forest Meteorol. 2011b;
Nakayama & Watanabe, Global Planet. Change 2008a)

G.W.L. change
-1.6-0.80.00.8(m)
River-discharge change
Change of hydrologic cycle around Dongting & Poyang Lakes in 1998-flood period after lake restoration
(Nakayama & Watanabe, Global Planet. Change 2008a)
0 120 240 360 480 600 7200
20000
40000
60000
80000
100000
Dis
char
ge (m
3 /sec
)
Date
0 120 240 360 480 600 7200
20000
40000
60000
80000
100000
Dis
char
ge (m
3 /sec
)
Date
Dongting Lake (Luoshan)
Poyang Lake (Datong)
Black line: 1990s (present)Red line: 1950s(after lake restoration)
Luoshan
Datong
Changjiang mainstream

90 120 150 180 210 240 270 30010
15
20
25Poyang Lake at 1998-flood
Before TGD After TGD (without limit) After TGD (55,000m3) After TGD (40,000m3)
After TGD (without limit, lake morphology) After TGD (without limit, lake+river morphology)
Date
Wat
er le
vel (
m)
0 60 120 180 240 300 360
-20000
0
20000
40000
60000
80000
100000 Around Poyang Lake at severe flood (1998) Obs. at junction (Hukou) Obs. at downstream mainchannel (Datong) Cal. at junction Cal. at downstream mainchannel
Dis
char
ge (m
3 /sec
)
Date
Impact of TGD and SNWTP on hydrologic changearound Poyang Lake at severe 1998-flood period
60 90 120 150 180 210 240 270 3000
20000
40000
60000
80000
Dis
char
ge (m
3 /sec
)
Date
Changjiang Riv.: 1998-floodMiddle region (Yichang)
Before TGD Without controlled discharge Upper limit of 55,000 m3/s Upper limit of 50,000 m3/s Upper limit of 45,000 m3/s Upper limit of 40,000 m3/s
Controlled discharge at Yichang (estimated)
River discharge around Poyang Lake(Nakayama & Watanabe,
Global Planet. Change 2008a)
Severe floodLake water level change
(Nakayama & Shankman, Global Planet. Change, in press)

Impact of TGD and SNWTP on hydrologic changearound Poyang Lake at normal flood
River discharge change
Groundwater level change
Normal flood
120 150 180 210 240 270-20000-10000
010000200003000040000500006000070000
Around Poyang Lake1987
Before TGD After TGD After TGD+SNWTP
Dis
char
ge (m
3 /sec
)
Date
[cm]
8 –6 – 84 – 62 – 40 – 2-2 – 0-4 – -2-6 – -4-8 – -6
-10 – -8-12 – -10-14 – -12-16 – -14-18 – -16-20 – -18
– -20
0 60 120 180 240 300 360-20000
0
20000
40000
60000
80000
100000Around Poyang Lake at normal flood (1987)
Obs. at junction (Hukou) Obs. at downstream mainchannel (Datong) Cal. at junction Cal. at downstream mainchannel
Dis
char
ge (m
3 /sec
)
Date
River discharge around Poyang Lake(Nakayama & Watanabe,
Global Planet. Change 2008a)
(Nakayama & Shankman, Global Planet. Change, in press)

1E-3 0.01 0.1 110
100
1000
log 10
S(f)
log10f (1/day)1E-3 0.01 0.1 1
10
100
1000
log 10
S(f)
log10f (1/day)
1E-3 0.01 0.1 110
100
1000
log 10
S(f)
log10f (1/day)1E-3 0.01 0.1 1
10
100
1000
log 10
S(f)
log10f (1/day)
Yichang
Yichang
Datong
Datong
River-lake-groundwater interactions in middle-lower reaches
Normal flood
Severe flood
(m3/s)
Simulated seepage from groundwater
to river & lake
Power spectra of river discharge
DatongYichang
steeper
steeper
Furtherdamping
flow

Preliminary conclusions and future works1. The author developed the National Integrated Catchment-based Eco-
hydrology (NICE) model, coupling with complex sub-systems to develop coupled human and natural systems and to analyze impact of anthropogenic activity on eco-hydrologic change in continental scales.
2. The increase in lake storage capacity might moderate peak value of flood events and decrease G.W.L. around lakes region in ChangjiangRiver.
3. The model predicted the TGD might promote flood risk at the beginning of rainy season in Changjiang River contrary to the widely held belief to reduce the threat.
4. The result suggests the needs of trans-boundary and -authority solutions of water management for sustainable development under sound socio-economic conditions contributory to national & global securities.
5. Vulnerability & feedback of ecosystem functions dependent on interaction between global–regional hydrologic cycles, and how stress factors affect ecosystem dynamics from various aspects between micro–regional levels, are important.

Way forward: Toward improvement in boundless biogeochemical cycles in terrestrial-aquatic ecosystems
1. Contribution of inland waters to continental-scale carbon cycling has remained uncertain due to a paucity of data.
2. Boreal and subarctic peatlands store about 15-30% of the world’s soil carbon as peat and affect the dynamics of greenhouse gases such as methane (Limpens et al., 2008).
3. Rivers may contribute on emitting CO2 up to 10 % of net ecosystem exchange. It may alter carbon balance of terrestrial systems (Butman and Raymond, 2011).
4. Main components needed for analysis are (i) CO2 concentration in surface water, (ii) areal extent of rivers, and (iii) rate of exchange of CO2between water and atmosphere (Melack et al., 2011).
5. Improvement in local heterogeneity about complex eco-hydrological processes would help to construct the improvement in boundless biogeochemical model with finer resolution (Cole et al., 2007; Battin et al., 2009).
6. Necessity for improvement in biogeochemical cycle along terrestrial-aquatic continuum for global environmental change.
7. If this effect is important, the terrestrial CO2 sink may prove to be smaller than thought so far.
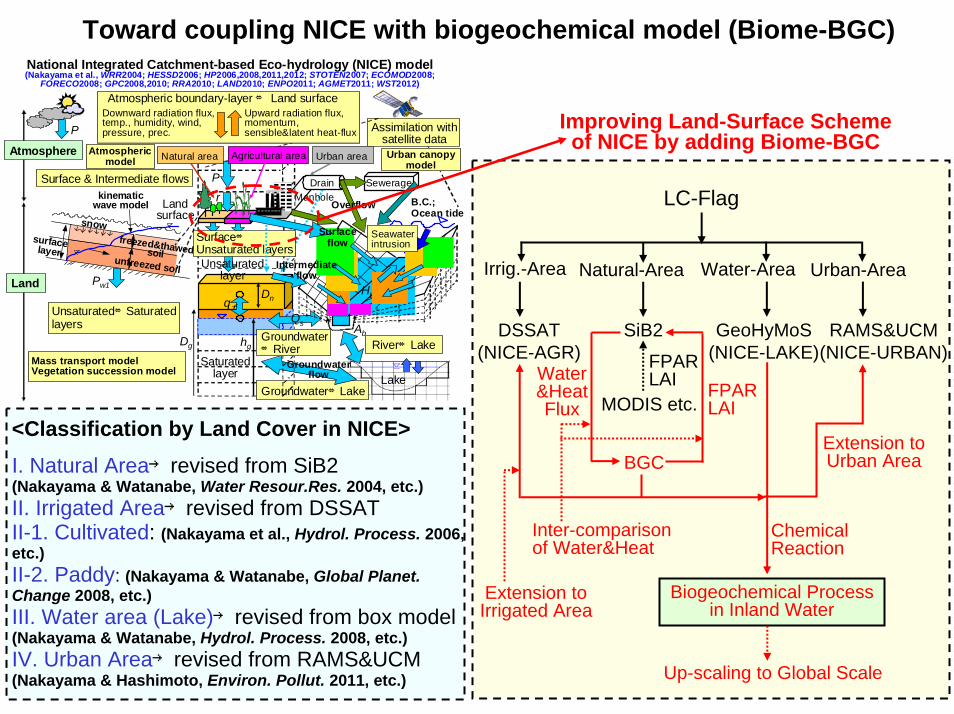
Toward coupling NICE with biogeochemical model (Biome-BGC)
snowsurfacelayer
freezed&thawedsoilunfreezed soil
kinematicwave model
Pw1
P
hgDg
Dn
Ab
Hb
r
qfUnsaturated⇔Saturatedlayers
Land surface
Land
Assimilation with satellite data
Atmospheric boundary-layer ⇔ Land surface
Atmosphere
P
Lake
River⇔Lake
Groundwater⇔Lake
Surface & Intermediate flows
Groundwater ⇔River
Groundwater flow
Saturated layer
Seawater intrusion
B.C.;Ocean tide
Mass transport modelVegetation succession model
Downward radiation flux, temp., humidity, wind, pressure, prec.
Upward radiation flux, momentum,sensible&latent heat-flux
Qs
Surface⇔Unsaturated layers
Drain SewerageManhole
Agricultural areaNatural area Urban area
Surface flow
Overflow
Unsaturated layer
Intermediate flow
National Integrated Catchment-based Eco-hydrology (NICE) model(Nakayama et al., WRR2004; HESSD2006; HP2006,2008,2011,2012; STOTEN2007; ECOMOD2008;
FORECO2008; GPC2008,2010; RRA2010; LAND2010; ENPO2011; AGMET2011; WST2012)
Urban canopy model
Atmosphericmodel
<Classification by Land Cover in NICE>I. Natural Area→revised from SiB2(Nakayama & Watanabe, Water Resour.Res. 2004, etc.)II. Irrigated Area→revised from DSSATII-1. Cultivated: (Nakayama et al., Hydrol. Process. 2006, etc.)II-2. Paddy: (Nakayama & Watanabe, Global Planet. Change 2008, etc.)III. Water area (Lake)→revised from box model(Nakayama & Watanabe, Hydrol. Process. 2008, etc.)IV. Urban Area→revised from RAMS&UCM(Nakayama & Hashimoto, Environ. Pollut. 2011, etc.)
Improving Land-Surface Schemeof NICE by adding Biome-BGC
LC-Flag
Irrig.-Area Natural-Area Water-Area
DSSAT(NICE-AGR)
SiB2 GeoHyMoS(NICE-LAKE)
BGC
FPARLAI
MODIS etc.Water&HeatFlux
FPARLAI
Inter-comparisonof Water&Heat
Biogeochemical Processin Inland Water
ChemicalReaction
Urban-Area
RAMS&UCM(NICE-URBAN)
Up-scaling to Global Scale
Extension toIrrigated Area
Extension toUrban Area
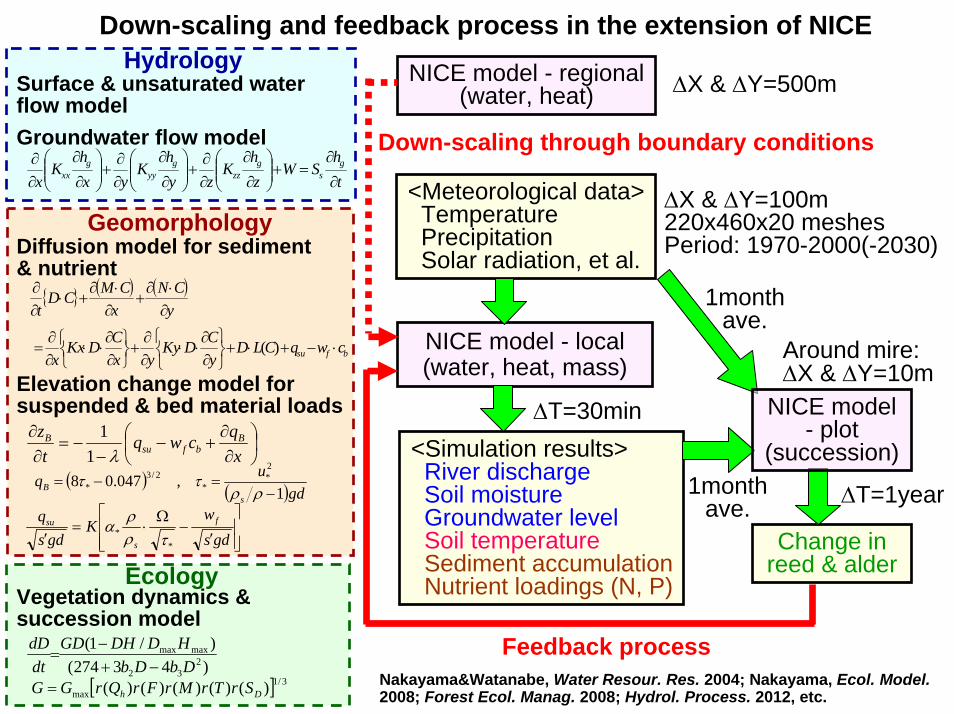
NICE model - local(water, heat, mass)
<Simulation results>River dischargeSoil moistureGroundwater levelSoil temperatureSediment accumulationNutrient loadings (N, P)
Change in reed & alder
<Meteorological data>TemperaturePrecipitationSolar radiation, et al.
∆T=30min
1month ave.
1month ave.
Feedback process
NICE model - regional(water, heat)
Down-scaling through boundary conditions
Down-scaling and feedback process in the extension of NICE
Around mire:∆X & ∆Y=10m
∆T=1year
∆X & ∆Y=100m220x460x20 meshesPeriod: 1970-2000(-2030)
Nakayama&Watanabe, Water Resour. Res. 2004; Nakayama, Ecol. Model.2008; Forest Ecol. Manag. 2008; Hydrol. Process. 2012, etc.
∆X & ∆Y=500m
NICE model- plot
(succession)
th
SWzh
Kzy
hK
yxh
Kx
gs
gzz
gyy
gxx ∂
∂=+⎟⎟
⎠
⎞⎜⎜⎝
⎛∂
∂
∂∂
+⎟⎟⎠
⎞⎜⎜⎝
⎛∂
∂
∂∂
+⎟⎟⎠
⎞⎜⎜⎝
⎛∂
∂
∂∂
( ) ( )
bfsu cwqCLDyCDKy
yxCDKx
x
yCN
xCMCD
t
⋅−+⋅+⎭⎬⎫
⎩⎨⎧
∂∂⋅⋅
∂∂
+⎭⎬⎫
⎩⎨⎧
∂∂⋅⋅
∂∂
=
∂⋅∂
+∂⋅∂
+⋅∂∂
)(
⎟⎠⎞
⎜⎝⎛
∂∂
+−−
−=∂∂
xqcwq
tz B
bfsuB
λ11
( ) ( )gduq
sB 1
,047.082*
*2/3
* −=−=
ρρττ
⎥⎥⎦
⎤
⎢⎢⎣
⎡
′−
Ω⋅=
′ gdsw
Kgds
q f
s
su
** τρρα
)43274()/1(
232
maxmax
DbDbHDDHGD
dtdD
−+−
=
Elevation change model for suspended & bed material loads
Vegetation dynamics & succession model
Diffusion model for sediment & nutrient
Groundwater flow model
Surface & unsaturated water flow model
[ ] 3/1max )()()()()( Dh SrTrMrFrQrGG =
Hydrology
Geomorphology
Ecology

ForestFarmMire (Reed-sedge)AlderBareUrbanRiver & LakeOther land
Legend
Up-scaling and down-scaling in terrestrial/aquatic ecosystems
Kushiro MireRegion
(Nakayama, Hydrol. Process. 2012, etc.)Down-scaling
Up-scaling
Kushiro River Catchment
(Nakayama&Watanabe, Water Resour. Res. 2004, etc.) Kucyoro River
Catchment(Nakayama,
Ecol. Model. 2008, etc.)
Hokkaido District
500m mesh
100m mesh
10m mesh
0.01°mesh(approx. 1km mesh)
0 2km1
0 200km100

Related references about NICENakayama, T.: Factors controlling vegetation succession in Kushiro Mire, Ecol. Model., 215, 225-236,
doi:10.1016/j.ecolmodel.2008.02.017, 2008a.Nakayama, T.: Shrinkage of shrub forest and recovery of mire ecosystem by river restoration in northern Japan, Forest
Ecol. Manag., 256, 1927-1938, doi:10.1016/j.foreco.2008.07.017, 2008b.Nakayama, T.: Simulation of hydrologic and geomorphic changes affecting a shrinking mire, River Res. Applic., 26(3),
305-321, doi:10.1002/rra.1253, 2010.Nakayama, T.: Simulation of complicated and diverse water system accompanied by human intervention in the North
China Plain, Hydrol. Process., 25, 2679-2693, doi:10.1002/hyp.8009, 2011a.Nakayama, T.: Simulation of the effect of irrigation on the hydrologic cycle in the highly cultivated Yellow River
catchment, Agr. Forest Meteorol., 151, 314-327, doi:10.1016/j.agrformet.2010.11.006, 2011b.Nakayama, T.: Visualization of missing role of hydrothermal interactions in Japanese megalopolis for win-win solution,
Water Sci. Technol., 66(2), 409-414, doi:10.2166/wst.2012.205, 2012a.Nakayama, T.: Feedback and regime shift of mire ecosystem in northern Japan, Hydrol. Process., 26(16), 2455-2469,
doi:10.1002/hyp.9347, 2012b.Nakayama, T.: Impact of anthropogenic activity on eco-hydrological process in continental scales, Proc. Environ. Sci., 13,
87-94, doi:10.1016/j.proenv.2012.01.008, 2012c.Nakayama, T. & Fujita, T.: Cooling effect of symbiotic urban pavements made of new materials on water and heat
budgets, Landscape Urban Plan., 96, 57-67, doi:10.1016/j.landurbplan.2010.02.003, 2010.Nakayama, T. & Hashimoto, S.: Potential of water resource to tackle urban heat island in intertwined environmental
pollution, Environ. Pollut., 159, 2164-2173, doi:10.1016/j.envpol.2010.11.016, 2011.Nakayama, T. & Shankman, D.: Impact of the Three-Gorges Dam and water transfer project on Changjiang floods, Global
Planet. Change, 100, 38-50, doi:10.1016/j.gloplacha.2012.10.004, 2013.Nakayama, T. & Watanabe, M.: Simulation of drying phenomena associated with vegetation change caused by invasion
of alder (Alnus japonica) in Kushiro Mire, Water Resour. Res., 40, W08402, doi:10.1029/2004WR003174, 2004.Nakayama, T. & Watanabe, M.: Simulation of spring snowmelt runoff by considering micro-topography and phase
changes in soil layer, Hydrol. Earth Syst. Sci. Discuss., 3, 2101-2144, 2006.Nakayama, T. & Watanabe, M.: Role of flood storage ability of lakes in the Changjiang River catchment, Global Planet.
Change, 63, 9-22, doi:10.1016/j.gloplacha.2008.04.002, 2008a.Nakayama, T. & Watanabe, M.: Missing role of groundwater in water and nutrient cycles in the shallow eutrophic Lake
Kasumigaura, Japan, Hydrol. Process., 22, 1150-1172, doi:10.1002/hyp.6684, 2008b.Nakayama, T., Yang, Y., Watanabe, M., Zhang, X.: Simulation of groundwater dynamics in North China Plain by coupled
hydrology and agricultural models, Hydrol. Process., 20(16), 3441-3466, doi:10.1002/hyp.6142, 2006.Nakayama, T., Watanabe, M., Tanji, K., Morioka, T.: Effect of underground urban structures on eutrophic coastal
environment, Sci. Total Environ., 373(1), 270-288, doi:10.1016/j.scitotenv.2006.11.033, 2007.Nakayama, T., Sun, Y., Geng, Y.: Simulation of water resource and its relation to urban activity in Dalian City, Northern
China, Global Planet. Change, 73, 172-185, doi:10.1016/j.gloplacha.2010.06.001, 2010.Nakayama, T., Hashimoto, S., Hamano, H.: Multi-scaled analysis of hydrothermal dynamics in Japanese megalopolis by
using integrated approach, Hydrol. Process., 26(16), 2431-2444, doi:10.1002/hyp.9290, 2012.

Question ?
Acknowledgement;
M. Watanabe, NIES, Japan (now Keio Univ.)K. Xu, and Q. Wang, NIES, JapanY. Yang, Chinese Academy of Sciences, ChinaR.J. Harding, CEH, UKS. Dadson, CEH, UK (now Oxford Univ.)
Japanese Ministry of the EnvironmentChinese Academy of SciencesOther colleagues