impact of photovoltaic yield forecasting on future...
TRANSCRIPT
http://www.ogimotolab.iis.u-tokyo.ac.jp/html_e/research_e.html
OGIMOTO laboratory, Institute of Industrial Science, the University of Tokyo As-413, 4-6-1 KOMABA MEGURO-KU TOKYO, 153-8505, JAPAN
Copyright © 2017 Ogimoto Laboratory All Rights Reserved.
1
Impact of Photovoltaic Yield Forecasting on Future Power System Operations in Japan
2017/10/24
Yusuke Udagawa(The university of Tokyo/KOZO KEIKAKU ENGINEERING Inc.) K. Ogimoto, J. Gari da Silva Fonseca Jr.(The university of Tokyo)
H. Ohtake(National Institute of Advanced Industrial Science and Technology) S. Fukutome(JP Business Service Corporation)
Solar Integration Workshop 2017 11:15 – 13:00 SESSION 2A – FORECASTING I
This paper is based on results obtained from a project commissioned by the New Energy and Industrial Technology Development Organization (NEDO).
OGIMOTO lab., IIS, the University of Tokyo Copyright © 2017 Ogimoto Laboratory All Rights Reserved.
Introduction
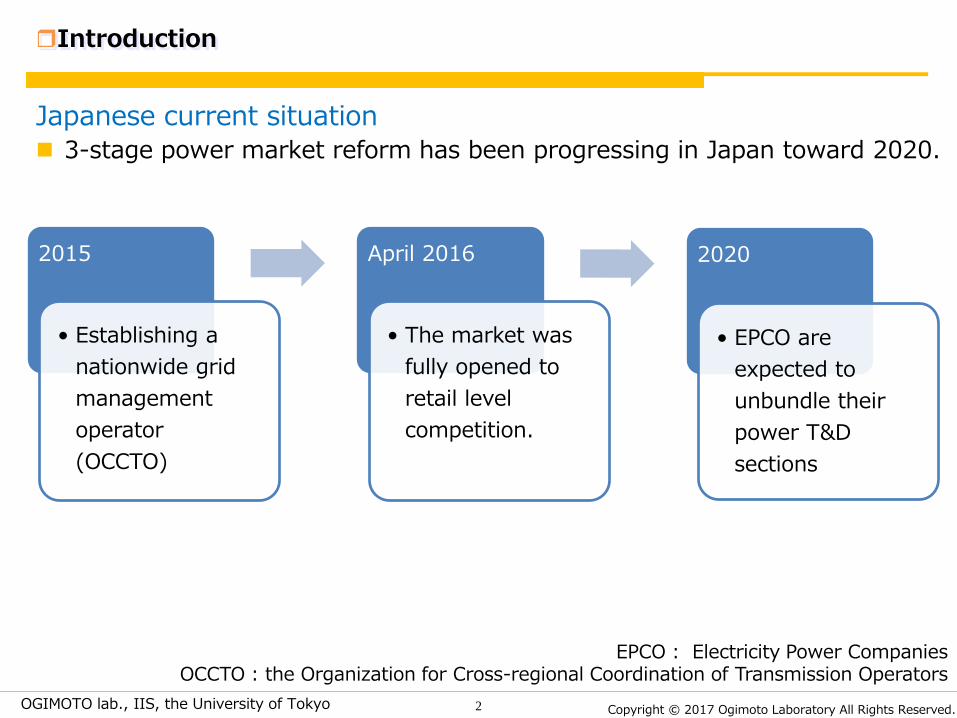
Japanese current situation 3-stage power market reform has been progressing in Japan toward 2020.
2
EPCO : Electricity Power Companies OCCTO : the Organization for Cross-regional Coordination of Transmission Operators
2015
• Establishing a nationwide grid management operator (OCCTO)
April 2016
• The market was fully opened to retail level competition.
2020
• EPCO are expected to unbundle their power T&D sections
OGIMOTO lab., IIS, the University of Tokyo Copyright © 2017 Ogimoto Laboratory All Rights Reserved.
Introduction
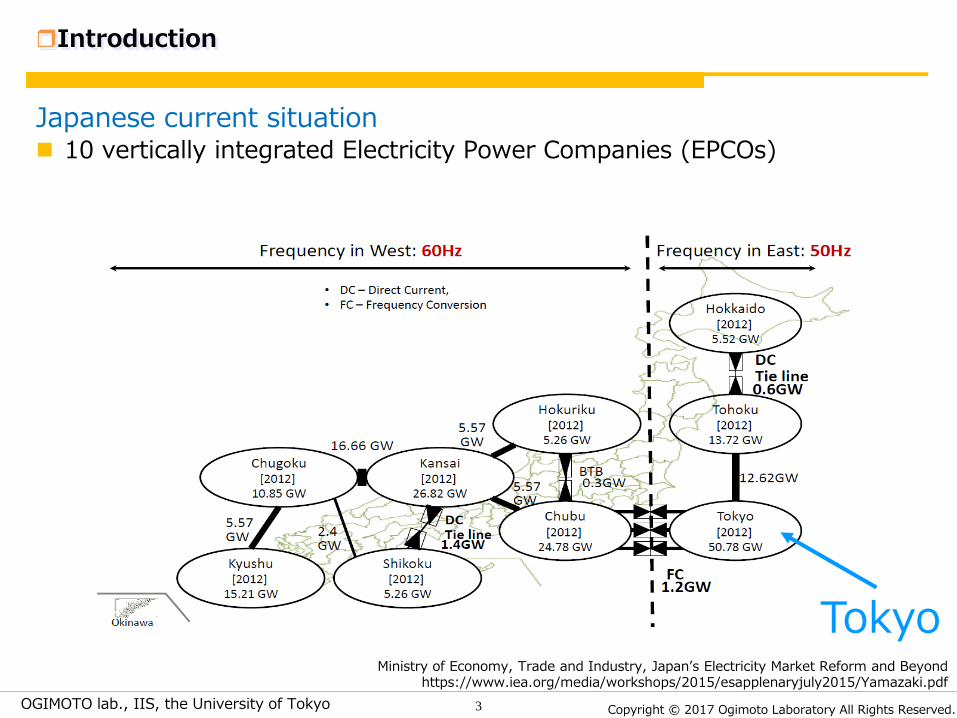
Japanese current situation 10 vertically integrated Electricity Power Companies (EPCOs)
3
Ministry of Economy, Trade and Industry, Japan’s Electricity Market Reform and Beyond https://www.iea.org/media/workshops/2015/esapplenaryjuly2015/Yamazaki.pdf
Tokyo
OGIMOTO lab., IIS, the University of Tokyo Copyright © 2017 Ogimoto Laboratory All Rights Reserved.
Introduction
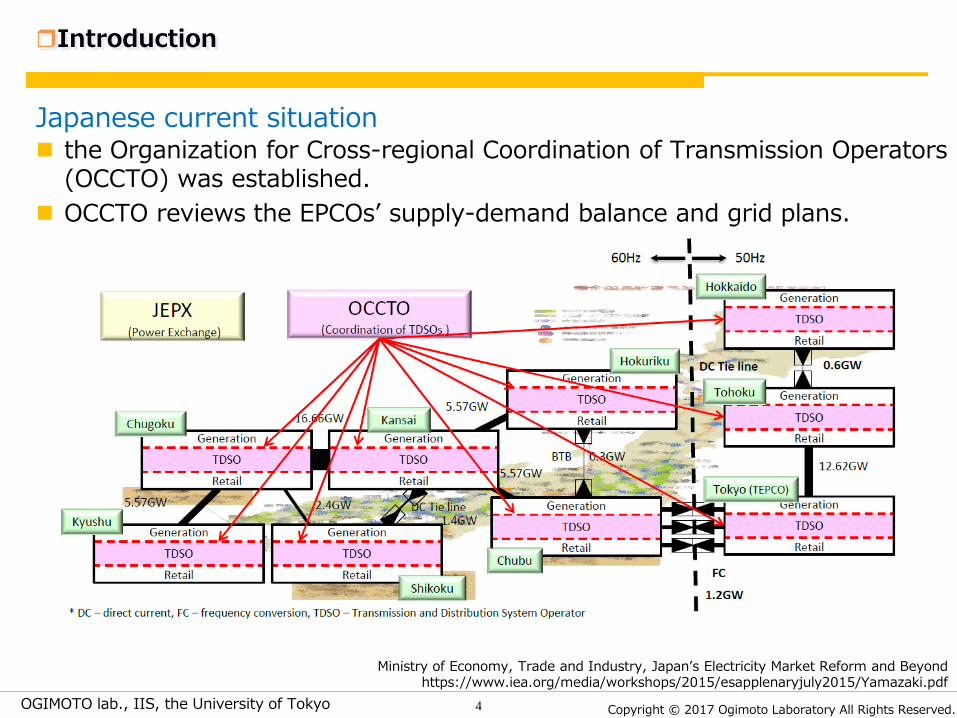
Japanese current situation the Organization for Cross-regional Coordination of Transmission Operators
(OCCTO) was established. OCCTO reviews the EPCOs’ supply-demand balance and grid plans.
4
Ministry of Economy, Trade and Industry, Japan’s Electricity Market Reform and Beyond https://www.iea.org/media/workshops/2015/esapplenaryjuly2015/Yamazaki.pdf

OGIMOTO lab., IIS, the University of Tokyo Copyright © 2017 Ogimoto Laboratory All Rights Reserved.
Introduction
Japanese current situation 3-stage power market reform has been progressing in Japan toward 2020.
5
EPCO : Electricity Power Companies OCCTO : the Organization for Cross-regional Coordination of Transmission Operators
2015
• Establishing a nationwide grid management operator (OCCTO)
April 2016
• The market was fully opened to retail level competition.
2020
• EPCO are expected to unbundle their power T&D sections
OGIMOTO lab., IIS, the University of Tokyo Copyright © 2017 Ogimoto Laboratory All Rights Reserved.
Introduction
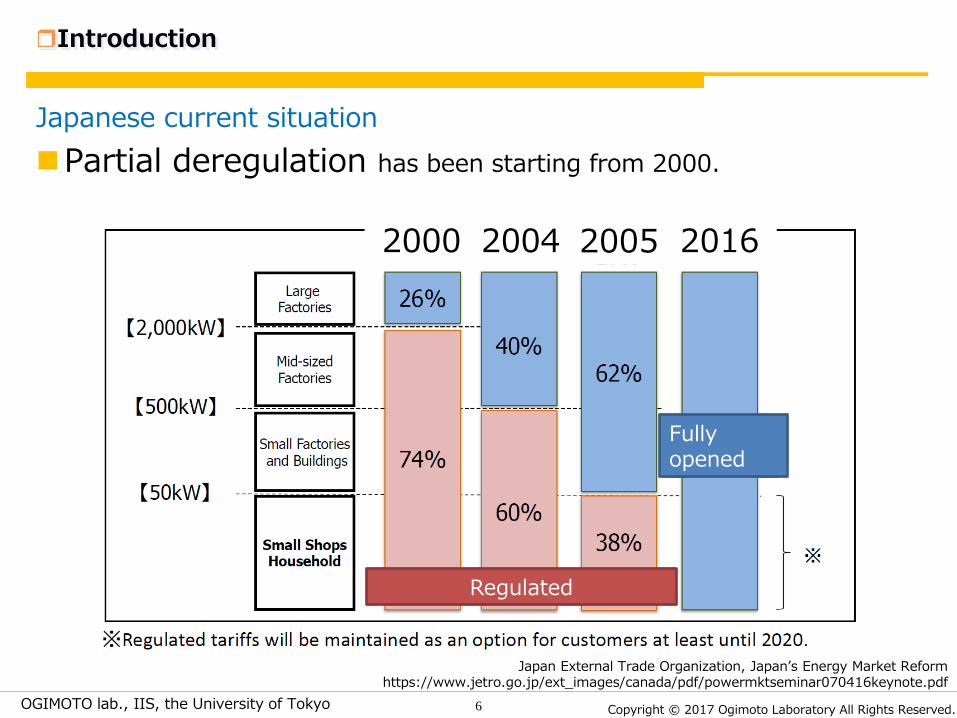
Japanese current situation Partial deregulation has been starting from 2000.
6
Japan External Trade Organization, Japan’s Energy Market Reform https://www.jetro.go.jp/ext_images/canada/pdf/powermktseminar070416keynote.pdf
Fully opened
2000 2004 2005 2016
Regulated

OGIMOTO lab., IIS, the University of Tokyo Copyright © 2017 Ogimoto Laboratory All Rights Reserved.
Introduction
Japanese current situation 3-stage power market reform has been progressing in Japan toward 2020.
7
EPCO : Electricity Power Companies OCCTO : the Organization for Cross-regional Coordination of Transmission Operators
2015
• Establishing a nationwide grid management operator (OCCTO)
April 2016
• The market was fully opened to retail level competition.
2020
• EPCOs are expected to unbundle their power T&D sections

OGIMOTO lab., IIS, the University of Tokyo Copyright © 2017 Ogimoto Laboratory All Rights Reserved.
Introduction
Japanese current situation FIT program was launched in 2012
Installed & approved PVs reached 28.5 GW & 84.5 GW, 2017.3 the Strategic Energy Plan of Japan for the next decade (revised)
64GW of PV and 10GW of wind are expected to be installed by 2030.
8
42
3837
3331
2826
24
3533
3028
26
40
36
32
27
24
2121
15
20
25
30
35
40
45
2012 2013 2014 2015 2016 2017 2018 2019
FIT (
Cent
/kWh
)
Up to 10kW Up to 10kW (curtailment required) Above 10kW Above 10kW, Up to 2000kW Above 2000kW
Bid
Now!
OGIMOTO lab., IIS, the University of Tokyo Copyright © 2017 Ogimoto Laboratory All Rights Reserved.
Motivation
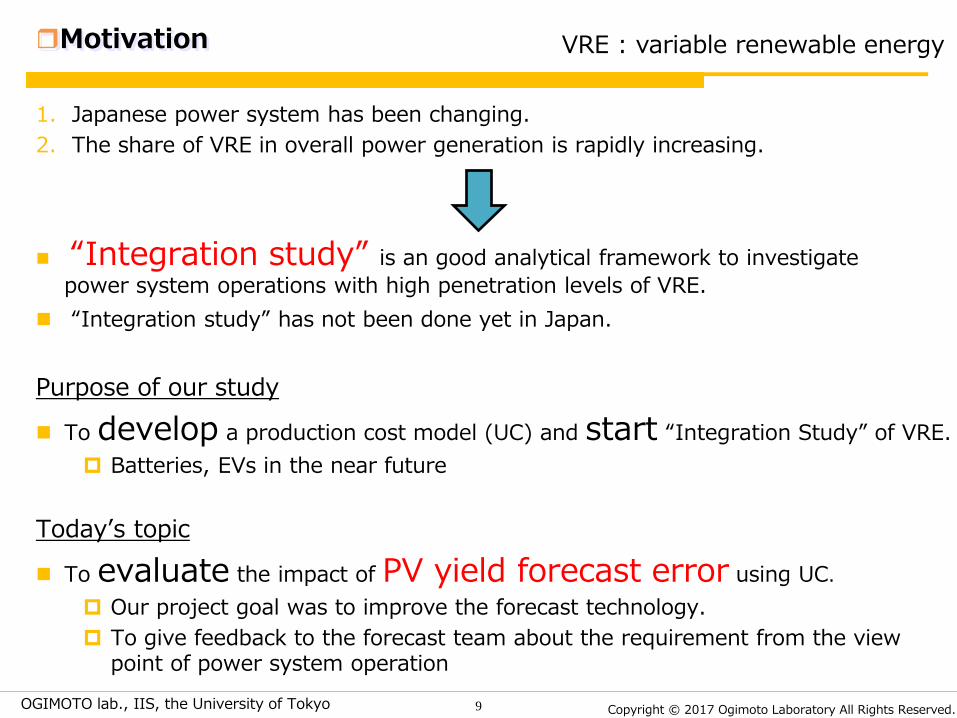
1. Japanese power system has been changing. 2. The share of VRE in overall power generation is rapidly increasing.
“Integration study” is an good analytical framework to investigate power system operations with high penetration levels of VRE.
“Integration study” has not been done yet in Japan. Purpose of our study
To develop a production cost model (UC) and start “Integration Study” of VRE. Batteries, EVs in the near future
Today’s topic
To evaluate the impact of PV yield forecast error using UC. Our project goal was to improve the forecast technology. To give feedback to the forecast team about the requirement from the view
point of power system operation
9
VRE : variable renewable energy

OGIMOTO lab., IIS, the University of Tokyo Copyright © 2017 Ogimoto Laboratory All Rights Reserved.
Today’s contents
What we have done
We have been studying the impacts of PV in TEPCO area. Developing Unit Commitment & Economic Dispatch model.
We have evaluated the value of day ahead PV prediction tech..
10
ELECTRICITYREVIEWJAPAN, The Federation of Electric Power Companies of Japan
TEPCO is the largest power balancing area in Japan and has high potential for PV deployment. 17.5 GW PV capacity was
assumed in the area in 2030 55GW peak load in
summer and 70GW of total supply capacity. Tokyo
45°N
35°N
Japan 52°N (Berlin)

OGIMOTO lab., IIS, the University of Tokyo Copyright © 2017 Ogimoto Laboratory All Rights Reserved.
Model Day ahead Unit Commitment and real time Economic Dispatch simulation.
A deterministic UC approach
which can consider confidence interval to consider the forecast error
Formulation
Objective function Variables (main)
Methodology
11
referred to as operational cost
For details, see our paper
𝑝𝑝𝑛𝑛,𝑡𝑡 : power generated by thermal gen. n
𝑔𝑔𝑚𝑚,𝑡𝑡 and ℎ𝑚𝑚,𝑡𝑡: power generated and consumed by pumped storage gen. m decision variables of the unit commitment (turn on or not, work or not, etc)
Min. fuel cost + start cost of thermal power plants ※not considering costs of pumped storage generator
OGIMOTO lab., IIS, the University of Tokyo Copyright © 2017 Ogimoto Laboratory All Rights Reserved.
Methodology
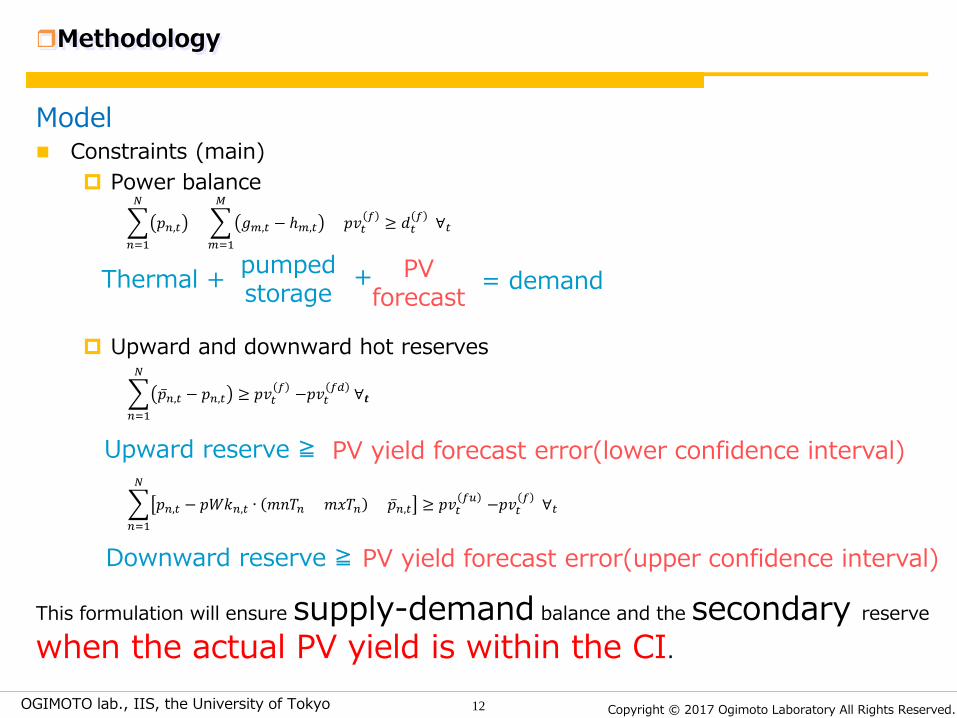
Model Constraints (main)
Power balance
Upward and downward hot reserves
12
� 𝑝𝑝𝑛𝑛,𝑡𝑡 + � 𝑔𝑔𝑚𝑚,𝑡𝑡 − ℎ𝑚𝑚,𝑡𝑡
𝑀𝑀
𝑚𝑚=1
𝑁𝑁
𝑛𝑛=1
+ 𝑝𝑝𝑝𝑝𝑡𝑡𝑓𝑓 ≥ 𝑑𝑑𝑡𝑡
𝑓𝑓 ∀𝑡𝑡
Thermal + pumped storage
PV forecast
� �̅�𝑝𝑛𝑛,𝑡𝑡 − 𝑝𝑝𝑛𝑛,𝑡𝑡
𝑁𝑁
𝑛𝑛=1
≥ 𝑝𝑝𝑝𝑝𝑡𝑡𝑓𝑓 −𝑝𝑝𝑝𝑝𝑡𝑡
𝑓𝑓𝑓𝑓 ∀𝒕𝒕
� 𝑝𝑝𝑛𝑛,𝑡𝑡 − 𝑝𝑝𝑝𝑝𝑝𝑝𝑛𝑛,𝑡𝑡 ∙ 𝑚𝑚𝑚𝑚𝑚𝑚𝑛𝑛 + 𝑚𝑚𝑚𝑚𝑚𝑚𝑛𝑛 + �̅�𝑝𝑛𝑛,𝑡𝑡
𝑁𝑁
𝑛𝑛=1
≥ 𝑝𝑝𝑝𝑝𝑡𝑡𝑓𝑓𝑓𝑓 −𝑝𝑝𝑝𝑝𝑡𝑡
𝑓𝑓 ∀𝑡𝑡
Upward reserve ≧ PV yield forecast error(lower confidence interval)
= demand +
Downward reserve ≧ PV yield forecast error(upper confidence interval)
This formulation will ensure supply-demand balance and the secondary reserve
when the actual PV yield is within the CI.

OGIMOTO lab., IIS, the University of Tokyo Copyright © 2017 Ogimoto Laboratory All Rights Reserved.
Methodology
Model Constraints
Secondary reserve
13
𝑑𝑑𝑑𝑑𝑚𝑚𝑑𝑑𝑚𝑚𝑑𝑑 × 3% 2 + 𝑝𝑝𝑝𝑝 × 20% 2 ≤ Rated power of thermal
Rated power of pumped storage (generation)
+
Rated power of pumped storage (pumping)
×20%
×33%
×10%
Short term variation Only in operation
Only adjustable speed type
Secondary reserve capacity Pump mode Generation mode
Thermal (Coal, LNG, Oil) ― ±5% of
the rated power
Pump
Const. speed ― ±16.5% of
the rated power
Adjustable speed
±10% of the rated power
±16.5% of the rated power
Secondary reserve
+

OGIMOTO lab., IIS, the University of Tokyo Copyright © 2017 Ogimoto Laboratory All Rights Reserved.
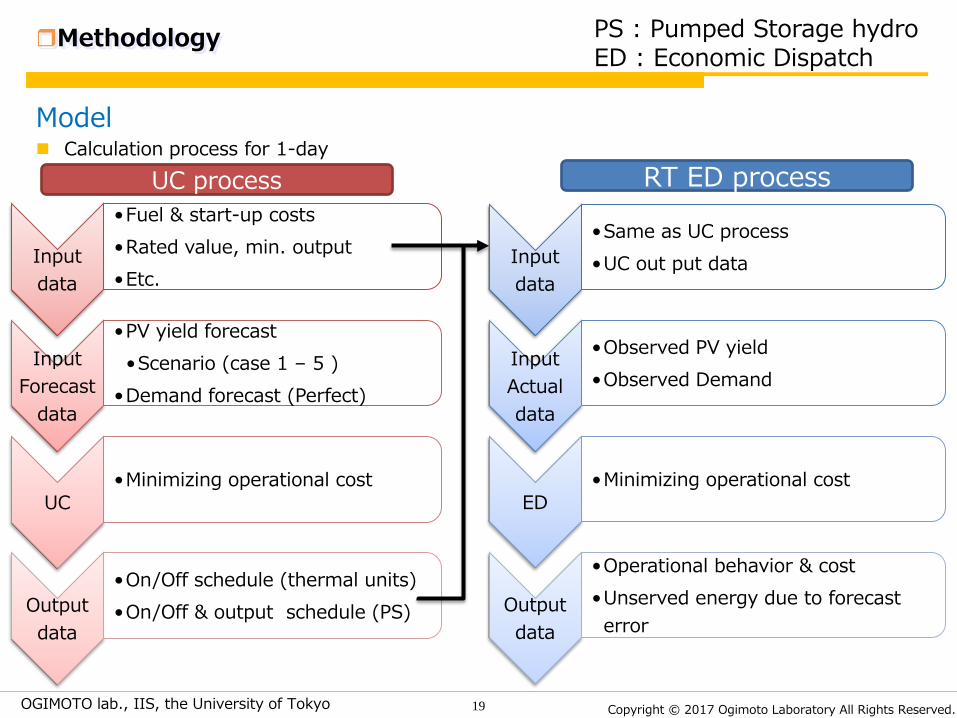
Model Calculation process for 1-day
Methodology
14
Input data
•Fuel & start-up costs •Rated value, min. output •Etc.
Input Forecast
data
•PV yield forecast •Scenario (case 1 – 5 )
•Demand forecast (Perfect)
UC •Minimizing operational cost
Output data
•On/Off schedule (thermal units) •On/Off & output schedule (PS)
UC process
PS : Pumped Storage hydro

OGIMOTO lab., IIS, the University of Tokyo Copyright © 2017 Ogimoto Laboratory All Rights Reserved.
Methodology
Forecast data (input data) Regional forecasts of solar irradiance [kW/m2]
calculated in NWP of the JMA the initial time of the forecast of 12:00 JST in the day preceding the target day.
multiplied by the system output coefficient (0.8) and a PV capacity
in TEPCO area (17.5GW).
15
[12] H. Ohtake, Joao Gari da Silva Fonseca Jr, T. Takashima., T. Oozeki, K-I. Shimose, and Y. Yamada, "Regional and seasonal characteristics of global horizontal irradiance forecasts obtained from the Japan Meteorological Agency mesoscale model", Solar Energy, 116, pp. 83-99. /doi:10.1016/j.solener., Mar 2015 [13] J. G. da S. Fonseca Junior, T. Oozeki, H. Ohtake, T. Takashima, and K. Ogimoto, "Regional forecasts of photovoltaic power generation according to different data availability scenarios: a study of four methods," Prog. Photovolt. Res. Appl., vol. 23, no. 10, pp. 1203–1218, Oct. 2015
For details, see these papers
NWP : numerical weather prediction JMA : Japan Meteorological Agency

OGIMOTO lab., IIS, the University of Tokyo Copyright © 2017 Ogimoto Laboratory All Rights Reserved.
Model Calculation process for 1-day
Methodology
16
Input data
•Fuel & start-up costs •Rated value, min. output •Etc.
Input Forecast
data
•PV yield forecast •Scenario (case 1 – 5 )
•Demand forecast (Perfect)
UC •Minimizing operational cost
Output data
•On/Off schedule (thermal units) •On/Off & output schedule (PS)
UC process
PS : Pumped Storage hydro

OGIMOTO lab., IIS, the University of Tokyo Copyright © 2017 Ogimoto Laboratory All Rights Reserved.
Methodology
Simulation scenarios We used 5-type of PV yield forecast.
17
Case Detail
Persistence Persistence forecast, assuming the conditions at the time today should not change at the same time tomorrow.
Predict. Day-ahead PV yield forecast without Confidence Interval
Predict. w/ 80% CI Day-ahead PV yield forecast with forecast error (80% CI)
Predict. w/ 90% CI Day-ahead PV yield forecast with forecast error (90% CI)
Predict. w/ 95% CI Day-ahead PV yield forecast with forecast error (95% CI)

OGIMOTO lab., IIS, the University of Tokyo Copyright © 2017 Ogimoto Laboratory All Rights Reserved.
Model Calculation process for 1-day
Methodology
18
Input data
•Fuel & start-up costs •Rated value, min. output •Etc.
Input Forecast
data
•PV yield forecast •Scenario (case 1 – 5 )
•Demand forecast (Perfect)
UC •Minimizing operational cost
Output data
•On/Off schedule (thermal units) •On/Off & output schedule (PS)
UC process
PS : Pumped Storage hydro
OGIMOTO lab., IIS, the University of Tokyo Copyright © 2017 Ogimoto Laboratory All Rights Reserved.
Model Calculation process for 1-day
Methodology
19
Input data
•Fuel & start-up costs •Rated value, min. output •Etc.
Input Forecast
data
•PV yield forecast •Scenario (case 1 – 5 )
•Demand forecast (Perfect)
UC •Minimizing operational cost
Output data
•On/Off schedule (thermal units) •On/Off & output schedule (PS)
UC process
PS : Pumped Storage hydro ED : Economic Dispatch
RT ED process
Input data
•Same as UC process •UC out put data
Input Actual data
•Observed PV yield •Observed Demand
ED •Minimizing operational cost
Output data
•Operational behavior & cost •Unserved energy due to forecast error

OGIMOTO lab., IIS, the University of Tokyo Copyright © 2017 Ogimoto Laboratory All Rights Reserved.
Methodology
Model Analysis period is 1 year (365days)
20
30 min
0:00 0:30
1:00 1:30
~
~
23:30 24:00
Time resolution is 30mim & Optimization period is 24 hours
Rolling horizon
4/1
4/2
3/30
3/31
48 time steps
DA UC & RT ED

OGIMOTO lab., IIS, the University of Tokyo Copyright © 2017 Ogimoto Laboratory All Rights Reserved.
Methodology
Analysis area Investigating the impact of PV yield forecast on TEPCO’s operations in 2030.
(Base data : FY2010) CO
21
Type Installed capacity Detail
Peak & Middle load
Thermal 42.60 [GW] Coal : 9.6 [GW] (15)
LNG : 22.16 [GW] (57) OIL : 10.84 [GW] (20)
Pump 13.68 [GW] Adjustable speed : 4.30 [GW] (11) Constant speed : 9.38 [GW] (41)
Base load - 13.71 [GW] Nuclear : 6.01 [GW] Hydro : 5.14 [GW] Others : 2.56 [GW]
A lot of pumped storage hydro is one of the TEPCO’s characteristics.
PS : Pumped Storage hydro
OGIMOTO lab., IIS, the University of Tokyo Copyright © 2017 Ogimoto Laboratory All Rights Reserved.
Results
22
20
25
30
35
40
4/27
0:00
4/28
0:00
GW
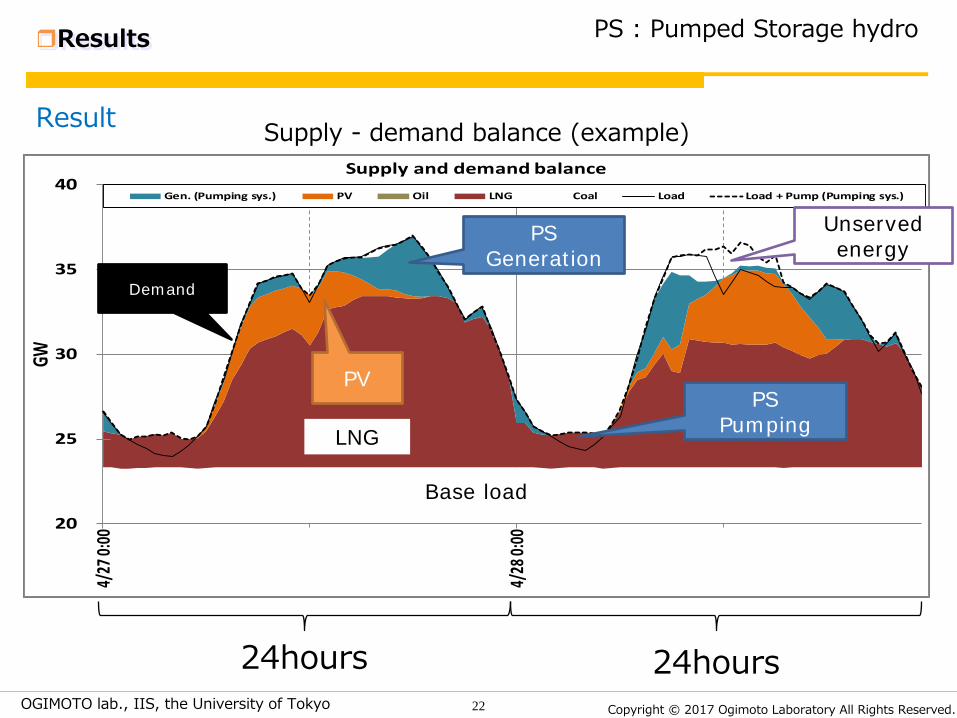
Supply and demand balance
Gen. (Pumping sys.) PV Oil LNG Coal Load Load + Pump (Pumping sys.)
Base load
LNG
PS Generation
Demand
PV PS
Pumping
Unserved energy
Supply - demand balance (example) Result
PS : Pumped Storage hydro
24hours 24hours
OGIMOTO lab., IIS, the University of Tokyo Copyright © 2017 Ogimoto Laboratory All Rights Reserved.
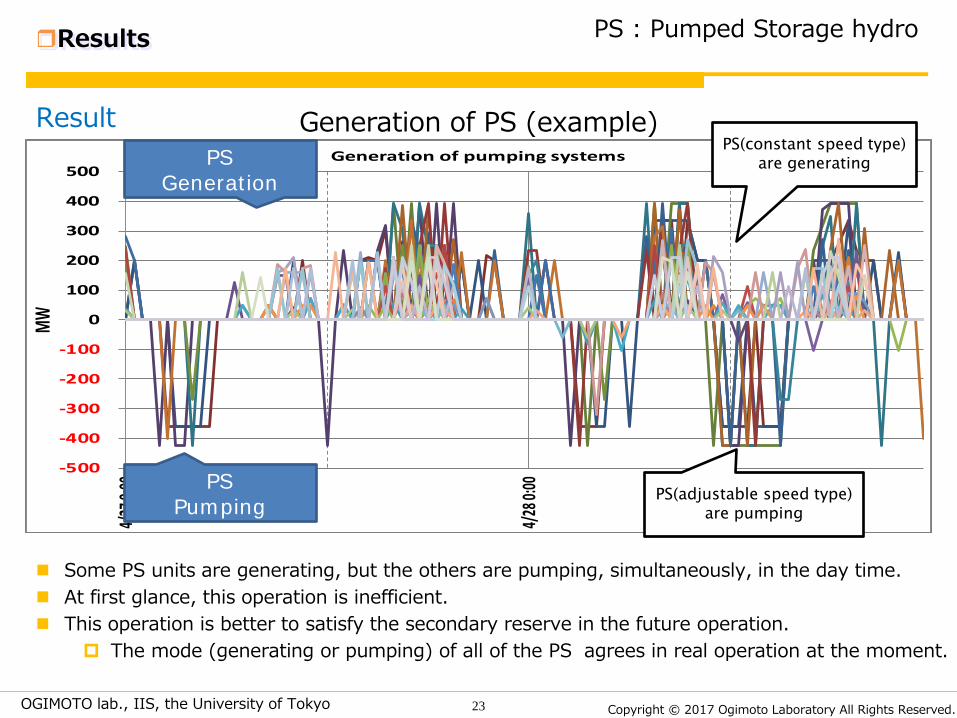
Result Some PS units are generating, but the others are pumping, simultaneously, in the day time. At first glance, this operation is inefficient. This operation is better to satisfy the secondary reserve in the future operation.
The mode (generating or pumping) of all of the PS agrees in real operation at the moment.
Results
23
-500
-400
-300
-200
-100
0
100
200
300
400
500
4/27
0:00
4/28
0:00
MW
Generation of pumping systemsPS Generation
PS Pumping
Generation of PS (example)
PS : Pumped Storage hydro
PS(constant speed type) are generating
PS(adjustable speed type) are pumping
OGIMOTO lab., IIS, the University of Tokyo Copyright © 2017 Ogimoto Laboratory All Rights Reserved.
Results
24
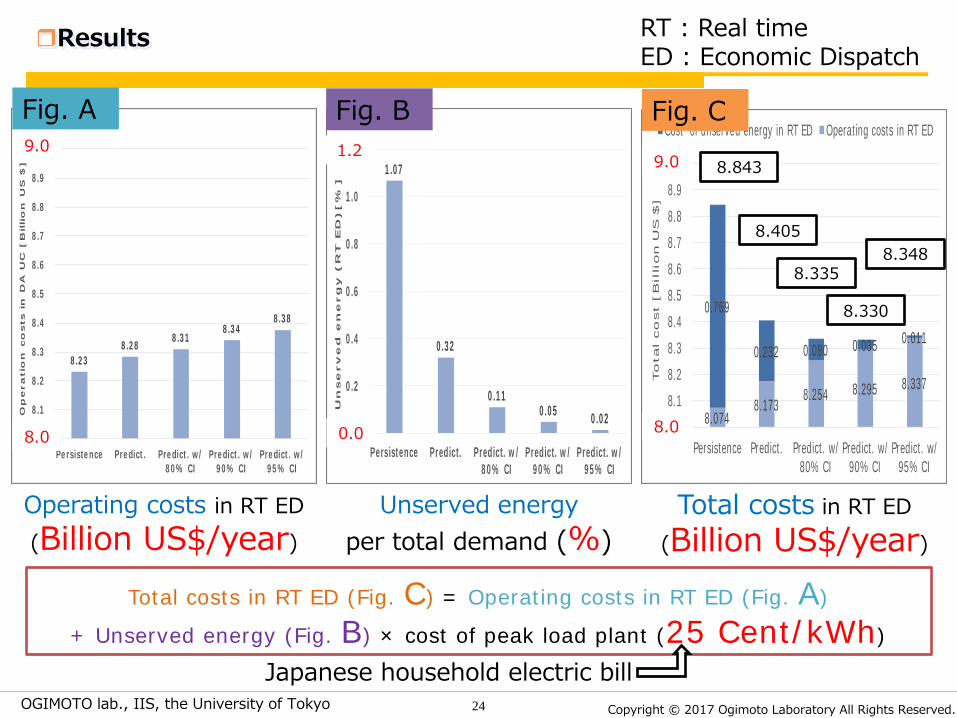
8.074 8.173
8.254 8.295 8.337
0.769
0.232 0.080 0.035 0.011
8.08.18.28.38.48.58.68.78.88.99.0
Persistence Predict. Predict. w/80% CI
Predict. w/90% CI
Predict. w/95% CI
Tota
l cost [Billion U
S $
]
Cost of unserved energy in RT ED Operating costs in RT ED
Total costs in RT ED (Billion US$/year)
Operating costs in RT ED (Billion US$/year)
Unserved energy per total demand (%)
Total costs in RT ED (Fig. C) = Operating costs in RT ED (Fig. A)
+ Unserved energy (Fig. B) × cost of peak load plant (25 Cent/kWh)
8.405
1.07
0.32
0.11 0.05 0.02
0.0
0.2
0.4
0.6
0.8
1.0
1.2
Persistence Predict. Predict. w/80% CI
Predict. w/90% CI
Predict. w/95% CI
Un
served
en
erg
y (
RT E
D)[%
]
8.23 8.28 8.31
8.34 8.38
8.0
8.1
8.2
8.3
8.4
8.5
8.6
8.7
8.8
8.9
9.0
Persistence Predict. Predict. w/80% CI
Predict. w/90% CI
Predict. w/95% CI
Op
eratio
n co
sts in
D
A U
C [
Billio
n U
S $
] 8.843
8.335
8.330
8.348
Fig. A
8.0
9.0
0.0
1.2
8.0
9.0
Fig. B Fig. C
Japanese household electric bill
RT : Real time ED : Economic Dispatch

OGIMOTO lab., IIS, the University of Tokyo Copyright © 2017 Ogimoto Laboratory All Rights Reserved.
Results
25
8.074 8.173
8.254 8.295 8.337
0.769
0.232 0.080 0.035 0.011
8.08.18.28.38.48.58.68.78.88.99.0
Persistence Predict. Predict. w/80% CI
Predict. w/90% CI
Predict. w/95% CI
Tota
l cost [Billion U
S $
]
Cost of unserved energy in RT ED Operating costs in RT ED
8.405
1.07
0.32
0.11 0.05 0.02
0.0
0.2
0.4
0.6
0.8
1.0
1.2
Persistence Predict. Predict. w/80% CI
Predict. w/90% CI
Predict. w/95% CI
Un
served
en
erg
y (
RT E
D)[%
]
8.23 8.28 8.31
8.34 8.38
8.0
8.1
8.2
8.3
8.4
8.5
8.6
8.7
8.8
8.9
9.0
Persistence Predict. Predict. w/80% CI
Predict. w/90% CI
Predict. w/95% CI
Op
eratio
n co
sts in
D
A U
C [
Billio
n U
S $
] 8.843
8.335
8.330
8.348
Fig. A
8.0
9.0
0.0
1.2
8.0
9.0
Fig. B Fig. C
① DA PV forecasts can strongly reduce the amount of unserved energy.
② Using CI reduce the unserved energy.
③ Even with 95% CI, 0.02% unserved energy with 41hours occurrence.
④ The lowest cost occurred in the case with 90% CI.
⑤ The order of the total costs depended on the cost of the peak load plant (next slide).
①
②
③
④
RT : Real time ED : Economic Dispatch
OGIMOTO lab., IIS, the University of Tokyo Copyright © 2017 Ogimoto Laboratory All Rights Reserved.
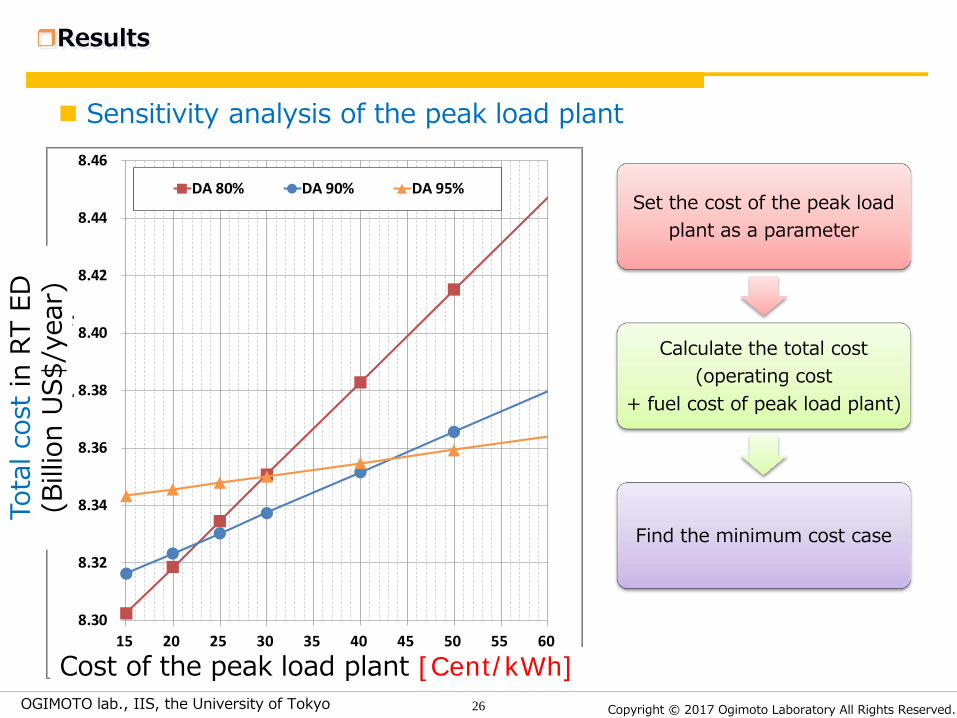
Sensitivity analysis of the peak load plant
Results
26
8.30
8.32
8.34
8.36
8.38
8.40
8.42
8.44
8.46
15 20 25 30 35 40 45 50 55 60
Tota
l Cos
t [bi
llion
US$
]
Value of Unserved Energy [Cent/kWh]
DA 80% DA 90% DA 95%
Cost of the peak load plant [Cent/kWh]
Tota
l cos
t in
RT E
D
(Bill
ion
US$/
year
)
Set the cost of the peak load plant as a parameter
Calculate the total cost (operating cost
+ fuel cost of peak load plant)
Find the minimum cost case
OGIMOTO lab., IIS, the University of Tokyo Copyright © 2017 Ogimoto Laboratory All Rights Reserved.
Sensitivity analysis of the peak load plant
Results
27
8.30
8.32
8.34
8.36
8.38
8.40
8.42
8.44
8.46
15 20 25 30 35 40 45 50 55 60
Tota
l Cos
t [bi
llion
US$
]
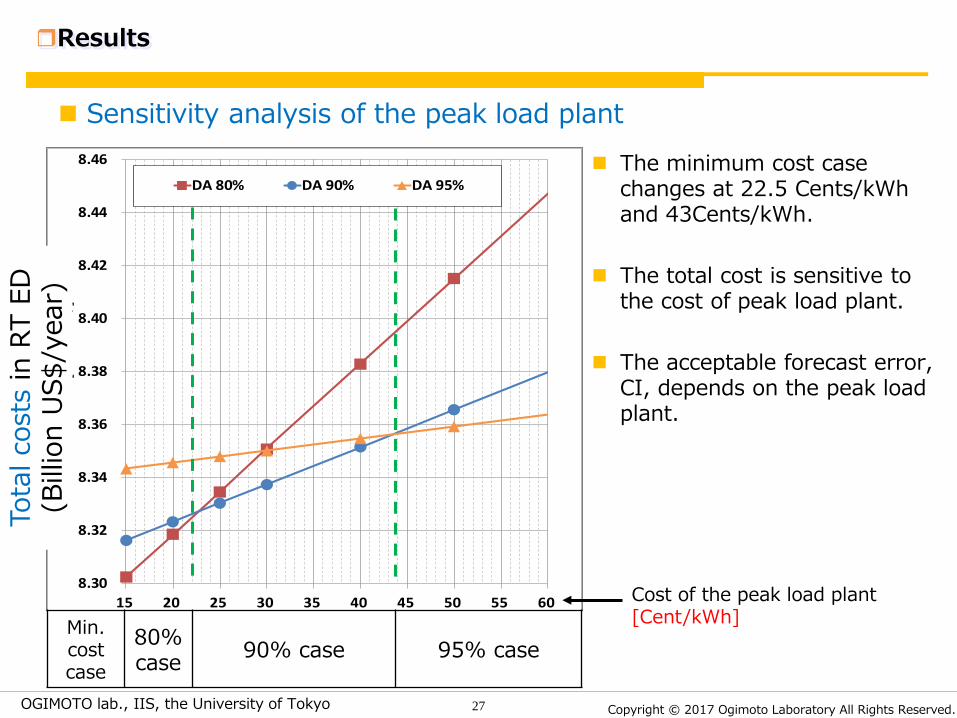
DA 80% DA 90% DA 95% The minimum cost case
changes at 22.5 Cents/kWh and 43Cents/kWh.
The total cost is sensitive to the cost of peak load plant.
The acceptable forecast error, CI, depends on the peak load plant.
Tota
l cos
ts in
RT
ED
(Bill
ion
US$/
year
)
Min. cost case
80% case 90% case 95% case
Cost of the peak load plant [Cent/kWh]
OGIMOTO lab., IIS, the University of Tokyo Copyright © 2017 Ogimoto Laboratory All Rights Reserved.
Sensitivity analysis of the peak load plant
Results
28
8.30
8.32
8.34
8.36
8.38
8.40
8.42
8.44
8.46
15 20 25 30 35 40 45 50 55 60
Tota
l Cos
t [bi
llion
US$
]
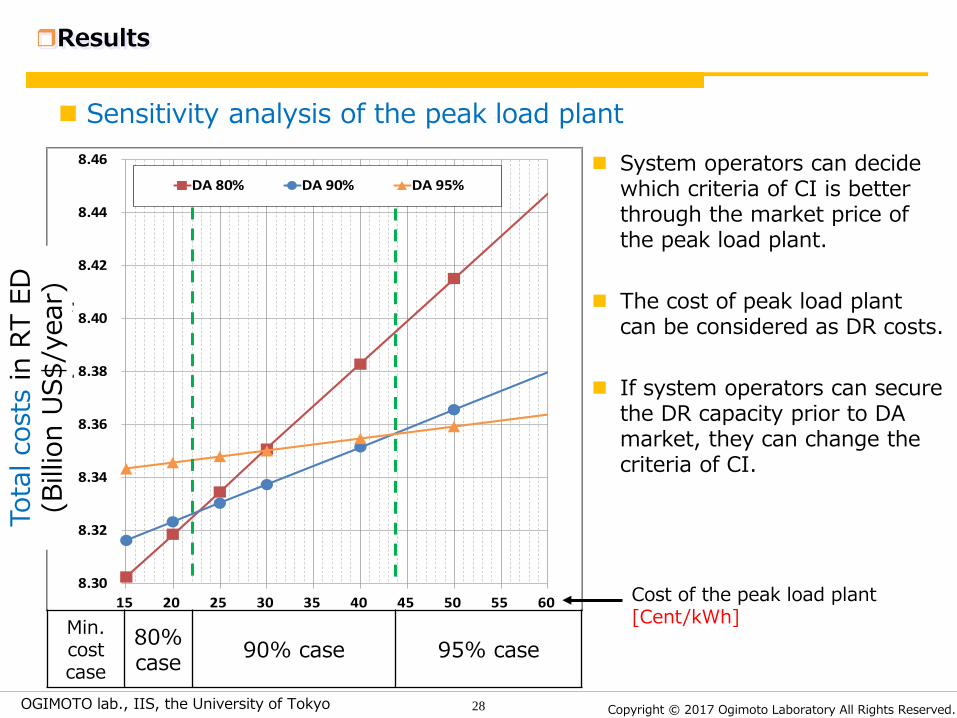
DA 80% DA 90% DA 95% System operators can decide
which criteria of CI is better through the market price of the peak load plant.
The cost of peak load plant can be considered as DR costs.
If system operators can secure the DR capacity prior to DA market, they can change the criteria of CI.
Tota
l cos
ts in
RT
ED
(Bill
ion
US$/
year
)
Min. cost case
80% case 90% case 95% case
Cost of the peak load plant [Cent/kWh]
OGIMOTO lab., IIS, the University of Tokyo Copyright © 2017 Ogimoto Laboratory All Rights Reserved.
Conclusions
29
We evaluated the impact of PV yield forecast error.
DA PV yield forecasts can strongly reduce the amount of unserved energy.
Even considering large PV yield forecast errors (95% CI), unserved energy still occur (0.02%). DR is a good way to compensate a small amount of the energy shortfall.
PV yield forecast with CI should be considered in DA UC, increasing
the system reliability and decreasing the operational cost. The size of CI which should be considered in DA UC can be decided
through the market cost of the peak load plant and DR. If system operators can secure the DR capacity prior to DA
market, they can change the criteria of CI.

OGIMOTO lab., IIS, the University of Tokyo Copyright © 2017 Ogimoto Laboratory All Rights Reserved.
Conclusions
30
We evaluated the impact of PV yield forecast error.
In the daytime, PV yield is abundant and that is stored by pumping operation of PS. PS conventionally pumps water in the daytime w/o highly installed VRE. In the future power system, the operation of pumped storage
generators drastically changes. Our results indicated that some PS units are generating, but the others are
pumping, simultaneously, in the day time. This operation might be better to satisfy the secondary reserve.
As actual power systems operations are more complicated, we have to model and simulate not only day ahead UC but also intraday UC with updated PV yield and/or the other VRE sources’ forecasts.
PS : Pumped Storage hydro VRE : variable renewable energy
OGIMOTO lab., IIS, the University of Tokyo Copyright © 2017 Ogimoto Laboratory All Rights Reserved.
31
Thank you very much for your attention!
This paper is based on results obtained from a project commissioned by the New Energy and Industrial Technology Development Organization (NEDO).

OGIMOTO lab., IIS, the University of Tokyo Copyright © 2017 Ogimoto Laboratory All Rights Reserved.
Motivation
Japanese power system has been changing. The share of VRE in overall power generation is rapidly increasing. “Integration study” is an good analytical framework to evaluate a power system with high penetration levels of VRE. Purpose of our study The share of PV as VRE in overall power generation is rapidly increasing,
1. To evaluate the impact of PV yield forecast error. our project goal was to improve the forecast technology. give feedback to the forecast team about the requirement from the view point of
power system operating
2. To simulate power systems operating with highly installed VRE uncertainty due to unexpected changes in resource availability
32
VRE : variable renewable energy
OGIMOTO lab., IIS, the University of Tokyo Copyright © 2017 Ogimoto Laboratory All Rights Reserved.
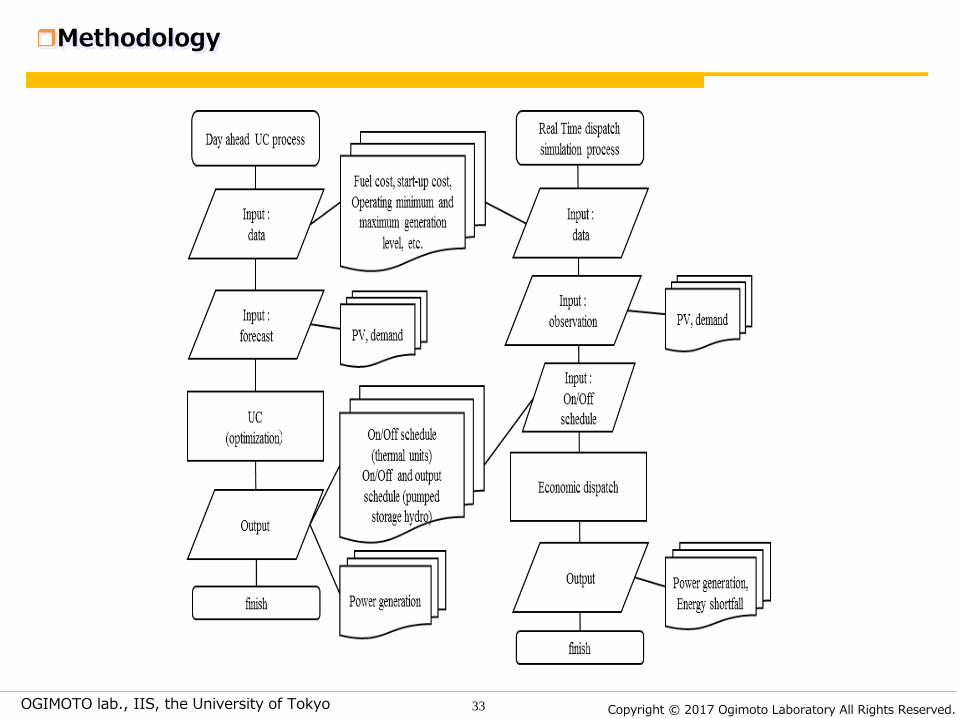
Methodology
33

OGIMOTO lab., IIS, the University of Tokyo Copyright © 2017 Ogimoto Laboratory All Rights Reserved.
Sensitivity analysis of the peak load plant
Results
34
8.30
8.32
8.34
8.36
8.38
8.40
8.42
8.44
8.46
15 20 25 30 35 40 45 50 55 60
Tota
l Cos
t [bi
llion
US$
]
Value of Unserved Energy [Cent/kWh]
DA 80% DA 90% DA 95% The minimum cost case
changes at 22.5 JPY/kWh or 43JPY/kWh.
The difference in the costs is sensitive to the cost of peak load plant.
The acceptable forecast error depends on the market value (price) of peak load plant and/or DR costs.
Cost of the peak load plant [Cent/kWh]
Tota
l cos
ts in
RT
ED
(Bill
ion
US$/
year
)
OGIMOTO lab., IIS, the University of Tokyo Copyright © 2017 Ogimoto Laboratory All Rights Reserved.
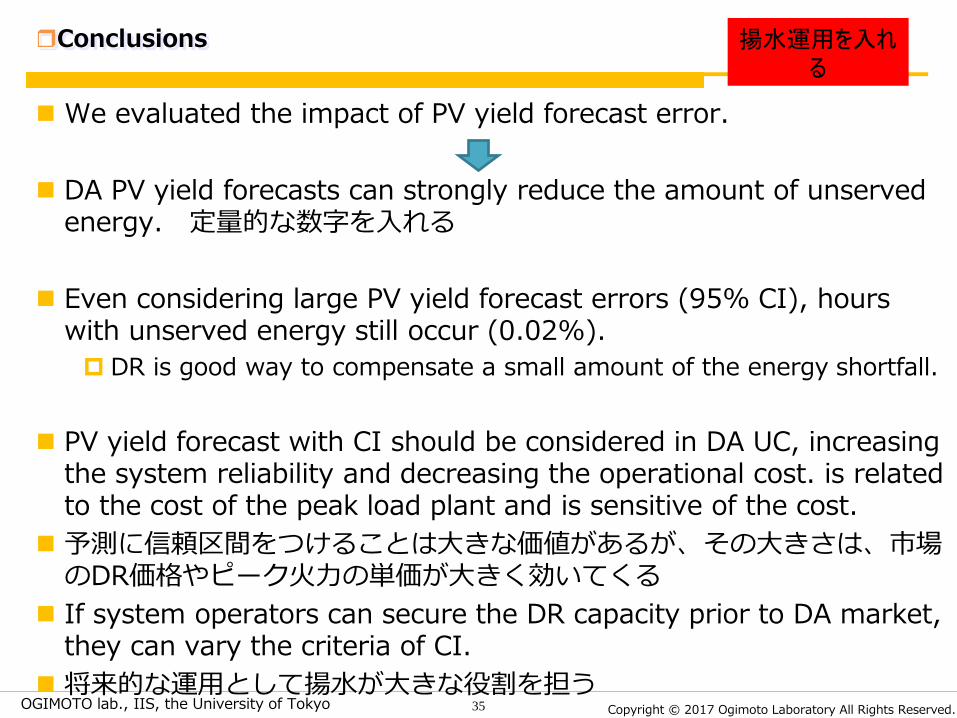
Conclusions
35
We evaluated the impact of PV yield forecast error.
DA PV yield forecasts can strongly reduce the amount of unserved energy. 定量的な数字を入れる
Even considering large PV yield forecast errors (95% CI), hours with unserved energy still occur (0.02%). DR is good way to compensate a small amount of the energy shortfall.
PV yield forecast with CI should be considered in DA UC, increasing
the system reliability and decreasing the operational cost. is related to the cost of the peak load plant and is sensitive of the cost.
予測に信頼区間をつけることは大きな価値があるが、その大きさは、市場のDR価格やピーク火力の単価が大きく効いてくる
If system operators can secure the DR capacity prior to DA market, they can vary the criteria of CI.
将来的な運用として揚水が大きな役割を担う
揚水運用を入れる
OGIMOTO lab., IIS, the University of Tokyo Copyright © 2017 Ogimoto Laboratory All Rights Reserved.
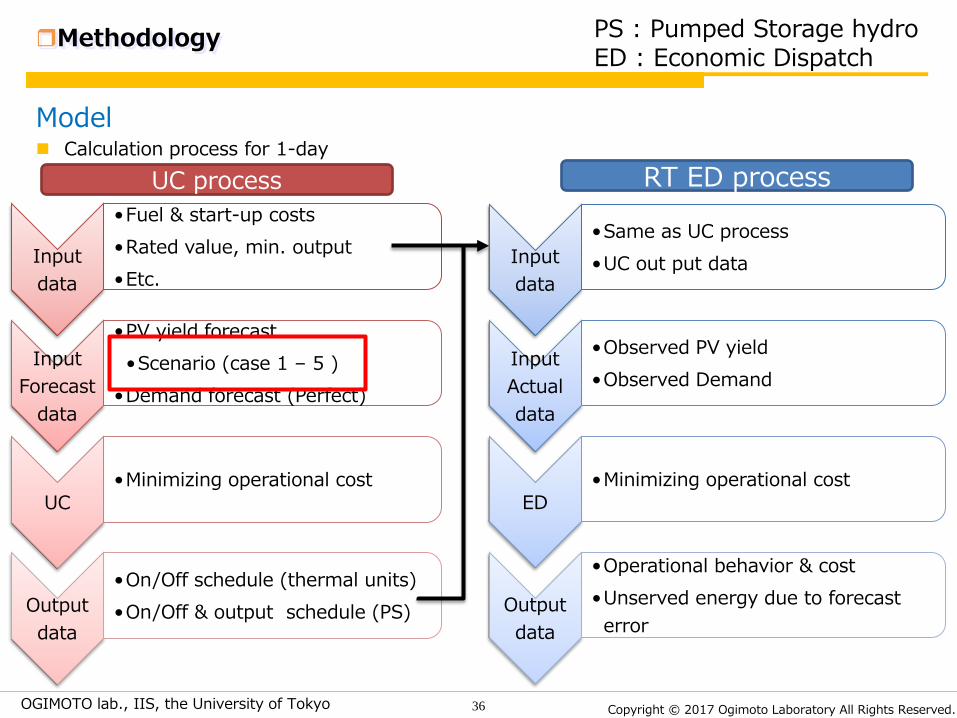
Model Calculation process for 1-day
Methodology
36
Input data
•Fuel & start-up costs •Rated value, min. output •Etc.
Input Forecast
data
•PV yield forecast •Scenario (case 1 – 5 )
•Demand forecast (Perfect)
UC •Minimizing operational cost
Output data
•On/Off schedule (thermal units) •On/Off & output schedule (PS)
UC process
PS : Pumped Storage hydro ED : Economic Dispatch
RT ED process
Input data
•Same as UC process •UC out put data
Input Actual data
•Observed PV yield •Observed Demand
ED •Minimizing operational cost
Output data
•Operational behavior & cost •Unserved energy due to forecast error