on frequency stability in the future renewable nordic...
TRANSCRIPT
On Frequency Stability in the Future Renewable Nordic Power System with
Gas Sector Integration
Jussi Ikäheimo (VTT) Juha Kiviluoma (VTT)
Contents
• Motivation – New reserve requirements in the Nordic system
• Frequency stability – Research methods – Results for a 100 % renewable scenario
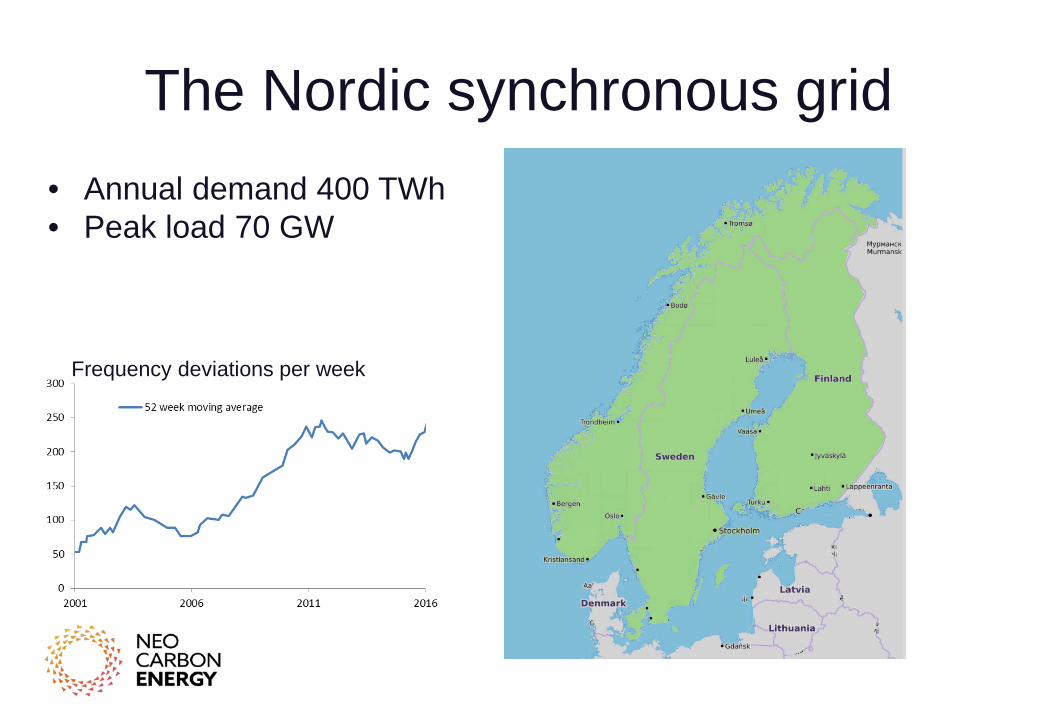
The Nordic synchronous grid • Annual demand 400 TWh • Peak load 70 GW
Frequency deviations per week
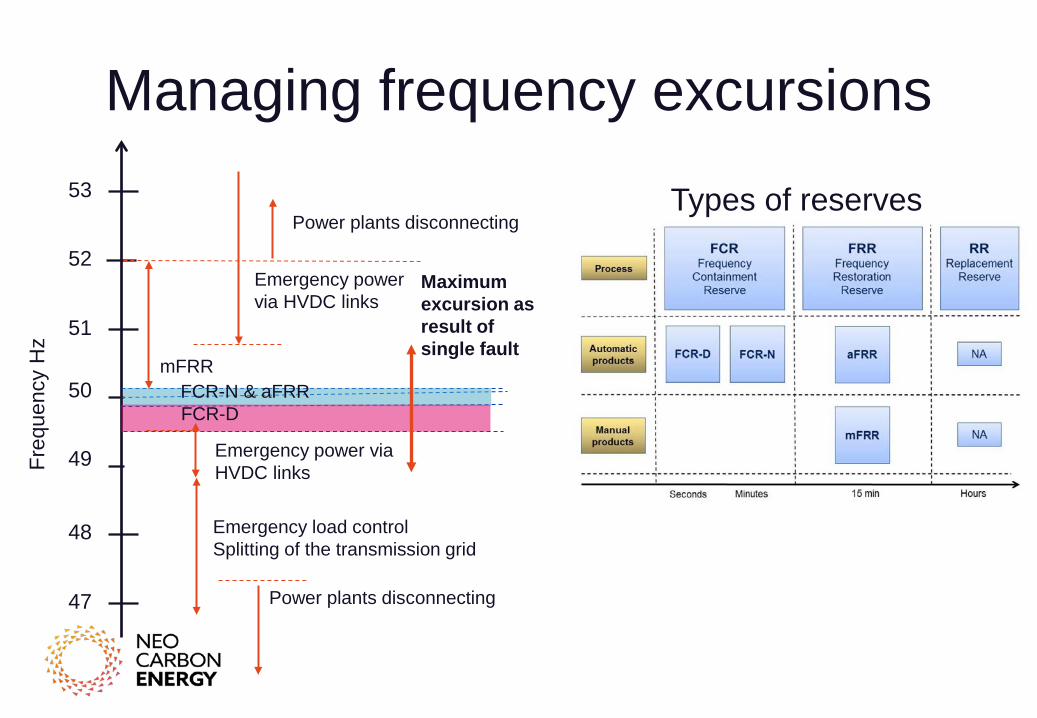
Managing frequency excursions
50
49
48
47
51
52
53
Emergency power via HVDC links
Emergency power via HVDC links
Power plants disconnecting
Power plants disconnecting
Emergency load control Splitting of the transmission grid
mFRR
FCR-D FCR-N & aFRR
Maximum excursion as result of single fault
Freq
uenc
y H
z
Types of reserves

Types of reserves in Nordic countries
(Source Fingrid Oyj)
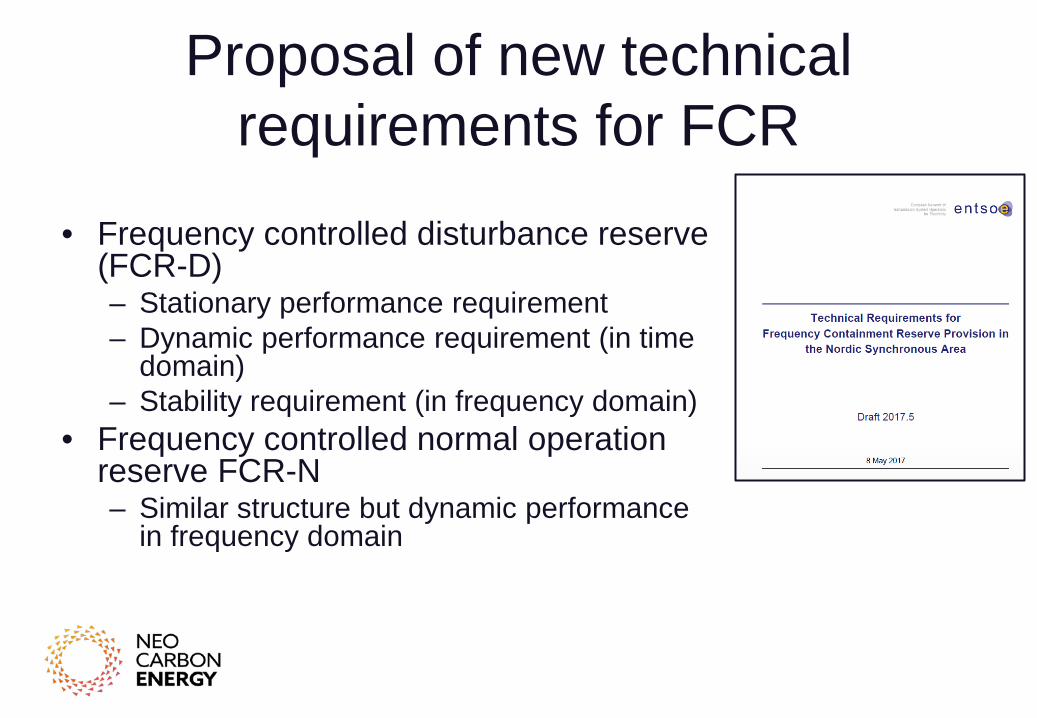
Proposal of new technical requirements for FCR
• Frequency controlled disturbance reserve
(FCR-D) – Stationary performance requirement – Dynamic performance requirement (in time
domain) – Stability requirement (in frequency domain)
• Frequency controlled normal operation reserve FCR-N – Similar structure but dynamic performance
in frequency domain

FCR-D dynamic performance • If specified energy
or power ramping requirement is not fulfilled, the paid capacity is penalized accordingly
𝐶𝐶𝑓𝑓𝑓𝑓𝑓𝑓𝑓𝑓 = 𝑚𝑚𝑚𝑚𝑚𝑚 ∆𝑃𝑃𝑠𝑠𝑠𝑠,∆𝑃𝑃5𝑠𝑠0.93
,𝐸𝐸5𝑠𝑠1.8𝑠𝑠

Methods

Workflow
0
20 000
40 000
60 000
80 000
100 000
120 000
140 000
ge
ne
rati
on
MW 1 natural gas
2 coal
3 wood
4 water
5 sun
6 wind
7 nuclear
Power system model
(Simulink)
Unit commitment
and economic dispatch
(Wilmar JMM)
Frequency nadir
Frequency rate of change
System set-up
Dimensioning incident
Capacity expansion simulation
Reserve requirement Plant scheduling
and reserves allocation
FCR-D 1500 MW 1400 MW
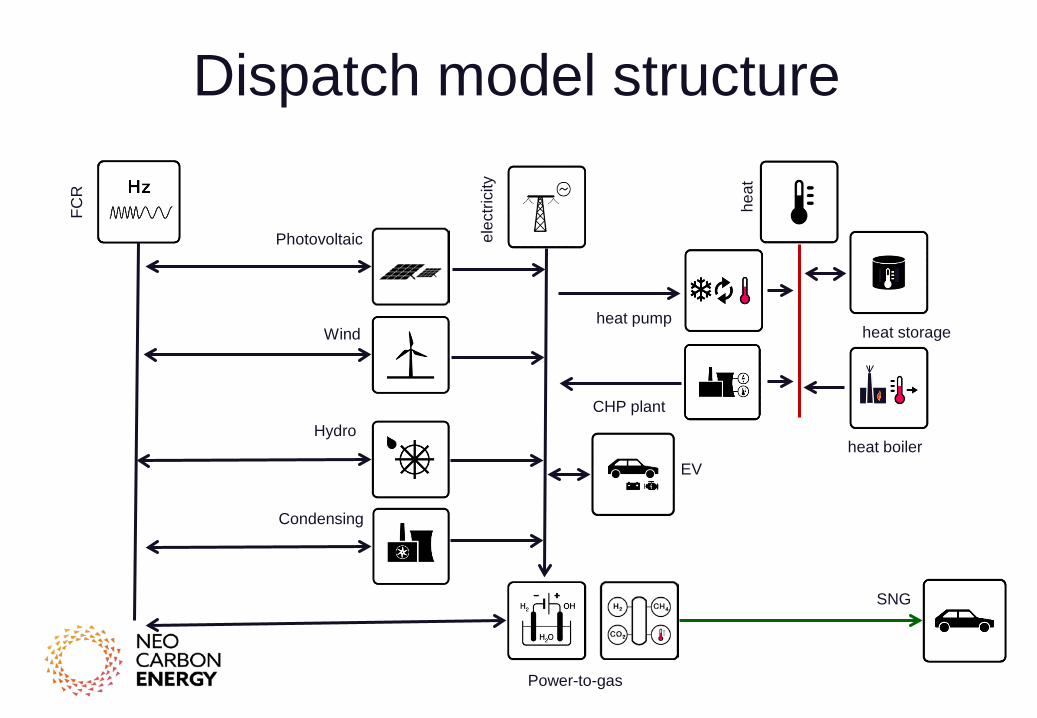
Dispatch model structure
heat pump
heat boiler
CHP plant
heat storage
elec
trici
ty
heat
Photovoltaic
Wind
Hydro
Power-to-gas
Condensing
EV
SNG
FCR

Dynamic plant models overview
Frequency measurement
Frequency measurement
Grid frequency
Governor model
Response model
Plant model
FCR-D
FCR-N
Power output

Dynamic plant models Plant Model type for FCR-D
Hydro plants The most common turbine model with water starting time TW = 1 s ; and gate servo delay Tg = 0.2 s
Steam & gas turbines
Based on the IEEEG1 model, with time constants for steam inlet and three boiler passes
Wind turbines Simplified model with consideration on blade pitching speed
PV plants First-order lag model with T1 = 1.5 s
Electrolysis First-order lag model with T1 = 2 s
Heat pumps First-order lag model with T1 = 2 s

Performance of the simulated plants
Plant type ΔP5s / ΔPss E5s / ΔPss Cfcrd / ΔPss
Hydro power plants 0.75 1.6 0.81
Steam and gas turbines 0.6 2.4 0.65
Wind turbines 0.97 2.6 1
PV plants 1.0 3.5 1
Heat pumps 1.0 2.8 1
Electrolysis plants 1.0 3.2 1
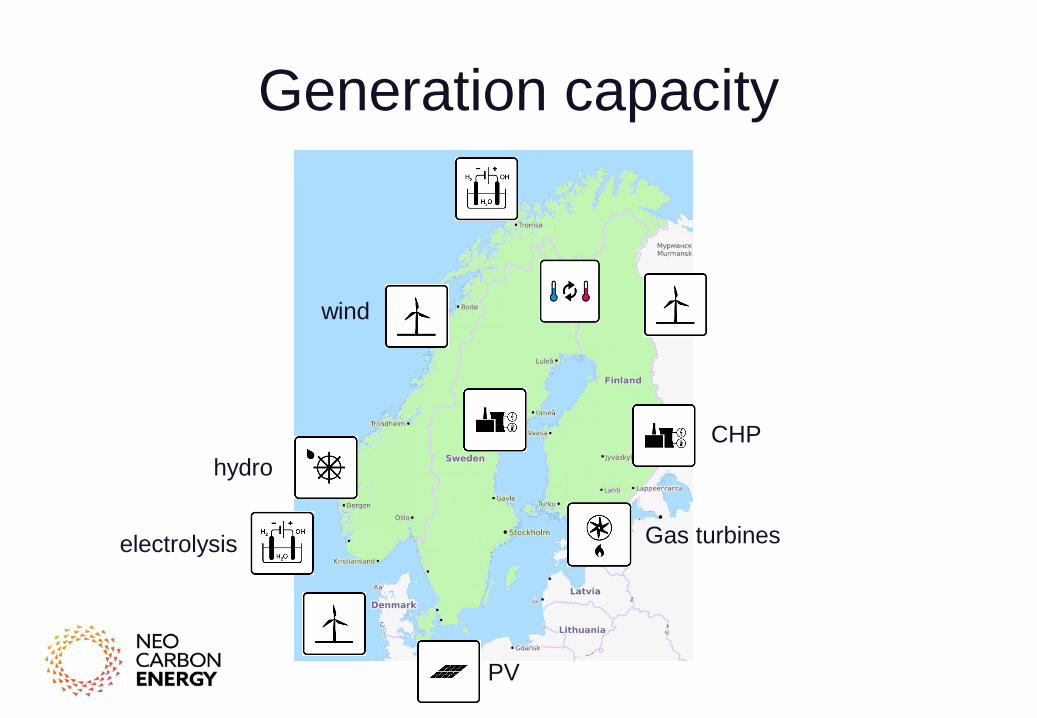
Generation capacity
wind
hydro CHP
electrolysis
PV
Gas turbines
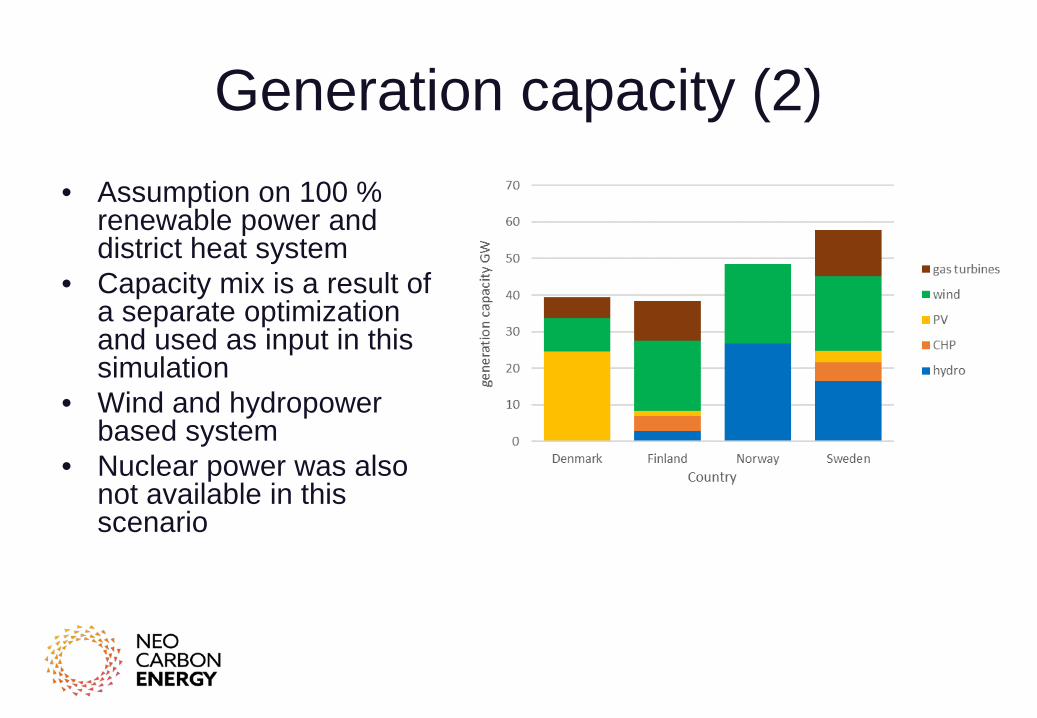
Generation capacity (2) • Assumption on 100 %
renewable power and district heat system
• Capacity mix is a result of a separate optimization and used as input in this simulation
• Wind and hydropower based system
• Nuclear power was also not available in this scenario
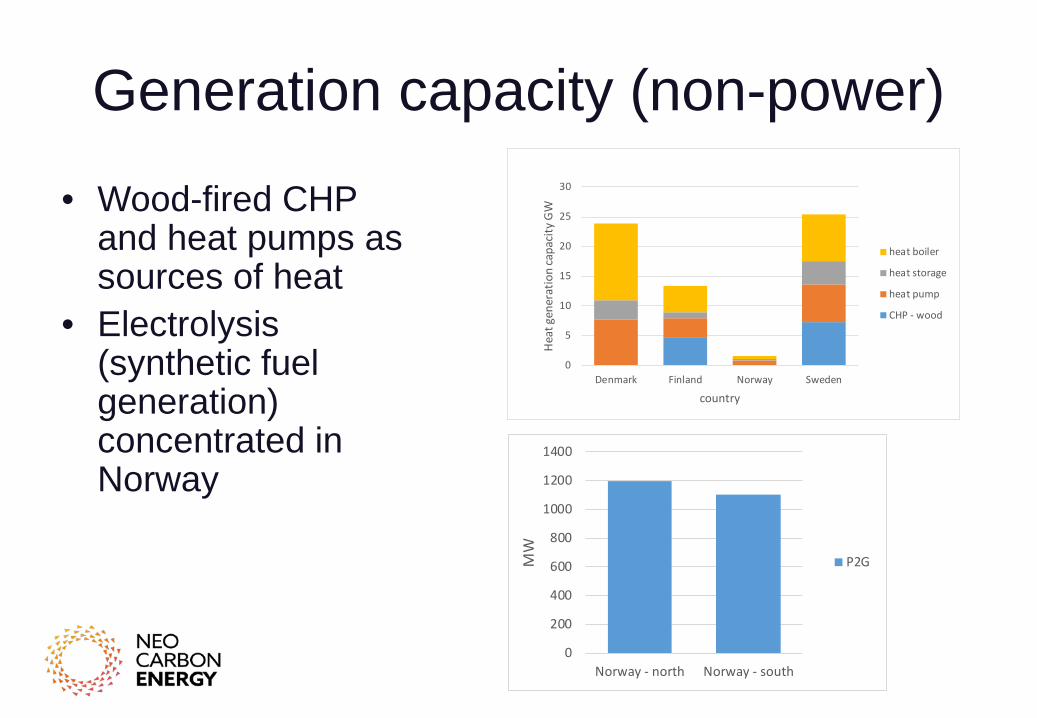
Generation capacity (non-power)
• Wood-fired CHP and heat pumps as sources of heat
• Electrolysis (synthetic fuel generation) concentrated in Norway
0
200
400
600
800
1000
1200
1400
Norway - north Norway - south
MW
P2G
0
5
10
15
20
25
30
Denmark Finland Norway Sweden
Hea
t gen
erat
ion
capa
city
GW
country
heat boiler
heat storage
heat pump
CHP - wood

Results
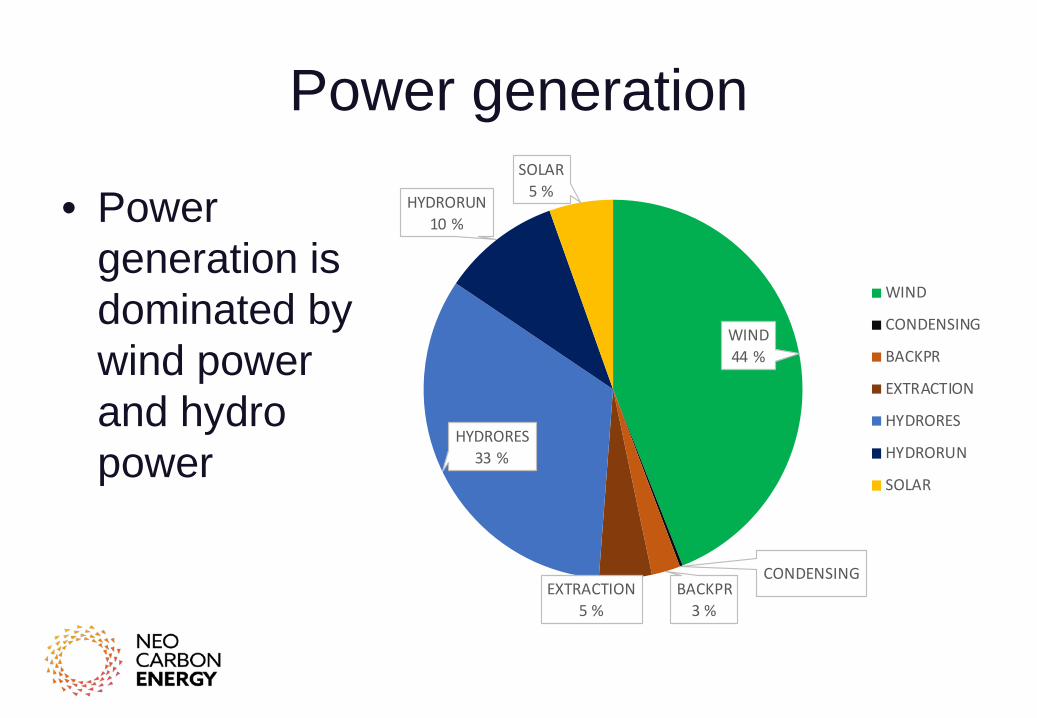
Power generation
• Power generation is dominated by wind power and hydro power
WIND44 %
CONDENSINGBACKPR
3 %EXTRACTION
5 %
HYDRORES33 %
HYDRORUN10 %
SOLAR5 %
WIND
CONDENSING
BACKPR
EXTRACTION
HYDRORES
HYDRORUN
SOLAR

System kinetic energy in the 100 % renewable case
• Minimum kinetic energy (40 GWs) half of previous ENTSO-E (2016) study
0
50
100
150
200
250
300
350
0 2000 4000 6000 8000
kine
tif e
nerg
y [G
Ws]
hours per year
ENTSO-E 2025
base 2050
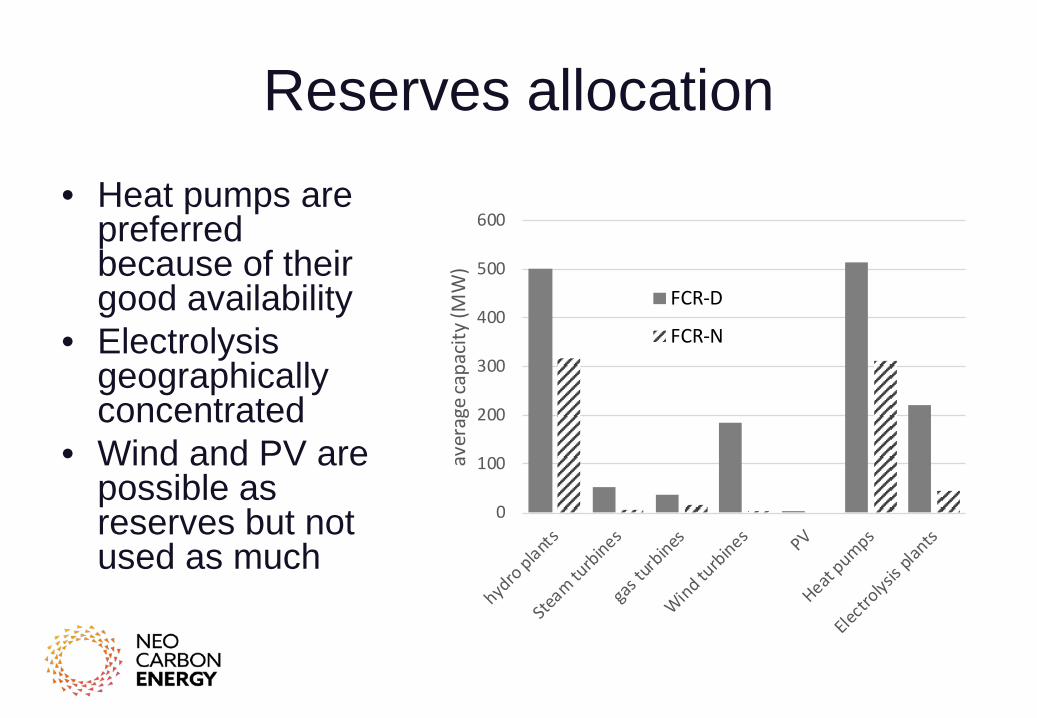
Reserves allocation • Heat pumps are
preferred because of their good availability
• Electrolysis geographically concentrated
• Wind and PV are possible as reserves but not used as much
0
100
200
300
400
500
600
aver
age
capa
city
(MW
)
FCR-D
FCR-N

Frequency nadir
48.8 49 49.2 49.4 49.6 49.8
Frequency nadir Hz
0
1000
2000
3000
4000
Hou
rs p
er y
ear
49.2 49.25 49.3 49.35 49.4 49.45 49.5
Frequency nadir Hz
0
1000
2000
3000
4000
5000
6000
Hou
rs p
er y
ear
0 50 100 150 200 250 300
Kinetic energy GWs
0.4
0.5
0.6
0.7
0.8
0.9
1
Freq
uenc
y dr
op H
z
0 50 100 150 200 250 300
Kinetic energy GWs
0.45
0.5
0.55
0.6
0.65
Freq
uenc
y dr
op H
z
Base case Wind inertia

Conclusion • 100 % Renewable Nordic power and heat sector modeled with new
reserve requirements • There was a considerably drop in the system kinetic energy minimum • Wind and solar power play only a small role in FCR-D • Single fault (1400 MW) lead to violation of the lowest allowed frequency
bound of 49.0Hz during 7 hours of the year – Increase of FCR-D to 1500 MW total was assumed
• When synthetic wind inertia was included, no violation of the allowed frequency bound took place
• Loads and EV’s were not considered as providers of FCR-D

Thank you