impact of natural resources on economic growth of transition countries: cis case … · ·...
TRANSCRIPT

~Jiss Institute of Social Studies
Graduate School of Development Studies
IMPACT OF NATURAL RESOURCES ON ECONOMIC GROWTH OF TRANSITION COUNTRIES: CIS CASE
A Research Paper presented by:
IRMA ALPENIDZE (GEORGIA)
In Partial Fulfillment of the Requirements for Obtaining the Degree of:
Master of Arts in Development Studies Specialization:
ECONOMICS OF DEVELOPMENT
Members of the Examining Committee: Dr S. Mansoob Murshed
Dr Howard Nicholas
The Hague, December 2003
This document represents part of the author's study programme while at the Institute of SocialStudiesi the views stated therein are those of the author and not necessarily those of the Institute.
Research papers and theses are not made available for outside circulation by the Institute.
Enquiries:
Postal Address: Institute of Social Studies P.O. Box 29776 2502 l T The Hague The Netherlands
Telephone: +31-70-4260460 Telefax: +31-70-4260 799 email: [email protected]
Location: Kortenaerkade 12 2518 AX The Hague The Netherlands
ii

TABLE OF CONTENTS
ACKNOWLEDGMENTS ................................................................................................ IV
ABBREVIATIONS ........................................................................................................ V
LIST OF CHARTS AND TABLES ..................................................................................... VI
CHAPTER 1. INTRODUCTION ........................................................................................ 1
1.1. RATIONALE FOR STUDy ........................................................................................................................................................ 1 1.2. HYPOTHESIS AND CONTENTS OFTHE PAPER .................................................................................................................. 3 1.3. METHODOLOGY AND LIMITATIONS OFTHE STUDy ....................................................................................................... 3
CHAPTER 2. THE PERFORMANCE OF THE NATURAL RESOURCE-DRIVEN ECONOMIES: A REVIEW OF THEORIES ................................................................................................ 5
2.1. INTRODUCTION ....................................................................................................................................................................... 5 2.2. DIRECT LINKS: FROM NATURAL RESOURCE ABUNDANCE TO GROWTH COLLAPSE ............................................ 6 2.3. INDIRECT LINKS: THE CURSE OR BLESSING DILEMMA OF NATURAL WEALTH? .................................................. 7 2.4. CONCLUSION ......................................................................................................................................................................... 12
CHAPTER 3. PRESENTATION OF THE CASE STUDY: ECONOMIC PERFORMANCE OF CIS COUNTRIES ............................................................................................................ 14
3.1. INTRODUCTION ..................................................................................................................................................................... 14 3.2. DIVERGENCE IN TRANSITION: HOW AND WHY CIS COUNTRIES DIFFER FROM OTHERS? ............................ 14 3.3. CONCLUSION ......................................................................................................................................................................... 23
CHAPTER 4. THE IMPACT OF NATURAL RESOURCES ON ECONOMIC GROWTH:/EMPIRICAL STUDIES ................................................................................................................ 24
4.1. INTRODUCTION ..................................................................................................................................................................... 24 4.2. How DO EMPIRICAL STUDIES REFLECT THE NATURAL WEALTH IMPACT HYPOTHESIS? ................................ 24 4.3. WHAT DO STUDIES OF NATURAL RESOURCE IMPACT ON TRANSITION ECONOMIES EXHIBIT? .................... 29 3.4. CONCLUSION ......................................................................................................................................................................... 31
CHAPTER 5. TESTING THE PREDICTIONS OF THE THEORIES AND EMPIRICAL STUDIES ........ 32
5.1. INTRODUCTION ..................................................................................................................................................................... 32 5.2. METHODOLOGY AND MEASURES ....................................................................................................................................... 32 5.3. TESTING THE CHANNELS .................................................................................................................................................... 34 5.4. CONCLUSION ......................................................................................................................................................................... 39
CHAPTER 6. POLICY IMPLICATIONS AND CONCLUSIONS ................................................. 41
ANNEXES ............................................................................................................... 44
BIBLIOGRAPHy ........................................................................................................ 61
iii


ACKNOWLEDGMENTS
My thanks are firstly due to my supervisors: Dr. Mansoob Murshed for the comments and
support he has been offering throughout the research and Dr. Howard Nicholas, for the
knowledge, inspiration and motivation I got from him.
In the most difficult stage of this project I received the guidance and feedback from my
teachers. I want to express my special gratitude to Dr. Arjun Bedi and Admasu Shiferaw for
being kind and patient enough to listen to my enquiries into the subject and provide extremely
welcome advice. My special thanks to Dr. Max Spoor for his wise notes and help in obtaining
the data.
My thanks are also due to my friends and fellow students for the support I have received from
them. I am grateful for the encouragement my friend George was giving me, which kept my
spirit strong. Discussions with Linh and Connie have helped me to improve my research. I am
very grateful to my dear friend Dana for her sobering remarks and contribution to my
maintaining of sanity.
Finally, I want to express my gratitude to my partner David for his love and always being there
for me.
iv

ABBREVIATIONS
BEEPS
CEE
EBRD
EDA
EIU
FSU
GDF
GDP
ICRG
IFIs
ILO
IMF
LCU
LDC
SITC
UNCTAD
USSR
WB
WDI
WTO
- Business Environment and Enterprise Performance Survey
- Central and Eastern European
- European Bank for Reconstruction and Development
- Exploratory Data Analysis
- Economist Intelligence Unit
- Former Soviet Union
- Global Development Finance Database
- Gross Domestic Product
- International Country Risk Guide
- International Financial Institutions
- International Labour Organisation
- International Monetary Fund
- Local Currency Units
- Less Developed Countries
- Commodity Indexes of Standard International Trade Classification
- United Nations Committee of Trade and Development
- Union of Soviet Socialistic Republic
- World Bank
- World Development Indicators Database
- World Trade Organisation
v


LIST OF CHARTS AND TABLES
TABLES
Table 1.1
Table 3.1
Table 3.2
Table 3.3
Annex 3.1
Annex 3.3
Annex 3.4
Annex 3.5
Annex 3.6
Annex 3.7
Annex 4.1
Annex 4.2
Annex 4.3
Annex 5.1
Annex 5.2
Annex 5.5
Annex 5.6
CHARTS
Chart 3.1
Chart 3.2
Chart 3.3
Chart 3.4
Chart 3.5
Chart 3.6
Chart 5.1
Chart 5.2
Chart 5.3
Chart 5.4
Chart 5.5
Chart 5.6
CIS Mineral Resources
Inflation and GDP in 1992 for selected countries
CIS GDP Growth Index (1989=100)
CIS External Debt Data
Selected Indicators for CEE, Baltic and CIS Countries
CIS GDP Per Capita Growth (Annual % Change)
CIS GDP Sectoral Composition Change, 1990-2001
Sectoral Distribution of Labour Force (% of Total Employment) for CIS Countries,
Averages for 1990-1992 and 1998-2000
Sources of classification of labour force sectoral distribution
Educational Composition of Unemployment in CIS countries
Classification of Commodity Groups based on Commodity Codes of the Standard
International Trade Classification (SITC), rev.3.
Shares of Commodity Groups in Export for CIS countries (in %), 1992-2001
Shares of Commodity Groups in GDP for CIS countries (in %), 1992-2001
Real Exchange Overvaluation/Undervaluation Computations for PPG Countries1
CIS countries grouped according to commodity shares in exports, 1992-2001
Governance Definition and Its Indicators
Regression Results
GDP Growth and Inflation for CEE and CIS countries, 1989-2000 (annual % change),
group average
CIS and CEE/Baltic GDP Growth Index (1989=100), based on data in LCU
GDP Composition Change (% of GDP), Average CIS
Capital Formation, Savings and FDI Dynamics (% of Total), CIS Average
Changes in Shares of Commodity Groups in CIS Exports, Average 1992-2001
Changes in Shares of Commodity Groups in CIS GDP, Average 1992-2001
Plot of Share of Natural Resources in Exports against GDP per capita Growth, Average
1992-2001
Plot of Share of Natural Resources in GDP against GDP per capita Growth, Average 1992-
2001
GDP Growth Index, CIS Countries (1989=100), Agriculture; Fuels, Ores and Minerals and
Manufacture Products Group Average
GDP Growth Index, CIS Countries (1989=100), Primary Products and Manufacture
Products Group Average
Plot of Share of Natural Resources in Exports against Real Exchange Rate Overvaluation,
Plot of Share of Natural Resources in GDP against Real Exchange Rate Overvaluation,
average for 1995-2001
1 Weig hs are aSSigned on a trade weighted basis
vi

Chart 5.7
Chart 5.8
in 2000
Chart 5.9
Chart 5.10
Chart 5.11
Chart 5.12
Chart 5.13
Annex 3.2
Annex 5.3
Annex 5.4
Plot of Real Exchange Rate Overvaluation against GOP Growth, average for 1995-2001
Plot of Share of Natural Resources in Exports, 1992-2000 against Control of Corruption
Plot of Share of Natural Resources in GOP, 1992-2000against Control of Corruption in
2000
Plot of Control of Corruption in 2000 against GOP Growth, 1992-2000
Plot of Share of Natural Resources in Exports against Decrease in TSER, Average 1995-
1997
Plot of Share of Natural Resources in GOP against Decrease in TSER, Average 1995-1997
Plot of Decrease in TSER, Average 1995-1997 against GOP Growth in 2001
CIS GOP Growth Index (1989=100), by Country
Agriculture Product Based Group GOP Sectoral Composition Change, 1990-2001
Fuel and Mineral Based Group GOP Sectoral Composition Change, 1990-2001
vii

CHAPTER 1. INTRODUCTION
1.1. Rationale for Study
In the process of transition2, trying to recover from the economic crises after the collapse of
Soviet Union, many of the Commonwealth of Independent States (CIS)3 countries have
become more natural resource dependent. Consequently, IFIs recommended macroeconomic
policies consistent with the patterns of volatile growth performance characteristic to most
resource-rich countries: prudent fiscal, monetary and trade policies. The implications of the
recommended policies, especially those emphasising the liberalisation of international trade,
capital and natural resource markets can be crucial for the development perspectives of those
countries. Hence, the soundness of theoretical underpinnings and the extent of its applicability
to transition economies becomes an important and interesting matter to scrutinise.
To start with, the meaning of the term "natural resources" shall be explored. The literature
studying natural resources builds on the term in the sense given by the World Bank Institute's
Development Education Program definition of natural capital, i.e. all "gifts of nature"- air, land,
water, forests, wildlife, topsoil, minerals - used by people for production or for direct
consumption, excluding the ones that cannot be stocked (such as sunlight) or be used in
production (such as picturesque landscapes) (World Bank, 2003). Consequently, empirical
studies of those resources focus on output of agriculture (including forestry and fishing) and
mining (and quarrying) sectors. From the very beginning, the literature on natural resources
has used the term "primary product" to refer to many of above- mentioned sectors, whereas
after the oil shocks of the 1970's a further distinction was made by classifying resources into
agricultural and mineral ones. The terminology then changed to diffused (i.e. where
production/revenue of resources is concentrated, e.g. diamonds, oil, coffee-cocoa) and point
source (i.e. where production/revenue is diffused, e.g. fertile soils, grazing lands, fisheries)
resources (Auty, 1997, Isham et ai, 2002).
Furthermore, following the existing theoretical and empirical studies, this paper uses the terms
"natural resource abundant", "natural resource dependent", "resource-rich", and "with natural
wealth" interchangeably to denote the high share of natural resources in the production and
export structure of the economy. In the same vein, the terms "retardation", "collapse" and
"poor" economic growth are used interchangeably to denote the long run worsening of
economic performance of the country, i.e. lower economic growth, greater cyclical fluctuations
in national income trends, etc.
2 The term transition denotes the process that postsoclalist economies undergo from a planned to a market based economic system
3 CIS was created In 1992. Today its members are Azerbaijan, Armenia, Belarus, Georgia, Kazakhstan, Kyrgyz Republic, Republic of Moldova,
Russian Federation, Tajikistan, Turkmenistan, Ukraine and Uzbekistan (12 FSU countries)
1

According to these studies, most countries heavily endowed with natural resources or at least
reliant on natural resources as their main export have done badly, especially the point-source
ones. According to Murshed (2003), only six (or 7 if Oman is included)4 point-source
economies have real per-capita income growth rates that exceed 2.5% per annum on an
average between 1965-995, out of which only two, Botswana and Indonesia have high growth
rates of over 4%. If Malaysia is included as a point-sourced economy too (even though her
1985 and contemporary export pattern suggests that it is diffused and a manufacturing
exporter respectively), in the developing world there are only three point-sourced success
stories. Similarly, studies of resource-rich transition economies emphasise the high probability
of long-run growth collapse for them.
CIS countries are interesting in this perspective due to the increased possibility for them to be
providers of resources for the Western energy and raw material markets and a profitable
investment opportunity. Indeed, after the collapse of Soviet Union, the rich energy resources
of some FSU countries (see table 1.1.) have became a subject of multilateral agreements and
a major source of FDI in the region (Levine and Wallace, 2000). As we see, at least five of
them (Azerbaijan, Kazakhstan, Russia, Turkmenistan and Uzbekistan) are fairly rich in natural
resources.
Table 1.1. CIS Mineral Resources
Proven Crude Proven Crude Natural Gas Natural Gas
Country Oil Reserves Oil Reserves Reserves Reserves Main Source of Mineral-Based
(Million (% of World (Trillion (% of World Production and Exports Barrels) Total) Cubic Feet) Total}
Armenia minimal minimal minimal minimai Perlite
Azerbaijan 7,000-12,000 0.6 -1.0% 30 0.5% Oil and Gas (pipelines through Russia and Georaia)
Belarus 0,2 minimal minimal minimal Potash
Georgia 35 minimal 0.3 minimal Transit of oil and gas
Kazakhstan 9,000 0.7% 65 1.2% Oil and gas through China and Russia
Kyrgystan minimal minimal minimal minimal Antimony, Mercury and Gold
Moldova minimal minimal minimal minimal Steel
I n CIS the biggest producer and exporter of mineral products (14%
of the world's total mineral Russia 60,000 4.9% 1,680 30.5% extraction), owner of the main
pipeline system from Caspian countries and herself to the
western markets
Tajikistan minimal minimal minimal minimal Aluminium and gold
Turkmenistan 0,55 minimal 71 1.3% Gas, chemicals, salt
Ukraine 0,4 minimal 39,6 0.7% Ferrous metals
Uzbekistan 0,6 minimal 66,2 1.2% Gold, non-ferrous metals, self-sufficient fuel minerals
% of World Total 1,213 6.4-6.9% 5,457 35.5% -
Source: Energy Information Administration ( www.eia.doe.govfur 1/01/03), Research of Levine and Wallace (2000)
and Economist Intelligence Unit Country Reports
4 Oman had a 5 % growth rate of per-capita income between 1965-99. It is not usual to include Oman in a list of developing countries, due to its
size. Libya and Kuwait have data problems, but the data we have clearly suggests they are growth failures.
5 These are Botswana, Chile, the Dominican Republic, Indonesia, Egypt and Tunisia.
2

1.2. Hypothesis and Contents of the Paper
As mentioned, the development strategies put forward by IFIs have their foundation in the
part of theoretical work and empirical studies on the impact of natural resources on economic
performance, which emphasise the high probability of growth retardation of the natural
resource dependent economies through different mechanisms. The same conclusions are
drawn from the studies on natural resources impact in transitional countries. However, the
relevance of these studies, as well as the plausibility of their predictions can be questioned on
the grounds of the turbulent nature of the transition, consistence of the logic of theoretical
argument, etc. Therefore, the current study attempts to inquire into the theoretical and
empirical findings on natural resource impact in transition economies, find how relevant the
alleged mechanisms and possible outcomes are and draw conclusions on policy implications for
the resource abundant CIS countries.
In line with that purpose, the paper will depart with the analysis of the existing theories
studying the impact natural resources have on growth, which will be presented in chapter two.
Furthermore, chapter three will look into the specific character of the dynamics of transition
economies by exploring the relevant studies on both the general level and CIS in particular.
Chapter four will discuss the findings of the studies on natural resource impact on transitional
economies, followed by chapter five, where these claims will be tested. Finally, chapter six will
conclude the study and sketch out policy measures that can be taken to avoid the possible
unfavourable effects of resource dependency in resource-rich CIS countries.
1.3. Methodology and Limitations of the Study
The paper builds on the critical overview of the theories and empirical findings, identifying and
testing the channels of natural resource impact on the economic performance of the CIS
countries by contrasting the performance of those basing their production/exports on natural
resources with the ones where the economy is mainly dependent on manufacture sector.
The data used in this paper comes from an array of sources. This is due to the data problems
in the transition countries, especially in early years. Among the reasons behind it are:
peculiarity of soviet accounting, the only statistics for the FSU countries performance before
the year 1992; the difficulties in measuring inflation and employment; over- and under
reporting of the output (De Melo et ai, 1997); unrecorded activities from the informal sector
making a difference due to its size (Campos and Coricelli, 2002). As a result, inconsistency and
incompleteness of the data makes it difficult to be interpreted over time. Therefore, as it was
mentioned, the statistics used in the present paper are compiled using different sources. To
maximise the consistency, the trade and inflows data is mainly derived from the UNCTAD
3

database, labour statistics from ILO database and most of the other variables from the WOl,
2003. Information for the GDP and labour sectoral decomposition for 1990-1995 years is taken
from CIS Handbook of Statistics. The information is compiled only in case of consistency with
earlier or later years from the EIU country reports. The additional caveat is that for some
countries there is no data available for various years, such as sectoral composition of labour
force for Central Asia countries of CIS for 1999-2002. The worst data problems are
encountered in the Turkmenistan (which stopped reporting its performance in 1999), which is
the reason behind its exclusion from some of the tests. However, keeping in mind the existing
problems, the present collection makes possible to use the data for analysis (the omissions are
reported in all cases).
4
CHAPTER 2. THE PERFORMANCE OF THE NATURAL RESOURCE-DRIVEN ECONOMIES: A REVIEW OF THEORIES
2.1. Introduction
The question of why some countries are rich and others poor has been the main concern of
economic theory as far back as classical economics. Even to this day no consensus exists on
the subject. In answering this question, one group of theories assigns some role to natural
resources. This perspective has a long history with diverse views on both the mechanisms and
implications of the natural wealth on growth. Auty et al (2001) divides studies of natural
resource impact on economic performance into those that outline exogenous and internal
explanations of divergent performance of resource-rich in contrast to resource-poor countries.
Other works such as that of Findlay and Lundahl (1999) group theories into ones
elaborated/supported by Interventionists, Neoclassical and Marxist/Dependency schools of
thought. Murshed (2002) on the other hand, focuses on the range of studies from the ones
portraying the onset of resource curse6 hypothesis to the ones sketching conditions where
resource booms can aid growth. The work of Isham et al (2002) outlines works influenced by
the political and economic schools of thought; and Stevens (2003) provides an overview of
studies from a historical perspective. In this paper, theories on resource abundance impact on
economic growth will be grouped into two broad categories. First are those that emphasise the
direct links between natural wealth and economic performance. Second are those that
highlight the natural resource impact on factors which in turn influence economic growth
(indirect links 7). An important distinction is that the former p-edicts growth collapse on the
long runs whereas the latter sees ways to avoid it. Since the empirical and theoretical studies
of natural wealth on economic performance in transition countries concentrate on the second
group, the paper will elaborate more on it.
The objective of this chapter is to depict the main features of both groups of theories. It is
organised as follows. First, the role assigned to the natural resources in theories of growth will
be outlined for both groups. Second, conclusions will be drawn by emphasising on policy
implications of them.
6 Term resource curse stands for the negative relationship between natural wealth and economic performance
7 Also referred to as transmission mechanisms (Stevens, 2003) and channels (Gylfason, 2000, others)
S This prediction is referred to as resource curse
5

2.2. Direct links: From Natural Resource Abundance to Growth Collapse
One distinct group of theories (hereafter referred to as (Neo) Liberal) puts emphasis on the
direct link between natural resource abundance and economic growth, basing its arguments on
the belief that the main problem with the performance of developing countries is imbalances in
factors of production, i.e. the mix of surplus labour but shortages of capital. Attracting the
latter is therefore seen as a key goal to pursue by, among other things, exploitation of the
natural resources. According to the "staple" theory of growth, capital shortages could be
overcomed by attracting foreign firms to exploit developing countries' natural resources,
consequently reinvesting profits in processing industries and building local infrastructure
(Innis, 1956; Watkins, 1963).
In a similar manner, the "big push" theory of economic development suggests that, for
developing countries to escape the low-income "equilibrium traps", they need a large
expansion in demand to encourage firms to invest in industrialisation. The "big push" required
can also come from large revenue streams accruing to an economy from the natural resou rce
exports (Rosenstein-Rodan, 1943; Murphy et ai, 1989). Since natural resources are seen as a
source of capital and foreign exchange, the poor economic performance of resource-rich
countries is explained by the lack of liberalisation of both capital and goods markets, which
would allow for the exploitation of the above- mentioned opportunities (Bauer and Yamey,
1957; Lal, 1983; Lal and Myint, 1996; Viner, 1953).
It is important to mention that the (Neo) Liberal view is based on the doctrine of comparative
advantage, i.e. the benefits to be obtained from concentration of efforts in producing of goods
which can be manufactured cheapest due to natural endowments in land, skilled and unskilled
labour and capital, criticised by scholars that follow the Structuralist/Dependency and Marxists
Schools.
Another group of theories (hereafter referred as Dependency) builds its argument on the
Terms of Trade theory (Myrdal, 1956; Prebisch, 1950; Singer, 1950,). The theory contradicts
the classical belief that gains from technological progress of the industrial based countries will
be distributed to the primary sector based ones withOlJt any vigorous industrialisation policy
(Singer, 1998). Further, the theory rests on the Structuralists view that the limitations in
output expansion in natural resource/primary product sectors results in the lack of investable
funds in LDCs. From its side, this is caused by the low income elasticity of demand from
primary products, consequently resulting in a fall of their prices on the long run. Therefore,
primary product exporters (the periphery) find themselves disadvantaged in trading with the
industrialised countries (the centre). Thus, the whys and wherefores of the economic
underperformance of resource-dependent countries is the secular tendency of their terms of
6

trade to deteriorate. The hypothesis is related to the ongoing debate on the statistically
significant proves to support it: some works challenge the empirical basis of the argument
(Cuddington, 1985; Maizels, 1968; Mikesell, 1997) and some verify it (Brohman, 1996;
Sapsford, 1985; Sarkar and Singer, 1991).
Marxist theory explains the backwardness of resource-rich countries by associating the cases
of growth retardation with the nature of the global capital, which acts through economic
institutions of global governance in order to preserve and reinforce the existing international
division of labour, and consequently conditions the low profitability of natural resources
(Brewer, 1997). For its part, Marxist theory is based on the belief of the exploitative nature of
capital, which generates profits from the surplus labour of workers (Marx, 1957; Lenin, 1950).
In conclusion, theories emphasising direct links between natural resource dependence and
economic performance draw our attention to the inherent danger of growth collapse of
resource-rich countries due to the lack of liberalisation of markets, a secular deterioration of
the terms of trade of resource dependent economies and the nature of the global capital.
2.3. Indirect Links: The Curse or Blessing Dilemma of Natural Wealth?
In answering this question another group of studies emphasise the channels through which the
underperformance of resource-rich countries is taking place. They, in general, build on the
input of the "linkages" hypothesis that highlights the limited links that primary product exports
create within the economy as opposed to manufactured exports. For instance, the work of
Hirschman (1958) pOints out that while industrial activities are closely related to each other
and generate both forward and backward physical production linkages, natural resource
production does not. This is due to the fact that natural resource production has few linkages
to the rest of the economy hence why the term "enclave economy" was later coined regarding
resource dependent economy. Similar line of the argument is held in "export-based" theories
(Baldwin, 1956) that attribute growth retardation to the different staple production functions of
the South relative to the North. Namely, the South with capital-intensive production (e.g. in
mining) and a shortage of linkages to drive economic growth fails to create sufficient demand
for domestically produced goods, trapping the economy into staple production. In contrast,
with labour-intensive staple production (e.g. food grain) and diffuse linkages, the North
diversifies the economy and escapes the trap.
At later stage, other than physical production linkages have been displayed. They include
consumption and fiscal links inherent to the different degree in primary end manufacture
sectors (Hirschman, 1981). Consequently, more favourable linkages not only are attributed to
the industrial sector, but used to explain the different economic performance of diffused and
point-source resource economies. Indeed, the following studies stress higher domestic demand
7

for the own manufacture products in agricultural-product-based economies compared to
mineral-based ones, as a condition to counteract resource curse (Auty, 2001; Murshed, 2001).
Similarly, less developed fiscal linkages, characteristic to the primary sector, are used to
explain the growth collapse of resource-rich countries from the perspective of the political
economy. Namely, it is stressed that concentrated rent flows from the point-source resources
have the tendency to be directed away from productive activities compared to the rents from
diffused resources (Auty and Gelb, 2001).
With time, more channels have developed among which can be distinguished overvaluation of
real exchange rate, deterioration of human capital, weak public institutions/policies, armed
conflicts and increased levels of poverty and inequality. All of them question any automatic
negative causality from resource abundance to the growth collapse. At the same time, the
divergence performance of economies is seen as conditioned by the types of natural resources.
The real exchange rate channel
The real exchange rate overvaluation channel as a cause of poor performance of resource-rich
countries builds its arguments on the "Dutch Disease" theory 9 (Neary and Wijnbergen, 1986).
The theory draws attention to the long run growth collapse of economies experiencing windfall
inflows as a result of de-industrialisation of the existing manufacturing base. One source of
these inflows considered to be large revenues from a resource price boom. Based on the
assumption of the inflows translating into increased demand for goods and services10, the
theories predict real exchange rate appreciation 11, if no sterilisation measures are pursued. As
a result, first, the relative price of non-tradables to tradables 12 rises and second, both labour
and capital shift away from manufactured sector. From its side, it leads to de-industrialisation
and, consequently, growth failure. These effects are referred to as the spending and resource
movement respectively (outlined by Corden and Neary, 1982). The spending one is considered
to be a short term effect. Resulting from the real exchange rate appreCiation, it points out a
decrease of domestic prices of imports and a consequent increase of import expenditure. At
the same time, with an increase of domestic price of tradables, favourable conditions are
created for the imports of tradable competing goods to crowd out the manufacturing sector.
However, the collapse is not inevitable: the findings of the studies such as Murshed (2001)
9 Named after the phenomenon of the Dutch guilder appreciation as a result of the natural gas deposits discovery within the country's jurisdiction
in the North Sea in the late 1950s-early 1960s, which reduced the profitability of manufacturing and service exports.
10 Theory mostly considers infiows related to the aid and resource price boom as causing adverse effects whereas other inflows such as FDI are
considered to have positive effect on the economy. Perhaps the assumptions are that either FDI do not translate into spending or LDCs are far
form experiencing large enough FDI inflow to cause Dutch Disease
11 It is argued, that the real exchange rate appreciation takes place in both fixed and flexible rage regimes, through the rise of domestiC price
level and nominal exchange rate respectively
12 I n empirical studies, the tradable sectors are usually considered to be agriculture, mining and manufacturing ones, non-tradables being retail
trade, services, and construction non- tradable ones
8

emphasise the possibility to counteract the disease by right13 policies (here devaluation). On
the long run, as resource movement effect indicates, boost in labour- intensive non-tradable
sector relative to the capital-intensive tradable sector amounts in the decline of capital
accumulation (Rosenberg and Saavalainen, 1998), hindering the future prospects of economic
growth. Importantly, the prediction of the Dutch Disease theory on crowding out of traded
sector is also argued to be dependent on the type of natural resource economy, e.g. with
higher propensity to consume domestically produced goods (i.e. better consumption linkages)
diffused economies have more probability to avoid adverse effects of resource boolT'S
(Murshed, 2002).
The Human Capital Channel
Secondly, the cause of a negative relationship between natural resource boom and future
possibilities of growth is seen in reduced positive externalities (e.g. learning-by-doing) of the
manufacturing sector, which explores the interlinkages view further. The hypothesis is taken
up by Van Wijnbergen's (1984) two-period model in which tradeables productivity in the
~;!' second period depends on tradeables production in the previous one, Krugman's (1987) model
based on the increasing returns to scale and Sachs and Warner's (1995) endogehous growth
model, etc.
Learning by dong view builds on Human Capital theory (Birdsal et ai, 2001, Gylfason, 2000,
others), according to which the reason of the poor growth is related to the undeveloped human
capital, characteristic to the resource-abundant countries. This points out another channel of
growth retardation: decreased human capital. Here, the vicious circle is created by the
lowering demand for education due to deterioration of manufacturing sector (Matsuyama,
1992), further reinforced by the lack of incentives for skilled labour14 and the little investment
in human capital. Moreover, the concentration of rents in the government and business elites,
that increases inequality as well as incremented taxes that reduce private investment in
education, lock the economy in staple trap.
The Policy/Institutions Channel
Still, another stand is taken by the theories emphasising the importance of socio-economic and
political institutions 15 and policy decisions. Thus, Murshed (2002) and Stevens (2003) argue
13 By right/good policies these studies refer to the broad range of macroeconomic policies that "help to avoid problems related to the economic
performance and that lead to greater prosperity" (Meier and Stiglitz, 2001). According to Chang (2002) "good policies", broadly, mean those
prescribed by the so-calied Washington consensus such as restrictive macroeconomic policy, Iiberallsation of international trade and Investment,
prlvatisation and deregulation. Consequently, the opposite Is to denote "poor" policies.
14 Based on the assumption that worker's education raises the productivity of labour In manufacture, but not in the non-tradable sector. Since
people incur costs on education only If they expect to be employed In the manufacturing sector, with the shrinking tradable sector each
generation forgoing education and WJrking In non-tradable sector since price and market wage there is above the marginal value of product of
labour In manufacturing (Sachs and Warner, 1997). The result Is less skilled workers and teachers as time goes by.
15 Studies that emphasise on Indirect links between natural resources and economic performance build on the definition of Institutions by North
(1990). According to him, Institutions are "the humanly devised constraints that shape human Interaction". Starting from It, the Important
9

that the underperformance of resource-rich economies cannot be assumed a priori, but it is
rather a consequence of inappropriate policies, that are the product of poor institutional
settings. Easterly and Levine (2003) present evidence, based on cross-sectional econometric
analysis that, among other factors, natural resource endowments does retard economic
development but it works via institutions as measured by Kaufmann, Kraay and Zoido-L6baton
(2002). The conclusion is that institutions are paramount: all other effects, including policies
and policy changes, will not work except through institutions. In addition, the findings of
different studies are that the point-source as compared to diffused resources are more inclined
to have weaker institutional capacities (Woolcock et ai, 2001) and growth collapse (Murshed,
2001). This argument brings in another channel between the national wealth and economic
performance: weak public institutions and policy failures.
The institutions/policy view builds on inputs from social capital and political economy studies.
Social capital part is based on the so-called Olson effect (the constraining effect of the social
groups on economic growth). It points out that social cohesion 16 (civic social capital), the
weakness of which is determined, among other things, by natural resource endowment,
positively affects the quality of public institutions and thus, triggers poor economic
performance (Ritzen, 2000). Inputs from political economy theories result in a distinction
between benevolent (i.e. directing the rents towards social welfare maximisation, investment
in infrastructure and human capital) and predatory (i.e. promoting rent-seeking, lobbying and
uncompetitive industrialisation and hence, misallocation of the resource revenues) states (Auty
and Gelb, 2001). In this case, the resource-rich states (especially those with point-source
resources) are more inclined to be predatory, leading to difficulties in improving the poor
growth performance. Namely, since natural resource rents are easier to capture in comparison
to returns from the investments, in circumstances where the state authorities control the
extraction of natural resources (especially true for point-source ones) the possibility to capture
the rents from them leads to: a) development of corruption and inefficient bureaucracies
(Gelb, 1988); b) state-led policies as import protection (Sachs and Warner, 1997); c)
inefficient exhaustion of the public good through competition over the rents (Murshed, 2002)
and d) waste of the rents through spendthrift investments or inappropriate consumption17
(Lane and Tornell, 1995). From its side, each of the outcomes is detrimental for the growth
(Auty, 1994; Bhagwati, 1982; Mauro, 1995).
institutions for those studies are the socio-political arrangements of redistribution of the national wealth and the capacity of social groups for
mobilisation and coordination of their action for change (i.e. support the creation of the institutions favouring the market-type economy). Chang
(2002) reveals that "good" institutions, in this sense, include democracy, 'good' bureaucracy, an independent judiciary, protected private property
rights, transparent and market-oriented corporate governance and financial institutions. However, the meaning of term differs for the "old"
institutional economists that use it to indicate the arrangements that enforce the interests of a class (Meier and Stiglitz, 2001).
16 Social cohesion Implies a state of affairs In which a group of people demonstrate an aptitude for collaboration that produces a climate for
change
17 Such as so called white elephants, i.e. investment projects with negative social cost
10
The Armed Conflict Channel
Studies that emphasise on armed conflict channel of growth deterioration of resource-rich
countries follow the same line of argument as rent seeking ones. They find the positive
correlation between the resource-dependence and risk of the conflict (Collier and Hoeffler,
2000), that builds on the notion of 'loot-seeking' wars versus 'justice-seeking' wars. The
former is based on greed or self-serving behaviour and the latter on grievance or justice
seeking behaviour. In the greed-driven conflicts case, probabilities of rebellious movements
increase with the availability of lootable income such as rents from the natural resources. Ross
(2001b) finds as much as nine ways for the natural wealth to initiate and influence the civil
war, among which the greed and grievance together with the predation are grouped into ones
increasing incidence of war, others - into influencing the duration and intensity of it. As for the
relationship between conflicts and economic growth, studies point out two-way effect. First is
the unfortunate path-dependence on reconstruction of highly distorted 'post-conflict'
economies (Addison and Murshed, 2001). Second is the view that economic growth reduces
the incentive to be involved in armed conflicts (Collier and Hoeffler, 2001).
The Poverty/Inequality Channel
Armed conflicts argument is related to the channel of poverty and inequality. This belongs to
the group of theories that explain the growth retardation of resource-rich countries through
welfare mechanisms. Ross (2001a) finds a positive correlation between the oil dependence and
the poverty rates, the mechanism being the worsening of condition of the poor through
decreased health care and education. In particular, he emphasises that since economic growth
is believed to enhance policies that reduce poverty (Dollar and Kraay, 2000), growing empirical
evidence of the growth collapse among point-source-dependent economies can be interpreted
as the fact that natural resources abundance is bad for the poor. The link from increased
poverty to decrease in economic growth is mostly assumed. Fields (1989), Easterly (2001) and
others similarly stress the high positive correlation between the natural resource dependency
and degree of inequality, that increases the probability of poor economic performance.
Criticism
Despite the multitude of studies confirming the mentioned theoretical arguments of indirect
linkages from natural wealth to economic performance, many of them are debatable. To start,
the theoretical underpinnings of Dutch Disease theory raise some questions. Indeed, if world
markets do not determine domestic prices for certain tradeables (as assumed by this theory),
then the impact differs between the importable and the exportable sectors (Benjamin et ai,
1989). Also, the argued effects seem to be inflow-type specific (see footnote 7). Further,
several studies (McMahon, 1997; Mikesell, 1997) conclude that the Dutch disease was not the
major factor in explaining the growth pattern for the countries used as case studies (mostly
countries of Latin America and Africa). Moreover, Fardmanesh (1991) argues that after the oil
boom of the 1970s oil exporting countries have experienced expansion of manufacturing
11

sector. On top of all, studies on DJtch Disease in transition economies are criticised for being
highly theoretical, basing their analysis on modelling rather than empirical work (Stevens,
2003).
The logic of the human capital argument can be questioned also since studies such as Ritzen et
al (2000) brings in the example that call in question logic of that argument. Namely, in
resource-poor countries of the European Union investment in higher education exhibit a
decreasing trend and resources are diverted towards the rich (with the exception of the four
countries: UK, the Netherlands, Norway and Sweden). Additionally, the assumptions of the
learning-by-doing model are questioned on the grounds of possibility of sectors besides the
traded one to contribute to it (Torvik, 2001).
As for the rent-seeking/corruption arguments, doubts are raised over whether the corruption is
the phenomenon conditioned by resource richness and if it automatically translates into the
growth collapse, to mention few. In fact, corruption is widespread in many highly-industrialised
economies such as Italy and Japan (Stevens, 2003). Moreover, different works (Hall, 1999;
Hellman et ai, 2002) emphasise the fact that foreign companies, almost invariably involved in
exploration/exploitation of the mineral resources, in I113ny cases condition corruption. These
studies slacken the vigour of institutions/policy channel arguments. On top of all, it is believed
that in the presence of other distortions, rent-seeking and shadow market activity may be a
second-best solution to the original distortions: rent seeking may actually increase efficiency
and welfare. It terms of governance also, the possibility to buy the political decisions may be
beneficial in otherwise highly bureaucratic environment (Bardhan, 1997). Further still, the
social cohesion argument is a contested concept as well with difficulties to find relevant
measures capturing the essence of it.
At the end, there is a controversial view on the increased inequality positively correlating to
growth collapse (Ros, 2000) so as on the relationship between the conflicts and economic
growth. Lastly, the poverty channel is arguable since it limits its analysis and narrowly bases
the conclusions on the findings of one group of studies.
2.4. Conclusion
As it is obvious, the mechanisms of the natural wealth's impact on economic growth are
different, depending on the hypothesis on the reasons, so are the "cures". The justifications
offered by the (Neo) Liberal theorists see a problem in state intervention, which distorts
dynamic rrechanisms of the comparative advantage-based development. The ensuing policy
consequences are to promote market liberalisation. Rationale of Dependency scholars has
translated into the policy implications to avoid the dependency on natural resources by state
led industrialisation. Explanations suggested by the Marxist theorists, similarly to dependency
12
·1

scholars, precipitated into industrialisation strategies as mean for resource-dependent
economies to avoid backwardness. Additionally, changes at the level cf global governance
institutions are important.
Theories underlining linkages root the problem in the nature of bonds between sectors. A
number of indirect channels that have developed from them stress the possibility to counteract
the resource curse, occurring through overvalued real exchange rate, poor policies that are
conditioned by weak institutions, armed conflicts, deteriorating human capital and welfare by
adequate policies.
Since the studies of transition economies reflect the stand that indirect channels are outlining
(Auty, 2003; Gylfason, 2000; Kronenberg, 2001; Markandya and Averchenkova, 2001;
Petersen and Budina, 2002; Rosenberg and Saavalainen, 1998) the doubts and limitations of
them are important to clarify. Therefore, the empirical work done on transition economies will
be scrutinised in the fourth chapter, upon presenting the economic dynamics of case study
countries. The further analysis will focus on the plausibility and applicability of emphasised
indirect links as well as the consistency of theoretical input with empirical work.
13


CHAPTER 3. PRESENTATION OF THE CASE STUDY: ECONOMIC PERFORMANCE OF CIS COUNTRIES
3.1. Introduction
CIS countries represent 3.7% of the world economy (by PPP estimates of GOP, Economic
Survey of Europe 2000 No. 2/3). In studies of transitional economies they are distinguished
has been translated by from others such as Central and Eastern European (CEE)18, Baltic19 and
Asian 20 ones, among other things, in terms of poorer economic performance (de Melo et ai,
1997; EBRD, 1999; etc). Indeed, four out from twelve CIS countries are of lower middle
income group and the rest of low income (see annex 3.1).
Since this paper aims at analysing the plausibility of natural resource hypothesis in CIS
countries, this chapter attempts to inquire into the economic performance of those countries.
For that, first, the distinguishing features of CIS economies vis-a-vis CEE and Baltic 21 ones will
be explored. The selection of countries is based on the fact that all of them are examp les of
growth collapse, feature that differentiates them from the Asian economies in transition.
Second, the stylised facts of the CIS transition outcomes will be presented. Due to the
multitude of factors having a bearing on growth in CIS, the complete discussion of which is
beyond the scope of the paper, the selection of factors is made on the basis of their relevance
to natural resource impact analysis. Therefore, the dynamics and change in composition of
output, labour, capital and trade will be outlined. Also, aspects of indebtedness and
institutional factors are presented as most of the policy recommendations for CIS countries
build on them. Lastly, the main findings will be showed in concluding part of the chapter.
3.2. Divergence In Transition: How and Why CIS Countries Differ from Others?
How CIS Economic Performance Differs From Other Transitional Countries
CIS countries had experienced more severe crises than CEE and Baltic economies in the
beginning of the transition (see chart 3.1). This can be considered a first distinguishing feature
of CIS economies. To emphasise the extent of the shoc~2, it appears that the most affected
countries are Latvia among Baltic Countries, Albania and Croatia among CEE and Azerbaijan
and Georgia in CIS (see table 3.1)23.
18 Albania, Bosnia and Herzegovina, Bulgaria, Macedonia FYR, Romania, Federal Republic of Yugoslavia, Croatia, Czech Republic, Hungary, Poland
and Slovak Republic
19 Latvia, Lithuania and Estonia
20 China, Mongolia and Vietnam
21 CIS, CEE and Baltic countries will be further referred to as Eastern Bloc
22 Following eXisting works, further referred to as systemic transformation (Kornai, 1990) and transitional recession (World Bank, 2002) 23 The year is chosen to empha slse on the depth of the crisis
14

3000
2500
2000 -""'" 1500
1000
500
1989 1990 1991
Chart 3.1. GDP Growth and Inflation for CeE and CIS Countrlu 1989 .. 2,000 (annual % Change), Group Average
I /
1 I
1992
1\ I \
I \.
\ / \/
/' A
..-/
..-/'
./
, / \ '.; \
1993
'- ---1994 1995 199B 1997 1998 1999 2000
--CEE and Baltic InnatlDn, aDP denator - -as Innatlon, aDP d.n.tor --CEE and Baltic aDP growth (rlght-nad Ileal.) - -CIS GDP growth (right-hand AC111o)
Table 3.1. Inflation and GOP Growth in 1992 for selected countries
GOP arowth (annual % Inflation, GOP deflator(annual %) CEE Average -5.6 CEE Average Albania -27 Albania Croatia -21 Croatia AveraQe Baltic -25.7 Average Baltic Latvia -35 Latvia AveraQe CIS -20.4 Average CIS Georaia -40 Georaia Azerbaijan -35 Azerbaijan
Source: WDI, 2002
15
10
-5
-10
-15
-20
-25 2001
273 115
1467 930 976
1160 1205 1,351
Second distinguishing feature of CIS from the rest of Eastern Bloc is the growth performance
after the recovery (see chart 3.2): CIS countries are far behind the level of 1989 when some
of the CEE and Baltic economies such as Hungary and Slovenia reached it in 2000.
110
70
'" 50
Chert 3.2. GlOP Growth Xnd.x (19B5hra100), b ••• d on debt In LeU
'i: \. ..... ,
..... " ,
, --'---- ------------~~~~--------------------------------------------19 .. 1990 1991 1992 1993 1994 1995 1996 1991 1998 1999 2000 2001
- -Av.ClS --AVOntgD CEE and Bartle
Source: WDI, 2002
One more distinctive feature of transition in CIS is the extent of increase in poverty and
inequality. Indeed, the Eastern Bloc countries saw sharp raises of both in the beginning of the
transition and show no signs of decline yet. According to the study by Milanovic (1998), in all
transition countries, the Poverty Headcount Index has increased from 4% in the late 1980s to
15
45% in 1993-95. Income inequality measured by the Gini coefficient has nearly doubled in
Armenia, Russia, Tajikistan and Ukraine (World Bank, 2002).
Why CIS Economic Performance Differs From Other Transitional Countries
Among the explanations of the divergence among transition countries two main groups can be
distinguished. The first comprises the factors playing a role in the initial output collapse (1989-
1994). The second encompasses the factors explaining the later economic performance. It is
important to emphasise that the first group points out the differences in initial conditions
(characteristics of countries in the beginning of the transition) whereas the second accentuates
the policies in the transition process.
The list of the explanatory factors of the sharp output fall in the beginning (1989-1992) and
the difficulty in recovery in early years of the transition (1992-1995) is quite long and includes
variables from the geography-related ones to the structural characteristics of the economy and
the institutional environment. Geography-related disadvantages include countries' distant
.,~, location from the Western markets24, which is considered to handicap the trade. Next
impediment is natural resource abundance25 that hinders the future perspectives of economic
growth by conditioning making of inappropriate policy decisions (such as delay of liberalisation
reforms). The initial structure of economy, another important explanatory factor for the depth
of the transitional recession, is unfavourable for countries with higher degree of
overindustrialisation26 (Wolf, 1997), inter- Republic 27 dependence on trade and production 28
(Gomulka, 2000) and favourable for countries with the higher degree of urbanisation and initial
income level (de Melo et ai, 1996). Further, initial distortions are also seen to have an
important role in a degree of shock (Berg et ai, 1999, others). Among these distortions are
repressed inflation (measured as a difference between the increase in real wages and real GDP
from 1987 to 1990), black market exchange rate (measured as a difference between the black
market and the official exchange rates) and terms of trade losses for the CIS. On top of all, the
so called market memory (experiences in the design of an institutional framework that
supports market economy), the experience of countries as independent nations and the extent
to which they were affected by war or civil strives are taken into the consideration (de Melo et
ai, 1997; others). In short, CIS countries that are a) further away from the western markets,
b) more endowed with ratural resources, c) overindustrialised, d) affected by wars, have e)
less initial income level, f) repressed inflation, g) high black market exchange rate, h) loss in
terms of trade i) less market memory and j) no experience of being independent in the near
past would have poorer performance in the beginning of the transition.
24 Mostly proxied by the distance of capital from Duesseldorf (Fisher and Sa hay, 2000, others)
25 Many studies use qualitative variable to distinguish resource poor, moderate and rich countries following the work of de Melo et ai, 1997
26 Mostly proxied by the initial level of PPP adjusted per-capita income (Fisher and Sahay, 2000 and de Melo et ai, 1996)
27 Trade between the USSR countries
28 Under dependence on trade usually It's referred to the membership of states In Council of Mutual Economic Assistance (CMEA) whereas under
dependence on production - the intra-USSR production links (such as the Warsaw Pact based ones of the defence· Industry, etc.)
16
However, there are some caveats. Moldova being among the countries located close to the
western markets should better off; instead it is one of the growth collapse examples (see table
3.2). The same holds for Georgia with one of the highest initial income levels. Hence, the
shortcomings of the frequently used cross-country regression analysis employing the above
mentioned factors has to be taken into consideration, especially when it claims to explain only
54% of the growth performance in 1990-1995 (World Bank, 2000).
As mentioned, the second part of the divergence puzzle is argued to lie in the policy decisions
made during later years (from 1994-95 onwards). The policies had to address the initial
outcomes of transition such as soaring inflation, severe balance of payment problems,
dramatic falls in output, etc. The cure was found in establishing market mechanisms with
stabilisation and structural adjustment programmes recommended by the IFIs (see annex
3.1). Mostly, the stabilization policies included measures such as pursuing restrictive fiscal and
monetary policies with nominal anchors assigned to income policy and fixed exchange rate
regimes. At later stages of the stabilisation programmes, when inflation declined to less than
10%, flexible exchange rate regimes were favoured more 29•
Analysis of the policies in the transition period has resulted in assigning an explanatory role of
the divergence to the speed of reforms (de Melo, 1996; Stiglitz, 1998; Aslund et ai, 1996).
Indeed, the indicators developed to capture the reform speed's impact on growth, pointed out
early liberalisers' (those who completed price liberalization, full current account convertibility
and almost completed small-scale privatisation before 1993) advantage over the late ones. the
majority of all CEE and Baltic countries 30 were graded in the former group whereas CIS
countries were graded in the latter (EBRD, 1999). In a word, the transition strategy with faster
macroeconomic stabilisation and liberalisation is seen to be given CEE and Baltic countries
chances to outperform CIS economies. Provided that, considering the examples of Vietnam
and China, that continue to grow despite the choice of very slow transformation, leaves the
room for the additional analysis.
3.3. What Do Stylised Facts of CIS Transition Show?
More then a decade later, the outcomes of the CIS countries transition do not reveal an
optimistic picture. Indeed, the fall in output, considerable lower levels of capital accumulation,
reallocations of labour, shifts in GDP composition away from the industry, alteration of both
composition and geographical distribution of trade, etc. indicate to the deep structural changes
of those economies. Similarly, they bring about the concerns on the future prospects of CIS
economic performance.
29 The argument was to limit the destabilising effects of capital inflows. The reasons to choose it over the peg was belief of inability to maintain
the peg in the situation of the real shocks, a lack of foreign exchange reserves and low credibility of countries (Fisher and Sahay, 2000:7)
30 With exception of Yugoslavia
17

f..,
"-
Output
Table 3.2. CIS GDP growth (1989=100)
Countries 1992 2001
Armenia 51.4 84.3
Azerbaijan 56.8 62.2
Belarus 88.1 92.3
Georgia 40.0 23.9
Kazakhstan 8004 78.6
Kyrgyz Republic 83.9 70.1
Moldova 58.1 37.5
Russian Federation 78.7 69.5
Tajikistan 66.2 42.0
Turkmenistan 90.9 91.5
Ukraine 7704 47.3
Uzbekistan 89.8 99.8
Average CIS 71.9 59.3
As was mentioned, output fell dramatically in the
beginning of the transition and, for most countries, did
not recover (see table 3.2 and annex 3.2). The graphs
in annex 3.2 exhibit the difficulty with the recovery
after transformational recession: the growth of the
most of countries is still far from the pre-transition
level. For some countries, such as Georgia, Moldova,
Ukraine and Tajikistan the recovery is very slow.
Moreover; Moldova and Ukraine only start
experiencing growth in 2000.
Additionally, the composition of GDP has changed (see
chart 3.3). Most of the countries have experienced a
decrease in industry 31 and agricultural sectors and ~------------------------------~ increase in a) trade, b) transport and communication and c) service and other sectors. On
average, the share of agriculture during the transition has decreased approximately by 11%
and industry by 8% (see annex 3.4). In some countries where industry has not fallen or even
has risen such as Azerbaijan, it is driven by fuel sector. Increase in services and the sector
called the other attract attention as well since its share has risen by 15%. The theoretical
explanation for it points out the real GDP per-capita growth as a cause (Chenery, 1960).
However, this obviously does not seem to be relevant in the case of transition economies.
More sensible would be to put the increase in these two sectors on the account of the small
size of the service sector in pre-transition time.
30
25
20
15
'0
Chart 3.3. GOP Sectoral Composition Change (% of GOP), Average CIS
Agriculturtl Induatry Construction Trunaport and Trade and Catarlng Servleea and other COrTVllUnca.Uon
I=Average 1990-1991 r;;:s;:JAverage 1999-2001 Change on average (right-hand scale)1
Source: Statistical Yearbooks of Interstate Statistical Committee of CIS States, Economist Intelligence Unit Country Reports and IMF Country Reports
with Selected Issues and Statistical Appendixes
31 Comprised of manufacture, fuel and energy sectors
18

Labour/Employment
To start with, the dynamics of labour growth shall be inquired into. The exploration of the
annual population growth rates reveals the low figures characteristic to the area: 0.6% for the
1990- 2000 across CIS. Irrespective to the trend, some countries display higher population
growth rates such as Turkmenistan with 3.4%, Uzbekistan with 1.9% and Tajikistan with
1. 6%32. Part of it is explained by the concentration of the asylum seekers and refugees such as
Turkmens and Afgans from Tajikistan in Turkmenistan (United Nations System in
Turkmenistan, 2000).
Furthermore, the observation of the sectoral change of labour shows dynamics that are similar
to the GDP composition change. Indeed, share of total labour force in the industrial sector has
decreased by 5.7% and has increased in the trade and catering sector by 2.9%. However,
other trends are reversed: the share of labour increases in agricultural sector by 8.5% and
decreases in construction by 3.9%, in transport and communication by 0.4% and in services
and other by 2.2% (see annex 3.5). At the sam: time, on average, unemployment in CIS has
increased for as much as 5 times from 199233 to 2001. The educational composition of
unemployment has changed as well: using the same comparison, the share of unemployed
population with higher and special secondary education has decreased (by 6% and 2%
respectively) and the ones of general secondary education have increased (by 6% and 1%
respectively) (see annex 3.7).
Lastly, human capital underwent changes as well. From the beginning it should be mentioned
that countries of CIS (similar to others in Eastern Bloc) are characterised by the high indices of
human capital34 compared to the development countries and even OECD. The reason lies in the
high prioritisation of education during the Soviet times. The results are the high demand from
the population and ever-decreasing, but still available supply in a form of government
subsidised schools. Irrespective of the educational attainment level of the average worker, the
composition of the stock human capital (in terms of the occupations) was assessed to be
inadequate to the needs of modern market requirements (Klara Sabirianova, 2000, Campos
and Zlabkova, 2001). Therefore, the privatisation of the sector was recommended. As the
result, share of the private sector in education has increased. In parallel, secondary school
enrolment has decreased from the 95% in 1990 to 80% in 2000 (measured in regional
averages)35 whereaS primary school enrolment has stayed almost unchanged (at
approximately 96% level). On top of all, countries permanently experienced net out- migration
of skilled labour related to the disruption of industrial bases (e.g. urban population with
320wn calculations on the basis ofWDI 2002
33 1992 is selected because it is the earliest a vailable data, however the fact that 1992 was a trough year has to be taken Into the consideration
34 Measured in gross or net enrolments, average years of schooling and literacy rates
35 Own calculations based on WDI 2003
19
industrial skills that served the military industry in Central Asian states36 ) and brain drain (e.g.
R&O specialists that left for the Western institutions).
Capital
Chart 3.4. Capital Formation, Savings and FDI Dynamics (% of total), CIS Average
" " " r '.~>'4
"1~
~~l ;1}~ ~~
" "
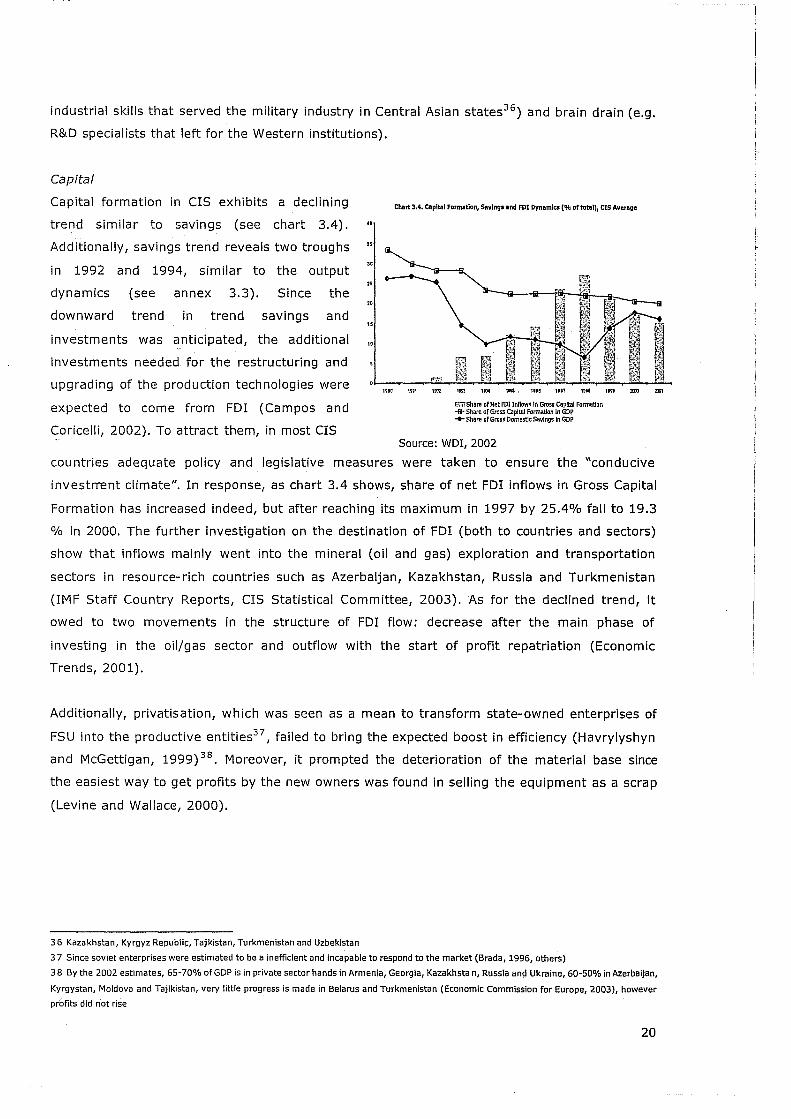
Capital formation in CIS exhibits a declining
trend similar to savings (see chart 3.4).
Additionally, savings trend reveals two troughs
in 1992 and 1994, similar to the output
dynamics (see annex 3.3). Since the
downward trend in trend savings and
investments was anticipated, the additional
investments needed for the restructuring and
upgrading of the production technologies were
expected to come from FOI (Campos and
" 1D
t~ ;l~J
~ r,;;~ ~~
1# '.~
11~ :~~ r)':.-t4
r ~t4 '~ ~~!j
i w;l
~~ ~~ I ~J';.: F i~~ I 1< ~~ ~l ':'l' ~i1
Coricelli, 2002). To attract them, in most CIS
lUG 19i1 1m 1m , ... ,,,.. 1898 1891 ,. .. ~5hare of Net FOt Inflows In Gross capital Format!on + Share of Gross Capital formation In GOP ... Share of Gross Domestlc Savings In GOP
Source: WDI, 2002
,m ... ZII1
countries adequate policy and legislative measures were taken to ensure the "conducive
investrrent climate". In response, as chart 3.4 shows, share of net FOI inflows in Gross Capital
Formation has increased indeed, but after reaching its maximum in 1997 by 25.4% fall to 19.3
% in 2000. The further investigation on the destination of FOI (both to countries and sectors)
show that inflows mainly went into the mineral (oil and gas) exploration and transportation
sectors in resource-rich countries such as Azerbaijan, Kazakhstan, Russia and Turkmenistan
(IMF Staff Country Reports, CIS Statistical Committee, 2003). As for the declined trend, it
owed to two movements in the structure of FOI flow: decrease after the main phase of
investing in the oil/gas sector and outflow with the start of profit repatriation (Economic
Trends, 2001).
Additionally, privatisation, which was seen as a mean to transform state-owned enterprises of
FSU into the productive entities37, failed to bring the expected boost in efficiency (Havrylyshyn
and McGettigan, 1999)38. Moreover, it prompted the deterioration of the material base since
the easiest way to get profits by the new owners was found in selling the equipment as a scrap
(Levine and Wallace, 2000).
36 Kazakhstan, Kyrgyz Republic, Tajkistan, Turkmenistan and Uzbekistan
37 Since soviet enterprises were estimated to be a inefficient and incapable to respond to the market (Brada, 1996, others)
38 By the 2002 estimates, 65-70% of GDP is In private sector hands in Armenia, Georgia, Kazakhsta n, Russia and Ukraine, 60-50% in Azerbaijan,
Kyrgystan, Moldova and Tajikistan, very little progress is made in Belarus and Turkmenistan (Economic Commission for Europe, 2003), however
profits did not rise
20

Trade
In examining trade, firstly, the decline in level attracts attention. Though in 1998 CIS exports
were about 30% higher than in the trough year (1994), they represented only 15% of 1990
exports (Campos and Coricelli, 2002). As it was mentioned, collapse of CMEA trade was the
main cause of the tremendous disruption in the international trade of these countries. In 1990-
1993, inter-Republic trade fell by 67% from $189bn in 1990 to $62bn in 1993. In addition,
FSU trade with the rest of the world fell by 48% in US$ terms over the same period (Senik
Leygonie and Hughes, 1994).
Secondly, trade patterns show a reorientation towards the industrialised countries (Breton and
Gros, 1997; Kaminski et ai, 1996). According to the calculations of some studies such as the
work of Campos and Coricelli (2002), the share of CIS exports to industrial countries has
"'" '50 . "
'" "'%
". ". ,,, '0%
'" ""
,,.
, .. , ..
1992
Chart 3.5. Changes In Shares of Commodity Groups In as Exports, A1I1!rage 1992-2001
199] ''''' 1995 199B 1m 199B 1999
-fil-Share of Food and Agricultural Raw Mat.nals In Exports • • Share of Fuesl, Ores and Metals In Exports -Share of Manufacture In Exports
... . .
200'
Source: own calculations based on UNCTAD export data
Chart 3.6. Changas In Sharu or Commodity Groups In CIS GOP, Average 1992-2001
-i!t-Share of Food and Agricultural Raw Materials In GOP • • Share of Fuasl, Ores and Metals In GOP -Share of Manufacture In GOP
. , . I
increased from the 15% in 1990 to
25% in 1998.
Thirdly, the structure of the trade has
changed. On average, from 1992 to
2001 the mineral-products-share in
exports has increased by 7% and that
of agricultural products has decreased
by 10%. At the same time, the share
of manufacture products has remained
broadly the same (see charts 3.5 and
3.6). However, the average figures do
not capture the extent of cases such
as transformation in individual country
increase of share of mineral products
in exports in Azerbaijan from 34% to
92%, decrease of share of
manufacture product in exports in
Kazakhstan from 53% to 18%,
changes in shares of agriculture
products in Georgia, Moldova and
Tajikistan, etc. (see Annex 4.2 and
Source: own calc. based on UNCTAD export data and WDI 2003 4.3).
Lastly, in the beginning of their independence, as a part of structural reform, the majority of
CIS countries 39 liberalised trade along with prices of most goods and services, foreign
exchange rate regime and enterprise and land privatisation (Ofer and Pomfret, 2003). Some of
39 With exceptions ofTurkmenistan, Ukraine and Uzbekistan. They also barely implemented structural reforms.
21
them are members of WTO such as Kyrgyztan (from 1998), Georgia (from 2000) and Armenia
(from 2003). Others except Turkmenistan are observers (WTO, 2003).
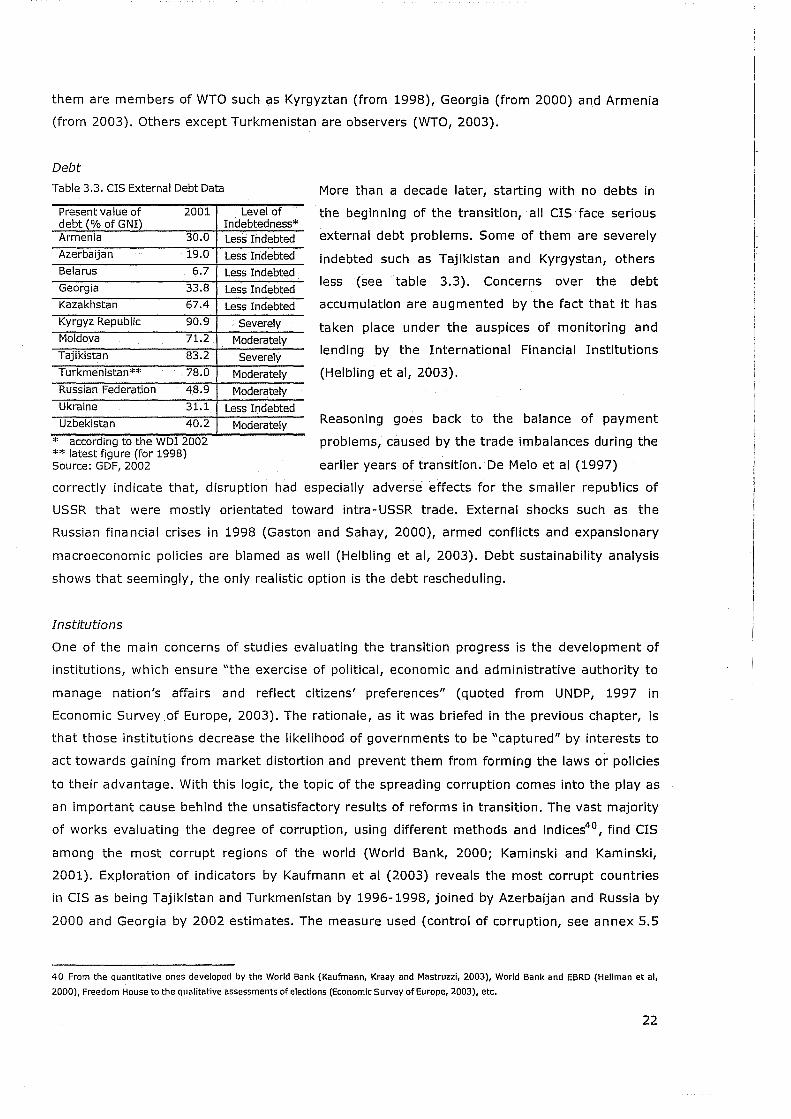
Debt Table 3.3. CIS External Debt Data
Present value of 2001 debt (% of GNI) Armenia 30.0
Azerbaijan 19.0
Belarus 6.7
Georgia 33.8
Kazakhstan 67.4
Kyrgyz Republic 90.9
Moldova 71.2
Tajikistan 83.2
Turkmenistan** 78.0
Russian Federation 48.9
Ukraine 31.1
Uzbekistan 40.2
* according to the WDI 2002 ** latest figure (for 1998) Source: GDF, 2002
Level of Indebtedness* Less Indebted
Less Indebted
Less Indebted
Less Indebted
Less Indebted
Severely
Moderately
Severely
Moderately
Moderately
Less Indebted
Moderately
More than a decade later, starting with no debts in
the beginning of the transition, all CIS face serious
external debt problems. Some of them are severely
indebted such as Tajikistan and Kyrgystan, others
less (see table 3.3). Concerns over the debt
accumulation are augmented by the fact that it has
taken place under the auspices of monitoring and
lending by the International Financial Institutions
(Helbling et ai, 2003).
Reasoning goes back to the balance of payment
problems, caused by the trade imbalances during the
earlier years of transition. De Melo et al (1997)
correctly indicate that, disruption had especially adverse effects for the smaller republics of
USSR that were mostly orientated toward intra-USSR trade. External shocks such as the
Russian fina ncial crises in 1998 (Gaston and Sahay, 2000), armed conflicts and expansionary
macroeconomic poliCies are blamed as well (Helbling et ai, 2003). Debt sustainability analysis
shows that seemingly, the only realistic option is the debt rescheduling.
Institutions
One of the main concerns of studies evaluating the transition progress is the development of
institutions, which ensure "the exercise of political, economic and administrative authority to
manage nation's affairs and reflect citizens' preferences" (quoted from UNDP, 1997 in
Economic Survey of Europe, 2003). The rationale, as it was briefed in the previous chapter, is
that those institutions decrease the likelihood of governments to be "captured" by interests to
act towards gaining from market distortion and prevent them from forming the laws or policies
to their advantage. With this logic, the topic of the spreading corruption comes into the playas
an important cause behind the unsatisfactory results of reforms in transition. The vast majority
of works evaluating the degree of corruption, using different methods and indices4o , find CIS
among the most corrupt regions of the world (World Bank, 2000; Kaminski and Kaminski,
2001). Exploration of indicators by Kaufmann et al (2003) reveals the most corrupt countries
in CIS as being Tajikistan and Turkmenistan by 1996-1998, joined by Azerbaijan and Russia by
2000 and Georgia by 2002 estimates. The measure used (control of corruption, see annex 5.5
40 From the quantitative ones developed by the World Bank (Kaufmann, Kraay and Mastruzzi, 2003), World Bank and EBRD (Hellman et ai,
2000), Freedom House to the qualitative assessments of elections (Economic Survey of Europe, 2003), etc.
22

for description) reveals the general trend of increased spread of corruption for in majority of
CIS countries (except Belarus, Tajikistan and Turkmenistan).
3.3. Conclusion
The analysis of the outcomes of transition indicates to the fundamental changes in economic
structure of CIS countries. The analysis of output, labour and trade dynamics indicate on the
decreased role of industry in the economy. The primary sector dominance is also of note.
Additionally, the findings reveal the increased importance of natural resource based exports.
Moreover, the change in huma n capital and high share of foreign capital in mineral-based
industries (which is considered to be an enclave in economy) is not supportive to the future
perspectives of the economic revival of countries in transition. On top of all, unsustainable debt
and indices of high spread of corruption weakens the negotiation power of them with IFIs and
other bilateral donors. In the light of this evidence the recommendations based on the natural
resource curse analysis becomes more important for the future prospects of the CIS countries'
economic performance. Therefore, the investigation of the relevance and the degree of
considering the region-specific factors become a valid further target.
23
CHAPTER 4. THE IMPACT OF NATURAL RESOURCES ON ECONOMIC GROWTH: EMPIRICAL STUDIES
4.1. Introduction
Similar to the theoretical studies, there is a vast bulk of empirical work that inquires into the
nature of relationship between resource abundance and economic growth. Among them are
works on transitional economies. For the most part the empirical evidence appears to support
the negative relationship hypothesis. Nevertheless, considerable doubts can be raised as to
what concerns their validity. And it is the aim of this chapter to find out the relevance of these
studies in CIS case. Thus, a review of the empirical literature will be undertaken with a view of
assessing how well it translates the theoretical models and explains the stylised facts.
Additionally, the channels that find sufficient empirical support will be selected to be tested
further.
The chapter is organised as follows. Firstly, the findings and shortcomings of the empirical
literature on the relationship of natural wealth and economic performance will be explored. As
it was stated before, this paper focuses on the empirical studies outlining the indirect channels
singled out in the theoretical part of this paper. Secondly, empirical studies on resource-driven
transitional economies will be reviewed. Lastly, the conclusions will be made on the
implications of the findings of the chapter.
4.2. How Do Empirical Studies Reflect The Natural Wealth Impact Hypothesis?
The large body of work that proves the relationship between abundance of natural resources
and poor economic performance is more explicit in their attempt 10 find out the channels
through which the adverse effects of resource wealth are taking place. Most of them build on
the influential work of Sachs and Warner (1995), which found a negative relationship between
natural resource exports and growth in the period of 1970-1990, based on a sample of 95
developing countries. The multitude of ensuing works, while confirming the finding, augment
it with the observation that point-source resource abundant countries are among the weakest
performers in a range of resource-dependent ones (Auty, 2001; Easterly and Levine, 2003;
Murshed, 2002; Perala, 2003).
The methods are mostly limited to the usage of econometrics, whereas exploratory data
analysis (EDA) is applied more rarely. It has to be noted, that the majority of the studies that
employ multiple regression, include the variables through which natural resources could have
effect on growth along with the natural resource abundance indices. The argument is to test
whether they are significantly associated with growth once natural resources are taken into
account. One can argue that simultaneous regressions seem to be a more plausible alternative.
This would serve the purpose of testing the theoretical argument in both ways: first, whether
24

the indirect linkages are explained by the natural resources and second, how much they
explain the economic performance. Some studies acknowledge the drawbacks of used
techniques and apply the simultaneous regressions such as Sachs and Warner (1995, -i9~fif
and Murshed (2003). Others rely on advancement of econometrics methods that give a
possibility to first use multiple regressions to measure the effect of each explanatory variable
on the dependent one while keeping other explanatory variables constant and second, to
correct for the data problems 41 arising when with the various tests. One additional critical point
is that these models look, and might be, manipulative since instead of building on theoretical
underpinnings, they seek for statistically significant coefficients and high coefficient of multiple
determination (R2) by excluding and adding up variables. It does not mean, however, that
econometrics is of no use: testing of theoretically solid arguments with the available evidence
is a powerful way of accepting or rejecting the hypothesis. Rather, it indicates that theories are
not sound enough to explain the reality.
Before exploring how the distinct links outlined in theory are proved and supported by the
empirical studies, the indices of natural resource abundance and economic growth shall be
inquired into. To capture the natural resource abundance/intensity, mostly single indices are
used. Among them are ones related to:
exports, such as the share of primary exports in GOP (Sachs and Warner, 1995) and the
share of primary exports in total exports (Isham, 2002);
production, such as the share of primary sector employment/labour force (Gylfason et ai,
1999) and the share of mineral production in GOP (Papyrakis and Gerlagh, 2002);
and resource reserves, such as per-capita land area (Wood and Berge, 1997), per-capita
cropland greater than 0.3 hectares ~uty, 2001) and the ratio of total land area to
population (Stijns, 2001).
Less frequently used are dual measurements such 'as export orientation and country size
(Syrquin and Chenery, 1989) and per-capita cropland and country size42 (Auty, 2001).-----
Additionally, to proximate the type of the natural resource, shares of commodity groups in
export, sectoral shares in GOP (Auty, 2001; Isham et ai, 2002; Murshed, 2002), sectoral
shares in total employment (Auty, 2001) and dummies for crops and minerals (Easterly and
Levine, 2003) are employed. As for the economic growth, its measure follows from the agreed
starting point that growth failure is considered to have occurred in economies that attained
their contemporary income level during the 1960s or before. Therefore, studies mostly make
use of averages or level indices for economic growth within a time span from 1960 onwards.
The way natural resources are defined and proxied and the chosen period for assessing the
economic performance can be a matter of critic. Firstly, it seems that the indices of natural
resource reserves assume an automatic translation of them into exports, which is dubious.
41 Among which are multicollinearity, heteroscedasticity, autocorrelation, etc
42 Country size is measured in terms of GDP
25

Secondly, although natural resource abundance is mostly measured by agriculture-related
proxies (such as per-capita cropland and employment in the agricultural sector), later the
results are generalised to the other types of resources whereas the resource-type development
is stressed on repeated occasions. As for the capturing the growth collapse, the analysis is
acknowledged to be sensitive to the period chosen. The reasons behind it are the evidence of
faster growth of resource-rich countries (Auty, 2001) and similar pattern of growth in all
developing countries before the 1970s.
The Real Exchange Rate Channel
Only few studies (such as Gylfason et ai, 1999; Murshed, 2003; Easterly and Levine, 2003),
that identify the policy measures taken by resource-rich countries to counteract the Dutch
disease, use the real exchange rate dynamics as an explanatory variable. Others identify Dutch
disease with de-industrialisation and use various proxies to capture the dangers to economy
from increased inflows that are highlighted by this hypothesis. For instance, Sachs and Warner
(1995) single out the propensity of countries with resource booms to develop protectionist
,z!';, strategies when trying to combat Dutch disease effects. Following from that, their analysis
exploits the trade openness indicator, measured by the fraction of years that country was
integrated into the world economy 43. With the same logic, ether works use trade inflows
(Gylfason, 2001) and openness defined as a difference between the actual and predicted ratio
of exports to GDp 44 (Gylfason, 1999).
Despite the puzzling ways to capture the theoretical arguments, in most cases, the hypothesis
are claimed to prove right. Consequently, the conclusion is drawn that growth failure is
explained by poor policies (most notable from protectionism) rather then natural wealth itself.
Even if the difficulty to see the logical link from the real exchange rate to the protectionist
policies was overcomed, the finding of open trade policies (in sense of lower tariffs and non-
tariff barriers to trade) to be significantly associated with economic growth could still be---------
challenged. Indeed, various studies characterise the claim as having "a little evidence"
(Rodriguez and Rodrik, 1999; Walde and Woods, 1999).
The Human Capital Channel
Employing the measures of human capital as secondary school enrolment (Gylfason et ai,
1999; Kronenberg, 2001), secondary school achievement in initial year (Isham et al), public
expenditure on education relative to national income, expected years of schooling and school
enrolment (Gylfason, 2001), studies prove the human capital deterioration to be the right
channel of natural wealth's adverse effect on economic growth.
43 Following Sachs and Warner, 1995 the indicator is used in most of the natural resource studies. It is based on definition that "county is said to
be open if it maintained reasonably low tariffs and quotas and did not have an excessively high black market exchange rate premium". The
reasonable trade restrictions are believed to be average tariffs lower than 40%, quotas and licensing covering less than 40% of total imports. As
for the black market premium, It must be less than 20%.
44 The predicted export-to-GOP ratio=86.3 -5.7In(population)
26

However, hconspicuously, in most works the idea of introducing a time (usually five-year)
window between human capital observation and the other explanatory variable to mitigate
risks of reverse causality is neglected.
The Po/icy/Institutions Channel
To model the theoretical argument of weak institutions (including social cohesion) having a
high probability to make for poor policies, empirical studies mainly focus on quality of
governance and civic social capital. Rarely, policy failures are applied as proxies as well.
Among the governance indicators (see annex 5.5) are those measured by World Bank
indicators (voice and accountability, political stability, government effectiveness, regulatory
quality, control of corruption); Transparency International indicators (Political Rights, Civil
Liberties, Freedom of the Press, Corruption Perception Index); World Bank and EBRD indicators
based on BEEPS (Quality Of Public Institutions, Institutional Obstacles to Business, State
Capture, Corruption, etc); Freedom house indicators (especially ones for countries in transition
such as Democratisation, Rule of Law And Economic Liberalisation); ICRG ind icators (Quality of
the Bureaucracy and Law and Order Tradition, etc); Composite Index of Quality of Bureaucracy
based on indices of Business International (Sachs and Warner, 1995); Institutional Quality
Index45 (Mehlum, 2002); Democracy index from Polity dataset of Gurr and Jaggers (Murshed,
2003), etc. Almost all of these works find governance malfunctioning to be an important
explanatory variable for the growth underperformance of resource-rich countries.
Another group of studies uses civic social capital as an explanatory factor for the economic
performance of natural resource abundant countries. Among the proxies are: a) direct
measures such as membership rates of organisations and participation in organisations (used
by Narayan and Pritchett, 1999; Robert Putnam, 1993) and measures of trust46 (Knack and
Keefer, 1997) and b) indirect measures such as income, distribution measures,
English/European language spoken and ethnic fr.actionalisation/heterogeneity, etc.
The group of studies that accentuates on policy failures as a channel usually argues that there
is a bigger possibility for high rents from natural resources to be translated into wasteful
investments, which allegedly leads to the failure of macroeconomic policies. Therefore, policy
failures are captured by inflation (Gylfason, 1999; Easterly and Levine, 2003) and average
investment-to-GDP ratio (Auty ,2001), etc. Using those indices, the th2111nel is found to-be
supportive for the resource curse hypothesis.
A number of questions can emerge on this issue as well. Firstly, the studies using corruption
indices face the fact that the assumed causality from corruption to growth and from natural
45 The ind ex is an unweighted average of 5 ind exes based on data from Political Risk Services: a rule of law index, a bureaucratic quality index, a
corruption in government index, a risk of expropriation index, and a government repudiation of contracts index
46 Answers on question do you think people can be trusted
27

resources to corruption is not so clear-cut. Indeed, some authors acknowledge the possibility
of other factors influencing corruption and suggest to model economic growth using
instrumental variables instead of usual indices of natural resources and corruption
(Kronenberg, 2001). Additionally, the selection of indicators of institutional quality and
governance is not well argumented, being rather motivated by issues of their availability.
Moreover, a range of studies that have not relied on advanced statistical techniques are
singling out the problems with the works that emphasise the importance of policy or
institutional variables. Namely, the majority of institutional variables are said to have weak
predictive powers to explain growth (Przeworski and Limongi, 1993 and Brunetti, 1996 cited in
Kenny and Williams, 2001). In addition, the fact that policies change too slowly to explain the
volatility of shorter-term growth rates and too fast to explain the stability of longer-term
growth rates was observed by Easterly et al (1993). As for the SOCial cohesion, starting from
its definition47 it is difficult to grasp the Ii3tionale behind the way in which the civic social
capital is captured. Namely, the way the degree of aptitude for collaboration among people is
proxied by the share of people speaking English/European language or ethnic fractionalisation
..,;;; is rather speculative.
The Poverty/Inequality Channel
The inequality and poverty channel is not as much used in multiple regreSSion type of analysis.
Rather, it is subjected to the separate investigation (Ross, 2001a; Fields, 1989; Gylfason,
2002). Usually, ilequality is captured by income or social inequality indices such as Gini,
deciles or quintiles ratio, share of income gains to middle 60% of population, etc. Further, the
testing of inequality channel results in either dropping it on the grounds of statistical
insignificance (Sachs and Warner, 1995) or finding out its linkage to the other independent
variable (such as conflicts in Murshed, 2003; education in Gylfason, 2002; institutions in ,
Easterly, 2001). The same applies to the poverty channel, although it is even less investigated.
The empirical studies that use the inequality/poverty channel do not attempt to clarify the
mechanisms through which natural resource abundance effects adversely the economic growth
through increased poverty and inequality.
Others
The other channels applied, in most part, include armed conflicts (proxied by the dummies for
the armed conflicts/war prone countries, etc.) and geography (captured by the dummies of
landlockness and belonging to region, distance from equator or developed countries). Studies,
in general, confirm their significance in supporting the resource curse hypothesis. However,
some of the results are sensitive to the resource type. The work of Soysa (2001) states that
the predicting power of mineral wealth in incidence of conflicts is significant whereas relative
47 See footnote 13
28

availability of total natural resources is not associated to conflicts. As for the geography
variables, they are open to the dispute as fair measures (Kenny and Williams, 2001).
In short, the empirical studies on indirect channels between natural wealth and economic
performance neither contribute to the theoretical debate in conclusive manner, nor they clarify
the ambivalent effects of some channels such as inequality and 'poverty one.
4.3. What Do Studies of Natural Resource Impact on Transition i;conomies Exhibit?
Since the studies of the impact of natural resource on economies in transition are few, there is
an opportunity to analyse all relevant ones in detail. It should be noted that all of them proved
the relevance of the curse hypothesis to the transition as well as found an explanation for the
poor growth performance of resource abundance transition countries. Three of these studies
are of special interest due to the fact that they pertain to all transition countries: Auty (2003),
Gylfason (2000) and Kronenberg (2001)48. Case studies such as ones done on Azerbaijan
(Petersen and Budina, 2002; Rosenberg and Saavalainen, 1998), Kazakhstan and Uzbekistan
(Petersen and Budina, 2002; Auty, 2001) and Russia (Markandya and Averchenkova, 2001)
are important as well.
These studies, in general, reproduce models and methods described in the first part of this
chapter. Hence, the same doubts apply to them. Following the trend, the research into
resource-rich transition countries tries to test possible channels through which the natural
resources retard growth. Consequently, institutions and policies, real exchange rate and
human capital are found to be the most influential ones.
The institutions/policy channel is the one most often claimed to be of high importance,
impeding the possibility of positive translation of resource rents to growth. Indeed, interlinked
analysis of rent-seeking activities, natural resources and economic growth prove right the
negative impact of resources on growth through governance malfunctioning (Gylfason, 2000;
Kronenberg, 2001). In addition, the inquiry into the cases of Kazakhstan and Azerbaijan
support the finding, emphasising, however, on different extent of it according to the resource
type, i.e. in crop-driven Uzbekistan the transition goes smoother compared to the mineral
driven Kazakhstan and Azerbaijan (Auty, 2001). The analysis is based on research of oil
revenues, shadow economy size, EBRD Governance, State Intervention, Corruption and Bribe
tax indices (Auty, 2003) and State Corruption Perception Index (Gylfason, 2000; Kronenberg,
2001).
48 Methodologically, study of Gylfason (2000) and Auty (2003) exploit exploratory data analysis whereas the one of Kronenberg (2001) makes
use of the stepwise regression approach.
29
The studies that focus on policy failures in transition countries, similar to general trend, outline
the link between high resource rents from natural resources and soaring inflation. Reasoning
from this, the relations between resource abundance and annual inflation rate as well as
between inflation and economic growth is investigated. The results show a significant, although
not impressive coefficient of positive correlation (Gylfason, 2000). At the same time, the lack
of any clear association between natural resource abundance and inflation on a world scale
suggests that correlations are spurious. In a different way, the coherence of economic policies
is found to be diminished by point-source resource abundance rather than diffused one
through its detrimental impact on democracy (Auty, 2003).
Interestingly, instead of highlighting the adverse effect of natural wealth on social cohesion,
Markandya and Averchenkova (2001) and Auty (2003) outline the devaluation of social capital
and increase of inequality as a consequence of the policy failure in resource-rich countries. The
latter point over indicates on contested causality of inequality/social cohesion channel.
The next channel that is tested for relevance is the real exchange rate one. For that, openness
indicator is employed (here, the difference between the actual and predicted exports-to-GDP
rati0 49). However, after failing to exhibit a significant relationship, the conclusion of no direct
impact of real exchange rate movements on the growth performance of transition countries is
reached (Gylfason, 2000). The opposite conclusion is derived by the work of Kronenberg
(2001). Building on the relative price effect common to the Dutch disease type of analysiS, it
employs the general price level as a proxy for the relative price, calculated as a ratio of
country's purchasing power parity exchange rate to nominal exchange rateso . The findings
indicate the positive correlation between resource abundance and price level, but no influence
of any on growth in case of transition countries. In order to explain the puzzle of positive
correlation between the price level and growth one could turn to the observed government
abilities by example of Russia to adjust policies so that resources could work in favour of
economic development (Markandya and Alesina, 2001). These conclusions, however, do not
match the predictions of the Rosenberg and Saavalainen's research (1998) that transitional
conditions add speed to real exchange rate appreciation. Overall, the findings as well as the
methods to test for the real exchange rate overvaluation channel are rather divergent.
Further, human capital channel is tested using secondary school enrolment. The results, on the
one hand, turn out significant, but sensitive to the inclusion of Albania (Gylfason, 2000) and,
on the other, insignificant (Kronenberg, 2001). The rationale of the latter one is quite
plausible: as it was stated in the previous chapter, human capital indices are generally high in
transition counties and, therefore, difficult to use as an explanation for the divergent economic
49 See footnote 3
SO This general price level is used as a prox y for relative price one based on the usual assumption that prices of tradables Is Internationally
determined and same everywhere
30

performance. Rather, investments in education seem to be relevant to inquire into. Similarly,
importance of time-lagged analysis has to be stressed.
The other channels such as inequality/poverty and armed conflict/war ones are not subjected
to tests in the transition country cases.
3.4. Conclusion
To summarise, the empirical studies of both general and transition country specific evidences
of resource-rich countries' economic performance prove the existence of natural resource
curse. In the case of transition countries, natural resources are found to be an important
explanatory factor of growth divergence along with the remoteness from dynamic markets,
extent of exposure to central planning (Auty, 2003), initial condition.s (initial income level in
Kronenberg, 2001 and social capital in Auty, 2003) and growth of exports (Kronenberg, 2001).
In addition, Auty (2003) suggests that resource type matters for the avoidance of growth
failure: diffuse resource base economies can escape it.
As for the channels, tests unanimously distinguish only one, the institution/policy channel, as
an explanatory factor of resource curse in transition countries. Secondly, proxying policy
failure by capital investment and inflation-related measurements has been proved unsound,
hence more appropriate indices are desirable. The human capital channel could be better
tested by using other proxies or techniques than secondary school enrolment. Additionally,
despite disputed effects on growth, a real exchange rate appreciation is alleged to occur in the
resource-abundant transitional countries, with the possible adverse outcomes for the economic
development. Lastly, the armed conflicts/war and poverty/inequality channels are not
considered of importance in explaining natural resource-led economic performance of
transition countries. The latter pOint coupled with the theoretical drawbacks is the reason of
not pursuing those channels any further.
Consequently, recommendations are mainly concerned with institutions/policy matters that, in
general, emphasise on trade and market liberalisation policies and measures to ensure the
transparent and accountable governance.
Although, the recommendations are more or less in line with the theoretical and empirical work
on this subject, their highlighted caveats confirm the necessity of further investigation.
Therefore, the next chapter will test the singled out channels on the CIS case. Additionally, this
will correct for the omissions of earlier studies such as exclusion of five out of twelve CIS
economies from the sample of transition economies (Kronenberg, 2001).
31

CHAPTER 5. TESTING THE PREDICTIONS OF THE THEORIES AND EMPIRICAL STUDIES
5.1. Introduction
The previous part of this paper presented that the channels through which natural resources
allegedly influence economic performance are debatable. There are few studies on the
resource curse in transitional economies, but generally they do not shed more light on the
subject. However, policy decisions to counteract Dutch disease and adverse rent management
practices are found to be crucial for the further development of resource-rich transition
economies (Auty, 2003; Gylfason, 2000; Rosenberg and Saavalainen, 1998; others).
Therefore, the present chapter aims at testing both the predicted impact of natural resource
abundance and the channels through which the impact takes place, on CIS case. The final
selection of channels, based on the findings of the previous chapter, includes real exchange
rate overvaluation, policy/institutions and human capital ones. Conclusions will be drawn on
whether the theoretical explanations and empirical studies on transition countries can be
generalised to the CIS case.
5.2. Methodology and measures
Before testing the prediction of studies on natural resource and growth, a few pOints should be
clarified. First of all, this chapter makes use of EDA. The rationale behind it is threefold: 1) the
critical evaluation of the models used to explain the economic performance in transition
economies (Stevens, 2003); 2) the mentioned limitations of econometrics methods (see
section 4.2) and 3) the small size of the sample and time (12 years of transition) and overall
poorness of data. Second of all, despite the mentioned drawbacks of econometrics analysis, in
order to expla in the economic performance of CIS countries through natural resources
endowments, a model of multiple regression is employed. This necessitates due to the
limitedness of data possibilities to exploit other alternatives. In this case, certainly, the
possible multicollinearity problem is solved by making use of the interaction term. Last of all,
overall, the predictions are tested by comparison of resource-rich to resource-poor CIS
economies.
The analysis, in most part, covers the time period from 1992 to 2001. The main reason behind
the choice of starting date is related to the availability of data, among which crucial ones are
figures on exports. From its side, this is explained by the absence of independent national
accounting before 1992 (CIS countries were part of USSR).
Economic growth is captured by average per capita growth (annual % change), calculated on
the basis of GDP per capita in LCU (data source is WDI 2003: NY.GDP.MKTP.KN).
32
Natural resource abundance is measured using two indices: a) primary export share in total
exports and b) primary exports share in GDP (see annex 4.2 and 4.3). The latter is relevant
since it is coherent with the analysis of sectoral composition of GDP and employment.
Additionally, both indices encompass agricultural and mineral resources.' Hence, they are not
limited to the one type of natural resources, yet create an opportunity to check for resource
type specific developments. The share of primary exports in total exports is calculated using
three digit level export data from UNCTAD for 1992-2001 years (see annex 4.1 for
classification of the commodity groups based on SITCS1). To follow the argument on economic
development, that are specific to natural resource type, a further distinction between
agriculture products (food and agricultural raw materials), minerals (fuels, ores and metals)
and manufacture products are made. As for the second measure of natural resource
abundance, i.e. primary exports share in GDP, it is computed using the same data and the
share of exports of goods and services in GDP from WDI 2003 (NE.EXP.GNFS.ZS).
To check for the governance channel, the widely employed (Easterly and Levine, 2002; Isham
et ai, 2002; World Bank, 2000, Wyatt, 2002) World Bank governance indicators are applied.
This choice is made due to the following reasons. First, it allows the largest sample with
maximum numb er of observations for CIS countries. Second, according to the latest
explanatory work on governance indicators (Kaufmann et ai, 2003) those indicators cover all
aspects of governance as well as they build on all available indices of other agencies. It should
be note that first, there are four observations of 1996, 1998, 2000 and 2002 years and
second, all scores of governance indicators lie between -2.5 and 2.5, with higher scores
corresponding to better outcomes. This paper employs two of the World Bank governance
indicators: Government Effectiveness and Control of Corruption. The former measure is used
as it captures the quality of public services, among others, in terms of its independence from
political pressures (Kauffman et ai, 2003). Indeed, both theoretical and empirical studies of the
institutions/policy channel highlight the importance of policy decisions to be free from
pressures of groups that are interested in seizing resource rents. Indices of shares of human,
natural and physical capital in national wealth come from their World Bank calculations (World
Bank, 1995). The Control of Corruption Index captures the perception of corruption
conventionally defined as the exercise of public power for private gain (Kaufmann et ai, 2003).
The rationale for choosing the latter is due to the fact that studies on transitional economies
widely apply it to back up their theoretical arguments. The observation of year 2000 it is one
of the latest observations and more appropriate for the time -span that is analysed in this
paper than that of 2002.
Further, the real exchange rate channel is tested employing real exchange rate dynamics,
based on own calculations (see annex 5.1). These calculations consider indices of trade
51 Groupings are based on Commodity Codification according to the Standard International Trade Classification (SITC), rev.3. The same groups
are used in the World Development Indicators (see Isham et ai, 2002).
33

partners and competitors (Nicholas, 2003). This particular channel is tested only for the
sample of resource-rich countries, eight in total (Uzbekistan is excluded due to the data
problems). Additionally, the time span is 1995-2001 due to the poorness of nominal exchange
rate and inflation data.
Lastly, the human capital channel is checked using the decrease in tertiary school enrolment
rates (TSER) from 1995 to 1997 (source of data is WDI 2003: SE.TER.ENRR). The choice of
that index is based on the limited possibility to make use of secondary school enrolment rates
to capture change in human capital in CIS countries (see section 3.3). Additionally, alternative
measures such as government and private expenditure on education are hard to get for the
whole sample. That limits the pool of relevant choices to TSER. Further, considering
recommendations on the using human capital indices with time lag, decrease of TSER in 1995-
1997 is associated with the economic performance in 2001.
To capture the effect that natural resources have on economic growth in CIS, the shares of
natural, physical and human capital in national wealth in 1990 are regressed with economic
growth per capita in PPP terms in 2001 (source is WDI 2003: NY.GDP.PCAP.PP.CD). Since all
studies point out the high importance of governance, the measure of its quality from World
Bank is included as an additional explanatory variable in the model. At the end, to correct for
the multicollinearity, human capital and natural capital shares are interacted.
5.3. Testing the Channels
To check for the relevance of natural resource curse for the CIS countries, predicted by the
theoretical and empirical studies, let us start with looking into the relationship between natural
resource abundance and economic growth. Scatterplots show no trend in association between
those variables (see chart 5.1/5.2), which makes it rather obvious that natural resource
abundance is not sufficient to explain the economic performance in CIS countries in 1992-
2001. Therefore, we should find the extent of the effect on economic growth that can be
Charts 5.1 and 5.2 Natural Resource Abundance and GOP Per Capita Growth
.5 Turtn.nl
• hIN. "",",. ...... -.5
<> -1.5 <> N rio Kyrgyz R JCyrvy.r R 0> -2.5 :!! Ruu'" RUlli,
1 -3.5
.. :a -4.5
c'J -5.5 rl:
Uk"!n' Uk,.ln_
.'i -6.5 Mokh..,. Moldon TaJlkbt
-7.5
-8.5
.4 . .6 . Av. Share of NR In Exports
-1.9 -1.7 -1.5 -1.3 -1.1 -.9 -.7 Log of Av. NR Share In GOP
34

accounted for natural resource endowments along with physical and human capital and
governance effectiveness. The results, presented in annex 5.6a, are significant at 1% level of
significance and explain 93% (see adjusted R2) of the growth performance in 2001. Due to the
output fall in most of the observation time, the signs of national wealth shares are, as
expected, negative. The coefficients indicate more or less similar effect of them on growth. It
has to be noted, however, that physical capital is slightly large in absolute terms than human
and natural capital. Also, the governance quality turns to be relevant and positively correlated
to growth factor. In this mode, to look at the modified effect that human and natural capitals
have on growth separately, the dummy for resource-rich and resource-poor CIS countries is
interacted with the share of human capital in national wealth. In this way, the positive sign of
the interaction term indicates to the higher relevance of human capital for the growth
performance of resource-rich countries compared to resource-poor ones.
In brief, the growth performance in CIS countries from 1990 to 2001 can be explained, more
or less similarly, by of shares natural, human and physical capital in national wealth and the
quality of governance. For some part, the combination of natural and human capitals are
responsible, the latter being especially important for resource-rich countries.
Let us now investigate further the natural-resource-specific economic developments of CIS
countries. In following that aim, first, export data shall be disaggregated. As a result, three
manufacture-based economies among CIS countries52 are distinguished. Those are Armenia,
Belarus and Ukraine (further referred to as MG). By further subdivision of the primary product
based CIS economies (further referred to as PPG), the groups are delineated according to the
extent of the agriculture and mineral product shares in their exports. Resulting from it, three
agriculture-based (Kazakh Republic, Moldova and Uzbekistan, further referred to as AG) and
six mineral based CIS economies (the rest, further referred to as FOMG) are discerned (see
Chart 5.3. GDP GnlW\h Index, CIS Countries (19Sg=lGO, Group "VUlg.)
110
"
" 70
" 50 ............... --
~~----------------------------------401--___________________ - _______ _
~ ~ ~ ~ ~ ~ ~ ~ 00 ~ 00 _ m
+Av.PPG +Av.HG -a-Av,MG ..... Av.Ml - 'Av.FOMG
Source: WDI, 2003
52 Same trend in commodity shares in export and in GDP makes possible to distinguish between groups and keep both indices of natural
resource endowment
35

annex 5.2). In accordance with the theory, MG and AG countries do exhibit divergent economic
performance of resource-rich states (see chart 5.3). Indeed, manufacture based economies, on
average, recover sooner and grow better than primary product based ones. However, with the
further bifurcation of PPG into AP and FOMG, changes in the group's gr.owth pattern can be
observed. Namely, AG outperforms MG during 1989-2000 years. As for the FOMG, they exhibit
the worst growth picture in line with predictions. Let us turn to the unexpected part of the
EOA. Analysis of AG countries in greater detail reveals well-developed interlinkages between
agricultural and manufactured sectors in Kyrgystan and Uzbekistan. Here, high revenues from
the cotton sector were used to develop industrial sector (see annex 5.3). Based on the
analysis, we can conclude: the explanations of CIS growth performance depends on
interlinkages between natural resource and other sectors 53•
Let us explore further the channels that were singled out in earlier chapters. Theoretically,
resource booms cause real exchange rate appreciation and, through it, de-industrialisation and
a further collapse of growth. Therefore, the analysis of the impact of the real exchange rate on
.. _ economic performance starts with looking for the evidence of the de-industrialisation in CIS
economies. On general level, the data shows a decreasing trend in the share of industry in
GOP as well as in the share of employment in industry (see section 3.3). Further inquiring into
GOP and employment sectoral composition change (see annex 5.3 and 3.5) shows the same
trend in APG countries: they have experienced a decrease in sectoral share of industry,
construction and, to a lesser extent, agriculture. At the same time, employment in agriculture
has increased. it is Important to note that APG countries were agriculture-based before the
transition also (with approximately 40% of GOP in 1990-1992). Having considered that, it can
be inferred that in APG countries there is a crowding out of industry (approximately 30% share
in GOP and 17% share of employment in 1990-1992) by trade and services sectors. In FOMG
countries the trend is the same as in PG, with exception of Azerbaijan where we observe the
raise in shares of industry and construction in GOP. The explanation for it is the fact that both
Charts 5.5-5.7 Real Exchange Rate with Natural Resource
Abundance and Economic Growth
.07 TIllkl,1
.06
0 .05 0
"nrblll
~ .04 It rVf: R
i OIlIl:lIgllI
m .03 g>
i .02
m .01 &!
industry and construction is boosted by the
fuel sector, which -is the main industry of the
country historically (EIU Country Report,
2002). Thus, the growth of industry in
Azerbaijan does not reflect an increase in the
manufacturing sector. On the contrary,
manufacturing sector has decreased from
60% in 1997 (with re-start of oil intensive oil
exports) to 33% in 2002 (EIU Country
,,,kmo, Report, 2003). Therefore, the same Runla
-.01 conclusions can be drawn: industry 50 ~ ro ~ 00
Sh. of NR In Exports. 1995-2001
53 For further readln gs see Ofer and Pomfret, 2003
36

.1
.075
. 05
.025
10 15
Tu/'tmolnl
RUlli"
""""J
--Run!.
20 25 30 Share ofNR In GOP, 1995-2001
O'Oflil.
KyrgyzR
Kllllkhtl
35
T.J!k111
Moldo ....
(especially manufacturing) is crowded out in
FOMG and APG countries and resources
moved to Trade and Catering and Service and
Other sectors. Additionally, labour moved to
agricultural sector.
Furthermore, as the calculations show, real
T.-. exchange rate is, indeed, overvalued in most
40 of the PPG countries in 1995-2001 years (see
annex 5.1)54. Let us look if the latter has a
role to play in de-industrialisation by
checking for correlation between real
exchange rate overvaluation and natural
resource abundance and economic growth
(see charts 5.5 - 5.7). Charts show highly
scattered pattern, meaning the real exchange
~ ~--------------------------------~-------------rate overvaluation in resource-rich CIS
countries is neither explained by the natural -.01 .04 Real Exchange Rele, 1995-2001
resource abundance nor is it accounted for
the economic growth performance. In conclusion, the real exchange rate movement is
explained by other macroeconomic factors than resource abundance. Next channel to test is
the institutions/policy one. Although the governance channel proved to be relevant as
measured by the government effectiveness index, the high incidence of attributing growth
failures to the corruption in transition countries, makes testing for the empirical support of the
argument tempting. Not only does corruption seem to be the most important channel of weak
institutions/policy failure, but also one of the few tested to support it. Therefore, the use of
Chart 5.8 and 5.9 Plots of Natural Resource Abundance for 1992-2000 with Control of Corruption for year 2000
-.5
-1
-1.5
Control Of Conuption, 2000 __ Fittad values
"".'
AutbIQ TUlt.n.nl T.jIlbt
~------,-------,-------~-----.2 . 4 .6
Av.Sh. NR in Exports, 1992-2000
Control Of COlTUption, 2000 __ Filled values
-.5
-1
.. 1.5 TIJibI
~---------T--------~----------~ .1 .2 • .4 Av.Sh.NR In GOP, 1992-2000
54 The year 1995 is used as a starting date due to data problems that make it difficult to calculate real exchange rate before that period fro the
whole sample
37

Chart 5.10 Plot of Control of Corruption
with Economic Growth, 2000
T-.ri
AlllbllJ
-1.5
Log of EG In 2000 __ Fitted values
MeldDv,
-1 -.5 Control Of COlllJption, 2000
Control of Corruption Index is made.
Following theoretical arguments, to check
how corruption is associated with natural
resource and growth· performance, the
Control of Corruption Index in 2000 is
plotted against average natural resource
abundance in 1992-2000 years. Plots (see
charts 5.8 and 5.9) show some degree of
negative correlation between a natural
wealth and control of corruption, i.e.
increase in average share of natural
resources is associated with the decrease in
control of corruption. Specifically, a variation in natural resource abundance explains at least
34% of variation in control of corruption (see the adjusted R2s in annex 5.6b/c). To inquire into
the relationship between corruption and economic growth, keeping the logic of the argument,
iffdices for both in 2000 have been plotted. The alternatives are limited by the difficulty to use
difference between the corruption indexes as an explanatory variable in cross country analysis.
The reason behind it is that the difference in corruption indices captures only the extent of
change and not the degree of corruption. For instance, countries with more corruption that
remained at the same level of it will be shown as better off than less corrupt countries whose
indices have increased.
Plotting economic growth and Control of Corruption in 2000 shows unexpected results (see
chart 5.10). Namely, at 5% significance level, the improvement in controlling of corruption is
responsible for the decrease of economic growth by about 30 % (see adjusted R in annex
5.6d). The results are different from the theory: corruption is said to have detrimental effect·
on growth. Here, altemative hypothesis can be used to explain the picture. Namely, that in the
presence of other distortions, corruption can be a second-best solution to the original
Charts 5.11-5.13 Plots of Natural Resource Abundance with Decrease in TSER, Average 1995-1997
2
m ~ ""' .. ~ Ii w UJ l-e
ti -2
C3 ... ~ -4
.2
ttankhll I(V'lIYzR Ruul!
UtMk11l
.4 .6 .8 Av.Sh.NR In Exports, 1992-1997
In ~ '" ~ ffi I!! .5
ti C3
2 .,,,.. .... T"""ri
TI,....,klrbat
.... "'" Jtylg'(ZR Kllnl,
Ub'lin.
Uxb,kllt
-2 Moldcd ... ""
-4
-3 -2 -1 Log of Av.Sh.NR In GOP, 1992·97
DUfll_
0
38

Economic Grov.ih, 2001 _Frttedva!ues
.25 .....
. 15
.1
.05 I...-,-___ ---, ____ -,.-__ T_"""_ •• _,-·2 0 2
Deer. in TSER, 1995-1997
distortions: it may actually increase
efficiency, among other things, by buying
the political decisions that are beneficial in
otherwise highly bureaucratic environments
(see section 2.3) .
Lastly, tests of human capital show that
although decrease of TSER in 1995-1997
can explain a part of the growth in 2001,
natural resource abundance has no role to
play in
it (see charts 5.11-5.13). As for the human capital measured in TSER as part of explanation of
economic performance of CIS countries, with 55% of explanatory power it shows that
increase in growth is caused by less decrease in human capital (see annex 5.6e). At this point,
the previous finding of human capital importance for resource-rich countries shall be returned
to. The explanation for these different outcomes could be found in the fact that, as was argued
on repeated occasions, since 1990 importance of natural resource for CIS countries has
changed. Namely, more countries and in more extent, start to be dependent on natural
resources. Hence, the starting positions of CIS countries in terms of "endowments" were
neutralised by the turbulent changes during transition times and at this point natural resources
alone have little to say in explaining human capital dynamics.
5.4. Conclusion
As the analysis shows, the hypothesis of indirect channels through which natural resource
abundance should have been responsible for divergent growth performance of CIS countries,
was not supported by evidence available at present. Indeed, neither real exchange rate, nor
human capital and institutions channels performed well to the test: neither of indexes used
indicate strong and predicted association with both, natural wealth and economic growth.
Similarly, natural resource abundance as measured by shares of natural resources in exports
and GDP has failed to explain economic growth pattern in CIS countries' transition to a market
based system. However, at the same time, manufacture-based CIS economies did show better
economic performance than natural resource dependent ones. Moreover, mineral based
economies display worst performance of all. Therefore, the development of the manufacturing
sector proves to have a definite positive influence on growth. An additional finding of the paper
is that of the importance of interlinkages to Kyrgystan and Uzbekistan55 to escape growth
collapse, despite being diffused resource economies. This leads to the conclusive pOint of the
55 Especially, Uzbekistan's growth attracts attention: with mild crises and full recovery to 1989 level in 2001 (see annex 3.2). The fact that this
state has not liberalised trade and commodity prices is an additional argument (see footnote 38).
39

high importance of decisions that national governments took to use resource rents to support
industrial sector. On top of all, the results show that, quite contrary to the whole body of
literature of the importance of institutions, corruption, here partly explained by natural
resources, has some positive impact on growth. Having said that, first, the importance of
other macroeconomic factors and second, the limited focus area of this paper has to be
stressed. Indeed, corruption might have positive impact on growth but a detrimental effect on
welfare.
In short, the empirical part of the paper gives a possibility to infer that both the analytical
framework and the policy recommendations for rE;!source-rich CIS have to be different from the
present ones. The growth performance in those countries is seems to be in most part
explained by the traumatic experience of transition than indirect channels outlines in the
natural resource literature. Additionally, it is also evident that policies do have a say in
determining the sustainable economic growth in CIS. However, here the right policy is the one
directed at industrial revival, especially in light of the evidence of overall de-industrialisation.
40

\'

CHAPTER 6. POLICY IMPLICATIONS AND CONCLUSIONS
As mentioned, resource-rich countries of CIS are recommended to liberalise the international
trade, capital and natural resource markets and pursue tight fiscal and monetary policies.
These recommendations are based on theoretical arguments and empirical findings that
emphasise high probability of growth collapse of countries with natural wealth though different
channels. As the analysis in the present paper shows, empirical evidence of CIS countries does
not support this theoretical rationale. Additionally, the current study identified high need for
re-industrialisation in CIS countries. Consequently, the recommendations have to be revised
and corrected. This chapter aims at sketching the general framework of policy implications of
the findings of this paper. Before arriving at this result, however, the logic and content of the
current advises are important to be demonstrated. This is explained by the necessity to reveal
the effect they might have on CIS re-industrialisation and related to it policies. The
recommendations are considered in accordance to the channels singled out in the previous
part of this paper.
Real Exchange Rate Overvaluation
The focus of policy recommendations concerning the real exchange rate overvaluation consist
of ·primary interest in spending efficiency and in open trade promotion. Macroeconomic policies
to avoid or reduce exchange rate appreciation mostly include sterilisation measures such as
accumulating foreign reserves and matching these with additional savings in the form either of
a government current account surplus or of greater private savings (Petersen and Budina,
2001; Rosenberg and Saavalainen, 1998). As for the open trade part, its importance is
believed to be twofold: first is to avoid the danger of application of import substitution strategy
to protect the shrinking manufacture sector and second, to stabilise the resource revenues. It
should be noted that following the recommendations and examples of other resource-rich
countries experiences (Kuwait, Norway, Botswana, etc.), Kazakhstan and Azerbaijan have
created special funds (Petersen and Budina, 2001).
It is important to recognise that these recommendations are based on the (Neo) Classical
assumptions of the market and trade liberalisation. Indeed, the argument builds on increased
savings and free trade as the foundations of sustained growth. Following comparative
advantage doctrine, resource-rich CIS countries should develop primary sector, since they are
relatively endowed with it. However, if the assumptions are questioned and contrary to the
belief, for instance, primary products can not be sold without limits at international price,
resource-rich CIS economies end up being trapped in the dependency on their natural
resources. The latter possibility can be considered seriously, since the theoretical rationale of
the discussed channel was not supported by the empirics in CIS case. Therefore, the
alternative views have good chances to be accepted. In most part, they advocate the
41

development of the industrial basis, simultaneously, calling for the adequate state intervention
to develop dynamic trade structure (Sarmiento, 1988). Those views are backed up by the
empirical evidence of the state-led export-promotion based success of Asian economies (World
Bank, 1993). On top of all, the supportive evidence exists that no developed country achieved
the present-day level without having promoted their industries in the past (Chang, 2002).
Therefore, instead of saving revenues from the natural resources, they rather are used to
provide subsidies for the tradable sectors. At the same time, some from of tariffs should be
used to improve chances of the industrial development.
Weak Institutions and Poor Policies
The institutions and policies are evaluated from the same stand of revenue management.
Apparently, creation of funds neither guarantees an appropriate fiscal stance nor substitutes
for sound fiscal and macro-economic management. Concern over here is governance of the
funds' operation and their independence from political circumstances. Therefore, the fiscal
discipline and political reforms to ensure transparency and accountability of institutions and
fight corruption, is highly recommended. The topic has two important sub-issues. First one is
the control of the way the money from these funds is invested. It goes as far as calling for
international community to the refuse investments in predatory states. Another sub-issue is
the avoidance of the increased borrowing.
To respond to it, the findings of the pervious chapters of this paper shall be used: corruption is
neither inherent nor detrimental factor for the CIS economies. In this case, stricter rules,
among other possible positive outcomes, can inhibit the government input into policies of
industrialisation and diversification of the economy. Again, experience of Asian tigers supports
the importance of this option (World Bank, 1993). As for the foreign borrowing and related
indebtedness, although unsustainable debt is detrimental on the long run, however the
possibility to get financial resources in times of need is equally important. It would be better if
recommendations considered the significance of investable funds for the CIS countries at this
stage and allow for the development of sustainable strategy of using the foreign aid and own
resources rather then wait for the benefits allegedly accrued from the FDI or ensure
transparency. Having said that, the significance of the quality of public institutions shall not be
undermined.
Deteriorated Human Capital
The main problem from the point of view of this channel is a little investment in human capital,
negatively enforced by lack of the incentives to skilled labour. Therefore, the main reasoning
comprises of the providing for the increase in education among public by encouraging the
private sector. It is backed up by the belief that privatisation of public education is a definite
way to increase the efficiency of the sector.
42

However, the negative outcomes of privatisation experience of educational sector in CIS such
as the decreased secondary and tertiary education in CIS countries calls for the different
approach. It seems easier to support the educational attainments than to build it all over
again, the need for which can be the reality of CIS countries if the trend is not reversed. Again,
public investments are crucial in the absence of the other realistic sources to contribute to the
sustainable level of human capital, which proved to be important to the growth performance
(see section 5.3).
In a word, the current study stresses the importance of the industrial, trade and technology
policies in resource-rich CIS economies to avoid the growth collapse as a consequence of
resource-dependency. However, these findings should be revisited to assess the longer path of
transitional experience and its peculiar impact on growth perspectives.
43

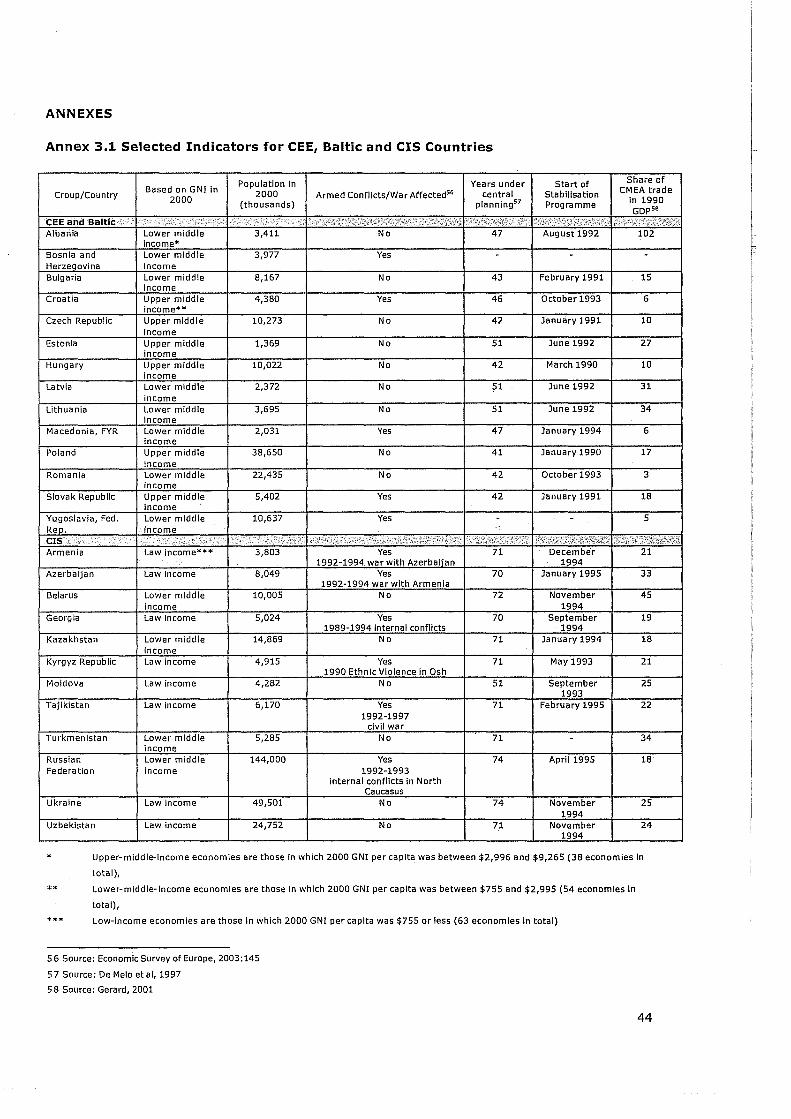
ANNEXES
Annex 3.1 Selected Indicators for CEE, Baltic and CIS Countries
Population in Years under Start of Share of
Croup/Country Based on GNI in 2000 Armed Conflicts/War Affected56 central Stabilisation CMEA trade
2000 In 1990 (thousands) planning5? Programme GDp sS
CEE and Baltic:;: " ,:" '>',::''':,'' :,:,,'::,":,':,::, ,::', '",,,', '>',:(;,:,l ,; ': :':;:';,', :':?::",: i,',:':::; ;:;"'::',,~:!;, ",:", 1';c,:::;',',:'C;::':,,::<':", ""f"',',"',, ;;';:;::::\.)':!:,
Albania Lower middle 3,411 No 47 August 1992 102 income*
Bosnia and Lower middle 3,977 Yes - - -Herzegovina Income Bulgaria Lower middle 8,167 No 43 February 1991 15
income Croatia Upper middle 4,380 Yes 46 October 1993 6
income** Czech Republic Upper mlddl e 10,273 No 42 January 1991 10
income Estonia Upper middle 1,369 No 51 June 1992 27
income Hungary Upper middle 10,022 No 42 March 1990 10
income Latvia Lower middle 2,372 No ;;1 June 1992 31
income Lithuania Lower middle 3,695 No 51 June 1992 34
income Macedonia, FYR Lower middle 2,031 Yes 47 January 1994 6
income Poland Upper middle 38,650 No 41 January 1990 17
income Romania Lower middle 22,435 No 42 October 1993 3
income Slovak Republic Upper middle 5,402 Yes 42 January 1991 18
income Yugoslavia, Fed. Lower middle 10,637 Yes - - 5 Rep. income CIS , :', ',,,:",\", "
',,;' , :», :, I "i:J :,:ii-:',;,:'.·:>',: ,,:i.:::: :: "':::""':'::::":"',: ,;<:::;:;, I ,';i:,:,,:;), ','/",':",:$",;:::" I":::;;:t,~;,~::::::,::,,~:~:':~:';
Armenia Law Income*** 3,803 Yes 71 December 21 1992-1994 war with Azerbaijan 1994
Azerbaijan Law income 8,049 Yes 70 January 1995 33 1992-1994 war with Armenia
Belarus Lower middle 10,005 No 72 November 45 income 1994
Georgia Law income 5,024 Yes 70 September 19 1989-1994 internal conflicts 1994
Kazakhstan Lower middle 14,869 No 71 January 1994 18 income
Kyrgyz Republic Law income 4,915 Yes 71 May 1993 21 1990 Ethnic Violence In Osh
Moldova Law income 4,282 No 51 September 25 1993
Tajikistan Law income 6,170 Yes 71 February 1995 22 1992-1997
civil war Turkmenistan Lower middle 5,285 No 71 - 34
income Russian Lower middle 144,000 Yes 74 April 1995 18 Federation income 1992-1993
internal conflicts In North Caucasus
Ukraine Law income 49,501 No 74 November 25 1994
Uzbekistan Law income 24,752 No 71 November 24 1994
* Upper-middle-income economies are those in which 2000 GNI per capita was between $2,996 and $9,265 (38 economies In
total),
** Lower-middle-Income economies are those in which 2000 GNI per capita was between $755 and $2,995 (54 economies In
total),
*** Low-income economies are those In which 2000 GNI per capita was $755 or less (63 economies In total)
56 Source: Economic Survey of Europe, 2003: 145
57 Source: De Melo etal, 1997
58 Source: Gerard, 2001
44

Annex 3.2 CIS GOP Growth Index (1989=100), by Country
Armonia Real GOP (1989=100) Azerbalajan Real GOP (1989=100)
t20
,00
80
80 ---""... 40
20
1989 '990 1991 1992 '''''' ,994 '995 , ... tI'" '998 ,m 2000 1989 1£OJ 1991 1002 1993 1994 1995 1900 1997 1'S198 1999 2000
1- -Average CIS Armol'lle I -Av.CIS Azatbaljan I
Belarus Real GOP (1989=100) Goergla Real GOP (1989=100)
'20 120
'ad 'DO .....,;; 80 so
80 ....... -- - - - 80 ....... -........ - --- ---40
20 20
1989 '990 '99' 1992 'S93 1994 1995 ,m '!l97 '998 ,899 2000 19B9 1990 1991 1992 1993 1994 1995 1996 1997 1996 1999 2000
1- -Av.,.gICIS e.lorull I
Kazakhstan Real GOP (1989=100) Kyrgyz Real GOP (1989=100)
'20 '''' toO 'DO
80 8D
80 80
~::..-..,-..... ~- --40
20 20
1989 '990 1991 1992 'S93 1994 '995 ,m tI'" , ... '999 2000 19159 19!1) 1991 1932 1993 1994 1995 1998 1997 1995 1999 200CI
-Av.,.goCIS Kllzakhal .. n I
Moldova Real GOP (1989=100) Russia Real GOP (1989=100)
120 '20
tm 'DO
so so
80 80
40
20
1989 '990 1991 '992 ,,., ,994 '995 'm "", 1998 1999 2llOO 1989 1900 1991 UUZ 1993 1994 1995 1900 1997 1998 1999 2IlOO
1- • AveragllCIS MokfcVl1
45

Tajikistan Real GOP (1989=100) Turkmonistan Roal GOP (1989=100)
19B9 1990 1991 1992 1993 1994 1995 1996 1997 1,,", 1999 2000 1989 1990 1991 1992 1993 1994 1995 1996 19S7 1998 1009 zooo
1- -Average CIS TaJlki.tan I Turkmenl.tan I
Ukraino Roal GOP (1989=100) Uzboklstan Real GOP (1989=100)
"" "" lC1l 100 ....... 80 00
60
......... -....... _--".,... '" 2.
1969 1990 1991 1992 1993 199. 1995 1996 1997 1,,", 1999 20r0 1989 1900 1991 1992 1993 1994 1995 1996 1991 1995 1999 2000
-AV'rageCIS -Ulmllne I Source: World Development Indicators, 2002
46

Annex 3.3 CIS GOP Per Capita Growth (Annual % Change)
GDP per capita growth (annual) base on constant Leu 1990 1991 1992 1993 1994 1995 1996 1997 1998 1999 2000 2001 Average
Armenia -12 -42 -9 5 7 6 3 7 3 6 10 -1.3
Azerbaijan -12 -1 -26 -23 -20 -12 1 6 ~O 7 11 10 -3.9
Belarus -1 -1 -10 -8 -12 -10 3 11 8 3 6 4 -0.5
Georgia -15 -20 -40 -39 -42 3 11 11 3 3 2 5 -10.0
Kazakhstan -5 -11 -5 -9 -13 -8 0 2 -2 3 10 13 -2.1
Kyrgyz Republic 6 -8 -14 -15 -20 -5 7 10 2 4 5 6 -2.0
Moldova -2 -16 -29 -1 -31 -1 -6 2 -7 -3 2 6 -7.2
Russian Federation -3 -5 -15 -9 -13 -4 -3 1 -5 5 8 6 -3.0
Tajikistan -1 -7 -29 -16 -21 -12 -17 2 5 4 8 10 -6.2
Turkmenistan 1 -5 -5 -10 -17 -7 -7 -11 7 17 18 20 0.0
Ukraine -6 -8 -10 -14 -23 -12 -10 -3 -2 0 6 9 -6.2
Uzbekistan 2 0 -11 -2 -5 -1 2 3 4 4 4 4 0.2
CIS Average GOP Growth (annual) -3.3 -7.9 -19.6 -13.0 -17.6 -5.4 -1.1 2.9 2.7 4.2 7.1 8.6 -3.5
47

Annex 3.4 CIS GOP Sectoral Composition Change, 1990-2001
Country Agriculture Industry Construction Transport and Trade and Catering Services and Other
Communication
Av. 1990- Av. 1999- Av. 1990- Av. 1999- Av. 1990- Av. 1999- Av. 1990- Av. 1999-2001 Av. 1990- Av. 1999- Av. 1990- Av. 1999-1991 2001 1991 2001 1991 2001 1991 1991 2001 1991 2001
Armenia 19.8 21.2 32.8 25.7 14.5 8.8 6.3 9.0 5.1 8.3 21.6 26.5
Azerbaijan 28.5 13.7 22.8 30.2 7.4 11.7 7.2 15.7 4.1 5.3 30.6 23.4
Belarus 21.7 6.6 39.1 29.0 7.7 27.6 5.9 14.5 5.5 2.8 20.5 19.6
Georgia 28.3 21.3 24.8 14.7 8.3 3.8 6.9 13.5 6.8 17.1 24.8 29.4
Kazakhstan 38.1 8.9 29.1 30.7 14.8 5.2 9.1 11.7 7.0 12.7 3.9 31.5
Kyrgyztan 35.9 34.7 24.0 22.0 6.9 3.7 5.5 3.7 28.1* 36.0*
Moldova 41.8 26.6 36.0 18.8 8.0 3.3 4.3 10.1 8.1 15.4 2.0 25.8
Russia 14.7 8.0 36.5 31.5 9.1 6.5 8.4 9.0 8.9 20.7 22.6 24.4
Tajikistan** 27.1 17.1 36.4 19.8 9.0 2.9 4.6 2.6 5.0 12.5 17.9 45.3
Turkmenistan*** 27.5 21.6 46.3 35.1 14.6 12.1 6.3 11.0 0.0 5.5 5.5 14.7
Ukraine 30.4 13.2 41.8 28.1 10.3 3.7 5.5 11.6 7.1 9.1 5.0 34.5
Uzbekistan 44.7 34.0 26.8 16.0 13.6 7.0 4.8 0.0 7.9 0.0 2.5 43.0
Average 29.5 18.8 34.5 24.9 9.6 8.0 6.0 12.2 6.4 11.4 13.5 27.6
* Figures include share of services and other
** Figures for the 1997 (latest available) *** Figures for the 2001 (only available in the period of 1998-2002)
Source: Statistical Yearbooks of Interstate Statistical Committee of CIS States, Economist Intelligence Unit Country Reports and IMF Country Reports with Selected Issues and Statistical Appendixes
48

Annex 3.S Sectoral Distribution of Labour Force (% of Total Employment) for CIS Countries, Averages for 1990-1992 and 1998-2000
Education, Health, Trade, Personal Finance, Agriculture, Social, Personal Transport, and Household Insurance, Real
Country Hunting, Forestry Industry Construction Services, Public Storage and Goods Repair, Estate and Undefined Sectors
and Fishing Administration Communication Hotels and Business Services and Defence Restaurants
Av. Av. Av. Av. Av. Av. Av. Av. Av. Av. Av. Av. Av. Av. Av. 1990- 1998- 1990- 1998- 1990- 1998- 1990- 1998- 1990- 1998- 1990- 1998- 1990- 1998- 1990-1992 2000 1992 2000 1992 2000 1992 2000 1992 2000 1992 2000 1992 2000 1992
Armenia 24.0 42.4 27.8 15.0 10.2 4.2 22.7 25.7 4.7 3.7 5.6 8.4 3.0 - 2.0
Belarus 21.7 21.0 29.4 28.7 8.9 5.9 21.9 23.4 7.1 6.4 6.9 11.6 0.6 1.2 4.3
Ukraine 20.0 20.5 30.9 26.0 8.9 5.6 24.1 19.2 7.0 7.6 7.4 11.8 3.7 3.5 1.3
Average MG 21.9 28.0 29.4 23.2 9.3 5.2 22.9 22.8 6.3 5.9 6.6 10.6 21.9 2.5 II
Azerbaijan 332 42.3 12.8 7.0 6.5 4.2 15.3 22.0 5.6 4.6 10.2 17.1 0.3 2.9 4.3
Georgia 28.4 50.9 17.0 8.3 8.6 1.6 24.9 21.2 7.2 4.1 6.0 10.2 3.1 3.0 2.6
Kazakhstan 22.9 23.1 15.8 14.8 3.8 4.1 18.2 21.6 10.0 9.1 25.1 23.7 4.2 3.6 -Russia 14.5 11.8 31.1 22.0 10.4 6.0 21.3 31.7 7.8 9.2 8.2 13.2 8.6 4.5 -
Tajikistan 44.8 65.7 , 14.0 7.8 7.6 2.5 21.2 17.2 4.6 2.5 5.4 3.3 1.5 0.2 2.0
Turkmenistan 42.8 48.5 10.2 12.3 10.4 5.9 23.7 19.4 - 11.2 - - - 1.0 7.4
Average 31.1 40.4 16.8 12.0 7.9 4.1 20.8 222 5.9 6.8 9.2 11.3 6.8 2.7 0.5 FOMG
Kyrgystan 35.5 51.5 17.9 9.0 7.8 2.7 23.6 23.0 5.3 3.9 6.5 7.5 3.4 1.6 -Moldova 35.1 49.9 20.9 10.8 7.6 2.9 21.2 18.7 5.2 4.5 6.7 10.8 2.1 2.4 -
Uzbekistan 41.5 39.0 14.4 11.7 8.1 6.5 22.2 22.0 4.8 4.2 5.6 8.2 1.5 0.6 1.4
Average PG 37.4 46.8 17.7 10.5 7.8 4.0 22.3 21.2 5.1 4.2 6.3 8.8 37.4 0.5 2.5
Average PPG 33.2 42.5 17.1 11.5 7.9 4.0 21.3 21.9 6.3 5.9 9.2 l!J!. 3.1 2.2 3.5
Average 30.4 38.9 20.2 14.5 8.2 4.3 21.7 22.1 6.3 5.9 8.5 11.4 2.9 2.2 4.4 CIS
Sources: Own Calculations based on data from International Labour Organisation, Euromonltor and Statistical Yearbooks of Interstate Statistical Committee of CIS States. For the way different classifications were readjusted to fit Into the main grouping of labour source sectoral distribution (Euromonltor) see annex 3.6
Av. 1998-2000
-3.4
5.8
0.0
-0.6
--
0.8
1.6
0.0
0.1
0.6
6.9
0.0
1.8
2.5
49

Annex 3.6 Sources of classification of labour force sectoral distribution
Groups according to Groups according to Statistical Yearbooks of Groups from Euromonitor ISIC" rev.2, ILO ISIC rev.3, ILO Interstate Statistical Committee
of CIS States
Agriculture, Hunting, 1 A+B Agriculture and Forestry Forestry and Fishing
from Non-material Sphere (housing, Community, Education, public utilities and personal services, health Health, Social, Personal 9 L+M+N+O care, social security, physical culture and
Services, Public Admin and sports, education, culture and arts, general Defence administration and defence, private non-
profit orQanisations)
Construction 5 F Construction (from industry and
construction)
Manufacturing 3 0
Mining And Quarrying 2 C Industry (from industry and construction)
Electricity, Gas and Water 4 E
Supply
Finance, Insurance, Real from Other (information services), from Estate and Business 8 J+K Nonmaterial Sphere (science and
Services scientific research, credit, insurance) from Other (transport of goods, road
Transport, Storage and 7 I
maintenance, communication); from non-Communications material sphere (passenger transport,
communication) Trade, Motor Vehicles And from Other (Wholesale trade, Retail trade
Personal And Household 6 G+H and catering, material supply,
Goods Repair, Hotels And procurement) Restaurants
Undefined Sectors 0 P+Q+X from Other (other services)
59 ISIC stand for International Industrial Classification of all Economic Activities; rev.2 was done in 1968, rev.3 in 1990.
50

Annex 3.7 Educational Composition of Unemployment in CIS countries
Unemployed With Higher With Special With General With Primary labour force (% of Total) Education Secondary Education Secondary Education Education
1992 2001 1992 2001 1992 2001 1992 2001
Armenia 17.1 12.4 27.2 24.5 47.4 56.9 8.3 6.2
Azerbaijan 16.7 25.5 34.8 34.6 41.3 35.4 7.2 4.5
Belarus * 9.6 7.9 19.8 15.3 61.8 62.8 8.8 14.0
Georgia
Kazakhstan 11.9 8.0 28.8 20.7 50.3 49.8 9.0 7.9
Kyrgyztan 30.8 10.1 31.3 23.4 29.9 57.1 8.0 9.4
Moldova 16.8 7.2 27.7 41.7 38.9 32.9 16.6 18.2
Russia 13.2 4.6 24.7 18.6 48.8 61.3 13.3 15.5
Tajikistan
Turkmenistan 18.0 12.8 27.4 24.3 37.8 49.2 16.8 13.7
Ukraine ** 15.0 10.1 52.5 54.4 27.1 29.9 5.4 5.6
Uzbekistan 14.8 5.5 28.8 25 47.1 .54.2 9.3 153
Average 16.4 10.4 30.3 28.3 43.0 49.0 10.3 11.0
Median 15.9 9.1 28.3 24.4 44.2 52.0 8.9 11.6
* Earliest available observations are for 1995 ** Earliest available observations are for1996
Source: Statistical Yearbooks of Interstate Statistical Committee of CIS States
51

Annex 4.1 Classification of Commodity Groups based on Commodity Codes of the Standard International Trade Classification (SITC), rev.3.
Commodity Codes
Manufacture Products
Primary Products
Agricultural Products
Fuels, Ores and Minerals
Corresponding SITC Codes, Rev.3
5 (Chemicals and related products) 6 (Manufactured goods classified chiefly by material) excluding division 68 (Non-ferrous metals) 7 (Machinery and transport equipment) 8 (Miscellaneous manufactured articles) o Food and live animals 1 Beverages and tobacco 4 Animal and vegetable oils, fats and waxes 2 (Crude materials, inedible, except fuels) excluding divisions 27 (Crude fertilizers, other than those of division 56, and crude minerals (excluding coal, petroleum and precious stones) and 28 (Metalliferous ores and metal scrap) 27 (Crude fertilizers, other than those of division 56, and crude minerals (excluding coal, petroleum and precious stones) 28 (Metalliferous ores and metal scrap) 68(Non-ferrous metals)
52

Annex 4.2 Shares of Commodity Groups in Export for CIS countries (in 0/0), 1992-2001 (own calculations based on UNCTAD Export Data)
Countries/Commodity Groups 1992 1993 1994 1995 1996 1997 1998 1999 2000 20Q1
Armenia
Agricultural Products 6 2 15 16 16 16 16. 12 20 14
Fuels, Ores and Metals 29 10 8 28 28 28 28 23 35 23
Manufacture 66 88 76 56 56 56 56 65 45 63
Azerbaijan
Agricultural Products 54 46 42 27 13 23 17 9 6 3
Fuels, Ores and Metals 34 42 25 43 68 63 70 82 88 92
Manufacture 11 13 33 30 20 14 13 9 6 4
Belarus
Agricultural Products 13 17 6 12 12 12 12 11 10 11
Fuels, Ores and Metals 34 24 7 10 14 14 14 14 24 22
Manufacture 52 59 20 74 72 72 72 71 63 65
Georgia
Agricultural Products 5 8 29 25 30 29 29 29 30 28
Fuels, Ores and Metals 82 65 19 14 26 29 29 29 37 35
Manufacture 13 27 52 61 44 40 40 40 32 34
Kazakhstan
Agricultural Products 6 6 6 13 15 15 10 9 8 8
Fuels, Ores and Metals 41 48 56 49 53 57 64 63 73 73
Manufacture 53 45 37 38 32 27 23 25 18 18
Kyrgystan
Agricultural Products 14 35 35 35 40 40 40 22 22 22
Fuels, Ores and Metals 9 23 23 23 22 22 15 18 18 18
Manufacture 57 41 41 41 38 38 45 20 20 20
Moldova
Agricultural Products 27 68 68 73 79 74 77 70 65 65
Fuels, Ores and Metals 23 4 4 4 1 1 1 3 2 1
Manufacture 51 28 28 23 20 25 23 27 33 34
Russia
Agricultural Products 10 9 5 5 5 5 5 5 4 5
Fuels, Ores and Metals 52 51 53 53 53 56 54 53 60 62
Manufacture 24 27 26 26 23 28 25 22 22
Tajikistan
Agricultural Products 69 55 57 29 25 62 16 16 16 16
Fuels, Ores and Metals 28 39 32 69 72 14 67 67 67 67
Manufacture 3 6 11 2 4 23 13 13 13 13
Turkmenistan
Agricultural Products 62 78 66 25 11 14 26 20 10 10
Fuels, Ores and Metals 30 20 30 73 57 78 60 65 81 81
Manufacture 8 2 4 2 2 8 14 12 7 7
Ukraine
Agricultural Products 7 6 18 19 20 13 12 14 11 10
Fuels, Ores and Metals 52 30 14 13 13 15 17 19 20 14
Manufacture 41 64 68 67 66 70 69 64 67 73
Uzbekistan
Agricultural Products 88 54 70 70 65 61 53 56 52 53
Fuels, Ores and Metals 6 13 6 18 13 11 22 19 19 10
Manufacture 6 5 15 8 17 16 21 19 20 28
Average Agricultural Products 30 32 35 29 27 30 26 23 21 20
Average Fuels, Ores and Metals 35 31 23 33 35 32 37 38· 44 42
Average Manufacture 34 36 35 38 35 36 36 34 31 33
53

Annex 4.3 Shares of Commodity Groups in GDP for CIS countries (in %), 1992-2001 (own calculations based on UNCTAD Export Data and WDI 2003)
Countries/Commodity Groups 1992 1993 1994 1995 1996 1997 1998 1999 2000 2001
Armenia
Agricultural Products 2.2 1.0 6.0 3.8 3.7 3.2 3.0 2.6 4.6 3.5
Fuels, Ores and Metals 11.4 4.5 3.2 6.7 6.4 5.6 4.8 8.0 6.1
Manufacture 26.3 41.5 29.8 13.5 12.9 11.2 10.7 13.6 10.4 16.4
Azerbaijan
Agricultural Products 46.5 26.2 26.7 8.6 3.2 6.6 3.8 2.6 2.2 1.3
Fuels, Ores and Metals 29.2 23.7 15.9 13.7 16.9 18.3 16.2 23.0 35.2 38.8
Manufacture 9.6 7.1 21.3 9.7 4.9 4.1 3.0 2.4 2.6 1.7
Belarus
Agricultural Products 7.8 11.5 4.0 5.9 53 7.0 6.9 6.5 7.2 7.7
Fuels, Ores and Metals 20.2 16.1 5.0 4.9 6.6 8.6 8.5 8.3 16.8 15.2
Manufacture 30.8 40.2 14.0* 37.2 33.3 43.4 42.7 41.7 43.3 44.4
Georgia
Agricultural Products 1.8 3.8 16.9 6.6 3.9 4.4 4.7 5.5 7.0 6.1
Fuels, Ores and Metals 29.3 30.4 11.0 3.7 3.4 4.4 4.7 5.5 8.4 7.6
Manufacture 4.7 12.6 29.9 15.8 5.7 6.0 6.4 7.6 7.4 7.4
Kazakhstan
Agricultural Products 4.5 2.4 2.4 4.9 5.3 5.2 2.9 3.9 4.7 3.7
Fuels, Ores and Metals 30.1 18.4 20.6 19.1 18.4 19.9 19.2 26.3 429 33.4
Manufacture 39.4 17.2 13.8 14.8 11.3 9.3 7.0 10.3 10.3 8.1
Kyrgystan**
Agricultural Products 5.0 12.1 12.1 10.3 12.3 15.1 14.6 9.2 9.2 8.1
Fuels, Ores and Metals 3.1 7.7 7.7 6.6 6.7 8.2 5.2 7.4 7.4 6.5
Manufacture 20.7 14.0 14.0 11.9 11.9 14.6 16.2 8.5 8.5 7.5
Moldova
Agricultural Products 23.8 26.6 38.2 44.1 43.5 40.4 36.0 37.2 32.4 32.5
Fuels, Ores and Metals 20.2 1.5 2.1 2.3 0.4 0.4 0.3 1.4 0.8 0.6
Manufacture 45.0 10.9 15.7 13.6 11.1 14.0 10.6 14.4 16.7 16.9
Russia
Agricultural Products 5.4 3.3 1.4 1.4 1.3 1.1 1.6 2.0 2.0 1.7
Fuels, Ores and Metals 29.4 18.2 14.9 14.9 13.3 13.4 16.7 23.4 27.2 22.8
Manufacture 13.5 9.8 7.3 7.3 6.5 5.5 8.7 11.0 10.0 8.2
Tajikistan
Agricultural Products 43.0 7.9 10.5 13.6 10.5
Fuels, Ores and Metals 9.9 32.3 43.0 55.8 43.0
Manufacture 16.1 6.2 8.2 10.7 8.2
Turkmenistan
Agricultural Products 44.2 31.1 8.9 8.5 5.4 7.9 8.2 6.1 4.8
Fuels, Ores and Metals 11.5 14.1 25.4 42.7 30.4 18.0 27.2 48.8 38.3
Manufacture 1.3 1.8 0.7 1.6 3.3 4.1 5.0 4.1 3.2
Ukraine
Agricultural Products 1.6 1.6 6.1 8.9 9.2 5.4 4.9 7.4 6.7 5.7
Fuels, Ores and Metals 12.5 7.7 4.8 6.3 5.8 6.0 7.0 10.2 12.2 7.9
Manufacture 9.8 16.6 23.7 31.4 30.5 28.5 29.0 34.5 41.6 41.0
Uzbekistan
Agricultural Products 29.9 18.2 11.9 25.8 18.1 16.4 11.7 10.0 13.0 14.8
Fuels, Ores and Metals 1.9 4.3 1.0 6.5 3.7 2.9 4.8 3.5 4.7 2.9
Manufacture 2.1 1.8 2.5 2.9 4.9 4.3 4.7 3.4 5.1 7.8
Average Agricultural Products 13 14 14 12 10 13 9 9 9 9
Average Fuels, Ores and Metals 19 13 9 10 11 11 12 15 22 19
Average Manufacture 20 16 16 14 12 13 12 13 14 14
* other commodities, that belong to group 9 approximately 68 % of exports in not included (s peclal transactions)
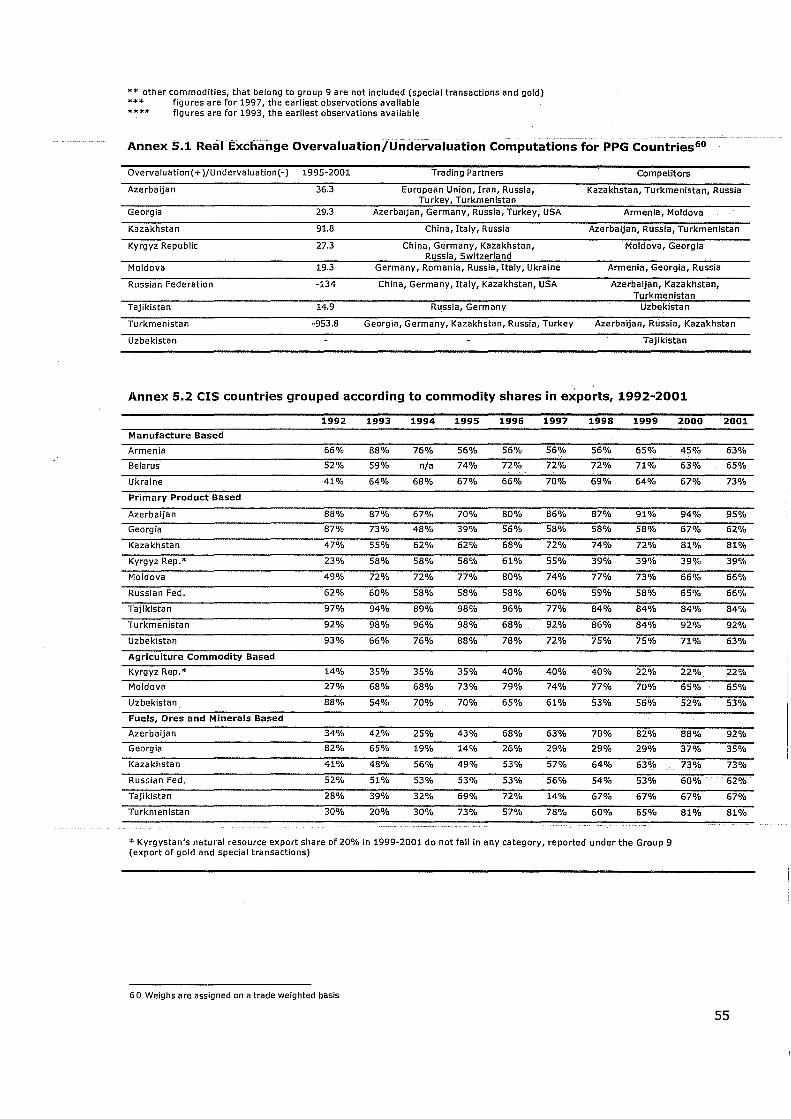
** other commodities, that belong to group 9 are not included (special transactions and gold) *** figures are for 1997, the earliest observations available **** figures are for 1993, the earliest observations available
Annex 5.1 Real Exchange Overvaluation/Undervaluation Computations for PPG Countries60
Overvaluation( + )/Undervaluation(-) 1995-2001 Trading Partners Competitors
Azerbaijan 36.3 European Union, Iran, Russia, Kazakhstan, Turkmenistan, Russia Turkey, Turkmenistan
Georgia 29.3 Azerbaijan, Germany, Russia, Turkey, USA Armenia, Moldova
Kazakhstan 91.8 China, Italy, Russia Azerbaijan, Russia, Turkmenistan
Kyrgyz Republic 27.3 China, Germany, Kazakhstan, Moldova, Georgia Russia, Switzerland
Moldova 19.3 Germany, Romania, Russia, Italy, Ukraine Armenia, Georgia, Russia
Russian Federation -134 China, Germany, Italy, Kazakhstan, USA Azerbaijan, Kazakhstan, Turkmenistan
Tajikistan 14.9 RL!ssia, Germany Uzbekistan
Turkmenistan -953.8 Georgia, Germany, Kazakhstan, Russia, Turkey Azerbaijan, Russia, Kazakhstan
Uzbekistan Tajikistan
Annex 5.2 CIS countries grouped according to commodity shares in exports, 1992-2001
1992 1993 1994 1995 1996 1997 1998 1999
Manufacture Based
Armenia 66% 88% 76% 56% 56% 56% 56% 65%
Belarus 52% 59% n/a 74% 72% 72% 72% 71%
Ukraine 41% 64% 68% 67% 66% 70% 69% 64%
Primary Product Based
Azerbaijan 88% 87% 67% 70% 80% 86% 87% 91%
Georgia 87% 73% 48% 39% 56% 58% 58% 58%
Kazakhstan 47% 55% 62% 62% 68% 72% 74% 72%
Kyrgyz Rep. * 23% 58% 58% 58% 61% 55% 39% 39%
Moldova 49% 72% 72% 77% 80% 74% 77% 73%
Russia n Fed. 62% 60% 58% 58% 58% 60% 59% 58%
Tajikistan 97% 94% 89% 98% 96% 77% 84% 84%
Turkmenistan 92% 98% 96% 98% 68% 92% 86% 84%
Uzbekistan 93% 66% 76% 88% 78% 72% 75% 75%
Agriculture Commodity Based
Kyrgyz Rep. * 14% 35% 35% 35% 40% 40% 40% 22%
Moldova 27% 68% 68% 73% 79% 74% 77% 70%
Uzbekistan 88% 54% 70% 70% 65% 61% 53% 56%
Fuels, Ores and Minerals Based
Azerbaijan 34% 42% 25% 43% 68% 63% 70% 82%
Georgia 82% 65% 19% 14% 26% 29% 29% 29%
Kazakhstan 41% 48% 56% 49% 53% 57% 64% 63%
Russian Fed. 52% 51% 53% 53% 53% 56% 54% 53%
Tajikistan 28% 39% 32% 69% 72% 14% 67% 67%
Turkmenistan 30% 20% 30% 73% 57% 78% 60% 65%
* Kyrgystan's natural resource export share of 20% in 1999-2001 do not fall In any category, reported under the Group 9 (export of gold and special transactions)
60 Weighs are assigned on a trade weighted basis
2000
45%
63%
67%
94%
67%
81%
39%
66%
65%
84%
92%
71%
22%
65%
52%
88%
37%
73%
60%
67%
81%
2001
63%
65%
73%
95%
62%
81%
39%
66%
66%
84%
92%
63%
22%
65%
53%
92%
35%
73%
62%
67%
81%
55
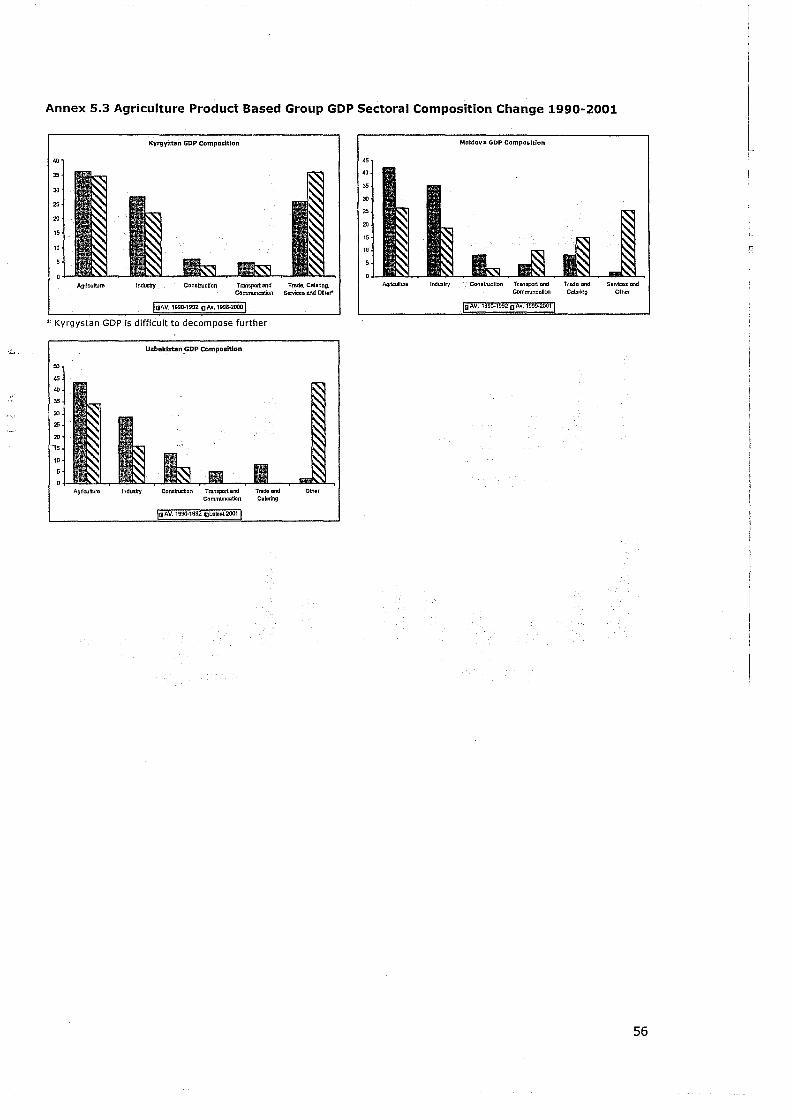
Annex 5.3 Agriculture Product Based Group GOP Sectoral Composition Change 1990-2001
Kyrgyztan GOP Composltron
40
AgriculllJre Industry Construction Trmsport anti Trade. Catering, Communcation Services end Other-
ImAv, ,990..'992 OAV,1991J.20001
* Kyrgystan GDP is difficult to decompose further
50
45
40
35
:lO
25
2!l
'15
'0
Agriculture Industry
Uzbekistan GOP ComposltJon
Construction Transport and Trado al'd Oillo, Communcatlon CalDring
1m AV, 1990-1992 tiL ... " 2001 I
45
40
35
:lO
25
20
15
10
Agrlcullure IndUStry
Moldova GDP Composition
Conltrucllon Transport end Tude end Sorvlcos one! CommunellUon Celoring Other
laAV. 199001992 0 Av.199§-2601 1
56

Annex 5.4 Fuel and Mineral Based Group GDP Sectoral Composition Change 1990-2001
35
30
25
20
15
10
40
3S
'" 25
20
15
10
40
30
25
20
15
10
Agriculture Industry
Agriculture
Industry
AzarlNlUanGDPComposltion
Construction Trnnsportand Trada lind Services and Communcatlon Cataring Other
1r-Il""'A"'V.-l"",,"'0-""'l,"'92-:-I!I""'A-v.""'l,"',,"".""200"""'1 I
Kazakhstan GOP Composltfon
Construction TransportaRd Trada GOO Communcutlan Cal!!rfng
ImAv. 1990·1"2 {lAY. 1"6-2IlOO I
Georgia GOP Composition
Construction Transport and Tt1'IdIl end Communcation Caterina
I!lAV. 1990-1992 oAy.l.'B.20001
Services and Olhor
Services and Othor
30
25
20
lS
so 4S
40
3S
'" 25
20
lS
10
60
so
40
30
20
10
AgriculbJre
Russia GDP ComposlUon
Industry Ccn.t:ruction Tl'lli"lSflort lind TI'lIda Wld Communclltian Cabtrlng
IClAV.199o.1992 IIAv.1999--20011
Tajikistan GOP Campo.lUon
Contlltruetfan Tnr,.portand Tradi m Ccrnmuncaticn Catering
I[JAV. '992~19930Av.1998-2000 I
S.w:.lland Other
Turkmenlatan GDP Composition
Incitsby Construction Transport and Trade and Sorvice. and Cammuncatlan Cataring Other
IIlAV. 1990-1.'20 I.Btostl997 I
Source: CIS Handbook of statistics (if there is one for 1996-2002), EIU country reports and selected country statistics from IMF
57

Annex 5.5 Governance Definition and Its Indicators
World Bank defined "governance" as encompassing: the state's institutional arrangements; the processes for formulating policy, decision- making and implementation; information flows within government; and the overall relationship between citizens and government (World Bank, 1989 cited in Woods, 2000)
Source Indicators Measured Aspects Voice and Accountability political process, civil liberties and political rights to measure extent to
which citizens of a cruntry. are able to participate In the selection of governments the independence of the media
Politica I Sta bility a nd Absence quality of governance in sense of likelihood of wrenching changes In of Violence government by possibly unconstitutional and/ or violent means, Including
domestic violence and terrorism Government Effectiveness quality of public service provision, the quality of the bureaucracy, the
competence of civil servants, the independence of the civil service from political pressures, and the credibility of the government's commitment
World Bank: Kaufmann, to policies Kraay and Mastruzzi, Regulatory Quality incidence of market-unfriendly poliCies such as price controls or
2003 Inadequate bank supervision, perceptions of the burdens imposed by excessive regulation in areas such as foreign trade and business development.
Rule of Law perceptions of the incidence of crime, the effectiveness and predictability of the judiciary, and the enforceability of contracts to measure the success of a society In developing an environment In which fair and predictable rules form the basis for economic and social Interactions, and importantly, the extent to which property rights are protected
Control of Corruption measures perceptions of corruption, conventionally defined as the exercise of public power for private gain
Quality of Governance - macroeconomic governance (political stability, inflation and exchange rate),
- microeconomic governance (taxes and regulations), World Bank and the - physical infrastructure, European Bank for - law and order (corruption, organised crime, street crime and
Reconstruction functioning of judiciary) and Development: State Capture (Share of Firms the actions of indiViduals, groups, or firms both in the public and private
Business Environment and Affected by State Capture) sectors to influence the formation of laws, regulations, decrees, and Enterprise Performance other government poliCies to their own advantage as a result of the illicit
Survey and non-transparent provision of private benefits to public officials (BEEPS) Administrative Corruption the intentional Imposition of distortions In the prescribed implementation
(Bribes as a Share of Annual of existing laws, rules, and regulations to provide advantages to either Revenues) state or non-state actors as a result of the illicit and non-transparent
provision of private Qalns to public officials Democratisation - Political Process (the fairness of national executive and legislative
elections, the development of multiparty systems, and popular participation In the political process);
- Civil Society (the growth of nongovernmental organizations, their organizational capacity and financial sustalnabllity, etc);
- Independent Media (legal framework for and actual state of press freedom, Including harassment of journalists and editorial Independence, the emergence of a financially viable private press, and Internet access for private citizens);
- Governance and Public Administration (the authority of legislative bodies; decentralization; the responsibilities, election, and management of local government bodies; and legislative and executive transparencv)
Rule of Law - Constitutional, Legislative and· Judicial Framework (constitutional
Freedom House reform and human rights protection, criminal code reform, the judiciary and judiclallnde pendence, and the status of ethnic minority rights)
- Corruption (perception of corruption in the civil service, business interests of top policy ma kers, laws on financial disclosure and conflict of interest and anticorruption initiatives)
Economic Liberalization - Prlvatisation (the legal framework for and the actual state of the prlvatlsatlon process);
- Macroeconomic Policy (tax reform, fiscal and monetary policy, and banking reform);
- Microeconomic Policy (property rights, price liberalization, the ability to operate a business, international trade and foreign Investment, and the energy sector)
Socia I Sector unemployment rates, pension systems, income levels, the educational system, Infant mortality, birth rates, life expectancy, divorce and suicide rates the health care svstem and povertv rates.
58

Annex 5.6 Regression Results
(Note: Note: * and ** stand for significance at 1 and 5 % level of significance respectively
a) Dependent Variable GDP Per Capita in 2001 (in International PPP terms)
Coefficient t HC -0.4363* -4.82 PC -0.5843* -5.44 NC -0.4359* -4.74 Interaction 0.0248* 3.62 GE2000 0.7494* 3.82 Constant 48.0591* 5.20
No. of Observations 10 R2 97.07% Adjusted R2 93.41%
HC, PC and NC stands for Human, Physical and Natural Capital shares in national wealth respectively.
Definitions from World Bank (2003)61:
Capital (capital assets) - a stock of wealth used to produce goods and services. Modern economists divide capital into physical capital (also called produced assets), natural capital, and human capital.
Physical capital (produced assets) - buildings, machines, and technical equipment used in production plus inventories of raw materials, half-finished goods, and finished goods.
Human capital - the knowledge, skills, and experience of people that make them economically productive. Human capital can be increased by investing in education, health care, and job training. HC is one of the components of Human Resources, other being the "raw labour," determined mainly by the number of people in a country's labour force.
61 Natural capital is defined in the introductory part of this paper
59

b) Dependent Variable Control of Corruption in 2000
Coefficient t AvShNrX9200 -1.4640** -2.58 Constant 0.0931 0.25
No. of Observations 12 R2 39.95% Adjusted RZ 33.94%
AvShNrX9200 stands for Average Share of Natural Resources in Exports in 1992-2000 years
c) Dependent Variable Control of Corruption in 2000
Coefficient t AvShNrGDP9200 -3.2544** -2.59 Constant -0.0534 -0.17
No. of Observations 12 R2 40.22% Adjusted R2 34.24%
AvShNrGDP9200 stands for Average Share of Natural Resources in GDP in 1992-2000 years
d) Dependent Variable Economic Growth (% change) in 2000
Coefficient t CC2000 -0.7943** -2.35 Constant 1.1520* 3.61
No. of Observations 12 R2 35.52% Adjusted R2 29.07%
CC2000 stands for the Control of Corruption in 2000
e) Dependent Variable Economic Growth (% change) in 2000
Coefficient t DifTSER -0.0268* -3 .81 Constant 0.1291* 9.68
No. of Observations 12 R2 59.15% Adjusted R2 55.06%
DifTSER stands for the difference in TSER from 1995 to 1997
60

BIBLIOGRAPHY
Addison, Tony and S. Mansoob Murshed (2001) "From Conflict to Reconstruction: Reviving
the Social Contract./I WIDER Discussion Paper No. 2001/48, UNU/WIDER.
Aslund, Anders; Peter Boone, and Simon Johnson (1996) "How to Stabilise: Lessons from
Post-Communist Countries./I Brookings Papers on Economic Activity 26(1):217-313.
Auty, Richard (1994) "Industrial Policy Reform in Six Newly Industrialised Countries: The
resource Curse Thesis./I World Development 22(1): 11-26.
Auty, Richard (1994) "Natural Resources, the State and Development Strategy./I Journal of
International Development 9: 651-63.
Auty, Richard and Alan H. Gelb (2001) "Political Economy of Resource-Abundant States." In
Richard Auty (ed.) Resource Abundance and Economic Development, 127-143.
Oxford: University Press.
Auty, Richard (2001) (ed.) Resource Abundance and Economic Development. Oxford:
University Press.
Auty, Richard (2003) Towards a Resource-Driven Model of Governance: Application to Lower
Income Transition Economies. Bonn: Center for Development Research.
Balcerowicz, Leszek (1995) Socialism, Capitalism, Transformation. Bud9pest: Central
European University.
Bardhan, P. (1997) "Corruption and Development: a Review of Issues." Journal of Economic.
Literature 35: 1320-46.
Benjamin, N.C., S. Devarajan and RJ. Weiner (1989) "The Dutch Disease in a Developing
Country." Journal of Development Economics 30: 71-92.
Berg, Andrew et al. (1999) "The Evolution of Output in Transition Economies: Explaining the
Differences." IMF Working Paper No. WP/99/73, Washington, D.C.: International
Monetary Fund.
Bhagwati, Jardish (1982) "Directly Unproductive Profit Seeking Activities." Journal of Political
Economy 90(5): 988-1002.
Birdsal, Nancy et al. (2001) "Natural Resources, Human Capital, and Growth./I In Richard
Auty (ed.) Resource Abundance and Economic Development, 57-75. Oxford:
University Press.
Brada, J. (1996) "Privatisation in Transition - Or Is It?/I Journal of Economic Perspectives
10(2): 67-86.
Breton, Paul and Daniel Gros (1997) "Trade Reorientation and Recovery in Transition
Economies./I Oxford Review of Economic Policy 13 (2): 65-76.
Brewer, Anthony (1997) Marxist Theories of Imperialism: A Critical Review. London and New
York: Routledge.
Brohman J. (1996) Popular Development: Rethinking the Theory and Practice of
Development. Oxford: Blackwell.
61

Campos, Nauro F. and Fabrizio Coricelli (2002) "Growth in Transition: What We KflOW, What
We Don't and What We Should." Working Paper 470: William Davidson Institute.
Campos, Nauro and Dana Zlabkova (2001) "The Wrong Mix: A First Look at Occupational
Mobility during the Hungarian Transition." Prague: CERGE-EI Discussion Paper 59.
CIS Statistical Committee (2003) "Analyticheskie Materiali: Investitsionnaja Dejatelnost v
Stranax Sodruzhestva." [Analytical Materials: Investment Activities in CIS]
<www.securities.org> accessed 27.10.2003.
Chang, Ha-Joon (2002) Kicking Away the Ladder: Development Strategy in Historical
Perspective. London: Anthem Press.
Chenery, Hollis (1960), "Patterns of Industrial Growth." American Economy Review 50: 624-
654.
Collier, P. and A. Hoeffler (2000) "Greed and Grievance in Civil War." World Bank Policy
Research Paper 2355.
Corden, W.M. and J.P. Neary (1982) "Booming Sector and Dutch Disease: a Survey."
Economic Journal 92: 825-48.
Cuddington, John T. (1985) "Long-run Trends in 26 Primary Commodity Prices: A
Disaggregated Look at the Prebisch-Singer Hypothesis." mimeo, Washington, D.C.:.
Economics Department of Georgetown University.
De Melo et al. (1996) "From Plan to Market." Policy Research Working Paper 1564, World
Bank Policy Research Department, Transition Economies Division.
De Melo et al. (1997) "Circumstance and Choice: the Role of Initial Conditions and Policies in
Transition Economies." Working Paper 714, World Bank, International Finance
Corporation.
Dollar and Kraay (2000) "Growth is good for the poor." Working paper of Development
Research Group of World Bank.
Easterly, W. et al. (1993) "Good Policy or Good Luck." Journal of Monetary Economics
32:459-83.
Easterly, William (2001) "Inequality Does Cause Underdevelopment." mimeo, World Bank.
Easterly, William and Ross Levine (2003) "Tropics, Germs and Crops: How Endowments
Influence Economic Development." Journal of Monetary Economics 50:3-39.
Economic Commission for Europe (2000) Economic Surveys of Europe: 2/3. New York and
Geneva: United Nations.
Economic Commission for Europe (2003) Economic Surveys of Europe: 1 New York and
Geneva: United Nations.
European Bank for Reconstruction and Development (1999) Transition Report. London:
EBRD.
Economist Intelligence Unit (2002) Country Reports. London: The Economist Intelligence Unit
Fardmanesh, M. (1991) "Dutch Disease Economies and the Oil Syndrome: an Empirical
Study." World Development 19(6): 711-717.
62

Fields, G. (1989) "Change in Poverty and Inequality in the Developing Countries." World
Bank Research Observer 4(2): 167-185.
Findlay, Ronald and Mats Lundahl (1999) Resource-Led Growth - a Long-Term Perspective:
the Relevance of the 1870-1914 Experience for Today's "Developing Economies.
UNU/WIDER Working Paper No. 162.
Fisher, Stanley and Ratna Sahay (2000) "The Transition Economies After Ten Years."
International Monetary Fund Working Paper.
Gaston, Gelos and Ratna Sahay (2000) "Financial Market Spillovers in Transition Economies."
IMF Working Paper WP/00/71, IMF.
Gelb A.H. (1988) Windfall Gains: Blessing or Curse? New York: Oxford University Press.
Gomulka, Stanislaw (2000) "Macroeconomic Policies and Achievements in Transition
Economies, 1989-1999." In Economic Commission for Europe Economic Surveys of
Europe: 2/3, pp-pp. New York and Geneva: United Nations.
Gylfason, Thorvaldur, Tryggvi Thor Herbertsson and Gylfi Zoega (1999) "A Mixed Blessing:
Natural Resources and Economic Growth." Macroeconomic Dynamics 3:204-25.
Gylfason, Thorvaldur (1999) "Exports, Inflation and Growth" World Development 27(6):
1031-57.
Gylfason, Thorvaldur (2000) "Resources, Agriculture and Economic Growth in Economies in
Transition." Kyklos 53(4): 545-80.
Gylfason, Thodvaldur (2001) "Natural Resources, Education and Economic Development."
European Economic Review 45(4-6): 847-59.
Gylfason, Thodvaldur and Gylfi Zoega (2002) "Inequality and Growth: Do Natural Resources
Matter." <http://www.hi.is/rvgylfason/pdf/gini593.pdf > accessed 11.10.2003.
Hallagan, Willian and Zhang Jun (2000) "Starting Positions, Reform Speed, and Economic
Outcomes in Transition Economies." Working Paper no. 280, William Davidson
Institute.
Hamilton, Kirk (2001) "The Sustainability of Extractive Economies." Richard Auty (ed.)
Resource Abundance and Economic Development, 36-56. Oxford: University Press.
Hare, Paul et al. (2000) "Supply Responses in the Economies of the Former Soviet Union."
Centre For Economic Reform and Transformation Discussion Paper No. 2000/09.
Havrylyshyn, O. and D. McGettigan (1999) "Privatisation in Transition Countries: A Sampling
of the Literature." IMF Working PaperWP/99/6.
Helbling, Thomas, Ashoka Mody and Ratna Sa hay (2003) "Debt Accumulation In The CIS-7
Countries: Bad Luck, Bad Policies, Or Bad Advice?" Paper presented at the Lucerne
Conference of the CIS-7 Initiative, Licerne, 20-22 January 2003.
Hellman, Joel S. et al. (2000) "Measuring Governance, Corruption, and State Capture: How
Firms and Bureaucrats Shape the Business Environment in Transition Economies."
Policy Research Working Paper No 2312: World Bank, World Bank Institute,
Governance, Regulation and Finance, EBRD.
63

Hirschman, Albert O. (1958) The Strategy of Economic Development. New Heaven CT: Yale
University Press.
Hirschman, Albert O. (1981) "A Generalised Linkage Approach to Development with Special
Reference to Staples/l In Essays in Trespassing: Economics to Politics and Beyond: 59-
97 Cambridge: Cambridge University Press
Hellman, Joel S., Geraint Jones and Daniel Kaufmann (2002) "Far From Home: Do Foreign
Investors Import Higher Standards of Governance in Transition Economies?/I
www.worldbannk.org/wbi/governance.
Innis, Harold A. (1956) Essays in Canadian Economic History. Toronto: University of Toronto
Press.
Isham, Jonathan et al. (2002) "The Varieties of Rentier Experience: How Natural Resource
Endowments Affect the Political Economy of Economic Growth./I mimeo, World Bank.
Kaminski, Bartolomiej; Zhen Wang and Alan Winters (1996) Foreign Trade in the Transition:
the International Environment and Domestic Policy. Washington, D.C.: World Bank.
Kaminski, Antoni Z. and Bartolomiej Kaminski (2001) "Governance and Corruption in
Transition: The Challenge of Subverting Corruption./I Paper presented at the Spring
Seminar UN Economic Commission Europe.
Kaufmann, Daniel; Aart Kraay and Pablo ZOido-L6baton (1999) "Aggregating Governance
Indicators." Policy Research Paper No. 2195, World Bank.
Kaufmann, Daniel; Aart Kraay and Massimo Mastruzzi (2003) Governance Matters III:
Governance Indicators for 1996-2002. Washington, D.C.: World Bank.
Kenny, Charles and David Williams (2001) "What Do We Know About Economic Growth? Or,
Why Don't We Know Very Much?/I World Development 29(1): 1-22.
Knack, S. and P. Keefer (1997) "Does Social Capital have an Economic Payoff?/I Quarterly
Journal of Economics 112 (4): 1251-88.
Kornai J. (1990) The Road to a Free Economy. : New York and London:- Norton & Co.
Kronenberg, Tobias (2001) "The Curse of Natural Resources in the Transition Economies./I
Working paper, Maastricht Economic Research Institute on Innovation and
Technology.
Krugman, Paul (1987) "The Narrow Moving Band, the Dutch Disease and the Competitive
Consequences of t:'Irs. Thatcher on Trade in the Presence of Dynamic Scale
Economies./I Journal of Development Economics 27: 41-55.
Lane, P. and A. Tornell (1995) "Power Concentration and Growth./I Discussion Paper
No.1720, Harvard Institute of Economic Research.
Le Billion, Philippe (2001) "Fuelling War or Buying Peace: The Role of Corruption in
Conflicts./I WIDER Discussion Papers No. 2001/65, UNU/WIDER.
Levine, Richard M. and Glenn J. Wallace (2000) "Mineral Industries of Armenia, Azerbaijan,
Belarus, Georgia, Kazakhstan, Kyrgystan, Moldova, Russia, Tajikistan, Turkmenistan,
Ukraine, and Uzbekistan./I U.S. Geological Survey Minerals Yearbook: 3.1-3.24.
64

Maizels, A. (1968) "Experts and Economic Growth of Developing Countries." Cambridge,
M.A.: Cam bridge University Press.
Markandya, Ani! and Alina Averchenkova (2001) "Reforming a Large Resource-Abundant
Transition Economy: Russia." In Richard Auty (ed.) Resource Abundance and
Economic Development, 277-95. Oxford: University Press.
Matsuyama, K. (1992) "Agricultural Productivity, Comparative Advantage and Economic
Growth." Journal of Economic Theory 58.
Mauro, Paolo (1995) "Corruption and Growth." Quarterly Journal of Economics 110(3): 681-
712.
Meier, Gerald M., Joseph Stiglitz (ed.) (2001) Frontiers of Development Economics: the
Future in Perspective. New York Oxford University Press, Inc.
Mehlum, Halvor; Ragnar Torvik and Karl Moene (2002) "Institutions and
<http://econwpa.wustl.edu/eps/dev/papers/021010210003.pdf>
20.11.2003.
Resource Curse.",
accessed
Mikesell, R. (1997) "Explaining the Resource Curse, with Special References to Mineral
Exporting Countries." Resources Policy 23(4).
Milanovic, Branko (1998) Income, Inequality, and Poverty during the Transition from Planned
to Market Economy. Washington DC: World Bank
Ministry of Economic Development of Azerbaijan (2001) Quarterly Issue of Economic Trends
of Azerbaijan: July-September, <www.economic-trends.org>.
Murphy K, A. Schleifer, and R.W. Vishny (1989) "Industrialisation and the Big Push." Journal
of Political Economy 97(5): 1003-26.
Murshed, S. Mansoob (2001) "Sort-Run Models of Contrasting Natural Resource
Endowments." In Richard Auty (ed.) Resource Abundance and Economic
Development, 113-25. Oxford: University Press.
Murshed, S. Mansoob "On Natural Resources Endowment and Underdevelopment" (2002)
Background Paper for the World Development Report 2003
Murshed, S. Mansoob "When Does Natural Resource Abundance Lead to a Resource Curse"
(2003), mimeo
Narayan Deepa and Lant Pritchett (1999) "Cents and Sociability: Household Income and
Social Capital in Rural Tanzania." Economic Development and Cultural Change 47(4):
871-897.
Neary, J. Peter and Sweder van Wijnbergen, (eds.) (1986) Natural resources and the
Macroeconomy Cambridge. MA: MIT Press
Nicholas, Howard (2003) "Financial Market Behaviour, Monetary Policy and Economic
Dynamics." Lecture Notes, The Hague: ISS.
North, Douglass C. (1990) Institutions, Institutional Change, and Economic Performance.
Cambridge: Cambridge University Press.
Odling-Smee, John (2003) "Economic Performance and Trade in the CIS, International
Monetary Fund." Paper presented at the International Conference dedicated to the
65

10th Anniversary of the National Currency of the Kyrgyz Republic,
Bishkek,10.05.2003.
Ofer, Gur and Richard Pomfret (ed.) (2003) The Economic Prospects of the CIS: The Sources
of Long Term Growth. Cheltenham: Edward Elgar (In Print). .
Olson, M. (2000) Power and Prosperity: Outgrowing Communist and Capitalist Dictatorships.
New York: Basic Books.
Papyrakis Elissaios and Rayer Gerlagh (2002) "The Resource Curse Hypothesis and Its
Transmission Channels." <http://www.feem.it/NR/rdonlyres/4CCC378C-60AO-4372-
96A9-E75B67C66922/609/growthFEEM.pdf> accessed 20.11.2003
Perala, Maiju (2003) "Persistence of Underdevelopment: Does the Type of Natural Resource
Endowment Matter?" WIDER, Discussion Paper No. 2003/37.
Petersen, Christian E. and Nina Budina (2002) "Governance Framework of Oil Funds: The
Case of Azerbaijan and Kazakhstan."
<http://www . worldbank.org/ogmc/pdfs/ChristianPetersenPap·er. pdf>
20.11.2003
accessed
Prebisch, Raul (1950) The economic Development of Latin America and its Principal
Problems. New York: United Nations.
Putnam, Robert D. (1993) "The Prosperous Community: Social Capital and Public Life."
American Prospect 4(13) <http://epn.org/prospect/13/13putn.html> accessed
20.11.2003
Ritzen, Jo; William Easterly and Michael Woolcock (2000) "On "Good" Politicians and "Bad"
Policies: Social Cohesion, Institutions, and Growth."
<http://econ.worldbank.org/docs/1203.pdf> accessed 20.11.2003
Robinson, James A. et al "Political Foundation of the Resource Curse." Discussion Paper No.
3422, Centre for Economic Policy Research.
Rodriguez, F. and D. Rodrik (1999) "Trade Policy and Economic Growth: A Sceptic Guide to
the Cross-Country Evidence." mimeo, University of Maryland College Park, MD.
Roland, Gerard (2001) "Ten Years After ... Transition and Economics." IMF Staff Papers 48
(Special Issue)
<http://www . imf.org/ExternallPubs/FT Istaffp/200 1/04/pdf/roland. pdf>
8.11.2003
accessed
Ros, Jaime (2000) Development Theory and Economics of Growth. Michigan U.P.: Ann Arbor.
Rosenstein"'Rodan P. (1943) "Problems of Industrialisation of Eastern and South-Eastern
Europe." The Economic Journal 53:202-211.
Rosenberg, Christoph B. and Tapio O. Saavalainen (1998) "Dealing with Azerbaijan Oil
Boom." Finance and Development
<http://www.imf.org/external/pubs/ft/fandd/1998/09/rosenber.htm#author>
accessed 20.11.2003
35(3)
Ross, Michael (2001a) Extractive Sectors and the Poor An Oxfam America Report. Los
Angeles: Department of Political Science of University of California.
66

Ross, (2001b) "How Does Natural Resource Wealth Influence Civil War?"
<http://www.polisci.ucla.edu/faculty/ross/HowDoesNat3.pdf>accessed20.11.2003
Sabirianova, Klara (2000) "The Great Human Capital Reallocation: A Study of Occupational
Mobility in Transitional Russia." Working Paper 309, William Davidson Institute.
Sachs, Jeffrey D. and Andrew M. Warner (1995) "Natural Resource Abundance and Economic
Growth." National Bureau of Economic Research Working Paper Series, N 5398,
National Bureau of Economic Research, Inc.: Cambridge, MA.
Sachs, Jeffrey D. and A.M. Warner (1997) "Natural Resource Abundance and Economic
Growth." Updated Version of NBER Working Paper No. 5398, Centre for International
Development and Harvard Institute for International Development: Cambridge, MA.
Sapsford, D (1985) "The Statistical Debate on the Net Barter Terms of Trade Between
Primary Commodities and Manufactures: Comment and Some Additional Evidence."
Economic Journal 95: 781-788.
Sarkar, Prabirjit and Hans W. Singer (1991) "Manufactured Exports of Developing Countries
and Their Terms of Trade Since 1965." World Development 19(4): 333-340.
Sarmiento, Eduardo (1988) "Development of Industrial versus Primary Exports". In Urrutia,
Miguel and Setsuko Yukawa (ed.) Economic Development Policies in Resource-Rich
Countries, 90-112. Tokyo: The United Nations University.
Senik-Leygonie, C. and G. Hughes (1992) "Industrial Profitability and Trade Among the
Former Soviet Republics." Economic Policy 15: 353-377.
Singer, Hans W. (1998) Growth, Development and Trade, Cheltenham. London: Edward
Elgar Publishing Limited.
Stevens, Paul (2003) "Resource Impact - Curse or Blessing? A· Literature Survey."
<http:Uwww.ipieca.org/down loads/sociaVPStevens resourceimpact final.doc>
accessed 11.10.2003
Stiglitz, Joseph (1998), Lessons from Russia, China and Eastern Europe. Cambridge: MA, MIT
Press.
Stijns, Jean-Philippe C. (2001) "Natural Resource Abundance and Economic Growth
Revisited." <http://econwpa. wustl.edu: 80/eps/dev/papers/O 103/0103001. pdf>
accessed 11.10.2003
Soysa, Indra de (2001) "Paradise is a Bazaar? Greed, Creed, Grievance and Governance."
WIDER Discussion Paper (2001/42), UNU/WIDER.
Torvik, Ragnar (2001) "Learning by DOing and the Dutch Disease." European Economic
Review 45: 285-306.
UNDP (1997) "Reconceptualising Governance." Discussion Paper 2. New York: United Nation.
United Nations System in Turkmenistan (2000) "Common Country Assessment."
<www.untuk.org> accessed 12.09.2003.
Van Wijnbe·rgen, S. (1984) "The Dutch Disease: a Disease After All?" Economic Journal
94(373): 41-55
67

Walde K. and C. Woods (1999) "The Empirics of Trade and Growth: Where are the Policy
Recommendations?" mimeo, Washington, D.C.: World Bank.
Watkins, Melville H. (1963) "A staple Theory of Economic Growth." The Canadian Journal of
Economics and Political Science 29: 142-158.
Woods, Ngaire (2000) "The Challenge of Good Governance for the IMF and the World Bank
Themselves." World Development 28(5): 823-841.
Woolcock, Michael; Lant Pritchett and Jonathan Isham (2001) "The Social Foundations of
Poor Economic Growth in Resource-Rich Countries." In Richard Auty (ed.) Resource
Abundance and Economic Development, 76-92. Oxford: University Press.
World Bank (1993) The East Asian Miracle: Economic Growth and Public Policy. Oxford:
Oxford University Press.
World Bank (1995) Monitoring Environmental Progress: Environmentally Sustainable
Development Series. Washington, D.C.: World Bank.
World Bank (2000) Anticorruption in Transition: a Contribution' to the Policy Debate.
Washington, D.C.: The World Bank.
World Bank (2002) The First Ten Years: Analysis and Lessons for Eastern Europe and Former
Soviet Union. Washington, D.C.: The World Bank.
World Bank (2003) "Beyond Economic Growth: Meeting the Challenges of Global
Development." Institute's Development Education Program (DEP)
<http://www.worldbank.orq/depweb/beyond/qlobal/about.html> accessed
11.10.2003.
World Trade Organisation (2003) "Understanding the WTO: Members and Observers,
<http://www.wto.orq/english/thewtoe/whatise/tife/org6e.htm>
11.10.2003
accessed
Wyatt, Geoffrey (2002) "Corruption, Productivity and Transition." CERT Discussion Paper
2002/05, Centre for Economic Reform and Transformation.
68