impact of marketing investments on firm value by
TRANSCRIPT

IMPACT OF MARKETING INVESTMENTS ON FIRM VALUE
By
Malika Chaudhuri
A DISSERTATION
Submitted to
Michigan State University
in partial fulfillment of the requirements
for the degree of
Business Administration-Marketing-Doctor of Philosophy
2015

ABSTRACT
IMPACT OF MARKETING INVESTMENTS ON FIRM VALUE
By
Malika Chaudhuri
Firms engage in marketing communication mix such as sales promotions and advertisements
primarily to boost sales, attract potential customers while retaining their existing customer base.
Marketing communications are therefore critical marketing strategies that are intended to
increase the visibility of the firm’s offerings. Despite the rich body of research on sales
promotions in the marketing literature, there still remains limited insight into the differential
impacts of various marketing efforts as well as the conditions under which they are most
effective.
My first essay seeks to address these gaps by demonstrating the effects of two types of
sales promotions (cash rebates and financing offers) on consumer perceptions of quality and unit
sales across both luxury and mass goods. The results reveal that offering financing incentives can
effectively drive sales irrespective of product class, but rebates only impact sales in the mass
market. Interestingly, rebates negatively affect perceptions of quality across both product
classes, demonstrating a more complex path to sales than traditional promotion models may
suggest. My second dissertation essay examines the downside of marketing communication mix
by U.S. pharmaceutical firms in the post-patent period. Findings suggest that incumbent’s
marketing activities in the post patent period is a signal that is interpreted differentially by the
waves of generic manufacturers who are planning to enter the market. Specifically, the first wave
of generic entry may consider incumbent’s marketing effort as a threat and hence it may act as an
entry deterrent strategy. Interestingly, continuance of incumbent’s marketing communication

even after the first wave of generics have entered the market may be interpreted by the second
wave of generics as signals of unexplored market potential, thereby attracting competition.
My third essay analyzes the impact of firm’s adoption of loyalty program on risk and
valuation. Results indicate that firm’s adoption of LP alleviates firm-specific risk. Next, we
demonstrate that market share moderates the relation between firm’s adoption of loyalty program
and sales. In particular, adoption of loyalty program by firms with high market share depletes
sales. On the other hand, adoption of loyalty programs by small firms boost sales, thereby
improving firms’ market share.

iv
To my family, who offered me unconditional love and support
throughout this journey.

v
ACKNOWLEDGMENTS
I am deeply indebted to my dissertation committee- Dr. Roger Calantone (Dissertation Chair),
Dr. Clay Voorhees (Dissertation Co-chair), Dr. Tomas Hult, and Dr. Gerry McNamara for their
insightful comments, helpful guidance, and unwavering support. In particular, I owe a huge debt
of gratitude to Dr. Roger Calantone for his encouragement, and unflinching support through all
phases of the doctoral program. I especially appreciate his guidance in helping me to keep things
in perspective, whether in regards to my dissertation, or my career aspirations. I am indebted, to
Dr. Clay Voorhees, who, first as a teacher and later as a coauthor, taught me much of what I
know about my field of research, teaching me the art of conducting research and also that of
presenting. Without his constant guidance and support this dissertation would not have been
possible. I thank Dr. Tomas Hult for his support and encouragement. I thank Dr. Gerry
McNamara for his invaluable guidance, constructive criticisms and for being instrumental in my
development as an academic. I thank the other professors of the Department of Marketing for
their encouragement and advice in the process of completing my dissertation.
On behalf of my husband, our children and myself, I would like to express our sincere
gratitude for Dr. G. Geoffrey Booth and Elizabeth Booth for treating us like family and for their
help and support throughout our stay in East Lansing. I would like to express my sincere
appreciation to my brother, Udipta Mukherji, and my parents, Dr. Raka Mukherji and Manas
Mukherji for their unwavering faith and confidence in my abilities. Finally, none of this would
have been possible without the patience and encouragement of my family back in India, who
have been a constant source of love and concern, over all these years. Support, strength and care
from my mother-in-law, Mrs. Renu Chaudhuri and father-in-law, Mr. R.K. Chaudhuri helped me

vi
overcome setbacks and stay focused on my graduate studies. My deepest gratitude goes to my
husband Ranadeb and my daughter Esha and my son, Rohan for their understanding during all
the time spent away from them. Without their sacrifices, this dissertation would not have been
possible. Special thanks to Ranadeb for his constant guidance, helpful criticisms, unconditional
support and for being there when I needed him most.
vii
TABLE OF CONTENTS
LIST OF TABLES ........................................................................................................................ ix
LIST OF FIGURES ....................................................................................................................... x
Chapter 1 ........................................................................................................................................ 1 Impact of Promotion Mix on Firm Performance: The Mediating Role of Perceived Quality ... 1
1. ABSTRACT ............................................................................................................................ 1 1.1 Introduction .................................................................................................................................. 3 1.2 Conceptual Background ............................................................................................................... 7
1.2.1 Defining Sales Promotions ...................................................................................... 7
1.2.2 Finance Rates ............................................................................................................ 7 1.2.3 Rebates ....................................................................................................................... 9 1.2.4 Promotions and Price Structure ............................................................................... 9
1.2.5 Perceived Quality and Firm Sales .......................................................................... 12 1.2.6 Impact of Promotions on Sales ............................................................................... 13
1.2.7 Moderating Role of Product Class (Luxury vs. Mass) .......................................... 14 1.3 Methodology ................................................................................................................................ 17
1.3.1 MIDAS .................................................................................................................... 17 1.3.2 Empirical Model ..................................................................................................... 19
1.4 Data and Measurement Variables ............................................................................................. 24 1.5 Results .......................................................................................................................................... 25
1.5.1 Descriptive Statistics .............................................................................................. 25 1.5.2 3SLS Estimation ...................................................................................................... 25
1.6 Post-Hoc Analysis ....................................................................................................................... 29 1.6.1 Contingencies in Sales Promotion Strategies ....................................................... 29 1.6.2 Unit Root Test......................................................................................................... 30 1.6.3 Cointegration Test .................................................................................................. 31 1.6.4 Granger Causality Test .......................................................................................... 31
1.7 Discussion .................................................................................................................................... 34 APPENDIX .................................................................................................................................. 39 BIBLIOGRAPHY......................................................................................................................... 50
Chapter 2 ...................................................................................................................................... 57 Does Marketing Communication Mix Attract Generic Competition? ....................................... 57 2. ABSTRACT .......................................................................................................................... 57
2.1 Introduction ................................................................................................................................ 58 2.2 Hypothesis Development ............................................................................................................ 61
2.2.1 Marketing Communication Mix Strategy ............................................................. 61
2.2.2 Detailing ................................................................................................................. 61 2.2.3 Direct-to-Customer Advertising (DTCA) .............................................................. 62
2.2.4 Sample Distribution ............................................................................................... 63

viii
2.2.5 Journal Advertising ............................................................................................... 64 2.2.6 Detailing and DTCA Marketing Strategies ........................................................... 64 2.2.7 Entry Deterrent Strategies by Prescription Manufacturing Firms ...................... 68
2.3 Methodology ................................................................................................................................ 71 2.3.1 Empirical Model ..................................................................................................... 71 2.3.2 Prentice-Williams-Peterson Gap Time Model ...................................................... 72
2.4 Data Collection ............................................................................................................................ 75 2.5 Results .......................................................................................................................................... 76 2.6 Discussion .................................................................................................................................... 83
APPENDIX .................................................................................................................................. 87 BIBLIOGRAPHY......................................................................................................................... 93
Chapter 3 ...................................................................................................................................... 99
The effect of Loyalty Program on firm risk and value ............................................................... 99 3. ABSTRACT .......................................................................................................................... 99
3.1 Introduction .............................................................................................................................. 100 3.2 Hypothesis Development .......................................................................................................... 104
3.2.1 Does Adoption of loyalty programs lowers firm risk? ........................................ 104 3.2.2 Loyalty Program and Firm Sales ........................................................................ 108 3.2.3 Incumbent Effect.................................................................................................. 109
3.2.4 Does market share moderate the relationship? .................................................. 110 3.3 Methodology .............................................................................................................................. 112
3.3.1 Measures of Idiosyncratic Risk ........................................................................... 112
3.3.2 Measures of Firm Performance .......................................................................... 113 3.4 Data and Measurement Variables ........................................................................................... 115 3.5 Results ........................................................................................................................................ 116
3.5.1 Descriptive Statistics ............................................................................................ 116 3.5.2 Loyalty programs and Firm risk .......................................................................... 116
3.5.3 Firm’s adoption of loyalty program and impact on sales ................................... 118 3.6 Post-Hoc Analysis: Response Surface Approach ................................................................... 120 3.7 Discussion .................................................................................................................................. 122
APPENDIX ................................................................................................................................ 125 BIBLIOGRAPHY....................................................................................................................... 134
ix
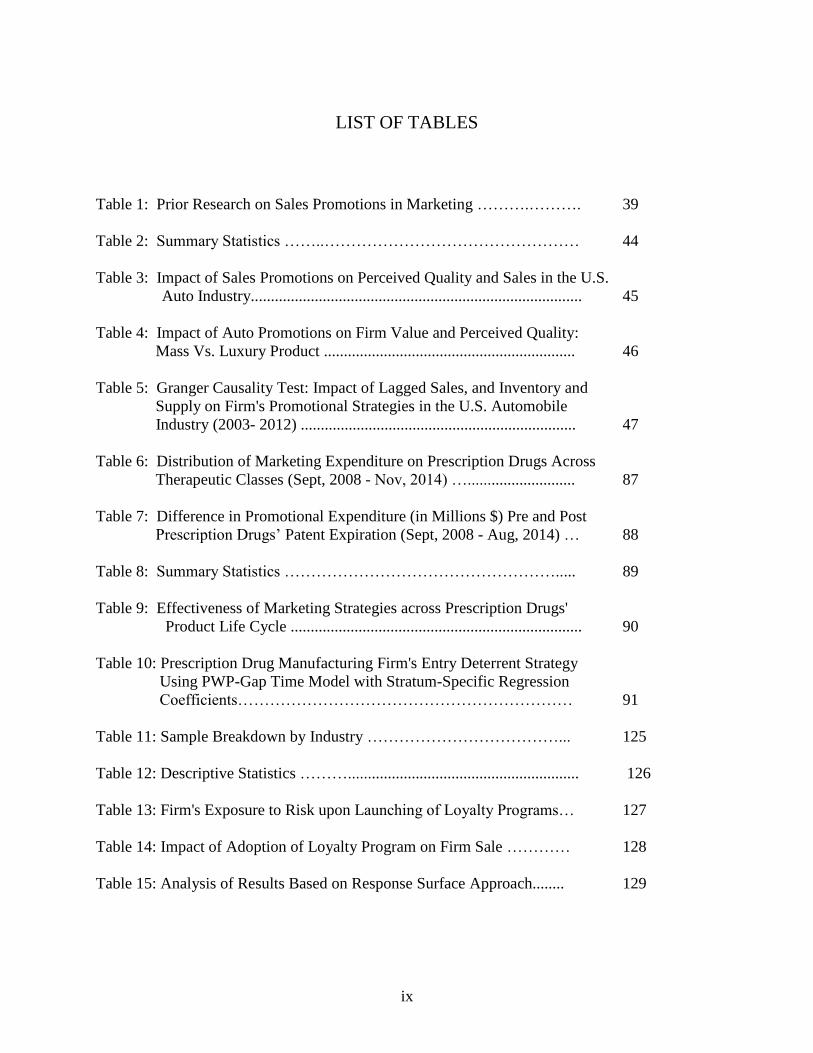
LIST OF TABLES
Table 1: Prior Research on Sales Promotions in Marketing ……….………. 39
Table 2: Summary Statistics ……..………………………………………… 44
Table 3: Impact of Sales Promotions on Perceived Quality and Sales in the U.S.
Auto Industry................................................................................... 45
Table 4: Impact of Auto Promotions on Firm Value and Perceived Quality:
Mass Vs. Luxury Product ............................................................... 46
Table 5: Granger Causality Test: Impact of Lagged Sales, and Inventory and
Supply on Firm's Promotional Strategies in the U.S. Automobile
Industry (2003- 2012) ..................................................................... 47
Table 6: Distribution of Marketing Expenditure on Prescription Drugs Across
Therapeutic Classes (Sept, 2008 - Nov, 2014) …........................... 87
Table 7: Difference in Promotional Expenditure (in Millions $) Pre and Post
Prescription Drugs’ Patent Expiration (Sept, 2008 - Aug, 2014) … 88
Table 8: Summary Statistics ……………………………………………..... 89
Table 9: Effectiveness of Marketing Strategies across Prescription Drugs'
Product Life Cycle ......................................................................... 90
Table 10: Prescription Drug Manufacturing Firm's Entry Deterrent Strategy
Using PWP-Gap Time Model with Stratum-Specific Regression
Coefficients……………………………………………………… 91
Table 11: Sample Breakdown by Industry ………………………………... 125
Table 12: Descriptive Statistics ……….......................................................... 126
Table 13: Firm's Exposure to Risk upon Launching of Loyalty Programs… 127
Table 14: Impact of Adoption of Loyalty Program on Firm Sale ………… 128
Table 15: Analysis of Results Based on Response Surface Approach........ 129
x
LIST OF FIGURES
Figure 1: Conceptual Model: The Differential Effects of Promotions for Mass
versus Luxury Brands …………………………………………… 49
Figure 2: Conceptual Model …………………………………………..... 133
Figure 3: Ridge of Maximum ………………………………………….. 134
Figure 4: Rotated Surface Plot ……………………………………….… 135

1
Chapter 1
Impact of Promotion Mix on Firm Performance: The Mediating Role of
Perceived Quality
1. ABSTRACT
The typical firm invests 20% of its promotional budget on sales promotions in an effort to
drive short-term sales. Given this heavy investment, academic researchers have modeled the
effectiveness of such promotions for decades. Despite the rich body of research on sales
promotions in the marketing literature, there still remains limited insight into the differential
impacts of various sales promotions as well as the conditions under which they are most
effective. This research seeks to address these gaps by demonstrating the effects of two types of
sales promotions (cash rebates and financing offers) on consumer perceptions of quality and unit
sales across both luxury and mass goods. The authors test these effects by leveraging data across
16 major auto manufacturers operating in the U.S. auto industry between 2003 and 2012. The
results reveal that financing incentives positively affect perceptions of quality irrespective of the
product class. However, cash rebates have positive impact on consumer perceive value in the
mass market with no impact in the luxury market. Moreover, financing incentives limit their
effectiveness as a driver of sales in the luxury product market whereas rebates impact sales
exclusively in the mass market, demonstrating a more complex path to sales than traditional
promotion models may suggest. Based on the findings, marketing managers in mass markets can
effectively leverage rebates to increase sales and improve consumer perception. On the contrary,
managers in the luxury market should focus promotional investments solely on financing offers

2
because it not only enhances consumer attitude but also offers significant sales benefit. Next, we
conduct post-hoc analysis to determine whether firm’s offering of promotional incentives are
exogenously determined. Granger causality estimates indicate that promotional strategies
adopted by firms are endogenously determined corporate strategies, dependent on the firm’s
internal factors, such as inventory and sales and history of promotional offerings.
Keywords: sales promotion, finance rates, rebates, perceived quality, product class
3
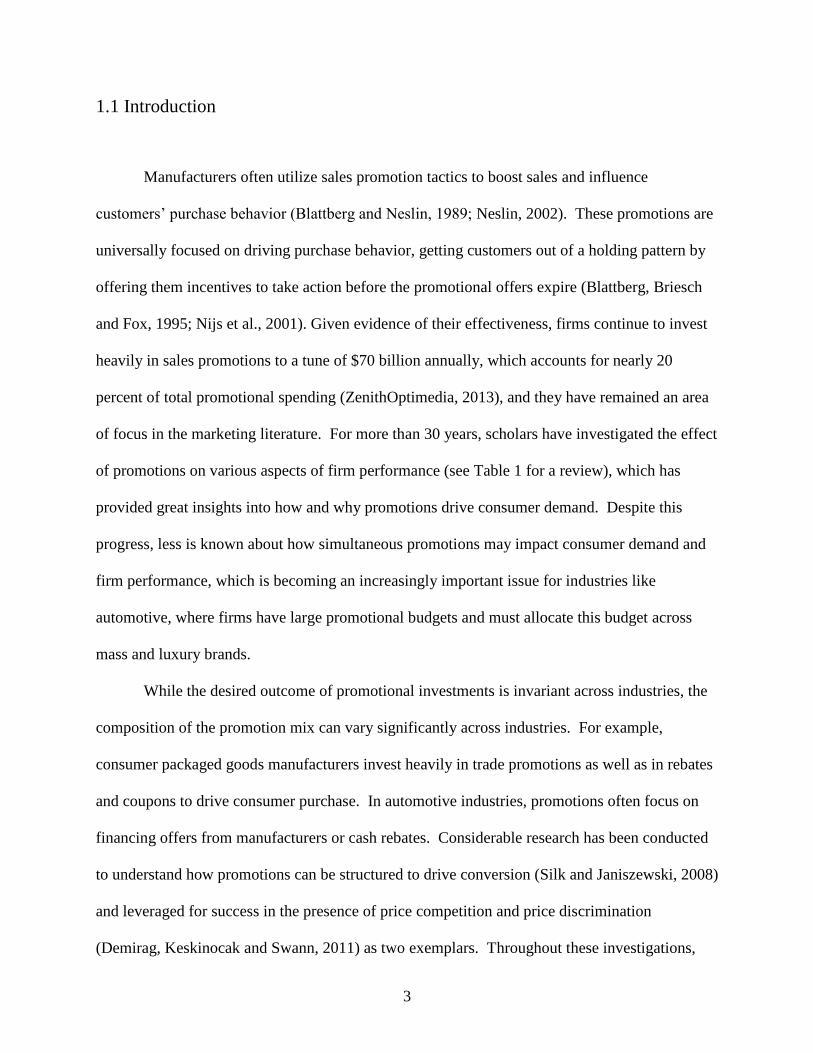
1.1 Introduction
Manufacturers often utilize sales promotion tactics to boost sales and influence
customers’ purchase behavior (Blattberg and Neslin, 1989; Neslin, 2002). These promotions are
universally focused on driving purchase behavior, getting customers out of a holding pattern by
offering them incentives to take action before the promotional offers expire (Blattberg, Briesch
and Fox, 1995; Nijs et al., 2001). Given evidence of their effectiveness, firms continue to invest
heavily in sales promotions to a tune of $70 billion annually, which accounts for nearly 20
percent of total promotional spending (ZenithOptimedia, 2013), and they have remained an area
of focus in the marketing literature. For more than 30 years, scholars have investigated the effect
of promotions on various aspects of firm performance (see Table 1 for a review), which has
provided great insights into how and why promotions drive consumer demand. Despite this
progress, less is known about how simultaneous promotions may impact consumer demand and
firm performance, which is becoming an increasingly important issue for industries like
automotive, where firms have large promotional budgets and must allocate this budget across
mass and luxury brands.
While the desired outcome of promotional investments is invariant across industries, the
composition of the promotion mix can vary significantly across industries. For example,
consumer packaged goods manufacturers invest heavily in trade promotions as well as in rebates
and coupons to drive consumer purchase. In automotive industries, promotions often focus on
financing offers from manufacturers or cash rebates. Considerable research has been conducted
to understand how promotions can be structured to drive conversion (Silk and Janiszewski, 2008)
and leveraged for success in the presence of price competition and price discrimination
(Demirag, Keskinocak and Swann, 2011) as two exemplars. Throughout these investigations,
4
when scholars focus on analyzing the impact of the promotion mix on firm performance, the
level of granularity in the data begins to disappear. With few exceptions, researchers often
aggregate promotion strategies into a single variable, such as, ‘promotion incentives’ (Pauwels et
al. 2004; Leeflang and Parreño-Selva, 2012; Gangwar, Kumar and Rao, 2013). Even though this
approach provides some evidence of the impact of promotions, in general, but offers little
actionable guidance to managers who need to manage a promotional budget across an array of
investment areas. One notable exception to this tendency to aggregate promotional types into a
single bucket is the study by Lu and Moorthy (2007), which demonstrates the differential
effectiveness of coupons and rebates as promotional strategies, conditional on consumers’
reservation price and redemption costs.
Failing to disaggregate sales promotions into their respective tactical investment areas
results in considerable information loss, and provide us with erroneous conclusions. For
example, in industries like automotive, the two most common promotions are cash rebates and
financing offers. While both result in cost savings for consumers, they could have differential
effects on customer attitudes (i.e., perceptions of quality) and sales. As a result, aggregating
these investments into a global “promotion incentives” bucket will, at best, result in a lack of
actionable guidance for managers and, at worst, lead to incorrect conclusions regarding the
effectiveness of promotions in driving attitude change and firm performance. Building on this
issue, most prior research conducts analysis at either the industry level or within a focal product
category with little variance in the brands under investigation. This narrow lens limits the ability
to assess product class contingencies that could alter the nature of the relationship between
promotions and sales. One notable factor missing in prior research is product class (luxury
5
versus mass). The very nature of promotions and customer mix for these classes of goods could
result in substantial swings in the effectiveness of sales promotions.
The current study seeks to provide advance research on the impact of the promotion mix
on firm sales by addressing these two shortcomings of the extant literature. Specifically, our first
contribution focuses on disaggregating promotion incentives into tactical level,
operationalizations of finance rates and cash rebate offers in the U.S. automotive industry. As a
first step, we focus on the single industry to tease out the effects of the two categories of
promotional tactics particularly relevant in the consumer durable industry. In doing so, we
provide new insight into the effectiveness of two unique promotional investments in driving
consumers’ perceptions of quality and firm sales. Second, we examine the effects of these
promotions across luxury and mass product classes, thus offering an improved understanding of
promotion types that can offer the biggest return for the various product classes. Finally, when
testing these effects, we introduce a new method to the marketing literature to handle the
frequency mismatch data issue by applying mixed data sampling regression (MIDAS) as
pioneered by Ghysels, Santa-Clara, and Valkanov (2004).
Our results demonstrate considerable value in disaggregating promotional incentives and
modeling their impact separately for luxury and mass goods. For example, our findings reveal
that finance rates are universally effective in driving consumers’ quality perception, irrespective
of product class. However, they are effective demand boosters exclusively in the luxury product
market. On the contrary, cash rebates trigger sales increases exclusively for mass brands.
Estimates also indicate that after controlling for firm’s history of bankruptcy filing and firm
characteristics, cash rebate offerings actually improve consumer perceive value in the mass
product market. Empirical estimates suggest that managers may employ perceived quality as a
6
strategic asset that can effectively boost sales, irrespective of product class. As a result, our
findings identify critical contingencies regarding the promotions-performance relationship and in
doing so has considerable implications for both researchers and practitioners. In the following
sections, we introduce the conceptual basis for our model, describe the MIDAS method, and
discuss the results.

7
1.2 Conceptual Background
1.2.1 Defining Sales Promotions
Sales promotion is a critical component of a firm’s marketing mix plan. These
promotional tactics operationalize short-term techniques to generate almost immediate impact on
sales volume and influence customers’ purchase pattern (Belch et al. 2008). In the current study,
we focus on finance rates and rebates - the two critical consumer oriented promotional strategies
frequently employed in the high-value consumer durable goods industries (Attanasio, Koujianou,
and Kyriazidou 2008). This study focuses on the U.S. automobile industry, a particularly
appropriate product category where both types of promotional strategies mentioned above are
critical demand boosters. In particular, automobiles are typical examples of consumer durables
where median product price exceeds median household income (Ohta and Griliches, 1986).
Consumers may lack the liquid assets necessary to make down payments towards the purchase of
these consumer durables. They may instead seek loans from banks or other financial institutions
to finance their product purchase (Stango and Zinman 2011). Additionally, rebates discount
product price. Thus, consumer-oriented sales promotions, such as finance rate deals and rebates,
may partially solve consumers’ liquidity problem, making the product relatively affordable and
consequently, increasing consumers’ likelihood of purchase.
1.2.2 Finance Rates
These are promotional strategies especially utilized by firms to stimulate purchase of big-
ticket items (i.e., automobiles etc.). An auto loan is a contractual agreement between the lender

8
and the borrower where the borrower pledges to repay the loan at a predetermined rate over a
fixed time period. Additionally, it is a secured loan where the financed vehicle is used as the
collateral (Forbes 2000). The annual percentage rate (APR), also referred to as finance rate, is a
function of the prevailing market interest rates and business environmental conditions
(Gambacorta 2004). A typical example of ‘finance rates’ may be financing purchase of
Chrysler/GM/Ford cars at an interest rate that is significantly less than the ongoing market
interest rate (e.g., 1.9% annual rate) (Varadarajan and Clark 1994).
In efforts to boost sales, auto manufacturers typically offer incentives to customers
through interest rate reductions from their captive finance subsidiaries (Barron, Chong, and
Staten 2008). These finance rate deals significantly lower the interest rates on the loans relative
to prevailing market interest rate, thereby drastically reducing the monthly payments customers
are required to make towards their loan. Such promotional incentives either make the car more
affordable to the customer by deducting smaller dollar amount from the customer’s disposable
income or allow the customer to purchase higher quality product by lowering the monthly loan
payments required. Interestingly, auto loans carrying zero percent interest rate is not uncommon
in the U.S. auto industry. Thus, finance rate deals do not have any explicit discount on the
product price. However, they are implicit promotional strategies that decrease the present value
of customers’ future stream of payments made towards the loan repayment. Additionally,
redemption period of the promotion coincides with the consumers’ loan repayment period.
Moreover, since the manufacturing firm that sells the product and the financing firm that extends
the loan are usually independent entities, consumers tend not to associate incidence of attractive
finance rates with erosion of quality.

9
1.2.3 Rebates
Rebates are monetary inducements in the form of price subsidies offered by
manufacturers to potential consumers to stimulate purchase (Blattberg and Neslin 1990; Neslin
2002). Traditionally, this category of inducement involves reducing the sales price of the product
equal to the dollar amount of the rebate (Varadarajan and Clark 1994). These are explicit
promotional tactics such that the price discount can be redeemed after purchase of the product.
Interestingly, during purchase of big ticket items, customers are often given the option to apply
the rebate towards their down payment or receive cash (Ault et al., 2000).
Thompson and Noordeweir (1992) analyzes declining impact of continuous incidence of
rebates for three successive years in the U.S. automobile industry. Results indicate that these
promotional strategies accelerate consumers’ likelihood of purchase. Lu and Moorthy (2007)
investigate whether coupons and rebates, two critical promotional incentives, have identical
implications on consumers’ buying behavior. The authors posit that consumers differ in
redemption costs since they inherently differ in opportunity cost of time. Specifically, with
coupons, the uncertainty about redemption costs is resolved even before product purchase.
However, with rebates, the uncertainty is resolved post product-purchase. Findings also suggest
that consumers’ ‘risk aversity’ and ‘delay between rebate redemption and rebate payment’
alleviates rebate attractiveness (Lu and Moorthy, 2007).
1.2.4 Promotions and Price Structure
Perceived quality represents consumers’ critical attitudinal evaluation of products and
these perceptions are often driven by brand reputation, price, and advertising efforts (Zeithaml,
1988; Dodds, Monroe and Grewal, 1991; Mitra and Golder, 2006). Quality perceptions serve as

10
an “attitude-like” assessment of the overall reliability of a product (Bitner, 1990) and can serve
as a primary driver of purchase intentions (Zeithaml, Berry, and Parasuraman, 1996) and brand
preference (Yoo, Donthu, and Lee, 2000).
Given the importance of perceived quality, it is widely regarded as a key strategic asset
despite its intangible nature (Aaker and Jacobson, 1994). The literature indicates that managers
need to complement delivery of quality product with high consumer perceptions regarding
product quality to realize the firm’s competitive advantage and to improve its financial value
(Aaker, 1991; Aaker and Jacobson, 1994). Thus, firms often leverage extrinsic cues to
communicate with their customer base and to build positive quality perceptions as consumers
interpret these cues when evaluating competing product options and forming quality evaluations
(Olson, 1978). This is most commonly done directly through product pricing to the extent that a
higher price reflects higher quality (Zeithaml, 1988) or through advertising where higher levels
of advertising can result in higher perceptions of product quality (Milgrom and Robers, 1995).
Given the rich literature base on these effects, we simply control for these quality drivers in the
current study and focus on the potential role of promotions as signals of quality.
In a similar vein to price, promotions provide extrinsic cues to customers about the
quality of the product. So while promotions are traditionally targeted at changing short-term
behavior, they can also be manifested in quality evaluations. In the context of our current
research, we consider two types of promotions. At the basic level, cash rebates function as price
reduction offers to consumers, thus eroding quality evaluations under the same mechanism as
price. However, when evaluating rebates, consumers may also engage in another layer of
processing in which they potentially perceive rebate offers as a signal of desperation by
manufacturers, which can result in a further reduction in quality perceptions (Darke and Chung,

11
2005). As a result, we propose that higher rebates erode perceptions of quality. Stated more
formally (figure 1):
H1: The magnitude of rebates has a negative impact on consumers’ perceived quality.
The mechanism underlying the effects of cash rebates is relatively straightforward, but
the manner in which financing offers can impact quality evaluations is not explicitly addressed in
the literature because a firm’s extension of attractive finances rates are implicit promotional
strategies with no direct discount on product price. Instead, these promotional tactics decrease
consumers’ monthly payment toward the product purchase loan, rendering an otherwise high-
priced product affordable. As a result, the “price” of the product remains unchanged when
consumers are offered financing incentives, but the overall cost to the consumer who finances a
vehicle can be greatly reduced. While it has been suggested that consumers account for
financing rates in determining the overall cost of a vehicle (Gale, 1994) and class economic
investigations have demonstrated a relationship between interest rates and demand for durables
(e.g., Hamburger, 1967), little empirical evidence has been provided to model the impact of
finance rates on perceptions of product quality. However, in line with the same logic on the well
documented price-quality relationship, we expect that a higher finance rate, that increases the
cost of a product, will result in increased perceptions of quality. Thus, we propose that:
H2: Finance rates have a positive impact on consumers’ perceived quality to the extent that
higher finance rates result in higher perceptions of quality.

12
1.2.5 Perceived Quality and Firm Sales
Perceived quality, in association with brand awareness and brand associations,
strengthens brand loyalty by increasing customer satisfaction and by providing consumers with
reasons to buy the product (Aaker, 1992). This gets reflected through increased sales and
enhanced firm value in the long run. Aaker and Jacobson (1994) examine the financial
information contained in perceived quality measures and analyze the relationship between firm
value, measured by movement in a firm's stock prices and customers’ perceived quality. Findings
of the study indicate a positive relationship between changes in consumer’s perception of quality
and stock returns, thereby impacting firm performance. In particular, improved perceived quality
strengthens customers’ brand loyalty, which translates into higher consumer switching costs. The
firm may effectively exploit such high switching costs to increase its cash flow and revenue
generation (Srinivasan et al., 2009). Tellis and Johnson (2007) investigate whether publication of
product quality information in The Wall Street Journal generates abnormal return in stock prices.
Findings indicate that a firm’s signal of high product quality generates investor enthusiasm as
reflected by abnormal returns in stock prices. Additionally, such signals improve consumer
confidence in the firm’s product offerings and enhance their willingness to buy (Oh, 1999). We
hypothesize that ‘perceived quality’ has positive impact on sales.
H3: Perceived quality has positive impact on sales.
13
1.2.6 Impact of Promotions on Sales
As we proposed in prior hypotheses, the indirect effect of financing incentives is
proposed to by positive; however, the indirect effect of rebates on sales via quality is proposed to
be negative. As a result, for cash rebates to offer positive return for firms in either the short or
long run, they must have a significant direct effect on the quantity purchased. In line with this
necessity, the marketing literature does provide solid evidence of the impact of price reductions
like those offered by rebates on short-term sales spikes (for a review see Blattberg, Briesch, and
Fox, 1995).
More recent investigations have provided an even more nuanced view of this
relationship. Specifically, Gangwar, Kumar and Rao (2013) demonstrate that following a firm’s
adoption of promotional strategies consumers significantly increase their purchase quantities in
an effort to stockpile. Similarly, Joshi and Hanssens (2010) suggest that rebates reduce sales
price and stimulate product demand. As a result, large rebates should trigger a stronger change
in demand. Based on classic investigations into the relationship of price promotions and sales
and recent empirical and analytical evidence, we suggest:
H4: Rebates have a positive impact on sales to the extent that higher magnitude cash rebates
result in higher sales.
In addition to rebates, firms can lower the cost of products through effective financing
offers. Specifically, finance rate cuts improve consumers’ willingness to buy by reducing the
14
loan payment they are required to make, thereby rendering the product more affordable
(Attanasio, Goldberg, and Kyriazidou, 2008). Thus, we propose:
H5: Finance rates have a negative impact on sales to the extent that higher finance rates result in
lower sales.
1.2.7 Moderating Role of Product Class (Luxury vs. Mass)
Luxury brands are designed to be deliberately conspicuous and flamboyant, to emit an
aura of exclusivity and quality (Atwal and Williams, 2009; Brown, Kozinets and Sherry, 2003)
that distinguishes these brands from mass-market firms by signaling their commitment towards
values ‘that are above commercial considerations’ (Beverland, 2005). Marketing of luxury
products has become increasingly multifaceted, being concomitant not only with cuing an aura of
quality, performance and legitimacy, ‘but also with attempting to sell an experience by relating it
to the lifestyle constructs of consumers’ (Atwal and Williams, 2009). The extant literature
indicates that the inescapable desire for social prestige influences consumers to pay a price
premium for products that confer status (Shapiro, 1983). Goldsmith, Flynn, and Kim (2010) posit
that ‘status consumption’ heightens consumers’ level of involvement with the product category.
It also enhances consumers’ brand loyalty toward the product. Consequently, an enhanced level
of involvement and brand loyalty make the consumer less price-sensitive. Consumers associate
consumption of luxury goods as signal of status and are willing to pay the price premium (Han,
Nunes, and Drèze, 2010). Thus, effective marketing strategies for luxury products are those that
convey high quality and are less explicit about product pricing structure.
The literature on marketing luxury products indicates that luxury is a social marker and
classical marketing rules do not apply for firms considering to ‘enter the luxury market, to build
15
a successful luxury brand’ and to maintain luxury status of their brands (Vigneron and Johnson,
2004; Kapferer and Bastien, 2009). Thus, these firms need to adopt strategies that endow the
‘luxury brand’ with a halo of superiority with respect to its client. Furthermore, these marketing
strategies emit signals that emphasize product excellence and perfection, while maintaining an
aura of exclusivity. Even though price communicates quality, marketing strategies for luxury
brands typically withhold price information from being publicly advertised (Kapferer and
Bastien, 2009). The role of advertising in the luxury sector is to recreate the dream of exclusivity
and not to improve sales growth (Kapferer and Bastien, 2009). Thus, firms whose product
offerings target the luxury market traditionally avoid extension of explicit sales promotions such
as rebates and coupons (Kapferer, 2012a; 2012b).
Interestingly, signals emitted by the luxury marketing mix are often diametrically
different from those of classical marketing employed while promoting mass products (Kapferer
and Bastien, 2009). In particular, in the mass market, one observes promotional strategies that
offer explicit price discounts and provide consumers with monetary relief that effectively
enhance product demand. Additionally, advertisements of products are geared toward
accelerating sales growth. Often times, advertisements even provide price information to
customers. Thus, considering the characteristics of the target customers in the luxury versus the
mass market, we posit that finance rates, given their implicit characteristics, have a higher
positive impact on perceived quality and sales in the luxury market relative to the mass market.
We also theorize that rebates, given their explicit characteristics, erode perceived quality
significantly more in the luxury market than in the mass market. Finally, we theorize that rebates
are a relatively more effective strategy in boosting sales in the mass market than in the luxury
market. We hypothesize:

16
H6a: The negative effect of rebates on perceived quality is stronger for luxury vis-à-vis mass
products.
H6b: The positive effect of finance rates on perceived quality is stronger for luxury vis-à-vis
mass products.
H7a: The positive effect of rebates on sales is weaker for luxury vis-à-vis mass products.
H7b: The negative effect of finance rates on sales is stronger for luxury vis-à-vis mass products.

17
1.3 Methodology
1.3.1 MIDAS
Our analysis uses data with different sampling frequency. Specifically, information on
firms’ promotions is available weekly, whereas sales and inventory information are sampled
monthly. Additionally, information on firm performance, dealership and perceived quality data is
available annually. Instances when researchers deal with mixed frequency data, they typically
have two alternatives: either to align variables downward by aggregating high frequency data to
a lower frequency down or to align variables upward by interpolating lower frequency data to
high frequency. Both methods suffer from limitations. On one hand, downward adjustments
abandon valuable information in the high frequency data, which consequently reduces its
estimation and forecast efficiency (Silvestrini and Veredas, 2008). The other alternative which
involves upward alignment based on random mathematical procedures may also be problematic.
We address the frequency mismatch data issue by applying mixed data sampling regression
(MIDAS) (Ghysels, Santa-Clara, and Valkanov, 2004). MIDAS regression typically projects
‘high frequency data onto low frequency data with tightly parameterized weights’ (Qian, 2013).
In particular, MIDAS helps to project the dependent variable onto a history of lagged
observations of the independent variables.
Suppose the sampling frequency of variable ty is between 1t and t is unity (say,
yearly), whereas that of another variable, say m
tx , is ‘m’ in that given period (say, monthly or m
= 12), then MIDAS aids in understanding the ‘dynamic relation between ty and m
tx ’. In

18
particular, MIDAS helps to ‘project ty onto a history of lagged observations of m
mjtx / ’(Ghysels,
Sinko and Valkanov, 2007). Note that the ‘superscript on m
mjtx / denotes the higher sampling
frequency and its exact timing lag is expressed as a fraction of the unit interval between 1t and
t ’ (Ghysels, Santa-Clara, and Valkanov, 2004). The MIDAS model may be illustrated as:
m
t
m
t
m
t xLBy ;/1
10 (1)
for Tt ,....,1 , where ty is the regressand, tx is the regressor, m denotes the frequency of
occurrence of tx ,
K
k
mkm LkBLB0
//1 ;; , mL /1
is a lag operator and m
t is the disturbance
term. The parameter 1 indicates the aggregate impact of lagged m
tx on ty and 0 is the
intercept. Following Ghysels, Sinko and Valkanov (2007), we estimate 1 ‘by normalizing the
function ;/1 mLB to sum up to unity’. Also note that the lag coefficients in ;kB
corresponding to mkL /
is a vector of parameter with a small dimension. In a MIDAS
framework, the mL /1
coefficients are characterized by ;/1 mLB . While there are several
alternative parametirizations of ;/1 mLB , in this study we utilize the "Exponential Almon Lag"
specification of ;kB (Ghysels, Sinko and Valkanov, 2007).
K
k
kk
kk
e
ekB
1
.....
.....
1
1
;
(2)
19
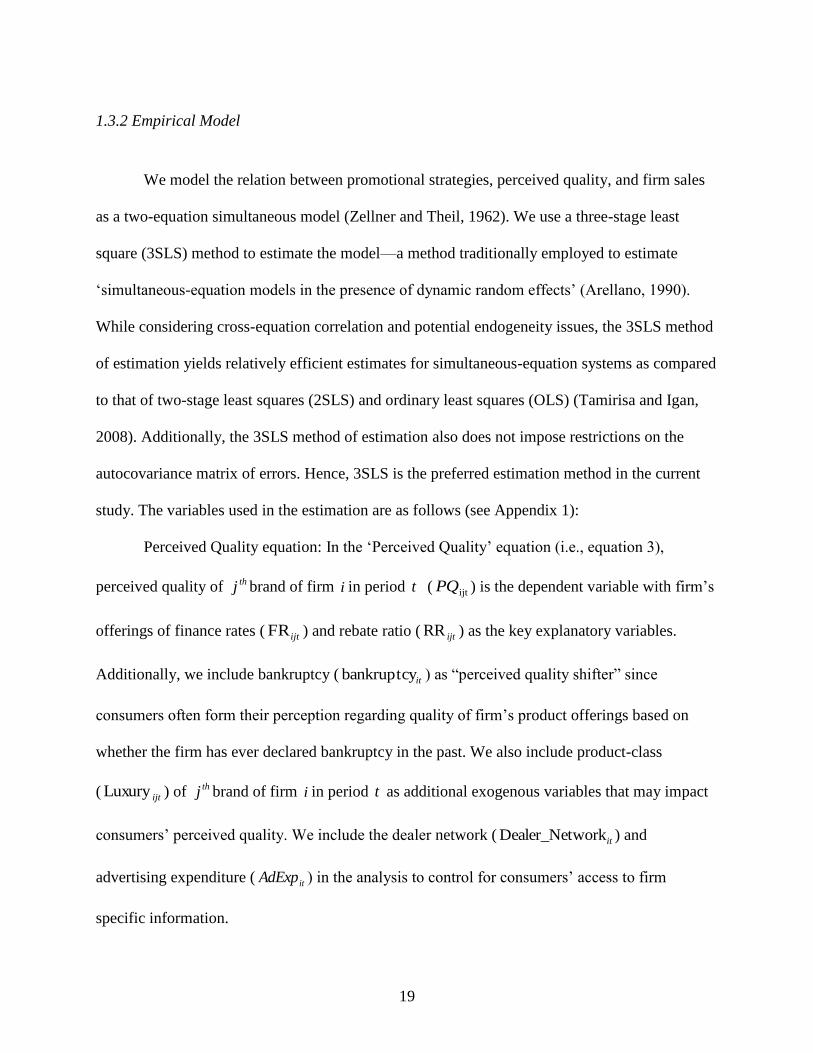
1.3.2 Empirical Model
We model the relation between promotional strategies, perceived quality, and firm sales
as a two-equation simultaneous model (Zellner and Theil, 1962). We use a three-stage least
square (3SLS) method to estimate the model—a method traditionally employed to estimate
‘simultaneous-equation models in the presence of dynamic random effects’ (Arellano, 1990).
While considering cross-equation correlation and potential endogeneity issues, the 3SLS method
of estimation yields relatively efficient estimates for simultaneous-equation systems as compared
to that of two-stage least squares (2SLS) and ordinary least squares (OLS) (Tamirisa and Igan,
2008). Additionally, the 3SLS method of estimation also does not impose restrictions on the
autocovariance matrix of errors. Hence, 3SLS is the preferred estimation method in the current
study. The variables used in the estimation are as follows (see Appendix 1):
Perceived Quality equation: In the ‘Perceived Quality’ equation (i.e., equation 3),
perceived quality of thj brand of firm i in period t ( ijtPQ ) is the dependent variable with firm’s
offerings of finance rates ( ijtFR ) and rebate ratio ( ijtRR ) as the key explanatory variables.
Additionally, we include bankruptcy ( itbankruptcy ) as “perceived quality shifter” since
consumers often form their perception regarding quality of firm’s product offerings based on
whether the firm has ever declared bankruptcy in the past. We also include product-class
( ijtLuxury ) of thj brand of firm i in period t as additional exogenous variables that may impact
consumers’ perceived quality. We include the dealer network ( itworkDealer_Net ) and
advertising expenditure ( itAdExp ) in the analysis to control for consumers’ access to firm
specific information.
20
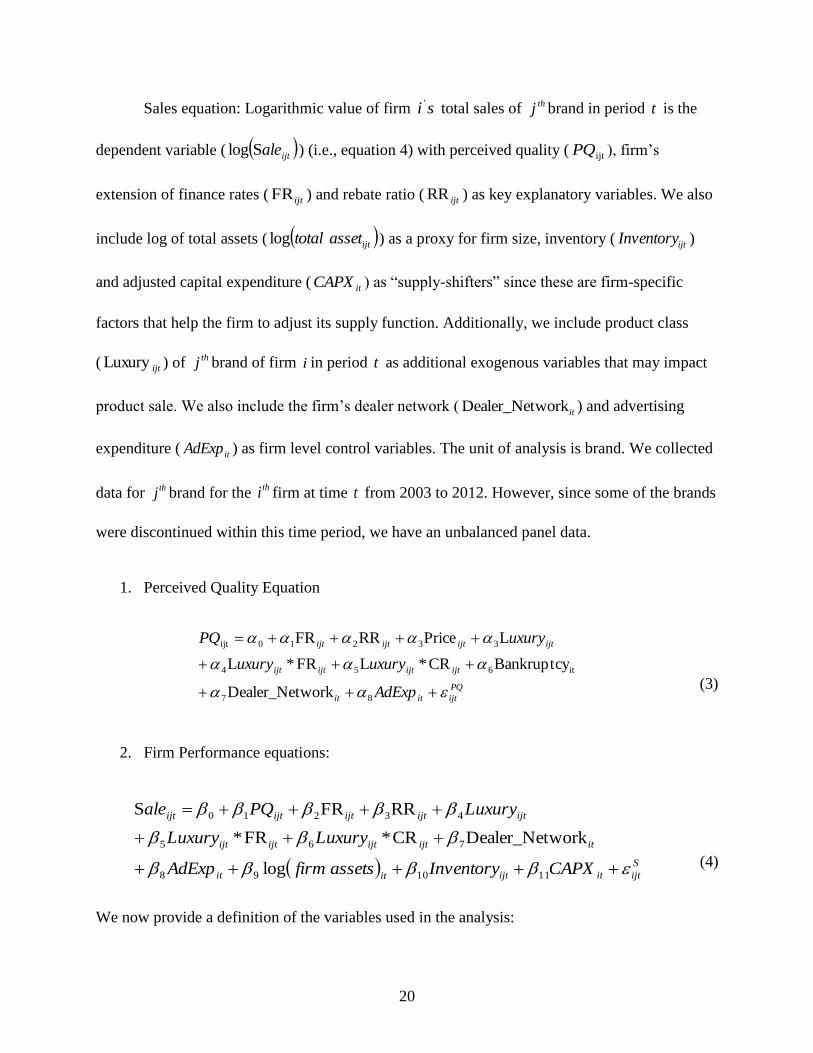
Sales equation: Logarithmic value of firm si ' total sales of thj brand in period t is the
dependent variable ( ijtaleSlog ) (i.e., equation 4) with perceived quality ( ijtPQ ), firm’s
extension of finance rates ( ijtFR ) and rebate ratio ( ijtRR ) as key explanatory variables. We also
include log of total assets ( ijtassettotallog ) as a proxy for firm size, inventory ( ijtInventory )
and adjusted capital expenditure ( itCAPX ) as “supply-shifters” since these are firm-specific
factors that help the firm to adjust its supply function. Additionally, we include product class
( ijtLuxury ) of thj brand of firm i in period t as additional exogenous variables that may impact
product sale. We also include the firm’s dealer network ( itworkDealer_Net ) and advertising
expenditure ( itAdExp ) as firm level control variables. The unit of analysis is brand. We collected
data for thj brand for the thi firm at time t from 2003 to 2012. However, since some of the brands
were discontinued within this time period, we have an unbalanced panel data.
1. Perceived Quality Equation
PQ
ijtitit
ijtijtijtijt
ijtijtijtijt
AdExp
uxuryuxury
uxuryPQ
87
it654
33210ijt
workDealer_Net
BankruptcyCR*LFR*L
LPriceRRFR
(3)
2. Firm Performance equations:
S
ijtitijtitit
itijtijtijtijt
ijtijtijtijtijt
CAPXInventoryassetsfirmAdExp
LuxuryLuxury
LuxuryPQale
111098
765
43210
log
workDealer_NetCR*FR*
RRFRS
(4)
We now provide a definition of the variables used in the analysis:
21
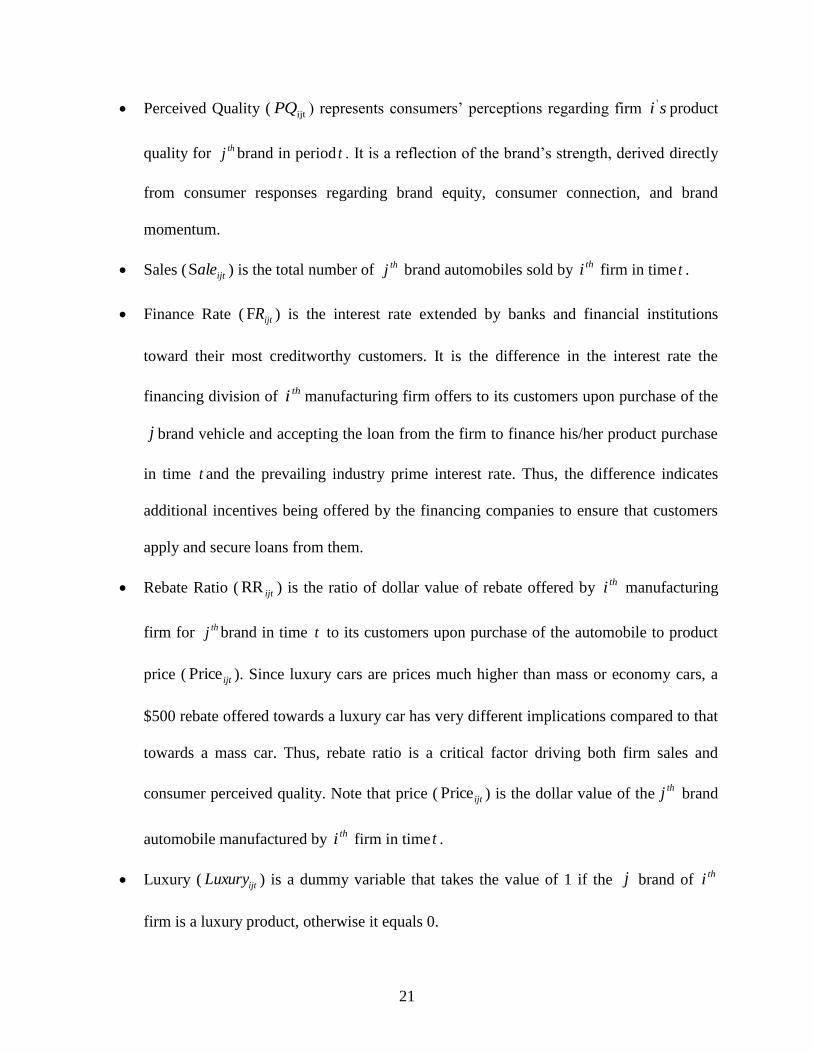
Perceived Quality ( ijtPQ ) represents consumers’ perceptions regarding firm si 'product
quality for thj brand in period t . It is a reflection of the brand’s strength, derived directly
from consumer responses regarding brand equity, consumer connection, and brand
momentum.
Sales ( ijtaleS ) is the total number of thj brand automobiles sold by thi firm in time t .
Finance Rate ( ijtRF ) is the interest rate extended by banks and financial institutions
toward their most creditworthy customers. It is the difference in the interest rate the
financing division of thi manufacturing firm offers to its customers upon purchase of the
j brand vehicle and accepting the loan from the firm to finance his/her product purchase
in time t and the prevailing industry prime interest rate. Thus, the difference indicates
additional incentives being offered by the financing companies to ensure that customers
apply and secure loans from them.
Rebate Ratio ( ijtRR ) is the ratio of dollar value of rebate offered by thi manufacturing
firm for thj brand in time t to its customers upon purchase of the automobile to product
price ( ijtPrice ). Since luxury cars are prices much higher than mass or economy cars, a
$500 rebate offered towards a luxury car has very different implications compared to that
towards a mass car. Thus, rebate ratio is a critical factor driving both firm sales and
consumer perceived quality. Note that price ( ijtPrice ) is the dollar value of thethj brand
automobile manufactured by thi firm in time t .
Luxury ( ijtLuxury ) is a dummy variable that takes the value of 1 if the j brand of thi
firm is a luxury product, otherwise it equals 0.
22
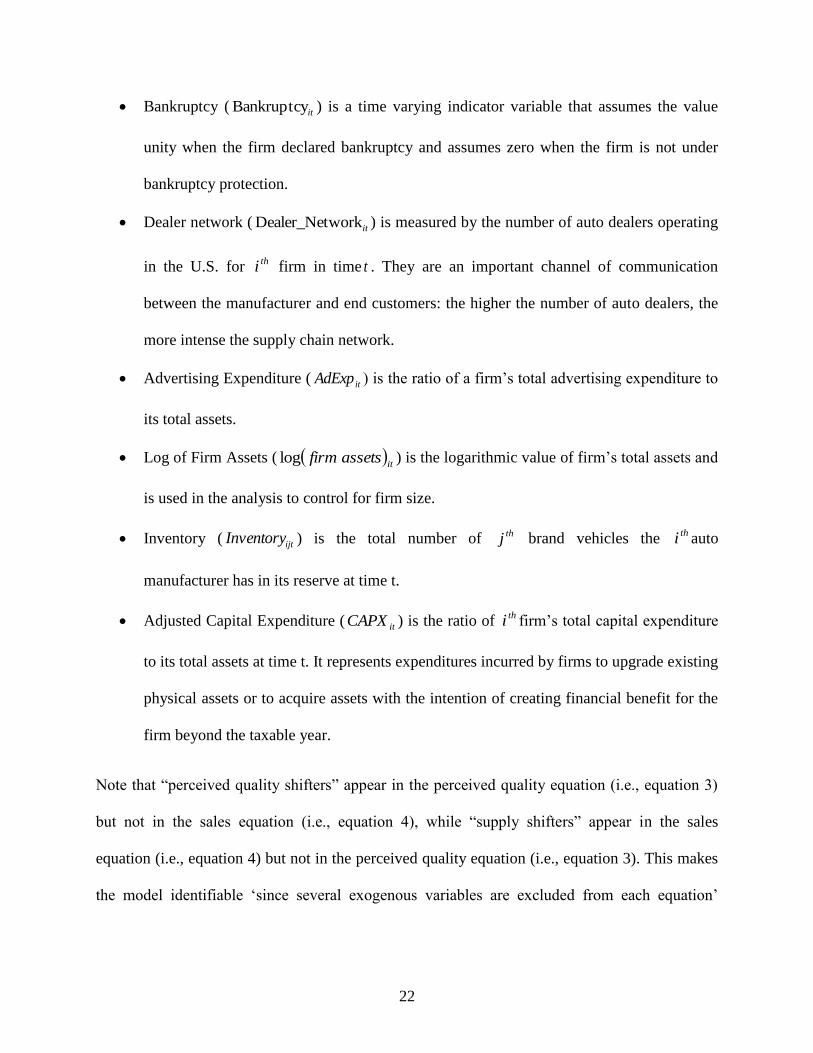
Bankruptcy ( itBankruptcy ) is a time varying indicator variable that assumes the value
unity when the firm declared bankruptcy and assumes zero when the firm is not under
bankruptcy protection.
Dealer network ( itworkDealer_Net ) is measured by the number of auto dealers operating
in the U.S. for thi firm in time t . They are an important channel of communication
between the manufacturer and end customers: the higher the number of auto dealers, the
more intense the supply chain network.
Advertising Expenditure ( itAdExp ) is the ratio of a firm’s total advertising expenditure to
its total assets.
Log of Firm Assets ( it
assetsfirmlog ) is the logarithmic value of firm’s total assets and
is used in the analysis to control for firm size.
Inventory ( ijtInventory ) is the total number of thj brand vehicles the thi auto
manufacturer has in its reserve at time t.
Adjusted Capital Expenditure ( itCAPX ) is the ratio of thi firm’s total capital expenditure
to its total assets at time t. It represents expenditures incurred by firms to upgrade existing
physical assets or to acquire assets with the intention of creating financial benefit for the
firm beyond the taxable year.
Note that “perceived quality shifters” appear in the perceived quality equation (i.e., equation 3)
but not in the sales equation (i.e., equation 4), while “supply shifters” appear in the sales
equation (i.e., equation 4) but not in the perceived quality equation (i.e., equation 3). This makes
the model identifiable ‘since several exogenous variables are excluded from each equation’

23
(Verhoef, Neslin and Vroomen, 2007). The error terms PQ
ijt and S
ijt are potentially correlated
with each other for a given firm and across firms.

24
1.4 Data and Measurement Variables
In this study, we considered 16 major auto manufacturers that were operating in the U.S. auto
industry between 2003 and 2012 and offering either luxury or economy or both brands of
products to the customers. Perceived quality information by brand was obtained from Harris
Interactive. We obtained weekly brand specific promotional information (i.e. cash rebate and
finance rate), monthly sales transaction, inventory and supply information by brand and firm
specific dealership network information from Automotive News. Brand specific price
information was sourced from Kelly Blue Book and warranty information from Gillis (2007).
We obtained advertisement and capital expenditure data from COMPUSTAT and product age
and luxury information from respective auto manufacturers’ websites (see Appendix 1).
25
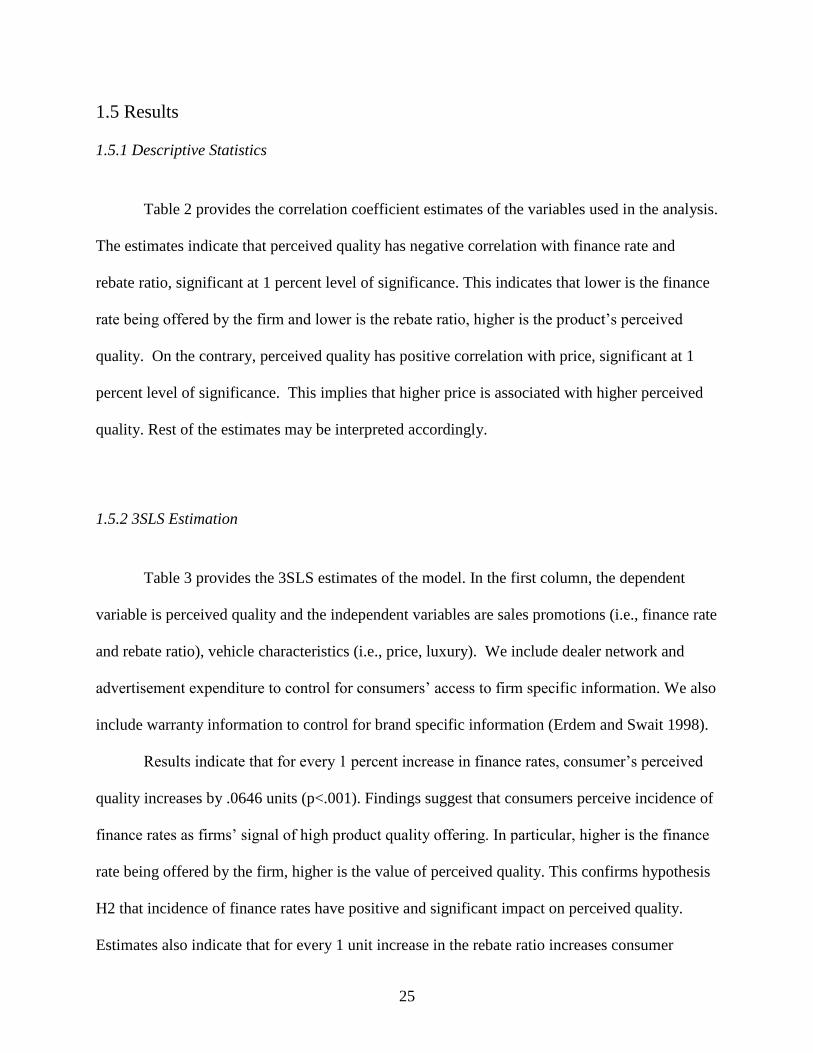
1.5 Results
1.5.1 Descriptive Statistics
Table 2 provides the correlation coefficient estimates of the variables used in the analysis.
The estimates indicate that perceived quality has negative correlation with finance rate and
rebate ratio, significant at 1 percent level of significance. This indicates that lower is the finance
rate being offered by the firm and lower is the rebate ratio, higher is the product’s perceived
quality. On the contrary, perceived quality has positive correlation with price, significant at 1
percent level of significance. This implies that higher price is associated with higher perceived
quality. Rest of the estimates may be interpreted accordingly.
1.5.2 3SLS Estimation
Table 3 provides the 3SLS estimates of the model. In the first column, the dependent
variable is perceived quality and the independent variables are sales promotions (i.e., finance rate
and rebate ratio), vehicle characteristics (i.e., price, luxury). We include dealer network and
advertisement expenditure to control for consumers’ access to firm specific information. We also
include warranty information to control for brand specific information (Erdem and Swait 1998).
Results indicate that for every 1 percent increase in finance rates, consumer’s perceived
quality increases by .0646 units (p<.001). Findings suggest that consumers perceive incidence of
finance rates as firms’ signal of high product quality offering. In particular, higher is the finance
rate being offered by the firm, higher is the value of perceived quality. This confirms hypothesis
H2 that incidence of finance rates have positive and significant impact on perceived quality.
Estimates also indicate that for every 1 unit increase in the rebate ratio increases consumer
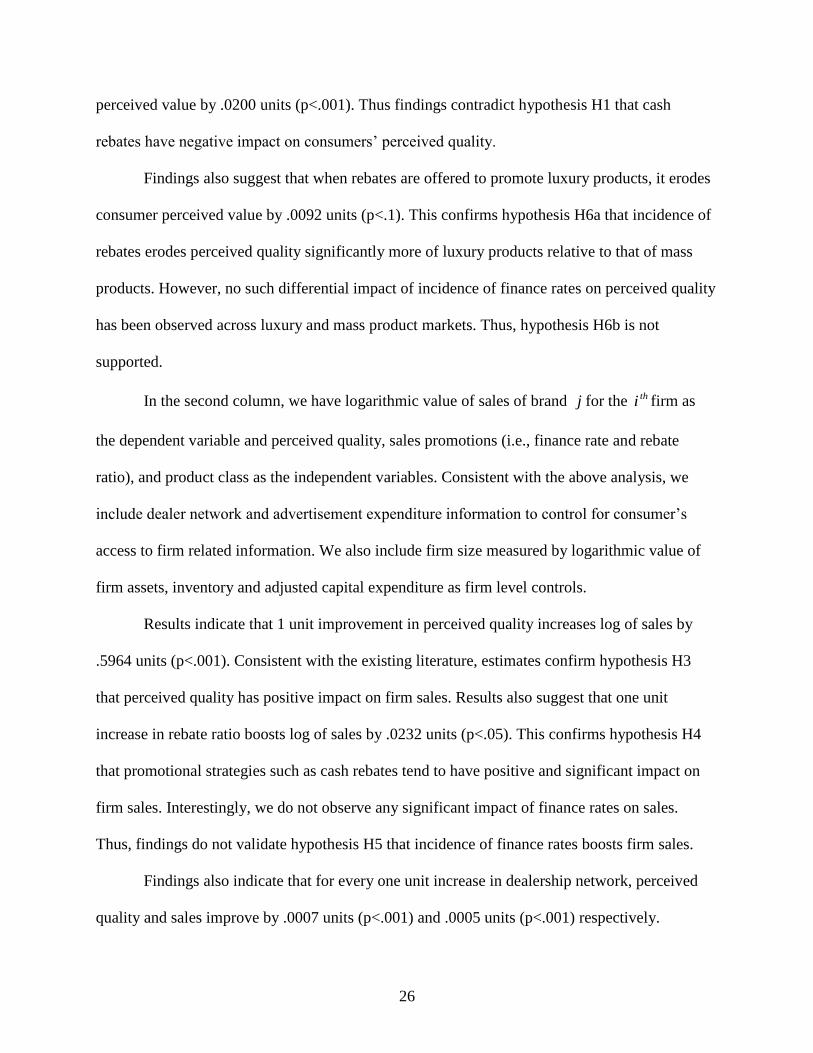
26
perceived value by .0200 units (p<.001). Thus findings contradict hypothesis H1 that cash
rebates have negative impact on consumers’ perceived quality.
Findings also suggest that when rebates are offered to promote luxury products, it erodes
consumer perceived value by .0092 units (p<.1). This confirms hypothesis H6a that incidence of
rebates erodes perceived quality significantly more of luxury products relative to that of mass
products. However, no such differential impact of incidence of finance rates on perceived quality
has been observed across luxury and mass product markets. Thus, hypothesis H6b is not
supported.
In the second column, we have logarithmic value of sales of brand j for the thi firm as
the dependent variable and perceived quality, sales promotions (i.e., finance rate and rebate
ratio), and product class as the independent variables. Consistent with the above analysis, we
include dealer network and advertisement expenditure information to control for consumer’s
access to firm related information. We also include firm size measured by logarithmic value of
firm assets, inventory and adjusted capital expenditure as firm level controls.
Results indicate that 1 unit improvement in perceived quality increases log of sales by
.5964 units (p<.001). Consistent with the existing literature, estimates confirm hypothesis H3
that perceived quality has positive impact on firm sales. Results also suggest that one unit
increase in rebate ratio boosts log of sales by .0232 units (p<.05). This confirms hypothesis H4
that promotional strategies such as cash rebates tend to have positive and significant impact on
firm sales. Interestingly, we do not observe any significant impact of finance rates on sales.
Thus, findings do not validate hypothesis H5 that incidence of finance rates boosts firm sales.
Findings also indicate that for every one unit increase in dealership network, perceived
quality and sales improve by .0007 units (p<.001) and .0005 units (p<.001) respectively.

27
Dealership network provides effective communication channel between the manufacturer and the
consumers and are able to provide authentic information regarding product quality along with
information on lucrative promotional deals to their customers. Additionally, higher dealership
network corresponds to higher competition amongst the dealers. In such a competitive
environment, as survival strategies, dealers would strive to provide better service and offer better
deals to customers. This eventually improves perceived quality and enhances sales.
To farther unravel the differential impact of promotional strategies on perceived quality
and firm sales across product class, we estimate the model for two subsectors (i.e., luxury and
mass automobiles) (Table 4). First two columns provide us with estimates for the mass product
whereas third and fourth column provide us with estimates of the luxury product. Additionally,
we have perceived quality (log of sales) as the dependent variable in the first and third (second
and forth) columns. Consistent with the previous sections, we have promotional strategies (i.e.,
finance rates and rebate ratio) as the independent variables. Furthermore, we control for
consumers’ access to information and firm characteristics.
Estimates suggest that in the mass market, one unit increase in finance rates improves
consumer perceived value by .0663 units (p<.001). Similarly, in the luxury market, one unit
improvement in finance rates drives up perceived quality by .028 units (p<.05). Interestingly, the
differential impact of finance rate across the two markets is not statistically significant. Thus,
results do not support hypothesis H6b that the positive effect of finance rates on perceived
quality is stronger for luxury vis-à-vis mass products. Post-hoc, we conducted one-way analysis
of variance to test for difference in means in perceived quality across product class. Findings
suggest that mean (standard deviation) of perceived quality of luxury products is higher (lower)

28
than that of mass products. Hence, consumers targeting the luxury market are less sensitive to
perceived quality.
Empirical findings suggest that in the mass market, one unit increase in rebate ratio
increased perceived quality by .0203 units (p<.001). Contrary to the findings in the literature,
estimates indicate that after controlling for firm's filing for bankruptcy protection and other firm
characteristics, rebates have a positive impact on perceived quality. However, rebate ratios may
not have any impact on perceived quality in the luxury market.
Empirical estimates indicate that one unit increase in perceived quality in the mass
(luxury) market enhances log of sales by .5972 units (.8145 units) both at p<.001. Thus, findings
support hypothesis H3 that perceived quality boosts sales, irrespective of the product market
characteristics. Results also indicate that one unit drop in finance rates in luxury market
improves sales by .0761 units (p<.05), with no significant impact in the mass market. Findings
support hypothesis H7b that the negative effect of finance rates on sales is strong in the luxury
market compared to the mass market. On the other hand, estimates indicate that one unit increase
in rebate ratio in the mass market increases log of sales by .0279 unit (p<.05) with no significant
impact on sales in the luxury market. This confirms hypothesis H7a that cash rebates may be an
important driver of sales in the mass market relative to that in the luxury market. Thus, findings
suggest that attractive finance rates are effective promotional strategies to boost sales in the
luxury market whereas rebates drive sales exclusively in the mass market.

29
1.6 Post-Hoc Analysis
1.6.1 Contingencies in Sales Promotion Strategies
Having established the relation between promotional strategies, perceived quality and
firm performance, post-hoc we analyzed whether firm’s promotional strategies are indeed driven
by lagged values of perceived quality, along with firm characteristics such as sales, inventory
and supply functions. Contingency theory is a strand of behavioral theory that proposes that
strategic decisions adopted by managers are contingent on its internal needs and the
environmental circumstances that the firms needs to adjust to (Morgan 1986). Even though
strategy is not a universal concept, its structure must be fitted into its context to enhance
organizational performance (Schoonhoven 1981; Mohr 1982). This fit is a vital concept, as it
needs to support firm’s competitive strategies. In fact, strategic fit may aid the firm to acquire
and develop critical resources and capabilities, which may endow it with competitive edge
(Drazin and Van de Ven, 1985).
Perceived quality corresponds to firms’ financial health. Thus, it is imperative for
managers to comprehend whether consumers perceive their product offerings of high quality
relative to their competitors. We posit that while crafting market-mix plans, managers internalize
perceived quality information. Specifically, if perceived qualities of product offerings are high,
firms would continue to adopt marketing strategies that would convey similar and consistent cue
to their consumer base. On the contrary, if firms have a history of low perceived quality,
managers would adopt marketing strategies that would influence consumer’s perception
regarding product quality towards better. Thus, we theorize that firm’s adoption of promotional
strategies is contingent on lagged value of perceived quality of its product offerings.

30
Extant literature indicates that two common features of consumer durable goods markets
are inventory pile up relative to sales and declining product prices over its life cycle (Copeland,
Dunn, and Hall (2005). Thus, managers are constantly required to synchronize their promotional
strategies, inventory and supply management to maximize firm valuation and sale. Even though
depleting inventory restricts inventory carrying costs, running too low on inventory may prove to
be detrimental for firm reputation (Hendricks and Singhal 2003). Additionally, supply
uncertainties due to external factors often require managers to adjust promotional strategies to
adjust with projected product demand. For example, due to natural calamities, manufacturing
firms may experience unplanned manufacturing parts or product supply disruptions (Chopra and
Sodhi 2004). Furthermore, demand for firm’s product offerings are exposed to seasonal
variations. Consistent with contingency theory, we posit that promotional incentives are often
endogenously determined, adopted by managers to improve sales, deplete inventory and adjust
variations in supply. Specifically, they provide the firm with a strategic fit between its internal
requirements and the environmental conditions it is exposed to, thereby improving its valuation.
1.6.2 Unit Root Test
First, we conduct unit-root tests to determine whether the variables used in the study (i.e.,
sales, promotions, inventory, etc.) are stationary or evolving over time. A unit root test helps us
to determine whether the variables should enter the Granger Causality Model in level or
difference form. We applied the augmented Dickey Fuller (ADF) test to examine the stationarity
of each individual series. Following is the general form of the test equation:
t
n
k
ktktt t
1
1
110 SS1S (5)
31
where tS is the variable of interest; t is a trend variable; L 1 where L is the lag operator;
andt is a white noise term. Additionally,
0 is the intercept term that accounts for the fact that
tS at 0t (i.e., 0S ) need not necessarily be equal to zero (Nijs et al., 2001). The null
hypothesis is 1:H0 and tS is said to possess the unit root property if one fails to reject
0H (Dickey and Fuller, 1979).
1.6.3 Cointegration Test
Evolving variables are said to be cointegrated when a linear combination of the variables
exists and results in stable residuals (Dekimpe and Hanssens, 2003). Various factors may drive
such long-run equilibria. For example, a boost in sales may translate into higher marketing
budget allocations, which may be reflected in a firm’s higher sales promotion expenditure. In
addition, competitive decision rules may restrict skewed distribution of the marketing budget.
This may ensure that budget allocation across marketing mix variables does not deviate
substantially. We use Johansen’s Full Information Maximum Likelihood (FIML) procedure to
test for possible pairwise cointegration of the five time series (i.e., finance rates, rebates,
inventory, supply and sales functions) (Johansen, 1995).
1.6.4 Granger Causality Test
We perform the Granger causality test to analyze whether an incidence of promotions is
triggered by the firm’s lagged sales, inventory, and supply information as well as history of

32
perceived quality of its product offerings. This is a well-established test for bivariate causality,
which involves estimating a linear reduced-form vector autoregression (VAR) (Granger, 1988):
tYXiYi
tXYiXi
XYY
YXX
,
K
1i
l-t
K
1i
i-t0t
,
K
1i
i-t
K
1i
i-t0t
(6)
where Yi is the coefficient on the lagged Y values,
Xi is the coefficient on the lagged X
values, and tX , and tY , are assumed to be independent and identically distributed (i.e.,
2,1,,0 2 iiid i ). To examine Granger causality between X and Y , the following null
hypotheses were tested: KtoiH Yi 10:0 and KtoiH Xi 10:0 . If neither set of
null hypotheses can be rejected, then X and Y are an independent series. If both are rejected,
then there is "feedback" between X and Y . If the hypothesis KtoiH Xi 10:0 is
rejected but the other is not, there is unidirectional causality running from X and Y .
Conversely, if hypothesis KtoiH Yi 10:0 is rejected but the other is not, then the
reverse is true (Hiemstra and Jones, 1994; Granger, Huang and Yang, 2000). Further, to avoid
model misspecification, appropriate lag structure must be identified based on statistical criterion
(Thornton and Batten, 1985).
Results from the Dickey Fuller test reveal that cash rebates, finance rate, sales, inventory,
and supply series are stationary. Next, we conduct a Johansen cointegration trace test to examine
if pairwise series share a common stochastic drift. Cointegration test results reveal that each of
the pairwise series has two cointegrated processes. Thus, we introduced the error correction term
while conducting the Granger Causality test (Granger, Huang and Yang, 2000).

33
Estimates in the Granger Causality test reveal that for every 1 unit increase in sales in
period 2-t , finance rate offered by the thi manufacturing firm against brand j in period
t increases by .00001 percentage points, significant at a 10 percent level of significance.
Additionally, for every 1unit drop in inventory in period 2-t , finance rate offered by the
thi manufacturing firm against brand j in period t increases by .00001 percentage points,
significant at a 5 percent level of significance. Improvement in sales and depletion in inventory
are positive signals to a firm’s management regarding product management. Thus, managers
respond to such positive signals by increasing finance rates, thereby adjusting the marketing-mix
strategies by reducing their promotion expenditure against finance rate deals.
Estimates also reveal that for every 1 unit drop in sales in period ‘ 2-t ’, incidence of
cash rebates in period ‘ t ’ increases by .00261 cents, significant at a 10 percent level of
significance. Additionally, for every 1 unit increase in inventory in period ‘ 2-t ’, incidence of
cash rebates in period ‘ t ’ increases by .00047 cents, significant at a 5 percent level of
significance. Thus, managers often extend cash rebates incentives to consumers to make product
purchases, thereby improving sales and depleting excess inventory. Interestingly, we observe a
two period lag between the dip in sales and an increase in inventory and the execution of the
strategic action by the firm. Findings are consistent with our conjecture that a firm’s decision to
extend promotional strategies (i.e., finance rates and cash rebates) is contingent on the firm’s
lagged sales, inventory, and supply functions. However, findings fail to confirm our hypothesis
that a firm’s decision to extend promotional strategies is contingent on consumers’ perceived
quality regarding its product offerings. This may be due to the intangibility characteristic of
‘perceived quality’ and manager’s inability to quantify it.

34
Estimates also indicate that incidence of finance rate in period t exhibits a negative
correlation with finance rates and cash rebates offered in periods 1-t and 2-t , significant at a
10 percent or higher level of significance. This suggests that firms are less likely to offer
attractive finance rates as promotional strategies in consecutive periods. Additionally, if the firm
offers attractive finance rates in the current period, it is less likely that the firm would have
offered cash rebates in the last two periods. This may be indicative of the fact that managers are
less inclined to opt for alternative promotional tactics in consecutive periods.
Results also indicate that an incidence of cash rebates in period t exhibits a negative
correlation with a firm’s extension of cash rebates in periods 1-t or 2-t , significant at a 5
percent level of significance or higher. This may indicate that firms are less likely to extend cash
rebates in consecutive period. Additionally, findings also suggest that a firm’s decision to extend
a cash rebate is not contingent on its decision to extend an attractive finance rate in previous
periods.
1.7 Discussion
Key Findings: Threats of market share erosion, mass customization, and product
commoditization are some critical factors that motivate firms to differentiate their product
offerings through various promotional incentives (Neslin, 2002, Busse, Simester and
Zettelmeyer, 2010). U.S. auto manufacturers are no exceptions. They frequently extend sales
promotions as rebates, attractive finance rates, or a combination of the two to enhance product
attractiveness and increase consumers’ willingness to buy (Thompson and Noordewier, 1992).
Historically, while the big-3 automakers typically offer a combination of cash rebate and
35
attractive finance rate deals to attract consumers, Honda and Volkswagen exclusively offer
attractive financing rates cut to attract potential consumers (Automotive News).
Thus, the intriguing question is why firms, even in the same industry, differ in their
extension of promotional incentives. Do firms use promotional strategies to signal product
quality? In the current study, we investigate if incidence of sales promotions has a direct and an
indirect impact on sales. Results confirm that in addition to the direct relationship between sales
promotions and sales, consumers’ perceived quality mediates the relationship. In particular, after
controlling for firm’s history of bankruptcy filing and firm characteristics, incidence of both
categories of promotional tactics (i.e., finance rates and cash rebates) improves perceived quality.
Moreover, perceived quality has a positive and significant impact on firm sales irrespective of
the product market characteristics.
Next, we examine whether the impact of promotion mix on sales is moderated by product
class. Results indicate that an extension of attractive finance rates boosts sales exclusively in the
luxury market where as effectiveness of rebates as a driver of sales is limited in the mass market.
Estimates indicate that incidence of finance rates improves consumer perceived value in both
categories of product classes. Interestingly, positive relation between incidence of cash rebates
and perceived quality is observed exclusively in the mass market.
Empirical findings suggest that the dealership network improves consumers’ perception
regarding product quality and sales. This may indicate that a dense dealer network increases
competition among the dealers and induces them to provide better value propositions to their
consumers, thereby improving consumers’ perceived quality. Moreover, intense dealer network
improves consumers’ access to firm and brand related information, which may consequently
influence product sales.

36
Ceteris paribus, managers may strive to adjust their promotion-mix tactics to maximize
firm sales while dynamically optimizing their inventory holdings as well as adjusting for
variations in product demand and uncertainty in supply. Thus, to complete the analysis, our post-
hoc analysis investigates whether firm’s promotional tactics are endogenously determined by
firm specific criterion, such as lagged sales, inventory, and supply functions as well as
consumers’ perception of product quality. Granger causality estimates indicate that promotional
tactics adopted by firms are not ad-hoc decisions imposed by the top management team. Rather,
they are endogenously determined tactics, dependent on the firm’s internal factors, such as
inventory and sales. Interestingly, estimates suggest that managers may not internalize
consumer’s perception of product quality while adopting their promotion-mix decisions. This
may be due to the intangibility characteristics of ‘perceived quality’ and the manager’s inability
to quantify the concept.
Results also indicate that a firm’s adjustment to promotional tactics with the advent of
sales and inventory information is not instantaneous; rather one observes the adjustment process
with few lag periods. In particular, with a dip in sales or inventory pile up in period 2t ,
managers typically extend rebates to boost sales and deplete inventory in period t . On the
contrary, a boost in sales and the depletion of inventory in period 2t encourages managers to
increase their finance rate offerings in period t , thereby reducing budget allocation targeted
towards this specific promotion strategy.
Managerial Implications: Auto firms tend to invest heavily to advertise and promote their
product offerings. For example, according to Kantar Media's 2011 index of top advertisers,
General Motors ranks second in marketing budget, with an overall budget approximately equal to
$3.1 billion, 2.081 percent of its revenue. Thus, it is imperative for a firm’s management to

37
adopt optimal marketing-mix strategies that would not only cover the marketing cost but also
ensure increasing returns. Estimates indicate that effectiveness of finance rates as a demand
booster is restricted in the luxury product market whereas that of cash rebates is limited to the
mass market. Thus, managers’ promotion-mix decisions are contingent on the product class of
their offerings. In particular, incidence of rebates in the luxury market may not only drain firm’s
exchequer without any significant improvement in sales but also may have no implications on
consumer perceived value.
Limitations and Future Research: In this section, we address some of the limitations of
the current study and list potential future research. Even though we have access to promotional
tactics, sales, and inventory information at the brand level, information on firm performance (i.e.,
revenue, net income, earnings per share etc.) is only available at the firm level. Thus, due to data
limitations, analysis of the impact of promotions on firm performance in the luxury and mass
product classes is restricted to variation in firm sales.
The current study assumes that at any given time period, firms offer identical finance rates to
their entire consumer base. However, in reality, finance lenders segment their finance rate
offerings based on consumers’ credit worthiness. However, due to lack of adequate consumer
credit information and information regarding the credit segmentation process employed by the
lenders, we were unable to incorporate segmentation analysis in our study. It may be interesting
to analyze how incidence of varying finance rates across segments of consumers with differing
credit scores affects perceived quality and sales.
Furthermore, it may be interesting to investigate the moderating effect of market dynamism
on the relationship between promotional tactics and firm performance. Specifically, in a highly
competitive industry, firms are expected to aggressively offer price promotions to attract

38
consumers and to maintain their market share in the industry. On the other hand, with less
competition and few key players in the market, firms may be less threatened by erosion of
market share. Thus, one may observe managers allocating significantly less budget resources
toward promotions in low to mildly competitive markets.

39
APPENDIX

40
Table 1: Prior Research on Sales Promotions in Marketing
Article
Assess Various
Promotions
Independently?
Consider
Contingency
Effects?
Consider
Attitudinal
Outcome?
Consider
Behavioral
Outcome?
Address Data
Frequency
Mismatch Issues?
Current Paper
Rebates and
finance rate offers
Moderating Effects
of Product Class
Perceived Quality
Unit Sales
Mixed Data
Sampling
Regression
(MIDAS)
Gangwar,
Kumar and Rao
(2013)
Shallow versus
deep price
promotions with
varying depth and
frequency
Consumer
stockpiling
Leeflang and
Parreño-Selva
(2012)
Cross category
demand
Martín-Herrán,
Sigué and
Zaccour (2010)
Rebates, trade
deals
Moderating effect
of consumer
sensitivity to
promotions
Unit sales
Busse, Simester
and Zettelmeyer
(2010)
Consumers'
perception of price
changes
Purchase
acceleration
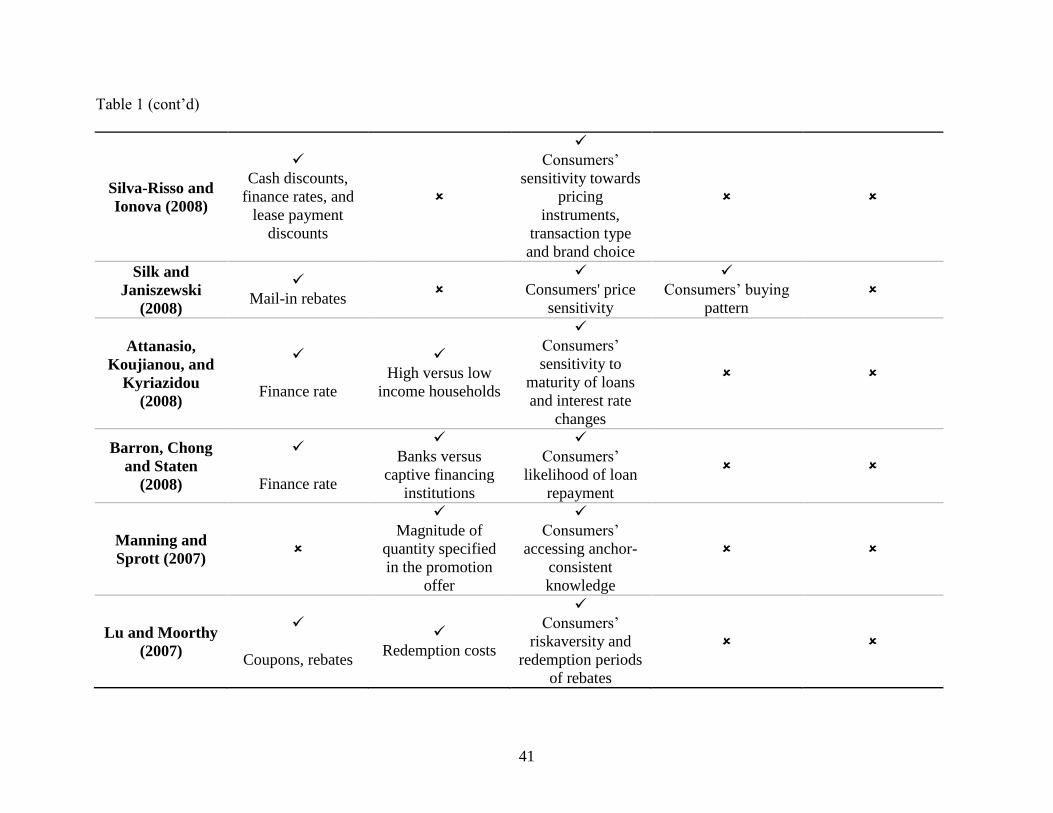
41
Table 1 (cont’d)
Silva-Risso and
Ionova (2008)
Cash discounts,
finance rates, and
lease payment
discounts
Consumers’
sensitivity towards
pricing
instruments,
transaction type
and brand choice
Silk and
Janiszewski
(2008)
Mail-in rebates
Consumers' price
sensitivity
Consumers’ buying
pattern
Attanasio,
Koujianou, and
Kyriazidou
(2008)
Finance rate
High versus low
income households
Consumers’
sensitivity to
maturity of loans
and interest rate
changes
Barron, Chong
and Staten
(2008)
Finance rate
Banks versus
captive financing
institutions
Consumers’
likelihood of loan
repayment
Manning and
Sprott (2007)
Magnitude of
quantity specified
in the promotion
offer
Consumers’
accessing anchor-
consistent
knowledge
Lu and Moorthy
(2007)
Coupons, rebates
Redemption costs
Consumers’
riskaversity and
redemption periods
of rebates
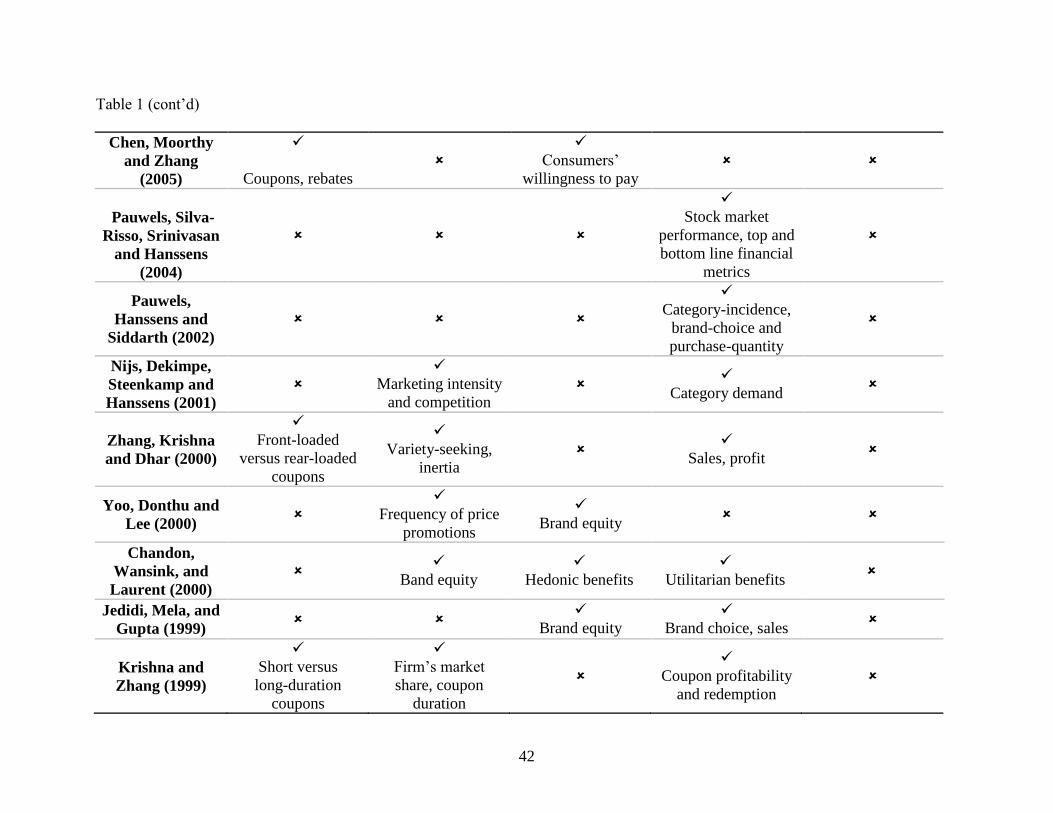
42
Table 1 (cont’d)
Chen, Moorthy
and Zhang
(2005)
Coupons, rebates
Consumers’
willingness to pay
Pauwels, Silva-
Risso, Srinivasan
and Hanssens
(2004)
Stock market
performance, top and
bottom line financial
metrics
Pauwels,
Hanssens and
Siddarth (2002)
Category-incidence,
brand-choice and
purchase-quantity
Nijs, Dekimpe,
Steenkamp and
Hanssens (2001)
Marketing intensity
and competition
Category demand
Zhang, Krishna
and Dhar (2000)
Front-loaded
versus rear-loaded
coupons
Variety-seeking,
inertia
Sales, profit
Yoo, Donthu and
Lee (2000)
Frequency of price
promotions
Brand equity
Chandon,
Wansink, and
Laurent (2000)
Band equity
Hedonic benefits
Utilitarian benefits
Jedidi, Mela, and
Gupta (1999)
Brand equity
Brand choice, sales
Krishna and
Zhang (1999)
Short versus
long-duration
coupons
Firm’s market
share, coupon
duration
Coupon profitability
and redemption

43
Table 1 (cont’d)
Dekimpe,
Hanssens and
Silva-Risso
(1998)
National and
private-label
brands
Category and brand
sales
Dhar and Raju
(1998)
Cross-ruff coupons
Demand
complements or
substitutes
Target and carrier
brand sales and profit
Mela, Gupta,
and Lehmann
(1997)
Consumers' brand
choice behavior
Narasimhan,
Neslin, and Sen
(1996)
Featured price cuts,
displayed price cuts,
and pure price cuts
Number of brands
offered, category
penetration,
interpurchase
times, and
consumer
propensity to
stockpile
Impulse buying,
private label market
share
Dhar and Hoch
(1996)
In-store coupons,
off-the-shelf price
discounts
Unit category sales,
retailer profit
Greenleaf (1995)
Price promotions,
trade deals
Consumers’ reaction
to reference price
effects
Profit
Raju, Dhar and
Morrison (1994)
Package coupons
Market share
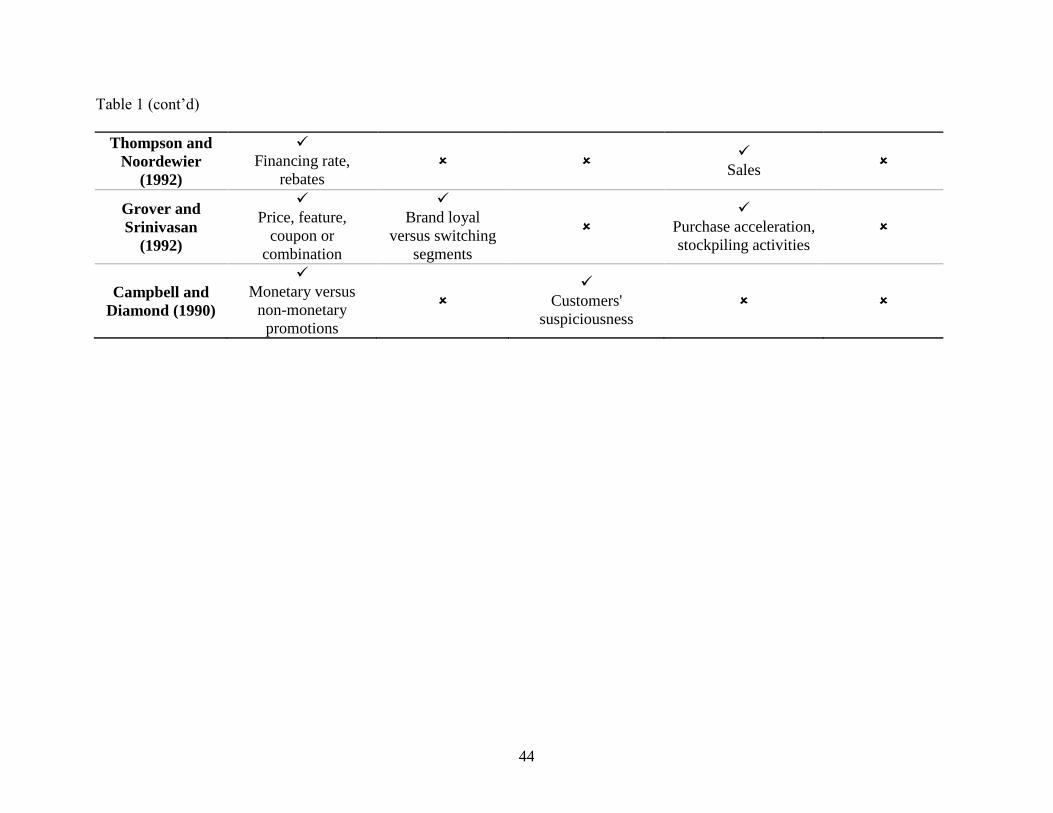
44
Table 1 (cont’d)
Thompson and
Noordewier
(1992)
Financing rate,
rebates
Sales
Grover and
Srinivasan
(1992)
Price, feature,
coupon or
combination
Brand loyal
versus switching
segments
Purchase acceleration,
stockpiling activities
Campbell and
Diamond (1990)
Monetary versus
non-monetary
promotions
Customers'
suspiciousness
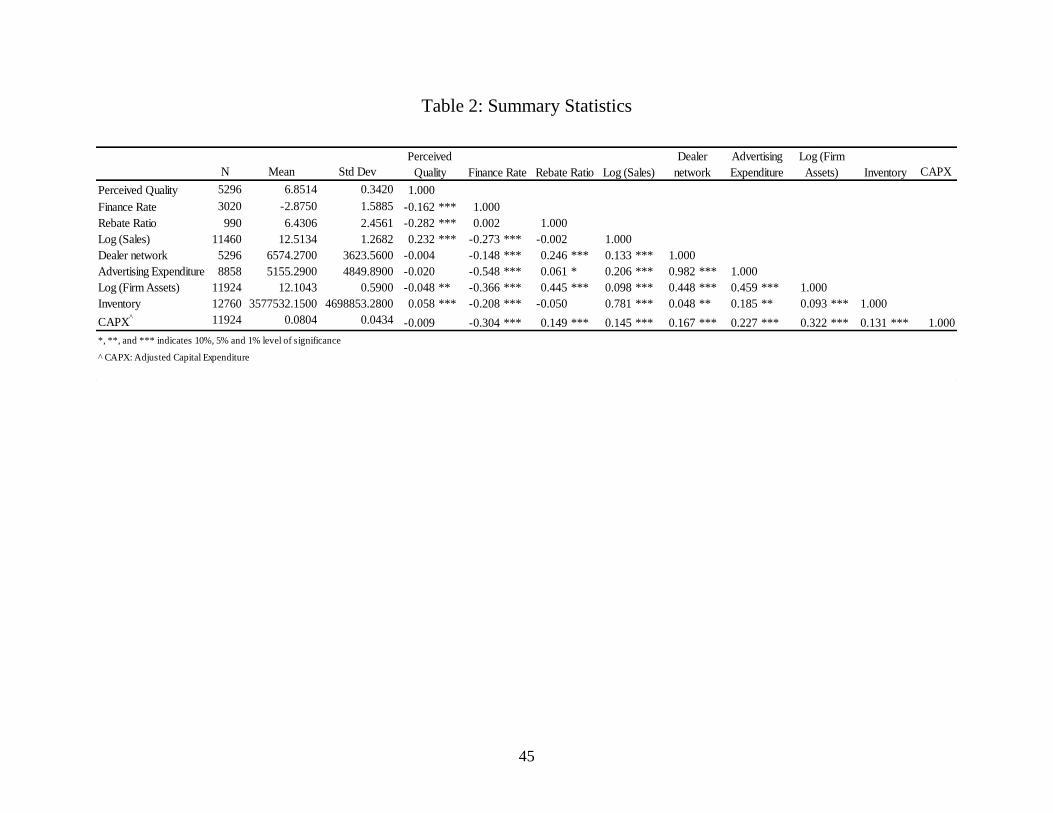
45
Table 2: Summary Statistics
N Mean Std Dev CAPX
Perceived Quality 5296 6.8514 0.3420 1.000
Finance Rate 3020 -2.8750 1.5885 -0.162 *** 1.000
Rebate Ratio 990 6.4306 2.4561 -0.282 *** 0.002 1.000
Log (Sales) 11460 12.5134 1.2682 0.232 *** -0.273 *** -0.002 1.000
Dealer network 5296 6574.2700 3623.5600 -0.004 -0.148 *** 0.246 *** 0.133 *** 1.000
Advertising Expenditure 8858 5155.2900 4849.8900 -0.020 -0.548 *** 0.061 * 0.206 *** 0.982 *** 1.000
Log (Firm Assets) 11924 12.1043 0.5900 -0.048 ** -0.366 *** 0.445 *** 0.098 *** 0.448 *** 0.459 *** 1.000
Inventory 12760 3577532.1500 4698853.2800 0.058 *** -0.208 *** -0.050 0.781 *** 0.048 ** 0.185 ** 0.093 *** 1.000
CAPX^ 11924 0.0804 0.0434 -0.009 -0.304 *** 0.149 *** 0.145 *** 0.167 *** 0.227 *** 0.322 *** 0.131 *** 1.000
^ CAPX: Adjusted Capital Expenditure
*, **, and *** indicates 10%, 5% and 1% level of significance
Finance Rate
Dealer
network
Advertising
Expenditure
Perceived
Quality Rebate Ratio
Log (Firm
Assets) InventoryLog (Sales)
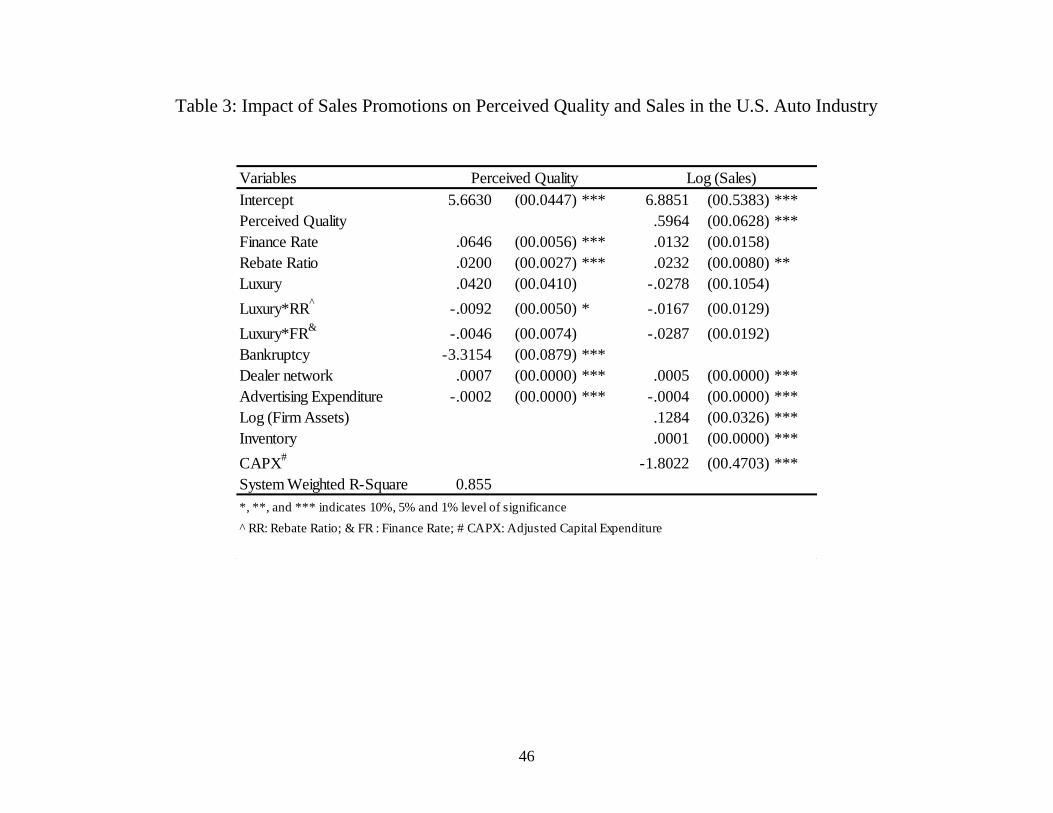
46
Table 3: Impact of Sales Promotions on Perceived Quality and Sales in the U.S. Auto Industry
Variables
Intercept 5.6630 (00.0447) *** 6.8851 (00.5383) ***
Perceived Quality .5964 (00.0628) ***
Finance Rate .0646 (00.0056) *** .0132 (00.0158)
Rebate Ratio .0200 (00.0027) *** .0232 (00.0080) **
Luxury .0420 (00.0410) -.0278 (00.1054)
Luxury*RR^
-.0092 (00.0050) * -.0167 (00.0129)
Luxury*FR&
-.0046 (00.0074) -.0287 (00.0192)
Bankruptcy -3.3154 (00.0879) ***
Dealer network .0007 (00.0000) *** .0005 (00.0000) ***
Advertising Expenditure -.0002 (00.0000) *** -.0004 (00.0000) ***
Log (Firm Assets) .1284 (00.0326) ***
Inventory .0001 (00.0000) ***
CAPX#
-1.8022 (00.4703) ***
System Weighted R-Square 0.855
^ RR: Rebate Ratio; & FR : Finance Rate; # CAPX: Adjusted Capital Expenditure
Perceived Quality Log (Sales)
*, **, and *** indicates 10%, 5% and 1% level of significance

47
Table 4: Impact of Auto Promotions on Firm Value and Perceived Quality: Mass Vs. Luxury Product
Variables
Intercept 5.6823 (00.0459) *** 7.3715 (00.5592) *** 5.5947 (00.1651) *** 1.3598 (01.5484)
Perceived Quality .5972 (00.0681) *** .8145 (00.1797) ***
Finnace Rate .0663 (00.0058) *** .0053 (00.0165) .0280 (00.0112) ** -.0761 (00.0265) **
Rebate Ratio .0203 (00.0027) *** .0279 (00.0083) ** .0071 (00.0083) -.0274 (00.0185)
Bankruptcy -3.2875 (00.0924) *** -3.4493 (00.3223) ***
Dealer network .0007 (00.0000) *** .00044 (00.00003) *** .0008 (00.0001) *** .0006 (00.0001) ***
Advertising Expenditure -.0002 (00.0000) *** -.0004 (00.0000) *** -.0002 (00.0000) *** -.0005 (00.0000) ***
Log (Firm Assets) .0827 (00.0355) ** .4585 (00.0754) ***
Inventory .0001 (00.0000) *** .0002 (00.0000) ***
CAPX#
-1.2992 (00.5018) ** -4.9089 (01.2053) ***
System Weighted R-Square 0.8577 .85980
# CAPX: Adjusted Capital Expenditure
*, **, and *** indicates 10%, 5% and 1% level of significance
Mass Product Luxury Product
Perceived Quality Log (Sales) Perceived Quality Log (Sales)

48
Table 5: Granger Causality Test: Impact of Lagged Sales, and Inventory and Supply on Firm's Promotional
Strategies in the U.S. Automobile Industry (2003 - 2012)
Independent Variables
Finance Rate in period t-1 -.45344 (00.03694) *** -7.13807 (22.33557)
Rebate in period t-1 -.00021 (00.00007) ** -.24347 (00.03958) ***
Perceived Quality in period t-1 -.03691 (00.12019) 14.97643 (72.67596)
Total Sales in period t-1 -.00001 (00.00000) .00047 (00.00143)
Inventory in period t-1 -.00001 (00.00000) .00008 (00.00021)
Supply in period t-1 .00003 (00.00046) -.61426 (00.27975)
Finance Rate in period t-2 -.27874 (00.03442) ** 39.85498 (20.81159) *
Rebate in period t-2 -.00010 (00.00006) * -.12125 (00.03531) **
Perceived Quality in period t-2 -.13022 (00.12011) 32.57484 (72.62346)
Total Sales in period t-2 .00001 (00.00000) * -.00261 (00.00141) *
Inventory in period t-2 -.00001 (00.00000) ** .00047 (00.00021) **
Supply in period t-2 .00063 (00.00046) -.87895 (00.27905)
month yes
Granger-Causality Wald Test
82.07 ***
Finance Rate in period t Cash Rebate in period t
*, **, and *** indicates 10%, 5% and 1% level of significance

49
Figure 1: Conceptual Model: The Differential Effects of Promotions for Mass versus Luxury Brands
Perceived Quality Sales Cash Rebates
Finance Rate
MASS BRANDS
Perceived Quality Cash Rebates
Finance Rate
LUXURYBRANDS
+
¯
¯
+ +
¯
+
+ +
¯ ¯
¯ ¯
+
+
Sales

50
BIBLIOGRAPHY

51
BIBLIOGRAPHY
Aaker, David A. (1991), Managing Brand Equity. New York:The Free Press.
Aaker, David A. "The value of brand equity." Journal of business strategy 13.4 (1992): 27-32.
Aaker, David A. and Robert Jacobson (1994)“The Financial Information Content of Perceived
Quality,” Journal of Marketing Research, Vol. 31, No. 2, Special Issue on Brand
Management(May, 1994), pp. 191-201.
Arellano, Manuel. "Testing for autocorrelation in dynamic random effects models." The review of
economic studies 57.1 (1990): 127-134.
Attanasio, Orazio P., Pinelopi Koujianou Goldberg, and Ekaterini Kyriazidou. "Credit Constraints
In The Market For Consumer Durables: Evidence From Micro Data On Car Loans*." International
Economic Review 49.2 (2008): 401-436.
Atwal, Glyn, and Alistair Williams. "Luxury brand marketing–the experience is everything!."
Journal of Brand Management 16.5 (2009): 338-346.
Ault, Richard W., T. Randolph Beard, David N. Laband and Richard P. Saba (2000), “Rebates,
Inventories, and Intertemporal Price Discrimination,” Economic Inquiry, 38 (4), 570–8.
Babakus, Emin, Carol C. Bienstock, and James R. Van Scotter. "Linking Perceived Quality and
Customer Satisfaction to Store Traffic and Revenue Growth*." Decision Sciences 35.4 (2004):
713-737.
Barron, John M., Byung‐Uk Chong, and Michael E. Staten. "Emergence of captive finance
companies and risk segmentation in loan markets: theory and evidence." Journal of Money, Credit
and Banking 40.1 (2008): 173-192.
Belch, G. E., Belch, M. A., Kerr, G. F., & Powell, I. (2008). Advertising and promotion: An
integrated marketing communications perspective. mcgraw-hill.
Bell, David R., and Xavier Drèze. "Changing the channel: A better way to do trade promotions."
Image (2012).
Beverland, Michael B. "Crafting brand authenticity: the case of luxury wines*." Journal of
Management Studies 42.5 (2005): 1003-1029.
Blattberg, Robert C., and Scott A. Neslin. "Sales promotion: the long and the short of it."
Marketing Letters 1, no. 1 (1989): 81-97.

52
Blattberg, Robert C., and Scott A. Neslin. Sales promotion: Concepts, methods, and strategies.
Englewood Cliffs, NJ: Prentice Hall, 1990.
Blattberg, Robert C., Richard Briesch, and Edward J. Fox. "How promotions work." Marketing
Science 14, no. 3_supplement (1995): G122-G132.
Busse, Meghan, Jorge Silva-Risso, and Florian Zettelmeyer. "$1,000 cash back: The pass-through
of auto manufacturer promotions." The American Economic Review (2006): 1253-1270.
Busse, Meghan R., Duncan I. Simester and Florian Zettelmeyer (2010) “The Best Price You’ll
Ever Get”: The 2005 Employee Discount Pricing Promotions in the U.S. Automobile Industry”,
Marketing Science 29(2), pp. 268–290.
Copeland, Adam, Wendy Dunn, and George Hall. Prices, production and inventories over the
automotive model year. No. w11257. National Bureau of Economic Research, 2005.
Chopra, Sunil, and ManMohan S. Sodhi. "Supply-chain breakdown." MIT Sloan management
review (2004).
Connelly, B. L., Certo, S. T., Ireland, R. D., & Reutzel, C. R. (2011). Signaling theory: A review
and assessment. Journal of Management, 37(1), 39-67.
Darke, Peter R., and Cindy MY Chung. "Effects of pricing and promotion on consumer
perceptions: it depends on how you frame it." Journal of Retailing 81.1 (2005): 35-47.
Dawar, Niraj, and Philip Parker. "Marketing universals: consumers' use of brand name, price,
physical appearance, and retailer reputation as signals of product quality." The Journal of
Marketing (1994): 81-95.
Dekimpe, Marnik G., Dominique M. Hanssens and Jorge M. Silva-Risso (1999) “Long-run effects
of price promotions in scanner markets”, Journal of Econometrics 89, 269-291.
Dekimpe, M. G., & Hanssens, D. M. (2004). Persistence modeling for assessing marketing
strategy performance. In D. Lehmann & C. Moorman (Eds.), Assessing marketing strategy
performance, Marketing Science Institute (pp. 69−93).
Demirag, Ozgun Caliskan, Pinar Keskinocak, and Julie Swann. "Customer rebates and retailer
incentives in the presence of competition and price discrimination." European Journal of
Operational Research 215.1 (2011): 268-280.
Dickey, David A., and Wayne A. Fuller. "Distribution of the estimators for autoregressive time
series with a unit root." Journal of the American statistical association 74.366a (1979): 427-431.
Drazin, Robert, and Andrew H. Van de Ven. "Alternative forms of fit in contingency theory."
Administrative science quarterly (1985): 514-539.

53
Erdem, Tülin, and Joffre Swait. "Brand equity as a signaling phenomenon." Journal of consumer
Psychology 7.2 (1998): 131-157.
Forbes, Mark P. "Method for retrieving vehicular collateral." U.S. Patent No. 6,025,774. 15 Feb.
2000.
Gambacorta, Leonardo. "How do banks set interest rates?." European Economic Review 52.5
(2008): 792-819.
Gangwar, Manish, Nanda Kumar, and Ram C. Rao. "Consumer Stockpiling and Competitive
Promotional Strategies." Marketing Science (2013).
Garvin, David A. "What does “product quality” really mean." Sloan management review 26.1
(1984).
Ghysels, Eric, Pedro Santa-Clara, and Rossen Valkanov. "The MIDAS touch: Mixed data
sampling regression models." (2004).
Ghysels, Eric, Arthur Sinko, and Rossen Valkanov. "MIDAS regressions: Further results and new
directions." Econometric Reviews 26.1 (2007): 53-90.
Gillis, Jack. The Car Book, 2007. Gillis Publishing Group.
Goldsmith, Ronald E., Leisa R. Flynn, and Daekwan Kim. "Status consumption and price
sensitivity." The Journal of Marketing Theory and Practice 18.4 (2010): 323-338.
Granger, Clive WJ. "Some recent development in a concept of causality." Journal of econometrics
39.1 (1988): 199-211.
Granger, Clive WJ, Bwo-Nung Huang, and Chin-Wei Yang. "A bivariate causality between stock
prices and exchange rates: evidence from recent Asianflu☆." The
Quarterly Review of Economics and Finance 40.3 (2000): 337-354.
Han, Young Jee, Joseph C. Nunes, and Xavier Drèze. "Signaling status with luxury goods: the role
of brand prominence." Journal of Marketing 74.4 (2010): 15-30.
Hendricks, Kevin B., and Vinod R. Singhal. "The effect of supply chain glitches on shareholder
wealth." Journal of Operations Management 21.5 (2003): 501-522.
Hiemstra, Craig, and Jonathan D. Jones. "Testing for Linear and Nonlinear Granger Causality in
the Stock Price‐Volume Relation." The Journal of Finance 49.5 (1994): 1639-1664.
Jedidi, Kamel, Carl F. Mela, and Sunil Gupta. "Managing advertising and promotion for long-run
profitability." Marketing science 18, no. 1 (1999): 1-22.
54
Jensen, T., Kees, J., Burton, S., & Turnipseed, F. L. (2003). Advertised reference prices in an
internet environment: effects on consumer price perceptions and channel search intentions. Journal
of Interactive Marketing, 17(2), 20-33.
Johansen, Søren. "Identifying restrictions of linear equations with applications to simultaneous
equations and cointegration." Journal of econometrics 69.1 (1995): 111-132.
Joshi, Amit, and Dominique M. Hanssens. "The direct and indirect effects of advertising spending
on firm value." Journal of Marketing 74.1 (2010): 20-33.
Kapferer, Jean-Noël, and Vincent Bastien. "The specificity of luxury management: Turning
marketing upside down." Journal of Brand Management 16.5 (2009): 311-322.
Kapferer, Jean-Noël a. The luxury strategy: break the rules of marketing to build luxury brands.
Kogan Page Publishers, 2012.
Kapferer, Jean-Noël b. "Why Luxury Should not Delocalize." European Business Review March
(2012): 58-62.
Kirmani, Amna, and Akshay R. Rao. "No pain, no gain: A critical review of the literature on
signaling unobservable product quality." Journal of marketing 64.2 (2000): 66-79.
Leeflang, Peter SH, and Josefa Parreño-Selva. "Cross-category demand effects of price
promotions." Journal of the Academy of Marketing Science 40, no. 4 (2012): 572-586.
Low, George S., and Charles W. Lamb Jr. "The measurement and dimensionality of brand
associations." Journal of Product & Brand Management 9.6 (2000): 350-370.
Lu, Qiang, and Sridhar Moorthy. "Coupons versus rebates." Marketing Science 26.1 (2007): 67-82.
Milgrom, Paul, and John Roberts. "Complementarities and fit strategy, structure, and
organizational change in manufacturing." Journal of accounting and economics 19.2 (1995): 179-
208.
Miyazaki, Anthony D., Dhruv Grewal, and Ronald C. Goodstein. "The effect of multiple extrinsic
cues on quality perceptions: a matter of consistency." Journal of Consumer Research 32.1 (2005):
146-153.
Mohr, Lawrence B. (1982) Explaining Organizational Behavior. Jossey-Bass Inc., San Francisco,
CA.
Morgan, G. (1986), Images of Organization, Beverly Hills, CA: Sage Publications.
Neslin, Scott. (2002). Sales Promotion. Cambridge: Marketing Science Institute Relevant
Knowledge Series

55
Nijs, Vincent, Marnik G. Dekimpe, Jan-Benedict E. M. Steenkamp, Dominique M. Hanssens.
2001. The category demand effects of price promotions. Marketing Sci. 21(1) 1-22.
Oh, Haemoon. "Service quality, customer satisfaction, and customer value: A holistic perspective."
International Journal of Hospitality Management 18.1 (1999): 67-82.
Ohta, Makoto and Zvi Griliches (1986) “Automobile Prices and Quality: Did the Gasoline Price
Increases Change Consumer Tastes in the U.S.?,” Journal of Business & Economic Statistics, Vol.
4, No. 2 (Apr., 1986), pp. 187-198.
Pauwels, Koen, Dominique M. Hanssens, and Sivaramakrishnan Siddarth. "The long-term effects
of price promotions on category incidence, brand choice, and purchase quantity." Journal of
marketing research 39.4 (2002): 421-439.
Pauwels, Koen, Jorge Silva-Risso, Shuba Srinivasan and Dominique M. Hanssens (2004) “New
Products, Sales Promotions, and Firm Value: The Case of the Automobile Industry”, Journal of
Marketing, Vol. 68, No. 4 (Oct., 2004), pp. 142-156.
Phau, Ian, and Prendergast, Gerard (2001). Offensive advertising: A view from Singapore. Journal
of Promotion Management, 7(1/2), 71-90.
Qian, Hang. "Vector autoregression with mixed frequency data." (2013).
Raju, Jagmohan S., Sanjay K. Dhar, and Donald G. Morrison. "The effect of package coupons on
brand choice." Marketing Science 13, no. 2 (1994): 145-164.
Sarmah, S. P., Acharya, D., & Goyal, S. K. (2006). Buyer vendor coordination models in supply
chain management. European journal of operational research, 175(1), 1-15.
Schoonhoven, Claudia Bird. "Problems with contingency theory: testing assumptions hidden
within the language of contingency" theory"." Administrative Science Quarterly (1981): 349-377.
Shapiro, Carl. "Premiums for high quality products as returns to reputations." The quarterly
journal of economics 98.4 (1983): 659-679.
Silk, Tim, and Chris Janiszewski. Managing mail-in rebate promotions. Working paper, 2008.
Silva-Risso, Jorge, and Irina Ionova. "Practice Prize Winner-A Nested Logit Model of Product and
Transaction-Type Choice for Planning Automakers' Pricing and Promotions." Marketing Science
27, no. 4 (2008): 545-566.
Silverstein, Michael J., and Neil Fiske. "Luxury for the masses." Harvard Business Review 81.4
(2003): 48-59.
Silvestrini, Andrea, and David Veredas. "Temporal aggregation of univariate and multivariate time
series models: a survey." Journal of Economic Surveys 22.3 (2008): 458-497.
56
Snoj, Boris, Aleksandra Pisnik Korda, and Damijan Mumel. "The relationships among perceived
quality, perceived risk and perceived product value." Journal of Product & Brand Management
13.3 (2004): 156-167.
Stango, Victor and Jonathan Zinman (2011) “Fuzzy Math, Disclosure Regulation, and Market
Outcomes: Evidence from Truth-in-Lending Reform,” The Review of Financial Studies / v 24 n 2
2011, pp: 507 – 534.
Srinivasan, Shuba, Koen Pauwels, Jorge Silva-Risso, & Dominique M. Hanssens (2009) “Product
Innovations, Advertising, and Stock Returns”, Journal of Marketing, Vol. 73 (January 2009), 24–
43
Tamirisa, Natalia T., and Deniz O. Igan. "Are Weak Banks Leading Credit Booms?
Evidence from Emerging Europe." Comparative economic studies 50.4 (2008): 599-619.
Tellis, Gerard J. and Joseph Johnson (2007) “The Value of Quality,” Marketing Science, Vol. 26,
No. 6 (Nov. - Dec., 2007), pp. 758-773.
Thompson, Patrick A., and Thomas Noordewier. "Estimating the effects of consumer incentive
programs on domestic automobile sales." Journal of Business & Economic Statistics 10.4 (1992):
409-417.
Thornton, Daniel L., and Dallas S. Batten. "Lag-length selection and tests of Granger causality
between money and income." Journal of Money, credit and Banking (1985): 164-178.
Varadarajan, P. Rajan, and Terry Clark. "Delineating the scope of corporate, business, and
marketing strategy." Journal of Business Research 31.2 (1994): 93-105.
Varki, Sajeev, and Mark Colgate. "The role of price perceptions in an integrated model of
behavioral intentions." Journal of Service Research 3.3 (2001): 232-240.
Verhoef, Peter C., Scott A. Neslin, and Björn Vroomen. "Multichannel customer management:
Understanding the research-shopper phenomenon." International Journal of Research in
Marketing 24, no. 2 (2007): 129-148.
Vigneron, Franck, and Lester W. Johnson. "Measuring perceptions of brand luxury." The Journal
of Brand Management 11.6 (2004): 484-506.
Yoo, Boonghee, Naveen Donthu, and Sungho Lee. "An examination of selected marketing mix
elements and brand equity." Journal of the Academy of Marketing Science 28.2 (2000): 195-211.
Zeithaml, Valarie A. "Consumer perceptions of price, quality, and value: a means-end model and
synthesis of evidence." The Journal of Marketing (1988): 2-22.
Zellner, Arnold, and Henri Theil. "Three-stage least squares: simultaneous estimation of
simultaneous equations." Econometrica: Journal of the Econometric Society (1962): 54-78.
57
Chapter 2
Does Marketing Communication Mix Attract Generic Competition?
2. ABSTRACT
Once the prescription drug patent expires, generic manufacturing firms enter the industry
with a time lag. However, even with competition from generics, incumbent’s loss in market share
is not immediate, thereby extending patent life beyond the patent expiration date. Current study
utilizes diffusion theory to analyze effectiveness of marketing communications to ensure diffusion
of prescription drugs and enhance customer responsiveness across product life cycle (PLC). Next,
we utilize signaling theory to analyze whether in the post-patent era, marketing efforts undertaken
by incumbents discourage generic competition or do they signal unexplored market potential and
thereby lure competition. Current study utilizes sales, revenue and marketing expenditure data
across 11 therapeutic classes from September, 2008 to October, 2014. Estimates indicate that
effectiveness of ‘Detailing’ (i.e., marketing communications targeted at the physicians) and DTCA
(i.e., direct-to-consumer advertising) follows a ‘U’ path, with minimum effectiveness in the
‘growth’ stage of PLC. Findings also demonstrate that marketing communication mix for
prescription drugs in the post-patent period acts as an entry deterrent strategy for the first and
second waves of generic entry whereas high brand price induces competition.
Keywords: prescription drugs, detailing, direct-to-customer-advertising, generic manufacturers

58
2.1 Introduction
Firms in the pharmaceutical industry adopt aggressive marketing mix strategies to aid in the
rapid diffusion of new products (Leffler, 1981; Mackowiak and Gagnon, 1985; Vogel,
Ramachandran and Zachry, 2002). Detailing and Direct-to-customer-advertisement (DTCA) are
two critical components of the marketing mix plan. Detailing educates physicians regarding the
new product characteristics whereas DTCA exposes existing and new consumers to product
information (Narayanan, Desiraju and Chintagunta, 2004). Firms also promote their products
through distribution of free samples and product advertisement in medical journals. Interestingly,
firm’s emphasis on communication channels vary across product life cycle (Fischer and Albers,
2010). For example, prescription drugs protected by the patent window are among the most
heavily promoted drugs in the U.S. economy. During this period, incumbents adopt marketing mix
strategies that help them to build a loyal customer base and strong brand equity (Ladha, 2007)
However, once the drug patent expires, incumbents may encounter competition for generic
manufacturers conditional on economic and financial factors (Grabowski, Ridley and Schulman,
2007). Interestingly, Hudson (2000) indicates that even with competition from generics,
incumbents’ loss in market share is not immediate, implying that value of patents extend beyond
their expiration period (Hudson, 2000). Thus, during the post-patent period, incumbents tend to
adopt ‘reminder oriented’ marketing mix strategies that emphasize point of difference between the
off-patent prescription drugs and generics (Agrawal and Thakkar, 1997).
However, for generic manufacturers, decision to enter a new market is exponentially more
challenging and risky. Königbauer (2007) suggests that generic manufacturers may consider
entering the drug market if expected stream of revenue income significantly outweighs the cost
59
and risk associated with the corporate strategy. Literature is, however, equivocal regarding the
impact of incumbent’s marketing effort in the post-patent window on generic entry decision.
Hurwitz and Caves (1988) and Rizzo (1999) demonstrate that brand-name marketing activities
inhibit generic market entry. Scott Morton (2000) conclude that incumbent’s advertising
expenditure in the pre-expiration period has no impact on generic manufacturers’ entry decision.
On the other hand, Königbauer (2007) uses a two-period Bertrand model of competition to
demonstrate that product differentiation through advertising induces generic entry.
The current study identifies some of the critical gaps in the pharmaceutical promotion literature
and addresses them. Studies analyzing effectiveness of incumbent’s marketing strategies in new
product diffusion tend to concentrate on product life cycle within the patent protection window
(Sridhar, Mantrala, and Albers, 2014). We utilize diffusion theory to analyze the effectiveness of
incumbent’s marketing communication mix to promote the prescription drug and enhance
customer responsiveness across product life cycle, with particular emphasis in the post patent
period. Furthermore, literature is equivocal regarding the impact of incumbent’s marketing effort
on generic entry decision. Current study solves the puzzle by demonstrating that certain factors
(i.e. aggressive marketing strategies such as detailing and DTCA) may serve as entry deterrent
strategies where as certain economic factors (i.e. high prescription drug prices) may actually lure
generic competition. Moreover, majority of the studies examining the impact of incumbent’s
marketing strategies on generics’ entry decisions tend to assume that the latter enters the drug
market simultaneously. In reality, once the patent window expires, generic manufacturers tend to
enter the market in sequential waves (Grabowski and Vernon, 1992). We utilize signaling theory to
resolve the ambiguity with regards to the relation between incumbent’s marketing effort on waves
of sequential generic entries.

60
We demonstrate that each waves of generics’ decision to enter the market is contingent on the
current economic and marketing conditions, independent of the decisions taken by the previous
waves of generics that have already entered the market. In particular, in the post-patent period,
incumbents’ continued marketing communications through detailing and DTCA (direct-to-
consumer advertising) help them to keep their consumers and physicians well informed regarding
effectiveness of the prescription drug and emphasize on its comparative advantage. Thus,
incumbents’ continued marketing communications act as an entry deterrent strategy for the first
and second waves of generic entry. Interestingly, high prescription drug prices even in the off-
patent period may signal revenue-generation potential, which may consequently induce generic
entry.
The article is organized as follows. Section 2 deals with literature review and hypothesis
development. Section 3 provides details of the Prentice-Williams-Peterson Gap time (PWP gap-
time) conditional model, methodology and variables used in the study and section 4 reports the
data collection. Section 5 reports the results and section 6 provides a brief summary and
discussion.
61
2.2 Hypothesis Development
2.2.1 Marketing Communication Mix Strategy
Pharmaceutical firms’ marketing communications are typically directed towards the
physicians who prescribe them as well as existing and potential consumers. Firm’s marketing
efforts directed at physicians encompass detailing (i.e., personal selling through sales
representatives), sampling distribution (i.e., distribution of free samples of drugs), physician
meetings and events, and advertisements in medical journals. Even though promotion expenditure
to educate professionals receives major share of firms’ promotion budget, direct-to-consumer
advertising (DTCA) has gained prominence over the last decade (Ma et al., 2003).
2.2.2 Detailing
In the pharmaceutical industry, detailing, i.e. personal selling by pharmaceutical firms sales
representatives to hospital and office-based physicians has been a critical component of drug
promotions for decades (Donohue et al., 2004; Gagnon and Lexchin, 2008; Sridhar, Mantrala, and
Albers, 2014). It includes direct contact by sales representatives at drug fair or a brief mention of
the drug in hospital clinics, meeting rooms etc. Firms also provide physicians information
regarding the drug over the phone or through educational press. Cegedim-SK&A ( 2011 ) reports
that in 2009–2010, U.S. Pharma Companies spent about $28 billion promoting drugs to
prescribers, with detailing accounting for about $15.3 billion, or about 54 % of total annual
promotion spending. Meta-analysis estimates by Sridhar, Mantrala, and Albers (2014) indicate that
current-period detailing elasticity is 0.21. Additionally, elasticity estimates are higher for products

62
that are offered in early life cycle stages and differ across countries. Even though detailing is a
dominant marketing strategy, yet firms selectively employ this strategy to aid product diffusion
(Donohue, Cevasco and Rosenthal, 2007). Additionally, studies suggest that detailing impacts
physician’s decision differentially, contingent on drug’s effectiveness and side effects
(Venkataraman and Stremersch, 2007).
2.2.3 Direct-to-Customer Advertising (DTCA)
Drug manufacturing firms often spend millions of dollars to promote their products directly
to the customers through multiple media channels (ie, internet, television, newspapers, magazine,
radio) (Bell, Kravitz and Wilkes, 1999; 2000a; 2000b). For example, in 2001, the US
pharmaceutical industry spent an aggregate of US$2.7 billion in DTCA campaigns (Young, 2003).
Proponents of DTCA argue that this marketing channel is an opportunity to enhance health care by
having patients identify symptoms of a curable medical condition and seek medical attention and
also treat more broadly diseases that are currently underdiagnosed or undertreated, and improve
communication between the health care system and their patients (Pines, 2000).Such massive
advertising efforts are geared towards improved consumer awareness of advertised drugs that may
eventually open up dialog between physicians and patients. That conversation is most likely to
induce the physician to prescribe the recommended drug, thereby generating demand for
prescription drugs (Mintzes et al., 2003; Frosch et al., 2007). Opponents of DTCA argue that
marketing effort by pharma firms directed at the customers is motivated by profit making
incentives rather than concern for the public health (Gellad and Lyles, 2007). They also argue that
DTCA often results in wasting causes physicians’ valuable time during their encounter with
patients and also encourages the consumption of expensive and often times, unnecessary

63
medications (Rosenthal et al., 2002). Additionally, they argue that manufacturing firms tend to
promote expensive prescription drugs that are newer with incomplete safety information (Lexchin
1999; Bradford et al., 2006). Therapeutic classes such as allergies, obstetrical/gynecological,
dermatological, Cardiovascular, tobacco addiction are those that are advertised most frequently
(Wilkes, Bell and Kravitz, 2000). There is ample evidence in the literature supporting the positive
association of firm’s expenditure on DTCA of prescription drugs with sales (Basara, 1996;
Donohue, Cevasco and Rosenthal, 2007; Dave and Saffer, 2010).
2.2.4 Sample Distribution
Sales representatives of the manufacturing firms typically distribute samples either in
person or during service visit or through mail (Dong, Li, and Xie, 2014). A drug sample in the
prescription drug industry is defined as ‘… a package containing a limited quantity of a
pharmaceutical product sufficient to evaluate clinical response, distributed to authorized health
care practitioners free of charge, for patient treatment’ (Warrier et al., 2010). Dispensing free
samples by pharmaceutical companies' sales representatives is one of the competitive marketing
practices in the prescription drug industry (Gönül et al, 2001). Moreover, distributing free samples
to patients may be indicative of care and involvement that may eventually improve the physician-
patient relationship (Groves, Sketris and Tett, 2003). Groves, Sketris and Tett (2003) indicates that
expenditure on free sampling distribution accounts for more than half of the total marketing
expenditure incurred by the U.S. pharmaceutical industry. Specifically, in aggregate,
pharmaceutical firms delivered an estimated $18.4 billion worth (in retail value) of free drug
samples to doctors in year 2005 alone – more than all other marketing expenses combined (Dong,
Li and Xie, 2014). Findings indicate that distribution of free drug samples and detailing as the two

64
critical pharmaceutical marketing practices with significant positive impact on demand for
prescription drugs (Mizik and Jacobson, 2002).
2.2.5 Journal Advertising
Physicians derive valuable information regarding latest drugs and devices from medical
journals. In addition, these journals are also the source of scholarly articles. Simultaneously,
medical journals often contain advertisements of drugs, thereby explicitly promoting sales of the
drug under consideration. By concurrently printing scholarly ‘articles and advertisements within
their pages’, these medical journals implicitly confer credibility on both the journal articles under
consideration as well as the advertisements. Moreover, by printing advertisements for drugs and
devices, these medical journals are indirectly recommending these drugs and complement
respective incumbent’s marketing effort. Journal advertisements not only generate profits for
pharmaceutical firms that advertise in those reputed journals but also for the medical journals and
the physician organizations that publish in those journals (Fugh-Berman, Alladin and Chow,
2006).
2.2.6 Detailing and DTCA Marketing Strategies
Rogers (1976; 1995) defined ‘diffusion’ as the process through which a new idea/ product is
adopted by the mass consumers over time. Products have a life span. Long established products
eventually loose consumer demand, while in contracts, demand for new product or idea increases
dramatically after they are launched. Literature categorizes product life cycle (PLC) by four
distinctive stages, namely introduction, growth, maturity and decline (Qualls, Olshavsky, and
Michaels, 1981).
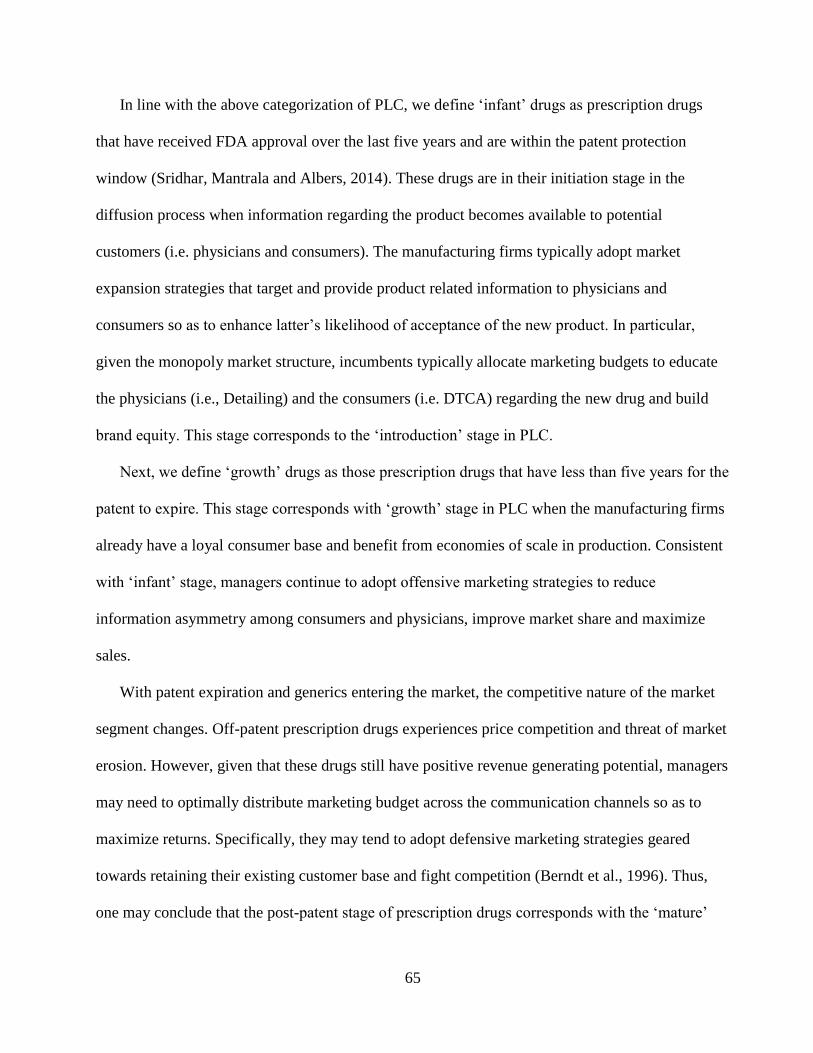
65
In line with the above categorization of PLC, we define ‘infant’ drugs as prescription drugs
that have received FDA approval over the last five years and are within the patent protection
window (Sridhar, Mantrala and Albers, 2014). These drugs are in their initiation stage in the
diffusion process when information regarding the product becomes available to potential
customers (i.e. physicians and consumers). The manufacturing firms typically adopt market
expansion strategies that target and provide product related information to physicians and
consumers so as to enhance latter’s likelihood of acceptance of the new product. In particular,
given the monopoly market structure, incumbents typically allocate marketing budgets to educate
the physicians (i.e., Detailing) and the consumers (i.e. DTCA) regarding the new drug and build
brand equity. This stage corresponds to the ‘introduction’ stage in PLC.
Next, we define ‘growth’ drugs as those prescription drugs that have less than five years for the
patent to expire. This stage corresponds with ‘growth’ stage in PLC when the manufacturing firms
already have a loyal consumer base and benefit from economies of scale in production. Consistent
with ‘infant’ stage, managers continue to adopt offensive marketing strategies to reduce
information asymmetry among consumers and physicians, improve market share and maximize
sales.
With patent expiration and generics entering the market, the competitive nature of the market
segment changes. Off-patent prescription drugs experiences price competition and threat of market
erosion. However, given that these drugs still have positive revenue generating potential, managers
may need to optimally distribute marketing budget across the communication channels so as to
maximize returns. Specifically, they may tend to adopt defensive marketing strategies geared
towards retaining their existing customer base and fight competition (Berndt et al., 1996). Thus,
one may conclude that the post-patent stage of prescription drugs corresponds with the ‘mature’

66
stage in PLC. In the current study, we define prescription drugs as ‘mature/post-patent’ if they lost
patent protection over the last five years.
Physicians’ access to drug related information is least in the ‘infant’ stage. Thus, incumbents’
marketing efforts geared towards educating physicians help to address this information asymmetry
problem, thereby aiding new product diffusion process. However, as new drug move along the
PLC, physicians access to drug related information increases. Thus towards the later stages in
PLC, increased detailing expenditure may not necessarily translate into enhanced product demand.
We hypothesize that firm’s return from detailing expenditure is high towards early life cycle.
However, its ability to generate high product demand and revenue drops as the product progresses
towards its ‘growth’ stage.
Once the patent expires, the incumbent experiences increased competition from generic drug
manufacturers. Managers adopt ‘reminder oriented’ marketing strategies that stress on points of
difference (Agrawal and Thakkar, 1997). In particular, the marketing communications not only
emphasize the off-patent prescription drug’s effectiveness but also its comparative advantage over
generics that have flooded the market. Generics are typically priced much lower than the
prescription drugs. However, physicians may not have full information regarding chemical
composition of the generics. They may even have limited information regarding generics’ possible
side effects (Borgheini, 2003) Moreover, these cheaper alternatives may not necessarily have gone
through all the steps in clinical trials and physicians may not be very comfortable prescribing the
generics over the off-patent prescription drugs. Thus, adoption of ‘reminder oriented’ marketing
mix plan may help the incumbents to retain their consumer base and prevent market erosion. We
hypothesize that effectiveness of ‘detailing’ as a marketing strategy to educate the physicians
follow a ‘U’ path across PLC.
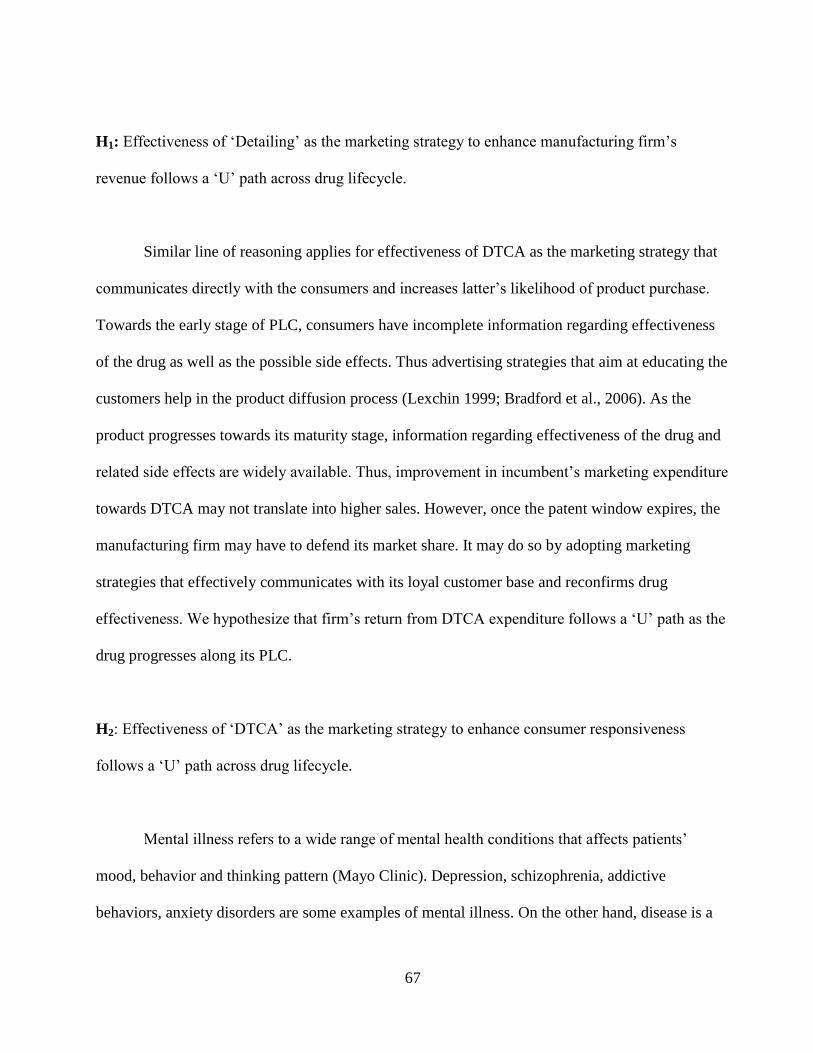
67
H1: Effectiveness of ‘Detailing’ as the marketing strategy to enhance manufacturing firm’s
revenue follows a ‘U’ path across drug lifecycle.
Similar line of reasoning applies for effectiveness of DTCA as the marketing strategy that
communicates directly with the consumers and increases latter’s likelihood of product purchase.
Towards the early stage of PLC, consumers have incomplete information regarding effectiveness
of the drug as well as the possible side effects. Thus advertising strategies that aim at educating the
customers help in the product diffusion process (Lexchin 1999; Bradford et al., 2006). As the
product progresses towards its maturity stage, information regarding effectiveness of the drug and
related side effects are widely available. Thus, improvement in incumbent’s marketing expenditure
towards DTCA may not translate into higher sales. However, once the patent window expires, the
manufacturing firm may have to defend its market share. It may do so by adopting marketing
strategies that effectively communicates with its loyal customer base and reconfirms drug
effectiveness. We hypothesize that firm’s return from DTCA expenditure follows a ‘U’ path as the
drug progresses along its PLC.
H2: Effectiveness of ‘DTCA’ as the marketing strategy to enhance consumer responsiveness
follows a ‘U’ path across drug lifecycle.
Mental illness refers to a wide range of mental health conditions that affects patients’
mood, behavior and thinking pattern (Mayo Clinic). Depression, schizophrenia, addictive
behaviors, anxiety disorders are some examples of mental illness. On the other hand, disease is a
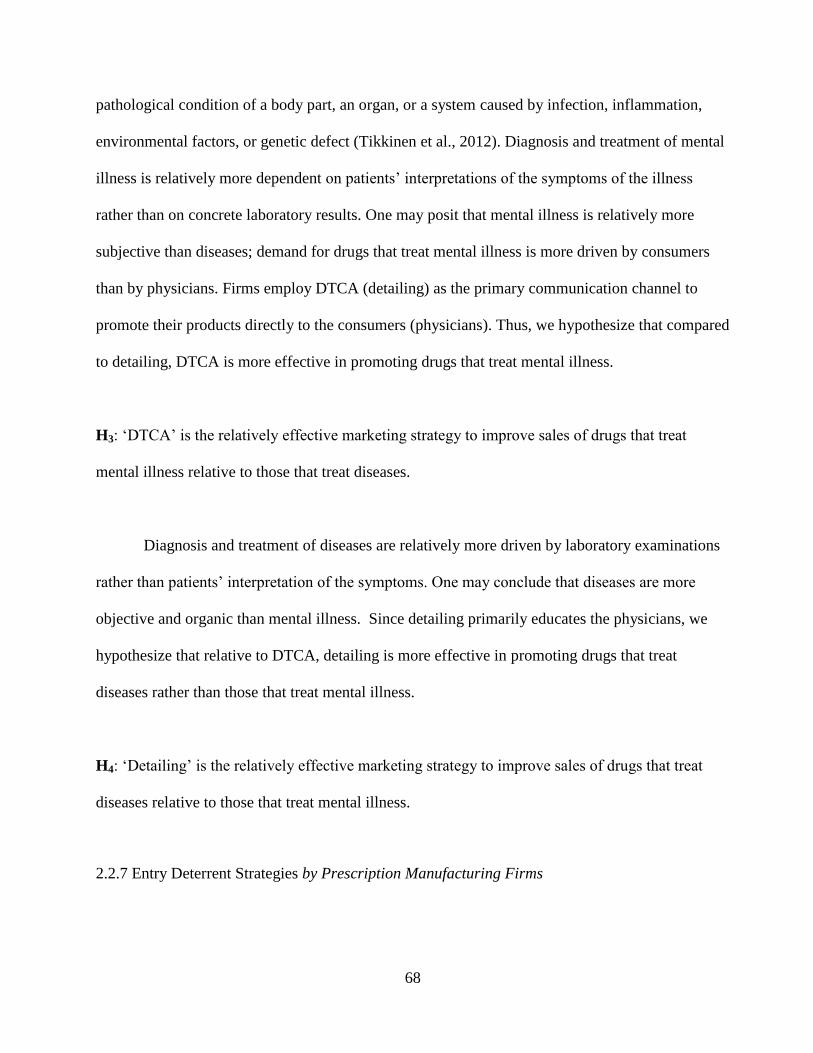
68
pathological condition of a body part, an organ, or a system caused by infection, inflammation,
environmental factors, or genetic defect (Tikkinen et al., 2012). Diagnosis and treatment of mental
illness is relatively more dependent on patients’ interpretations of the symptoms of the illness
rather than on concrete laboratory results. One may posit that mental illness is relatively more
subjective than diseases; demand for drugs that treat mental illness is more driven by consumers
than by physicians. Firms employ DTCA (detailing) as the primary communication channel to
promote their products directly to the consumers (physicians). Thus, we hypothesize that compared
to detailing, DTCA is more effective in promoting drugs that treat mental illness.
H3: ‘DTCA’ is the relatively effective marketing strategy to improve sales of drugs that treat
mental illness relative to those that treat diseases.
Diagnosis and treatment of diseases are relatively more driven by laboratory examinations
rather than patients’ interpretation of the symptoms. One may conclude that diseases are more
objective and organic than mental illness. Since detailing primarily educates the physicians, we
hypothesize that relative to DTCA, detailing is more effective in promoting drugs that treat
diseases rather than those that treat mental illness.
H4: ‘Detailing’ is the relatively effective marketing strategy to improve sales of drugs that treat
diseases relative to those that treat mental illness.
2.2.7 Entry Deterrent Strategies by Prescription Manufacturing Firms

69
Patent window ensures market exclusivity to the inventor(s) of the prescription drugs for a fixed
period of time during which the pioneer firm can recuperate the ‘huge sunk innovation costs’
(Königbauer, 2007) and to ensure diffusion of new products (Eisenberg, 2003). Within this
window, incumbents enjoy monopoly power and ‘may even charge monopoly price for their
products’. However, once the patent window expires, market conditions may change contingent on
several economic (Caves, Whinston & Hurwitz, 1991; Hudson, 2000) and marketing (Königbauer,
2007) factors. One observes entry of generic manufacturing firms with a time lag ranging from few
days to several years (Hudson, 2002). Consequently, incumbents experience significant erosion of
market share and loss in revenue (Grabowski and Vernon, 1992).
There is as extensive body of literature that captures the relation between the marketing
efforts and generic market entry. Interestingly, studies are equivocal with regards to the
relationship. Hurwitz and Caves (1988) demonstrates that in the pharmaceutical industry,
incumbent’s history of marketing expenditure directed at educating the physicians and the
consumers help the firm to retain its market share. However, generic price discounts erode market
share. Rizzo (1999) suggests that brand-name advertising enhances brand loyalty, thereby
decreasing price-elasticity of demand. Thus, both these studies conclude that brand-name
marketing inhibits generic market entry. Scott Morton (2000) investigates the influence of
incumbent’s advertising expenditure in the pre-expiration period on generic manufacturers’ entry
decision. The study concludes that generics’ entry decision is not influenced by brand-name
advertising. Königbauer (2007) uses a two-period Bertrand model of competition to demonstrate
that product differentiation through advertising induces generic entry. The author argues that
market entry is costly. Thus, the expected profit that the generic manufacturers may earn once they

70
enter the market must be sufficiently high. Thus, incumbent’s effort to differentiate its product
through advertising activities induces generic market entry.
Despite many studies documenting the incidence of generic entries in the pharmaceutical
industry, there is scarcity of research that recognizes the sequential nature of generic entry. In
particular, generic manufacturing firms enter the drug market in waves, contingent on FDA
approval for their bioequivalent drug. Additionally, entry of generics range from the date of patent
expiration of the prescription drug to few years, depending on the revenue generation capability of
the latter (Hudson, 2000). We posit that market communication mix and market saturation are two
critical factors that influence generic entry decision. Entry into a new market is costly. Hence,
generic manufacturing firms are likely to enter the market only if they expect the payoff to be
greater the cost and risk of entering the market. In particular, we hypothesize that in the off-patent
era, incumbent’s continuance of marketing communications through detailing, DTCA, distribution
of free samples to its customers and advertisement of drugs in medical journals signal incumbent’s
market dominance.
H5: Incumbent’s marketing communications geared towards promoting off-patent drugs deter
generic competition.

71
2.3 Methodology
2.3.1 Empirical Model
Following Kadiyali (1996), we measure effectiveness of changes in incumbent’s marketing effort
to boost sales using the following regression analysis (i.e. equation, 7).
itijtijtijtj
ijtjijt
ijtjjijt
DTCDETAILDTCA
DETAILDTC
DETAIL
log*loglog*DISEASE
log*DISEASElog
logDISEASEFATAL)log(Sale
76
54
3210
(7)
We now provide a definition of the variables used in the analysis:
Dependent Variable
ijtSale : Total sales of the thi drug that belongs to thj therapeutic class in time t .
Explanatory Variables
jFATAL : ‘FATAL’ is a dummy variable that is equal to zero if the drug in thj therapeutic
class treats non-fatal medical conditions else is assumes the value of unity.
jDISEASE : ‘DISEASE’ is a dummy variable that is equal to zero if the drug in thj
therapeutic class treats mental health else is assumes the value of unity.
Detail ( ijtDETAIL ): “Detail advertising” is firm’s practice of deploying sales
representatives to doctors’ offices to educate and promote thi drug by engaging in one-on-
one conversations.
DTCA ( ijtDTCA ): Firm’s marketing effort to promote thi drug directly to its customers.

72
2.3.2 Prentice-Williams-Peterson Gap Time Model
Cox Proportional Hazard (CoxPH) model analyzes time to event outcomes (Fox, 2002). It
takes into consideration of the time to relapse and does not assume a constant hazard rate.
Alternatively, it assumes that the ratio of risk for generic competition between two off-patent
prescription drugs is constant over time. Cox proportional hazard function may be expressed as:
p
i
iiztt1
0 exp (8)
where pizi ,...,2,1, are values of p covariates and pii ,...,2,1, is a p1 vector of
regression parameters. t0 is the baseline hazard function that describes how risk of an event is a
function of time at baseline levels of covariates and the effect parameters describe response of
hazard to changes in explanatory covariates. Since the generic manufacturers enter the off-patent
drug market in sequential waves, each wave is expected to alter the competitive environment. In
particular, with every wave of generics entering the market, the off-patent prescription drug and
the existing bio-equivalent generics compete for market share. Thus, this is a typical example
where the baseline hazard function varies by strata, thereby not satisfying the basic assumption of
proportional hazard model. Additionally, the sequence of occurrence of events is critical,
specifically, the second wave of generics will not enter the market until the first wave of generic
have already entered the market.
Our study employs Prentice-Williams-Peterson Gap time (PWP-GT) conditional model, an
extension of the COX proportional hazard model that analyzes recurrent events with stratifications.
It is the conditional model that conserves the order of sequential entry of generic manufacturing
firms in the creation of the risk set, thereby allowing for entry dependence. In particular, PWP-GT
model incorporates for ‘event dependence via stratification by event number so that’ different
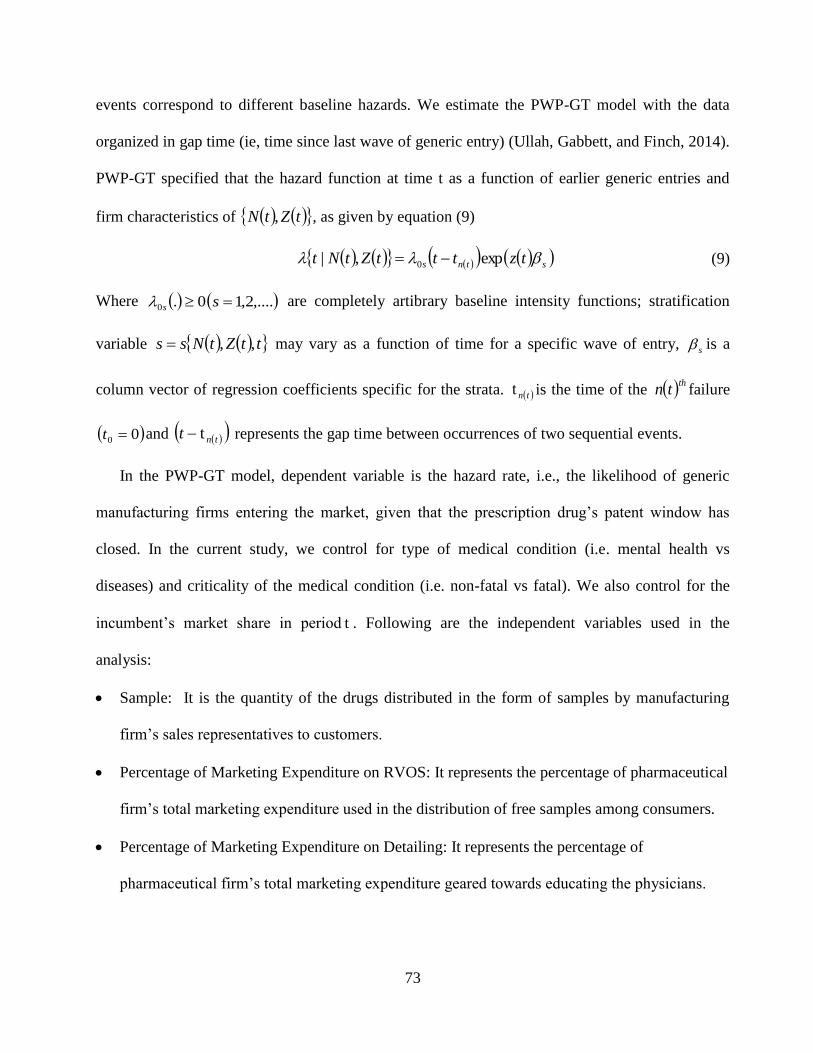
73
events correspond to different baseline hazards. We estimate the PWP-GT model with the data
organized in gap time (ie, time since last wave of generic entry) (Ullah, Gabbett, and Finch, 2014).
PWP-GT specified that the hazard function at time t as a function of earlier generic entries and
firm characteristics of tZtN , , as given by equation (9)
stns tztttZtNt exp,| 0 (9)
Where ,....2,10.0 ss are completely artibrary baseline intensity functions; stratification
variable ttZtNss ,, may vary as a function of time for a specific wave of entry, s is a
column vector of regression coefficients specific for the strata. tnt is the time of the thtn failure
00 t and tnt t represents the gap time between occurrences of two sequential events.
In the PWP-GT model, dependent variable is the hazard rate, i.e., the likelihood of generic
manufacturing firms entering the market, given that the prescription drug’s patent window has
closed. In the current study, we control for type of medical condition (i.e. mental health vs
diseases) and criticality of the medical condition (i.e. non-fatal vs fatal). We also control for the
incumbent’s market share in period t . Following are the independent variables used in the
analysis:
Sample: It is the quantity of the drugs distributed in the form of samples by manufacturing
firm’s sales representatives to customers.
Percentage of Marketing Expenditure on RVOS: It represents the percentage of pharmaceutical
firm’s total marketing expenditure used in the distribution of free samples among consumers.
Percentage of Marketing Expenditure on Detailing: It represents the percentage of
pharmaceutical firm’s total marketing expenditure geared towards educating the physicians.
74
Percentage of Marketing Expenditure on DTCA: It represents the percentage of pharmaceutical
firm’s total marketing expenditure geared towards directly advertising to the consumers.
Firm Size of Generic Manufacturers: We use log of total asset as the proxy for firm’s total
asset.
Market Share of Prescription Manufacturers: Market share is measured by the ratio of firm’s
total sales to industry sales in that period.
Prescription Drug Price: Price of the prescription drug charged by the manufacturer.
75
2.4 Data Collection
We obtained monthly marketing expenditure data for eleven therapeutic classes for the month
September, 2008 through August, 2014 from IMS Health. Marketing expenditure directed to
physicians is composed of four components: detailing (i.e. providing drug related information in a
face-to-face meeting to the office and hospital-based physicians, providing free samples to
physicians, and advertising in medical journals (Rosenthal et al., 2002). Drug patent applicant and
supplier information, patent expiration dates are obtained from drugpatentwatch.com. Additional
information on generic manufacturing firms entering the respective drug market are obtained from
drugs.com and WebMD .com. We obtained information on firm performance (i.e., total sales, firm
size, R&D intensity) from COMPUSTAT.

76
2.5 Results
Table (6) provides the summary statistics of promotional expenditure by prescription drug
manufacturers across 11 therapeutic classes. Estimates indicate that drugs that treat fatal diseases
(i.e., Pyrimidine, Antineo Monoclonal Antibody, Tyrosine Kinase Inhibator etc.) channelize
substantially less marketing expenditure towards DTCA vis-à-vis drugs that treat mental illness
(i.e. Serotonin) and non-fatal diseases (Beta Blockers, HMG-CoA Reductase etc.). Similar
dichotomy is observed in pharma marketing expenditure towards sampling distribution and journal
advertising. Specifically, incumbents that manufacture drugs that treat mental illness (i.e.
Serotonin, SSRI and SNRI) and those that treat non-fatal diseases tend to invest in sampling
distribution. However, there is a significant drop in marketing expenditure geared towards
distribution of free samples by firms that manufacture cancer treatment drugs (i.e. Pyrimidine,
Antineo Monoclonal Antibody, Tyrosine Kinase Inhibator etc.). One may infer that high value of
samples may act as disincentives. Interestingly, estimates of manufacturing firm’s percentage of
sales towards detailing are approximately consistent across all the therapeutic classes, ranging
between .001 to .1 percentage of sales.
In this section we classify therapeutic classes against three broad categories, specifically, non-
fatal mental illness (category 1), non-fatal disease (category 2) and fatal disease (category 3).
Table (7) presents the difference in marketing expenditure by manufacturing firms before and after
prescription drug patent expiration across these three categories. Estimates indicate that the
difference in mean expenditure before and after patent window closes for drugs that treat category
1, category 2, and category 3 are 14.8349 (p<.1), 18.5372 (p<.05), and 13.9029 (p<.05) million
dollars respectively. Thus, findings suggest that manufacturing firms tend to significantly reduce

77
their promotional expenditure in RVOS once the patent window expires. Interestingly, findings
also suggest that pharmaceutical firms that produce drugs to treat category 2 (i.e., non-fatal
disease) actually enhance their DTCA expenditure once the patent window closes by 3.2047
million dollars (p<.05).
Table 8 provides the correlation coefficient matrix of the variables used in the current study.
Findings suggest that there is negative association between incumbent’s percentage of marketing
expenditure across all the marketing channels of communication. In particular, percentage of
expenditure for distribution of free samples ( RVOSPct ) is negatively correlated with that of
detailing ( DetailingPct ) (p<.001), journal advertisement ( JournalPct ) (p<.001) and direct-to-
customer advertising ( DTCAPct ) (p<.001). Additionally, estimates indicate negative correlation
between brand price ( Price Brand ) and brand sales ( Sales Brand ) (p<.001) and percentage of
marketing expenditure across the different channels (p<.001). Interestingly, brand sales
( Sales Brand ) has positive association with percentage of expenditure for distribution of free
samples ( RVOSPct ) (p<.001) and direct-to-customer advertising ( DTCAPct ) (p<.001), whereas
it is negatively correlated with percentage of expenditure geared towards detailing ( DetailingPct )
(p<.001) and that of journal advertisement ( JournalPct ) (p<.001).
The elasticity estimates of the marketing effort are presented in table (9). In panel (A),
dependent variable is logarithmic value of total revenue generated by the drug, whereas in panel
(B), the dependent variable is log of total sales of the product. Exogenous variables used in the
analysis are logarithmic values of the firm’s marketing expenditure targeted at educating and
building awareness among the consumers (i.e. Direct to Customer Advertising (DTCA)) and the
physicians (Detailing). Panel A (Panel B) provides us with the estimates of responsiveness of
revenue (total sales) to changes in marketing expenditure.

78
The first column provides us with the elasticity estimates for drugs in ‘infant’ or ‘early’ stage.
Similarly, the second and third column provides us with elasticity estimates in the ‘growth’ stage
and in the ‘mature’ or ‘post-patent’ stage respectively. As defined in the previous section, a drug is
in its ‘infant’ or ‘early’ stage of PLC if it has been launched in the market less than 5 years.
Similarly, a drug is categorized as ‘growth’ if it has less than 5 years for patent to expire.
Additionally, we define a drug as ‘mature’ or ‘post-patent’ if it went off-patent over the last 5
years.
In panel (A), the coefficients are marketing elasticity of revenue (MER) that measures
responsiveness in total revenue to a change in the expenditure on the marketing effort for a specific
product (% change revenue / % change in marketing expenditure). Similarly, panel (B) provides
estimates of marketing elasticity of sales (MES) that measures responsiveness in total sales (Sales)
to a change in the expenditure on the marketing effort for a specific product (% change in sales / %
change in marketing expenditure).
‘FATAL’ is an indicator variable that is equal to zero if the drug treats non-fatal medical
condition; else is assumes the value of unity. Estimates in panel (A) indicate that in the ‘infant’ and
‘post-patent’ PLC stages, increase in marketing expenditure towards promoting the drug that treats
non-fatal diseases has higher effect on revenue that those that treat fatal diseases. Interestingly, we
observe a switching pattern in the growth PLC stage improvement in marketing expenditure on
fatal drugs has greater effect on revenue generation vis-à-vis non-fatal drugs.
‘DISEASE’ is an indicator variable that is equal to zero if the drug treats mental illness; else is
assumes the value of unity. Findings indicate that in the ‘infant’ stage, total revenue generated by
drugs that treat diseases are more responsive to changes in marketing expenditure vis-à-vis those
that treats mental health. However, as the drugs moves through their stages in PLC (i.e. growth and

79
post-patent stage), changes in revenue generation to changes in marketing expenditure is more for
those drugs that treat mental health than those that treat diseases.
Findings in Panel A indicate that a 10% increase in the detailing expenditure increases revenue
generated by the product by a 16.54% (p<.001) in its infant/early stage. However, a similar
increase in marketing expenditure improves revenue by 2.82 (p<.001) and 7.98 (p<.001)
percentage points in the growth and post-patent expiration era respectively. Additionally, estimates
also suggest that revenue responsiveness to changes in DTCA expenditure is inelastic. In
particular, one percentage change in manufacturing firm’s expenditure towards DTCA enhances
revenue generated by the product by .860 (p<.001), .129 (p<.001) and .465 (p<.001) percentage
points in the infant, growth and post-patent expiration era respectively.
The fourth column provides us with difference estimates between the infant and growth stages
whereas the fifth column provides us with difference estimates between the mature and growth
stages. Estimates indicate that effectiveness of Detailing as a marketing strategy to improve
revenue (sales) is higher in the infant stage than the growth stage by 1.372 (p<.001) and .841
(p<.001) percentage points respectively. Additionally, its effectiveness in improving revenue
(sales) is higher in the mature stage than the growth stage by .561 (p<.01) and (.313) (p<.05)
percentage points respectively. Thus, one may conclude that effectiveness of detailing as a
marketing communication to generate revenue and sales is lowest at the product’s growth stage.
Furthermore, results suggest that effectiveness of DTCA as a marketing strategy to improve
revenue and sales is higher in the infant stage than the growth stage by .731 (p<.001) and .284
(p<.05) percentage points respectively. Additionally, its effectiveness in improving sales is higher
in the mature stage than the growth stage by .079 ( p<.1) percentage points respectively. Thus,
one may conclude that effectiveness of detailing and DTCA as a marketing communication to

80
generate sales is lowest at the product’s growth stage. Thus, effectiveness of both ‘DTCA’ and
‘Detailing’ as a sales generating strategy follows a ‘U’ path, with minimum effectiveness at the
‘growth’ stage in PLC. Similarly, effectiveness of Detailing as a revenue generating strategy also
follows a ‘U’ path, with minimum effectiveness at the ‘growth’ stage in PLC. Thus, findings are
consistent with hypotheses H1 and partially satisfy hypotheses H2.
Empirical findings in panel (A) indicate that for prescription drugs that treat diseases, for one
percentage improvement in incumbent’s marketing expenditure towards detailing enhances
revenue generation by the product by .267 (p<.001), .330 (p<.001) and .530 (p<.001) percentage
points in the infant, growth and post-patent expiration stages respectively. Similarly, for
prescription drugs that treat diseases, one percentage increase in incumbent’s expenditure towards
DTCA depresses revenue generated by the product by .344 (p<.001) and 0.141 (p<.05) in the
infant and post-patent expiration stages respectively. The difference in estimates between
responsiveness of detailing and DTCA in generating revenue is .611 (p<.001), .256 (p<.001) and
.671 (p<.001) in the infant, growth and mature stages respectively. Similarly, according to the
estimates in panel (B), the difference in estimates between responsiveness of detailing and DTCA
in generating sales is .117 (p<.01) and .290 (p<.001) in the infant and mature stages respectively.
Thus, findings support hypothesis H4 that ‘Detailing’ is relatively more effective in generating
revenue and sales when the drug under consideration treats ‘diseases’ as compared to ‘mental
illness’. Interestingly, the effectiveness of ‘detailing’ in generating revenue is maximum in the
post-patent period of the drug.
Moreover, effectiveness of DTCA as a firm’s marketing effort to enhance total revenue varies
across PLC and is contingent of the characteristics of the medical condition it treats. In particular,
DTCA is an effective strategy for those drugs that treat mental health and are either in their

81
‘infant/early’ or in the ‘post-patent’ stage of their PLC. However, it is an effective strategy to
enhance revenue if the drug treats diseases and is in its mature stage.
Table (5) provides us with the estimates of PWP-Gap time model. The dependent variable is
the hazard rate, i.e., the likelihood of generic manufacturing firms entering the market, given that
the prescription drug’s patent window has closed. Column (A) provides us with the estimates of
the incumbent’s marketing strategies targeted at the first to enter generic manufacturers. Column
(B) provides us with the estimates targeted at the second wave of generic manufacturers who enter
the drug market. The standard errors have been reported in parenthesis. We report the
corresponding hazard ratio directly below the standard errors.
If the hazards ratio an independent variable is less than 1, an improvement in the variable
decreases the hazard rate. According to HR estimates in column A, HR for marketing strategy
targeted at educating the physicians (Detailing) and customers (DTCA) is 0.017 (p<.05) and .001
(p<.01) respectively. Results indicate that in the post-patent era, ‘detailing’ and ‘DTCA’
expenditure incurred by the prescription drug manufacturing firm helps to them to continue
building awareness among physicians and customers regarding the effectiveness of the drug.
Specifically, it improves the likelihood of physicians continue to prescribe the drug and customers
continue to consume it. These entry deterrent strategies employed by the incumbent consequently
discourage generic manufacturers from entering the market.
If the hazards ratio (HR) of an independent variable is larger than 1, an increment in the
variable increases the hazard rate. Estimates of HR for the prescription drug price is 1.005 (p<.05).
This may indicate that high prescription drug prices are likely to attract competition from generics.
In the post-patent era, incumbents typically experience competition from generic manufacturing
firms. Drop in prescription drug prices may have been an effective strategy adopted by incumbents

82
to prevent market share erosion. However, the very fact that incumbents continue to maintain high
prescription drug prices even in the post-patent period is a strong signal to potential competitors
regarding unexplored market potential. This pricing strategy may however attract the first wave of
generic entry.
Column (B) provides us with the estimates for the second wave of generic entry. HR for Retail
value of samples (RVOS) and Detailing are .018 (p<.01) and .011 (p<.05) respectively.
Distribution of free samples to consumers and continuance of physician education are expensive
affairs. Findings suggest that when incumbents continue to allocate significant marketing budget
towards these marketing strategies, they successfully deter even the second wave of generic entry.
Interestingly, firm size of the generic manufacturer is a critical factor influencing its decision to
enter the market. Finally, HR for firm size of the generic manufacturer is .190 (p<.05). Thus,
estimates suggest that prescription drug manufacturing firm is less likely to encounter competition
from generics if the latter’s firm size is high.

83
2.6 Discussion
Key Findings and Theoretical Implications: The U.S. drug manufacturers promote their
products heavily to ensure accelerated adoption of new drugs and retain market share of existing
drugs (Neslin, 2002; Rosenthal et al., 2002; Donohue, Cevasco, and Rosenthal, 2007). Although
the patent window of a prescription drug closes on a specific date, the drug's trademark continues
to live on as the vehicle for maintaining the pharmaceutical incumbent’s goodwill and possibly
delaying or impeding subsequent generic competition (Caves, Whinston and Hurwitz, 1992). Thus,
the incumbent often continues to promote its prescription drug even after the latter goes off patent
and faces competition from generic manufacturers (Aitken, Berndt, and Cutler, 2009). These
marketing communications by the incumbent serve two primary purposes. First, they continue to
build brand loyalty and re-establish the relative effectiveness of the brand drug compared to the
bio-equivalent generics that may be available in the market (Grabowski and Vernon, 1992).
Second, they serve as an entry deterrent strategy (Ellison and Ellison, 2007).
In the current study we analyze effectiveness of incumbent’s marketing communications across
stages of PLC. We consider detailing, direct-to-customer advertising (DTCA), sample distribution
and journal advertising as the four broad categories of marketing strategies that are typically
adopted by the U.S. pharmaceutical firms to promote their drugs. Our results indicate that
effectiveness of both ‘Detailing’ and ‘DTCA’ as a marketing strategy to improve consumer and
physicians awareness regarding the product follows a ‘U’ path along the product life cycle stages,
with minimum effectiveness at the growth stage. One may conclude that drugs in their growth
stage have an established market with known effectiveness and possible side effects. Thus,
additional marketing expenditure to increase consumer awareness may not necessarily yield high

84
returns. However, when a drug is in its infant stage, physicians and consumers have limited
information regarding its effectiveness in treating the medical condition and possible side effects.
Thus, incumbent’s marketing communications through detailing and DTCA helps to resolve some
of these uncertainties and decrease risk.
Empirical estimates also indicate that effectiveness of ‘detailing’ as an effective marketing
strategy also varies across therapeutic classes. Specifically, ‘detailing’ is more effective in
generating sales of drugs that treat ‘diseases’ vis-a-vis ‘mental illness’. Diseases are medical
conditions that are relatively organic and subject to observable pathology vis-à-vis mental health
that are more descriptive and not observable readily. Additionally, diagnosis of the former requires
expert clinical eye of physicians whereas the latter subject to interpretation of the patient. Thus,
increased budget allocation towards detailing (i.e. marketing effort geared towards educating the
physicians) is expected to generate sales and revenue for drugs treating diseases relative to those
treating mental health. Our findings confirm our hypothesis.
Interestingly, DTCA is an effective strategy to improve sales and revenue in the infant and
post-patent period. In both these stages, the incumbent utilizes DTCA to establish product
credibility and emphasize on its comparative advantage. Since mental illness is a subjective
medical condition and depends largely on patients’ interpretation of the condition, DTCA helps to
resolve some of the uncertainties by providing information directly to the customers.
Finally, results indicate that continuance of marketing communications mix by the
incumbent in the post-expiration period emits mixed signal to the wave of generics entering the
market. Specifically, estimates indicate that in the post-patent period, incumbent’s continued
marketing communications through detailing and DTCA (direct-to-consumer advertising) act as an
entry deterrent strategy for the first and second waves of generic entry. Given that these strategies
85
are effective in generating incumbent’s revenue and sales even in the off-patent period may deter
generic. Interestingly, continuance of high brand price even in the off-patent period lures
competition. In particular, when the generic manufacturers observe that the incumbent continues
to charge high price for its off-patent drug, they may interpret this as signals of drugs’ revenue
generation potential, which may consequently induce them to enter the market.
Managerial Implications: Current study indicates that effectiveness of marketing strategies
in promoting the product and generating sales varies across product lifecycle. Thus, in order to
maximize returns and firm valuation, managers of pharmaceutical firms may need to adjust their
marketing expenditure and effort contingent on whether the drug is in its infant/ mature or post-
patent stage.
Additionally, findings suggest that once the prescription drug goes off-patent and generic
manufacturing firms consider entering the market, they tend to interpret incumbent’s marketing
expenditure as signals of market potential. Thus, managers of the incumbent firm may need to be
aware of the downside of continuance in marketing efforts even in the post-patent stage. They may
need to adjust their marketing effort accordingly.
Limitations and Future Research: The current study establishes that effectiveness of
marketing communications vary across drug life cycle. An interesting extension of the current
study may be to solve the incumbent’s dynamic allocation of marketing expenditure problem
across marketing channels and across product life cycle that maximizes total sales/ revenue
generation.
Incumbents adopt detaining and DTCA as primary promotional vehicles to diffuse their
product. It may be interesting to analyze in a game theoretic setup how these strategies may impact
rival firm’s marketing strategies who manufacture non-bioequivalent or quasi-bioequivalent drugs

86
in the same therapeutic class. An interesting analysis may be examining the cross-marketing effect
if the rival firm introduces the close-substitute drug with a time lag.

87
APPENDIX

88
Table 6: Distribution of Marketing Expenditure on Prescription Drugs Across Therapeutic Classes
(Sept, 2008 - Nov, 2014)
Variable Serotonin SSRI SNRI
Beta
Blockers
HMG-
CoA
Reductase
ACE
Inhibitor Pyrimidine
Anti Neo
Plastics
GRH
Analogs
Antineo
Monoclonal
Antibody
Tyrosine
Kinase
Inhibator
Direct-to-customer advertising (millions of dollars)** 61.501 9.871 6.805 16.401 1477.129 0.000 0.556 28.754 0.199 2.517 3.463
Percentage of sales 0.889 0.082 0.022 0.343 2.570 0.000 0.007 0.495 0.005 0.005 0.017
Promotion to professionals
Detailing (millions of dollars)&
1.499 2.878 6.805 4.776 8.970 0.054 0.136 0.372 0.348 0.807 0.657
Percentage of sales 0.022 0.024 0.022 0.100 0.016 0.012 0.002 0.006 0.008 0.001 0.003
Retail value of samples (millions of dollars) 436.519 801.686 2690.574 749.838 3986.680 12.396 52.667 222.551 3.139 674.536 71.752
Percentage of sales 6.307 6.637 8.835 15.688 6.935 2.667 0.633 3.833 0.074 1.222 0.344
Journal advertising (millions of dollars) 0.911 0.000 45.323 26.712 26.394 0.000 6.009 17.197 1.550 29.322 19.706
Percentage of sales 0.013 0.000 0.149 0.559 0.046 0.000 0.072 0.296 0.036 0.053 0.094
Total professional promotion effort (millions of dollars) 438.929 804.564 2742.702 781.326 4022.044 12.450 58.812 240.120 5.036 704.665 92.115
Percentage of sales 6.342 6.661 9.006 16.347 6.997 2.678 0.707 4.136 0.119 1.276 0.441
Total promotional efforts (millions of dollars) 500.430 814.435 2749.507 797.727 5499.173 12.450 59.368 268.874 5.235 707.182 95.578
Percentage of sales 7.230 6.743 9.029 16.690 9.566 2.678 0.714 4.631 0.123 1.281 0.458
Free Samples distributed (millions) 11.632 36.393 77.539 49.885 127.496 0.956 0.024 0.421 0.012 0.095 0.181
Percentage of unit sales 18.984 73.448 42.509 69.438 62.084 26.176 0.220 13.397 0.190 0.261 4.158
* Data Source: IMS Health
** Data include spending on advertising on internet, network and cable television, newspaper, magazine as well as spot radio and spot television.
& Data include spending on educating hospital and office-based physicians

89
Table 7: Difference in Promotional Expenditure (in Millions $) Pre and Post Prescription Drugs' Patent Expiration
(Sept, 2008 - Aug, 2014)
Pre Patent Expiration (A) N 194 190 205 109 174
Mean 0.5259 17.2230 0.0446 0.5612 6.4443
Std Dev [0.451] [17.924] [0.033] [0.525] [9.193]
Post Patent Expiration (B) N 119 114 176 93
Mean 0.0486 2.3881 0.0027 0.4313
Std Dev [0.135] [14.801] [0.006] [1.784]
0.4773 14.8349 * 0.0419 0.5612 6.0129
Pre Patent Expiration (A) N 162 151 229 160 86
Mean 0.9128 25.7454 0.0517 0.2918 9.1683
Std Dev [0.581] [19.407] [0.042] [0.264] [9.092]
Post Patent Expiration (B) N 125 121 233 35 57
Mean 0.2437 7.2082 0.0013 0.2277 12.3730
Std Dev [0.414] [11.833] [0.001] [0.184] [11.905]
0.6692 18.5372 ** 0.0504 0.0641 -3.2047 **
Pre Patent Expiration (A) N 66 56 222 204 173
Mean 0.0049 14.2689 0.0074 0.2706 0.0374
Std Dev [0.006] [55.235] [0.005] [0.209] [0.047]
Post Patent Expiration (B) N 5 4 44 7 22
Mean 0.0020 0.3660 0.0005 0.0300 0.0044
Std Dev [0.002] [0.321] [0.001] [0.015] [0.002]
0.0029 13.9029 ** 0.0069 0.2406 0.0330
***, **, and * indicates 1%, 5% and 10% level of significance
Non-Fatal Mental
Health (Category 1)
Non-Fatal Disease
(Category 2)
Fatal Disease
(Category 3)
Difference in Mean (A-B)
Difference in Mean (A-B)
Difference in Mean (A-B)
Therapeutic Class Samples
(in Millions)
RVOS
(in Millions $)
Detailing
(in Millions $)
Journal
(in Millions $)
Direct to Customer
(in Millions $)

90
Table 8: Summary Statistics
MeanStandard
Deviation
Samples (in 100000) 0.2713449 1.5222292 1.0000
Pct RVOS^ 0.2751564 0.4271668 0.3096 *** 1.0000
Pct Detailing% 0.3369917 0.4530551 -0.2002 *** -0.4730 *** 1.0000
Pct Journal$ 0.2422847 0.4069128 -0.1533 *** -0.3709 *** -0.4124 *** 1.0000
Pct DTCA# 0.1455672 0.2987558 0.0697 *** -0.2074 *** -0.2786 *** -0.2063 *** 1.0000
Brand Price 1609.91 3112.83 -0.0898 *** -0.3031 *** -0.0500 *** 0.2182 *** 0.2205 *** 1.0000
Brand Sales 60672.21 273580.21 0.8485 *** 0.2664 *** -0.1898 *** -0.1353 *** 0.0912 *** -0.1035 *** 1.0000
***, **, and * indicates 1%, 5% and 10% level of significance
Brand Price
^ Pct RVOS: Percentage of Marketing Expenditure on Retail Value Of Service; % Pct Detailing: Percentage of Marketing Expenditure on Detailing; $ Pct Journal: Percentage of
Marketing Expenditure on Journal; # DTCA: Percentage of Marketing Expenditure on Direct-to-Consumer Advertising
Brand SalesSamples
(in 100000)Pct RVOS
^ Pct Detailing Pct Journal Pct DTCA#
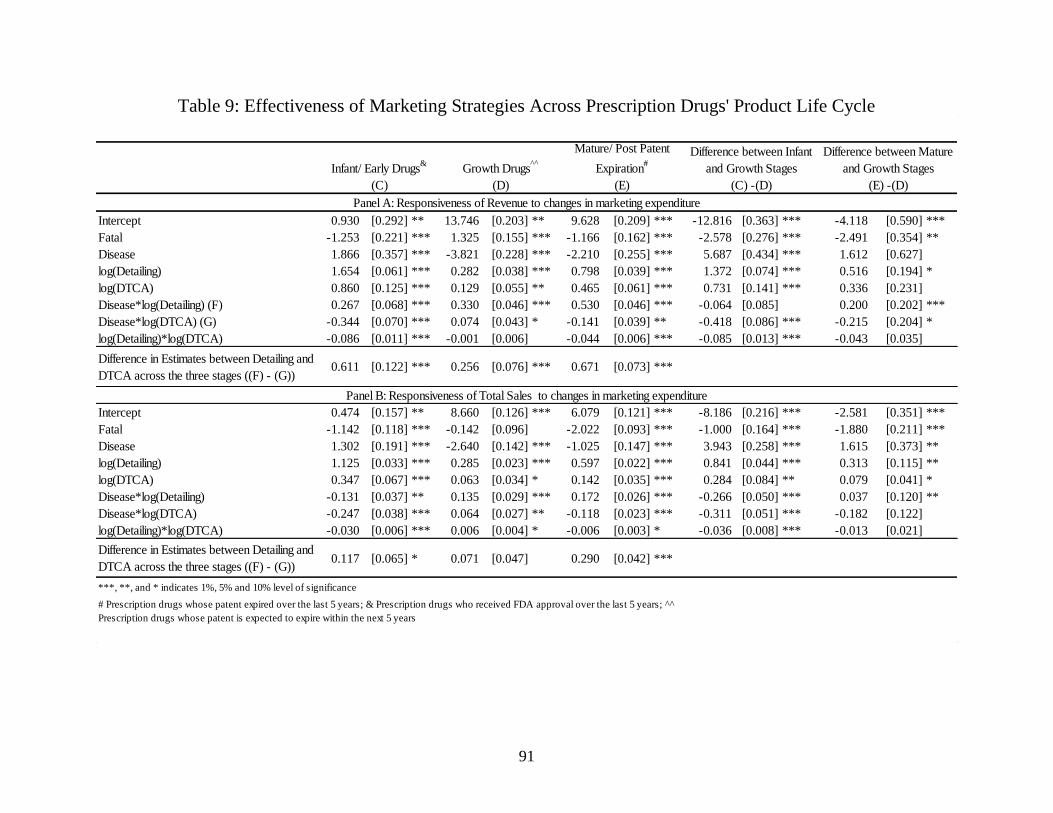
91
Table 9: Effectiveness of Marketing Strategies Across Prescription Drugs' Product Life Cycle
Intercept 0.930 [0.292] ** 13.746 [0.203] ** 9.628 [0.209] *** -12.816 [0.363] *** -4.118 [0.590] ***
Fatal -1.253 [0.221] *** 1.325 [0.155] *** -1.166 [0.162] *** -2.578 [0.276] *** -2.491 [0.354] **
Disease 1.866 [0.357] *** -3.821 [0.228] *** -2.210 [0.255] *** 5.687 [0.434] *** 1.612 [0.627]
log(Detailing) 1.654 [0.061] *** 0.282 [0.038] *** 0.798 [0.039] *** 1.372 [0.074] *** 0.516 [0.194] *
log(DTCA) 0.860 [0.125] *** 0.129 [0.055] ** 0.465 [0.061] *** 0.731 [0.141] *** 0.336 [0.231]
Disease*log(Detailing) (F) 0.267 [0.068] *** 0.330 [0.046] *** 0.530 [0.046] *** -0.064 [0.085] 0.200 [0.202] ***
Disease*log(DTCA) (G) -0.344 [0.070] *** 0.074 [0.043] * -0.141 [0.039] ** -0.418 [0.086] *** -0.215 [0.204] *
log(Detailing)*log(DTCA) -0.086 [0.011] *** -0.001 [0.006] -0.044 [0.006] *** -0.085 [0.013] *** -0.043 [0.035]
Difference in Estimates between Detailing and
DTCA across the three stages ((F) - (G))0.611 [0.122] *** 0.256 [0.076] *** 0.671 [0.073] ***
Intercept 0.474 [0.157] ** 8.660 [0.126] *** 6.079 [0.121] *** -8.186 [0.216] *** -2.581 [0.351] ***
Fatal -1.142 [0.118] *** -0.142 [0.096] -2.022 [0.093] *** -1.000 [0.164] *** -1.880 [0.211] ***
Disease 1.302 [0.191] *** -2.640 [0.142] *** -1.025 [0.147] *** 3.943 [0.258] *** 1.615 [0.373] **
log(Detailing) 1.125 [0.033] *** 0.285 [0.023] *** 0.597 [0.022] *** 0.841 [0.044] *** 0.313 [0.115] **
log(DTCA) 0.347 [0.067] *** 0.063 [0.034] * 0.142 [0.035] *** 0.284 [0.084] ** 0.079 [0.041] *
Disease*log(Detailing) -0.131 [0.037] ** 0.135 [0.029] *** 0.172 [0.026] *** -0.266 [0.050] *** 0.037 [0.120] **
Disease*log(DTCA) -0.247 [0.038] *** 0.064 [0.027] ** -0.118 [0.023] *** -0.311 [0.051] *** -0.182 [0.122]
log(Detailing)*log(DTCA) -0.030 [0.006] *** 0.006 [0.004] * -0.006 [0.003] * -0.036 [0.008] *** -0.013 [0.021]
Difference in Estimates between Detailing and
DTCA across the three stages ((F) - (G))0.117 [0.065] * 0.071 [0.047] 0.290 [0.042] ***
***, **, and * indicates 1%, 5% and 10% level of significance
# Prescription drugs whose patent expired over the last 5 years; & Prescription drugs who received FDA approval over the last 5 years; ^^
Prescription drugs whose patent is expected to expire within the next 5 years
Difference between Infant
and Growth Stages
(C) -(D)
Panel A: Responsiveness of Revenue to changes in marketing expenditure
Panel B: Responsiveness of Total Sales to changes in marketing expenditure
Difference between Mature
and Growth Stages
(E) -(D)
Infant/ Early Drugs&
(C)
Growth Drugs^^
(D)
Mature/ Post Patent
Expiration#
(E)

92
Table 10: Prescription Drug Manufacturing Firm's Entry Deterrant Strategy Using
PWP-Gap time Model with Stratum-Specific Regression Coefficients
0.304 * -0.091
(0.170) (0.093)
[1.355] [0.913]
-0.162 -0.042
(0.002) (0.167)
[1.002] [0.959]
-1.419 -4.003 *
(1.591) (2.123)
[0.242] [0.018]
-4.097 ** -4.494 **
(2.015) (2.232)
[0.017] [0.011]
-17.354 * -2.044
(8.906) (6.353)
[0.001] [7.720]
-0.208 -1.662 **
(0.415) (0.762)
[1.231] [0.190]
2.710 0.523
(1.815) (1.601)
[15.031] [0.592]
0.005 * 0.002
(0.003) (0.002)
[1.005] [0.998]
^ RVOS: Retail value of samples; # DTCA: Direct to Customer Advertisement
***, **, and * indicates 1%, 5% and 10% level of significance
Strategy Targeted at First to
Market Generic Manufacturer
Column (A)
Strategy Targeted at Follower
Generic Manufacturer
Column (B)
Intercept
Samples (in 100000)
Percentage of Marketing
Expenditure on RVOS^
Percentage of Marketing
Expenditure on Detailing
Percentage of Marketing
Expenditure on DTCA#
Firm Size of Generic
Manufacturer
Market Share of Prescription
Manufacturing Firm
Prescription Drug Price

93
BIBLIOGRAPHY
94
BIBLIOGRAPHY
Agrawal, Madhu, and Nimish Thakkar. "Surviving patent expiration: strategies for marketing
pharmaceutical products." Journal of product & brand management 6.5 (1997): 305-314.
Aitken, Murray, Ernst R. Berndt, and David M. Cutler. "Prescription drug spending trends in the
United States: looking beyond the turning point." Health Affairs 28.1 (2009): w151-w160.
Aronsson, Thomas, Mats A. Bergman, and Niklas Rudholm. "The impact of generic drug
competition on brand name market shares–Evidence from micro data." Review of Industrial
Organization 19.4 (2001): 423-433.
Basara LR. The impact of a direct-to-consumer prescription medication advertising campaign on
new prescription volume. Drug InfJ. 1996;30:715-729.
Bell, Robert A., Richard L. Kravitz, and Michael S. Wilkes. "Direct‐to‐consumer prescription
drug advertising and the public." Journal of General Internal Medicine 14.11 (1999): 651-657.
Bell, Robert A., Michael S. Wilkes, and Richard L. Kravitz (2000a) "The educational value of
consumer-targeted prescription drug print advertising." Journal of Family Practice 49.12: 1092-
1098.
Bell, Robert A., Richard L. Kravitz, and Michael S. Wilkes (2000b)"Direct-to-consumer
prescription drug advertising, 1989-1998. A content analysis of conditions, targets, inducements,
and appeals." J Fam Pract 49.4: 329-335.
Berndt, Ernst R., Linda T. Bui, David H. Lucking-Reiley, and Glen L. Urban (1996) “The Roles
of Marketing, Product Quality, and Price Competition in the Growth and Composition of the
U.S. Antiulcer Drug Industry”, in The Economics of New Goods, Timothy F. Bresnahan and
Robert J. Gordon, editors, University of Chicago Press, pp: 277 – 328.
Blattberg, R. C., & Neslin, S. A. (1990). Sales promotion: Concepts, methods, and strategies
(pp. 349-350). Englewood Cliffs, NJ: Prentice Hall.
Borgheini, Giuseppe. "The bioequivalence and therapeutic efficacy of generic versus brand-
name psychoative drugs." Clinical therapeutics 25.6 (2003): 1578-1592.
Bradford, W. D., Kleit, A. N., Nietert, P. J., Steyer, T., McIlwain, T., & Ornstein, S. (2006). How
direct-to-consumer television advertising for osteoarthritis drugs affects physicians’ prescribing
behavior. Health Affairs, 25(5), 1371-1377.
Caves, Richard E., Michael D. Whinston and Mark A. Hurwitz (1991) “Patent Expiration, Entry,
and Competition in the U.S. Pharmaceutical Industry,”
95
Cegedim-SK&A (2011) 2010 U.S. Pharma Company promotion Spending, January. Available at
www.forums.pharma-mkting.com/attachment.php?attachmentid=154&d
Dave, Dhaval, and Henry Saffer. "Impact of direct-to-consumer advertising on pharmaceutical
prices and demand." Southern Economic Journal 79.1 (2012): 97-126.
Dong, Xiaojing, Michael Li, and Ying Xie. "Understanding Sample Usage and Sampling as a
Promotion Tool: State of Industry Practice and Current Research." Innovation and Marketing in
the Pharmaceutical Industry. Springer New York, 2014. 507-530.
Donohue, Julie M., Ernst R. Berndt, Meredith Rosenthal, Arnold M. Epstein, and Richard G.
Frank. “Effects of pharmaceutical promotion on adherence to the treatment guidelines for
depression.” Medical care 42, no. 12 (2004): 1176-1185.
Donohue, Julie M., Marisa Cevasco, and Meredith B. Rosenthal. "A decade of direct-to-
consumer advertising of prescription drugs." New England Journal of Medicine 357.7 (2007):
673-681.
Duflos, Gautier, and Frank R. Lichtenberg. "Does competition stimulate drug utilization? The
impact of changes in market structure on US drug prices, marketing and utilization."
International Review of Law and Economics 32.1 (2012): 95-109.
Eisenberg, Rebecca S. (2003) “Patents, Product Exclusivity, and Information Dissemination:
How Law Directs Biopharmaceutical Research and Development,” Fordham law Review, Vol
72, issue 3, pp 477 – 491.
Ellison, Glenn, and Sara Fisher Ellison. Strategic entry deterrence and the behavior of
pharmaceutical incumbents prior to patent expiration. No. w13069. National Bureau of
Economic Research, 2007.
Fischer, Marc, and Sönke Albers. "Patient-or physician-oriented marketing: what drives primary
demand for prescription drugs?." Journal of Marketing Research 47.1 (2010): 103-121.
Fox, John. "Cox proportional-hazards regression for survival data." An R and S-PLUS
companion to applied regression (2002): 1-18.
Frosch, D. L., Krueger, P. M., Hornik, R. C., Cronholm, P. F., & Barg, F. K. (2007). Creating
demand for prescription drugs: a content analysis of television direct-to-consumer advertising.
The Annals of Family Medicine, 5(1), 6-13.
Fugh-Berman, Adriane, Karen Alladin, and Jarva Chow. "Advertising in medical journals:
should current practices change?." PLoS Medicine 3.6 (2006): e130.
Gagnon, Marc-André, and Joel Lexchin. “The cost of pushing pills: a new estimate of
pharmaceutical promotion expenditures in the United States.” PLoS medicine 5.1 (2008): e1.

96
Gellad, Ziad F., and Kenneth W. Lyles. “Direct-to-consumer advertising of pharmaceuticals.”
The American journal of medicine 120.6 (2007): 475-480.
Gönül, Füsun F., Franklin Carter, Elina Petrova, and Kannan Srinivasan. "Promotion of
prescription drugs and its impact on physicians’ choice behavior." Journal of Marketing 65, no. 3
(2001): 79-90.
Grabowski, Henry G. and John M. Vernon (1992) “Brand Loyalty, Entry, and Price Competition
in Pharmaceuticals after the 1984 Drug Act,” Journal of Law and Economics, Vol. 35, No. 2
(Oct., 1992), pp. 331-350.
Grabowski, Henry G., David B. Ridley, and Kevin A. Schulman. "Entry and competition in
generic biologics." Managerial and Decision Economics 28.4‐5 (2007): 439-451.
Groves, K. E. M., I. Sketris, and S. E. Tett. "Prescription drug samples–does this marketing
strategy counteract policies for quality use of medicines?." Journal of clinical pharmacy and
therapeutics 28.4 (2003): 259-271.
Hudson, John (2000) “Generic take-up in the pharmaceutical market following patent expiry A
multi-country study”, International Review of Law and Economics 20 (2000) 205–221
Hurwitz, MA and RE Caves (1988) “Persuasion or information? Promotion and the shares of
brand name and generic pharmaceuticals,” Journal of Law and Economics, Vol. 31, No. 2 (Oct.,
1988), pp. 299-320.
Kadiyali, Vrinda. "Entry, its deterrence, and its accommodation: A study of the US photographic
film industry." The Rand Journal of Economics (1996): 452-478.
Königbauer, Ingrid. "Advertising and generic market entry." Journal of health economics 26.2
(2007): 286-305.
Kvesic, Dennis Z. "Product lifecycle management: marketing strategies for the pharmaceutical
industry." Journal of Medical Marketing: Device, Diagnostic and Pharmaceutical Marketing 8.4
(2008): 293-301.
Ladha, Z. (2007). Marketing strategy: are consumers really influenced by brands when
purchasing pharmaceutical products?. Journal of Medical Marketing: Device, Diagnostic and
Pharmaceutical Marketing, 7(2), 146-151.
Leffler KB. Persuasion or information? The economics of prescription drugs advertising, J Law
Econ. 1981;24:45-74.
Lexchin, Joel. “Direct-to-consumer advertising.” Disease Management and Health Outcomes 5.5
(1999): 273-283.

97
Luo, Xueming, and Chitra Bhanu Bhattacharya. "The debate over doing good: Corporate social
performance, strategic marketing levers, and firm-idiosyncratic risk." Journal of Marketing 73.6
(2009): 198-213.
Ma, Jun; Stafford, Randall S.; Cockburn, Iain M.; Finkelstein, Stan N. (2003) “A statistical
analysis of the magnitude and composition of drug promotion in the United States in 1998,”
Clinical Therapeutics, 25 (5) (May 2003): 1503-1517.
Mackowiak, John I., and Jean Paul Gagnon. "Effects of promotion on pharmaceutical demand."
Social Science & Medicine 20.11 (1985): 1191-1197.
Masood, I., Ibrahim, M. I., Hassali, M. A., & Ahmed, M. (2009). Evolution of marketing
techniques, adoption in pharmaceutical industry and related issues: a review. J Clin Diagnostic
Res, 3, 1942-52.
Mintzes, Barbara, Morris L. Barer, Richard L. Kravitz, Ken Bassett, Joel Lexchin, Arminée
Kazanjian, Robert G. Evans, Richard Pan, and Stephen A. Marion. “How does direct-to-
consumer advertising (DTCA) affect prescribing? A survey in primary care environments with
and without legal DTCA.” Canadian Medical Association Journal 169, no. 5 (2003): 405-412.
Mizik, Natalie, and Robert Jacobson. "Are physicians “easy marks”? Quantifying the effects of
detailing and sampling on new prescriptions." Management Science 50.12 (2004): 1704-1715.
Neslin, Scott. (2002). Sales Promotion. Cambridge: Marketing Science Institute Relevant
Knowledge Series.
Rogers, Everett M. "New product adoption and diffusion." Journal of consumer Research
(1976): 290-301.
Rogers Everett, M. "Diffusion of innovations." New York (1995).
Scott Morton, Fiona M. "Barriers to entry, brand advertising, and generic entry in the US
pharmaceutical industry." International Journal of Industrial Organization 18.7 (2000): 1085-
1104.
Narayanan, Sridhar, Ramarao Desiraju, and Pradeep K. Chintagunta. "Return on investment
implications for pharmaceutical promotional expenditures: The role of marketing-mix
interactions." Journal of marketing 68.4 (2004): 90-105.
Pines, Wayne L. “Direct-to-consumer advertising.” The Annals of pharmacotherapy 34, no. 11
(2000): 1341-1344.
Qualls, William, Richard W. Olshavsky, and Ronald E. Michaels. "Shortening of the PLC: An
empirical test." The Journal of Marketing (1981): 76-80.
Rizzo, John A. "Advertising and Competition in the Ethical Pharmaceutical Industry: The Case
of Antihypertensive Drugs*." The Journal of Law and Economics 42.1 (1999): 89-116.

98
Rosenthal, M. B., Berndt, E. R., Donohue, J. M., Frank, R. G., & Epstein, A. M. (2002).
Promotion of prescription drugs to consumers. New England Journal of Medicine, 346(7), 498-
505.
Sridhar, Shrihari, Murali K. Mantrala, and Sönke Albers. “Pharmaceutical detailing elasticities:
A meta-analysis.” Innovation and Marketing in the Pharmaceutical Industry. Springer New York,
2014. 531-556.
Ullah, Shahid, Tim J. Gabbett, and Caroline F. Finch. "Statistical modelling for recurrent events:
an application to sports injuries." British journal of sports medicine (2012): bjsports-2011.
Venkataraman, Sriram, and Stefan Stremersch. "The debate on influencing doctors' decisions:
Are drug characteristics the missing link?." Management Science 53.11 (2007): 1688-1701.
Vogel, Ronald J., Sulabha Ramachandran, and Woodie M. Zachry. "A 3-stage model for
assessing the probable economic effects of direct-to-consumer advertising of pharmaceuticals."
Clinical therapeutics 25.1 (2003): 309-329.
Warrier, R., Monaghan, M. S., Maio, A., Huggett, K., & Rich, E. (2010). Effect of drug sample
availability on physician prescribing behavior: a systematic review.
Wilkes, Michael S., Robert A. Bell, and Richard L. Kravitz. “Direct-to-consumer prescription
drug advertising: trends, impact, and implications.” Health Affairs 19.2 (2000): 110-128.
Young, Andrew. “Direct-to-consumer advertising.” CMAJ 169.5 (2003): 385.

99
Chapter 3
The effect of Loyalty Program on firm risk and value
3. ABSTRACT
Loyalty programs (LPs) are dynamic incentive programs where consumers are benefitted
from cumulative purchase over time. Studies indicate that not all LP are equally successful and
some fail to generate the expected stream of revenue for the firm, leading to volatility in
expected stream of revenue. A report published by Colloquy reiterates the fact by indicating that
American businesses distribute approximately $48 billion worth of perceived value in reward
points and miles annually; surprisingly only two-third of these points are redeemed by
consumers. The current study utilizes a sample of 336 U.S. firms – inclusive of retail, hospitality,
telecommunication and entertainment sectors – that offer loyalty programs. We estimate firm’s
idiosyncratic risk after it adopts the program following the Fama-French four-factor model.
Results indicate that firm’s adoption of LP alleviates firm-specific risk. Next, we demonstrate
that market share moderates the relation between firm’s adoption of loyalty program and sales.
In particular, adoption of loyalty program by firms with high market share depletes sales. On the
other hand, adoption of loyalty programs by small firms boost sales, thereby improving firms’
market share.
Keywords: loyalty program, firm-specific risk, market share, sales
100
3.1 Introduction
Loyalty programs are designed to offer accumulated economic benefits to customers who
purchase the product in the near future (Uncles, Dowling and Hammond, 2003). Customers
typically accumulate points over a period of time, which he/she may consequently exchange for
free products or rewards such as air miles (Dowling and Uncles, 1997; Sharp and Sharp, 1997).
Consequently, these programs encourage consumers to shift their purchase decisions to a multi-
period framework rather than focus on single-period decisions (Lewis, 2004). Over the last
decade, loyalty programs have assumed a critical role in customer relationship management
(CRM), thereby rendering these strategies critical for firm management in initiating and
maintaining relationships, motivating product and service usage, and retaining customer base
(Musalem and Joshi, 2009).
Acquiring a new customer base is few folds more expensive than customer retention
(Blattberg, Getz and Thomas, 2001; Griffin and Lowenstein, 2001; Thomas, Blattberg and Fox,
2004). Moreover, on average, existing customers spend significantly more than a new customer
(Zeithaml, Rust, Lemon, 2001). Thus, one of the important factors driving marketing strategists
to implement loyalty programs is retaining existing customer base (Lee, Lee, Feick, 2001). A
report published by Colloquy reiterates the fact by indicating that American businesses distribute
approximately $48 billion worth of perceived value in reward points and miles annually;
surprisingly only two-third of these points are redeemed by consumers. Thus, significant portion
of company’s time and effort spent towards the loyalty program get lost and customers do not get
any additional benefit from buying business to which they are loyal (Keh and Lee, 2006).
Another report by Colloquy indicates that the average U.S. household has joined 14.1 loyalty and
rewards programs; however, they actively operate only 6.2 of them. Thus, market strategists

101
realize that loyalty and rewards programs have the potential to spark business growth. However,
there may be misalignment between loyalty program offerings and customers’ expectations from
the business that needs to be addressed to increase the effectiveness of loyalty programs (McCall
and Voorhees, 2010). Customers express the need for loyalty programs that are relevant and
customized based on individual consumer preference structure (Kivetz and Simonson, 2003).
Firm management and consumer enthusiasm for loyalty programs (LP) has been echoed
in the marketing literature. In particular, scholars have examined effectiveness of loyalty
programs in changing consumer purchase pattern. Consistent with the ‘goal-gradient hypothesis’,
Kivetz, Urminsky, and Zheng (2006) demonstrates consumers expend more effort as they
approach a reward. Moreover, consumers are more likely to have high perception regarding the
LP if they experience an idiosyncratic fit with the program offerings (Kivetz and Simonson,
2003). Additionally, LPs with high requirements tend to shift consumer preference towards
luxury rewards as compared to necessity rewards (Kivetz and Simonson, 2002). Studies
demonstrate that loyalty program in conjunction with marketing instruments such as shipping
fees, e-mail coupons etc. aids in customer retention (Verhoef, 2003; Lewis, 2004). Studies have
also focused on the economic aspects of loyalty programs (Shugan, 2005). Retail firms with high
assortment homogeneity and product offerings characterized by high purchase frequency are
more likely to adopt loyalty program to limit consumer’s tendency to switch (Zhang et al., 2000;
Leenheer and Bijmolt, 2008). Adoption of successful loyalty program helps the firm to build a
strong customer base that tends to discount negative evaluations of the company relative to its
competitors (Bolton, Kannan and Bramlett, 2000). Kim, Shi and Srinivasan (2001) demonstrates
that reward programs weaken price competition. In particular, ‘by offering the incentives for
repeat purchases, reward programs increase a firm’s cost to attract competing firms’ current

102
customers. Moreover, since firms gain less from undercutting their prices, equilibrium prices go
up.’
Adoption of LP is a critical component of customer relation management that not only
improves firm’s visibility in the market but also adds value to customers (Dowling and Uncles,
1997). Moreover, LPs are designed to decrease consumer defection rate and build a loyal
customer base (Zhang et al., 2000). Thus, one may conjecture that firm’s investments on such
market-based assets may dampen uncertainty in future cash flow that may lead to a decrease in
firm risk (Rego, Billett and Morgan, 2009) and improvement in firm valuation (Srivastava,
Reibstein, and Joshi, 2006). Thus, it may be interesting to examine the impact of firm’s adoption
of loyalty program on firm risk.
Considering the ‘the sunk-cost fallacy’ where already accumulated reward points lock
customers into the LP (Keiningham et al., 2005), key to successful adoption of LP is the firm’s
market entry position. However, there is paucity in the literature on the relation between firm’s
adoption of loyalty program and first mover advantage. An important question is whether the
pioneering firm who is first to adopt loyalty program in the industry has relative advantage vis-à-
vis other competitors in the industry who are yet to adopt similar corporate strategy.
An underlying assumption to an effective loyalty program is that the offerings match
closely with the expectations and needs of firm’s customer base. This may especially be
challenging for a firm with high market share since it typically has a diverse customer base with
differentiated preference structure. On the other hand, a firm with low market share usually has a
niche customer base. Thus, tailoring its loyalty program to satisfy the requirements of its
clientele may not be an impossible task. A critical question is whether the relation between
firm’s adoption of loyalty program and firm performance is moderated by firm’s market share.
103
Our study makes the following contributions to the extant literature. We demonstrate that
firm’s adoption of loyalty program alleviates risk. In particular, estimates indicate that upon
adoption of the loyalty program, firm’s exposure to idiosyncratic risk steadily decreases over the
next three years vis-à-vis its exposure to idiosyncratic risk prior to the launch of the program.
Firms with high market share often adopt loyalty programs to retain their current customer base
and prevent market share erosion. We empirically illustrate that such a defensive marketing
strategy is likely to hurt firm performance, as indicated by drop in sales. Interestingly, when a
low market share firm adopts loyalty program as an offensive strategy to improve upon its
customer base, it boots sales.
The article is organized as follows. Section 2 deals with literature review and hypothesis
development. Section 3 provides details of the measures of idiosyncratic risk and firm
performance. Section 4 reports the data collection and sample selection procedure used in the
analysis. Finally, section 5 provides the results of the analysis followed by a discussion section.

104
3.2 Hypothesis Development
3.2.1 Does Adoption of loyalty programs lowers firm risk?
Valuation of a firm is determined by the present value of expected future cash flows
(Kaplan and Ruback, 1995). Financial managers may improve firm valuation either by increasing
expected future cash flows or by reducing uncertainty of the cash flows, which translates into a
lower discount rate and firm risk. If one compares two firms with identical cash flows but differ
in risk structure, present value of the low risk firm’s future cash flow will be higher than that of
the firm with higher risk structure. Thus, former has higher firm valuation than the later, even
though the level of cash flow is identical for both the firms (Rego, Billett and Morgan, 2009).
The association between firm’s investment on market-based assets such as brand, patents,
trademarks etc., and risk is central to the relation between marketing and firm performance
(Madden, Fehle and Fournier, 2006). This is because if such an investment helps to alleviate risk
and reduce uncertainty in future cash flow, it improves firm value. Fornell et al. (2006) posits
that by investing in superior market based assets, managers may be able to simultaneously
improve return and alleviate risk. Rego, Billett and Morgan (2009) demonstrates that firm’s
investment on consumer based brand equity (CBBE) has strong implications on firm’s exposure
to risk. In particular, the authors demonstrate that even though CBBE has significant risk-
reducing effect on both idiosyncratic as well as systematic risk, its impact on alleviating the
former is stronger than shielding the firm from economy-level shocks.
A firm’s total risk or volatility is composed of systematic and idiosyncratic risk (Low,
2009). While systematic risk reflects firm’s sensitivity to the market returns changes or to

105
information regarding broad market changes (e.g., unemployment, natural disaster etc.) that are
common to all stocks, idiosyncratic risk is the ‘risk associated with firm-specific strategies’, after
systematic risk has been accounted for (Fu, 2009). Since, by definition, idiosyncratic risk is
unique to a specific firm, it is a diversifiable risk (Lee and Faff, 2009), whereas systematic risk
involves uncertainty inherent to the entire market and hence is non-diversifiable. Firm’s
‘idiosyncratic risk is priced by investors in financial markets’ and is the major contributor to
firm’s total risk (Ang et al., 2006; Goyal and Santa-Clara, 2003). Studies indicate that firm
specific idiosyncratic risk has profound influence in stock market performance, rendering it as an
important factor for the managers as well as the investors. Thus, in the presence of transaction
costs, asymmetric information and market inefficiency, corporations’ risk management division
traditionally lay greater emphasis in managing unsystematic risk (Brown and Kapadia, 2007).
An emerging strand in the finance literature deals with the relation between firm’s
idiosyncratic risk and economic and financial factors such as firm profitability and investment
decisions (Wei and Zhang 2006; Panousi and Papanikolaou, 2012), corporate governance
(Ferreira and Laux 2007), institutional holding (Xu and Malkiel 2003), consumer word of mouth
(Luo, 2007) etc. Osinga et al. (2011) examines the relation between firm’s marketing activities
and its impact on stock market returns, generation of systematic and unsystematic risk. The study
focuses on direct consumer (i.e., direct-to-consumer advertising, DTCA) and physician (i.e.,
direct-to-physician, DTP) advertising expenditure incurred by pharmaceutical firms. Findings
indicate that investors regard expenditure on DTCA as value enhancing as reflected in upward
movement of stock prices. Interestingly, results also indicate that such marketing activities
generate higher idiosyncratic risk. In contrast, DTP marketing activities have relatively modest
impact on stock returns and idiosyncratic risk. Luo and Bhattacharya (2009) examines whether

106
corporate social performance (CSP) influences firm’s idiosyncratic risk. Empirical results
indicate that even though there is a negative and significant relationship between firm’s CSP and
idiosyncratic risk, firm’s effort to simultaneously pursue CSP, advertising, and R&D may
enhance its idiosyncratic risk.
Current study examines the impact of firm’s adoption of LP on firm risk. Pioneered by
the airline industry in the 1980s, LP has penetrated virtually all industries, ranging from retail to
hospitality, department stores to specialty stores, and entertainment to communications. With
growth of the internet, LP has also captured the online shopping market (Keegan 2010, Wong
2011). Firms embrace LPs and invest billions of dollars in their implementation and maintenance
for multitude of reasons (Nunes & Dréze, 2006). First, LPs helps to reduce customer defection
(Keiningham et al., 2005). The authors suggest that customers are driven by ‘the sunk-cost
fallacy’ where they focus on the total reward points they have already accumulated so far. This
fallacy locks them into the LP and ensures continued interaction in the future even though the
consumer may not feel truly loyal towards the firm’s products and service offerings (p.119).
Furthermore, by providing extra incentives, loyalty programs encourage consumers to ‘direct
more of their purchases toward a business and less at competitors’. It may even entice customers
to buy more than they originally intended. Thus, LPs help firms to win a greater share of
customers’ wallet. Furthermore, with strong customer patronage, LPs may decrease variability in
customers’ cash flows even in cases of environmental shocks, such as negative press coverage,
product recall etc. Thus, establishing a strong customer base helps the firm to reduce uncertainty
in cash flow and alleviate risk (Kumar and Shah, 2015).
Firms often utilize LP as a tool to obtain customer specific data which might yield
valuable insight into customer behavior and purchase pattern. In particular, marketing managers

107
may be able to use the data to decipher information regarding consumers’ preference structure,
volume and frequency of purchase. Consumer specific information may be utilized to determine
customer segmentation and relative effectiveness of marketing strategies across segment.
Additionally, insider information may help the firm to reduce overall marketing and promotional
costs, and maximize effectiveness of marketing communication mix.
Furthermore, marketing managers may even use insider information to establish special
bond with the customers, which goes beyond offering just economic or functional value of the
product or service. It may help the firm to establish a relationship of trust and commitment with
its customer base. Using customer relation management (CRM), one may observe
metamorphosis of ‘an explicit contractual relationship governed by laws into an implicit
friendship governed by passion, purpose, and mutual respect’ (Sheth and Parvatiyar, 1995).
We posit that adoption of LP help the managers to make firm’s cash flow less sensitive to
unexpected changes in firm’s environment. The firm may be exposed to unexpected shocks
specific to the firm (i.e. massive product recall, disruption in supply chain etc.) or the industry.
The impact of such firm or industry specific shock is captured by firm’s idiosyncratic risk. The
firm may also be exposed to shock targeted at the broader market due to unexpected events (i.e.,
hurricane Katrina, tsunamis, earthquakes etc.), impact of which is captured by systematic risk.
We hypothesize that adoption of a successful loyalty program and building a strong customer
base shields the firm from both categories of shocks and helps the manager to manage risk better.
H1a: Firm’s adoption of loyalty program lowers idiosyncratic risk
H1b: Firm’s adoption of loyalty program lowers systematic risk

108
3.2.2 Loyalty Program and Firm Sales
Loyalty programs are dynamic incentives designed to benefit consumers from cumulative
purchase over time and helps the firm to retain its current customer base while attracting
potential customers (Liu, 2007). In other words, an optimally designed loyalty program is
expected to benefit both the parties involved in the transaction (i.e. the consumers as well as the
firm). Thus, adopting a successful loyalty program is an effective marketing strategy by the firm,
especially in a competitive environment. Bolton, Kannan and Bramlett (2000) demonstrates that
an effective reward program not only make customers happy and makes them believe that the
program provides them good value for their money but also makes them less sensitive to any
negative evaluations of the firm vis-à-vis its competitors. Thus, it helps the firm to build a loyal
customer base with positive evaluations and repeat purchase intentions. In particular, these
loyalty program members provide firms with a consistent source of revenue (repeat and
increased purchases) and helps in cost reduction through less promotional expenses, thereby
elevating profit.
However, building a loyal customer base takes time and resources (Taylor and Neslin,
2005). Furthermore it is a learning process for the firm to be able to offer a loyalty program that
matches customer requirements as well as satisfies their corporate goals. There are numerous
instances of firms re-launching loyalty programs, each time with minor revisions that better suits
customer needs and helps them to fulfill their organizational goals (Nunes and Drèze, 2006). For
example, Kohl’s, Star bucks etc. have history of re-launching their loyalty programs, each time
with incremental changes in their program offering packet. Thus we posit that launching of
loyalty program may not have a significant impact on firm sales in the immediate future .
However, it helps the firm to improve sales in the long run (Figure 1).

109
H2: Launch of LP has positive impact on sales in the long run.
3.2.3 Incumbent Effect
In this section we investigate whether firms who are the pioneers in adopting loyalty
programs in their respective industry enjoy first mover advantage. Extant literature indicates that
first-mover advantage depends on certain demand-related inertial advantage and supply-related
efficiency advantages (Mueller, 1997). Specifically, first-mover advantage is significant in
industries where products are associated with high set-up and switching costs, product with high
network externalities or high dollar value of transactions (Kerin, Varadarajan and Peterson,
1992). ‘Switching costs can take the form of transaction costs from switching brands, learning
costs, or seller-induced costs like contractual costs’ (Klemperer, 1987). For instance, usability
and value of a credit card is directly proportional to the number of stores, restaurants, etc., which
accept it, which in turn is a function of the number of possible customers who also use similar
cards. Consumer’s uncertainty regarding product quality is a demand-related factor that may
actually prove to be disadvantageous for the first mover in the industry. On the other hand,
network externalities, economies of scale, set-up and sunk costs are some of the supply related
factors typically enjoyed by the pioneering firm in the industry. For example, a firm that
develops a new product may be able to establish a contractual relationship with suppliers of
important inputs.
Literature indicates that pioneers firms have different skill sets and resources at their
disposal relative to the early adopters and late entrants. Robinson, Fornell and Sullivan (1992)
investigates whether successful market pioneers necessarily have access to superior skills and

110
resources. Findings suggest that market pioneers are not necessarily stronger and have access to
superior skills. However, skills and resource profiles of market pioneers vary significantly from
that of early followers and late entrants (Lieberman and Montgomery, 1988). However, studies
indicate that first mover advantage is contingent on industry and product characteristics
(Lieberman and Montgomery, 1998). In similar vein, studies indicate that the pioneer firm
offering loyalty program enjoys distinct advantage over the other firms in the industry (Van
Osselaer, Alba and Manchanda, 2003). However, the relation may be moderated by loyalty
program offerings and its pricing structure. We hypothesize that the pioneer firm who is the first
to launch a loyalty program in the industry enjoys a significant improvement in sales vis-à-vis its
competitors who are yet to adopt such a marketing strategy.
H3: Pioneering firms who are first to launch loyalty programs in their industry may experience
improvement in sales relative to other firms in the industry.
3.2.4 Does market share moderate the relationship?
Fornell (1992) and Griffin and Hauser (1993) indicated the possibility of a negative
association between customer satisfaction and market share. Authors posit that a firm with small
market- share may target niche customers and address their needs, thereby resulting in high
degrees of satisfaction. On the contrary, a firm with large market share may target ‘a more
diverse and heterogeneous set of customers’. As a firm grows by bringing in customers with
preferences further away from the firm's target market, the overall level of customer satisfaction
is likely to fall.

111
Similar analogy may be drawn between firm’s market share and its adoption of loyalty
programs. A small market share firm serving a niche customer base may be able to tailor its
loyalty program offerings to address the needs of its customer. Loyalty program members may
believe that the program provides them good value for their money. This in turn may translate
into higher customer satisfaction (Bolton, Kannan and Bramlett, 2000) and customer retention
(Lewis, 2004). Thus, an effective loyalty program not only makes the customers happy but also
helps the firm to improve its sales and performance through customer retention and by attracting
potential customers. Thus, one may conclude that small market share firm utilizes
announcements and adopting launching loyalty programs as an offensive marketing strategy to
improve its customer base and gain market share in the long run (Hauser and Shugan, 1983).
On the contrary, a high-market share firm with large and diverse customer base may offer
a generic loyalty program that addresses overall customer needs. However, "one size fits all"
marketing strategy is ‘likely to be profitable only if enough customers have similar preferences’.
The firm may offer multiple loyalty programs targeted at its multiple customer segments.
However, such a differentiated marketing approach may not necessarily translate into higher
customer satisfaction ‘due to the difficulty of serving multiple customers within each segment
and the dilution of effort that comes from serving multiple segments’ (Anderson, Fornell and
Lehmann, 1994). Additionally, such a differentiated marketing strategy may not be very cost
effective. Thus, we posit that for firms with high market share, either strategy (one generic
loyalty program vs. multiple loyalty program targeted at multiple customer segments) may not
necessarily translate into high firm performance.

112
H4: Market share will negatively moderate the effect of firm’s launching loyalty programs on its
sales to the extent that firms with high market share will experience loss in sales from launching
of the loyalty program.
3.3 Methodology
3.3.1 Measures of Idiosyncratic Risk
Firm’s total risk may be measured by standard deviation of returns. In particular, it is
given by
n
i RFRn 1
21
where iR is the thi firm’s stock return on day and RF is the
risk free rate based the Fama and French four factor model (Campbell et al., 2001). Firm’s total
risk may be decomposed into Systematic Risk (or market risk) and Firm-Specific Risk (or
idiosyncratic risk). We measure idiosyncratic risk of an individual stock using the Fama and
French (1993) three-factor model expanded with the Carhart (1997) momentum factor:
,iiiiititi MOMmHMLhSMBsRFRMbRFR (10)
where is the subscript for the day and t is the subscript for the month, t and ib ,
is , and ih
are factor sensitivities or loadings. iR is the thi firm’s stock return on day, RM is the return
in month t on a value-weighted market proxy, RF is the risk free return and is measured by in
month t of a one-month treasury bill. Daily stock returns are obtained from the Center for
Research in Security Prices (CRSP). We regress daily excess returns of individual stocks
RFRi on the following four factors: (i) the excess return based on a market portfolio
RFRM , (ii) the difference in return between a portfolio of small stocks and that of a

113
portfolio of large stocks SMB , (iii) the difference in return between a portfolio of high book-
to-market stocks and that of a portfolio of low book-to-market stocks HML , and (iv) the
difference in return between a portfolio of long on past one-year winners and that of short on
past one-year losers tMOM .
The residual ( ,i ) of the model is a measure of firm-idiosyncratic excess return (Ang et
al. 2006; Cao, Simin, and Zhao 2008). Following Lou and Bhattacharya (2009), we assume that
,1,, iii u , where ,i is a normal random variable with mean 0 and variance 2
. Thus,
presence of serial correlation is evident in the residual term. Firm’s idiosyncratic risk is
measured by the variance of the residuals over the time period under consideration. Specifically,
in the thk year, thi firm’s idiosyncratic risk may be expressed as
n
in 1
2
,
1
where n denotes the
number of days (i.e., 252) over which the model is estimated.
3.3.2 Measures of Firm Performance
We employed multivariate regression analysis with performance indicator as the
dependent variables and launching of loyalty programs as the independent variable. We used
sales (Sales ) as indicators of firm performance. We used firm size and leverage as control
variables (equation 2). Consistent with Leenheer and Bijmolt (2008), we include customer
satisfaction index to control for firm’s customer orientation.
tit
tititi
tititi
tititi
Size
measureePerformanc
,t98
,7,6,5
,,4,3
,2,10,
dummyy Hospitalitdummy Retail
Leverageindexon SatisfactiConsumer
ShareMarket *ProgramLoyaltyShareMarket
IncumbentProgramLoyalty_
(11)
114
Loyalty Program ( ti,ProgramLoyalty ) is an indicator variable that takes the value of 1 if
the thi firm has adopted a loyalty program in period t else equals.
Incumbent ( ti,Incumbent ) is an indicator variable that takes the value of 1 if the thi firm is
the pioneering firm in the industry to launch the loyalty program else equals 0.
Market Share ( ti,ShareMarket ): It is the ratio of thi firm’s sales in period t to total
industry sales in that period. It is an indicator of relative competitiveness of the firm in
the industry.
Consumer Satisfaction index ( ti,Indexon SatisfactiConsumer ): It is economic indicator that
measures the satisfaction of the U.S. consumers for product and/or service offerings of
the thi firm in period t .
Size: We use log of firm’s total asset as a proxy for firm size. Data for firm’s total asset
was obtained from the Compustat database.
Leverage ( Leverage ): It is the firm’s debt to total asset ratio. Data for firm debt and total
asset information was obtained from the Compustat database.
Retail dummy (tdummy Retail ): this is an indicator variable that takes the value of unity if
the firm under consideration belongs to the retail industry; else it takes the value of zero.
Hospitality dummy (tdummyy Hospitalit ): this is an indicator variable that takes the value
of unity if the firm under consideration belongs to the hospitality industry; else it takes
the value of zero.

115
3.4 Data and Measurement Variables
Current analysis includes four sectors, namely: retail, hospitality, telecommunication and
information, and entertainment. Consistent with ASCI convention, we include department and
discount stores (SIC: 5651, 5311), specialty retail stores (SIC: 5700, 5940), drug stores (SIC:
5912), and super markets (SIC: 5411, 5331, 5399) as ‘retail’ sector. Next, we include hotel (SIC:
7011, 6794), restaurants (SIC: 5812, 6794), airlines (SIC: 4512), internet travel (SIC: 4700) as
‘hospitality’ sector. ‘Telecommunications and Information’ sector includes cellular phone (SIC:
4812), and subsciption TV/ Cable (SIC: 4841). Finally, we include amusement and theme parks
(SIC: 7990), and cruises (SIC: 4400) as the ‘entertainment’ sector. Once we obtain a
consolidated list of publicly traded firms corresponding to the list of SIC given above, we
acquired loyalty program related information from company websites, COLLOQUY
(Colloquy.com) and LexisNexis (LexisNexis.com). Information on firm performance measures
(i.e., sales, debt-to-asset ratio, total asset) are obtained from COMPUSTAT. Finally, we obtain
information on customer satisfaction index from American Customer Satisfaction Index (ACSI).
Thus, we constructed a panel data set that contains financial as well as loyalty program
information of the publicly traded firms in the four sectors identified in the study (i.e., retail,
hospitality, telecommunication and information, and entertainment) from 1980 to 2013.

116
3.5 Results
3.5.1 Descriptive Statistics
Table 11 gives the summary statistics of firms included in our study. Column ‘A’ gives the
number of firms in the respective sector that has launched loyalty programs since 1980. In
particular, there are approximately 228, 75, 23 and 10 firms that have adopted loyalty programs
in the retail, hospitality, telecommunications and information and entertainment sectors
respectively over the time period. Similarly, column ‘B’ provides us with information regarding
the number of firms in of these four sectors who are yet to adopt loyalty programs in the
corresponding time period.
Table 12 provides the descriptive statistics of the financial variables used in the current
study. Findings suggest that there is positive association between a firm’s likelihood of
launching loyalty program and its market share (p>.001), sales to asset ratio (p>.05) and size
(p>.001). Estimates also indicate that firms with high market share tend to have positive
association with consumer satisfaction (p>.05), sales to asset ratio (p>.001), and size (p>.001).
3.5.2 Loyalty programs and Firm risk
In this section we examine firm’s adoption of loyalty program and consequent exposure
to risk. We constructed a panel data set that contains financial information of the firm three years
prior to and post adoption of the loyalty program. In particular, if firm i adopts loyalty program
in period t , we consolidated a data set with firm si' financial information for period 3-t to
3t . First two columns of table (13) provide estimates for all three components of risk (i.e.,

117
total firm risk, systematic risk and firm-specific risk) for one year before and after the launch of
the program. The third column provides the difference in estimates. We measure total risk by
standard deviation of firm’s returns. Parameter estimates suggest that firm’s total risk is .4020
(p<.001) and .3810 (p<.001) one year before and after the adoption of the loyalty program
respectively. Findings also suggest that over this time period, systematic risk has been 1.0135
(p<.001) and 1.0084 (p<.001) respectively. Finally, estimates indicate that firm-specific risk has
been .3521 (p<.001), .3285 (p<.001) one year pre and post adoption of the loyalty program
respectively. Next, empirical estimates indicate that the difference in overall firm-risk and firm-
specific risk over the time period is -.0210 (p<.1) and -.0236 (p<.001) respectively.
Columns four and five of table (13) provide estimates of firm risk for three years before
and after the launch of the program. The sixth column provides the difference in estimates.
Parameter estimates suggest that firm’s total risk is .4538 (p<.001) and .3902 (p<.001) three
years before and after the adoption of the loyalty program respectively. Findings also suggest
that over this time period, systematic risk has been 1.0590 (p<.001) and 1.0339 (p<.001)
respectively. Finally, estimates indicate that firm-specific risk has been .3950 (p<.001), .3388
(p<.001) three years pre and post adoption of the loyalty program respectively. Finally, empirical
estimates indicate that the difference in overall firm-risk and firm-specific risk over the time
period is -.0636 (p<.001) and -.0561 (p<.001) respectively.
Thus, empirical estimates indicate that firm’s adoption of LP alleviates firm risk in both
the one year and three years interval. Interestingly, we do not observe any significant difference
in firm’s exposure to systematic risk. However, we do observe significant drop in firm risk in
both the time intervals. Thus, findings are consistent with hypothesis (H1a) that firm’s adoption

118
of loyalty program reduces idiosyncratic risk. However, findings do not support hypothesis
(H1b) that firm’s adoption of loyalty program reduces systematic risk.
3.5.3 Firm’s adoption of loyalty program and impact on sales
Table 14 reports the impact of firm’s launching of loyalty program on firm performance one
year, three years and five years after the launch date. We use sales as the measures of firm
performance. As mentioned earlier, loyalty program is an indicator variable that takes the value
of unity (i.e., 1ProgramLoyalty ) if the firm has launched a loyalty program; else it takes the
value of 0 (i.e., 0ProgramLoyalty ). We include prior year change in sales as a control in the
regression analysis since firms may launch LPs in light of declining sales. We also include firm
size measured by log of total assets and consumer satisfaction index to control for firm
characteristics. Effectiveness of LP varies across sectors. In particular, even though the
emphasis on LP in the retail sector is minimal, it is exponentially significant in the hospitality
industry. Thus, we included sector dummy in the analysis to control for the imbalance in
emphasis on LP across sectors.
Parameter estimates indicate that firm’s adoption of LP may not translate into an immediate
improvement in sales. Interestingly, it registers a boost in sales by 4893.66 (p<.1) and 9905.70
(p<.05) units after three and five years of launching the program respectively. Thus, consistent
with hypothesis H2, we demonstrate that firm’s launching of loyalty program has a long term
positive impact on sales.
Estimates indicate that pioneering firms who were among the first to launch loyalty programs
in the respective industry experience improvement in sales by 6373.09 units (p<.1) three years
after the launch date. Interestingly, we do not observe any significant impact of loyalty programs

119
on sales one year and five years after the launch date. Thus, findings partially confirm hypothesis
H3 that incumbent’s advantage in the industry is limited to the first year of launch of the
program.
Findings suggest that firm’s market share drives sales by 42054.00 (p<.001), 51875.00
(p<.001) and 76837.00 (p<.001) one year, three years and five years after the launch date
respectively. Consistent with the literature, findings indicate a positive association between
market share and sales (Szymanski, Bharadwaj, and Vara-darajan, 1993). Interestingly, market
share of firms who have launched loyalty programs diminishes sales by 32933.00 (p<.05),
44187.00 (p<.001) and 52270.00 (p<.001) one year, three years and five years after the launch
date respectively. This suggests that adoption of loyalty program hurts firms with high market
share in the short and long run. Thus, findings confirm hypothesis H4 that market share
negatively moderates the relation between firm’s launching of loyalty program and sales in all
the three periods under consideration.
Findings suggest that in the hospitality sector, loyalty programs hurts sales by 9417.10 units
(p<.05), 8068.89 units (p<.05) and 11008.00 units (p<.05) one year, three and five years after the
launch year respectively. However, we do not observe any significant impact on sales after the
firm’s adoption of LP in the retail sector.
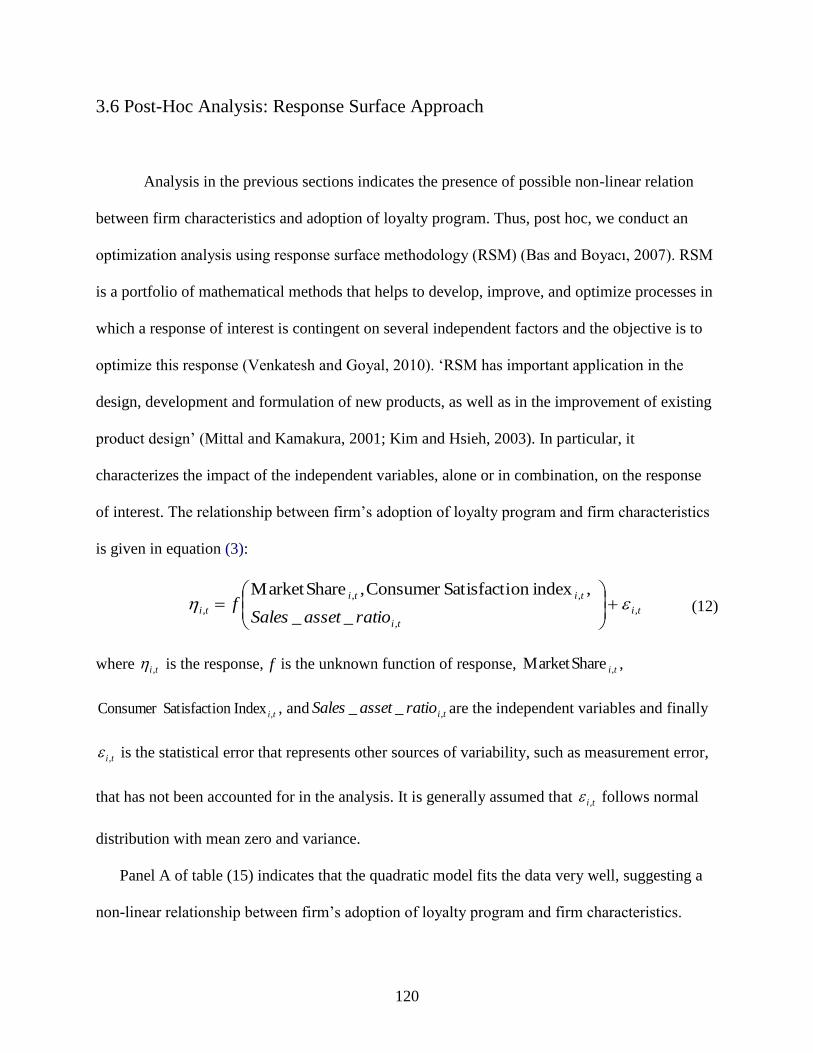
120
3.6 Post-Hoc Analysis: Response Surface Approach
Analysis in the previous sections indicates the presence of possible non-linear relation
between firm characteristics and adoption of loyalty program. Thus, post hoc, we conduct an
optimization analysis using response surface methodology (RSM) (Bas and Boyacı, 2007). RSM
is a portfolio of mathematical methods that helps to develop, improve, and optimize processes in
which a response of interest is contingent on several independent factors and the objective is to
optimize this response (Venkatesh and Goyal, 2010). ‘RSM has important application in the
design, development and formulation of new products, as well as in the improvement of existing
product design’ (Mittal and Kamakura, 2001; Kim and Hsieh, 2003). In particular, it
characterizes the impact of the independent variables, alone or in combination, on the response
of interest. The relationship between firm’s adoption of loyalty program and firm characteristics
is given in equation (3):
ti
ti
titi
tiratioassetSales
f ,
,
,,
,__
,indexon SatisfactiConsumer ,ShareMarket
(12)
where ti , is the response, f is the unknown function of response, ti,ShareMarket ,
ti,Indexon SatisfactiConsumer , and tiratioassetSales ,__ are the independent variables and finally
ti , is the statistical error that represents other sources of variability, such as measurement error,
that has not been accounted for in the analysis. It is generally assumed that ti , follows normal
distribution with mean zero and variance.
Panel A of table (15) indicates that the quadratic model fits the data very well, suggesting a
non-linear relationship between firm’s adoption of loyalty program and firm characteristics.

121
Additionally, R-square is 0.1359, which indicates 13.59% of variability explained by the fitted
model. Panel B of table (15) provides the estimates of the coefficient of response surface
analysis. Estimates indicate that market share is not significant in the analysis of variance for the
model. Findings also indicate that quadratic and interaction terms are significantly important,
with the exception of interaction between consumer satisfaction index and market share.
122
3.7 Discussion
Key Findings and Theoretical Implications: Loyalty programs (LPs) are dynamic
incentive programs designed to benefit consumers from cumulative purchase over time. Despite
extensive literature on loyalty programs and their impact on the customer’s buying pattern, little
is known about the impact of firms’ adoption of loyalty programs on firm’s exposure to risk and
its valuation in the long run. Studies indicate that not all LP are equally successful and some fail
to generate the expected stream of revenue for the firm (Reinartz and V. Kumar, 2002; Shugan,
2005). Thus, from firm management perspective, it is important to analyze whether launching a
LP increases firm’s revenue depletion risk. We examine this gap by measuring firm’s
idiosyncratic risk after the firm adopts the program. We empirically demonstrate that firm’s
adoption of loyalty program depletes risk. In particular, estimates indicate that upon adoption of
the loyalty program, firm specific risk drops steadily and significantly.
Firm management realizes that loyalty programs or frequent shopper programs involve
firm’s extending substantial discounts to its loyal customers with the assumption that the loss
generated due to discounts may be negated by overwhelming increase in sales to new and
existing customers over a period of time (Lal and Bell, 2003). A critical question is whether
firms experience a drop in performance within a year of adopting the LP and whether it is able to
recuperate its losses and is able to successfully enhance firm value in the long run.
Third, we analyze if firms enjoy first mover advantage by being the pioneer in the
industry to adopt the loyalty program. In particular, we examine whether pioneer firms enjoy a
distinct advantage over the rival firms in the industry by examining short and long term firm
performance of these first movers across industries. Findings suggest that firm’s adoption of
123
loyalty program depletes sales in the short run. However, it is able to recuperate its loss in the
long run. We observe improvement in sales three years after launching the program. Results also
indicate that market share moderates the relationship between firm’s adoption of loyalty program
and sales. In particular, adoption of loyalty programs by firms with high market share hurts sales.
Additionally, estimates suggest that first-mover advantage is limited to the first year after
adopting the loyalty program.
Finally, we conduct a post-hoc analysis to investigate probable non-linear relationship
between firm’s adoption of loyalty program and critical firm characteristics. Specifically, we
utilize Response Surface Methodology to investigate if there is an optimal combination of firm’s
sales to asset ratio, consumer satisfaction index and market share that makes launching of loyalty
program a feasible solution for the firm. Findings confirm existence of non-linear relationship.
Managerial Implications: It has been well established in the literature that loyalty programs
are risky marketing strategies. A report published by Colloquy reiterates the fact by indicating
that American businesses distribute approximately $48 billion worth of perceived value in
reward points and miles annually; surprisingly only two-third of these points are redeemed by
consumers. Thus, one may conclude that either the consumers are unaware of the benefits
offered by the loyalty program or their requirements are not addressed by the program offerings.
Current study reiterates the statistics through empirical findings. Results suggest that
successful adoption of loyalty programs require managers to craft programs whose offerings
matches closely with that of the expectations and requirements of the consumers. However, this
may be a challenging requirement for managers, especially for those of big firms. In particular,
firms with high market share typically cater to a consumer base with diverse preference
structure. Thus, tweaking program offerings to meet the requirements of each consumer segment

124
may be a daunting task almost impossible to achieve. On the other hand, managers of small firms
may be able to customize program offerings to satisfy the requirements of their niche customer
base, and in the process yield positive returns.
Limitations and Future Research: Heerde and Bijmolt (2005) investigates the differential
impact of communication mode of loyalty programs (i.e. direct mail to loyalty program members
only vs. door-to-door flyers to its entire customer base) across its customer base. We would like
to extend the study by analyzing wthere effectiveness of loyalty programs is contingent on
communication channel and characteristics of the loyalty program offerings. In particular, we
would like to examine the effectiveness of corporate websites, direct contact with customers
through emails, word-of-mouth, point-of-sale information, direct mail, dedicated club sites, SMS
text messages and social network as effective marketing channels impacting success of the
launching program. Furthermore, firms differ in their loyalty program offerings. Some programs
are built on tier system to reward initial loyalty, where as some charge an initial fee to receive
benefits (Zeithaml, Rust and Lemon, 2001). Some firms even structure non-monetary programs
around their customer's values while some opt to partner with another company to provide all-
inclusive offers to its customers. Additionally, we would like to investigate whether reward
program characteristics are critical factors driving loyalty program success.

125
APPENDIX

126
Table 11: Sample Breakdown by Industry
Sector Industry
Number of firms
who offer Loyalty
Programs (A)
Number of firms
who do not offer
Loyalty Programs (B)
RetailDepartment and Discount Stores, Specialty
Retail Stores, Drug stores, Super Markets 228 1018
Hospitality Hotel, Restaurants*, Airlines, Internet Travel 75 468
Telecommunications and Information Cellular phone, Subsciption TV/ Cable 23 272
Entertainment Amusement and theme parks, Cruises etc. 10 195
Total 336 1953
*incudes limited as well as full service
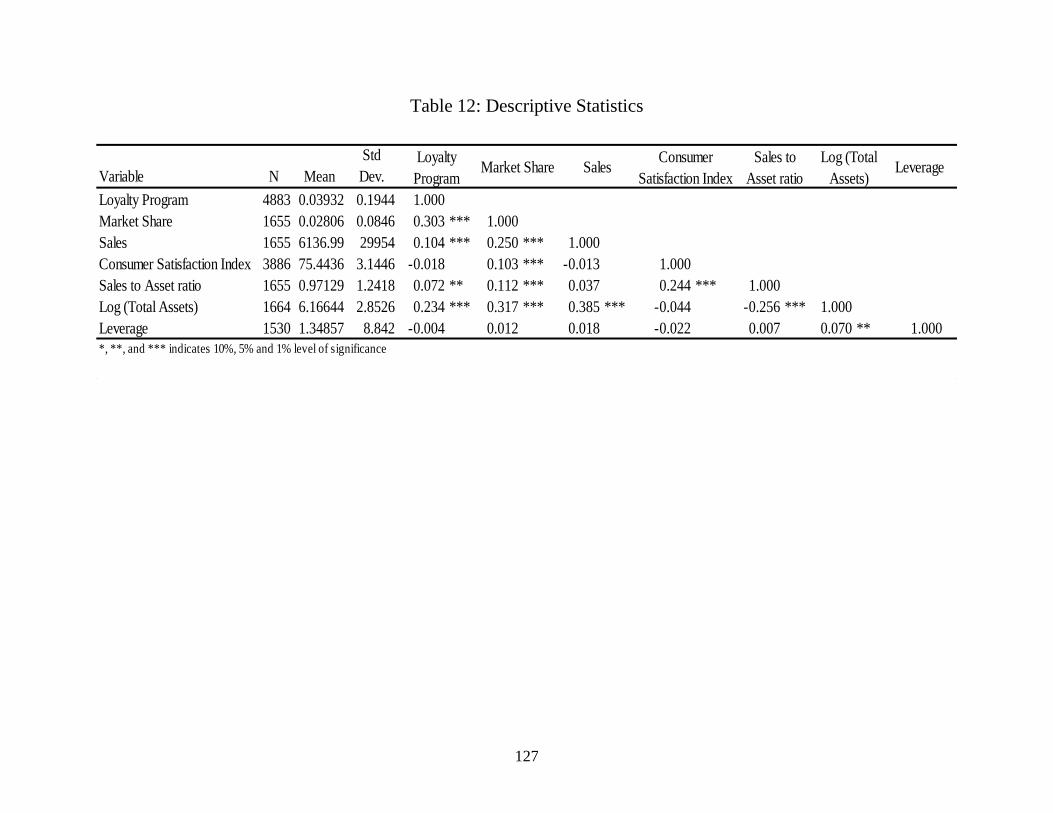
127
Table 12: Descriptive Statistics
Variable N Mean
Std
Dev.
Loyalty Program 4883 0.03932 0.1944 1.000
Market Share 1655 0.02806 0.0846 0.303 *** 1.000
Sales 1655 6136.99 29954 0.104 *** 0.250 *** 1.000
Consumer Satisfaction Index 3886 75.4436 3.1446 -0.018 0.103 *** -0.013 1.000
Sales to Asset ratio 1655 0.97129 1.2418 0.072 ** 0.112 *** 0.037 0.244 *** 1.000
Log (Total Assets) 1664 6.16644 2.8526 0.234 *** 0.317 *** 0.385 *** -0.044 -0.256 *** 1.000
Leverage 1530 1.34857 8.842 -0.004 0.012 0.018 -0.022 0.007 0.070 ** 1.000
*, **, and *** indicates 10%, 5% and 1% level of significance
Market ShareConsumer
Satisfaction Index
Sales to
Asset ratioLeverage
Loyalty
Program
Log (Total
Assets)Sales
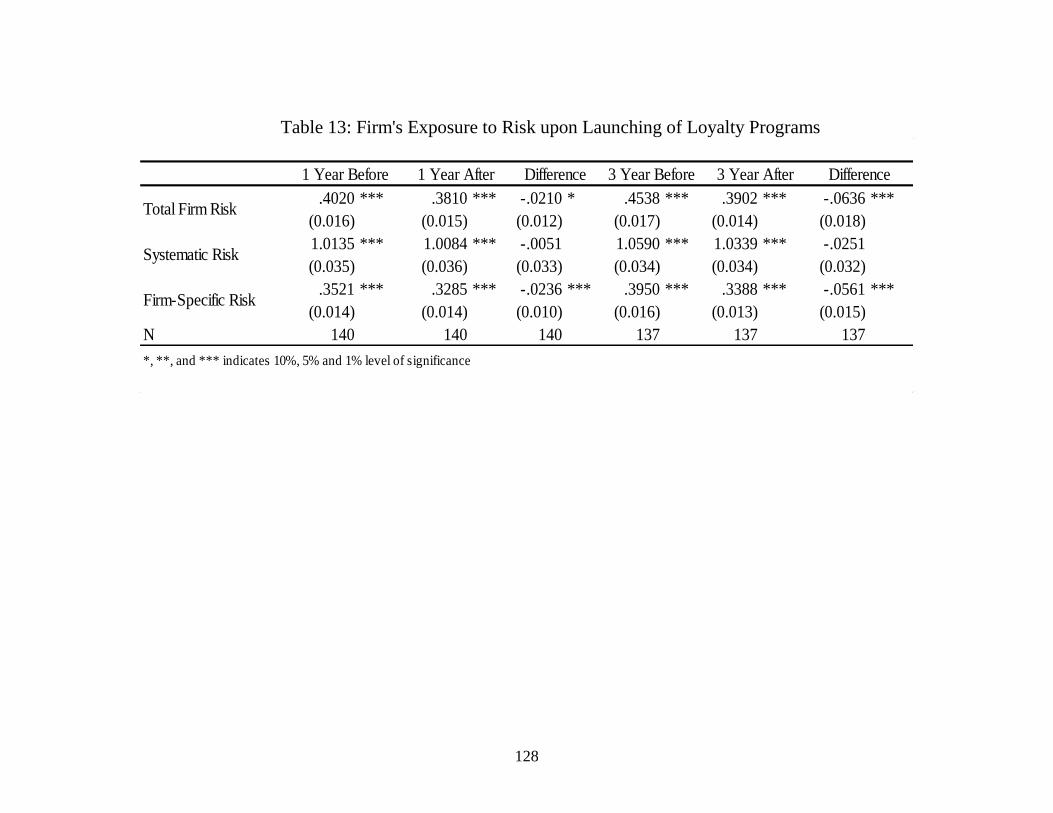
128
Table 13: Firm's Exposure to Risk upon Launching of Loyalty Programs
.4020 *** .3810 *** -.0210 * .4538 *** .3902 *** -.0636 ***
(0.016) (0.015) (0.012) (0.017) (0.014) (0.018)
1.0135 *** 1.0084 *** -.0051 1.0590 *** 1.0339 *** -.0251
(0.035) (0.036) (0.033) (0.034) (0.034) (0.032)
.3521 *** .3285 *** -.0236 *** .3950 *** .3388 *** -.0561 ***
(0.014) (0.014) (0.010) (0.016) (0.013) (0.015)
N 140 140 140 137 137 137
Firm-Specific Risk
1 Year Before 1 Year After Difference
*, **, and *** indicates 10%, 5% and 1% level of significance
3 Year Before 3 Year After Difference
Total Firm Risk
Systematic Risk
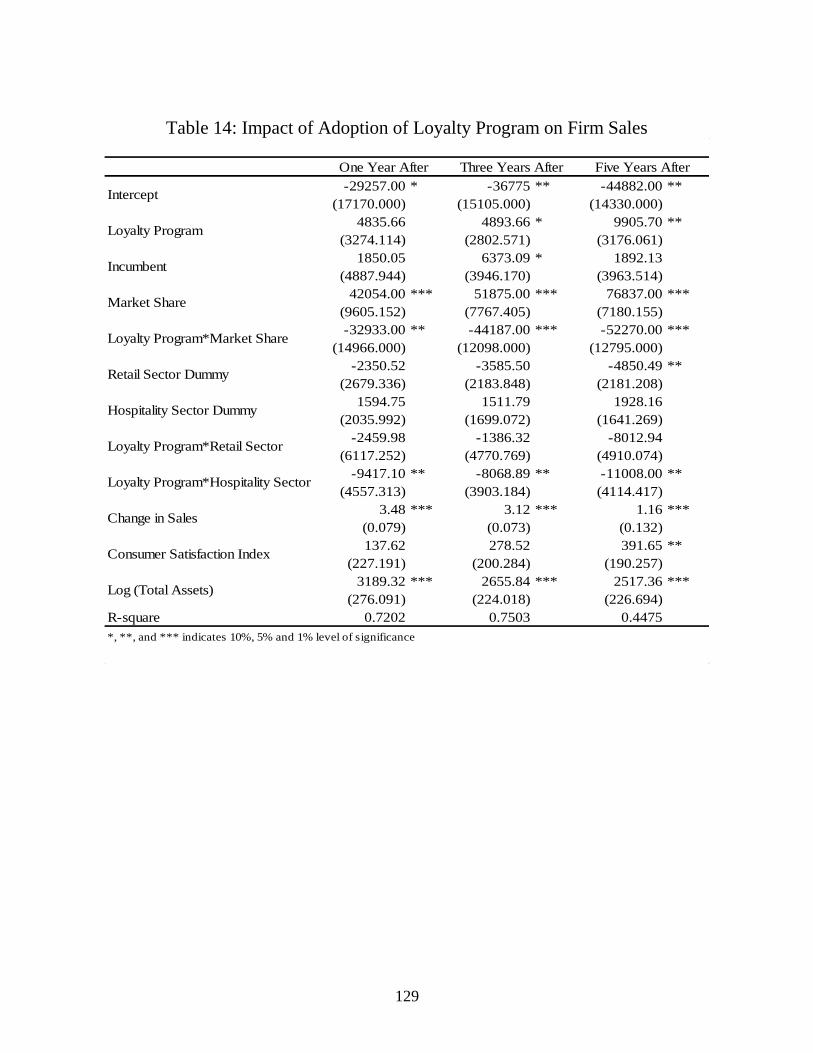
129
Table 14: Impact of Adoption of Loyalty Program on Firm Sales
-29257.00 * -36775 ** -44882.00 **
(17170.000) (15105.000) (14330.000)
4835.66 4893.66 * 9905.70 **
(3274.114) (2802.571) (3176.061)
1850.05 6373.09 * 1892.13
(4887.944) (3946.170) (3963.514)
42054.00 *** 51875.00 *** 76837.00 ***
(9605.152) (7767.405) (7180.155)
-32933.00 ** -44187.00 *** -52270.00 ***
(14966.000) (12098.000) (12795.000)
-2350.52 -3585.50 -4850.49 **
(2679.336) (2183.848) (2181.208)
1594.75 1511.79 1928.16
(2035.992) (1699.072) (1641.269)
-2459.98 -1386.32 -8012.94
(6117.252) (4770.769) (4910.074)
-9417.10 ** -8068.89 ** -11008.00 **
(4557.313) (3903.184) (4114.417)
3.48 *** 3.12 *** 1.16 ***
(0.079) (0.073) (0.132)
137.62 278.52 391.65 **
(227.191) (200.284) (190.257)
3189.32 *** 2655.84 *** 2517.36 ***
(276.091) (224.018) (226.694)
R-square 0.7202 0.7503 0.4475
*, **, and *** indicates 10%, 5% and 1% level of significance
Loyalty Program*Retail Sector
Loyalty Program*Hospitality Sector
Consumer Satisfaction Index
Log (Total Assets)
Change in Sales
Loyalty Program
Incumbent
Market Share
Loyalty Program*Market Share
Retail Sector Dummy
Hospitality Sector Dummy
One Year After Three Years After Five Years After
Intercept
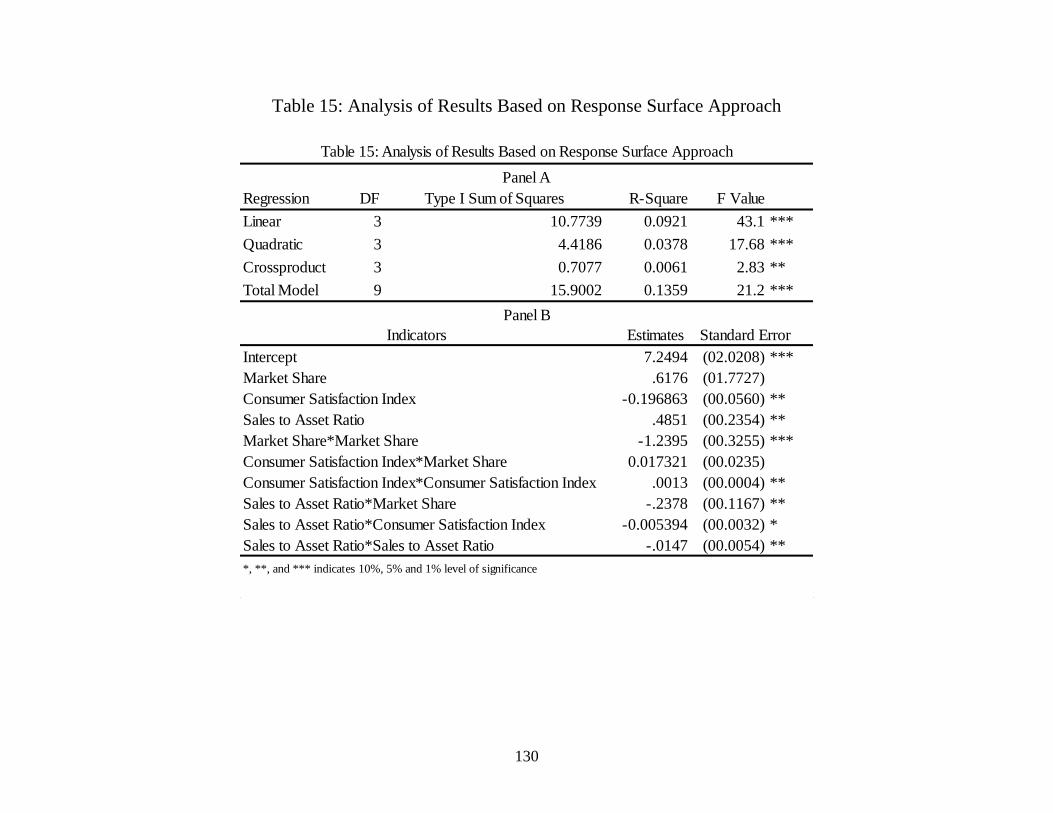
130
Table 15: Analysis of Results Based on Response Surface Approach
Regression DF Type I Sum of Squares R-Square F Value
Linear 3 10.7739 0.0921 43.1 ***
Quadratic 3 4.4186 0.0378 17.68 ***
Crossproduct 3 0.7077 0.0061 2.83 **
Total Model 9 15.9002 0.1359 21.2 ***
Indicators
7.2494 (02.0208) ***
.6176 (01.7727)
-0.196863 (00.0560) **
.4851 (00.2354) **
-1.2395 (00.3255) ***
0.017321 (00.0235)
.0013 (00.0004) **
-.2378 (00.1167) **
-0.005394 (00.0032) *
-.0147 (00.0054) **
*, **, and *** indicates 10%, 5% and 1% level of significance
Panel A
Panel B
Estimates Standard Error
Intercept
Market Share
Consumer Satisfaction Index
Sales to Asset Ratio
Market Share*Market Share
Consumer Satisfaction Index*Market Share
Consumer Satisfaction Index*Consumer Satisfaction Index
Sales to Asset Ratio*Market Share
Sales to Asset Ratio*Consumer Satisfaction Index
Sales to Asset Ratio*Sales to Asset Ratio
Table 15: Analysis of Results Based on Response Surface Approach
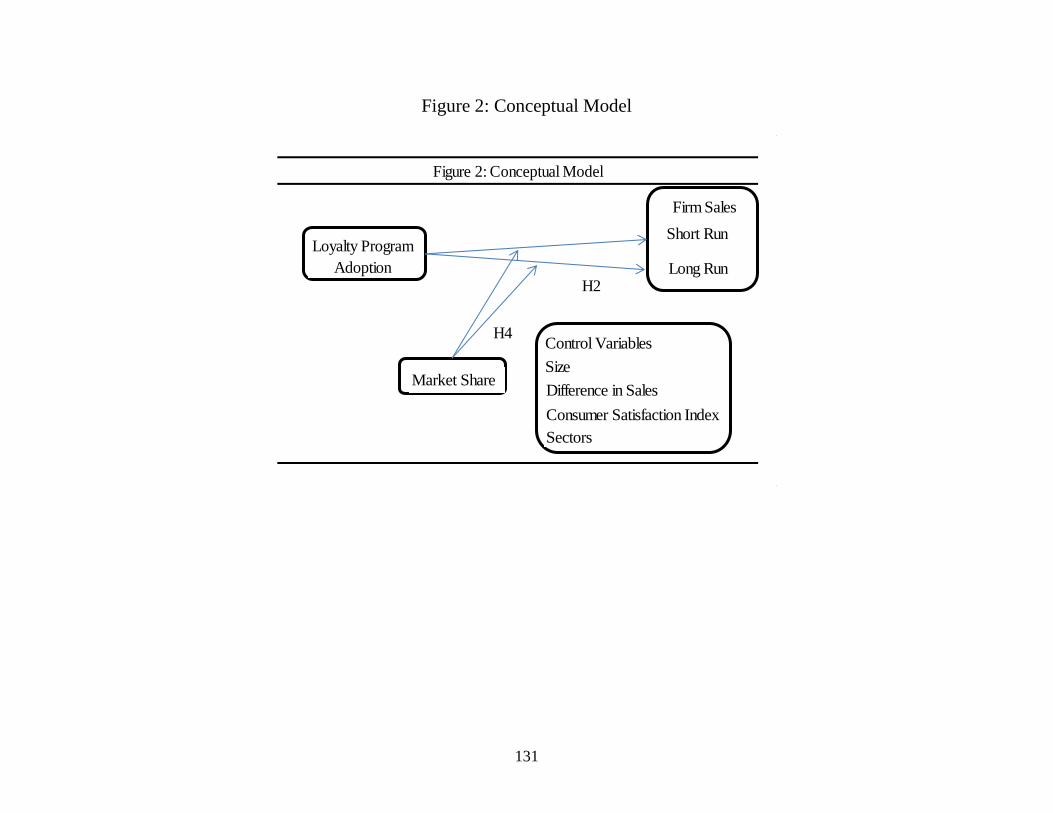
131
Figure 2: Conceptual Model
Figure 2: Conceptual Model
Control Variables
Size
Consumer Satisfaction Index
Market Share
Sectors
Loyalty Program
Adoption
Firm Sales
Short Run
Long Run
H4
Difference in Sales
H2

132
Figure 3: Ridge of Maximum
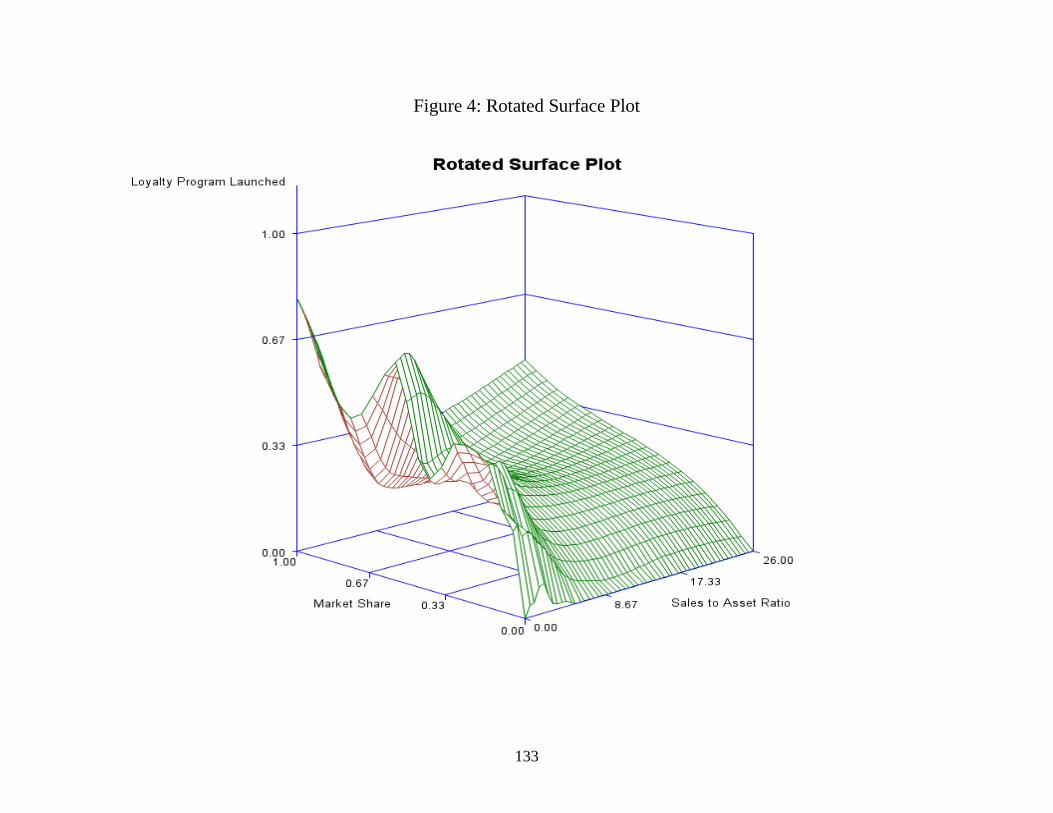
133
Figure 4: Rotated Surface Plot

134
BIBLIOGRAPHY

135
BIBLIOGRAPHY
Anderson, Eugene W., Claes Fornell, and Donald R. Lehmann. "Customer satisfaction, market
share, and profitability: Findings from Sweden." The Journal of Marketing (1994): 53-66.
Ang, Andrew, Rober J. Hodrick, Yuhang Xing, Xiaoyan Zhang (2006) “The cross‐section of
volatility and expected returns,” The Journal of Finance, vol. 61, no. 1, pp. 259-299.
Baş, Deniz, and İsmail H. Boyacı. "Modeling and optimization I: Usability of response surface
methodology." Journal of Food Engineering 78.3 (2007): 836-845.
Bijmolt, Tammo HA, Harald J. van Heerde, and Rik GM Pieters. "New empirical generalizations
on the determinants of price elasticity." Journal of marketing research 42.2 (2005): 141-156.
Blattberg, Robert C., Gary Getz, and Jacquelyn S. Thomas (2001), Customer Equity: Building
and Managing Relationships as Valuable Assets. Boston: Harvard Business School Press.
Bolton, Ruth N., R K. Kannan and Matthew D. Bramlett (2000) “Implications of Loyalty
Program Membership and Service Experiences for Customer Retention and Value,” Journal of
the Academy of Marketing Science; Winter2000, Vol. 28 Issue 1, pp 95- 108.
Brown, Gregory and Nishad Kapadia (2007) “Firm-specific risk and equity market
development,” Journal of Financial Economics 84 (2007) 358–388.
Cao, Charles, Timothy Simin, and Jing Zhao. "Can growth options explain the trend in
idiosyncratic risk?." Review of financial studies 21.6 (2008): 2599-2633.
Campbell, J. Y., Lettau, M., Malkiel, B. G., & Xu, Y. (2001). Have individual stocks become
more volatile? An empirical exploration of idiosyncratic risk. The Journal of Finance, 56(1), 1-
43.
Carhart, M., 1997. On persistence in mutual fund performance. Journal of Finance 52, 57–82.
Dowling, Grahame R. and Mark Uncles (1997), "Do Customer Loyalty Programs Really Work?"
Sloan Management Review, 38 (Summer), 71-82.
Fama, Eugene F., and Kenneth R. French. "Common risk factors in the returns on stocks and
bonds." Journal of financial economics 33.1 (1993): 3-56.
Ferreira, Miguel A. and Paul A. Laux (2007) “Corporate Governance, Idiosyncratic Risk, and
Information Flow,” The Journal of Finance, Vol. 62, No. 2, 951-989.
Fornell, Claes. "A national customer satisfaction barometer: The Swedish experience." the
Journal of Marketing (1992): 6-21.

136
Griffin, Abbie, and John R. Hauser. "The voice of the customer." Marketing science 12.1 (1993):
1-27.
Goyal, Amit and Santa-Clara, Pedro (2003) “Idiosyncratic Risk Matters!,” The Journal of
Finance, Vol. 58, No. 3 (Jun., 2003), pp. 975-1007.
Griffin, Jill, and Michael W. Lowenstein. "Customer winback." San Francisco (2001).
Hauser, John R., and Steven M. Shugan. "Defensive marketing strategies." Marketing Science
2.4 (1983): 319-360.
Kaplan, Steven N., and Richard S. Ruback. "The valuation of cash flow forecasts: An empirical
analysis." The Journal of Finance 50.4 (1995): 1059-1093.
Keh, Hean Tat and Lee, Yih Hwai (2006) “Do reward programs build loyalty for services? The
moderating effect of satisfaction on type and timing of rewards,” Journal of Retailing 82 (2),
127–136.
Keiningham, T. L., Vavra, T. G., Aksoy, L., & Wallard, H. (2005). Loyalty myths: hyped
strategies that will put you out of business--and proven tactics that really work. John Wiley &
Sons.
Kerin, Roger A., P. Rajan Varadarajan and Robert A. Peterson (1992) “First-Mover Advantage:
A Synthesis, Conceptual Framework, and Research Propositions,” Journal of Marketing, Vol. 56,
No. 4 (Oct., 1992), pp. 33-52.
Kim, Byung-Do, Mengze Shi and Kannan Srinivasan (2001) “Reward Programs and Tacit
Collusion,”, Marketing Science
Kim, Stephen Keysuk, and Ping-Hung Hsieh. "Interdependence and its consequences in
distributor-supplier relationships: a distributor perspective through response surface approach."
Journal of Marketing Research 40.1 (2003): 101-112.
Kivetz, Ran and Itamar Simonson (2002) “Earning the Right to Indulge: Effort as a determinant
for Customer Preferences Toward Frequency Program Rewards,” Journal of Marketing
Research, Vol. 39, No. 2 (May, 2002), pp. 155-170.
Kivetz, Ran and Itamar Simonson (2003) “The Idiosyncratic Fit Heuristic: Effort Advantage as a
Determinant of Consumer Response to Loyalty Programs,” Journal of Marketing Research, Vol.
40, No. 4 (May, 2002), pp. 454-467.
Kivetz, Ran, Oleg Urminsky and Yuhuang Zheng (2006) “The Goal-Gradient Hypothesis
Resurrected: Purchase Acceleration, Illusionary Goal Progress, and Customer Retention,”
Journal of Marketing Research, Vol. 43, No. 1, pp. 39-58.
137
Klemperer, Paul. "Markets with consumer switching costs." The quarterly journal of economics
(1987): 375-394.
Kumar, V. and Denish Shah (2004) “Building and sustaining profitable customer loyalty for the
21st century,” Journal of Retailing 80 (2004) 317–330
Kumar, V. and Denish Shah (2015) “Handbook of Research on Customer Equity in Marketing”,
Business & Economics
Lee, Jonathan, Janghyuk Lee, Lawrence Feick, (2001) "The impact of switching costs on the
customer satisfaction-loyalty link: mobile phone service in France", Journal of Services
Marketing, Vol. 15 Iss: 1, pp.35 – 48
Lee, Darren D., and Robert W. Faff. "Corporate sustainability performance and idiosyncratic
risk: A global perspective." Financial Review 44.2 (2009): 213-237.
Leenheer, Jorna, Harald J. van Heerde , Tammo H.A. Bijmolt and Ale Smidts (2007) “Do loyalty
programs really enhance behavioral loyalty? An empirical analysis accounting for self-selecting
members,” International Journal of Research in Marketing
Leenheer, Jorna, and Tammo HA Bijmolt (2008) "Which retailers adopt a loyalty program? An
empirical study." Journal of Retailing and Consumer Services 15.6: 429-442.
Lewis, Michael (2004) “The Influence of Loyalty Programs and Short-Term Promotions on
Customer Retention”, Journal of Marketing Research, Vol. 41, No. 3 (Aug., 2004), pp. 281-292.
Lieberman, Marvin B. and David B. Montgomery (1998) “First-mover (dis)advantages:
Retrospective and link with the resource-based view,” Strategic Management Journal. Dec1998,
Vol. 19 Issue 12, pp 1111 – 1125.
Liu, Yuping (2007) “The Long-Term Impact of Loyalty Programs on Consumer Purchase
Behavior and Loyalty,” Journal of Marketing, Vol. 71, No. 4 (Oct., 2007), pp. 19-35
Liu, Yuping and Rong Yang (2009) “Competing Loyalty Programs: Impact of Market
Saturation, Market Share, and Category Expandability,”Journal of Marketing, Vol. 73 (January
2009), 93–108.
Low, Angie (2009) “Managerial risk-taking behavior and equity-based compensation,” Journal
of Financial Economics, Volume 92, Issue 3, June 2009, Pages 470–490
Luo, Xueming. "Consumer negative voice and firm-idiosyncratic stock returns." Journal of
Marketing 71.3 (2007): 75-88.
Luo, Xueming and C.B. Bhattacharya (2009), “The Debate over Doing Good: Corporate Social
Performance, Strategic Marketing Levers, and Firm-Idiosyncratic Risk,” Journal of Marketing,
73 (6), 198–213.

138
Mägi, Anne W. "Share of wallet in retailing: the effects of customer satisfaction, loyalty cards
and shopper characteristics." Journal of Retailing 79.2 (2003): 97-106.
McAlexander, James H., John W. Schouten and Harold F. Koenig (2002) “Building Brand
Community,” Journal of Marketing, Vol. 66, No. 1 (Jan., 2002), pp. 38-54
McCall, Michael and Clay Voorhees (2010) “The Drivers of Loyalty Program Success,” An
Organizing Framework and Research Agenda, Cornell Hospitality Quarterly February 2010 vol.
51 no. 1 35-52.
Mittal, Vikas, and Wagner A. Kamakura. "Satisfaction, repurchase intent, and repurchase
behavior: Investigating the moderating effect of customer characteristics." Journal of marketing
research 38.1 (2001): 131-142.
Mueller, Dennis C. "First-mover advantages and path dependence." International Journal of
Industrial Organization 15.6 (1997): 827-850.
Musalem, Andrés and Yogesh V. Joshi (2009) “Research Note—How Much Should You Invest
in Each Customer Relationship? A Competitive Strategic Approach,” Marketing Science
May/June 2009 vol. 28 no. 3 555-565
Nunes, Joseph C., and Xavier Drèze. "Your loyalty program is betraying you." Harvard Business
Review 84.4 (2006): 124.
O’Brien, Louise and Charles Jones (1995) “Do Rewards Really Create Loyalty?,” Harvard
Business Review, 73 (May/June), pp 75-82.
Osinga, Ernst C., Peter S.H. Leeflang, Shuba Srinivasan, & Jaap E. Wieringa (2011) “Why Do
Firms Invest in Consumer Advertising with Limited Sales Response? A Shareholder
Perspective,” Journal of Marketing, Vol. 75 (January 109 2011), 109–124.
Panousi, Vasia, and Dimitris Papanikolaou. "Investment, idiosyncratic risk, and ownership." The
Journal of Finance 67.3 (2012): 1113-1148.
Reinartz, Werner and V. Kumar (2002) “The Mismanagent of Customer Loyalty,” Harvard
Business Review. Jul2002, Vol. 80 Issue 7, p86-94.
Robinson, William T., Claes Fornell and Mary Sullivan (1992) “Are Market Pioneers
Intrinsically Stronger Than Later Entrants?” Strategic Management Journal, Vol. 13, No. 8, 609-
624.
Sharp, Byron and Anne Sharp (1997) “Loyalty programs and their impact on repeat-purchase
loyalty Patterns,” Intern. J. of Research in Marketing 14 (1997) 473-486.

139
Sheth, Jagdish N., and Atul Parvatiyar. "The evolution of relationship marketing." International
Business Review 4.4 (1995): 397-418.
Shugan, Steven M. (2005) “Brand Loyalty Programs: Are They Shams?,” Marketing Science
Spring 2005 vol. 24 no. 2 185-193
Sirdeshmukh, Deepak, Jagdip Singh and Barry Sabol, (2002), Consumer Trust, Value, and
Loyalty in Relational Exchanges, Journal of Marketing,
Stauss, Bernd, Maxie Schmidt and Andreas Schoeler (2005) Customer frustration in loyalty
programs, International Journal of Service Industry Management, Vol. 16 No. 3, pp. 229-252.
Szymanski, David M., Sundar G. Bharadwaj, and P. Rajan Varadarajan. "An analysis of the
market share-profitability relationship." The Journal of Marketing (1993): 1-18.
Thomas, Jacquelyn S., Robert C. Blattberg and Edward J. Fox (2004) “Recapturing Lost
Customers,” Journal of Marketing Research, Vol. 41, No. 1 (Feb., 2004), pp. 31-45
Uncles, Mark D., Grahame R. Dowling, and Kathy Hammond. "Customer loyalty and customer
loyalty programs." Journal of consumer marketing 20.4 (2003): 294-316.
Van Osselaer, Stijn M. J., Joseph W. Alba and Puneet Manchanda (2003) “Irrelevant information
and mediated intertemporal choice,” Journal of Consumer Psychology, 14 (2), 257-274.
Venkatesh, Viswanath, and Sandeep Goyal. "Expectation disconfirmation and technology
adoption: polynomial modeling and response surface analysis." MIS quarterly 34.2 (2010): 281-
303.
Verhoef, Peter C. (2003) “Understanding the Effect of Customer Relationship Management
Efforts on Customer Retention and Customer Share Development,” Journal of Marketing, Vol.
67, No. 4, 30-45.
Wagner, Tillmann, Thorsten Hennig-Thurau, Thomas Rudolph (2009). Does Customer
Demotion Jeopardize Loyalty? Journal of Marketing: Vol. 73, No. 3, pp. 69-85.
Wei, Steven X., and Chu Zhang. "Why Did Individual Stocks Become More Volatile?*." The
Journal of Business 79.1 (2006): 259-292.
Russel S. Winer (2001) “A Framework for Customer Relationship Management,” California
Management Review, Vol. 43, No. 4, 89- 105.
Xu, Yexiao, and Burton G. Malkiel. "Investigating the behavior of idiosyncratic volatility*." The
Journal of Business 76.4 (2003): 613-645.
Yi, Youjae and Hoseong Jeon (2003) Effects of Loyalty Programs on Value Perception, Program
Loyalty, and Brand Loyalty, Journal of the Academy of Marketing Science

140
Zeithaml, Valarie A., Roland T. Rust and Katherine N. Lemon (2001) “The Customer Pyramid:
Creating and Serving Profitable Customers,” California Management Review Summer2001, Vol.
43 Issue 4, p118