annual report - fidelity investments report 4 delaware portfolio 2024 (multi-firm) 159 investment...
TRANSCRIPT

Annual ReportDecember 31, 2017

2Annual Report
Chairman’s Message to Participants 5Independent Auditor’s Report 6Performance: The Bottom Line 8Market Recap 26Fund Talk: The Managers’ Overview 27Delaware College Portfolio (Fidelity Funds) 30 Investment Summary
31 Investments32 Financial Statements
Delaware Portfolio 2018 (Fidelity Funds) 34 Investment Summary35 Investments36 Financial Statements
Delaware Portfolio 2021 (Fidelity Funds) 38 Investment Summary39 Investments40 Financial Statements
Delaware Portfolio 2024 (Fidelity Funds) 42 Investment Summary43 Investments44 Financial Statements
Delaware Portfolio 2027 (Fidelity Funds) 46 Investment Summary47 Investments48 Financial Statements
Delaware Portfolio 2030 (Fidelity Funds) 50 Investment Summary51 Investments52 Financial Statements
Delaware Portfolio 2033 (Fidelity Funds) 54 Investment Summary55 Investments56 Financial Statements
Delaware Portfolio 2036 (Fidelity Funds) 58 Investment Summary59 Investments60 Financial Statements
Delaware Conservative Portfolio (Fidelity Funds) 62 Investment Summary63 Investments64 Financial Statements
Delaware Moderate Growth Portfolio (Fidelity Funds)
66 Investment Summary67 Investments68 Financial Statements
Delaware Aggressive Growth Portfolio (Fidelity Funds)
70 Investment Summary71 Investments72 Financial Statements
Delaware Money Market Portfolio 74 Financial StatementsDelaware College Portfolio (Fidelity Index) 76 Investment Summary
77 Investments78 Financial Statements
Contents

3 Annual Report
Delaware Portfolio 2018 (Fidelity Index) 80 Investment Summary81 Investments82 Financial Statements
Delaware Portfolio 2021 (Fidelity Index) 84 Investment Summary85 Investments86 Financial Statements
Delaware Portfolio 2024 (Fidelity Index) 88 Investment Summary89 Investments90 Financial Statements
Delaware Portfolio 2027 (Fidelity Index) 92 Investment Summary93 Investments94 Financial Statements
Delaware Portfolio 2030 (Fidelity Index) 96 Investment Summary97 Investments98 Financial Statements
Delaware Portfolio 2033 (Fidelity Index) 100 Investment Summary101 Investments102 Financial Statements
Delaware Portfolio 2036 (Fidelity Index) 104 Investment Summary105 Investments106 Financial Statements
Delaware Conservative Portfolio (Fidelity Index) 108 Investment Summary109 Investments110 Financial Statements
Delaware Moderate Growth Portfolio (Fidelity Index)
112 Investment Summary113 Investments114 Financial Statements
Delaware Aggressive Growth Portfolio (Fidelity Index)
116 Investment Summary117 Investments118 Financial Statements
Delaware Intermediate Treasury Index Portfolio 120 Financial StatementsDelaware International Index Portfolio 122 Financial StatementsDelaware Fidelity® 500 Index Portfolio 124 Financial StatementsDelaware Total Market Index Portfolio 126 Financial StatementsDelaware Bank Deposit Portfolio 128 Financial StatementsDelaware College Portfolio (Multi-Firm) 130 Investment Summary
131 Investments132 Financial Statements
Delaware Portfolio 2018 (Multi-Firm) 134 Investment Summary135 Investments136 Financial Statements
Delaware Portfolio 2021 (Multi-Firm) 138 Investment Summary139 Investments140 Financial Statements

4Annual Report
Delaware Portfolio 2024 (Multi-Firm) 142 Investment Summary143 Investments144 Financial Statements
Delaware Portfolio 2027 (Multi-Firm) 146 Investment Summary147 Investments148 Financial Statements
Delaware Portfolio 2030 (Multi-Firm) 150 Investment Summary151 Investments152 Financial Statements
Delaware Portfolio 2033 (Multi-Firm) 154 Investment Summary155 Investments156 Financial Statements
Delaware Portfolio 2036 (Multi-Firm) 158 Investment Summary159 Investments160 Financial Statements
Notes to Financial Statements 162Independent Auditor’s Report on Internal Control Over Financial Reporting and on Compliance and Other Matters Based on an Audit of Financial Statements Performed in Accordance with Government Auditing Standards
165
Standard & Poor’s, S&P and S&P 500 are registered service marks of The McGraw-Hill Companies, Inc. and have been licensed for use by Fidelity Distributors Corporation.
Other third-party marks appearing herein are the property of their respective owners.
All other marks appearing herein are registered or unregistered trademarks or service marks of the State of Delaware or of FMR LLC or an affili-ated company. © 2018 FMR LLC. All rights reserved.
This report and the financial statements contained herein are submitted for the general information of the holders of units of the Portfolios. This report is not authorized for distribution to prospective participants in the Portfolios unless preceded or accompanied by a current Fact Kit.
Portfolio units are not deposits or obligations of, or guaranteed by, any depository institution. Units are not insured by the FDIC, Federal Reserve Board or any other agency, and are subject to investment risks, including possible loss of principal amount invested.
Although the underlying deposits are eligible for FDIC insurance, subject to applicable federal deposit insurance limits, the Units of the Bank Deposit Portfolio are not insured or guaranteed by the FDIC or any other government agency. You are responsible for monitoring the total amount of your assets on deposit at the depository bank, including amounts held directly at the depository bank. All such deposits held in the same ownership capacity at the depository bank are subject to aggregation and to the current FDIC insurance coverage limitation of $250,000. Please see a 529 Fact Kit for more details.
Neither the Portfolios, the mutual funds in which they invest, nor Fidelity Distributors Corporation is a bank.
For more information on any Fidelity fund, including charges and expenses, call 1-800-544-6666 for a free prospectus. For more information on the Delaware Plan, call 1-800-544-1655 for a free Fact Kit. Read it carefully before you invest or send money.

5 Annual Report
Chairman’s Message to Participants
Dear Participant:On behalf of the State of Delaware and the Plans Management Board, we are pleased to provide you with your Delaware College Investment Plan (the “Delaware Plan”) Annual Report as of December 31, 2017. The Annual Report is designed to provide you with an opportunity to review the Delaware Plan in depth, including the performance of the Portfolios, along with expense, holdings, asset alloca-tion and investment strategy information. Additionally, the Managers’ Overview, a discussion with Co-Portfolio Managers Andrew Dierdorf and Bret Sumsion, provides Delaware Plan Participants with insight into the Portfolios’ performance, the markets over the past year and an outlook for the months ahead.
As the mutual fund market continues to evolve, less-expensive share classes have become more broadly available across fund companies. As a reminder, the Delaware Plan made some contractual changes in 2016 affecting Multi-Firm Portfolios, which were launched in 2011 to provide Plan Participants with options that included fund families beyond Fidelity. The changes allow Strategic Advisers, Inc. (SAI), Fidelity’s registered investment adviser that works closely with the co-managers to make fund selection decisions affecting Multi-Firm Portfolios’ underlying investments, to leverage a broader array of mutual funds, including those that have lower expense ratios. The changes have resulted in reduced expenses paid by Plan participants, building on the substantial reduction in total asset-based fees for Fidelity Index Portfolios announced previously.
We also remind Plan Participants of the December 2016 launch of age-based Portfolio 2036, available across Fidelity Funds, Multi-Firm and Fidelity Index platforms and intended primarily for beneficiaries with a birth year of 2017 to 2019. At about the same time, Portfolio 2015 was, by design, merged with the College Portfolio.
We are pleased to offer our Delaware Plan Participants a diverse selection of investments to help achieve their college savings goals. The Delaware Plan includes age-based and static Portfolios that are invested in Fidelity mutual funds, as well as age-based Multi-Firm Portfolios that invest in mutual funds from a broad universe of investment companies. In addition, the Delaware Plan offers Index Portfolios that are invested in Fidelity index funds.
As you consider your investment options, you can also take comfort that earnings on your Delaware Plan investments will grow tax-deferred and that withdrawals for qualified education expenses will be free from federal income tax and Delaware personal income tax. We encourage you to call Fidelity’s dedicated college planning representatives at 1-800-544-1655 for a personalized review of your Delaware Plan account to help determine whether your investments are appropriately allocated based on your specific college savings goals.
Thank you for choosing the Delaware College Investment Plan. We look forward to serving your needs for years to come.
Sincerely,
Kenneth A. Simpler, State Treasurer
Sincerely,
Stephen Saville, Chair, College Investment Committee

6Annual Report
Independent Auditor’s Report
To the Plans Management Board, Trustee of Delaware Qualified Tuition Savings Plan Trust, and the Participants of the Delaware College Investment Plan Dover, Delaware
Report on the Financial StatementsWe have audited the accompanying financial statements of the 36 investment portfolios listed below (collectively the “Portfolios”) of the Delaware College Investment Plan (Plan), which comprise the statements of assets and liabilities, including schedules of investments as of December 31, 2017, the related statements of operations and changes in net assets for the year then ended, the financial highlights for the year then ended, and the related notes to the financial statements.
Delaware College Portfolio (Fidelity Funds) Delaware Portfolio 2033 (Fidelity Index)Delaware Portfolio 2018 (Fidelity Funds) Delaware Portfolio 2036 (Fidelity Index)Delaware Portfolio 2021 (Fidelity Funds) Delaware Conservative Portfolio (Fidelity Index)Delaware Portfolio 2024 (Fidelity Funds) Delaware Moderate Growth Portfolio (Fidelity Index)Delaware Portfolio 2027 (Fidelity Funds) Delaware Aggressive Growth Portfolio (Fidelity Index)Delaware Portfolio 2030 (Fidelity Funds) Delaware Intermediate Treasury Index PortfolioDelaware Portfolio 2033 (Fidelity Funds) Delaware International Index PortfolioDelaware Portfolio 2036 (Fidelity Funds) Delaware Fidelity® 500 Index PortfolioDelaware Conservative Portfolio (Fidelity Funds) Delaware Total Market Index PortfolioDelaware Moderate Growth Portfolio (Fidelity Funds) Delaware Bank Deposit PortfolioDelaware Aggressive Growth Portfolio (Fidelity Funds) Delaware College Portfolio (Multi-Firm)Delaware Money Market Portfolio Delaware Portfolio 2018 (Multi-Firm)Delaware College Portfolio (Fidelity Index) Delaware Portfolio 2021 (Multi-Firm)Delaware Portfolio 2018 (Fidelity Index) Delaware Portfolio 2024 (Multi-Firm)Delaware Portfolio 2021 (Fidelity Index) Delaware Portfolio 2027 (Multi-Firm)Delaware Portfolio 2024 (Fidelity Index) Delaware Portfolio 2030 (Multi-Firm)Delaware Portfolio 2027 (Fidelity Index) Delaware Portfolio 2033 (Multi-Firm)Delaware Portfolio 2030 (Fidelity Index) Delaware Portfolio 2036 (Multi-Firm)
Management’s Responsibility for the Financial StatementsManagement is responsible for the preparation and fair presentation of these financial statements and financial highlights in accordance with accounting principles generally accepted in the United States of America; this includes the design, implementation, and maintenance of internal control relevant to the preparation and fair presentation of financial statements and financial highlights that are free from material misstate-ment, whether due to fraud or error.
Auditor’s ResponsibilityOur responsibility is to express opinions on these financial statements and financial highlights based on our audits. We conducted our audits in accordance with auditing standards generally accepted in the United States of America and the standards applicable to financial audits contained in Government Auditing Standards, issued by the Comptroller General of the United States. Those standards require that we plan and perform the audits to obtain reasonable assurance about whether the financial statements and financial highlights are free from material misstatement.
An audit involves performing procedures to obtain audit evidence about the amounts and disclosures in the financial statements. The procedures selected depend on the auditor’s judgment, including the assessment of the risks of material misstatement of the financial statements, whether due to fraud or error. In making those risk assessments, the auditor considers internal control relevant to the entity’s preparation and fair presentation of the financial statements in order to design audit procedures that are appropriate in the circumstances, but not for the purpose of expressing an opinion on the effectiveness of the entity’s internal control. Accordingly, we express no such opinion. An audit also includes evaluating the appropriateness of accounting policies used and the reasonableness of significant accounting estimates made by management, as well as evaluating the overall presentation of the financial statements.

7 Annual Report
Independent Auditor’s Report – continued
We believe that the audit evidence we have obtained is sufficient and appropriate to provide a basis for our audit opinions.
OpinionsIn our opinion, the financial statements and financial highlights referred to above present fairly, in all material respects, the financial position of each of the Portfolios constituting the Delaware College Investment Plan as of December 31, 2017, and the results of their operations and the changes in their net assets for the year then ended, and the financial highlights for the year then ended in accordance with accounting principles generally accepted in the United States of America.
Other MattersThe financial statements of the Portfolios as of December 31, 2016 and financial highlights for the years ended December 31, 2016, 2015, 2014 and 2013 were audited by other auditors whose report dated April 10, 2017 expressed unmodified opinions on those statements.
The Performance: The Bottom Line, Market Recap, and Fund Talk: The Managers’ Overview have not been subjected to the auditing procedures applied in the audit of the basic financial statements and financial highlights, and accordingly, we do not express an opinion or provide any assur-ance on it.
Other Reporting Required by Government Auditing StandardsIn accordance with Government Auditing Standards, we have also issued our report dated April 10, 2018 on our consideration of the Portfolios’ internal control over financial reporting and on our tests of their compliance with certain provisions of laws, regulations, contracts, and agree-ments and other matters. The purpose of that report is to describe the scope of our testing of internal control over financial reporting and compli-ance and the results of that testing, and not to provide opinions on internal control over financial reporting or on compliance. That report is an integral part of an audit performed in accordance with Government Auditing Standards in consideration of the Portfolios’ internal control over financial reporting and compliance.
Very truly yours,
April 10, 2018 Wilmington, Delaware

8Annual Report
Understanding PerformanceHow a portfolio did yesterday is no guarantee of how it will do tomorrow. The stock market, for example, has a history of long-term growth and short-term volatility. In turn, the unit price and return of a portfolio that invests in stocks will vary. That means if you sell your units during a market downturn, you might lose money. But if you can ride out the market’s ups and downs, you may have a gain.
Delaware College Portfolio (Fidelity Funds)
Performance – The Bottom Line (Unaudited)Average annual total returns take the Portfolio’s cumulative return, located on the Fidelity.com web site, and show you what would have happened if the Portfolio had performed at a constant rate each year.
Average Annual Total ReturnsPeriods ended December 31, 2017 Past 1
yearPast 5 years
Past 10 years
Delaware College Portfolio (Fidelity Funds) 7.50% 3.70% 3.43%Delaware College Portfolio Composite
Index 6.37% 3.55% 3.23%
$10,000 Over 10 Years
Period Ending Values $14,013 Delaware College Portfolio (Fidelity Funds) $13,741 Delaware College Portfolio Composite Index
Past 10 Years: Let’s say hypothetically that $10,000 was invested in Delaware College Portfolio (Fidelity Funds) on December 31, 2007 (past ten year period).
The chart shows how the value of that investment would have changed, and also shows how the Delaware College Portfolio Composite Index performed over the same period.
Delaware Portfolio 2018 (Fidelity Funds)
Performance – The Bottom Line (Unaudited)Average annual total returns take the Portfolio’s cumulative return, located on the Fidelity.com web site, and show you what would have happened if the Portfolio had performed at a constant rate each year.
Average Annual Total ReturnsPeriods ended December 31, 2017 Past 1
yearPast 5 years
Past 10 years
Delaware Portfolio 2018 (Fidelity Funds) 8.73% 5.69% 3.53%Delaware Portfolio 2018 Composite Index 7.36% 5.41% 3.79%
$10,000 Over 10 Years
Period Ending Values $14,141 Delaware Portfolio 2018 (Fidelity Funds) $14,511 Delaware Portfolio 2018 Composite Index
Past 10 Years: Let’s say hypothetically that $10,000 was invested in Delaware Portfolio 2018 (Fidelity Funds) on December 31, 2007 (past ten year period).
The chart shows how the value of that investment would have changed, and also shows how the Delaware Portfolio 2018 Composite Index performed over the same period.
9 Annual Report
Understanding PerformanceHow a portfolio did yesterday is no guarantee of how it will do tomorrow. The stock market, for example, has a history of long-term growth and short-term volatility. In turn, the unit price and return of a portfolio that invests in stocks will vary. That means if you sell your units during a market downturn, you might lose money. But if you can ride out the market’s ups and downs, you may have a gain.
Delaware Portfolio 2021 (Fidelity Funds)
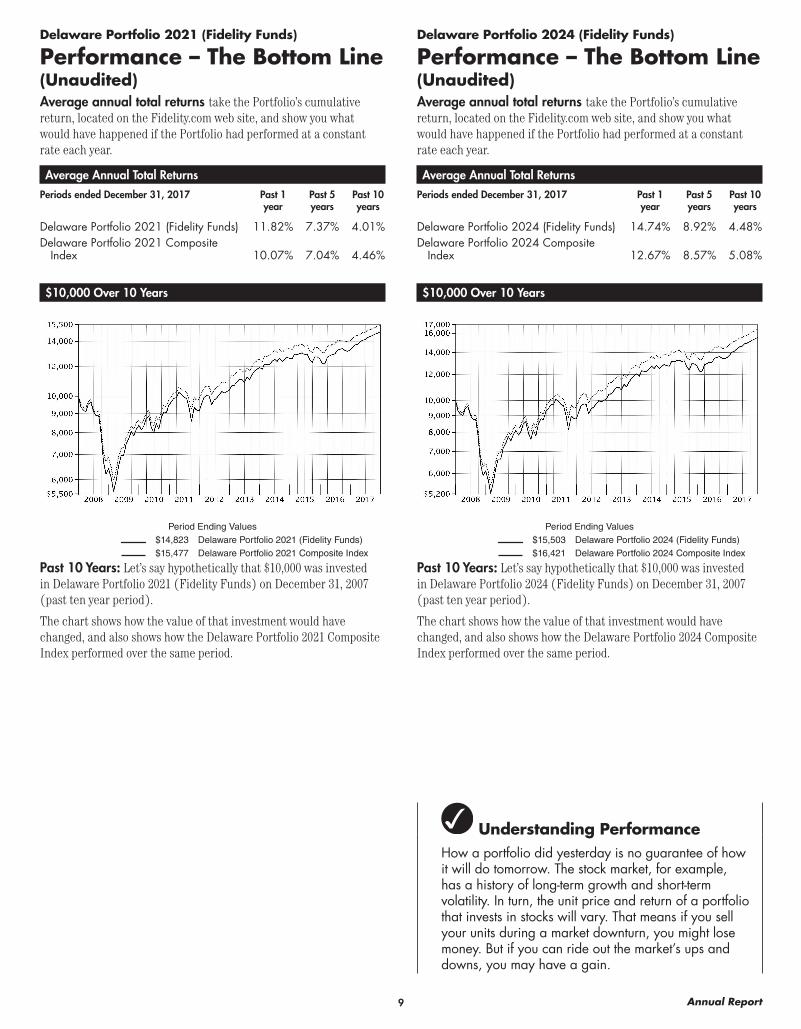
Performance – The Bottom Line (Unaudited)Average annual total returns take the Portfolio’s cumulative return, located on the Fidelity.com web site, and show you what would have happened if the Portfolio had performed at a constant rate each year.
Average Annual Total ReturnsPeriods ended December 31, 2017 Past 1
yearPast 5 years
Past 10 years
Delaware Portfolio 2021 (Fidelity Funds) 11.82% 7.37% 4.01%Delaware Portfolio 2021 Composite
Index 10.07% 7.04% 4.46%
$10,000 Over 10 Years
Period Ending Values $14,823 Delaware Portfolio 2021 (Fidelity Funds) $15,477 Delaware Portfolio 2021 Composite Index
Past 10 Years: Let’s say hypothetically that $10,000 was invested in Delaware Portfolio 2021 (Fidelity Funds) on December 31, 2007 (past ten year period).
The chart shows how the value of that investment would have changed, and also shows how the Delaware Portfolio 2021 Composite Index performed over the same period.
Delaware Portfolio 2024 (Fidelity Funds)
Performance – The Bottom Line (Unaudited)Average annual total returns take the Portfolio’s cumulative return, located on the Fidelity.com web site, and show you what would have happened if the Portfolio had performed at a constant rate each year.
Average Annual Total ReturnsPeriods ended December 31, 2017 Past 1
yearPast 5 years
Past 10 years
Delaware Portfolio 2024 (Fidelity Funds) 14.74% 8.92% 4.48%Delaware Portfolio 2024 Composite
Index 12.67% 8.57% 5.08%
$10,000 Over 10 Years
Period Ending Values $15,503 Delaware Portfolio 2024 (Fidelity Funds) $16,421 Delaware Portfolio 2024 Composite Index
Past 10 Years: Let’s say hypothetically that $10,000 was invested in Delaware Portfolio 2024 (Fidelity Funds) on December 31, 2007 (past ten year period).
The chart shows how the value of that investment would have changed, and also shows how the Delaware Portfolio 2024 Composite Index performed over the same period.

10Annual Report
Understanding PerformanceHow a portfolio did yesterday is no guarantee of how it will do tomorrow. The stock market, for example, has a history of long-term growth and short-term volatility. In turn, the unit price and return of a portfolio that invests in stocks will vary. That means if you sell your units during a market downturn, you might lose money. But if you can ride out the market’s ups and downs, you may have a gain.
Delaware Portfolio 2027 (Fidelity Funds)
Performance – The Bottom Line (Unaudited)Average annual total returns take the Portfolio’s cumulative return, located on the Fidelity.com web site, and show you what would have happened if the Portfolio had performed at a constant rate each year.
Average Annual Total ReturnsPeriods ended December 31, 2017 Past 1
yearPast 5 years
Past 10 years
Delaware Portfolio 2027 (Fidelity Funds) 17.60% 10.32% 5.12%Delaware Portfolio 2027 Composite
Index 15.27% 9.97% 5.84%
$10,000 Over 10 Years
Period Ending Values $16,471 Delaware Portfolio 2027 (Fidelity Funds) $17,646 Delaware Portfolio 2027 Composite Index
Past 10 Years: Let’s say hypothetically that $10,000 was invested in Delaware Portfolio 2027 (Fidelity Funds) on December 31, 2007 (past ten year period).
The chart shows how the value of that investment would have changed, and also shows how the Delaware Portfolio 2027 Composite Index performed over the same period.
Delaware Portfolio 2030 (Fidelity Funds)
Performance – The Bottom Line (Unaudited)Average annual total returns take the Portfolio’s cumulative return, located on the Fidelity.com web site, and show you what would have happened if the Portfolio had performed at a constant rate each year.
Average Annual Total ReturnsPeriods ended December 31, 2017 Past 1
yearPast 5 years Life of Portfolio
Delaware Portfolio 2030 (Fidelity Funds) 20.48% 11.39% 9.34%
Delaware Portfolio 2030 Composite Index 17.82% 11.01% 9.75%
$10,000 Over Life of Portfolio
Period Ending Values $18,710 Delaware Portfolio 2030 (Fidelity Funds) $19,210 Delaware Portfolio 2030 Composite Index
Life of Portfolio: Let’s say hypothetically that $10,000 was invested in Delaware Portfolio 2030 (Fidelity Funds) on December 28, 2010, when the Portfolio started.
The chart shows how the value of that investment would have changed, and also shows how the Delaware Portfolio 2030 Composite Index performed over the same period.

11 Annual Report
Understanding PerformanceHow a portfolio did yesterday is no guarantee of how it will do tomorrow. The stock market, for example, has a history of long-term growth and short-term volatility. In turn, the unit price and return of a portfolio that invests in stocks will vary. That means if you sell your units during a market downturn, you might lose money. But if you can ride out the market’s ups and downs, you may have a gain.
Delaware Portfolio 2033 (Fidelity Funds)
Performance – The Bottom Line (Unaudited)Average annual total returns take the Portfolio’s cumulative return, located on the Fidelity.com web site, and show you what would have happened if the Portfolio had performed at a constant rate each year.
Average Annual Total ReturnsPeriods ended December 31, 2017 Past 1
year Life of Portfolio
Delaware Portfolio 2033 (Fidelity Funds) 23.29% 9.45%Delaware Portfolio 2033 Composite Index 20.33% 9.30%
$10,000 Over Life of Portfolio
Period Ending Values $14,400 Delaware Portfolio 2033 (Fidelity Funds) $14,318 Delaware Portfolio 2033 Composite Index
Life of Portfolio: Let’s say hypothetically that $10,000 was invested in Delaware Portfolio 2033 (Fidelity Funds) on December 18, 2013, when the Portfolio started.
The chart shows how the value of that investment would have changed, and also shows how the Delaware Portfolio 2033 Composite Index performed over the same period.
Delaware Portfolio 2036 (Fidelity Funds)
Performance – The Bottom Line (Unaudited)Average annual total returns take the Portfolio’s cumulative return, located on the Fidelity.com web site, and show you what would have happened if the Portfolio had performed at a constant rate each year.
Average Annual Total ReturnsPeriods ended December 31, 2017 Past 1
year Life of Portfolio
Delaware Portfolio 2036 (Fidelity Funds) 24.92% 23.58%Delaware Portfolio 2036 Composite Index 21.99% 20.34%
$10,000 Over Life of Portfolio
Period Ending Values $12,480 Delaware Portfolio 2036 (Fidelity Funds) $12,138 Delaware Portfolio 2036 Composite Index
Life of Portfolio: Let’s say hypothetically that $10,000 was invested in Delaware Portfolio 2036 (Fidelity Funds) on December 14, 2016, when the Portfolio started.
The chart shows how the value of that investment would have changed, and also shows how the Delaware Portfolio 2036 Composite Index performed over the same period.

12Annual Report
Understanding PerformanceHow a portfolio did yesterday is no guarantee of how it will do tomorrow. The stock market, for example, has a history of long-term growth and short-term volatility. In turn, the unit price and return of a portfolio that invests in stocks will vary. That means if you sell your units during a market downturn, you might lose money. But if you can ride out the market’s ups and downs, you may have a gain.
Delaware Conservative Portfolio (Fidelity Funds)
Performance – The Bottom Line (Unaudited)Average annual total returns take the Portfolio’s cumulative return, located on the Fidelity.com web site, and show you what would have happened if the Portfolio had performed at a constant rate each year.
Average Annual Total ReturnsPeriods ended December 31, 2017 Past 1
yearPast 5 years
Past 10 years
Delaware Conservative Portfolio (Fidelity Funds) 2.03% 1.14% 2.29%
Delaware Conservative Portfolio Composite Index 2.07% 1.12% 1.89%
$10,000 Over 10 Years
Period Ending Values $12,540 Delaware Conservative Portfolio (Fidelity Funds) $12,062 Delaware Conservative Portfolio Composite Index
Past 10 Years: Let’s say hypothetically that $10,000 was invested in Delaware Conservative Portfolio (Fidelity Funds) on December 31, 2007 (past ten year period).
The chart shows how the value of that investment would have changed, and also shows how the Delaware Conservative Portfolio Composite Index performed over the same period.
Delaware Moderate Growth Portfolio (Fidelity Funds)
Performance – The Bottom Line (Unaudited)Average annual total returns take the Portfolio’s cumulative return, located on the Fidelity.com web site, and show you what would have happened if the Portfolio had performed at a constant rate each year.
Average Annual Total ReturnsPeriods ended December 31, 2017 Past 1
yearPast 5 years
Past 10 years
Delaware Moderate Growth Portfolio (Fidelity Funds) 18.28% 9.92% 5.75%
Delaware Moderate Growth Portfolio Composite Index 16.88% 9.79% 6.31%
$10,000 Over 10 Years
Period Ending Values $17,484 Delaware Moderate Growth Portfolio (Fidelity Funds) $18,447 Delaware Moderate Growth Portfolio Composite Index
Past 10 Years: Let’s say hypothetically that $10,000 was invested in Delaware Moderate Growth Portfolio (Fidelity Funds) on December 31, 2007 (past ten year period).
The chart shows how the value of that investment would have changed, and also shows how the Delaware Moderate Growth Portfolio Composite Index performed over the same period.

13 Annual Report
Understanding PerformanceHow a portfolio did yesterday is no guarantee of how it will do tomorrow. The stock market, for example, has a history of long-term growth and short-term volatility. In turn, the unit price and return of a portfolio that invests in stocks will vary. That means if you sell your units during a market downturn, you might lose money. But if you can ride out the market’s ups and downs, you may have a gain.
Delaware Aggressive Growth Portfolio (Fidelity Funds)
Performance – The Bottom Line (Unaudited)Average annual total returns take the Portfolio’s cumulative return, located on the Fidelity.com web site, and show you what would have happened if the Portfolio had performed at a constant rate each year.
Average Annual Total ReturnsPeriods ended December 31, 2017 Past 1
yearPast 5 years
Past 10 years
Delaware Aggressive Growth Portfolio (Fidelity Funds) 24.78% 12.94% 5.75%
Delaware Aggressive Growth Portfolio Composite Index 23.04% 12.76% 6.63%
$10,000 Over 10 Years
Period Ending Values $17,486 Delaware Aggressive Growth Portfolio (Fidelity Funds) $19,004 Delaware Aggressive Growth Portfolio Composite Index
Past 10 Years: Let’s say hypothetically that $10,000 was invested in Delaware Aggressive Growth Portfolio (Fidelity Funds) on December 31, 2007 (past ten year period).
The chart shows how the value of that investment would have changed, and also shows how the Delaware Aggressive Growth Portfolio Composite Index performed over the same period.
Delaware Money Market Portfolio
Performance – The Bottom Line (Unaudited)Average annual total returns take the Portfolio’s cumulative return, located on the Fidelity.com web site, and show you what would have happened if the Portfolio had performed at a constant rate each year.
Average Annual Total ReturnsPeriods ended December 31, 2017 Past 1
yearPast 5 years
Past 10 years
Delaware Money Market Portfolio A 0.37% 0.07% 0.33%Bloomberg Barclays U.S. 3 Month
Treasury Bellwether Index 0.87% 0.28% 0.43%
A A portion of the Portfolio’s expenses were reimbursed by Fidelity. Absent re-imbursement, returns would have been lower.

14Annual Report
Understanding PerformanceHow a portfolio did yesterday is no guarantee of how it will do tomorrow. The stock market, for example, has a history of long-term growth and short-term volatility. In turn, the unit price and return of a portfolio that invests in stocks will vary. That means if you sell your units during a market downturn, you might lose money. But if you can ride out the market’s ups and downs, you may have a gain.
Delaware College Portfolio (Fidelity Index)
Performance – The Bottom Line (Unaudited)Average annual total returns take the Portfolio’s cumulative return, located on the Fidelity.com web site, and show you what would have happened if the Portfolio had performed at a constant rate each year.
Average Annual Total ReturnsPeriods ended December 31, 2017 Past 1
yearPast 5 years
Past 10 years
Delaware College Portfolio (Fidelity Index) 5.94% 3.13% 3.33%Delaware College Portfolio (Fidelity Index)
Composite Index 6.07% 3.33% 3.51%
$10,000 Over 10 Years
Period Ending Values $13,870 Delaware College Portfolio (Fidelity Index) $14,113 Delaware College Portfolio (Fidelity Index) Composite Index
Past 10 Years: Let’s say hypothetically that $10,000 was invested in Delaware College Portfolio (Fidelity Index) on December 31, 2007 (past ten year period).
The chart shows how the value of that investment would have changed, and also shows how the Delaware College Portfolio (Fidelity Index) Composite Index performed over the same period.
Delaware Portfolio 2018 (Fidelity Index)
Performance – The Bottom Line (Unaudited)Average annual total returns take the Portfolio’s cumulative return, located on the Fidelity.com web site, and show you what would have happened if the Portfolio had performed at a constant rate each year.
Average Annual Total ReturnsPeriods ended December 31, 2017 Past 1
yearPast 5 years
Past 10 years
Delaware Portfolio 2018 (Fidelity Index) 6.88% 4.96% 3.73%Delaware Portfolio 2018 (Fidelity Index)
Composite Index 7.03% 5.20% 3.98%
$10,000 Over 10 Years
Period Ending Values $14,423 Delaware Portfolio 2018 (Fidelity Index) $14,769 Delaware Portfolio 2018 (Fidelity Index) Composite Index
Past 10 Years: Let’s say hypothetically that $10,000 was invested in Delaware Portfolio 2018 (Fidelity Index) on December 31, 2007 (past ten year period).
The chart shows how the value of that investment would have changed, and also shows how the Delaware Portfolio 2018 (Fidelity Index) Composite Index performed over the same period.

15 Annual Report
Understanding PerformanceHow a portfolio did yesterday is no guarantee of how it will do tomorrow. The stock market, for example, has a history of long-term growth and short-term volatility. In turn, the unit price and return of a portfolio that invests in stocks will vary. That means if you sell your units during a market downturn, you might lose money. But if you can ride out the market’s ups and downs, you may have a gain.
Delaware Portfolio 2021 (Fidelity Index)
Performance – The Bottom Line (Unaudited)Average annual total returns take the Portfolio’s cumulative return, located on the Fidelity.com web site, and show you what would have happened if the Portfolio had performed at a constant rate each year.
Average Annual Total ReturnsPeriods ended December 31, 2017 Past 1
yearPast 5 years
Past 10 years
Delaware Portfolio 2021 (Fidelity Index) 9.57% 6.61% 4.31%Delaware Portfolio 2021 (Fidelity Index)
Composite Index 9.66% 6.86% 4.56%
$10,000 Over 10 Years
Period Ending Values $15,257 Delaware Portfolio 2021 (Fidelity Index) $15,614 Delaware Portfolio 2021 (Fidelity Index) Composite Index
Past 10 Years: Let’s say hypothetically that $10,000 was invested in Delaware Portfolio 2021 (Fidelity Index) on December 31, 2007 (past ten year period).
The chart shows how the value of that investment would have changed, and also shows how the Delaware Portfolio 2021 (Fidelity Index) Composite Index performed over the same period.
Delaware Portfolio 2024 (Fidelity Index)
Performance – The Bottom Line (Unaudited)Average annual total returns take the Portfolio’s cumulative return, located on the Fidelity.com web site, and show you what would have happened if the Portfolio had performed at a constant rate each year.
Average Annual Total ReturnsPeriods ended December 31, 2017 Past 1
yearPast 5 years
Past 10 years
Delaware Portfolio 2024 (Fidelity Index) 12.08% 8.16% 4.85%Delaware Portfolio 2024 (Fidelity Index)
Composite Index 12.16% 8.42% 5.11%
$10,000 Over 10 Years
Period Ending Values $16,060 Delaware Portfolio 2024 (Fidelity Index) $16,458 Delaware Portfolio 2024 (Fidelity Index) Composite Index
Past 10 Years: Let’s say hypothetically that $10,000 was invested in Delaware Portfolio 2024 (Fidelity Index) on December 31, 2007 (past ten year period).
The chart shows how the value of that investment would have changed, and also shows how the Delaware Portfolio 2024 (Fidelity Index) Composite Index performed over the same period.

16Annual Report
Understanding PerformanceHow a portfolio did yesterday is no guarantee of how it will do tomorrow. The stock market, for example, has a history of long-term growth and short-term volatility. In turn, the unit price and return of a portfolio that invests in stocks will vary. That means if you sell your units during a market downturn, you might lose money. But if you can ride out the market’s ups and downs, you may have a gain.
Delaware Portfolio 2027 (Fidelity Index)
Performance – The Bottom Line (Unaudited)Average annual total returns take the Portfolio’s cumulative return, located on the Fidelity.com web site, and show you what would have happened if the Portfolio had performed at a constant rate each year.
Average Annual Total ReturnsPeriods ended December 31, 2017 Past 1
yearPast 5 years
Past 10 years
Delaware Portfolio 2027 (Fidelity Index) 14.61% 9.52% 5.51%Delaware Portfolio 2027 (Fidelity Index)
Composite Index 14.66% 9.80% 5.75%
$10,000 Over 10 Years
Period Ending Values $17,094 Delaware Portfolio 2027 (Fidelity Index) $17,494 Delaware Portfolio 2027 (Fidelity Index) Composite Index
Past 10 Years: Let’s say hypothetically that $10,000 was invested in Delaware Portfolio 2027 (Fidelity Index) on December 31, 2007 (past 10 year period).
The chart shows how the value of that investment would have changed, and also shows how the Delaware Portfolio 2027 (Fidelity Index) Composite Index performed over the same period.
Delaware Portfolio 2030 (Fidelity Index)
Performance – The Bottom Line (Unaudited)Average annual total returns take the Portfolio’s cumulative return, located on the Fidelity.com web site, and show you what would have happened if the Portfolio had performed at a constant rate each year.
Average Annual Total ReturnsPeriods ended December 31, 2017 Past 1
yearPast 5 years Life of Portfolio
Delaware Portfolio 2030 (Fidelity Index) 17.07% 10.50% 9.53%
Delaware Portfolio 2030 (Fidelity Index) Composite Index 17.12% 10.76% 9.59%
$10,000 Over Life of Portfolio
Period Ending Values $18,930 Delaware Portfolio 2030 (Fidelity Index) $19,010 Delaware Portfolio 2030 (Fidelity Index) Composite Index
Life of Portfolio: Let’s say hypothetically that $10,000 was invested in Delaware Portfolio 2030 (Fidelity Index) on December 28, 2010, when the Portfolio started.
The chart shows how the value of that investment would have changed, and also shows how the Delaware Portfolio 2030 (Fidelity Index) Composite Index performed over the same period.

17 Annual Report
Understanding PerformanceHow a portfolio did yesterday is no guarantee of how it will do tomorrow. The stock market, for example, has a history of long-term growth and short-term volatility. In turn, the unit price and return of a portfolio that invests in stocks will vary. That means if you sell your units during a market downturn, you might lose money. But if you can ride out the market’s ups and downs, you may have a gain.
Delaware Portfolio 2033 (Fidelity Index)
Performance – The Bottom Line (Unaudited)Average annual total returns take the Portfolio’s cumulative return, located on the Fidelity.com web site, and show you what would have happened if the Portfolio had performed at a constant rate each year.
Average Annual Total ReturnsPeriods ended December 31, 2017 Past 1
year Life of Portfolio
Delaware Portfolio 2033 (Fidelity Index) 19.45% 8.57%Delaware Portfolio 2033 (Fidelity Index)
Composite Index 19.52% 8.79%
$10,000 Over Life of Portfolio
Period Ending Values $13,940 Delaware Portfolio 2033 (Fidelity Index) $14,054 Delaware Portfolio 2033 (Fidelity Index) Composite Index
Life of Portfolio: Let’s say hypothetically that $10,000 was invested in Delaware Portfolio 2033 (Fidelity Index) on December 18, 2013, when the Portfolio started.
The chart shows how the value of that investment would have changed, and also shows how the Delaware Portfolio 2033 (Fidelity Index) Composite Index performed over the same period.
Delaware Portfolio 2036 (Fidelity Index)
Performance – The Bottom Line (Unaudited)Average annual total returns take the Portfolio’s cumulative return, located on the Fidelity.com web site, and show you what would have happened if the Portfolio had performed at a constant rate each year.
Average Annual Total ReturnsPeriods ended December 31, 2017 Past 1
year Life of Portfolio
Delaware Portfolio 2036 (Fidelity Index) 21.04% 19.79%Delaware Portfolio 2036 (Fidelity Index)
Composite Index 21.12% 19.57%
$10,000 Over Life of Portfolio
Period Ending Values $12,080 Delaware Portfolio 2036 (Fidelity Index) $12,057 Delaware Portfolio 2036 (Fidelity Index) Composite Index
Life of Portfolio: Let’s say hypothetically that $10,000 was invested in Delaware Portfolio 2036 (Fidelity Index) on December 14, 2016, when the Portfolio started.
The chart shows how the value of that investment would have changed, and also shows how the Delaware Portfolio 2036 (Fidelity Index) Composite Index performed over the same period.
18Annual Report
Understanding PerformanceHow a portfolio did yesterday is no guarantee of how it will do tomorrow. The stock market, for example, has a history of long-term growth and short-term volatility. In turn, the unit price and return of a portfolio that invests in stocks will vary. That means if you sell your units during a market downturn, you might lose money. But if you can ride out the market’s ups and downs, you may have a gain.
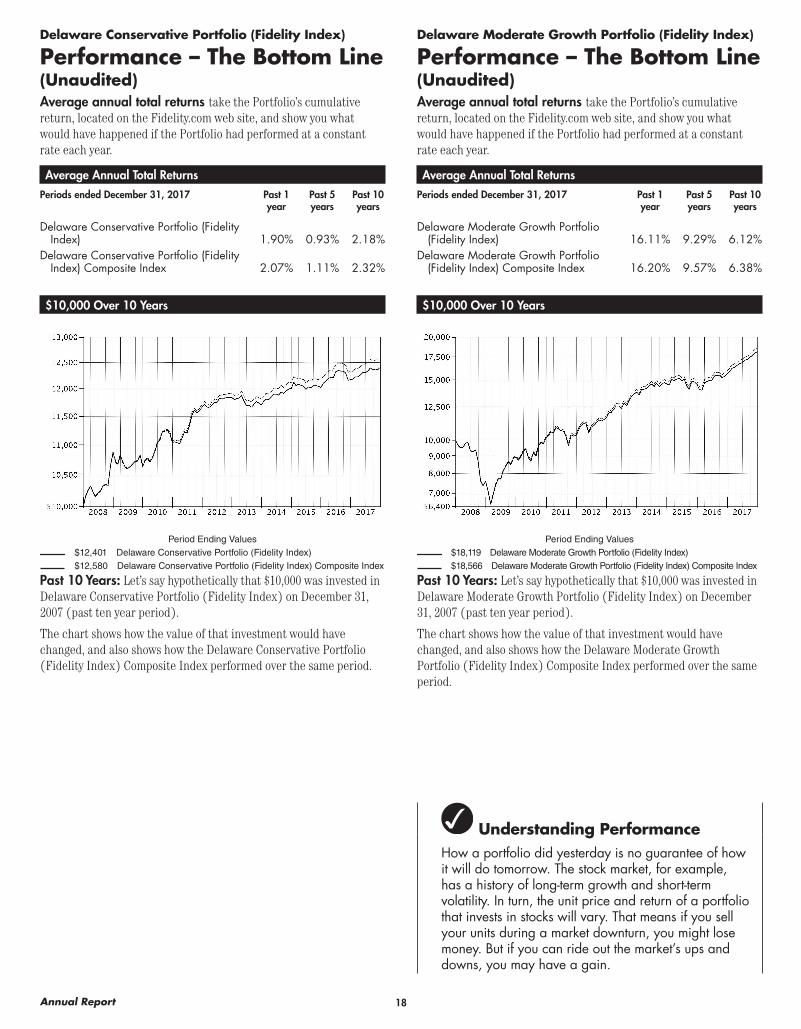
Delaware Conservative Portfolio (Fidelity Index)
Performance – The Bottom Line (Unaudited)Average annual total returns take the Portfolio’s cumulative return, located on the Fidelity.com web site, and show you what would have happened if the Portfolio had performed at a constant rate each year.
Average Annual Total ReturnsPeriods ended December 31, 2017 Past 1
yearPast 5 years
Past 10 years
Delaware Conservative Portfolio (Fidelity Index) 1.90% 0.93% 2.18%
Delaware Conservative Portfolio (Fidelity Index) Composite Index 2.07% 1.11% 2.32%
$10,000 Over 10 Years
Period Ending Values $12,401 Delaware Conservative Portfolio (Fidelity Index) $12,580 Delaware Conservative Portfolio (Fidelity Index) Composite Index
Past 10 Years: Let’s say hypothetically that $10,000 was invested in Delaware Conservative Portfolio (Fidelity Index) on December 31, 2007 (past ten year period).
The chart shows how the value of that investment would have changed, and also shows how the Delaware Conservative Portfolio (Fidelity Index) Composite Index performed over the same period.
Delaware Moderate Growth Portfolio (Fidelity Index)
Performance – The Bottom Line (Unaudited)Average annual total returns take the Portfolio’s cumulative return, located on the Fidelity.com web site, and show you what would have happened if the Portfolio had performed at a constant rate each year.
Average Annual Total ReturnsPeriods ended December 31, 2017 Past 1
yearPast 5 years
Past 10 years
Delaware Moderate Growth Portfolio (Fidelity Index) 16.11% 9.29% 6.12%
Delaware Moderate Growth Portfolio (Fidelity Index) Composite Index 16.20% 9.57% 6.38%
$10,000 Over 10 Years
Period Ending Values $18,119 Delaware Moderate Growth Portfolio (Fidelity Index) $18,566 Delaware Moderate Growth Portfolio (Fidelity Index) Composite Index
Past 10 Years: Let’s say hypothetically that $10,000 was invested in Delaware Moderate Growth Portfolio (Fidelity Index) on December 31, 2007 (past ten year period).
The chart shows how the value of that investment would have changed, and also shows how the Delaware Moderate Growth Portfolio (Fidelity Index) Composite Index performed over the same period.

19 Annual Report
Understanding PerformanceHow a portfolio did yesterday is no guarantee of how it will do tomorrow. The stock market, for example, has a history of long-term growth and short-term volatility. In turn, the unit price and return of a portfolio that invests in stocks will vary. That means if you sell your units during a market downturn, you might lose money. But if you can ride out the market’s ups and downs, you may have a gain.
Delaware Aggressive Growth Portfolio (Fidelity Index)
Performance – The Bottom Line (Unaudited)Average annual total returns take the Portfolio’s cumulative return, located on the Fidelity.com web site, and show you what would have happened if the Portfolio had performed at a constant rate each year.
Average Annual Total ReturnsPeriods ended December 31, 2017 Past 1
yearPast 5 years
Past 10 years
Delaware Aggressive Growth Portfolio (Fidelity Index) 22.04% 12.48% 6.39%
Delaware Aggressive Growth Portfolio (Fidelity Index) Composite Index 22.13% 12.75% 6.63%
$10,000 Over 10 Years
Period Ending Values $18,575 Delaware Aggressive Growth Portfolio (Fidelity Index) $19,007 Delaware Aggressive Growth Portfolio (Fidelity Index) Composite Index
Past 10 Years: Let’s say hypothetically that $10,000 was invested in Delaware Aggressive Growth Portfolio (Fidelity Index) on December 31, 2007 (past ten year period).
The chart shows how the value of that investment would have changed, and also shows how the Delaware Aggressive Growth Portfolio (Fidelity Index) Composite Index performed over the same period.
Delaware Intermediate Treasury Index Portfolio
Performance – The Bottom Line (Unaudited)Average annual total returns take the Portfolio’s cumulative return, located on the Fidelity.com web site, and show you what would have happened if the Portfolio had performed at a constant rate each year.
Average Annual Total ReturnsPeriods ended December 31, 2017 Past 1
yearPast 5 years
Past 10 years
Delaware Intermediate Treasury Index Portfolio 2.17% 1.10% 3.86%
Bloomberg Barclays U.S. 5-10 Year Treasury Bond Index 2.17% 1.32% 4.24%
$10,000 Over 10 Years
Period Ending Values $14,608 Delaware Intermediate Treasury Index Portfolio $15,141 Bloomberg Barclays U.S. 5-10 Year Treasury Bond Index
Past 10 Years: Let’s say hypothetically that $10,000 was invested in Delaware Intermediate Treasury Index Portfolio on December 31, 2007 (past ten year period).
The chart shows how the value of that investment would have changed, and also shows how the Bloomberg Barclays U.S. 5-10 Year Treasury Bond Index performed over the same period.

20Annual Report
Understanding PerformanceHow a portfolio did yesterday is no guarantee of how it will do tomorrow. The stock market, for example, has a history of long-term growth and short-term volatility. In turn, the unit price and return of a portfolio that invests in stocks will vary. That means if you sell your units during a market downturn, you might lose money. But if you can ride out the market’s ups and downs, you may have a gain.
Delaware International Index Portfolio
Performance – The Bottom Line (Unaudited)Average annual total returns take the Portfolio’s cumulative return, located on the Fidelity.com web site, and show you what would have happened if the Portfolio had performed at a constant rate each year.
Average Annual Total ReturnsPeriods ended December 31, 2017 Past 1
yearPast 5 years
Past 10 years
Delaware International Index Portfolio 25.29% 7.59% 1.87%MSCI EAFE Index 25.29% 8.07% 2.10%
$10,000 Over 10 Years
Period Ending Values $12,036 Delaware International Index Portfolio $12,309 MSCI EAFE Index
Past 10 Years: Let’s say hypothetically that $10,000 was invested in Delaware International Index Portfolio on December 31, 2007 (past ten year period).
The chart shows how the value of that investment would have changed, and also shows how the MSCI EAFE Index performed over the same period.
Delaware Fidelity® 500 Index Portfolio
Performance – The Bottom Line (Unaudited)Average annual total returns take the Portfolio’s cumulative return, located on the Fidelity.com web site, and show you what would have happened if the Portfolio had performed at a constant rate each year.
Average Annual Total ReturnsPeriods ended December 31, 2017 Past 1
yearPast 5 years
Past 10 years
Delaware Fidelity® 500 Index Portfolio 21.71% 15.60% 8.24%S&P 500® Index 21.83% 15.79% 8.50%
$10,000 Over 10 Years
Period Ending Values $22,064 Delaware Fidelity® 500 Index Portfolio $22,603 S&P 500® Index
Past 10 Years: Let’s say hypothetically that $10,000 was invested in Delaware Fidelity® 500 Index Portfolio on December 31, 2007 (past ten year period).
The chart shows how the value of that investment would have changed, and also shows how the S&P 500® Index performed over the same period.

21 Annual Report
Understanding PerformanceHow a portfolio did yesterday is no guarantee of how it will do tomorrow. The stock market, for example, has a history of long-term growth and short-term volatility. In turn, the unit price and return of a portfolio that invests in stocks will vary. That means if you sell your units during a market downturn, you might lose money. But if you can ride out the market’s ups and downs, you may have a gain.
Delaware Total Market Index Portfolio
Performance – The Bottom Line (Unaudited)Average annual total returns take the Portfolio’s cumulative return, located on the Fidelity.com web site, and show you what would have happened if the Portfolio had performed at a constant rate each year.
Average Annual Total ReturnsPeriods ended December 31, 2017 Past 1
yearPast 5 years
Past 10 years
Delaware Total Market Index Portfolio 21.06% 15.38% 8.42%Dow Jones U.S. Total Stock Market
IndexSM 21.16% 15.52% 8.66%
$10,000 Over 10 Years
Period Ending Values $22,445 Delaware Total Market Index Portfolio $22,948 Dow Jones U.S. Total Stock Market IndexSM
Past 10 Years: Let’s say hypothetically that $10,000 was invested in Delaware Total Market Index Portfolio on December 31, 2007 (past ten year period).
The chart shows how the value of that investment would have changed, and also shows how the Dow Jones U.S. Total Stock Market IndexSM performed over the same period.
Delaware Bank Deposit Portfolio
Performance – The Bottom Line (Unaudited)Average annual total returns take the Portfolio’s cumulative return, located on the Fidelity.com web site, and show you what would have happened if the Portfolio had performed at a constant rate each year.
Average Annual Total ReturnsPeriods ended December 31, 2017 Past 1
yearPast 5 years Life of Portfolio
Delaware Bank Deposit Portfolio A 0.50% 0.24% 0.20%
A A portion of the Portfolio’s expenses were reimbursed by Fidelity. Absent re-imbursement, returns would have been lower.

22Annual Report
Understanding PerformanceHow a portfolio did yesterday is no guarantee of how it will do tomorrow. The stock market, for example, has a history of long-term growth and short-term volatility. In turn, the unit price and return of a portfolio that invests in stocks will vary. That means if you sell your units during a market downturn, you might lose money. But if you can ride out the market’s ups and downs, you may have a gain.
Delaware College Portfolio (Multi-Firm)
Performance – The Bottom Line (Unaudited)Average annual total returns take the Portfolio’s cumulative return, located on the Fidelity.com web site, and show you what would have happened if the Portfolio had performed at a constant rate each year.
Average Annual Total ReturnsPeriods ended December 31, 2017 Past 1
yearPast 5 years Life of Portfolio
Delaware College Portfolio (Multi-Firm) 7.71% 3.68% 4.28%
Delaware College Portfolio Composite Index 6.37% 3.55% 3.97%
$10,000 Over Life of Portfolio
Period Ending Values $13,000 Delaware College Portfolio (Multi-Firm) $12,759 Delaware College Portfolio Composite Index
Life of Portfolio: Let’s say hypothetically that $10,000 was invested in Delaware College Portfolio (Multi-Firm) on September 28, 2011, when the Portfolio started.
The chart shows how the value of that investment would have changed, and also shows how the Delaware College Portfolio Composite Index performed over the same period.
Delaware Portfolio 2018 (Multi-Firm)
Performance – The Bottom Line (Unaudited)Average annual total returns take the Portfolio’s cumulative return, located on the Fidelity.com web site, and show you what would have happened if the Portfolio had performed at a constant rate each year.
Average Annual Total ReturnsPeriods ended December 31, 2017 Past 1
yearPast 5 years Life of Portfolio
Delaware Portfolio 2018 (Multi-Firm) 8.83% 5.39% 6.72%Delaware Portfolio 2018 Composite
Index 7.36% 5.41% 6.64%
$10,000 Over Life of Portfolio
Period Ending Values $15,030 Delaware Portfolio 2018 (Multi-Firm) $14,957 Delaware Portfolio 2018 Composite Index
Life of Portfolio: Let’s say hypothetically that $10,000 was invested in Delaware Portfolio 2018 (Multi-Firm) on September 28, 2011, when the Portfolio started.
The chart shows how the value of that investment would have changed, and also shows how the Delaware Portfolio 2018 Composite Index performed over the same period.

23 Annual Report
Understanding PerformanceHow a portfolio did yesterday is no guarantee of how it will do tomorrow. The stock market, for example, has a history of long-term growth and short-term volatility. In turn, the unit price and return of a portfolio that invests in stocks will vary. That means if you sell your units during a market downturn, you might lose money. But if you can ride out the market’s ups and downs, you may have a gain.
Delaware Portfolio 2021 (Multi-Firm)
Performance – The Bottom Line (Unaudited)Average annual total returns take the Portfolio’s cumulative return, located on the Fidelity.com web site, and show you what would have happened if the Portfolio had performed at a constant rate each year.
Average Annual Total ReturnsPeriods ended December 31, 2017 Past 1
yearPast 5 years Life of Portfolio
Delaware Portfolio 2021 (Multi-Firm) 11.72% 6.96% 8.42%Delaware Portfolio 2021 Composite
Index 10.07% 7.04% 8.49%
$10,000 Over Life of Portfolio
Period Ending Values $16,590 Delaware Portfolio 2021 (Multi-Firm) $16,657 Delaware Portfolio 2021 Composite Index
Life of Portfolio: Let’s say hypothetically that $10,000 was invested in Delaware Portfolio 2021 (Multi-Firm) on September 28, 2011, when the Portfolio started.
The chart shows how the value of that investment would have changed, and also shows how the Delaware Portfolio 2021 Composite Index performed over the same period.
Delaware Portfolio 2024 (Multi-Firm)
Performance – The Bottom Line (Unaudited)Average annual total returns take the Portfolio’s cumulative return, located on the Fidelity.com web site, and show you what would have happened if the Portfolio had performed at a constant rate each year.
Average Annual Total ReturnsPeriods ended December 31, 2017 Past 1
yearPast 5 years Life of Portfolio
Delaware Portfolio 2024 (Multi-Firm) 14.42% 8.38% 9.93%Delaware Portfolio 2024 Composite
Index 12.67% 8.57% 10.17%
$10,000 Over Life of Portfolio
Period Ending Values $18,090 Delaware Portfolio 2024 (Multi-Firm) $18,343 Delaware Portfolio 2024 Composite Index
Life of Portfolio: Let’s say hypothetically that $10,000 was invested in Delaware Portfolio 2024 (Multi-Firm) on September 28, 2011, when the Portfolio started.
The chart shows how the value of that investment would have changed, and also shows how the Delaware Portfolio 2024 Composite Index performed over the same period.

24Annual Report
Understanding PerformanceHow a portfolio did yesterday is no guarantee of how it will do tomorrow. The stock market, for example, has a history of long-term growth and short-term volatility. In turn, the unit price and return of a portfolio that invests in stocks will vary. That means if you sell your units during a market downturn, you might lose money. But if you can ride out the market’s ups and downs, you may have a gain.
Delaware Portfolio 2027 (Multi-Firm)
Performance – The Bottom Line (Unaudited)Average annual total returns take the Portfolio’s cumulative return, located on the Fidelity.com web site, and show you what would have happened if the Portfolio had performed at a constant rate each year.
Average Annual Total ReturnsPeriods ended December 31, 2017 Past 1
yearPast 5 years Life of Portfolio
Delaware Portfolio 2027 (Multi-Firm) 17.12% 9.65% 11.19%Delaware Portfolio 2027 Composite
Index 15.27% 9.97% 11.64%
$10,000 Over Life of Portfolio
Period Ending Values $19,430 Delaware Portfolio 2027 (Multi-Firm) $19,930 Delaware Portfolio 2027 Composite Index
Life of Portfolio: Let’s say hypothetically that $10,000 was invested in Delaware Portfolio 2027 (Multi-Firm) on September 28, 2011, when the Portfolio started.
The chart shows how the value of that investment would have changed, and also shows how the Delaware Portfolio 2027 Composite Index performed over the same period.
Delaware Portfolio 2030 (Multi-Firm)
Performance – The Bottom Line (Unaudited)Average annual total returns take the Portfolio’s cumulative return, located on the Fidelity.com web site, and show you what would have happened if the Portfolio had performed at a constant rate each year.
Average Annual Total ReturnsPeriods ended December 31, 2017 Past 1
yearPast 5 years Life of Portfolio
Delaware Portfolio 2030 (Multi-Firm) 19.74% 10.62% 12.09%
Delaware Portfolio 2030 Composite Index 17.82% 11.01% 12.60%
$10,000 Over Life of Portfolio
Period Ending Values $20,440 Delaware Portfolio 2030 (Multi-Firm) $21,028 Delaware Portfolio 2030 Composite Index
Life of Portfolio: Let’s say hypothetically that $10,000 was invested in Delaware Portfolio 2030 (Multi-Firm) on September 28, 2011, when the Portfolio started.
The chart shows how the value of that investment would have changed, and also shows how the Delaware Portfolio 2030 Composite Index performed over the same period.

25 Annual Report
Understanding PerformanceHow a portfolio did yesterday is no guarantee of how it will do tomorrow. The stock market, for example, has a history of long-term growth and short-term volatility. In turn, the unit price and return of a portfolio that invests in stocks will vary. That means if you sell your units during a market downturn, you might lose money. But if you can ride out the market’s ups and downs, you may have a gain.
Delaware Portfolio 2033 (Multi-Firm)
Performance – The Bottom Line (Unaudited)Average annual total returns take the Portfolio’s cumulative return, located on the Fidelity.com web site, and show you what would have happened if the Portfolio had performed at a constant rate each year.
Average Annual Total ReturnsPeriods ended December 31, 2017 Past 1
year Life of Portfolio
Delaware Portfolio 2033 (Multi-Firm) 22.30% 8.77%Delaware Portfolio 2033 Composite Index 20.33% 9.30%
$10,000 Over Life of Portfolio
Period Ending Values $14,040 Delaware Portfolio 2033 (Multi-Firm) $14,318 Delaware Portfolio 2033 Composite Index
Life of Portfolio: Let’s say hypothetically that $10,000 was invested in Delaware Portfolio 2033 (Multi-Firm) on December 18, 2013, when the Portfolio started.
The chart shows how the value of that investment would have changed, and also shows how the Delaware Portfolio 2033 Composite Index performed over the same period.
Delaware Portfolio 2036 (Multi-Firm)
Performance – The Bottom Line (Unaudited)Average annual total returns take the Portfolio’s cumulative return, located on the Fidelity.com web site, and show you what would have happened if the Portfolio had performed at a constant rate each year.
Average Annual Total ReturnsPeriods ended December 31, 2017 Past 1
year Life of Portfolio
Delaware Portfolio 2036 (Multi-Firm) 24.10% 22.44%Delaware Portfolio 2036 Composite Index 21.99% 20.34%
$10,000 Over Life of Portfolio
Period Ending Values $12,360 Delaware Portfolio 2036 (Multi-Firm) $12,138 Delaware Portfolio 2036 Composite Index
Life of Portfolio: Let’s say hypothetically that $10,000 was invested in Delaware Portfolio 2036 (Multi-Firm) on December 14, 2016, when the Portfolio started.
The chart shows how the value of that investment would have changed, and also shows how the Delaware Portfolio 2036 Composite Index performed over the same period.

26Annual Report
Market Recap
For the 12 months ending December 31, 2017, U.S. equities gained 21.83%, as the S&P 500® index rose steadily to close the year just shy of an all-time high after a particularly strong three-month finish. Early on, equities rallied on optimism for President Trump’s pro-business agenda but leveled off in March amid fading optimism and stalled efforts by Congress to repeal and replace the Affordable Care Act. Upward momentum soon returned – and continued through year-end – with consumer sentiment and other market indicators remaining positive. The lone exception was a brief cooldown in August, when geopolitical tension escalated and uncertainty grew regarding the future of health care, tax reform and the debt ceiling.
Sector-wise in the S&P 500®, information technology (+39%) fared best by a wide margin amid strong earnings growth from several major index constituents. Materials (+24%) was helped by higher demand, especially from China, although industrials (+21%) modestly lagged. Consumer discretionary (+23%) outperformed despite online competition to brick-and-mortar retailers. Financials edged the broader market on an uptick in interest rates that, at the same time, held back real estate (+11%) and other “bond proxy” sectors such as consumer staples (+13%) and utilities (+12%). Defensive-oriented energy (-1%) and telecommunication services (-1%) marked the only sector-level declines. In the energy sector, oil prices lost ground in the first half of 2017 before rebounding through December 31 to end well above where they started 12 months ago. Commodities overall, as measured by the Bloomberg Commodity Index Total Return, returned 1.70% in 2017.
Outside the U.S., the MSCI ACWI (All Country World Index) ex USA Index gained 27.40% for the year, helped partly by a generally weak U.S. dollar. As with U.S. equity, growth stocks in non-U.S. equity markets outpaced value stocks, with the EM-equity differential especially large. Regionally, certain election results in continental Europe (+28%) suggested ebbing political uncertainty and near-term risk there, whereas the U.K. (+21%) faced more-mixed conditions ahead of its expected exit from the European Union. Japan (+24%), despite central-bank easing and recent pressure from regional yen strength, lagged the rest of the Asia-Pacific group (+26%). Commodity-price volatility slowed Canada (+17%), but emerging markets (+36%) sped ahead. The overall rise in the price of crude oil helped Russia, Brazil and other economies dependent on oil revenue. Meanwhile, industrial metals such as copper, nickel and aluminum were sharply higher this year, helping EM countries that produce those commodities.
Turning to fixed income, the Bloomberg Barclays U.S. Aggregate Bond Index gained 3.54% for the year. Within the Bloomberg Barclays index, investment-grade corporate credit led all major market segments, up 6.42%. U.S. Treasuries returned 2.31%, outperforming most sovereign bonds. Securitized sectors, with the exception of asset-backed securities, finished slightly ahead of Treasuries. Outside the index, riskier, non-core fixed-income segments led the broader market. For example, U.S. corporate high-yield bonds gained 7.48% in 2017, as measured by ICE BofAMLUS High Yield Constrained Index. The J.P. Morgan Emerging Markets Bond Index Global surged even higher – up 9.32% for the year. Meanwhile, Treasury Inflation-Protected Securities (TIPS) returned 3.01%, according to Bloomberg Barclays.

27 Annual Report
Fund Talk: The Managers’ Overview
Andrew Dierdorf (left) and Brett Sumsion, Co-Portfolio Managers of the Delaware College Investment Plan
Q. Brett, how did the age-based Portfolios perform in 2017?A. Each of the actively managed age-based Fidelity Funds and Multi-Firm Portfolios delivered positive absolute and benchmark-relative results in 2017; longer-term performance comparisons also are favorable. Gains ranged from about 8% for each platform’s College Portfolio up to about 24% to 25% for Portfolio 2036. In addition, each outperformed its respective Composite benchmark by about 1 to 3 percentage points, depending on strategy and vintage. Active management of asset class exposures – and within underlying invest-ments – contributed to outperformance for the year. Meanwhile, corresponding Fidelity Index Portfolio results ranged from about 6% to 21%. (For specific results for Fidelity Funds Portfolios, Multi-Firm Portfolios and Fidelity Index Portfolios please refer to the perfor-mance section of this report.)
Q. Please give us an overview of equity markets for the year.A. For the 12 months ending December 31, 2017, the bellwether S&P 500 U.S. equity index returned 21.83%, buoyed in particular by infor-mation technology stocks, although many other sectors posted strong gains as well. In a stark reversal from 2016, growth-oriented stocks in the United States far outpaced their value counterparts across the market-capitalization spectrum. Also, larger-caps outperformed smaller-cap stocks. Foreign stocks pushed even higher, especially in emerging markets (EM). Here again, growth outpaced value seg-ments, with the EM-equity style disparity especially wide.
Q. And how about bond markets?A. U.S. investment-grade debt, as measured by the Bloomberg Barclays U.S. Aggregate Bond Index, gained 3.54% in 2017. The asset class spent the majority of the year in recovery mode from its steep post-election sell-off in late 2016. Longer-term bond yields declined through early September – despite two hikes in target rates – as it became clear that changes to tax, health care and fiscal policies proposed by the Trump administration would take time to develop and implement. Yields then ticked higher in October amid efforts by the Federal Reserve to gradually reduce its balance sheet. Yields also were influenced by economic strength, leading to a policy-rate hike in December, and were further affected by tax reform passed by Congress late in 2017 that boosted expectations for near-term economic growth and reinforced the rate-hike cycle.
Outside of the Bloomberg Barclays index, riskier, non-core fixed-income segments – helped by a resurgence in investors’ appetite for risk – led the broader bond market. For example, U.S. high-yield debt returned about 7%, according to Bloomberg Barclays. EM bonds went even higher, up about 9% for the year. Meanwhile, amid mixed signals, inflation-protected debt gained about 3%.
Q. Andrew, what influenced age-based Fidelity Funds Portfolios’ relative results?A. Versus Composites, top-down asset allocation decisions con-tributed to the Portfolios’ outperformance, most notably choices regarding the EM equity and investment-grade debt asset classes. Given that non-U.S. equities – particularly in emerging markets – outperformed U.S. stocks, our overall equity strategy of overweighting foreign developed-markets (DM) stocks – and, more so, EM equity – delivered relative value. Conversely, given volatility in the energy sector, Portfolio exposure to the commodities asset class (+2%) detracted for the year; nevertheless, we believe it’s important to maintain diversification and inflation protection within the Portfolios.
Similarly, underweighting core investment-grade debt to fund alloca-tions to out-of-Composite fixed-income asset classes also helped overall. With the exception of inflation-protected debt, all of the Portfolios’ fixed-income diversifiers outperformed the 3.54% result of the Bloomberg Barclays U.S. Aggregate Bond Index. In many cases, allocations were small – and thus exerted modest influence individu-ally – but collectively these exposures provided diversification from an asset allocation perspective.
Results among underlying investments contributed even more to the Portfolios’ relative results. In aggregate, our U.S. equity investments outperformed the asset class. Highlights include Fidelity® Growth Company Fund (+37%) – one of our largest U.S. equity investments – which led its specific benchmark by about 7 percentage points. Conversely, certain value-oriented and smaller-cap investments detracted modestly. That said, Fidelity® Mega Cap Stock Fund (+18%) lagged its specific benchmark by 5 percentage points and ranked as our largest detractor.
The contribution from non-U.S. equity investments was notable as well. In DM equity, Fidelity Overseas Fund (+30%) finished about 4 percentage points ahead of its specific benchmark; Fidelity Emerging Markets Fund (+48%) outperformed by 10 percentage points.
On the debt side, both Fidelity Investment Grade Bond Fund (+3.9%) and Fidelity Total Bond Fund (+4.2%) led the core fixed-income asset class. Both portfolio management teams seek to add value via sector positioning and security selection while managing risk by keeping duration roughly in line with that of the Bloomberg Barclays index.
Q. How about Multi-Firm Portfolios?A. We observed similar comparisons among Multi-Firm Portfolios. Allocation added value while underlying investments, selected by a team of specialists within Strategic Advisers, Inc. (SAI) contributed even more. We work closely with SAI portfolio managers Wilfred Chilangwa, Gregory Pappas, Lawrence Rakers and John Stone in the selection process for mutual funds to be used within Multi-Firm Portfolios. In the U.S. equity sleeve, Fidelity Growth Company Fund

28Annual Report
Fund Talk: The Managers’ Overview – continued
again stood out, as did Loomis Sayles Growth Fund (+33%), which aims for a “long-term private equity-oriented approach” by “part-nering” with company management teams that “think and act like owners.” JPMorgan Small Cap Equity Fund (+16%) also outper-formed its specific benchmark.
In non-U.S. equity, T. Rowe Price Emerging Markets Stock Fund (+43%) led its EM benchmark by about 6 percentage points. In the foreign DM equity category, MFS International Value Fund (+27%), which “seeks an advantage by evaluating the long-term quality, sustainability, improvement potential and intrinsic value of busi-nesses,” helped most, followed by William Blair International Growth Fund (+29%). Elsewhere, I’ll note that PIMCO CommoditiesPLUS® Strategy Fund (+11%), an enhanced-index approach employing tacti-cal strategies based on relative value and structural opportunities across the commodities complex, outperformed the commodity asset class’s result by a wide margin.
In fixed income, most underlying investments contributed, Prudential Total Return Bond Fund (+6.6%) and Western Asset Core Bond Fund (+5.1%) chief among them. In addition to pluses from other fixed-income segments, the roughly 8% advance logged by Hotchkis & Wiley High Yield Fund bears mention.
Q. And the Fidelity Index Portfolios?A. Returns were roughly in line with respective Composites, as we would expect for Portfolios designed to track indexes corresponding to each of five underlying components: U.S. and non-U.S. equity, com-modities, and investment-grade and short-term debt.
Q. What is your outlook as of December 31?A. Our philosophy is that, over the long term, financial markets are largely efficient, and fundamentals drive markets and security prices. We also believe that prices of financial assets can diverge from underlying fair value in the short term due to such factors as overreaction, changes in regimes and cycles, and liquidity preference, among others.
As of December 31, our view is constructive with regard to the global macroeconomic environment, moderated by the risks of near-peak profit margins in the U.S. and the potential consequences of evolv-ing global monetary policies. Equity positioning within the Portfolios emphasizes emerging markets, based on improving fundamentals and stronger growth prospects than developed-market economies. In our view, EM equities remain favorably valued and less exposed to late-cycle risks relative to U.S. equites.
Yields on Treasury bonds are at or near historic lows, and we believe the distribution of potential outcomes supports an underweighting here. Tighter spreads have reduced the margin of safety in credit. Lastly, inflation-sensitive assets are attractively valued, in our opin-ion, and sentiment is bearish following a long period of low inflation. As late-cycle pressures build in developed economies against the backdrop of accommodative monetary and fiscal policy, we think market participants may be mispricing the potential for inflation.
During the year, we reduced the Portfolios’ underweighting in the core bond asset class and increased our underweighting in U.S. equities. We shifted from a roughly neutral stance to a modest
overweighting in foreign DM equity and reduced our overweighting in EM equity. Given our outlook, we also raised exposure to inflation-protected and commodity securities.
Portfolio Facts
Goals: Age-based Portfolios (Fidelity Funds, Fidelity Index, Multi-Firm) seek capital appreciation with reasonable safety of principal, consistent with the ages of the benefi-ciaries for whom each is designed. Each static Portfolio (Fidelity Funds, Fidelity Index) has its own investment objective; target allocations do not change over time: Conservative Portfolios seek preservation of capital by allocating assets among bond and money market funds, with income a secondary objective; Moderate Growth Portfolios seek to maximize total return over the longer term by allocating assets among stock and bond mutual funds; Aggressive Growth Portfolios seek long-term growth of capital. Each individual-fund Portfolio has the same investment objective as the underlying mutual fund in which it invests. Bank Deposit Portfolio seeks preservation of principal.
Start dates: Fidelity Funds Portfolios (age-based, static and individual) started on July 1, 1998, except Portfolio 2018 (January 4, 1999); Moderate Growth Portfolio (May 10, 2001); Aggressive Growth Portfolio (May 7, 2001); Portfolio 2021 and Conservative Portfolio (December 13, 2001); Portfolio 2024 (December 27, 2004); Portfolio 2027 (December 14, 2007); Portfolio 2030 (December 28, 2010); Portfolio 2033 (December 18, 2013); and Portfolio 2036 (December 14, 2016). Money Market Portfolio started on November 6, 2006; Bank Deposit Portfolio, on September 16, 2010.
Fidelity Index Portfolios (age-based, static and individual) started on November 6, 2006, except Portfolio 2027 (December 14, 2007); Portfolio 2030 (December 28, 2010); Portfolio 2033 (December 18, 2013); and Portfolio 2036 (December 14, 2016).
Multi-Firm Portfolios started September 28, 2011, except Portfolio 2033 (December 18, 2013) and Portfolio 2036 (December 14, 2016).
Co-Managers: Andrew Dierdorf, since 2007; joined Fidelity in 2004; Brett Sumsion, since 2014; joined Fidelity in 2014.

29 Annual Report
Fund Talk: The Managers’ Overview – continued
Andrew Dierdorf on changes to the Portfolios:“With regard to the selection process for mutual funds used within Multi-Firm Portfolios, we work closely with SAI portfolio managers – Wilfred Chilangwa, Gregory Pappas, Lawrence Rakers and John Stone – and made several changes among Multi-Firm Portfolios’ underlying investments just prior to the start of reporting period. In November 2016, T. Rowe Price Emerging Markets Stock Fund replaced Oppenheimer Developing Markets Fund. In February 2017, a position was established in T. Rowe Price Overseas Stock Fund. Its manager seeks to own a range of ‘world class’ companies with what the manager considers strong prospects to compound returns over many years, relying on T. Rowe’s independent global research platform to uncover compel-ling opportunities.
“Additionally, the Delaware College Investment Plan made top-level contractual changes to permit all Portfolios to make use of a broader array of underlying investments. For example, holdings were shifted to lower-fee share classes where possible, which in turn lowered net fees for participants. The mutual fund market has changed over the past few years, and less-expensive share classes have become more broadly available across fund com-plexes, which made this move attractive.
“We are committed to ongoing excellence in our target-date strategies, providing shareholder-focused products supported by Fidelity’s deep capabilities and resources across all aspects of the investment process.
“The Delaware College Investment Plan delivers structured and disciplined Portfolios diversified across the major categories in global capital markets. We believe this diversified investment strategy can help mitigate short-term segment swings and smooth returns over time, and that it can offer an effective approach to college saving.”

30Annual Report
Delaware College Portfolio (Fidelity Funds)
Investment Summary
Top Holdings as of December 31, 2017% of Portfolio’s
net assetsFidelity Investment Grade Bond Fund 29.8Fidelity Investments Money Market Government Portfolio Institutional Class 19.2Fidelity Short-Term Bond Fund 9.1Fidelity Government Income Fund 8.2Fidelity Inflation-Protected Bond Fund 3.8Fidelity Emerging Markets Fund 3.0Fidelity Overseas Fund 2.7Fidelity Diversified International Fund 2.6Fidelity Corporate Bond Fund 2.4Fidelity Commodity Strategy Fund 2.1
82.9
Asset Allocation (% of Portfolio’s net assets)
U.S. Equity Funds 13.5%
Non – U.S. Equity Funds 8.5%
Bond Funds 49.7%
Short-Term Funds 28.3%

31 Annual Report
See accompanying notes which are an integral part of the financial statements.
U.S. Equity Funds – 13.5%Shares Value
Fidelity Blue Chip Growth Fund 9,604 $ 842,852Fidelity Commodity Strategy Fund 169,092 1,785,610Fidelity Contrafund 4,575 560,311Fidelity Growth Company Fund 6,819 1,218,146Fidelity Large Cap Stock Fund 26,833 897,846Fidelity Low-Priced Stock Fund 8,686 473,541Fidelity Mega Cap Stock Fund 37,872 660,103Fidelity Real Estate Income Fund 34,694 415,983Fidelity Real Estate Investment Portfolio 3,336 139,455Fidelity Stock Selector All Cap Fund 38,524 1,692,744Fidelity Stock Selector Large Cap Value
Fund 58,912 1,220,655Fidelity Stock Selector Small Cap Fund 17,742 469,449Fidelity Value Discovery Fund 42,238 1,221,948
TOTAL U.S. EQUITY FUNDS(Cost $10,239,363) 11,598,643
Non – U.S. Equity Funds – 8.5%
Fidelity Canada Fund 3,904 213,373Fidelity Diversified International Fund 57,121 2,285,982Fidelity Emerging Markets Fund 78,338 2,565,586Fidelity Overseas Fund 45,276 2,295,485
TOTAL NON – U.S. EQUITY FUNDS(Cost $5,777,102) 7,360,426
Bond Funds – 49.7%
Fidelity Corporate Bond Fund 175,332 2,046,120Fidelity Floating Rate High Income Fund 22,781 219,152Fidelity Government Income Fund 694,819 7,094,103Fidelity High Income Fund 146,879 1,316,039Fidelity Inflation-Protected Bond Fund 273,294 3,265,864Fidelity Investment Grade Bond Fund 3,236,712 25,634,754Fidelity Mortgage Securities Fund 148,660 1,660,534Fidelity New Markets Income Fund 37,768 612,597Fidelity Total Bond Fund 86,805 923,604
TOTAL BOND FUNDS(Cost $42,413,732) 42,772,767
Delaware College Portfolio (Fidelity Funds)
Investments December 31, 2017Showing Percentage of Net Assets
Short-Term Funds – 28.3%Shares Value
Fidelity Investments Money Market Government Portfolio Institutional Class 1.19% (a) 16,521,169 $ 16,521,169
Fidelity Short-Term Bond Fund 909,575 7,804,157
TOTAL SHORT-TERM FUNDS(Cost $24,338,220) 24,325,326
TOTAL INVESTMENT IN SECURITIES – 100.0%(Cost $82,768,417) 86,057,162
NET OTHER ASSETS (LIABILITIES) – 0.0% (15,103)
NET ASSETS – 100% $86,042,059
Legend(a) The rate quoted is the annualized seven-day yield of the fund at
period end.

32Annual Report
See accompanying notes which are an integral part of the financial statements.
Delaware College Portfolio (Fidelity Funds)
Financial Statements
Statement of Assets and Liabilities
December 31, 2017
AssetsInvestments in securities at value (cost
$82,768,417) $ 86,057,162Receivable for investments sold 178,847Receivable for units sold 72,049Distributions receivable 111,405
Total assets 86,419,463
LiabilitiesPayable for investments purchased $ 111,473Accrued management and administration
fees 15,063Payable for units redeemed 250,868
Total liabilities 377,404Net Assets $ 86,042,059
Net Asset Value, offering price and re-demption price per unit ($86,042,059 / 3,999,577 units) $ 21.51
Statement of Operations
Year ended December 31,
2017
Investment IncomeIncome distributions from underlying funds $ 1,474,603ExpensesManagement and administration fees $ 196,860
Total expenses 196,860
Net investment income (loss) 1,277,743Realized and Unrealized Gain (Loss) on
InvestmentsNet realized gain (loss) on sale of underly-
ing funds’ shares 1,813,708Capital gain distributions from underlying
funds 617,083 2,430,791Change in net unrealized appreciation
(depreciation) on underlying funds’ shares 3,486,681Net gain (loss) 5,917,472Net increase (decrease) in net assets result-
ing from operations $ 7,195,215

33 Annual Report
See accompanying notes which are an integral part of the financial statements.
Delaware College Portfolio (Fidelity Funds)Financial Statements – continued
Statement of Changes in Net Assets
Year ended December 31,
2017
Year ended December 31,
2016Increase (Decrease) in Net Assets:
OperationsNet investment income (loss) $ 1,277,743 $ 671,111Net realized gain (loss) 2,430,791 398,419Change in net unrealized appreciation (depreciation) 3,486,681 713,737Net increase (decrease) in net assets resulting from operations 7,195,215 1,783,267
Unit transactionsProceeds from sales of units 8,887,641 80,343,022Cost of units redeemed (36,972,691) (19,400,777)Net increase (decrease) in net assets resulting from unit transactions (28,085,050) 60,942,245Total increase (decrease) in net assets (20,889,835) 62,725,512
Net AssetsBeginning of period 106,931,894 44,206,382End of period $ 86,042,059 $ 106,931,894
Other InformationUnit transactions
Sold 424,983 4,018,276Redeemed (1,768,405) (980,818)Net increase (decrease) (1,343,422) 3,037,458
Financial Highlights Delaware College Portfolio (Fidelity Funds)
Periods ended December 31, 2017 2016 2015 2014 2013Selected Per Unit Data Net asset value, beginning of period $ 20.01 $ 19.17 $ 19.31 $ 18.68 $ 17.94Income from Investment Operations
Net investment income (loss) A .27 .30 .30 .24 .21Net realized and unrealized gain (loss) 1.23 .54 (.44) .39 .53
Total increase (decrease) from investment operations 1.50 .84 (.14) .63 .74Net asset value, end of period $ 21.51 $ 20.01 $ 19.17 $ 19.31 $ 18.68
Total Return 7.50% 4.38% (.73)% 3.37% 4.12%Ratios and Supplemental Data B Net assets, end of period (in $ thousands) $ 86,042 $ 106,932 $ 44,206 $ 60,543 $ 79,356Ratio of expenses to average net assets .20% .20% .20% .20% .20%Ratio of net investment income (loss) to average net assets 1.30% 1.52% 1.52% 1.26% 1.14%Portfolio Turnover Rate 17% 61% 26% 26% 41%
A Calculated based on average units outstanding during the period.B Amounts do not include the activity of any underlying fund.
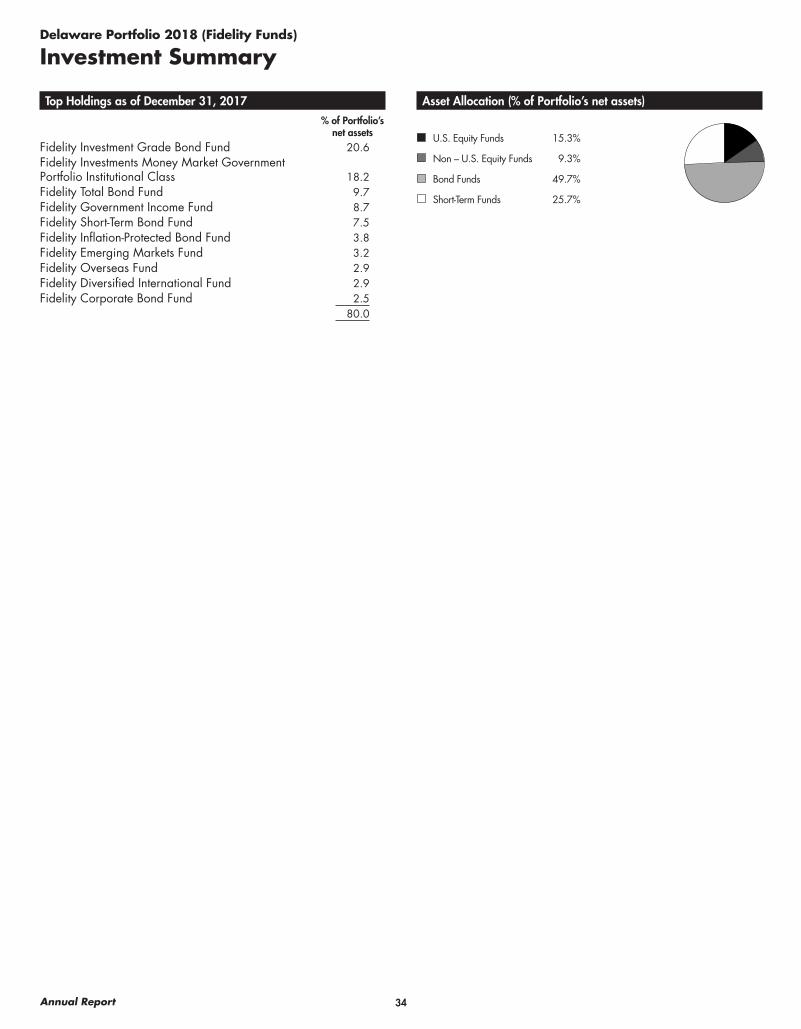
34Annual Report
Delaware Portfolio 2018 (Fidelity Funds)
Investment Summary
Top Holdings as of December 31, 2017% of Portfolio’s
net assetsFidelity Investment Grade Bond Fund 20.6Fidelity Investments Money Market Government Portfolio Institutional Class 18.2Fidelity Total Bond Fund 9.7Fidelity Government Income Fund 8.7Fidelity Short-Term Bond Fund 7.5Fidelity Inflation-Protected Bond Fund 3.8Fidelity Emerging Markets Fund 3.2Fidelity Overseas Fund 2.9Fidelity Diversified International Fund 2.9Fidelity Corporate Bond Fund 2.5
80.0
Asset Allocation (% of Portfolio’s net assets)
U.S. Equity Funds 15.3%
Non – U.S. Equity Funds 9.3%
Bond Funds 49.7%
Short-Term Funds 25.7%

35 Annual Report
See accompanying notes which are an integral part of the financial statements.
U.S. Equity Funds – 15.3%Shares Value
Fidelity Blue Chip Growth Fund 19,749 $ 1,733,147Fidelity Commodity Strategy Fund 298,267 3,149,699Fidelity Contrafund 9,407 1,152,130Fidelity Growth Company Fund 14,017 2,504,210Fidelity Large Cap Stock Fund 55,160 1,845,657Fidelity Low-Priced Stock Fund 17,854 973,390Fidelity Mega Cap Stock Fund 77,862 1,357,130Fidelity Real Estate Income Fund 59,152 709,236Fidelity Real Estate Investment Portfolio 6,856 286,584Fidelity Stock Selector All Cap Fund 79,216 3,480,734Fidelity Stock Selector Large Cap Value
Fund 121,129 2,509,801Fidelity Stock Selector Small Cap Fund 36,478 965,204Fidelity Value Discovery Fund 86,838 2,512,221
TOTAL U.S. EQUITY FUNDS(Cost $18,212,808) 23,179,143
Non – U.S. Equity Funds – 9.3%
Fidelity Canada Fund 7,604 415,613Fidelity Diversified International Fund 111,343 4,455,937Fidelity Emerging Markets Fund 147,925 4,844,528Fidelity Overseas Fund 88,240 4,473,765
TOTAL NON – U.S. EQUITY FUNDS(Cost $10,394,606) 14,189,843
Bond Funds – 49.7%
Fidelity Corporate Bond Fund 330,136 3,852,687Fidelity Floating Rate High Income Fund 39,084 375,991Fidelity Government Income Fund 1,291,256 13,183,728Fidelity High Income Fund 254,773 2,282,768Fidelity Inflation-Protected Bond Fund 484,962 5,795,298Fidelity Investment Grade Bond Fund 3,946,159 31,253,581Fidelity Mortgage Securities Fund 275,201 3,073,992Fidelity New Markets Income Fund 61,917 1,004,299Fidelity Total Bond Fund 1,391,288 14,803,304
TOTAL BOND FUNDS(Cost $76,205,112) 75,625,648
Delaware Portfolio 2018 (Fidelity Funds)
Investments December 31, 2017Showing Percentage of Net Assets
Short-Term Funds – 25.7%Shares Value
Fidelity Investments Money Market Government Portfolio Institutional Class 1.19% (a) 27,683,032 $ 27,683,032
Fidelity Short-Term Bond Fund 1,332,851 11,435,860
TOTAL SHORT-TERM FUNDS(Cost $39,132,122) 39,118,892
TOTAL INVESTMENT IN SECURITIES – 100.0%(Cost $143,944,648) 152,113,526
NET OTHER ASSETS (LIABILITIES) – 0.0% (25,854)
NET ASSETS – 100% $152,087,672
Legend(a) The rate quoted is the annualized seven-day yield of the fund at
period end.

36Annual Report
See accompanying notes which are an integral part of the financial statements.
Delaware Portfolio 2018 (Fidelity Funds)
Financial Statements
Statement of Assets and Liabilities
December 31, 2017
AssetsInvestments in securities at value (cost
$143,944,648) $ 152,113,526Receivable for investments sold 19,670Receivable for units sold 132,562Distributions receivable 189,966
Total assets 152,455,724
LiabilitiesPayable for investments purchased $ 189,979Accrued management and administration
fees 25,853Payable for units redeemed 152,220
Total liabilities 368,052Net Assets $ 152,087,672
Net Asset Value, offering price and re-demption price per unit ($152,087,672 / 6,820,447 units) $ 22.30
Statement of Operations
Year ended December 31,
2017
Investment IncomeIncome distributions from underlying funds $ 2,361,157ExpensesManagement and administration fees $ 300,828
Total expenses 300,828
Net investment income (loss) 2,060,329Realized and Unrealized Gain (Loss) on
InvestmentsNet realized gain (loss) on sale of underly-
ing funds’ shares 5,300,300Capital gain distributions from underlying
funds 1,229,533 6,529,833Change in net unrealized appreciation
(depreciation) on underlying funds’ shares 3,933,570
Net gain (loss) 10,463,403Net increase (decrease) in net assets
resulting from operations $ 12,523,732

37 Annual Report
See accompanying notes which are an integral part of the financial statements.
Delaware Portfolio 2018 (Fidelity Funds)Financial Statements – continued
Statement of Changes in Net Assets
Year ended December 31,
2017
Year ended December 31,
2016Increase (Decrease) in Net Assets:
OperationsNet investment income (loss) $ 2,060,329 $ 2,131,583Net realized gain (loss) 6,529,833 2,769,210Change in net unrealized appreciation (depreciation) 3,933,570 1,929,795Net increase (decrease) in net assets resulting from operations 12,523,732 6,830,588
Unit transactionsProceeds from sales of units 9,513,909 9,952,751Cost of units redeemed (14,582,213) (6,964,736)Net increase (decrease) in net assets resulting from unit transactions (5,068,304) 2,988,015Total increase (decrease) in net assets 7,455,428 9,818,603
Net AssetsBeginning of period 144,632,244 134,813,641End of period $ 152,087,672 $ 144,632,244
Other InformationUnit transactions
Sold 440,847 496,723Redeemed (672,327) (345,701)Net increase (decrease) (231,480) 151,022
Financial Highlights Delaware Portfolio 2018 (Fidelity Funds)
Periods ended December 31, 2017 2016 2015 2014 2013Selected Per Unit Data Net asset value, beginning of period $ 20.51 $ 19.54 $ 19.62 $ 18.72 $ 16.91Income from Investment Operations
Net investment income (loss) A .29 .30 .32 .29 .22Net realized and unrealized gain (loss) 1.50 .67 (.40) .61 1.59
Total increase (decrease) from investment operations 1.79 .97 (.08) .90 1.81Net asset value, end of period $ 22.30 $ 20.51 $ 19.54 $ 19.62 $ 18.72
Total Return 8.73% 4.96% (.41)% 4.81% 10.70%Ratios and Supplemental Data B Net assets, end of period (in $ thousands) $ 152,088 $ 144,632 $ 134,814 $ 130,826 $ 121,992Ratio of expenses to average net assets .20% .20% .20% .20% .20%Ratio of net investment income (loss) to average net assets 1.37% 1.52% 1.63% 1.48% 1.23%Portfolio Turnover Rate 24% 25% 20% 25% 21%
A Calculated based on average units outstanding during the period.B Amounts do not include the activity of any underlying fund.

38Annual Report
Delaware Portfolio 2021 (Fidelity Funds)
Investment Summary
Top Holdings as of December 31, 2017% of Portfolio’s
net assetsFidelity Investment Grade Bond Fund 21.6Fidelity Investments Money Market Government Portfolio Institutional Class 11.3Fidelity Total Bond Fund 8.9Fidelity Government Income Fund 6.7Fidelity Short-Term Bond Fund 4.6Fidelity Emerging Markets Fund 4.5Fidelity Overseas Fund 4.4Fidelity Diversified International Fund 4.3Fidelity Stock Selector All Cap Fund 3.9Fidelity Inflation-Protected Bond Fund 3.1
73.3
Asset Allocation (% of Portfolio’s net assets)
U.S. Equity Funds 24.3%
Non – U.S. Equity Funds 13.6%
Bond Funds 46.2%
Short-Term Funds 15.9%

39 Annual Report
See accompanying notes which are an integral part of the financial statements.
U.S. Equity Funds – 24.3%Shares Value
Fidelity Blue Chip Growth Fund 25,388 $ 2,228,058Fidelity Commodity Strategy Fund 221,386 2,337,837Fidelity Contrafund 12,094 1,481,159Fidelity Growth Company Fund 18,020 3,219,259Fidelity Large Cap Stock Fund 70,908 2,372,595Fidelity Low-Priced Stock Fund 22,952 1,251,357Fidelity Mega Cap Stock Fund 100,093 1,744,629Fidelity Real Estate Income Fund 42,418 508,590Fidelity Real Estate Investment Portfolio 8,815 368,465Fidelity Stock Selector All Cap Fund 101,835 4,474,622Fidelity Stock Selector Large Cap Value
Fund 155,716 3,226,438Fidelity Stock Selector Small Cap Fund 46,899 1,240,952Fidelity Value Discovery Fund 111,635 3,229,611
TOTAL U.S. EQUITY FUNDS(Cost $21,616,764) 27,683,572
Non – U.S. Equity Funds – 13.6%
Fidelity Canada Fund 8,421 460,273Fidelity Diversified International Fund 123,308 4,934,805Fidelity Emerging Markets Fund 155,709 5,099,474Fidelity Overseas Fund 97,719 4,954,358
TOTAL NON – U.S. EQUITY FUNDS(Cost $11,462,070) 15,448,910
Bond Funds – 46.2%
Fidelity Corporate Bond Fund 189,956 2,216,788Fidelity Floating Rate High Income Fund 28,242 271,685Fidelity Government Income Fund 743,311 7,589,203Fidelity High Income Fund 185,828 1,665,018Fidelity Inflation-Protected Bond Fund 299,178 3,575,181Fidelity Investment Grade Bond Fund 3,101,652 24,565,084Fidelity Mortgage Securities Fund 158,522 1,770,687Fidelity New Markets Income Fund 44,458 721,104Fidelity Total Bond Fund 949,566 10,103,380
TOTAL BOND FUNDS(Cost $52,733,075) 52,478,130
Delaware Portfolio 2021 (Fidelity Funds)
Investments December 31, 2017Showing Percentage of Net Assets
Short-Term Funds – 15.9%Shares Value
Fidelity Investments Money Market Government Portfolio Institutional Class 1.19% (a) 12,836,027 $ 12,836,027
Fidelity Short-Term Bond Fund 605,508 5,195,259
TOTAL SHORT-TERM FUNDS(Cost $18,050,244) 18,031,286
TOTAL INVESTMENT IN SECURITIES – 100.0%(Cost $103,862,153) 113,641,898
NET OTHER ASSETS (LIABILITIES) – 0.0% (19,146)
NET ASSETS – 100% $113,622,752
(a) The rate quoted is the annualized seven-day yield of the fund at period end.

40Annual Report
See accompanying notes which are an integral part of the financial statements.
Delaware Portfolio 2021 (Fidelity Funds)
Financial Statements
Statement of Assets and Liabilities
December 31, 2017
AssetsInvestments in securities at value (cost
$103,862,153) $ 113,641,898Receivable for units sold 63,586Distributions receivable 122,074
Total assets 113,827,558
LiabilitiesPayable for investments purchased $ 167,045Accrued management and administration
fees 19,170Payable for units redeemed 18,591
Total liabilities 204,806Net Assets $ 113,622,752
Net Asset Value, offering price and re-demption price per unit ($113,622,752 / 4,940,953 units) $ 23.00
Statement of Operations
Year ended December 31,
2017
Investment IncomeIncome distributions from underlying funds $ 1,622,008ExpensesManagement and administration fees $ 213,257
Total expenses 213,257
Net investment income (loss) 1,408,751Realized and Unrealized Gain (Loss) on
InvestmentsNet realized gain (loss) on sale of underly-
ing funds’ shares 4,088,843Capital gain distributions from underlying
funds 1,372,081 5,460,924Change in net unrealized appreciation
(depreciation) on underlying funds’ shares 4,937,280
Net gain (loss) 10,398,204Net increase (decrease) in net assets
resulting from operations $ 11,806,955

41 Annual Report
See accompanying notes which are an integral part of the financial statements.
Delaware Portfolio 2021 (Fidelity Funds)Financial Statements – continued
Statement of Changes in Net Assets
Year ended December 31,
2017
Year ended December 31,
2016Increase (Decrease) in Net Assets:
OperationsNet investment income (loss) $ 1,408,751 $ 1,409,284Net realized gain (loss) 5,460,924 2,170,959Change in net unrealized appreciation (depreciation) 4,937,280 1,586,753Net increase (decrease) in net assets resulting from operations 11,806,955 5,166,996
Unit transactionsProceeds from sales of units 7,446,007 6,872,458Cost of units redeemed (3,891,600) (4,075,392)Net increase (decrease) in net assets resulting from unit transactions 3,554,407 2,797,066Total increase (decrease) in net assets 15,361,362 7,964,062
Net AssetsBeginning of period 98,261,390 90,297,328End of period $ 113,622,752 $ 98,261,390
Other InformationUnit transactions
Sold 339,692 345,277Redeemed (177,090) (204,357)Net increase (decrease) 162,602 140,920
Financial Highlights Delaware Portfolio 2021 (Fidelity Funds)
Periods ended December 31, 2017 2016 2015 2014 2013Selected Per Unit Data Net asset value, beginning of period $ 20.56 $ 19.47 $ 19.51 $ 18.49 $ 16.11Income from Investment Operations
Net investment income (loss) A .29 .30 .32 .29 .21Net realized and unrealized gain (loss) 2.15 .79 (.36) .73 2.17
Total increase (decrease) from investment operations 2.44 1.09 (.04) 1.02 2.38Net asset value, end of period $ 23.00 $ 20.56 $ 19.47 $ 19.51 $ 18.49
Total Return 11.82% 5.60% (.21)% 5.52% 14.77%Ratios and Supplemental Data B Net assets, end of period (in $ thousands) $ 113,623 $ 98,261 $ 90,297 $ 87,741 $ 78,425Ratio of expenses to average net assets .20% .20% .20% .20% .20%Ratio of net investment income (loss) to average net assets 1.32% 1.49% 1.60% 1.53% 1.24%Portfolio Turnover Rate 24% 21% 19% 24% 22%
A Calculated based on average units outstanding during the period.B Amounts do not include the activity of any underlying fund.

42Annual Report
Delaware Portfolio 2024 (Fidelity Funds)
Investment Summary
Top Holdings as of December 31, 2017% of Portfolio’s
net assetsFidelity Investment Grade Bond Fund 19.9Fidelity Investments Money Market Government Portfolio Institutional Class 7.6Fidelity Total Bond Fund 6.5Fidelity Overseas Fund 5.8Fidelity Diversified International Fund 5.7Fidelity Emerging Markets Fund 5.6Fidelity Stock Selector All Cap Fund 5.5Fidelity Government Income Fund 5.2Fidelity Value Discovery Fund 4.0Fidelity Stock Selector Large Cap Value Fund 4.0
69.8
Asset Allocation (% of Portfolio’s net assets)
U.S. Equity Funds 33.2%
Non – U.S. Equity Funds 17.6%
Bond Funds 38.8%
Short-Term Funds 10.4%

43 Annual Report
See accompanying notes which are an integral part of the financial statements.
U.S. Equity Funds – 33.2%Shares Value
Fidelity Blue Chip Growth Fund 16,429 $ 1,441,797Fidelity Commodity Strategy Fund 101,430 1,071,097Fidelity Contrafund 7,826 958,507Fidelity Growth Company Fund 11,661 2,083,231Fidelity Large Cap Stock Fund 45,883 1,535,251Fidelity Low-Priced Stock Fund 14,852 809,738Fidelity Mega Cap Stock Fund 64,769 1,128,915Fidelity Real Estate Income Fund 18,823 225,694Fidelity Real Estate Investment Portfolio 5,705 238,461Fidelity Stock Selector All Cap Fund 65,897 2,895,516Fidelity Stock Selector Large Cap Value
Fund 100,764 2,087,825Fidelity Stock Selector Small Cap Fund 30,350 803,068Fidelity Value Discovery Fund 72,241 2,089,925
TOTAL U.S. EQUITY FUNDS(Cost $13,749,196) 17,369,025
Non – U.S. Equity Funds – 17.6%
Fidelity Canada Fund 5,098 278,683Fidelity Diversified International Fund 74,665 2,988,075Fidelity Emerging Markets Fund 89,819 2,941,559Fidelity Overseas Fund 59,169 2,999,856
TOTAL NON – U.S. EQUITY FUNDS(Cost $6,970,824) 9,208,173
Bond Funds – 38.8%
Fidelity Corporate Bond Fund 68,705 801,793Fidelity Floating Rate High Income Fund 12,606 121,266Fidelity Government Income Fund 267,809 2,734,328Fidelity High Income Fund 83,830 751,113Fidelity Inflation-Protected Bond Fund 93,861 1,121,642Fidelity Investment Grade Bond Fund 1,311,436 10,386,576Fidelity Mortgage Securities Fund 56,932 635,931Fidelity New Markets Income Fund 19,731 320,038Fidelity Total Bond Fund 320,563 3,410,786
TOTAL BOND FUNDS(Cost $20,343,103) 20,283,473
Delaware Portfolio 2024 (Fidelity Funds)
Investments December 31, 2017Showing Percentage of Net Assets
Short-Term Funds – 10.4%Shares Value
Fidelity Investments Money Market Government Portfolio Institutional Class 1.19% (a) 3,974,371 $ 3,974,371
Fidelity Short-Term Bond Fund 174,802 1,499,802
TOTAL SHORT-TERM FUNDS(Cost $5,480,464) 5,474,173
TOTAL INVESTMENT IN SECURITIES – 100.0%(Cost $46,543,587) 52,334,844
NET OTHER ASSETS (LIABILITIES) – 0.0% (8,786)
NET ASSETS – 100% $52,326,058
Legend(a) The rate quoted is the annualized seven-day yield of the fund at
period end.

44Annual Report
See accompanying notes which are an integral part of the financial statements.
Delaware Portfolio 2024 (Fidelity Funds)
Financial Statements
Statement of Assets and Liabilities
December 31, 2017
AssetsInvestments in securities at value (cost
$46,543,587) $ 52,334,844Receivable for units sold 36,277Distributions receivable 46,070
Total assets 52,417,191
LiabilitiesPayable for investments purchased $ 71,662Accrued management and administration
fees 8,791Payable for units redeemed 10,680
Total liabilities 91,133Net Assets $ 52,326,058
Net Asset Value, offering price and re-demption price per unit ($52,326,058 / 2,516,642 units) $ 20.79
Statement of Operations
Year ended December 31,
2017
Investment IncomeIncome distributions from underlying funds $ 688,283ExpensesManagement and administration fees $ 95,641
Total expenses 95,641
Net investment income (loss) 592,642Realized and Unrealized Gain (Loss) on
InvestmentsNet realized gain (loss) on sale of underly-
ing funds’ shares 1,923,363Capital gain distributions from underlying
funds 826,417 2,749,780Change in net unrealized appreciation
(depreciation) on underlying funds’ shares 3,149,170Net gain (loss) 5,898,950Net increase (decrease) in net assets result-
ing from operations $ 6,491,592

45 Annual Report
See accompanying notes which are an integral part of the financial statements.
Delaware Portfolio 2024 (Fidelity Funds)Financial Statements – continued
Statement of Changes in Net Assets
Year ended December 31,
2017
Year ended December 31,
2016Increase (Decrease) in Net Assets:
OperationsNet investment income (loss) $ 592,642 $ 598,582Net realized gain (loss) 2,749,780 999,547Change in net unrealized appreciation (depreciation) 3,149,170 874,544Net increase (decrease) in net assets resulting from operations 6,491,592 2,472,673
Unit transactionsProceeds from sales of units 4,660,360 3,310,657Cost of units redeemed (1,832,742) (1,586,340)Net increase (decrease) in net assets resulting from unit transactions 2,827,618 1,724,317Total increase (decrease) in net assets 9,319,210 4,196,990
Net AssetsBeginning of period 43,006,848 38,809,858End of period $ 52,326,058 $ 43,006,848
Other InformationUnit transactions
Sold 237,440 189,649Redeemed (93,705) (90,353)Net increase (decrease) 143,735 99,296
Financial Highlights Delaware Portfolio 2024 (Fidelity Funds)
Periods ended December 31, 2017 2016 2015 2014 2013Selected Per Unit Data Net asset value, beginning of period $ 18.12 $ 17.07 $ 17.08 $ 16.13 $ 13.56Income from Investment Operations
Net investment income (loss) A .24 .26 .27 .24 .18Net realized and unrealized gain (loss) 2.43 .79 (.28) .71 2.39
Total increase (decrease) from investment operations 2.67 1.05 (.01) .95 2.57Net asset value, end of period $ 20.79 $ 18.12 $ 17.07 $ 17.08 $ 16.13
Total Return 14.74% 6.15% (.06)% 5.89% 18.95%Ratios and Supplemental Data B Net assets, end of period (in $ thousands) $ 52,326 $ 43,007 $ 38,810 $ 35,535 $ 30,509Ratio of expenses to average net assets .20% .20% .20% .20% .20%Ratio of net investment income (loss) to average net assets 1.24% 1.47% 1.55% 1.42% 1.20%Portfolio Turnover Rate 26% 18% 20% 19% 24%
A Calculated based on average units outstanding during the period.B Amounts do not include the activity of any underlying fund.
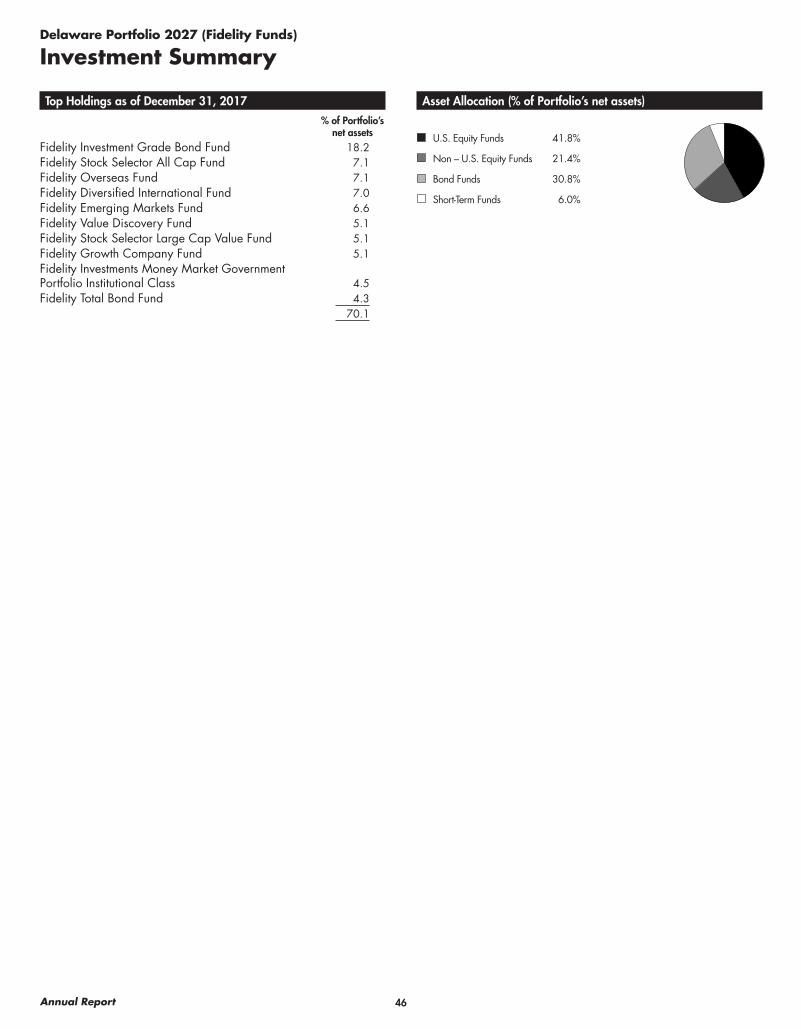
46Annual Report
Delaware Portfolio 2027 (Fidelity Funds)
Investment Summary
Top Holdings as of December 31, 2017% of Portfolio’s
net assetsFidelity Investment Grade Bond Fund 18.2Fidelity Stock Selector All Cap Fund 7.1Fidelity Overseas Fund 7.1Fidelity Diversified International Fund 7.0Fidelity Emerging Markets Fund 6.6Fidelity Value Discovery Fund 5.1Fidelity Stock Selector Large Cap Value Fund 5.1Fidelity Growth Company Fund 5.1Fidelity Investments Money Market Government Portfolio Institutional Class 4.5Fidelity Total Bond Fund 4.3
70.1
Asset Allocation (% of Portfolio’s net assets)
U.S. Equity Funds 41.8%
Non – U.S. Equity Funds 21.4%
Bond Funds 30.8%
Short-Term Funds 6.0%

47 Annual Report
See accompanying notes which are an integral part of the financial statements.
U.S. Equity Funds – 41.8%Shares Value
Fidelity Blue Chip Growth Fund 8,599 $ 754,617Fidelity Commodity Strategy Fund 41,171 434,761Fidelity Contrafund 4,097 501,750Fidelity Growth Company Fund 6,103 1,090,251Fidelity Large Cap Stock Fund 24,015 803,542Fidelity Low-Priced Stock Fund 7,776 423,938Fidelity Mega Cap Stock Fund 33,903 590,922Fidelity Real Estate Income Fund 7,404 88,773Fidelity Real Estate Investment Portfolio 2,990 124,995Fidelity Stock Selector All Cap Fund 34,485 1,515,263Fidelity Stock Selector Large Cap Value
Fund 52,735 1,092,673Fidelity Stock Selector Small Cap Fund 15,881 420,215Fidelity Value Discovery Fund 37,808 1,093,772
TOTAL U.S. EQUITY FUNDS(Cost $7,263,922) 8,935,472
Non – U.S. Equity Funds – 21.4%
Fidelity Canada Fund 2,565 140,179Fidelity Diversified International Fund 37,585 1,504,133Fidelity Emerging Markets Fund 43,125 1,412,346Fidelity Overseas Fund 29,784 1,510,040
TOTAL NON – U.S. EQUITY FUNDS(Cost $3,502,325) 4,566,698
Bond Funds – 30.8%
Fidelity Corporate Bond Fund 17,849 208,295Fidelity Floating Rate High Income Fund 4,979 47,900Fidelity Government Income Fund 70,765 722,510Fidelity High Income Fund 33,619 301,230Fidelity Inflation-Protected Bond Fund 16,855 201,423Fidelity Investment Grade Bond Fund 491,151 3,889,913Fidelity Mortgage Securities Fund 14,979 167,320Fidelity New Markets Income Fund 7,795 126,440Fidelity Total Bond Fund 86,780 923,341
TOTAL BOND FUNDS(Cost $6,579,696) 6,588,372
Delaware Portfolio 2027 (Fidelity Funds)
Investments December 31, 2017Showing Percentage of Net Assets
Short-Term Funds – 6.0%Shares Value
Fidelity Investments Money Market Government Portfolio Institutional Class 1.19% (a) 956,942 $ 956,942
Fidelity Short-Term Bond Fund 36,626 314,249
TOTAL SHORT-TERM FUNDS(Cost $1,272,660) 1,271,191
TOTAL INVESTMENT IN SECURITIES – 100.0%(Cost $18,618,603) 21,361,733
NET OTHER ASSETS (LIABILITIES) – 0.0% (3,619)
NET ASSETS – 100% $21,358,114
Legend(a) The rate quoted is the annualized seven-day yield of the fund at
period end.

48Annual Report
See accompanying notes which are an integral part of the financial statements.
Delaware Portfolio 2027 (Fidelity Funds)
Financial Statements
Statement of Assets and Liabilities
December 31, 2017
AssetsInvestments in securities at value (cost
$18,618,603) $ 21,361,733Receivable for units sold 19,250Distributions receivable 14,873
Total assets 21,395,856
LiabilitiesPayable for investments purchased $ 34,138Accrued management and administration
fees 3,604Total liabilities 37,742
Net Assets $ 21,358,114
Net Asset Value, offering price and re-demption price per unit ($21,358,114 / 1,288,745 units) $ 16.57
Statement of Operations
Year ended December 31,
2017
Investment IncomeIncome distributions from underlying funds $ 264,987ExpensesManagement and administration fees $ 39,222
Total expenses 39,222
Net investment income (loss) 225,765Realized and Unrealized Gain (Loss) on Invest-
mentsNet realized gain (loss) on sale of underlying
funds’ shares 809,953Capital gain distributions from underlying
funds 420,747 1,230,700Change in net unrealized appreciation (de-
preciation) on underlying funds’ shares 1,679,060Net gain (loss) 2,909,760Net increase (decrease) in net assets resulting
from operations $ 3,135,525

49 Annual Report
See accompanying notes which are an integral part of the financial statements.
Delaware Portfolio 2027 (Fidelity Funds)Financial Statements – continued
Statement of Changes in Net Assets
Year ended December 31,
2017
Year ended December 31,
2016Increase (Decrease) in Net Assets:
OperationsNet investment income (loss) $ 225,765 $ 228,028Net realized gain (loss) 1,230,700 387,080Change in net unrealized appreciation (depreciation) 1,679,060 451,532Net increase (decrease) in net assets resulting from operations 3,135,525 1,066,640
Unit transactionsProceeds from sales of units 2,119,934 1,955,219Cost of units redeemed (1,109,904) (568,106)Net increase (decrease) in net assets resulting from unit transactions 1,010,030 1,387,113Total increase (decrease) in net assets 4,145,555 2,453,753
Net AssetsBeginning of period 17,212,559 14,758,806End of period $ 21,358,114 $ 17,212,559
Other InformationUnit transactions
Sold 137,830 146,047Redeemed (70,426) (41,327)Net increase (decrease) 67,404 104,720
Financial Highlights Delaware Portfolio 2027 (Fidelity Funds)
Periods ended December 31, 2017 2016 2015 2014 2013Selected Per Unit Data Net asset value, beginning of period $ 14.09 $ 13.22 $ 13.21 $ 12.45 $ 10.14Income from Investment Operations
Net investment income (loss) A .18 .19 .20 .17 .14Net realized and unrealized gain (loss) 2.30 .68 (.19) .59 2.17
Total increase (decrease) from investment operations 2.48 .87 .01 .76 2.31Net asset value, end of period $ 16.57 $ 14.09 $ 13.22 $ 13.21 $ 12.45
Total Return 17.60% 6.58% .08% 6.10% 22.78%Ratios and Supplemental Data B Net assets, end of period (in $ thousands) $ 21,358 $ 17,213 $ 14,759 $ 11,726 $ 9,337Ratio of expenses to average net assets .20% .20% .20% .20% .20%Ratio of net investment income (loss) to average net assets 1.15% 1.43% 1.45% 1.33% 1.24%Portfolio Turnover Rate 30% 16% 19% 17% 19%
A Calculated based on average units outstanding during the period.B Amounts do not include the activity of any underlying fund.

50Annual Report
Delaware Portfolio 2030 (Fidelity Funds)
Investment Summary
Top Holdings as of December 31, 2017% of Portfolio’s
net assetsFidelity Investment Grade Bond Fund 15.4Fidelity Stock Selector All Cap Fund 8.7Fidelity Overseas Fund 8.4Fidelity Diversified International Fund 8.4Fidelity Emerging Markets Fund 7.6Fidelity Value Discovery Fund 6.3Fidelity Stock Selector Large Cap Value Fund 6.3Fidelity Growth Company Fund 6.2Fidelity Large Cap Stock Fund 4.6Fidelity Blue Chip Growth Fund 4.3
76.2
Asset Allocation (% of Portfolio’s net assets)
U.S. Equity Funds 50.6%
Non – U.S. Equity Funds 25.2%
Bond Funds 22.6%
Short-Term Funds 1.6%

51 Annual Report
See accompanying notes which are an integral part of the financial statements.
U.S. Equity Funds – 50.6%Shares Value
Fidelity Blue Chip Growth Fund 4,111 $ 360,746Fidelity Commodity Strategy Fund 16,017 169,135Fidelity Contrafund 1,959 239,938Fidelity Growth Company Fund 2,917 521,098Fidelity Large Cap Stock Fund 11,480 384,118Fidelity Low-Priced Stock Fund 3,719 202,770Fidelity Mega Cap Stock Fund 16,210 282,534Fidelity Real Estate Income Fund 2,815 33,755Fidelity Real Estate Investment Portfolio 1,426 59,605Fidelity Stock Selector All Cap Fund 16,480 724,151Fidelity Stock Selector Large Cap Value
Fund 25,205 522,253Fidelity Stock Selector Small Cap Fund 7,587 200,757Fidelity Value Discovery Fund 18,071 522,783
TOTAL U.S. EQUITY FUNDS(Cost $3,545,887) 4,223,643
Non – U.S. Equity Funds – 25.2%
Fidelity Canada Fund 1,190 65,055Fidelity Diversified International Fund 17,434 697,726Fidelity Emerging Markets Fund 19,496 638,488Fidelity Overseas Fund 13,816 700,468
TOTAL NON – U.S. EQUITY FUNDS(Cost $1,671,707) 2,101,737
Bond Funds – 22.6%
Fidelity Corporate Bond Fund 2,765 32,265Fidelity Floating Rate High Income Fund 1,901 18,288Fidelity Government Income Fund 11,370 116,089Fidelity High Income Fund 12,888 115,474Fidelity Inflation-Protected Bond Fund 5,465 65,303Fidelity Investment Grade Bond Fund 162,234 1,284,892Fidelity Mortgage Securities Fund 2,541 28,383Fidelity New Markets Income Fund 2,954 47,920Fidelity Total Bond Fund 17,185 182,853
TOTAL BOND FUNDS(Cost $1,887,804) 1,891,467
Delaware Portfolio 2030 (Fidelity Funds)
Investments December 31, 2017Showing Percentage of Net Assets
Short-Term Funds – 1.6%Shares Value
Fidelity Investments Money Market Government Portfolio Institutional Class 1.19% (a) 108,359 $ 108,359
Fidelity Short-Term Bond Fund 3,335 28,617
TOTAL SHORT-TERM FUNDS(Cost $137,077) 136,976
TOTAL INVESTMENT IN SECURITIES – 100.0%(Cost $7,242,475) 8,353,823
NET OTHER ASSETS (LIABILITIES) – 0.0% (1,395)
NET ASSETS – 100% $ 8,352,428
Legend(a) The rate quoted is the annualized seven-day yield of the fund at
period end.

52Annual Report
See accompanying notes which are an integral part of the financial statements.
Delaware Portfolio 2030 (Fidelity Funds)
Financial Statements
Statement of Assets and Liabilities
December 31, 2017
AssetsInvestments in securities at value (cost
$7,242,475) $ 8,353,823Receivable for units sold 1,735Distributions receivable 4,053
Total assets 8,359,611
LiabilitiesPayable for investments purchased $ 5,785Accrued management and administration
fees 1,398Total liabilities 7,183
Net Assets $ 8,352,428
Net Asset Value, offering price and re-demption price per unit ($8,352,428 / 446,345 units) $ 18.71
Statement of Operations
Year ended December 31,
2017
Investment IncomeIncome distributions from underlying funds $ 90,840ExpensesManagement and administration fees $ 14,644
Total expenses 14,644
Net investment income (loss) 76,196Realized and Unrealized Gain (Loss) on Invest-
mentsNet realized gain (loss) on sale of underlying
funds’ shares 225,247Capital gain distributions from underlying
funds 193,837 419,084Change in net unrealized appreciation (de-
preciation) on underlying funds’ shares 847,100Net gain (loss) 1,266,184Net increase (decrease) in net assets resulting
from operations $ 1,342,380

53 Annual Report
See accompanying notes which are an integral part of the financial statements.
Delaware Portfolio 2030 (Fidelity Funds)Financial Statements – continued
Statement of Changes in Net Assets
Year ended December 31,
2017
Year ended December 31,
2016Increase (Decrease) in Net Assets:
OperationsNet investment income (loss) $ 76,196 $ 74,249Net realized gain (loss) 419,084 124,726Change in net unrealized appreciation (depreciation) 847,100 204,051Net increase (decrease) in net assets resulting from operations 1,342,380 403,026
Unit transactionsProceeds from sales of units 959,451 1,090,381Cost of units redeemed (183,000) (239,948)Net increase (decrease) in net assets resulting from unit transactions 776,451 850,433Total increase (decrease) in net assets 2,118,831 1,253,459
Net AssetsBeginning of period 6,233,597 4,980,138End of period $ 8,352,428 $ 6,233,597
Other InformationUnit transactions
Sold 55,603 74,289Redeemed (10,543) (15,885)Net increase (decrease) 45,060 58,404
Financial Highlights Delaware Portfolio 2030 (Fidelity Funds)
Periods ended December 31, 2017 2016 2015 2014 2013Selected Per Unit Data Net asset value, beginning of period $ 15.53 $ 14.52 $ 14.49 $ 13.64 $ 10.91Income from Investment Operations
Net investment income (loss) A .18 .20 .19 .18 .17Net realized and unrealized gain (loss) 3.00 .81 (.16) .67 2.56
Total increase (decrease) from investment operations 3.18 1.01 .03 .85 2.73Net asset value, end of period $ 18.71 $ 15.53 $ 14.52 $ 14.49 $ 13.64
Total Return 20.48% 6.96% .21% 6.23% 25.02%Ratios and Supplemental Data B Net assets, end of period (in $ thousands) $ 8,352 $ 6,234 $ 4,980 $ 4,022 $ 2,363Ratio of expenses to average net assets .20% .20% .20% .20% .20%Ratio of net investment income (loss) to average net assets 1.04% 1.33% 1.26% 1.31% 1.35%Portfolio Turnover Rate 29% 15% 13% 17% 12%
A Calculated based on average units outstanding during the period.B Amounts do not include the activity of any underlying fund.

54Annual Report
Delaware Portfolio 2033 (Fidelity Funds)
Investment Summary
Top Holdings as of December 31, 2017% of Portfolio’s
net assetsFidelity Stock Selector All Cap Fund 10.2Fidelity Overseas Fund 9.7Fidelity Diversified International Fund 9.7Fidelity Emerging Markets Fund 8.6Fidelity Growth Company Fund 7.4Fidelity Value Discovery Fund 7.4Fidelity Stock Selector Large Cap Value Fund 7.4Fidelity Investment Grade Bond Fund 7.2Fidelity Large Cap Stock Fund 5.4Fidelity Blue Chip Growth Fund 5.1
78.1
Asset Allocation (% of Portfolio’s net assets)
U.S. Equity Funds 59.2%
Non – U.S. Equity Funds 28.9%
Bond Funds 10.3%
Short-Term Funds 1.6%

55 Annual Report
See accompanying notes which are an integral part of the financial statements.
U.S. Equity Funds – 59.2%Shares Value
Fidelity Blue Chip Growth Fund 1,537 $ 134,873Fidelity Commodity Strategy Fund 5,003 52,833Fidelity Contrafund 724 88,610Fidelity Growth Company Fund 1,083 193,492Fidelity Large Cap Stock Fund 4,241 141,893Fidelity Low-Priced Stock Fund 1,373 74,846Fidelity Mega Cap Stock Fund 5,986 104,338Fidelity Real Estate Income Fund 1,004 12,037Fidelity Real Estate Investment Portfolio 527 22,043Fidelity Stock Selector All Cap Fund 6,091 267,616Fidelity Stock Selector Large Cap Value
Fund 9,314 192,989Fidelity Stock Selector Small Cap Fund 2,801 74,106Fidelity Value Discovery Fund 6,678 193,182
TOTAL U.S. EQUITY FUNDS(Cost $1,376,499) 1,552,858
Non – U.S. Equity Funds – 28.9%
Fidelity Canada Fund 432 23,634Fidelity Diversified International Fund 6,333 253,457Fidelity Emerging Markets Fund 6,910 226,301Fidelity Overseas Fund 5,018 254,425
TOTAL NON – U.S. EQUITY FUNDS(Cost $631,686) 757,817
Bond Funds – 10.3%
Fidelity Floating Rate High Income Fund 498 4,788Fidelity High Income Fund 3,985 35,705Fidelity Inflation-Protected Bond Fund 1,723 20,586Fidelity Investment Grade Bond Fund 23,845 188,853Fidelity New Markets Income Fund 761 12,341Fidelity Total Bond Fund 757 8,053
TOTAL BOND FUNDS(Cost $268,745) 270,326
Short-Term Funds – 1.6%
Fidelity Investments Money Market Government Portfolio Institutional Class 1.19% (a) 32,667 32,667
Fidelity Short-Term Bond Fund 980 8,412
TOTAL SHORT-TERM FUNDS(Cost $41,107) 41,079
TOTAL INVESTMENT IN SECURITIES – 100.0%(Cost $2,318,037) 2,622,080
NET OTHER ASSETS (LIABILITIES) – 0.0% (424)
NET ASSETS – 100% $ 2,621,656
Delaware Portfolio 2033 (Fidelity Funds)
Investments December 31, 2017Showing Percentage of Net Assets
Legend(a) The rate quoted is the annualized seven-day yield of the fund at
period end.

56Annual Report
See accompanying notes which are an integral part of the financial statements.
Delaware Portfolio 2033 (Fidelity Funds)
Financial Statements
Statement of Assets and Liabilities
December 31, 2017
AssetsInvestments in securities at value (cost
$2,318,037) $ 2,622,080Receivable for units sold 84,571Distributions receivable 611
Total assets 2,707,262
LiabilitiesPayable for investments purchased $ 85,180Accrued management and administration
fees 426Total liabilities 85,606
Net Assets $ 2,621,656
Net Asset Value, offering price and redemption price per unit ($2,621,656 / 182,073 units) $ 14.40
Statement of Operations
Year ended December 31,
2017
Investment IncomeIncome distributions from underlying funds $ 23,157ExpensesManagement and administration fees $ 4,166
Total expenses 4,166
Net investment income (loss) 18,991Realized and Unrealized Gain (Loss) on Invest-
mentsNet realized gain (loss) on sale of underlying
funds’ shares 59,940Capital gain distributions from underlying funds 67,600 127,540Change in net unrealized appreciation (depre-
ciation) on underlying funds’ shares 279,045Net gain (loss) 406,585Net increase (decrease) in net assets resulting
from operations $ 425,576

57 Annual Report
See accompanying notes which are an integral part of the financial statements.
Delaware Portfolio 2033 (Fidelity Funds)Financial Statements – continued
Statement of Changes in Net Assets
Year ended December 31,
2017
Year ended December 31,
2016Increase (Decrease) in Net Assets:
OperationsNet investment income (loss) $ 18,991 $ 15,033Net realized gain (loss) 127,540 23,229Change in net unrealized appreciation (depreciation) 279,045 58,616Net increase (decrease) in net assets resulting from operations 425,576 96,878
Unit transactionsProceeds from sales of units 790,626 753,859Cost of units redeemed (215,975) (26,543)Net increase (decrease) in net assets resulting from unit transactions 574,651 727,316Total increase (decrease) in net assets 1,000,227 824,194
Net AssetsBeginning of period 1,621,429 797,235End of period $ 2,621,656 $ 1,621,429
Other InformationUnit transactions
Sold 59,886 68,050Redeemed (16,611) (2,362)Net increase (decrease) 43,275 65,688
Financial Highlights Delaware Portfolio 2033 (Fidelity Funds)
Periods ended December 31, 2017 2016 2015 2014 2013 A
Selected Per Unit Data Net asset value, beginning of period $ 11.68 $ 10.90 $ 10.86 $ 10.22 $ 10.00Income from Investment Operations
Net investment income (loss) B .12 .15 .14 .14 –C
Net realized and unrealized gain (loss) 2.60 .63 (.10) .50 .22Total increase (decrease) from investment operations 2.72 .78 .04 .64 .22Net asset value, end of period $ 14.40 $ 11.68 $ 10.90 $ 10.86 $ 10.22
Total Return D 23.29% 7.16% .37% 6.26% 2.20%Ratios and Supplemental Data E Net assets, end of period (in $ thousands) $ 2,622 $ 1,621 $ 797 $ 370 $ 1Ratio of expenses to average net assets .20% .20% .20% .20% .20%F
Ratio of net investment income (loss) to average net assets .91% 1.31% 1.22% 1.36% .58%F
Portfolio Turnover Rate 34% 9% 9% 16% —%
A For the period December 18, 2013 (commencement of operations) to December 31, 2013.B Calculated based on average units outstanding during the period.C Amount represents less than $.01 per unit.D Total returns for periods of less than one year are not annualized.E Amounts do not include the activity of any underlying fund.F Annualized

58Annual Report
Delaware Portfolio 2036 (Fidelity Funds)
Investment Summary
Top Holdings as of December 31, 2017% of Portfolio’s
net assetsFidelity Stock Selector All Cap Fund 11.4Fidelity Overseas Fund 10.8Fidelity Diversified International Fund 10.7Fidelity Emerging Markets Fund 9.5Fidelity Value Discovery Fund 8.3Fidelity Growth Company Fund 8.3Fidelity Stock Selector Large Cap Value Fund 8.3Fidelity Large Cap Stock Fund 6.1Fidelity Blue Chip Growth Fund 5.7Fidelity Mega Cap Stock Fund 4.5
83.6
Asset Allocation (% of Portfolio’s net assets)
U.S. Equity Funds 65.2%
Non – U.S. Equity Funds 32.0%
Bond Funds 1.8%
Short-Term Funds 1.0%

59 Annual Report
See accompanying notes which are an integral part of the financial statements.
U.S. Equity Funds – 65.2%Shares Value
Fidelity Blue Chip Growth Fund 187 $ 16,375Fidelity Commodity Strategy Fund 348 3,674Fidelity Contrafund 89 10,892Fidelity Growth Company Fund 133 23,787Fidelity Large Cap Stock Fund 525 17,558Fidelity Low-Priced Stock Fund 169 9,201Fidelity Mega Cap Stock Fund 740 12,892Fidelity Real Estate Income Fund 61 733Fidelity Real Estate Investment Portfolio 65 2,709Fidelity Stock Selector All Cap Fund 749 32,896Fidelity Stock Selector Large Cap Value
Fund 1,147 23,766Fidelity Stock Selector Small Cap Fund 345 9,129Fidelity Value Discovery Fund 823 23,802
TOTAL U.S. EQUITY FUNDS(Cost $181,271) 187,414
Non – U.S. Equity Funds – 32.0%
Fidelity Canada Fund 53 2,881Fidelity Diversified International Fund 771 30,868Fidelity Emerging Markets Fund 833 27,281Fidelity Overseas Fund 611 30,988
TOTAL NON – U.S. EQUITY FUNDS(Cost $86,675) 92,018
Bond Funds – 1.8%
Fidelity Floating Rate High Income Fund 39 371Fidelity High Income Fund 273 2,445Fidelity Inflation-Protected Bond Fund 121 1,440Fidelity New Markets Income Fund 59 954
TOTAL BOND FUNDS(Cost $5,227) 5,210
Short-Term Funds – 1.0%
Fidelity Investments Money Market Government Portfolio Institutional Class 1.19% (a) 2,270 2,270
Fidelity Short-Term Bond Fund 67 577
TOTAL SHORT-TERM FUNDS(Cost $2,850) 2,847
TOTAL INVESTMENT IN SECURITIES – 100.0%(Cost $276,023) 287,489
NET OTHER ASSETS (LIABILITIES) – 0.0% (44)
NET ASSETS – 100% $ 287,445
Delaware Portfolio 2036 (Fidelity Funds)
Investments December 31, 2017Showing Percentage of Net Assets
Legend(a) The rate quoted is the annualized seven-day yield of the fund at
period end.
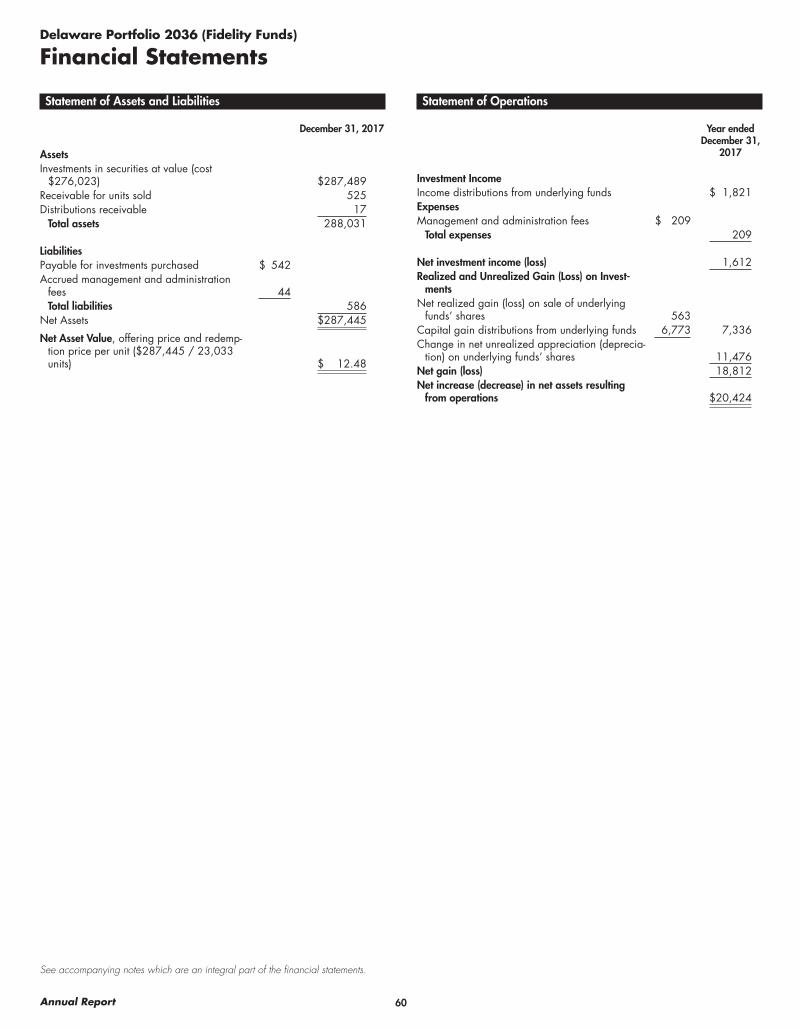
60Annual Report
See accompanying notes which are an integral part of the financial statements.
Delaware Portfolio 2036 (Fidelity Funds)
Financial Statements
Statement of Assets and Liabilities
December 31, 2017
AssetsInvestments in securities at value (cost
$276,023) $ 287,489Receivable for units sold 525Distributions receivable 17
Total assets 288,031
LiabilitiesPayable for investments purchased $ 542Accrued management and administration
fees 44Total liabilities 586
Net Assets $ 287,445
Net Asset Value, offering price and redemp-tion price per unit ($287,445 / 23,033 units) $ 12.48
Statement of Operations
Year ended December 31,
2017
Investment IncomeIncome distributions from underlying funds $ 1,821ExpensesManagement and administration fees $ 209
Total expenses 209
Net investment income (loss) 1,612Realized and Unrealized Gain (Loss) on Invest-
mentsNet realized gain (loss) on sale of underlying
funds’ shares 563Capital gain distributions from underlying funds 6,773 7,336Change in net unrealized appreciation (deprecia-
tion) on underlying funds’ shares 11,476Net gain (loss) 18,812Net increase (decrease) in net assets resulting
from operations $ 20,424

61 Annual Report
See accompanying notes which are an integral part of the financial statements.
Delaware Portfolio 2036 (Fidelity Funds)Financial Statements – continued
Statement of Changes in Net Assets
Year ended December 31,
2017
For the Period December 14, 2016
(commencement of operations) to December 31,
2016Increase (Decrease) in Net Assets:
OperationsNet investment income (loss) $ 1,612 $ 2Net realized gain (loss) 7,336 7Change in net unrealized appreciation (depreciation) 11,476 (10)Net increase (decrease) in net assets resulting from operations 20,424 (1)
Unit transactionsProceeds from sales of units 267,214 1,000Cost of units redeemed (1,192) –Net increase (decrease) in net assets resulting from unit transactions 266,022 1,000Total increase (decrease) in net assets 286,446 999
Net AssetsBeginning of period 999 –End of period $ 287,445 $ 999
Other InformationUnit transactions
Sold 23,033 100Redeemed (100) –Net increase (decrease) 22,933 100
Financial Highlights Delaware Portfolio 2036 (Fidelity Funds)
Periods ended December 31, 2017 2016 A
Selected Per Unit Data Net asset value, beginning of period $ 9.99 $ 10.00Income from Investment Operations
Net investment income (loss) B .18 .02Net realized and unrealized gain (loss) 2.31 (.03)
Total increase (decrease) from investment operations 2.49 (.01)Net asset value, end of period $ 12.48 $ 9.99
Total Return C 24.92% (.10)%Ratios and Supplemental Data D Net assets, end of period (in $ thousands) $ 287 $ 1Ratio of expenses to average net assets .20% .20%E
Ratio of net investment income (loss) to average net assets 1.53% 4.25%E
Portfolio Turnover Rate 13% 0%
A For the period December 14, 2016 (commencement of operations) to December 31, 2016.B Calculated based on average units outstanding during the period.C Total returns for periods of less than one year are not annualized.D Amounts do not include the activity of any underlying fund.E Annualized

62Annual Report
Delaware Conservative Portfolio (Fidelity Funds)
Investment Summary
Top Holdings as of December 31, 2017% of Portfolio’s
net assetsFidelity Investments Money Market Government Portfolio Institutional Class 42.8Fidelity Investment Grade Bond Fund 27.8Fidelity Short-Term Bond Fund 12.1Fidelity Government Income Fund 8.4Fidelity Corporate Bond Fund 2.4Fidelity Mortgage Securities Fund 1.9Fidelity Inflation-Protected Bond Fund 1.9Fidelity High Income Fund 1.0Fidelity New Markets Income Fund 0.5Fidelity Real Estate Income Fund 0.5
99.3
Asset Allocation (% of Portfolio’s net assets)
U.S. Equity Funds 0.5%
Bond Funds 44.6%
Short-Term Funds 54.9%

63 Annual Report
See accompanying notes which are an integral part of the financial statements.
U.S. Equity Funds – 0.5%Shares Value
Fidelity Real Estate Income Fund(Cost $33,414) 2,986 $ 35,801
Bond Funds – 44.6%
Fidelity Corporate Bond Fund 15,002 175,070Fidelity Floating Rate High Income Fund 3,701 35,604Fidelity Government Income Fund 58,579 598,096Fidelity High Income Fund 8,028 71,934Fidelity Inflation-Protected Bond Fund 11,208 133,932Fidelity Investment Grade Bond Fund 251,493 1,991,820Fidelity Mortgage Securities Fund 12,505 139,677Fidelity New Markets Income Fund 2,213 35,903Fidelity Total Bond Fund 1,060 11,283
TOTAL BOND FUNDS(Cost $3,212,579) 3,193,319
Short-Term Funds – 54.9%
Fidelity Investments Money Market Government Portfolio Institutional Class 1.19% (a) 3,068,795 3,068,795
Fidelity Short-Term Bond Fund 100,691 863,931
TOTAL SHORT-TERM FUNDS(Cost $3,931,132) 3,932,726
TOTAL INVESTMENT IN SECURITIES – 100.0%(Cost $7,177,125) 7,161,846
NET OTHER ASSETS (LIABILITIES) – 0.0% (1,248)
NET ASSETS – 100% $ 7,160,598
Legend(a) The rate quoted is the annualized seven-day yield of the fund at
period end.
Delaware Conservative Portfolio (Fidelity Funds)
Investments December 31, 2017Showing Percentage of Net Assets

64Annual Report
See accompanying notes which are an integral part of the financial statements.
Delaware Conservative Portfolio (Fidelity Funds)
Financial Statements
Statement of Assets and Liabilities
December 31, 2017
AssetsInvestments in securities at value (cost
$7,177,125) $ 7,161,846Receivable for investments sold 61,331Receivable for units sold 9,820Distributions receivable 10,482
Total assets 7,243,479
LiabilitiesPayable for investments purchased $ 10,493Accrued management and administration
fees 1,236Payable for units redeemed 71,152
Total liabilities 82,881Net Assets $ 7,160,598
Net Asset Value, offering price and redemption price per unit ($7,160,598 / 460,389 units) $ 15.55
Statement of Operations
Year ended December 31,
2017
Investment IncomeIncome distributions from underlying funds $ 109,722ExpensesManagement and administration fees $ 13,944
Total expenses 13,944
Net investment income (loss) 95,778Realized and Unrealized Gain (Loss) on Invest-
mentsNet realized gain (loss) on sale of underlying
funds’ shares 2,714Capital gain distributions from underlying funds 3,279 5,993Change in net unrealized appreciation (depre-
ciation) on underlying funds’ shares 39,932Net gain (loss) 45,925Net increase (decrease) in net assets resulting
from operations $ 141,703

65 Annual Report
See accompanying notes which are an integral part of the financial statements.
Delaware Conservative Portfolio (Fidelity Funds)Financial Statements – continued
Statement of Changes in Net Assets
Year ended December 31,
2017
Year ended December 31,
2016Increase (Decrease) in Net Assets:
OperationsNet investment income (loss) $ 95,778 $ 88,044Net realized gain (loss) 5,993 232Change in net unrealized appreciation (depreciation) 39,932 79,051Net increase (decrease) in net assets resulting from operations 141,703 167,327
Unit transactionsProceeds from sales of units 2,058,494 672,905Cost of units redeemed (1,517,903) (1,716,429)Net increase (decrease) in net assets resulting from unit transactions 540,591 (1,043,524)Total increase (decrease) in net assets 682,294 (876,197)
Net AssetsBeginning of period 6,478,304 7,354,501End of period $ 7,160,598 $ 6,478,304
Other InformationUnit transactions
Sold 133,410 44,230Redeemed (98,136) (113,318)Net increase (decrease) 35,274 (69,088)
Financial Highlights Delaware Conservative Portfolio (Fidelity Funds)
Periods ended December 31, 2017 2016 2015 2014 2013Selected Per Unit Data Net asset value, beginning of period $ 15.24 $ 14.88 $ 14.93 $ 14.57 $ 14.69Income from Investment Operations
Net investment income (loss) A .21 .19 .19 .17 .15Net realized and unrealized gain (loss) .10 .17 (.24) .19 (.27)
Total increase (decrease) from investment operations .31 .36 (.05) .36 (.12)Net asset value, end of period $ 15.55 $ 15.24 $ 14.88 $ 14.93 $ 14.57
Total Return 2.03% 2.42% (.33)% 2.47% (.82)%Ratios and Supplemental Data B Net assets, end of period (in $ thousands) $ 7,161 $ 6,478 $ 7,355 $ 7,655 $ 8,155Ratio of expenses to average net assets .20% .20% .20% .20% .20%Ratio of net investment income (loss) to average net assets 1.37% 1.26% 1.29% 1.15% .99%Portfolio Turnover Rate 29% 55% 18% 25% 13%
A Calculated based on average units outstanding during the period.B Amounts do not include the activity of any underlying fund.

66Annual Report
Delaware Moderate Growth Portfolio (Fidelity Funds)
Investment Summary
Top Holdings as of December 31, 2017% of Portfolio’s
net assetsFidelity Investment Grade Bond Fund 19.1Fidelity Stock Selector All Cap Fund 8.3Fidelity Overseas Fund 7.8Fidelity Diversified International Fund 7.8Fidelity Emerging Markets Fund 6.7Fidelity Value Discovery Fund 6.0Fidelity Stock Selector Large Cap Value Fund 6.0Fidelity Growth Company Fund 6.0Fidelity Government Income Fund 4.8Fidelity Large Cap Stock Fund 4.4
76.9
Asset Allocation (% of Portfolio’s net assets)
U.S. Equity Funds 47.9%
Non – U.S. Equity Funds 23.0%
Bond Funds 29.1%

67 Annual Report
See accompanying notes which are an integral part of the financial statements.
U.S. Equity Funds – 47.9%Shares Value
Fidelity Blue Chip Growth Fund 9,067 $ 795,732Fidelity Commodity Strategy Fund 18,139 191,545Fidelity Contrafund 4,316 528,544Fidelity Growth Company Fund 6,434 1,149,472Fidelity Large Cap Stock Fund 25,324 847,347Fidelity Low-Priced Stock Fund 8,205 447,311Fidelity Mega Cap Stock Fund 35,755 623,218Fidelity Real Estate Income Fund 11,724 140,571Fidelity Real Estate Investment Portfolio 3,152 131,745Fidelity Stock Selector All Cap Fund 36,352 1,597,301Fidelity Stock Selector Large Cap Value
Fund 55,595 1,151,925Fidelity Stock Selector Small Cap Fund 16,729 442,640Fidelity Value Discovery Fund 39,860 1,153,139
TOTAL U.S. EQUITY FUNDS(Cost $7,109,061) 9,200,490
Non – U.S. Equity Funds – 23.0%
Fidelity Canada Fund 2,559 139,876Fidelity Diversified International Fund 37,469 1,499,524Fidelity Emerging Markets Fund 38,969 1,276,246Fidelity Overseas Fund 29,697 1,505,640
TOTAL NON – U.S. EQUITY FUNDS(Cost $3,356,929) 4,421,286
Bond Funds – 29.1%
Fidelity Corporate Bond Fund 22,815 266,248Fidelity Floating Rate High Income Fund 9,782 94,102Fidelity Government Income Fund 89,764 916,488Fidelity High Income Fund 21,112 189,166Fidelity Inflation-Protected Bond Fund 11,871 141,858Fidelity Investment Grade Bond Fund 462,428 3,662,430Fidelity Mortgage Securities Fund 18,928 211,429Fidelity New Markets Income Fund 5,811 94,251Fidelity Total Bond Fund 1 9
TOTAL BOND FUNDS(Cost $5,599,020) 5,575,981
TOTAL INVESTMENT IN SECURITIES – 100.0%(Cost $16,065,010) 19,197,757
NET OTHER ASSETS (LIABILITIES) – 0.0% (3,239)
NET ASSETS – 100% $19,194,518
Delaware Moderate Growth Portfolio (Fidelity Funds)
Investments December 31, 2017Showing Percentage of Net Assets

68Annual Report
See accompanying notes which are an integral part of the financial statements.
Delaware Moderate Growth Portfolio (Fidelity Funds)
Financial Statements
Statement of Assets and Liabilities
December 31, 2017
AssetsInvestments in securities at value (cost
$16,065,010) $ 19,197,757Receivable for units sold 22,567Distributions receivable 11,372
Total assets 19,231,696
LiabilitiesPayable for investments purchased $ 26,816Accrued management and administration
fees 3,242Payable for units redeemed 7,120
Total liabilities 37,178Net Assets $ 19,194,518
Net Asset Value, offering price and re-demption price per unit ($19,194,518 / 758,698 units) $ 25.30
Statement of Operations
Year ended December 31,
2017
Investment IncomeIncome distributions from underlying funds $ 259,540ExpensesManagement and administration fees $ 37,648
Total expenses 37,648
Net investment income (loss) 221,892Realized and Unrealized Gain (Loss) on
InvestmentsNet realized gain (loss) on sale of underly-
ing funds’ shares 1,234,941Capital gain distributions from underlying
funds 436,996 1,671,937Change in net unrealized appreciation
(depreciation) on underlying funds’ shares 1,270,867Net gain (loss) 2,942,804Net increase (decrease) in net assets result-
ing from operations $ 3,164,696

69 Annual Report
See accompanying notes which are an integral part of the financial statements.
Delaware Moderate Growth Portfolio (Fidelity Funds)Financial Statements – continued
Statement of Changes in Net Assets
Year ended December 31,
2017
Year ended December 31,
2016Increase (Decrease) in Net Assets:
OperationsNet investment income (loss) $ 221,892 $ 295,406Net realized gain (loss) 1,671,937 833,305Change in net unrealized appreciation (depreciation) 1,270,867 252,852Net increase (decrease) in net assets resulting from operations 3,164,696 1,381,563
Unit transactionsProceeds from sales of units 1,774,443 1,448,669Cost of units redeemed (4,741,718) (4,279,155)Net increase (decrease) in net assets resulting from unit transactions (2,967,275) (2,830,486)Total increase (decrease) in net assets 197,421 (1,448,923)
Net AssetsBeginning of period 18,997,097 20,446,020End of period $ 19,194,518 $ 18,997,097
Other InformationUnit transactions
Sold 74,986 70,742Redeemed (204,338) (205,886)Net increase (decrease) (129,352) (135,144)
Financial Highlights Delaware Moderate Growth Portfolio (Fidelity Funds)
Periods ended December 31, 2017 2016 2015 2014 2013Selected Per Unit Data Net asset value, beginning of period $ 21.39 $ 19.98 $ 19.98 $ 18.85 $ 15.77Income from Investment Operations
Net investment income (loss) A .28 .30 .31 .28 .22Net realized and unrealized gain (loss) 3.63 1.11 (.31) .85 2.86
Total increase (decrease) from investment operations 3.91 1.41 – 1.13 3.08Net asset value, end of period $ 25.30 $ 21.39 $ 19.98 $ 19.98 $ 18.85
Total Return 18.28% 7.06% —% 5.99% 19.53%Ratios and Supplemental Data B Net assets, end of period (in $ thousands) $ 19,195 $ 18,997 $ 20,446 $ 22,150 $ 20,798Ratio of expenses to average net assets .20% .20% .20% .20% .20%Ratio of net investment income (loss) to average net assets 1.18% 1.49% 1.50% 1.44% 1.26%Portfolio Turnover Rate 32% 17% 19% 20% 27%
A Calculated based on average units outstanding during the period.B Amounts do not include the activity of any underlying fund.

70Annual Report
Delaware Aggressive Growth Portfolio (Fidelity Funds)
Investment Summary
Top Holdings as of December 31, 2017% of Portfolio’s
net assetsFidelity Stock Selector All Cap Fund 12.1Fidelity Overseas Fund 11.1Fidelity Diversified International Fund 11.0Fidelity Value Discovery Fund 8.8Fidelity Stock Selector Large Cap Value Fund 8.7Fidelity Growth Company Fund 8.7Fidelity Emerging Markets Fund 8.7Fidelity Large Cap Stock Fund 6.4Fidelity Blue Chip Growth Fund 6.0Fidelity Mega Cap Stock Fund 4.7
86.2
Asset Allocation (% of Portfolio’s net assets)
U.S. Equity Funds 68.2%
Non – U.S. Equity Funds 31.8%

71 Annual Report
See accompanying notes which are an integral part of the financial statements.
U.S. Equity Funds – 68.2%Shares Value
Fidelity Blue Chip Growth Fund 31,415 $ 2,756,967Fidelity Commodity Strategy Fund 42,830 452,289Fidelity Contrafund 14,957 1,831,756Fidelity Growth Company Fund 22,295 3,982,976Fidelity Large Cap Stock Fund 87,738 2,935,704Fidelity Low-Priced Stock Fund 28,413 1,549,090Fidelity Mega Cap Stock Fund 123,868 2,159,023Fidelity Real Estate Investment Portfolio 10,853 453,646Fidelity Stock Selector All Cap Fund 125,975 5,535,339Fidelity Stock Selector Large Cap Value
Fund 192,641 3,991,519Fidelity Stock Selector Small Cap Fund 58,007 1,534,877Fidelity Value Discovery Fund 138,118 3,995,763
TOTAL U.S. EQUITY FUNDS(Cost $23,717,887) 31,178,949
Non – U.S. Equity Funds – 31.8%
Fidelity Canada Fund 8,598 469,963Fidelity Diversified International Fund 125,902 5,038,609Fidelity Emerging Markets Fund 121,439 3,977,130Fidelity Overseas Fund 99,774 5,058,537
TOTAL NON – U.S. EQUITY FUNDS(Cost $11,092,872) 14,544,239
TOTAL INVESTMENT IN SECURITIES – 100.0%(Cost $34,810,759) 45,723,188
NET OTHER ASSETS (LIABILITIES) – 0.0% (7,729)
NET ASSETS – 100% $45,715,459
Delaware Aggressive Growth Portfolio (Fidelity Funds)
Investments December 31, 2017Showing Percentage of Net Assets

72Annual Report
See accompanying notes which are an integral part of the financial statements.
Delaware Aggressive Growth Portfolio (Fidelity Funds)
Financial Statements
Statement of Assets and Liabilities
December 31, 2017
AssetsInvestments in securities at value (cost
$34,810,759) $ 45,723,188Receivable for investments sold 11,682Receivable for units sold 9,047
Total assets 45,743,917
LiabilitiesAccrued management and administration
fees $ 7,733Payable for units redeemed 20,725
Total liabilities 28,458Net Assets $ 45,715,459
Net Asset Value, offering price and re-demption price per unit ($45,715,459 / 1,857,150 units) $ 24.62
Statement of Operations
Year ended December 31,
2017
Investment IncomeIncome distributions from underlying funds $ 387,789ExpensesManagement and administration fees $ 88,986
Total expenses 88,986
Net investment income (loss) 298,803Realized and Unrealized Gain (Loss) on
InvestmentsNet realized gain (loss) on sale of underly-
ing funds’ shares 3,460,333Capital gain distributions from underlying
funds 1,497,093 4,957,426Change in net unrealized appreciation
(depreciation) on underlying funds’ shares 4,533,883Net gain (loss) 9,491,309Net increase (decrease) in net assets result-
ing from operations $ 9,790,112
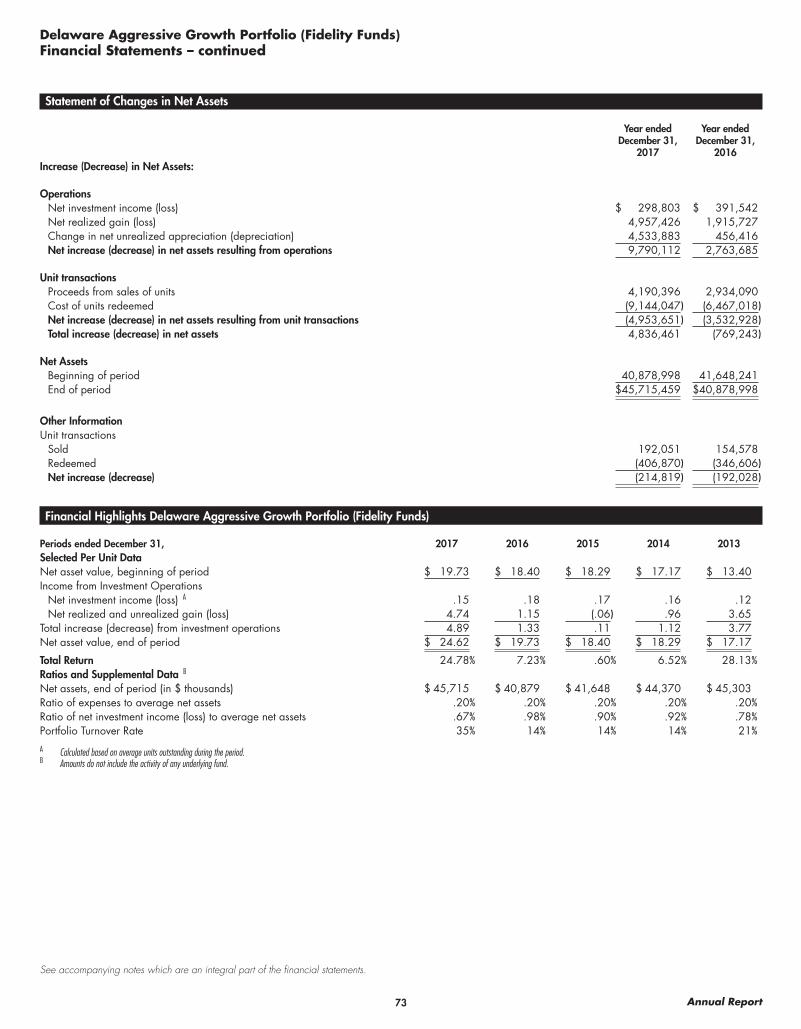
73 Annual Report
See accompanying notes which are an integral part of the financial statements.
Delaware Aggressive Growth Portfolio (Fidelity Funds)Financial Statements – continued
Statement of Changes in Net Assets
Year ended December 31,
2017
Year ended December 31,
2016Increase (Decrease) in Net Assets:
OperationsNet investment income (loss) $ 298,803 $ 391,542Net realized gain (loss) 4,957,426 1,915,727Change in net unrealized appreciation (depreciation) 4,533,883 456,416Net increase (decrease) in net assets resulting from operations 9,790,112 2,763,685
Unit transactionsProceeds from sales of units 4,190,396 2,934,090Cost of units redeemed (9,144,047) (6,467,018)Net increase (decrease) in net assets resulting from unit transactions (4,953,651) (3,532,928)Total increase (decrease) in net assets 4,836,461 (769,243)
Net AssetsBeginning of period 40,878,998 41,648,241End of period $ 45,715,459 $ 40,878,998
Other InformationUnit transactions
Sold 192,051 154,578Redeemed (406,870) (346,606)Net increase (decrease) (214,819) (192,028)
Financial Highlights Delaware Aggressive Growth Portfolio (Fidelity Funds)
Periods ended December 31, 2017 2016 2015 2014 2013Selected Per Unit Data Net asset value, beginning of period $ 19.73 $ 18.40 $ 18.29 $ 17.17 $ 13.40Income from Investment Operations
Net investment income (loss) A .15 .18 .17 .16 .12Net realized and unrealized gain (loss) 4.74 1.15 (.06) .96 3.65
Total increase (decrease) from investment operations 4.89 1.33 .11 1.12 3.77Net asset value, end of period $ 24.62 $ 19.73 $ 18.40 $ 18.29 $ 17.17
Total Return 24.78% 7.23% .60% 6.52% 28.13%Ratios and Supplemental Data B Net assets, end of period (in $ thousands) $ 45,715 $ 40,879 $ 41,648 $ 44,370 $ 45,303Ratio of expenses to average net assets .20% .20% .20% .20% .20%Ratio of net investment income (loss) to average net assets .67% .98% .90% .92% .78%Portfolio Turnover Rate 35% 14% 14% 14% 21%
A Calculated based on average units outstanding during the period.B Amounts do not include the activity of any underlying fund.

74Annual Report
See accompanying notes which are an integral part of the financial statements.
Delaware Money Market Portfolio
Financial Statements
Statement of Assets and Liabilities
December 31, 2017
AssetsInvestments in securities at value
(9,784,800 shares of Fidelity Gov-ernment Cash Reserves Fund; cost $9,784,800) $ 9,784,800
Receivable for investments sold 3,625Receivable for units sold 37,153Distributions receivable 7,456
Total assets 9,833,034
LiabilitiesPayable for investments purchased $ 7,465Accrued management and administration
fees 1,699Payable for units redeemed 40,775
Total liabilities 49,939Net Assets $ 9,783,095
Net Asset Value, offering price and redemption price per unit ($9,783,095 / 897,321 units) $ 10.90
Statement of Operations
Year ended December 31,
2017
Investment IncomeIncome distributions from underlying funds $ 55,830ExpensesManagement and administration fees $ 19,482
Total expenses before reductions 19,482Expense reductions (527) 18,955
Net investment income (loss) 36,875Realized and Unrealized Gain (Loss) on Invest-
ments –Net increase (decrease) in net assets resulting
from operations $ 36,875

75 Annual Report
See accompanying notes which are an integral part of the financial statements.
Delaware Money Market PortfolioFinancial Statements – continued
Statement of Changes in Net Assets
Year ended December 31,
2017
Year ended December 31,
2016Increase (Decrease) in Net Assets:
OperationsNet investment income (loss) $ 36,875 $ 1,362Net increase (decrease) in net assets resulting from operations 36,875 1,362
Unit transactionsProceeds from sales of units 5,436,904 4,633,368Cost of units redeemed (3,289,858) (3,201,085)Net increase (decrease) in net assets resulting from unit transactions 2,147,046 1,432,283Total increase (decrease) in net assets 2,183,921 1,433,645
Net AssetsBeginning of period 7,599,174 6,165,529End of period $ 9,783,095 $ 7,599,174
Other InformationUnit transactions
Sold 500,125 426,645Redeemed (302,304) (294,759)Net increase (decrease) 197,821 131,886
Financial Highlights Delaware Money Market Portfolio
Periods ended December 31, 2017 2016 2015 2014 2013Selected Per Unit Data Net asset value, beginning of period $ 10.86 $ 10.86 $ 10.86 $ 10.86 $ 10.86Income from Investment Operations
Net investment income (loss) A,B $ .04 – – – –Net realized and unrealized gain (loss) – – – – –
Total increase (decrease) from investment operations .04 – – – –Net asset value, end of period $ 10.90 $ 10.86 $ 10.86 $ 10.86 $ 10.86
Total Return C .37% —% —% —% —%Ratios and Supplemental Data D Net assets, end of period (in $ thousands) $ 9,783 $ 7,599 $ 6,166 $ 6,588 $ 6,282Ratio of expenses to average net assets before reductions .20% .20% .20% .20% .20%Ratio of expenses to average net assets after reductions .19% .08% –%E –% –%Ratio of net investment income (loss) to average net assets .38% .02% .01% .01% .01%
A Amount represents less than $.01 per unit.B Calculated based on average units outstanding during the period.C Total returns would have been lower had certain expenses not been reduced during the applicable periods shown.D Amounts do not include the activity of any underlying fund.E Amount represents less than 0 .01%.

76Annual Report
Delaware College Portfolio (Fidelity Index)
Investment Summary
Top Holdings as of December 31, 2017% of Portfolio’s
net assetsFidelity U.S. Bond Index Fund Institutional Premium Class 50.0Fidelity Investments Money Market Government Portfolio Institutional Class 30.0Fidelity Total Market Index Fund Institutional Premium Class 12.9Fidelity International Index Fund Institutional Premium Class 6.0Fidelity Commodity Strategy Fund 1.1
100.0
Asset Allocation (% of Portfolio’s net assets)
U.S. Equity Funds 12.9%
Commodity Funds 1.1%
Non – U.S. Equity Funds 6.0%
Bond Funds 50.0%
Short-Term Funds 30.0%

77 Annual Report
See accompanying notes which are an integral part of the financial statements.
U.S. Equity Funds – 12.9%Shares Value
Fidelity Total Market Index Fund Institutional Premium Class(Cost $796,855) 12,557 $ 958,711
Commodity Funds – 1.1%
Fidelity Commodity Strategy Fund(Cost $76,389) 7,635 80,628
Non – U.S. Equity Funds – 6.0%
Fidelity International Index Fund Institutional Premium Class(Cost $385,132) 10,368 447,704
Bond Funds – 50.0%
Fidelity U.S. Bond Index Fund Institutional Premium Class(Cost $3,697,499) 320,960 3,719,932
Short-Term Funds – 30.0%
Fidelity Investments Money Market Government Portfolio Institutional Class 1.19% (a)(Cost $2,226,773) 2,226,773 2,226,773
TOTAL INVESTMENT IN SECURITIES – 100.0%(Cost $7,182,648) 7,433,748
NET OTHER ASSETS (LIABILITIES) – 0.0% (596)
NET ASSETS – 100% $ 7,433,152
Legend(a) The rate quoted is the annualized seven-day yield of the fund at
period end.
Delaware College Portfolio (Fidelity Index)
Investments December 31, 2017Showing Percentage of Net Assets

78Annual Report
See accompanying notes which are an integral part of the financial statements.
Delaware College Portfolio (Fidelity Index)
Financial Statements
Statement of Assets and Liabilities
December 31, 2017
AssetsInvestments in securities at value (cost
$7,182,648) $ 7,433,748Receivable for investments sold 14,430Receivable for units sold 24,138Distributions receivable 10,698
Total assets 7,483,014
LiabilitiesPayable for investments purchased $ 40,942Accrued management and administration
fees 581Payable for units redeemed 8,339
Total liabilities 49,862Net Assets $ 7,433,152
Net Asset Value, offering price and redemption price per unit ($7,433,152 / 496,310 units) $ 14.98
Statement of Operations
Year ended December 31,
2017
Investment IncomeIncome distributions from underlying funds $ 157,681ExpensesManagement and administration fees $ 7,902
Total expenses 7,902
Net investment income (loss) 149,779Realized and Unrealized Gain (Loss) on Invest-
mentsNet realized gain (loss) on sale of underlying
funds’ shares 94,696Capital gain distributions from underlying funds 10,192 104,888Change in net unrealized appreciation (depre-
ciation) on underlying funds’ shares 254,748Net gain (loss) 359,636Net increase (decrease) in net assets resulting
from operations $ 509,415

79 Annual Report
See accompanying notes which are an integral part of the financial statements.
Delaware College Portfolio (Fidelity Index)Financial Statements – continued
Statement of Changes in Net Assets
Year ended December 31,
2017
Year ended December 31,
2016Increase (Decrease) in Net Assets:
OperationsNet investment income (loss) $ 149,779 $ 84,941Net realized gain (loss) 104,888 26,003Change in net unrealized appreciation (depreciation) 254,748 3,990Net increase (decrease) in net assets resulting from operations 509,415 114,934
Unit transactionsProceeds from sales of units 1,584,435 7,381,052Cost of units redeemed (4,226,331) (1,545,350)Net increase (decrease) in net assets resulting from unit transactions (2,641,896) 5,835,702Total increase (decrease) in net assets (2,132,481) 5,950,636
Net AssetsBeginning of period 9,565,633 3,614,997End of period $ 7,433,152 $ 9,565,633
Other InformationUnit transactions
Sold 108,957 522,772Redeemed (289,237) (109,779)Net increase (decrease) (180,280) 412,993
Financial Highlights Delaware College Portfolio (Fidelity Index)
Periods ended December 31, 2017 2016 2015 2014 2013Selected Per Unit Data Net asset value, beginning of period $ 14.14 $ 13.71 $ 13.73 $ 13.31 $ 12.84Income from Investment Operations
Net investment income (loss) A .25 .30 .21 .17 .26Net realized and unrealized gain (loss) .59 .13 (.23) .25 .21
Total increase (decrease) from investment operations .84 .43 (.02) .42 .47Net asset value, end of period $ 14.98 $ 14.14 $ 13.71 $ 13.73 $ 13.31
Total Return 5.94% 3.14% (.15)% 3.16% 3.66%Ratios and Supplemental Data B Net assets, end of period (in $ thousands) $ 7,433 $ 9,566 $ 3,615 $ 3,983 $ 5,564Ratio of expenses to average net assets .09% .09% .09% .09% .12%Ratio of net investment income (loss) to average net assets 1.71% 2.17% 1.52% 1.22% 2.00%Portfolio Turnover Rate 15% 65% 36% 14% 71%
A Calculated based on average units outstanding during the period.B Amounts do not include the activity of any underlying fund.

80Annual Report
Delaware Portfolio 2018 (Fidelity Index)
Investment Summary
Top Holdings as of December 31, 2017% of Portfolio’s
net assetsFidelity U.S. Bond Index Fund Institutional Premium Class 50.1Fidelity Investments Money Market Government Portfolio Institutional Class 27.7Fidelity Total Market Index Fund Institutional Premium Class 14.4Fidelity International Index Fund Institutional Premium Class 6.7Fidelity Commodity Strategy Fund 1.1
100.0
Asset Allocation (% of Portfolio’s net assets)
U.S. Equity Funds 14.4%
Commodity Funds 1.1%
Non – U.S. Equity Funds 6.7%
Bond Funds 50.1%
Short-Term Funds 27.7%
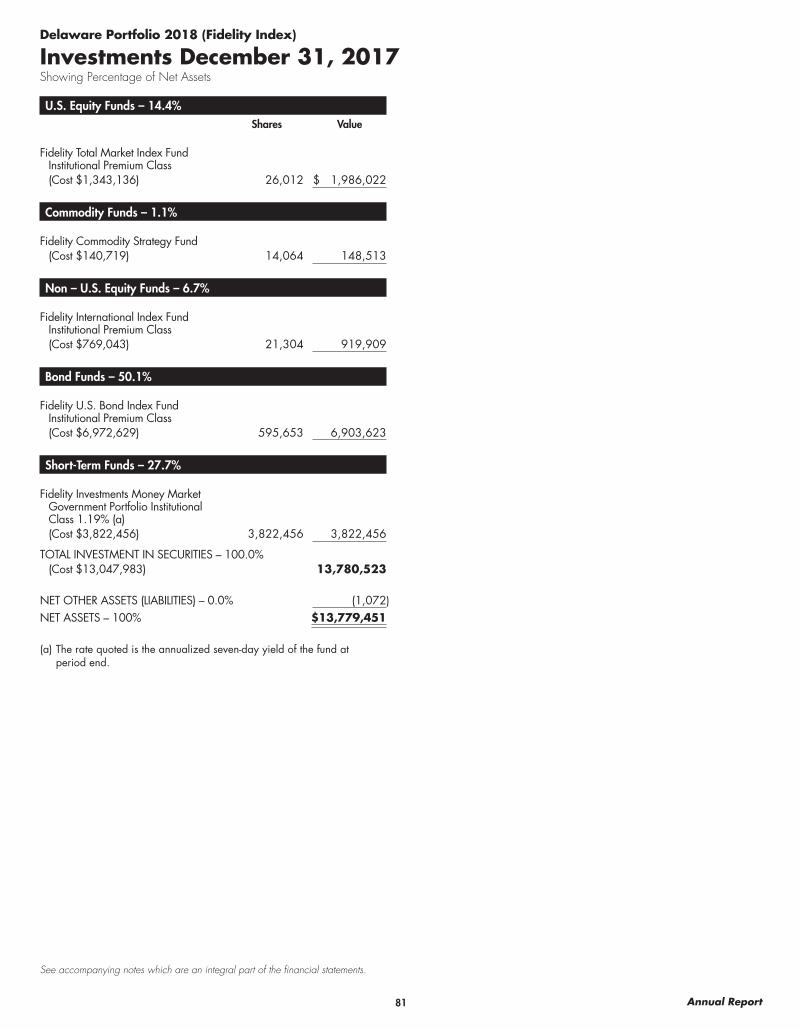
81 Annual Report
See accompanying notes which are an integral part of the financial statements.
U.S. Equity Funds – 14.4%Shares Value
Fidelity Total Market Index Fund Institutional Premium Class(Cost $1,343,136) 26,012 $ 1,986,022
Commodity Funds – 1.1%
Fidelity Commodity Strategy Fund(Cost $140,719) 14,064 148,513
Non – U.S. Equity Funds – 6.7%
Fidelity International Index Fund Institutional Premium Class(Cost $769,043) 21,304 919,909
Bond Funds – 50.1%
Fidelity U.S. Bond Index Fund Institutional Premium Class(Cost $6,972,629) 595,653 6,903,623
Short-Term Funds – 27.7%
Fidelity Investments Money Market Government Portfolio Institutional Class 1.19% (a)(Cost $3,822,456) 3,822,456 3,822,456
TOTAL INVESTMENT IN SECURITIES – 100.0%(Cost $13,047,983) 13,780,523
NET OTHER ASSETS (LIABILITIES) – 0.0% (1,072)
NET ASSETS – 100% $13,779,451
(a) The rate quoted is the annualized seven-day yield of the fund at period end.
Delaware Portfolio 2018 (Fidelity Index)
Investments December 31, 2017Showing Percentage of Net Assets

82Annual Report
See accompanying notes which are an integral part of the financial statements.
Delaware Portfolio 2018 (Fidelity Index)
Financial Statements
Statement of Assets and Liabilities
December 31, 2017
AssetsInvestments in securities at value (cost
$13,047,983) $ 13,780,523Receivable for investments sold 80,391Receivable for units sold 20,697Distributions receivable 19,140
Total assets 13,900,751
LiabilitiesPayable for investments purchased $ 110,470Accrued management and administration
fees 1,054Payable for units redeemed 9,776
Total liabilities 121,300Net Assets $ 13,779,451
Net Asset Value, offering price and re-demption price per unit ($13,779,451 / 860,639 units) $ 16.01
Statement of Operations
Year ended December 31,
2017
Investment IncomeIncome distributions from underlying funds $ 247,327ExpensesManagement and administration fees $ 11,775
Total expenses 11,775
Net investment income (loss) 235,552Realized and Unrealized Gain (Loss) on Invest-
mentsNet realized gain (loss) on sale of underlying
funds’ shares 237,517Capital gain distributions from underlying
funds 19,593 257,110Change in net unrealized appreciation (depre-
ciation) on underlying funds’ shares 372,554Net gain (loss) 629,664Net increase (decrease) in net assets resulting
from operations $ 865,216

83 Annual Report
See accompanying notes which are an integral part of the financial statements.
Delaware Portfolio 2018 (Fidelity Index)Financial Statements – continued
Statement of Changes in Net Assets
Year ended December 31,
2017
Year ended December 31,
2016Increase (Decrease) in Net Assets:
OperationsNet investment income (loss) $ 235,552 $ 200,536Net realized gain (loss) 257,110 193,402Change in net unrealized appreciation (depreciation) 372,554 24,483Net increase (decrease) in net assets resulting from operations 865,216 418,421
Unit transactionsProceeds from sales of units 2,325,131 1,842,236Cost of units redeemed (1,124,103) (924,930)Net increase (decrease) in net assets resulting from unit transactions 1,201,028 917,306Total increase (decrease) in net assets 2,066,244 1,335,727
Net AssetsBeginning of period 11,713,207 10,377,480End of period $ 13,779,451 $ 11,713,207
Other InformationUnit transactions
Sold 150,494 125,065Redeemed (71,937) (62,238)Net increase (decrease) 78,557 62,827
Financial Highlights Delaware Portfolio 2018 (Fidelity Index)
Periods ended December 31, 2017 2016 2015 2014 2013Selected Per Unit Data Net asset value, beginning of period $ 14.98 $ 14.43 $ 14.43 $ 13.83 $ 12.57Income from Investment Operations
Net investment income (loss) A .28 .26 .25 .24 .20Net realized and unrealized gain (loss) .75 .29 (.25) .36 1.06
Total increase (decrease) from investment operations 1.03 .55 – .60 1.26Net asset value, end of period $ 16.01 $ 14.98 $ 14.43 $ 14.43 $ 13.83
Total Return 6.88% 3.81% —% 4.34% 10.02%Ratios and Supplemental Data B Net assets, end of period (in $ thousands) $ 13,779 $ 11,713 $ 10,377 $ 9,384 $ 7,513Ratio of expenses to average net assets .09% .09% .09% .09% .12%Ratio of net investment income (loss) to average net assets 1.80% 1.76% 1.72% 1.68% 1.50%Portfolio Turnover Rate 15% 35% 16% 13% 27%
A Calculated based on average units outstanding during the period.B Amounts do not include the activity of any underlying fund.

84Annual Report
Delaware Portfolio 2021 (Fidelity Index)
Investment Summary
Top Holdings as of December 31, 2017% of Portfolio’s
net assetsFidelity U.S. Bond Index Fund Institutional Premium Class 47.5Fidelity Total Market Index Fund Institutional Premium Class 23.5Fidelity Investments Money Market Government Portfolio Institutional Class 17.3Fidelity International Index Fund Institutional Premium Class 10.6Fidelity Commodity Strategy Fund 1.1
100.0
Asset Allocation (% of Portfolio’s net assets)
U.S. Equity Funds 23.5%
Commodity Funds 1.1%
Non – U.S. Equity Funds 10.6%
Bond Funds 47.5%
Short-Term Funds 17.3%

85 Annual Report
See accompanying notes which are an integral part of the financial statements.
U.S. Equity Funds – 23.5%Shares Value
Fidelity Total Market Index Fund Institutional Premium Class(Cost $2,530,849) 48,794 $ 3,725,397
Commodity Funds – 1.1%
Fidelity Commodity Strategy Fund(Cost $160,430) 16,036 169,335
Non – U.S. Equity Funds – 10.6%
Fidelity International Index Fund Institutional Premium Class(Cost $1,405,247) 38,884 1,679,030
Bond Funds – 47.5%
Fidelity U.S. Bond Index Fund Institutional Premium Class(Cost $7,586,602) 648,594 7,517,205
Short-Term Funds – 17.3%
Fidelity Investments Money Market Government Portfolio Institutional Class 1.19% (a)(Cost $2,736,140) 2,736,140 2,736,140
TOTAL INVESTMENT IN SECURITIES – 100.0%(Cost $14,419,268) 15,827,107
NET OTHER ASSETS (LIABILITIES) – 0.0% (1,218)
NET ASSETS – 100% $15,825,889
Legend(a) The rate quoted is the annualized seven-day yield of the fund at
period end.
Delaware Portfolio 2021 (Fidelity Index)
Investments December 31, 2017Showing Percentage of Net Assets
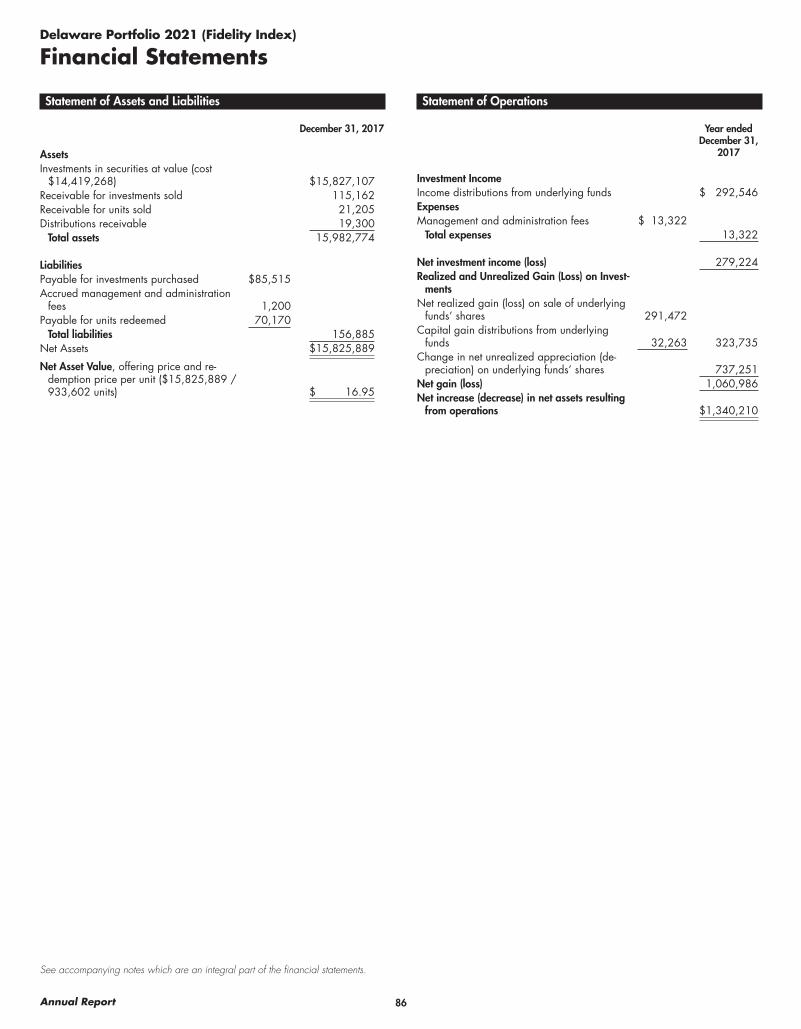
86Annual Report
See accompanying notes which are an integral part of the financial statements.
Delaware Portfolio 2021 (Fidelity Index)
Financial Statements
Statement of Assets and Liabilities
December 31, 2017
AssetsInvestments in securities at value (cost
$14,419,268) $ 15,827,107Receivable for investments sold 115,162Receivable for units sold 21,205Distributions receivable 19,300
Total assets 15,982,774
LiabilitiesPayable for investments purchased $ 85,515Accrued management and administration
fees 1,200Payable for units redeemed 70,170
Total liabilities 156,885Net Assets $ 15,825,889
Net Asset Value, offering price and re-demption price per unit ($15,825,889 / 933,602 units) $ 16.95
Statement of Operations
Year ended December 31,
2017
Investment IncomeIncome distributions from underlying funds $ 292,546ExpensesManagement and administration fees $ 13,322
Total expenses 13,322
Net investment income (loss) 279,224Realized and Unrealized Gain (Loss) on Invest-
mentsNet realized gain (loss) on sale of underlying
funds’ shares 291,472Capital gain distributions from underlying
funds 32,263 323,735Change in net unrealized appreciation (de-
preciation) on underlying funds’ shares 737,251Net gain (loss) 1,060,986Net increase (decrease) in net assets resulting
from operations $ 1,340,210

87 Annual Report
See accompanying notes which are an integral part of the financial statements.
Delaware Portfolio 2021 (Fidelity Index)Financial Statements – continued
Statement of Changes in Net Assets
Year ended December 31,
2017
Year ended December 31,
2016Increase (Decrease) in Net Assets:
OperationsNet investment income (loss) $ 279,224 $ 227,376Net realized gain (loss) 323,735 210,412Change in net unrealized appreciation (depreciation) 737,251 106,760Net increase (decrease) in net assets resulting from operations 1,340,210 544,548
Unit transactionsProceeds from sales of units 1,563,336 3,181,557Cost of units redeemed (679,800) (438,242)Net increase (decrease) in net assets resulting from unit transactions 883,536 2,743,315Total increase (decrease) in net assets 2,223,746 3,287,863
Net AssetsBeginning of period 13,602,143 10,314,280End of period $ 15,825,889 $ 13,602,143
Other InformationUnit transactions
Sold 96,237 209,322Redeemed (41,623) (28,929)Net increase (decrease) 54,614 180,393
Financial Highlights Delaware Portfolio 2021 (Fidelity Index)
Periods ended December 31, 2017 2016 2015 2014 2013Selected Per Unit Data Net asset value, beginning of period $ 15.47 $ 14.76 $ 14.76 $ 14.06 $ 12.31Income from Investment Operations
Net investment income (loss) A .31 .29 .27 .27 .22Net realized and unrealized gain (loss) 1.17 .42 (.27) .43 1.53
Total increase (decrease) from investment operations 1.48 .71 – .70 1.75Net asset value, end of period $ 16.95 $ 15.47 $ 14.76 $ 14.76 $ 14.06
Total Return 9.57% 4.81% —% 4.98% 14.22%Ratios and Supplemental Data B Net assets, end of period (in $ thousands) $ 15,826 $ 13,602 $ 10,314 $ 9,176 $ 7,491Ratio of expenses to average net assets .09% .09% .09% .09% .12%Ratio of net investment income (loss) to average net assets 1.89% 1.94% 1.83% 1.88% 1.69%Portfolio Turnover Rate 13% 26% 12% 10% 22%
A Calculated based on average units outstanding during the period.B Amounts do not include the activity of any underlying fund.

88Annual Report
Delaware Portfolio 2024 (Fidelity Index)
Investment Summary
Top Holdings as of December 31, 2017% of Portfolio’s
net assetsFidelity U.S. Bond Index Fund Institutional Premium Class 41.1Fidelity Total Market Index Fund Institutional Premium Class 32.3Fidelity International Index Fund Institutional Premium Class 14.4Fidelity Investments Money Market Government Portfolio Institutional Class 11.0Fidelity Commodity Strategy Fund 1.2
100.0
Asset Allocation (% of Portfolio’s net assets)
U.S. Equity Funds 32.3%
Commodity Funds 1.2%
Non – U.S. Equity Funds 14.4%
Bond Funds 41.1%
Short-Term Funds 11.0%

89 Annual Report
See accompanying notes which are an integral part of the financial statements.
U.S. Equity Funds – 32.3%Shares Value
Fidelity Total Market Index Fund Institutional Premium Class(Cost $3,630,079) 74,324 $ 5,674,658
Commodity Funds – 1.2%
Fidelity Commodity Strategy Fund(Cost $195,408) 19,513 206,059
Non – U.S. Equity Funds – 14.4%
Fidelity International Index Fund Institutional Premium Class(Cost $2,107,911) 58,618 2,531,112
Bond Funds – 41.1%
Fidelity U.S. Bond Index Fund Institutional Premium Class(Cost $7,287,070) 623,297 7,224,016
Short-Term Funds – 11.0%
Fidelity Investments Money Market Government Portfolio Institutional Class 1.19% (a)(Cost $1,932,443) 1,932,443 1,932,443
TOTAL INVESTMENT IN SECURITIES – 100.0%(Cost $15,152,911) 17,568,288
NET OTHER ASSETS (LIABILITIES) – 0.0% (1,340)
NET ASSETS – 100% $17,566,948
Legend(a) The rate quoted is the annualized seven-day yield of the fund at
period end.
Delaware Portfolio 2024 (Fidelity Index)
Investments December 31, 2017Showing Percentage of Net Assets

90Annual Report
See accompanying notes which are an integral part of the financial statements.
Delaware Portfolio 2024 (Fidelity Index)
Financial Statements
Statement of Assets and Liabilities
December 31, 2017
AssetsInvestments in securities at value (cost
$15,152,911) $ 17,568,288Receivable for investments sold 100,775Receivable for units sold 14,705Distributions receivable 17,846
Total assets 17,701,614
LiabilitiesPayable for investments purchased $ 125,523Accrued management and administration
fees 1,330Payable for units redeemed 7,813
Total liabilities 134,666Net Assets $ 17,566,948
Net Asset Value, offering price and re-demption price per unit ($17,566,948 / 986,488 units) $ 17.81
Statement of Operations
Year ended December 31,
2017
Investment IncomeIncome distributions from underlying funds $ 325,414ExpensesManagement and administration fees $ 14,381
Total expenses 14,381
Net investment income (loss) 311,033Realized and Unrealized Gain (Loss) on Invest-
mentsNet realized gain (loss) on sale of underlying
funds’ shares 319,645Capital gain distributions from underlying
funds 45,819 365,464Change in net unrealized appreciation (de-
preciation) on underlying funds’ shares 1,131,752Net gain (loss) 1,497,216Net increase (decrease) in net assets resulting
from operations $ 1,808,249

91 Annual Report
See accompanying notes which are an integral part of the financial statements.
Delaware Portfolio 2024 (Fidelity Index)Financial Statements – continued
Statement of Changes in Net Assets
Year ended December 31,
2017
Year ended December 31,
2016Increase (Decrease) in Net Assets:
OperationsNet investment income (loss) $ 311,033 $ 269,646Net realized gain (loss) 365,464 317,177Change in net unrealized appreciation (depreciation) 1,131,752 179,831Net increase (decrease) in net assets resulting from operations 1,808,249 766,654
Unit transactionsProceeds from sales of units 1,837,371 1,911,231Cost of units redeemed (624,986) (716,068)Net increase (decrease) in net assets resulting from unit transactions 1,212,385 1,195,163Total increase (decrease) in net assets 3,020,634 1,961,817
Net AssetsBeginning of period 14,546,314 12,584,497End of period $ 17,566,948 $ 14,546,314
Other InformationUnit transactions
Sold 108,531 123,678Redeemed (37,330) (46,010)Net increase (decrease) 71,201 77,668
Financial Highlights Delaware Portfolio 2024 (Fidelity Index)
Periods ended December 31, 2017 2016 2015 2014 2013Selected Per Unit Data Net asset value, beginning of period $ 15.89 $ 15.02 $ 15.03 $ 14.25 $ 12.03Income from Investment Operations
Net investment income (loss) A .33 .31 .29 .29 .24Net realized and unrealized gain (loss) 1.59 .56 (.30) .49 1.98
Total increase (decrease) from investment operations 1.92 .87 (.01) .78 2.22Net asset value, end of period $ 17.81 $ 15.89 $ 15.02 $ 15.03 $ 14.25
Total Return 12.08% 5.79% (.07)% 5.47% 18.45%Ratios and Supplemental Data B Net assets, end of period (in $ thousands) $ 17,567 $ 14,546 $ 12,584 $ 11,295 $ 9,946Ratio of expenses to average net assets .09% .09% .09% .09% .12%Ratio of net investment income (loss) to average net assets 1.95% 2.00% 1.92% 1.94% 1.79%Portfolio Turnover Rate 11% 21% 13% 16% 18%
A Calculated based on average units outstanding during the period.B Amounts do not include the activity of any underlying fund.

92Annual Report
Delaware Portfolio 2027 (Fidelity Index)
Investment Summary
Top Holdings as of December 31, 2017% of Portfolio’s
net assetsFidelity Total Market Index Fund Institutional Premium Class 40.8Fidelity U.S. Bond Index Fund Institutional Premium Class 34.9Fidelity International Index Fund Institutional Premium Class 18.1Fidelity Investments Money Market Government Portfolio Institutional Class 5.0Fidelity Commodity Strategy Fund 1.2
100.0
Asset Allocation (% of Portfolio’s net assets)
U.S. Equity Funds 40.8%
Commodity Funds 1.2%
Non – U.S. Equity Funds 18.1%
Bond Funds 34.9%
Short-Term Funds 5.0%

93 Annual Report
See accompanying notes which are an integral part of the financial statements.
U.S. Equity Funds – 40.8%Shares Value
Fidelity Total Market Index Fund Institutional Premium Class(Cost $3,344,714) 66,242 $ 5,057,568
Commodity Funds – 1.2%
Fidelity Commodity Strategy Fund(Cost $144,440) 14,427 152,348
Non – U.S. Equity Funds – 18.1%
Fidelity International Index Fund Institutional Premium Class(Cost $1,882,837) 51,937 2,242,642
Bond Funds – 34.9%
Fidelity U.S. Bond Index Fund Institutional Premium Class(Cost $4,355,075) 372,725 4,319,884
Short-Term Funds – 5.0%
Fidelity Investments Money Market Government Portfolio Institutional Class 1.19% (a)(Cost $614,699) 614,699 614,699
TOTAL INVESTMENT IN SECURITIES – 100.0%(Cost $10,341,765) 12,387,141
NET OTHER ASSETS (LIABILITIES) – 0.0% (940)
NET ASSETS – 100% $12,386,201
Legend(a) The rate quoted is the annualized seven-day yield of the fund at
period end.
Delaware Portfolio 2027 (Fidelity Index)
Investments December 31, 2017Showing Percentage of Net Assets

94Annual Report
See accompanying notes which are an integral part of the financial statements.
Delaware Portfolio 2027 (Fidelity Index)
Financial Statements
Statement of Assets and Liabilities
December 31, 2017
AssetsInvestments in securities at value (cost
$10,341,765) $ 12,387,141Receivable for investments sold 74,169Receivable for units sold 2,375Distributions receivable 10,133
Total assets 12,473,818
LiabilitiesPayable for investments purchased $ 86,681Accrued management and administration
fees 936Total liabilities 87,617
Net Assets $ 12,386,201
Net Asset Value, offering price and re-demption price per unit ($12,386,201 / 731,314 units) $ 16.94
Statement of Operations
Year ended December 31,
2017
Investment IncomeIncome distributions from underlying funds $ 232,728ExpensesManagement and administration fees $ 9,999
Total expenses 9,999
Net investment income (loss) 222,729Realized and Unrealized Gain (Loss) on Invest-
mentsNet realized gain (loss) on sale of underlying
funds’ shares 252,230Capital gain distributions from underlying
funds 39,196 291,426Change in net unrealized appreciation (de-
preciation) on underlying funds’ shares 985,087Net gain (loss) 1,276,513Net increase (decrease) in net assets resulting
from operations $ 1,499,242

95 Annual Report
See accompanying notes which are an integral part of the financial statements.
Delaware Portfolio 2027 (Fidelity Index)Financial Statements – continued
Statement of Changes in Net Assets
Year ended December 31,
2017
Year ended December 31,
2016Increase (Decrease) in Net Assets:
OperationsNet investment income (loss) $ 222,729 $ 189,453Net realized gain (loss) 291,426 193,095Change in net unrealized appreciation (depreciation) 985,087 199,159Net increase (decrease) in net assets resulting from operations 1,499,242 581,707
Unit transactionsProceeds from sales of units 1,626,140 1,600,286Cost of units redeemed (523,544) (206,204)Net increase (decrease) in net assets resulting from unit transactions 1,102,596 1,394,082Total increase (decrease) in net assets 2,601,838 1,975,789
Net AssetsBeginning of period 9,784,363 7,808,574End of period $ 12,386,201 $ 9,784,363
Other InformationUnit transactions
Sold 102,389 112,423Redeemed (32,852) (14,371)Net increase (decrease) 69,537 98,052
Financial Highlights Delaware Portfolio 2027 (Fidelity Index)
Periods ended December 31, 2017 2016 2015 2014 2013Selected Per Unit Data Net asset value, beginning of period $ 14.78 $ 13.85 $ 13.87 $ 13.12 $ 10.75Income from Investment Operations
Net investment income (loss) A .32 .31 .28 .27 .22Net realized and unrealized gain (loss) 1.84 .62 (.30) .48 2.15
Total increase (decrease) from investment operations 2.16 .93 (.02) .75 2.37Net asset value, end of period $ 16.94 $ 14.78 $ 13.85 $ 13.87 $ 13.12
Total Return 14.61% 6.71% (.14)% 5.72% 22.05%Ratios and Supplemental Data B Net assets, end of period (in $ thousands) $ 12,386 $ 9,784 $ 7,809 $ 7,046 $ 6,165Ratio of expenses to average net assets .09% .09% .09% .09% .12%Ratio of net investment income (loss) to average net assets 2.00% 2.17% 2.02% 1.99% 1.81%Portfolio Turnover Rate 13% 14% 15% 15% 17%
A Calculated based on average units outstanding during the period.B Amounts do not include the activity of any underlying fund.

96Annual Report
Delaware Portfolio 2030 (Fidelity Index)
Investment Summary
Top Holdings as of December 31, 2017% of Portfolio’s
net assetsFidelity Total Market Index Fund Institutional Premium Class 49.3Fidelity U.S. Bond Index Fund Institutional Premium Class 27.6Fidelity International Index Fund Institutional Premium Class 21.8Fidelity Commodity Strategy Fund 1.3
100.0
Asset Allocation (% of Portfolio’s net assets)
U.S. Equity Funds 49.3%
Commodity Funds 1.3%
Non – U.S. Equity Funds 21.8%
Bond Funds 27.6%

97 Annual Report
See accompanying notes which are an integral part of the financial statements.
U.S. Equity Funds – 49.3%Shares Value
Fidelity Total Market Index Fund Institutional Premium Class(Cost $1,903,866) 33,393 $ 2,549,568
Commodity Funds – 1.3%
Fidelity Commodity Strategy Fund(Cost $64,122) 6,395 67,530
Non – U.S. Equity Funds – 21.8%
Fidelity International Index Fund Institutional Premium Class(Cost $976,727) 26,089 1,126,505
Bond Funds – 27.6%
Fidelity U.S. Bond Index Fund Institutional Premium Class(Cost $1,434,571) 123,092 1,426,631
TOTAL INVESTMENT IN SECURITIES – 100.0%(Cost $4,379,286) 5,170,234
NET OTHER ASSETS (LIABILITIES) – 0.0% (384)
NET ASSETS – 100% $ 5,169,850
Delaware Portfolio 2030 (Fidelity Index)
Investments December 31, 2017Showing Percentage of Net Assets

98Annual Report
See accompanying notes which are an integral part of the financial statements.
Delaware Portfolio 2030 (Fidelity Index)
Financial Statements
Statement of Assets and Liabilities
December 31, 2017
AssetsInvestments in securities at value (cost
$4,379,286) $ 5,170,234Receivable for investments sold 25,183Receivable for units sold 7,100Distributions receivable 3,086
Total assets 5,205,603
LiabilitiesPayable for investments purchased $ 35,369Accrued management and administration
fees 384Total liabilities 35,753
Net Assets $ 5,169,850
Net Asset Value, offering price and redemption price per unit ($5,169,850 / 273,145 units) $ 18.93
Statement of Operations
Year ended December 31,
2017
Investment IncomeIncome distributions from underlying funds $ 94,951ExpensesManagement and administration fees $ 4,061
Total expenses 4,061
Net investment income (loss) 90,890Realized and Unrealized Gain (Loss) on Invest-
mentsNet realized gain (loss) on sale of underlying
funds’ shares 75,716Capital gain distributions from underlying funds 18,807 94,523Change in net unrealized appreciation (depre-
ciation) on underlying funds’ shares 519,017Net gain (loss) 613,540Net increase (decrease) in net assets resulting
from operations $ 704,430

99 Annual Report
See accompanying notes which are an integral part of the financial statements.
Delaware Portfolio 2030 (Fidelity Index)Financial Statements – continued
Statement of Changes in Net Assets
Year ended December 31,
2017
Year ended December 31,
2016Increase (Decrease) in Net Assets:
OperationsNet investment income (loss) $ 90,890 $ 75,280Net realized gain (loss) 94,523 45,941Change in net unrealized appreciation (depreciation) 519,017 139,360Net increase (decrease) in net assets resulting from operations 704,430 260,581
Unit transactionsProceeds from sales of units 818,592 821,835Cost of units redeemed (228,722) (240,585)Net increase (decrease) in net assets resulting from unit transactions 589,870 581,250Total increase (decrease) in net assets 1,294,300 841,831
Net AssetsBeginning of period 3,875,550 3,033,719End of period $ 5,169,850 $ 3,875,550
Other InformationUnit transactions
Sold 46,299 53,579Redeemed (12,774) (15,620)Net increase (decrease) 33,525 37,959
Financial Highlights Delaware Portfolio 2030 (Fidelity Index)
Periods ended December 31, 2017 2016 2015 2014 2013Selected Per Unit Data Net asset value, beginning of period $ 16.17 $ 15.04 $ 15.08 $ 14.25 $ 11.49Income from Investment Operations
Net investment income (loss) A .35 .34 .33 .32 .26Net realized and unrealized gain (loss) 2.41 .79 (.37) .51 2.50
Total increase (decrease) from investment operations 2.76 1.13 (.04) .83 2.76Net asset value, end of period $ 18.93 $ 16.17 $ 15.04 $ 15.08 $ 14.25
Total Return 17.07% 7.51% (.27)% 5.82% 24.02%Ratios and Supplemental Data B Net assets, end of period (in $ thousands) $ 5,170 $ 3,876 $ 3,034 $ 2,232 $ 1,417Ratio of expenses to average net assets .09% .09% .09% .09% .12%Ratio of net investment income (loss) to average net assets 2.01% 2.20% 2.18% 2.19% 1.98%Portfolio Turnover Rate 13% 15% 13% 8% 15%
A Calculated based on average units outstanding during the period.B Amounts do not include the activity of any underlying fund.

100Annual Report
Delaware Portfolio 2033 (Fidelity Index)
Investment Summary
Top Holdings as of December 31, 2017% of Portfolio’s
net assetsFidelity Total Market Index Fund Institutional Premium Class 57.9Fidelity International Index Fund Institutional Premium Class 25.5Fidelity U.S. Bond Index Fund Institutional Premium Class 15.3Fidelity Commodity Strategy Fund 1.3
100.0
Asset Allocation (% of Portfolio’s net assets)
U.S. Equity Funds 57.9%
Commodity Funds 1.3%
Non – U.S. Equity Funds 25.5%
Bond Funds 15.3%
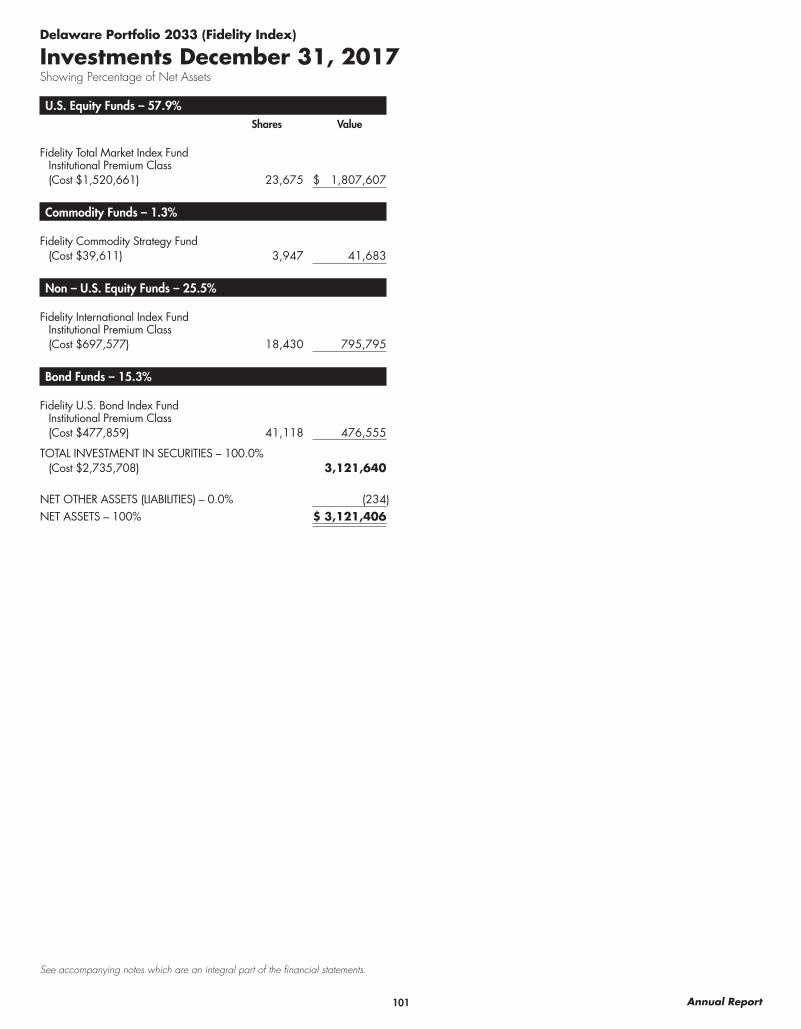
101 Annual Report
See accompanying notes which are an integral part of the financial statements.
U.S. Equity Funds – 57.9%Shares Value
Fidelity Total Market Index Fund Institutional Premium Class(Cost $1,520,661) 23,675 $ 1,807,607
Commodity Funds – 1.3%
Fidelity Commodity Strategy Fund(Cost $39,611) 3,947 41,683
Non – U.S. Equity Funds – 25.5%
Fidelity International Index Fund Institutional Premium Class(Cost $697,577) 18,430 795,795
Bond Funds – 15.3%
Fidelity U.S. Bond Index Fund Institutional Premium Class(Cost $477,859) 41,118 476,555
TOTAL INVESTMENT IN SECURITIES – 100.0%(Cost $2,735,708) 3,121,640
NET OTHER ASSETS (LIABILITIES) – 0.0% (234)
NET ASSETS – 100% $ 3,121,406
Delaware Portfolio 2033 (Fidelity Index)
Investments December 31, 2017Showing Percentage of Net Assets

102Annual Report
See accompanying notes which are an integral part of the financial statements.
Delaware Portfolio 2033 (Fidelity Index)
Financial Statements
Statement of Assets and Liabilities
December 31, 2017
AssetsInvestments in securities at value (cost
$2,735,708) $ 3,121,640Receivable for investments sold 13,117Receivable for units sold 2,440Distributions receivable 1,032
Total assets 3,138,229
LiabilitiesPayable for investments purchased $ 16,589Accrued management and administration
fees 234Total liabilities 16,823
Net Assets $ 3,121,406
Net Asset Value, offering price and redemption price per unit ($3,121,406 / 223,974 units) $ 13.94
Statement of Operations
Year ended December 31,
2017
Investment IncomeIncome distributions from underlying funds $ 54,808ExpensesManagement and administration fees $ 2,218
Total expenses 2,218
Net investment income (loss) 52,590Realized and Unrealized Gain (Loss) on Invest-
mentsNet realized gain (loss) on sale of underlying
funds’ shares 22,769Capital gain distributions from underlying funds 12,754 35,523Change in net unrealized appreciation (depre-
ciation) on underlying funds’ shares 343,945Net gain (loss) 379,468Net increase (decrease) in net assets resulting
from operations $ 432,058
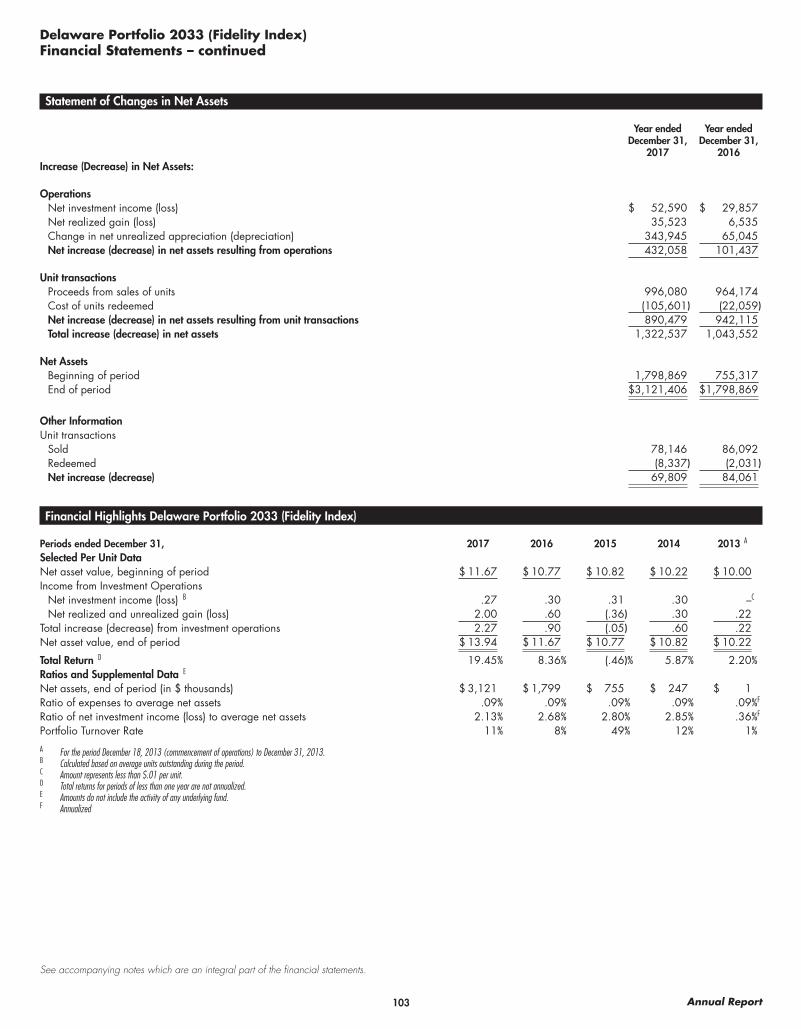
103 Annual Report
See accompanying notes which are an integral part of the financial statements.
Delaware Portfolio 2033 (Fidelity Index)Financial Statements – continued
Statement of Changes in Net Assets
Year ended December 31,
2017
Year ended December 31,
2016Increase (Decrease) in Net Assets:
OperationsNet investment income (loss) $ 52,590 $ 29,857Net realized gain (loss) 35,523 6,535Change in net unrealized appreciation (depreciation) 343,945 65,045Net increase (decrease) in net assets resulting from operations 432,058 101,437
Unit transactionsProceeds from sales of units 996,080 964,174Cost of units redeemed (105,601) (22,059)Net increase (decrease) in net assets resulting from unit transactions 890,479 942,115Total increase (decrease) in net assets 1,322,537 1,043,552
Net AssetsBeginning of period 1,798,869 755,317End of period $ 3,121,406 $ 1,798,869
Other InformationUnit transactions
Sold 78,146 86,092Redeemed (8,337) (2,031)Net increase (decrease) 69,809 84,061
Financial Highlights Delaware Portfolio 2033 (Fidelity Index)
Periods ended December 31, 2017 2016 2015 2014 2013 A
Selected Per Unit Data Net asset value, beginning of period $ 11.67 $ 10.77 $ 10.82 $ 10.22 $ 10.00Income from Investment Operations
Net investment income (loss) B .27 .30 .31 .30 –C
Net realized and unrealized gain (loss) 2.00 .60 (.36) .30 .22Total increase (decrease) from investment operations 2.27 .90 (.05) .60 .22Net asset value, end of period $ 13.94 $ 11.67 $ 10.77 $ 10.82 $ 10.22
Total Return D 19.45% 8.36% (.46)% 5.87% 2.20%Ratios and Supplemental Data E Net assets, end of period (in $ thousands) $ 3,121 $ 1,799 $ 755 $ 247 $ 1Ratio of expenses to average net assets .09% .09% .09% .09% .09%F
Ratio of net investment income (loss) to average net assets 2.13% 2.68% 2.80% 2.85% .36%F
Portfolio Turnover Rate 11% 8% 49% 12% 1%
A For the period December 18, 2013 (commencement of operations) to December 31, 2013.B Calculated based on average units outstanding during the period.C Amount represents less than $.01 per unit.D Total returns for periods of less than one year are not annualized.E Amounts do not include the activity of any underlying fund.F Annualized

104Annual Report
Delaware Portfolio 2036 (Fidelity Index)
Investment Summary
Top Holdings as of December 31, 2017% of Portfolio’s
net assetsFidelity Total Market Index Fund Institutional Premium Class 65.0Fidelity International Index Fund Institutional Premium Class 28.6Fidelity U.S. Bond Index Fund Institutional Premium Class 5.0Fidelity Commodity Strategy Fund 1.4
100.0
Asset Allocation (% of Portfolio’s net assets)
U.S. Equity Funds 65.0%
Commodity Funds 1.4%
Non – U.S. Equity Funds 28.6%
Bond Funds 5.0%
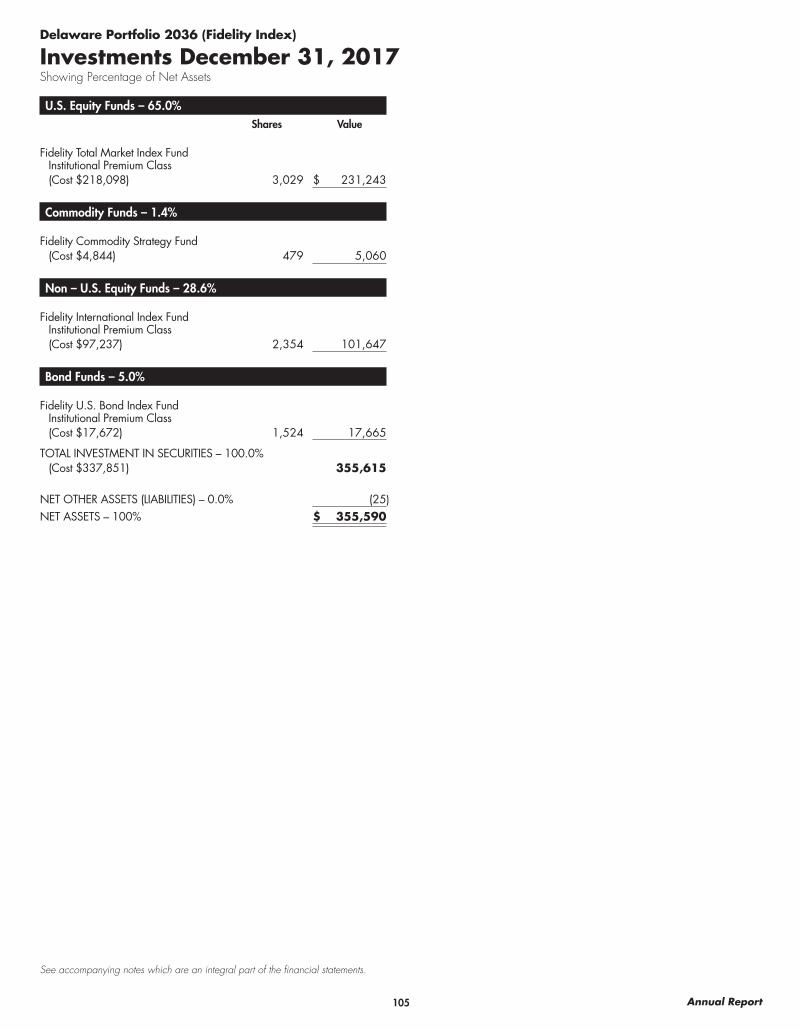
105 Annual Report
See accompanying notes which are an integral part of the financial statements.
U.S. Equity Funds – 65.0%Shares Value
Fidelity Total Market Index Fund Institutional Premium Class(Cost $218,098) 3,029 $ 231,243
Commodity Funds – 1.4%
Fidelity Commodity Strategy Fund(Cost $4,844) 479 5,060
Non – U.S. Equity Funds – 28.6%
Fidelity International Index Fund Institutional Premium Class(Cost $97,237) 2,354 101,647
Bond Funds – 5.0%
Fidelity U.S. Bond Index Fund Institutional Premium Class(Cost $17,672) 1,524 17,665
TOTAL INVESTMENT IN SECURITIES – 100.0%(Cost $337,851) 355,615
NET OTHER ASSETS (LIABILITIES) – 0.0% (25)
NET ASSETS – 100% $ 355,590
Delaware Portfolio 2036 (Fidelity Index)
Investments December 31, 2017Showing Percentage of Net Assets

106Annual Report
See accompanying notes which are an integral part of the financial statements.
Delaware Portfolio 2036 (Fidelity Index)
Financial Statements
Statement of Assets and Liabilities
December 31, 2017
AssetsInvestments in securities at value (cost
$337,851) $ 355,615Receivable for units sold 1,350Distributions receivable 37
Total assets 357,002
LiabilitiesPayable for investments purchased $ 1,387Accrued management and administration
fees 25Total liabilities 1,412
Net Assets $ 355,590
Net Asset Value, offering price and redemp-tion price per unit ($355,590 / 29,433 units) $ 12.08
Statement of Operations
Year ended December 31,
2017
Investment IncomeIncome distributions from underlying funds $ 5,215ExpensesManagement and administration fees $ 113
Total expenses 113
Net investment income (loss) 5,102Realized and Unrealized Gain (Loss) on Invest-
mentsNet realized gain (loss) on sale of underlying
funds’ shares 41Capital gain distributions from underlying funds 1,271 1,312Change in net unrealized appreciation (deprecia-
tion) on underlying funds’ shares 17,787Net gain (loss) 19,099Net increase (decrease) in net assets resulting
from operations $ 24,201
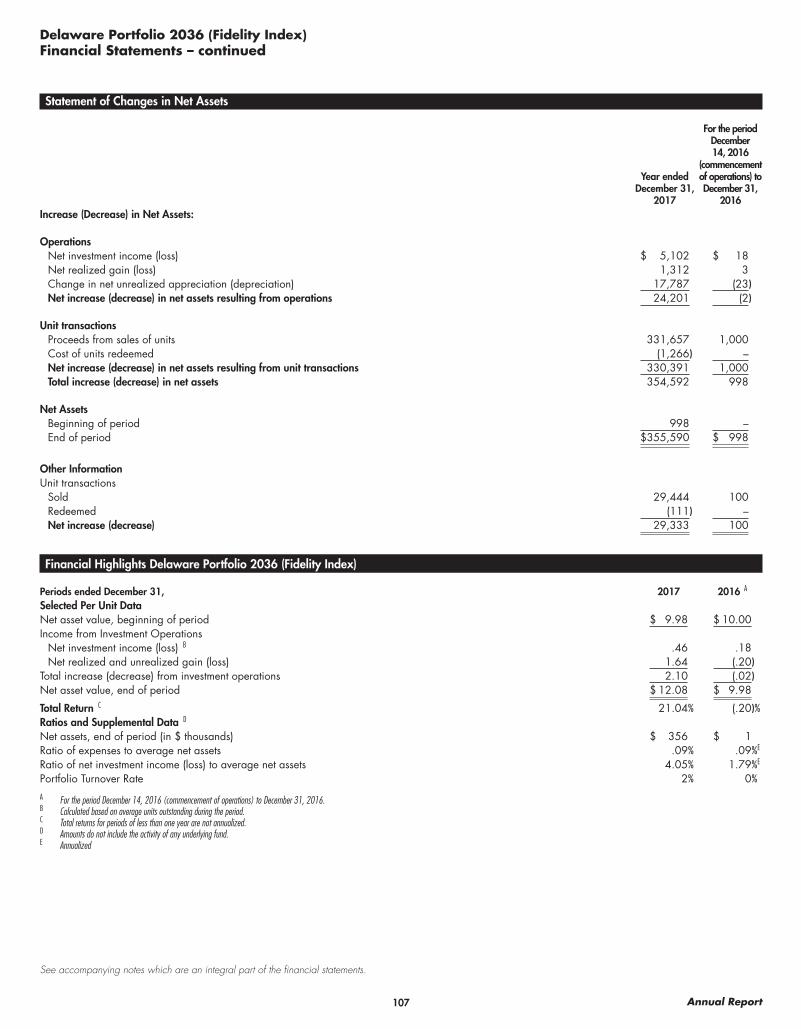
107 Annual Report
See accompanying notes which are an integral part of the financial statements.
Delaware Portfolio 2036 (Fidelity Index)Financial Statements – continued
Statement of Changes in Net Assets
Year ended December 31,
2017
For the period December 14, 2016
(commencement of operations) to December 31,
2016Increase (Decrease) in Net Assets:
OperationsNet investment income (loss) $ 5,102 $ 18Net realized gain (loss) 1,312 3Change in net unrealized appreciation (depreciation) 17,787 (23)Net increase (decrease) in net assets resulting from operations 24,201 (2)
Unit transactionsProceeds from sales of units 331,657 1,000Cost of units redeemed (1,266) –Net increase (decrease) in net assets resulting from unit transactions 330,391 1,000Total increase (decrease) in net assets 354,592 998
Net AssetsBeginning of period 998 –End of period $ 355,590 $ 998
Other InformationUnit transactions
Sold 29,444 100Redeemed (111) –Net increase (decrease) 29,333 100
Financial Highlights Delaware Portfolio 2036 (Fidelity Index)
Periods ended December 31, 2017 2016 A
Selected Per Unit Data Net asset value, beginning of period $ 9.98 $ 10.00Income from Investment Operations
Net investment income (loss) B .46 .18Net realized and unrealized gain (loss) 1.64 (.20)
Total increase (decrease) from investment operations 2.10 (.02)Net asset value, end of period $ 12.08 $ 9.98
Total Return C 21.04% (.20)%Ratios and Supplemental Data D Net assets, end of period (in $ thousands) $ 356 $ 1Ratio of expenses to average net assets .09% .09%E
Ratio of net investment income (loss) to average net assets 4.05% 1.79%E
Portfolio Turnover Rate 2% 0%
A For the period December 14, 2016 (commencement of operations) to December 31, 2016.B Calculated based on average units outstanding during the period.C Total returns for periods of less than one year are not annualized.D Amounts do not include the activity of any underlying fund.E Annualized
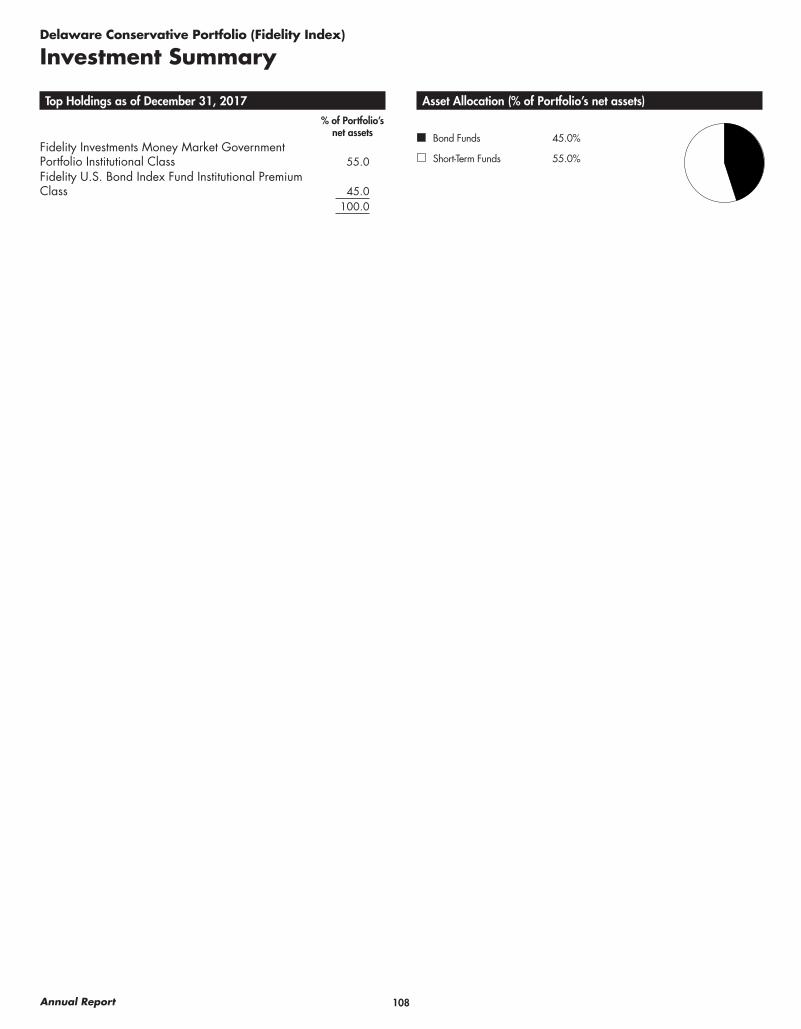
108Annual Report
Delaware Conservative Portfolio (Fidelity Index)
Investment Summary
Top Holdings as of December 31, 2017% of Portfolio’s
net assetsFidelity Investments Money Market Government Portfolio Institutional Class 55.0Fidelity U.S. Bond Index Fund Institutional Premium Class 45.0
100.0
Asset Allocation (% of Portfolio’s net assets)
Bond Funds 45.0%
Short-Term Funds 55.0%

109 Annual Report
See accompanying notes which are an integral part of the financial statements.
Bond Funds – 45.0%Shares Value
Fidelity U.S. Bond Index Fund Institutional Premium Class(Cost $1,585,870) 135,906 $ 1,575,147
Short-Term Funds – 55.0%
Fidelity Investments Money Market Government Portfolio Institutional Class 1.19% (a)(Cost $1,921,612) 1,921,612 1,921,612
TOTAL INVESTMENT IN SECURITIES – 100.0%(Cost $3,507,482) 3,496,759
NET OTHER ASSETS (LIABILITIES) – 0.0% (284)
NET ASSETS – 100% $ 3,496,475
Legend(a) The rate quoted is the annualized seven-day yield of the fund at
period end.
Delaware Conservative Portfolio (Fidelity Index)
Investments December 31, 2017Showing Percentage of Net Assets

110Annual Report
See accompanying notes which are an integral part of the financial statements.
Delaware Conservative Portfolio (Fidelity Index)
Financial Statements
Statement of Assets and Liabilities
December 31, 2017
AssetsInvestments in securities at value (cost
$3,507,482) $ 3,496,759Receivable for investments sold 11,017Receivable for units sold 5,013Distributions receivable 5,427
Total assets 3,518,216
LiabilitiesPayable for investments purchased $ 5,439Accrued management and administration
fees 271Payable for units redeemed 16,031
Total liabilities 21,741Net Assets $ 3,496,475
Net Asset Value, offering price and redemption price per unit ($3,496,475 / 260,388 units) $ 13.43
Statement of Operations
Year ended December 31,
2017
Investment IncomeIncome distributions from underlying funds $ 56,694ExpensesManagement and administration fees $ 3,266
Total expenses 3,266
Net investment income (loss) 53,428Realized and Unrealized Gain (Loss) on Invest-
mentsNet realized gain (loss) on sale of underlying
funds’ shares (4,211)Capital gain distributions from underlying funds 991 (3,220)Change in net unrealized appreciation (depre-
ciation) on underlying funds’ shares 21,214Net gain (loss) 17,994Net increase (decrease) in net assets resulting
from operations $ 71,422

111 Annual Report
See accompanying notes which are an integral part of the financial statements.
Delaware Conservative Portfolio (Fidelity Index)Financial Statements – continued
Statement of Changes in Net Assets
Year ended December 31,
2017
Year ended December 31,
2016Increase (Decrease) in Net Assets:
OperationsNet investment income (loss) $ 53,428 $ 35,072Net realized gain (loss) (3,220) (33)Change in net unrealized appreciation (depreciation) 21,214 (11,547)Net increase (decrease) in net assets resulting from operations 71,422 23,492
Unit transactionsProceeds from sales of units 1,282,555 1,449,835Cost of units redeemed (1,081,101) (733,297)Net increase (decrease) in net assets resulting from unit transactions 201,454 716,538Total increase (decrease) in net assets 272,876 740,030
Net AssetsBeginning of period 3,223,599 2,483,569End of period $ 3,496,475 $ 3,223,599
Other InformationUnit transactions
Sold 96,874 109,363Redeemed (81,116) (55,453)Net increase (decrease) 15,758 53,910
Financial Highlights Delaware Conservative Portfolio (Fidelity Index)
Periods ended December 31, 2017 2016 2015 2014 2013Selected Per Unit Data Net asset value, beginning of period $ 13.18 $ 13.02 $ 13.00 $ 12.67 $ 12.82Income from Investment Operations
Net investment income (loss) A .20 .15 .14 .13 .12Net realized and unrealized gain (loss) .05 .01 (.12) .20 (.27)
Total increase (decrease) from investment operations .25 .16 .02 .33 (.15)Net asset value, end of period $ 13.43 $ 13.18 $ 13.02 $ 13.00 $ 12.67
Total Return 1.90% 1.23% .15% 2.60% (1.17)%Ratios and Supplemental Data B Net assets, end of period (in $ thousands) $ 3,496 $ 3,224 $ 2,484 $ 2,331 $ 2,046Ratio of expenses to average net assets .09% .09% .09% .09% .12%Ratio of net investment income (loss) to average net assets 1.47% 1.16% 1.06% 1.03% .92%Portfolio Turnover Rate 27% 79% 30% 30% 45%
A Calculated based on average units outstanding during the period.B Amounts do not include the activity of any underlying fund.

112Annual Report
Delaware Moderate Growth Portfolio (Fidelity Index)
Investment Summary
Top Holdings as of December 31, 2017% of Portfolio’s
net assetsFidelity Total Market Index Fund Institutional Premium Class 47.6Fidelity U.S. Bond Index Fund Institutional Premium Class 30.1Fidelity International Index Fund Institutional Premium Class 21.0Fidelity Commodity Strategy Fund 1.3
100.0
Asset Allocation (% of Portfolio’s net assets)
U.S. Equity Funds 47.6%
Commodity Funds 1.3%
Non – U.S. Equity Funds 21.0%
Bond Funds 30.1%

113 Annual Report
See accompanying notes which are an integral part of the financial statements.
U.S. Equity Funds – 47.6%Shares Value
Fidelity Total Market Index Fund Institutional Premium Class(Cost $3,194,566) 58,740 $ 4,484,776
Commodity Funds – 1.3%
Fidelity Commodity Strategy Fund(Cost $116,554) 11,632 122,830
Non – U.S. Equity Funds – 21.0%
Fidelity International Index Fund Institutional Premium Class(Cost $1,682,785) 45,927 1,983,132
Bond Funds – 30.1%
Fidelity U.S. Bond Index Fund Institutional Premium Class(Cost $2,860,288) 244,778 2,836,979
TOTAL INVESTMENT IN SECURITIES – 100.0%(Cost $7,854,193) 9,427,717
NET OTHER ASSETS (LIABILITIES) – 0.0% (731)
NET ASSETS – 100% $ 9,426,986
Delaware Moderate Growth Portfolio (Fidelity Index)
Investments December 31, 2017Showing Percentage of Net Assets

114Annual Report
See accompanying notes which are an integral part of the financial statements.
Delaware Moderate Growth Portfolio (Fidelity Index)
Financial Statements
Statement of Assets and Liabilities
December 31, 2017
AssetsInvestments in securities at value (cost
$7,854,193) $ 9,427,717Receivable for investments sold 31,053Receivable for units sold 2,078Distributions receivable 6,389
Total assets 9,467,237
LiabilitiesPayable for investments purchased $ 28,029Accrued management and administration
fees 722Payable for units redeemed 11,500
Total liabilities 40,251Net Assets $ 9,426,986
Net Asset Value, offering price and redemption price per unit ($9,426,986 / 470,342 units) $ 20.04
Statement of Operations
Year ended December 31,
2017
Investment IncomeIncome distributions from underlying funds $ 188,027ExpensesManagement and administration fees $ 8,029
Total expenses 8,029
Net investment income (loss) 179,998Realized and Unrealized Gain (Loss) on Invest-
mentsNet realized gain (loss) on sale of underlying
funds’ shares 253,590Capital gain distributions from underlying
funds 34,678 288,268Change in net unrealized appreciation (de-
preciation) on underlying funds’ shares 860,016Net gain (loss) 1,148,284Net increase (decrease) in net assets resulting
from operations $ 1,328,282

115 Annual Report
See accompanying notes which are an integral part of the financial statements.
Delaware Moderate Growth Portfolio (Fidelity Index)Financial Statements – continued
Statement of Changes in Net Assets
Year ended December 31,
2017
Year ended December 31,
2016Increase (Decrease) in Net Assets:
OperationsNet investment income (loss) $ 179,998 $ 167,259Net realized gain (loss) 288,268 227,684Change in net unrealized appreciation (depreciation) 860,016 121,659Net increase (decrease) in net assets resulting from operations 1,328,282 516,602
Unit transactionsProceeds from sales of units 1,491,463 2,625,209Cost of units redeemed (1,802,661) (1,621,611)Net increase (decrease) in net assets resulting from unit transactions (311,198) 1,003,598Total increase (decrease) in net assets 1,017,084 1,520,200
Net AssetsBeginning of period 8,409,902 6,889,702End of period $ 9,426,986 $ 8,409,902
Other InformationUnit transactions
Sold 78,823 157,035Redeemed (95,631) (97,554)Net increase (decrease) (16,808) 59,481
Financial Highlights Delaware Moderate Growth Portfolio (Fidelity Index)
Periods ended December 31, 2017 2016 2015 2014 2013Selected Per Unit Data Net asset value, beginning of period $ 17.26 $ 16.11 $ 16.13 $ 15.29 $ 12.85Income from Investment Operations
Net investment income (loss) A .38 .38 .33 .31 .26Net realized and unrealized gain (loss) 2.40 .77 (.35) .53 2.18
Total increase (decrease) from investment operations 2.78 1.15 (.02) .84 2.44Net asset value, end of period $ 20.04 $ 17.26 $ 16.11 $ 16.13 $ 15.29
Total Return 16.11% 7.14% (.12)% 5.49% 18.99%Ratios and Supplemental Data B Net assets, end of period (in $ thousands) $ 9,427 $ 8,410 $ 6,890 $ 6,462 $ 6,168Ratio of expenses to average net assets .09% .09% .09% .09% .12%Ratio of net investment income (loss) to average net assets 2.02% 2.29% 2.03% 1.98% 1.85%Portfolio Turnover Rate 20% 29% 23% 26% 23%
A Calculated based on average units outstanding during the period.B Amounts do not include the activity of any underlying fund.

116Annual Report
Delaware Aggressive Growth Portfolio (Fidelity Index)
Investment Summary
Top Holdings as of December 31, 2017% of Portfolio’s
net assetsFidelity Total Market Index Fund Institutional Premium Class 68.5Fidelity International Index Fund Institutional Premium Class 30.1Fidelity Commodity Strategy Fund 1.4
100.0
Asset Allocation (% of Portfolio’s net assets)
U.S. Equity Funds 68.5%
Commodity Funds 1.4%
Non – U.S. Equity Funds 30.1%

117 Annual Report
See accompanying notes which are an integral part of the financial statements.
U.S. Equity Funds – 68.5%Shares Value
Fidelity Total Market Index Fund Institutional Premium Class(Cost $6,014,197) 115,860 $ 8,845,927
Commodity Funds – 1.4%
Fidelity Commodity Strategy Fund(Cost $171,125) 17,078 180,340
Non – U.S. Equity Funds – 30.1%
Fidelity International Index Fund Institutional Premium Class(Cost $3,338,736) 90,011 3,886,654
TOTAL INVESTMENT IN SECURITIES – 100.0%(Cost $9,524,058) 12,912,921
NET OTHER ASSETS (LIABILITIES) – 0.0% (976)
NET ASSETS – 100% $12,911,945
Delaware Aggressive Growth Portfolio (Fidelity Index)
Investments December 31, 2017Showing Percentage of Net Assets

118Annual Report
See accompanying notes which are an integral part of the financial statements.
Delaware Aggressive Growth Portfolio (Fidelity Index)
Financial Statements
Statement of Assets and Liabilities
December 31, 2017
AssetsInvestments in securities at value (cost
$9,524,058) $ 12,912,921Receivable for units sold 2,475
Total assets 12,915,396
LiabilitiesPayable for investments purchased $ 2,478Accrued management and administration
fees 973Total liabilities 3,451
Net Assets $ 12,911,945
Net Asset Value, offering price and redemp-tion price per unit ($12,911,945 / 626,876 units) $ 20.60
Statement of Operations
Year ended December 31,
2017
Investment IncomeIncome distributions from underlying funds $ 233,265ExpensesManagement and administration fees $ 10,665
Total expenses 10,665
Net investment income (loss) 222,600Realized and Unrealized Gain (Loss) on Invest-
mentsNet realized gain (loss) on sale of underlying
funds’ shares 357,019Capital gain distributions from underlying
funds 63,609 420,628Change in net unrealized appreciation (de-
preciation) on underlying funds’ shares 1,690,301Net gain (loss) 2,110,929Net increase (decrease) in net assets resulting
from operations $ 2,333,529

119 Annual Report
See accompanying notes which are an integral part of the financial statements.
Delaware Aggressive Growth Portfolio (Fidelity Index)Financial Statements – continued
Statement of Changes in Net Assets
Year ended December 31,
2017
Year ended December 31,
2016Increase (Decrease) in Net Assets:
OperationsNet investment income (loss) $ 222,600 $ 212,381Net realized gain (loss) 420,628 243,100Change in net unrealized appreciation (depreciation) 1,690,301 450,023Net increase (decrease) in net assets resulting from operations 2,333,529 905,504
Unit transactionsProceeds from sales of units 2,081,357 1,755,288Cost of units redeemed (2,133,980) (1,261,065)Net increase (decrease) in net assets resulting from unit transactions (52,623) 494,223Total increase (decrease) in net assets 2,280,906 1,399,727
Net AssetsBeginning of period 10,631,039 9,231,312End of period $ 12,911,945 $ 10,631,039
Other InformationUnit transactions
Sold 109,251 112,161Redeemed (112,337) (78,886)Net increase (decrease) (3,086) 33,275
Financial Highlights Delaware Aggressive Growth Portfolio (Fidelity Index)
Periods ended December 31, 2017 2016 2015 2014 2013Selected Per Unit Data Net asset value, beginning of period $ 16.88 $ 15.47 $ 15.55 $ 14.68 $ 11.44Income from Investment Operations
Net investment income (loss) A .35 .34 .30 .30 .25Net realized and unrealized gain (loss) 3.37 1.07 (.38) .57 2.99
Total increase (decrease) from investment operations 3.72 1.41 (.08) .87 3.24Net asset value, end of period $ 20.60 $ 16.88 $ 15.47 $ 15.55 $ 14.68
Total Return 22.04% 9.11% (.51)% 5.93% 28.32%Ratios and Supplemental Data B Net assets, end of period (in $ thousands) $ 12,912 $ 10,631 $ 9,231 $ 8,900 $ 7,795Ratio of expenses to average net assets .09% .09% .09% .09% .12%Ratio of net investment income (loss) to average net assets 1.88% 2.15% 1.90% 1.99% 1.92%Portfolio Turnover Rate 17% 14% 17% 13% 21%
A Calculated based on average units outstanding during the period.B Amounts do not include the activity of any underlying fund.
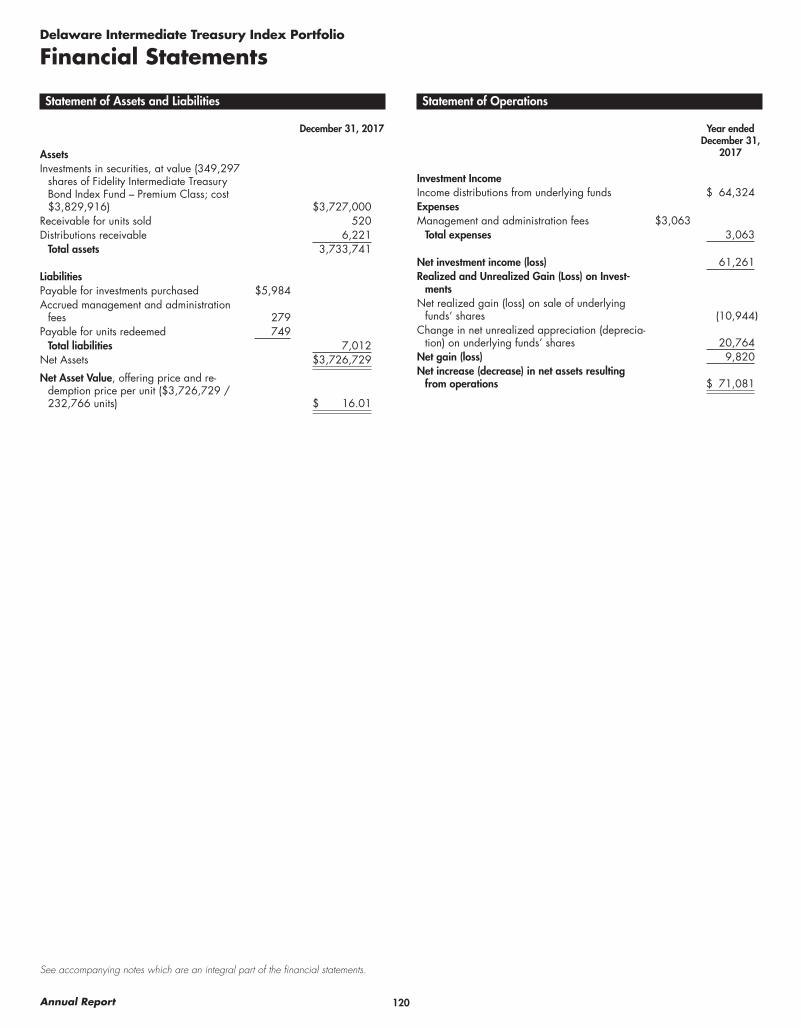
120Annual Report
See accompanying notes which are an integral part of the financial statements.
Delaware Intermediate Treasury Index Portfolio
Financial Statements
Statement of Assets and Liabilities
December 31, 2017
AssetsInvestments in securities, at value (349,297
shares of Fidelity Intermediate Treasury Bond Index Fund – Premium Class; cost $3,829,916) $ 3,727,000
Receivable for units sold 520Distributions receivable 6,221
Total assets 3,733,741
LiabilitiesPayable for investments purchased $ 5,984Accrued management and administration
fees 279Payable for units redeemed 749
Total liabilities 7,012Net Assets $ 3,726,729
Net Asset Value, offering price and re-demption price per unit ($3,726,729 / 232,766 units) $ 16.01
Statement of Operations
Year ended December 31,
2017
Investment IncomeIncome distributions from underlying funds $ 64,324ExpensesManagement and administration fees $ 3,063
Total expenses 3,063
Net investment income (loss) 61,261Realized and Unrealized Gain (Loss) on Invest-
mentsNet realized gain (loss) on sale of underlying
funds’ shares (10,944)Change in net unrealized appreciation (deprecia-
tion) on underlying funds’ shares 20,764Net gain (loss) 9,820Net increase (decrease) in net assets resulting
from operations $ 71,081

121 Annual Report
See accompanying notes which are an integral part of the financial statements.
Delaware Intermediate Treasury Index PortfolioFinancial Statements – continued
Statement of Changes in Net Assets
Year ended December 31,
2017
Year ended December 31,
2016Increase (Decrease) in Net Assets:
OperationsNet investment income (loss) $ 61,261 $ 51,072Net realized gain (loss) (10,944) 34,189Change in net unrealized appreciation (depreciation) 20,764 (93,464)Net increase (decrease) in net assets resulting from operations 71,081 (8,203)
Unit transactionsProceeds from sales of units 1,125,696 1,982,539Cost of units redeemed (623,738) (1,045,244)Net increase (decrease) in net assets resulting from unit transactions 501,958 937,295Total increase (decrease) in net assets 573,039 929,092
Net AssetsBeginning of period 3,153,690 2,224,598End of period $ 3,726,729 $ 3,153,690
Other InformationUnit transactions
Sold 70,525 123,789Redeemed (39,068) (65,656)Net increase (decrease) 31,457 58,133
Financial Highlights Delaware Intermediate Treasury Index Portfolio
Periods ended December 31, 2017 2016 2015 2014 2013Selected Per Unit Data Net asset value, beginning of period $ 15.67 $ 15.54 $ 15.31 $ 14.42 $ 15.16Income from Investment Operations
Net investment income (loss) A .29 .28 .28 .28 .25Net realized and unrealized gain (loss) .05 (.15) (.05) .61 (.99)
Total increase (decrease) from investment operations .34 .13 .23 .89 (.74)Net asset value, end of period $ 16.01 $ 15.67 $ 15.54 $ 15.31 $ 14.42
Total Return 2.17% .84% 1.50% 6.17% (4.88)%Ratios and Supplemental Data B Net assets, end of period (in $ thousands) $ 3,727 $ 3,154 $ 2,225 $ 2,246 $ 2,423Ratio of expenses to average net assets .09% .09% .09% .09% .13%Ratio of net investment income (loss) to average net assets 1.80% 1.72% 1.81% 1.87% 1.69%
A Calculated based on average units outstanding during the period.B Amounts do not include the activity of any underlying fund.

122Annual Report
See accompanying notes which are an integral part of the financial statements.
Delaware International Index Portfolio
Financial Statements
Statement of Assets and Liabilities
December 31, 2017
AssetsInvestments in securities, at value (158,732
shares of Fidelity International Index Fund – Institutional Premium Class; cost $5,988,495) $ 6,854,033
Receivable for units sold 12,064Total assets 6,866,097
LiabilitiesPayable for investments purchased $ 9,704Accrued management and administration
fees 511Payable for units redeemed 2,355
Total liabilities 12,570Net Assets $ 6,853,527
Net Asset Value, offering price and re-demption price per unit ($6,853,527 / 487,164 units) $ 14.07
Statement of Operations
Year ended December 31,
2017
Investment IncomeIncome distributions from underlying funds $ 155,231ExpensesManagement and administration fees $ 5,173
Total expenses 5,173
Net investment income (loss) 150,058Realized and Unrealized Gain (Loss) on Invest-
mentsNet realized gain (loss) on sale of underlying
funds’ shares 15,185Capital gain distributions from underlying funds 9,318 24,503Change in net unrealized appreciation (depre-
ciation) on underlying funds’ shares 1,084,738Net gain (loss) 1,109,241Net increase (decrease) in net assets resulting
from operations $ 1,259,299

123 Annual Report
See accompanying notes which are an integral part of the financial statements.
Delaware International Index PortfolioFinancial Statements – continued
Statement of Changes in Net Assets
Year ended December 31,
2017
Year ended December 31,
2016Increase (Decrease) in Net Assets:
OperationsNet investment income (loss) $ 150,058 $ 126,956Net realized gain (loss) 24,503 (21,817)Change in net unrealized appreciation (depreciation) 1,084,738 (46,562)Net increase (decrease) in net assets resulting from operations 1,259,299 58,577
Unit transactionsProceeds from sales of units 2,145,733 881,979Cost of units redeemed (1,177,488) (900,717)Net increase (decrease) in net assets resulting from unit transactions 968,245 (18,738)Total increase (decrease) in net assets 2,227,544 39,839
Net AssetsBeginning of period 4,625,983 4,586,144End of period $ 6,853,527 $ 4,625,983
Other InformationUnit transactions
Sold 168,567 80,438Redeemed (93,313) (81,731)Net increase (decrease) 75,254 (1,293)
Financial Highlights Delaware International Index Portfolio
Periods ended December 31, 2017 2016 2015 2014 2013Selected Per Unit Data Net asset value, beginning of period $ 11.23 $ 11.10 $ 11.21 $ 11.86 $ 9.76Income from Investment Operations
Net investment income (loss) A .34 .31 .29 .36 .27Net realized and unrealized gain (loss) 2.50 (.18) (.40) (1.01) 1.83
Total increase (decrease) from investment operations 2.84 .13 (.11) (.65) 2.10Net asset value, end of period $ 14.07 $ 11.23 $ 11.10 $ 11.21 $ 11.86
Total Return 25.29% 1.17% (.98)% (5.48)% 21.52%Ratios and Supplemental Data B Net assets, end of period (in $ thousands) $ 6,854 $ 4,626 $ 4,586 $ 4,167 $ 4,377Ratio of expenses to average net assets .09% .09% .09% .09% .12%Ratio of net investment income (loss) to average net assets 2.61% 2.83% 2.47% 3.03% 2.53%
A Calculated based on average units outstanding during the period.B Amounts do not include the activity of any underlying fund.

124Annual Report
See accompanying notes which are an integral part of the financial statements.
Delaware Fidelity® 500 Index Portfolio
Financial Statements
Statement of Assets and Liabilities
December 31, 2017
AssetsInvestments in securities, at value
(203,139 shares of Fidelity 500 Index Fund – Institutional Premium Class; cost $13,835,408) $ 18,983,356
Receivable for units sold 19,829Total assets 19,003,185
LiabilitiesPayable for investments purchased $ 12,023Accrued management and administration
fees 1,429Payable for units redeemed 7,805
Total liabilities 21,257Net Assets $ 18,981,928
Net Asset Value, offering price and re-demption price per unit ($18,981,928 / 789,285 units) $ 24.05
Statement of Operations
Year ended December 31,
2017
Investment IncomeIncome distributions from underlying funds $ 327,698ExpensesManagement and administration fees $ 14,773
Total expenses 14,773
Net investment income (loss) 312,925Realized and Unrealized Gain (Loss) on Invest-
mentsNet realized gain (loss) on sale of underlying
funds’ shares 394,553Capital gain distributions from underlying
funds 28,904 423,457Change in net unrealized appreciation (de-
preciation) on underlying funds’ shares 2,487,414Net gain (loss) 2,910,871Net increase (decrease) in net assets resulting
from operations $ 3,223,796

125 Annual Report
See accompanying notes which are an integral part of the financial statements.
Delaware Fidelity® 500 Index PortfolioFinancial Statements – continued
Statement of Changes in Net Assets
Year ended December 31,
2017
Year ended December 31,
2016Increase (Decrease) in Net Assets:
OperationsNet investment income (loss) $ 312,925 $ 245,579Net realized gain (loss) 423,457 430,688Change in net unrealized appreciation (depreciation) 2,487,414 655,586Net increase (decrease) in net assets resulting from operations 3,223,796 1,331,853
Unit transactionsProceeds from sales of units 4,952,410 4,468,418Cost of units redeemed (3,270,562) (3,280,871)Net increase (decrease) in net assets resulting from unit transactions 1,681,848 1,187,547Total increase (decrease) in net assets 4,905,644 2,519,400
Net AssetsBeginning of period 14,076,284 11,556,884End of period $ 18,981,928 $ 14,076,284
Other InformationUnit transactions
Sold 226,656 235,563Redeemed (149,701) (177,160)Net increase (decrease) 76,955 58,403
Financial Highlights Delaware Fidelity 500 Index Portfolio
Periods ended December 31, 2017 2016 2015 2014 2013Selected Per Unit Data Net asset value, beginning of period $ 19.76 $ 17.67 $ 17.46 $ 15.38 $ 11.65Income from Investment Operations
Net investment income (loss) A .42 .37 .36 .30 .26Net realized and unrealized gain (loss) 3.87 1.72 (.15) 1.78 3.47
Total increase (decrease) from investment operations 4.29 2.09 .21 2.08 3.73Net asset value, end of period $ 24.05 $ 19.76 $ 17.67 $ 17.46 $ 15.38
Total Return 21.71% 11.83% 1.20% 13.52% 32.02%Ratios and Supplemental Data B Net assets, end of period (in $ thousands) $ 18,982 $ 14,076 $ 11,557 $ 9,283 $ 6,281Ratio of expenses to average net assets .09% .09% .09% .09% .12%Ratio of net investment income (loss) to average net assets 1.90% 2.04% 2.04% 1.87% 1.91%
A Calculated based on average units outstanding during the period.B Amounts do not include the activity of any underlying fund.

126Annual Report
See accompanying notes which are an integral part of the financial statements.
Delaware Total Market Index Portfolio
Financial Statements
Statement of Assets and Liabilities
December 31, 2017
AssetsInvestments in securities, at value (157,350
shares of Fidelity Total Market Index Fund – Institutional Premium Class; cost $8,302,409) $ 12,013,639
Receivable for investments sold 3,589Receivable for units sold 2,085
Total assets 12,019,313
LiabilitiesAccrued management and administration
fees $ 914Payable for units redeemed 5,675
Total liabilities 6,589Net Assets $ 12,012,724
Net Asset Value, offering price and redemp-tion price per unit ($12,012,724 / 488,345 units) $ 24.60
Statement of Operations
Year ended December 31,
2017
Investment IncomeIncome distributions from underlying funds $ 195,737ExpensesManagement and administration fees $ 9,711
Total expenses 9,711
Net investment income (loss) 186,026Realized and Unrealized Gain (Loss) on Invest-
mentsNet realized gain (loss) on sale of underlying
funds’ shares 446,927Capital gain distributions from underlying
funds 78,848 525,775Change in net unrealized appreciation (de-
preciation) on underlying funds’ shares 1,352,890Net gain (loss) 1,878,665Net increase (decrease) in net assets resulting
from operations $ 2,064,691

127 Annual Report
See accompanying notes which are an integral part of the financial statements.
Delaware Total Market Index PortfolioFinancial Statements – continued
Statement of Changes in Net Assets
Year ended December 31,
2017
Year ended December 31,
2016Increase (Decrease) in Net Assets:
OperationsNet investment income (loss) $ 186,026 $ 156,893Net realized gain (loss) 525,775 271,076Change in net unrealized appreciation (depreciation) 1,352,890 619,743Net increase (decrease) in net assets resulting from operations 2,064,691 1,047,712
Unit transactionsProceeds from sales of units 2,861,892 1,955,799Cost of units redeemed (2,691,798) (1,456,397)Net increase (decrease) in net assets resulting from unit transactions 170,094 499,402Total increase (decrease) in net assets 2,234,785 1,547,114
Net AssetsBeginning of period 9,777,939 8,230,825End of period $ 12,012,724 $ 9,777,939
Other InformationUnit transactions
Sold 128,688 101,793Redeemed (121,609) (76,514)Net increase (decrease) 7,079 25,279
Financial Highlights Delaware Total Market Index Portfolio
Periods ended December 31, 2017 2016 2015 2014 2013Selected Per Unit Data Net asset value, beginning of period $ 20.32 $ 18.05 $ 17.99 $ 16.02 $ 12.03Income from Investment Operations
Net investment income (loss) A .39 .34 .32 .27 .24Net realized and unrealized gain (loss) 3.89 1.93 (.26) 1.70 3.75
Total increase (decrease) from investment operations 4.28 2.27 .06 1.97 3.99Net asset value, end of period $ 24.60 $ 20.32 $ 18.05 $ 17.99 $ 16.02
Total Return 21.06% 12.58% .33% 12.30% 33.17%Ratios and Supplemental Data B Net assets, end of period (in $ thousands) $ 12,013 $ 9,778 $ 8,231 $ 7,781 $ 5,974Ratio of expenses to average net assets .09% .09% .09% .09% .12%Ratio of net investment income (loss) to average net assets 1.72% 1.83% 1.75% 1.62% 1.71%
A Calculated based on average units outstanding during the period.B Amounts do not include the activity of any underlying fund.

128Annual Report
See accompanying notes which are an integral part of the financial statements.
Delaware Bank Deposit Portfolio
Financial Statements
Statement of Assets and Liabilities
December 31, 2017
AssetsInvestments in bank deposits $ 6,445,434Receivable for investments sold 831Interest receivable 7,325
Total assets 6,453,590
LiabilitiesPayable for investments purchased $ 7,432Accrued management and administration
fees 2,890Payable for units redeemed 831
Total liabilities 11,153Net Assets $ 6,442,437
Net Asset Value, offering price and re-demption price per unit ($6,442,437 / 634,645 units) $ 10.15
Statement of Operations
Year ended December 31,
2017
Investment IncomeInterest $ 70,675ExpensesManagement and administration fees $ 33,339
Total expenses before reductions 33,339Expense reductions (515) 32,824
Net investment income (loss) 37,851Realized and Unrealized Gain (Loss) on Invest-
ments –Net increase (decrease) in net assets resulting
from operations $ 37,851

129 Annual Report
See accompanying notes which are an integral part of the financial statements.
Delaware Bank Deposit PortfolioFinancial Statements – continued
Statement of Changes in Net Assets
Year ended December 31,
2017
Year ended December 31,
2016Increase (Decrease) in Net Assets:
OperationsNet investment income (loss) $ 37,851 $ 22,716Net increase (decrease) in net assets resulting from operations 37,851 22,716
Unit transactionsProceeds from sales of units 2,388,783 5,957,990Cost of units redeemed (3,165,191) (3,944,033)Net increase (decrease) in net assets resulting from unit transactions (776,408) 2,013,957Total increase (decrease) in net assets (738,557) 2,036,673
Net AssetsBeginning of period 7,180,994 5,144,321End of period $ 6,442,437 $ 7,180,994
Other InformationUnit transactions
Sold 236,057 591,068Redeemed (312,659) (391,070)Net increase (decrease) (76,602) 199,998
Financial Highlights Delaware Bank Deposit Portfolio
Periods ended December 31, 2017 2016 2015 2014 2013Selected Per Unit Data Net asset value, beginning of period $ 10.10 $ 10.06 $ 10.05 $ 10.04 $ 10.03Income from Investment Operations
Net investment income (loss) A .05 .04 .01 .01 .01Net realized and unrealized gain (loss) – – – – –
Total increase (decrease) from investment operations .05 .04 .01 .01 .01Net asset value, end of period $ 10.15 $ 10.10 $ 10.06 $ 10.05 $ 10.04
Total Return .50% .40% .10% .10% .10%Ratios and Supplemental Data B Net assets, end of period (in $ thousands) $ 6,442 $ 7,181 $ 5,144 $ 3,325 $ 2,373Ratio of expenses to average net assets before reductions .47% .05% .05% .05% .05%Ratio of expenses to average net assets after reductions .47% .05% .05% .05% .05%Ratio of net investment income (loss) to average net assets .54% .34% .10% .09% .09%
A Calculated based on average units outstanding during the period.B Amounts do not include the activity of any underlying fund.
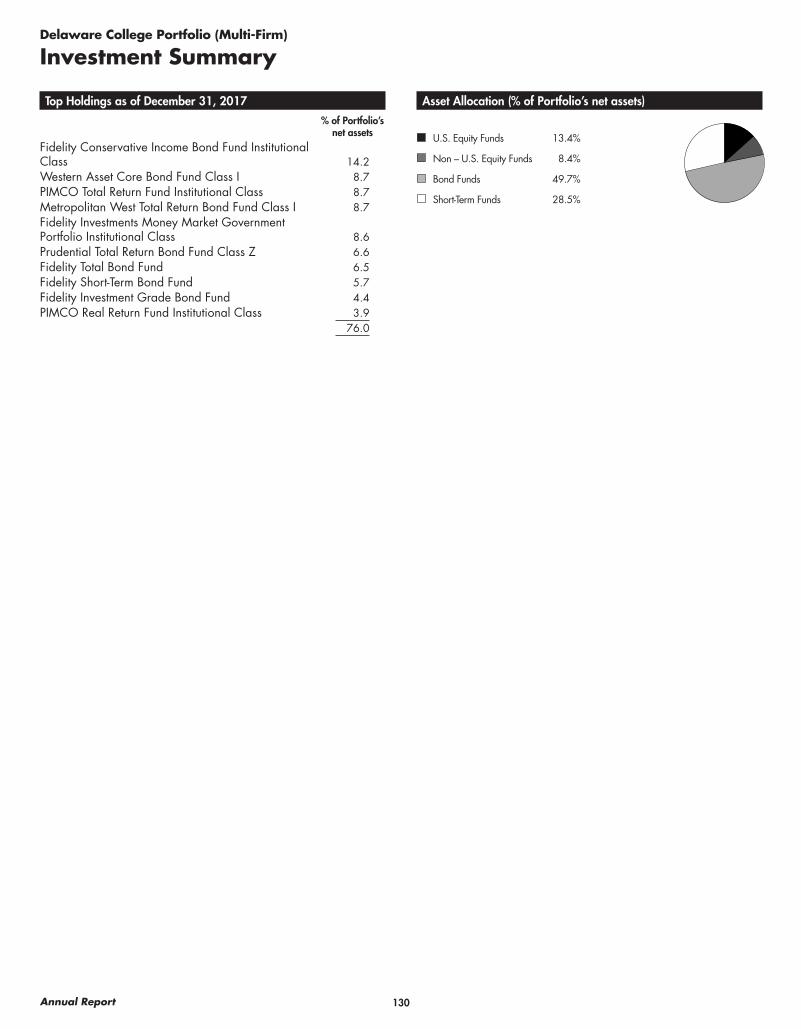
130Annual Report
Delaware College Portfolio (Multi-Firm)
Investment Summary
Top Holdings as of December 31, 2017% of Portfolio’s
net assetsFidelity Conservative Income Bond Fund Institutional Class 14.2Western Asset Core Bond Fund Class I 8.7PIMCO Total Return Fund Institutional Class 8.7Metropolitan West Total Return Bond Fund Class I 8.7Fidelity Investments Money Market Government Portfolio Institutional Class 8.6Prudential Total Return Bond Fund Class Z 6.6Fidelity Total Bond Fund 6.5Fidelity Short-Term Bond Fund 5.7Fidelity Investment Grade Bond Fund 4.4PIMCO Real Return Fund Institutional Class 3.9
76.0
Asset Allocation (% of Portfolio’s net assets)
U.S. Equity Funds 13.4%
Non – U.S. Equity Funds 8.4%
Bond Funds 49.7%
Short-Term Funds 28.5%

131 Annual Report
See accompanying notes which are an integral part of the financial statements.
U.S. Equity Funds – 13.4%Shares Value
AB Select U.S. Equity Portfolio Advisor Class 677 $ 11,349
BBH Core Select Fund - Retail Class 863 9,262Credit Suisse Commodity Return
Strategy Fund 4,006 20,112Fidelity Growth Company Fund 80 14,219Fidelity Real Estate Income Fund 511 6,131JPMorgan Small Cap Equity Fund
Class R6 321 18,394JPMorgan U.S. Equity Fund Class R6 2,516 41,093Legg Mason BW Diversified Large Cap
Value Fund Class I 714 14,872Loomis Sayles Growth Fund 689 10,697LSV Value Equity Fund 514 14,872PIMCO CommoditiesPLUS Strategy
Fund Institutional Class 1,044 6,523PIMCO StocksPLUS Absolute Return
Fund Institutional Class 658 7,044
TOTAL U.S. EQUITY FUNDS(Cost $167,280) 174,568
Non – U.S. Equity Funds – 8.4%
Acadian Emerging Markets Portfolio Institutional Class 1,020 22,829
Causeway International Value Fund Institutional Class 791 13,698
Fidelity Canada Fund 86 4,696MFS International Value Fund Class I 340 15,393MFS Research International Fund
Class I 667 13,306T. Rowe Price Emerging Markets Stock
Fund Class I 339 15,263T. Rowe Price Overseas Stock Fund I
Class 1,076 12,132William Blair International Growth
Fund Class I 415 12,915
TOTAL NON – U.S. EQUITY FUNDS(Cost $91,745) 110,232
Bond Funds – 49.7%
BlackRock High Yield Bond Fund Institutional Class 774 6,034
Fidelity Floating Rate High Income Fund 339 3,261Fidelity Investment Grade Bond Fund 7,198 57,008Fidelity New Markets Income Fund 483 7,827Fidelity Total Bond Fund 8,031 85,446Hotchkis & Wiley High Yield Fund
Class I 493 6,037MainStay High Yield Corporate Bond
Fund Class I 885 5,088Metropolitan West Total Return Bond
Fund Class I 10,704 114,108
Delaware College Portfolio (Multi-Firm)
Investments December 31, 2017Showing Percentage of Net Assets
Shares Value
PIMCO Real Return Fund Institutional Class 4,545 $ 50,269
PIMCO Total Return Fund Institutional Class 11,112 114,115
Prudential Total Return Bond Fund Class Z 5,875 85,661
Western Asset Core Bond Fund Class I 9,016 114,141
TOTAL BOND FUNDS(Cost $641,683) 648,995
Short-Term Funds – 28.5%
Fidelity Conservative Income Bond Fund Institutional Class 18,528 186,026
Fidelity Investments Money Market Government Portfolio Institutional Class 1.19% (a) 111,798 111,798
Fidelity Short-Term Bond Fund 8,682 74,488
TOTAL SHORT-TERM FUNDS(Cost $372,366) 372,312
TOTAL INVESTMENT IN SECURITIES – 100.0%(Cost $1,273,074) 1,306,107
NET OTHER ASSETS (LIABILITIES) – 0.0% (365)
NET ASSETS – 100% $ 1,305,742
Legend(a) The rate quoted is the annualized seven-day yield of the fund at
period end.

132Annual Report
See accompanying notes which are an integral part of the financial statements.
Delaware College Portfolio (Multi-Firm)
Financial Statements
Statement of Assets and Liabilities
December 31, 2017
AssetsInvestments in securities at value (cost
$1,273,074) $ 1,306,107Receivable for investments sold 44,026Receivable for units sold 25Distributions receivable 2,712
Total assets 1,352,870
LiabilitiesPayable for investments purchased $ 43,775Accrued management and administration
fees 397Payable for units redeemed 2,956
Total liabilities 47,128Net Assets $ 1,305,742
Net Asset Value, offering price and redemption price per unit ($1,305,742 / 100,426 units) $ 13.00
Statement of Operations
Year ended December 31,
2017
Investment IncomeIncome distributions from underlying funds $ 26,103ExpensesManagement and administration fees $ 4,685
Total expenses 4,685
Net investment income (loss) 21,418Realized and Unrealized Gain (Loss) on Invest-
mentsNet realized gain (loss) on sale of underlying
funds’ shares 24,612Capital gain distributions from underlying funds 11,365 35,977Change in net unrealized appreciation (depre-
ciation) on underlying funds’ shares 41,965Net gain (loss) 77,942Net increase (decrease) in net assets resulting
from operations $ 99,360

133 Annual Report
See accompanying notes which are an integral part of the financial statements.
Delaware College Portfolio (Multi-Firm)Financial Statements – continued
Statement of Changes in Net Assets
Year ended December 31,
2017
Year ended December 31,
2016Increase (Decrease) in Net Assets:
OperationsNet investment income (loss) $ 21,418 $ 8,430Net realized gain (loss) 35,977 14,768Change in net unrealized appreciation (depreciation) 41,965 1,455Net increase (decrease) in net assets resulting from operations 99,360 24,653
Unit transactionsProceeds from sales of units 448,119 1,112,575Cost of units redeemed (501,830) (166,444)Net increase (decrease) in net assets resulting from unit transactions (53,711) 946,131Total increase (decrease) in net assets 45,649 970,784
Net AssetsBeginning of period 1,260,093 289,309End of period $ 1,305,742 $ 1,260,093
Other InformationUnit transactions
Sold 35,677 93,162Redeemed (39,667) (13,814)Net increase (decrease) (3,990) 79,348
Financial Highlights Delaware College Portfolio (Multi-Firm)
Periods ended December 31, 2017 2016 2015 2014 2013Selected Per Unit Data Net asset value, beginning of period $ 12.07 $ 11.54 $ 11.64 $ 11.29 $ 10.85Income from Investment Operations
Net investment income (loss) A .20 .21 .14 .14 .14Net realized and unrealized gain (loss) .73 .32 (.24) .21 .30
Total increase (decrease) from investment operations .93 .53 (.10) .35 .44Net asset value, end of period $ 13.00 $ 12.07 $ 11.54 $ 11.64 $ 11.29
Total Return 7.71% 4.59% (.86)% 3.10% 4.06%Ratios and Supplemental Data B Net assets, end of period (in $ thousands) $ 1,306 $ 1,260 $ 289 $ 274 $ 260Ratio of expenses to average net assets .35% .35% .35% .35% .35%Ratio of net investment income (loss) to average net assets 1.60% 1.80% 1.24% 1.24% 1.23%Portfolio Turnover Rate 47% 125% 21% 51% 39%
A Calculated based on average units outstanding during the period.B Amounts do not include the activity of any underlying fund.

134Annual Report
Delaware Portfolio 2018 (Multi-Firm)
Investment Summary
Top Holdings as of December 31, 2017% of Portfolio’s
net assetsFidelity Conservative Income Bond Fund Institutional Class 13.1Western Asset Core Bond Fund Class I 8.7PIMCO Total Return Fund Institutional Class 8.7Metropolitan West Total Return Bond Fund Class I 8.7Fidelity Investments Money Market Government Portfolio Institutional Class 7.9Prudential Total Return Bond Fund Class Z 6.6Fidelity Total Bond Fund 6.6Fidelity Short-Term Bond Fund 5.3Fidelity Investment Grade Bond Fund 4.4PIMCO Real Return Fund Institutional Class 3.8
73.8
Asset Allocation (% of Portfolio’s net assets)
U.S. Equity Funds 14.9%
Non – U.S. Equity Funds 9.1%
Bond Funds 49.7%
Short-Term Funds 26.3%

135 Annual Report
See accompanying notes which are an integral part of the financial statements.
U.S. Equity Funds – 14.9%Shares Value
AB Select U.S. Equity Portfolio Advisor Class 811 $ 13,589
BBH Core Select Fund - Retail Class 1,036 11,118Credit Suisse Commodity Return
Strategy Fund 4,215 21,159Fidelity Growth Company Fund 95 17,020Fidelity Real Estate Income Fund 538 6,451JPMorgan Small Cap Equity Fund
Class R6 386 22,099JPMorgan U.S. Equity Fund Class R6 3,018 49,276Legg Mason BW Diversified Large Cap
Value Fund Class I 856 17,844Loomis Sayles Growth Fund 822 12,765LSV Value Equity Fund 616 17,844PIMCO CommoditiesPLUS Strategy
Fund Institutional Class 1,098 6,863PIMCO StocksPLUS Absolute Return
Fund Institutional Class 795 8,510
TOTAL U.S. EQUITY FUNDS(Cost $191,238) 204,538
Non – U.S. Equity Funds – 9.1%
Acadian Emerging Markets Portfolio Institutional Class 1,134 25,393
Causeway International Value Fund Institutional Class 903 15,647
Fidelity Canada Fund 98 5,353MFS International Value Fund Class I 388 17,569MFS Research International Fund
Class I 763 15,236T. Rowe Price Emerging Markets Stock
Fund Class I 376 16,883T. Rowe Price Overseas Stock Fund I
Class 1,229 13,863William Blair International Growth
Fund Class I 476 14,824
TOTAL NON – U.S. EQUITY FUNDS(Cost $104,225) 124,768
Bond Funds – 49.7%
BlackRock High Yield Bond Fund Institutional Class 814 6,346
Fidelity Floating Rate High Income Fund 357 3,431Fidelity Investment Grade Bond Fund 7,573 59,982Fidelity New Markets Income Fund 508 8,236Fidelity Total Bond Fund 8,463 90,042Hotchkis & Wiley High Yield Fund
Class I 518 6,350MainStay High Yield Corporate Bond
Fund Class I 931 5,353Metropolitan West Total Return Bond
Fund Class I 11,275 120,189
Delaware Portfolio 2018 (Multi-Firm)
Investments December 31, 2017Showing Percentage of Net Assets
Shares Value
PIMCO Real Return Fund Institutional Class 4,782 $ 52,890
PIMCO Total Return Fund Institutional Class 11,704 120,196
Prudential Total Return Bond Fund Class Z 6,191 90,258
Western Asset Core Bond Fund Class I 9,496 120,222
TOTAL BOND FUNDS(Cost $682,355) 683,495
Short-Term Funds – 26.3%
Fidelity Conservative Income Bond Fund Institutional Class 17,991 180,629
Fidelity Investments Money Market Government Portfolio Institutional Class 1.19% (a) 108,434 108,434
Fidelity Short-Term Bond Fund 8,431 72,335
TOTAL SHORT-TERM FUNDS(Cost $361,485) 361,398
TOTAL INVESTMENT IN SECURITIES – 100.0%(Cost $1,339,303) 1,374,199
NET OTHER ASSETS (LIABILITIES) – 0.0% (365)
NET ASSETS – 100% $ 1,373,834
Legend(a) The rate quoted is the annualized seven-day yield of the fund at
period end.

136Annual Report
See accompanying notes which are an integral part of the financial statements.
Delaware Portfolio 2018 (Multi-Firm)
Financial Statements
Statement of Assets and Liabilities
December 31, 2017
AssetsInvestments in securities at value (cost
$1,339,303) $ 1,374,199Receivable for investments sold 55,483Distributions receivable 2,743
Total assets 1,432,425
LiabilitiesPayable for investments purchased $ 58,193Accrued management and administration
fees 398Total liabilities 58,591
Net Assets $ 1,373,834
Net Asset Value, offering price and redemption price per unit ($1,373,834 / 91,396 units) $ 15.03
Statement of Operations
Year ended December 31,
2017
Investment IncomeIncome distributions from underlying funds $ 23,226ExpensesManagement and administration fees $ 4,097
Total expenses 4,097
Net investment income (loss) 19,129Realized and Unrealized Gain (Loss) on Invest-
mentsNet realized gain (loss) on sale of underlying
funds’ shares 25,342Capital gain distributions from underlying funds 13,068 38,410Change in net unrealized appreciation (depre-
ciation) on underlying funds’ shares 39,839Net gain (loss) 78,249Net increase (decrease) in net assets resulting
from operations $ 97,378

137 Annual Report
See accompanying notes which are an integral part of the financial statements.
Delaware Portfolio 2018 (Multi-Firm)Financial Statements – continued
Statement of Changes in Net Assets
Year ended December 31,
2017
Year ended December 31,
2016Increase (Decrease) in Net Assets:
OperationsNet investment income (loss) $ 19,129 $ 13,647Net realized gain (loss) 38,410 11,468Change in net unrealized appreciation (depreciation) 39,839 22,484Net increase (decrease) in net assets resulting from operations 97,378 47,599
Unit transactionsProceeds from sales of units 306,346 217,238Cost of units redeemed (66,665) (37,679)Net increase (decrease) in net assets resulting from unit transactions 239,681 179,559Total increase (decrease) in net assets 337,059 227,158
Net AssetsBeginning of period 1,036,775 809,617End of period $ 1,373,834 $ 1,036,775
Other InformationUnit transactions
Sold 20,940 16,201Redeemed (4,602) (2,735)Net increase (decrease) 16,338 13,466
Financial Highlights Delaware Portfolio 2018 (Multi-Firm)
Periods ended December 31, 2017 2016 2015 2014 2013Selected Per Unit Data Net asset value, beginning of period $ 13.81 $ 13.14 $ 13.25 $ 12.69 $ 11.56Income from Investment Operations
Net investment income (loss) A .24 .20 .17 .20 .15Net realized and unrealized gain (loss) .98 .47 (.28) .36 .98
Total increase (decrease) from investment operations 1.22 .67 (.11) .56 1.13Net asset value, end of period $ 15.03 $ 13.81 $ 13.14 $ 13.25 $ 12.69
Total Return 8.83% 5.10% (.83)% 4.41% 9.78%Ratios and Supplemental Data B Net assets, end of period (in $ thousands) $ 1,374 $ 1,037 $ 810 $ 690 $ 363Ratio of expenses to average net assets .35% .35% .35% .35% .35%Ratio of net investment income (loss) to average net assets 1.63% 1.45% 1.30% 1.54% 1.19%Portfolio Turnover Rate 25% 126% 21% 32% 17%
A Calculated based on average units outstanding during the period.B Amounts do not include the activity of any underlying fund.

138Annual Report
Delaware Portfolio 2021 (Multi-Firm)
Investment Summary
Top Holdings as of December 31, 2017% of Portfolio’s
net assetsWestern Asset Core Bond Fund Class I 8.2PIMCO Total Return Fund Institutional Class 8.2Metropolitan West Total Return Bond Fund Class I 8.2Fidelity Conservative Income Bond Fund Institutional Class 8.1JPMorgan U.S. Equity Fund Class R6 6.2Prudential Total Return Bond Fund Class Z 6.2Fidelity Total Bond Fund 6.2Fidelity Investments Money Market Government Portfolio Institutional Class 4.9Fidelity Investment Grade Bond Fund 4.1Fidelity Short-Term Bond Fund 3.2
63.5
Asset Allocation (% of Portfolio’s net assets)
U.S. Equity Funds 24.0%
Non – U.S. Equity Funds 13.3%
Bond Funds 46.5%
Short-Term Funds 16.2%
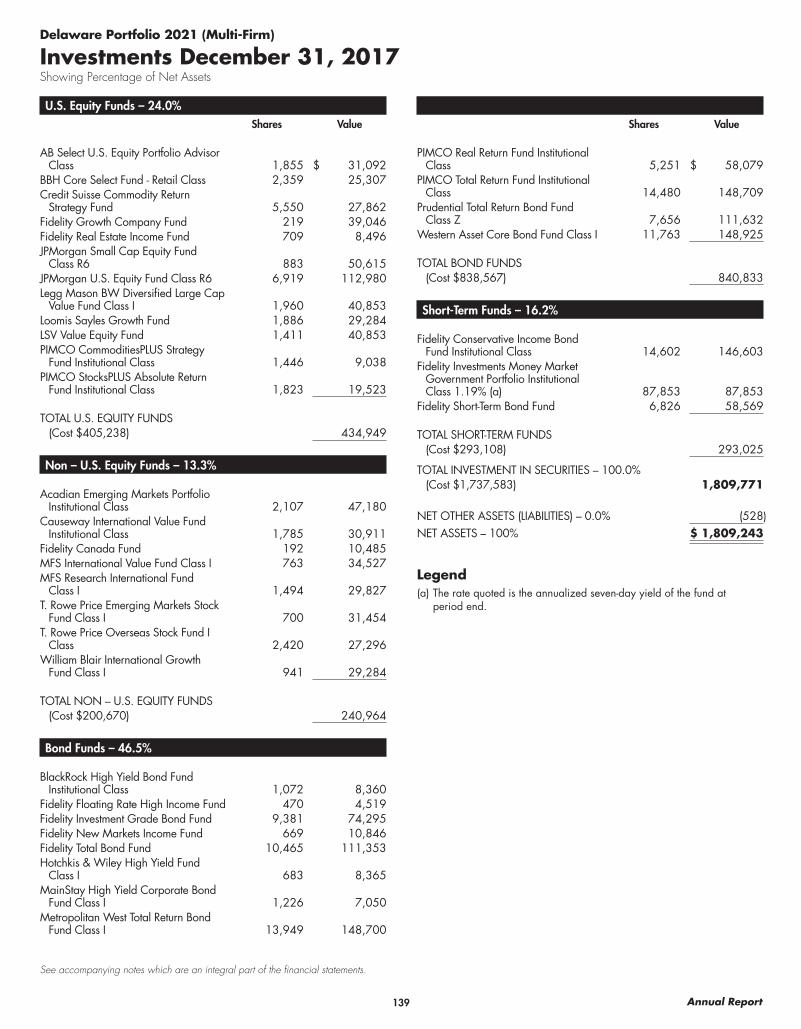
139 Annual Report
See accompanying notes which are an integral part of the financial statements.
U.S. Equity Funds – 24.0%Shares Value
AB Select U.S. Equity Portfolio Advisor Class 1,855 $ 31,092
BBH Core Select Fund - Retail Class 2,359 25,307Credit Suisse Commodity Return
Strategy Fund 5,550 27,862Fidelity Growth Company Fund 219 39,046Fidelity Real Estate Income Fund 709 8,496JPMorgan Small Cap Equity Fund
Class R6 883 50,615JPMorgan U.S. Equity Fund Class R6 6,919 112,980Legg Mason BW Diversified Large Cap
Value Fund Class I 1,960 40,853Loomis Sayles Growth Fund 1,886 29,284LSV Value Equity Fund 1,411 40,853PIMCO CommoditiesPLUS Strategy
Fund Institutional Class 1,446 9,038PIMCO StocksPLUS Absolute Return
Fund Institutional Class 1,823 19,523
TOTAL U.S. EQUITY FUNDS(Cost $405,238) 434,949
Non – U.S. Equity Funds – 13.3%
Acadian Emerging Markets Portfolio Institutional Class 2,107 47,180
Causeway International Value Fund Institutional Class 1,785 30,911
Fidelity Canada Fund 192 10,485MFS International Value Fund Class I 763 34,527MFS Research International Fund
Class I 1,494 29,827T. Rowe Price Emerging Markets Stock
Fund Class I 700 31,454T. Rowe Price Overseas Stock Fund I
Class 2,420 27,296William Blair International Growth
Fund Class I 941 29,284
TOTAL NON – U.S. EQUITY FUNDS(Cost $200,670) 240,964
Bond Funds – 46.5%
BlackRock High Yield Bond Fund Institutional Class 1,072 8,360
Fidelity Floating Rate High Income Fund 470 4,519Fidelity Investment Grade Bond Fund 9,381 74,295Fidelity New Markets Income Fund 669 10,846Fidelity Total Bond Fund 10,465 111,353Hotchkis & Wiley High Yield Fund
Class I 683 8,365MainStay High Yield Corporate Bond
Fund Class I 1,226 7,050Metropolitan West Total Return Bond
Fund Class I 13,949 148,700
Delaware Portfolio 2021 (Multi-Firm)
Investments December 31, 2017Showing Percentage of Net Assets
Shares Value
PIMCO Real Return Fund Institutional Class 5,251 $ 58,079
PIMCO Total Return Fund Institutional Class 14,480 148,709
Prudential Total Return Bond Fund Class Z 7,656 111,632
Western Asset Core Bond Fund Class I 11,763 148,925
TOTAL BOND FUNDS(Cost $838,567) 840,833
Short-Term Funds – 16.2%
Fidelity Conservative Income Bond Fund Institutional Class 14,602 146,603
Fidelity Investments Money Market Government Portfolio Institutional Class 1.19% (a) 87,853 87,853
Fidelity Short-Term Bond Fund 6,826 58,569
TOTAL SHORT-TERM FUNDS(Cost $293,108) 293,025
TOTAL INVESTMENT IN SECURITIES – 100.0%(Cost $1,737,583) 1,809,771
NET OTHER ASSETS (LIABILITIES) – 0.0% (528)
NET ASSETS – 100% $ 1,809,243
Legend(a) The rate quoted is the annualized seven-day yield of the fund at
period end.

140Annual Report
See accompanying notes which are an integral part of the financial statements.
Delaware Portfolio 2021 (Multi-Firm)
Financial Statements
Statement of Assets and Liabilities
December 31, 2017
AssetsInvestments in securities at value (cost
$1,737,583) $ 1,809,771Receivable for investments sold 116,469Distributions receivable 3,552
Total assets 1,929,792
LiabilitiesPayable for investments purchased $ 119,995Accrued management and administration
fees 554Total liabilities 120,549
Net Assets $ 1,809,243
Net Asset Value, offering price and redemption price per unit ($1,809,243 / 109,064 units) $ 16.59
Statement of Operations
Year ended December 31,
2017
Investment IncomeIncome distributions from underlying funds $ 33,302ExpensesManagement and administration fees $ 6,218
Total expenses 6,218
Net investment income (loss) 27,084Realized and Unrealized Gain (Loss) on Invest-
mentsNet realized gain (loss) on sale of underlying
funds’ shares 61,546Capital gain distributions from underlying funds 29,890 91,436Change in net unrealized appreciation (depre-
ciation) on underlying funds’ shares 74,950Net gain (loss) 166,386Net increase (decrease) in net assets resulting
from operations $ 193,470
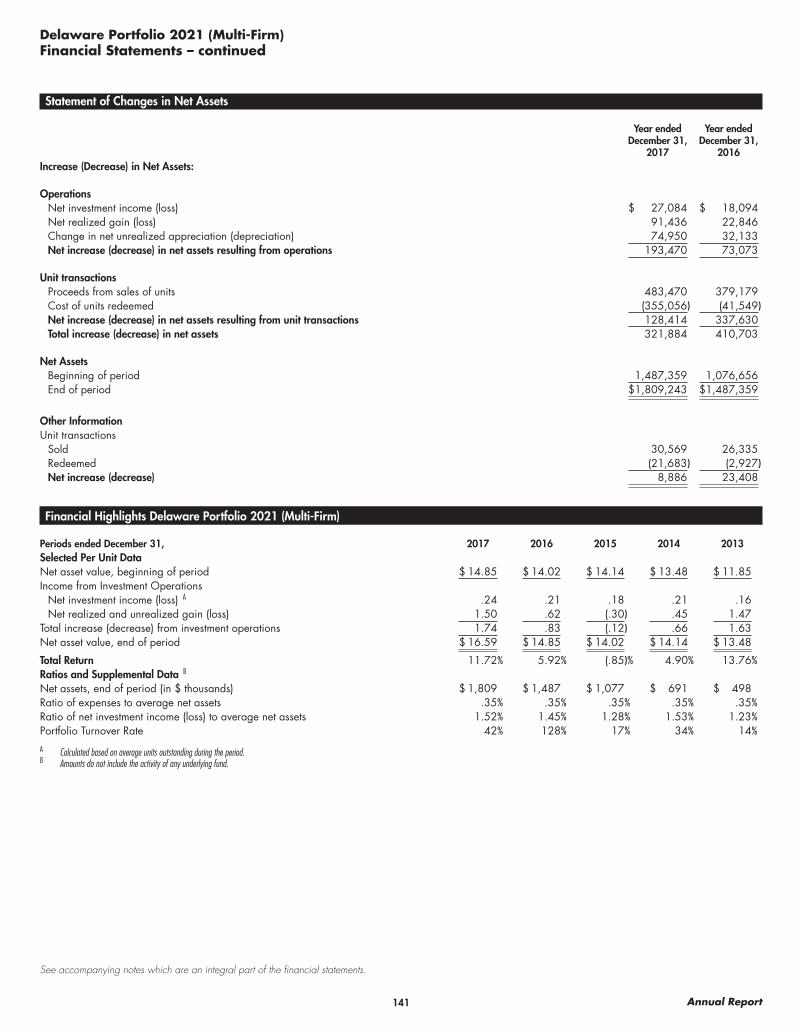
141 Annual Report
See accompanying notes which are an integral part of the financial statements.
Delaware Portfolio 2021 (Multi-Firm)Financial Statements – continued
Statement of Changes in Net Assets
Year ended December 31,
2017
Year ended December 31,
2016Increase (Decrease) in Net Assets:
OperationsNet investment income (loss) $ 27,084 $ 18,094Net realized gain (loss) 91,436 22,846Change in net unrealized appreciation (depreciation) 74,950 32,133Net increase (decrease) in net assets resulting from operations 193,470 73,073
Unit transactionsProceeds from sales of units 483,470 379,179Cost of units redeemed (355,056) (41,549)Net increase (decrease) in net assets resulting from unit transactions 128,414 337,630Total increase (decrease) in net assets 321,884 410,703
Net AssetsBeginning of period 1,487,359 1,076,656End of period $ 1,809,243 $ 1,487,359
Other InformationUnit transactions
Sold 30,569 26,335Redeemed (21,683) (2,927)Net increase (decrease) 8,886 23,408
Financial Highlights Delaware Portfolio 2021 (Multi-Firm)
Periods ended December 31, 2017 2016 2015 2014 2013Selected Per Unit Data Net asset value, beginning of period $ 14.85 $ 14.02 $ 14.14 $ 13.48 $ 11.85Income from Investment Operations
Net investment income (loss) A .24 .21 .18 .21 .16Net realized and unrealized gain (loss) 1.50 .62 (.30) .45 1.47
Total increase (decrease) from investment operations 1.74 .83 (.12) .66 1.63Net asset value, end of period $ 16.59 $ 14.85 $ 14.02 $ 14.14 $ 13.48
Total Return 11.72% 5.92% (.85)% 4.90% 13.76%Ratios and Supplemental Data B Net assets, end of period (in $ thousands) $ 1,809 $ 1,487 $ 1,077 $ 691 $ 498Ratio of expenses to average net assets .35% .35% .35% .35% .35%Ratio of net investment income (loss) to average net assets 1.52% 1.45% 1.28% 1.53% 1.23%Portfolio Turnover Rate 42% 128% 17% 34% 14%
A Calculated based on average units outstanding during the period.B Amounts do not include the activity of any underlying fund.

142Annual Report
Delaware Portfolio 2024 (Multi-Firm)
Investment Summary
Top Holdings as of December 31, 2017% of Portfolio’s
net assetsJPMorgan U.S. Equity Fund Class R6 8.8Western Asset Core Bond Fund Class I 7.0PIMCO Total Return Fund Institutional Class 6.9Metropolitan West Total Return Bond Fund Class I 6.9Fidelity Conservative Income Bond Fund Institutional Class 5.4Prudential Total Return Bond Fund Class Z 5.2Fidelity Total Bond Fund 5.2JPMorgan Small Cap Equity Fund Class R6 4.0Fidelity Investment Grade Bond Fund 3.5Acadian Emerging Markets Portfolio Institutional Class 3.3
56.2
Asset Allocation (% of Portfolio’s net assets)
U.S. Equity Funds 32.9%
Non – U.S. Equity Funds 17.3%
Bond Funds 39.1%
Short-Term Funds 10.7%

143 Annual Report
See accompanying notes which are an integral part of the financial statements.
U.S. Equity Funds – 32.9%Shares Value
AB Select U.S. Equity Portfolio Advisor Class 2,395 $ 40,148
BBH Core Select Fund - Retail Class 3,049 32,713Credit Suisse Commodity Return
Strategy Fund 5,072 25,463Fidelity Growth Company Fund 281 50,227Fidelity Real Estate Income Fund 648 7,765JPMorgan Small Cap Equity Fund
Class R6 1,142 65,427JPMorgan U.S. Equity Fund Class R6 8,914 145,559Legg Mason BW Diversified Large Cap
Value Fund Class I 2,537 52,870Loomis Sayles Growth Fund 2,426 37,670LSV Value Equity Fund 1,826 52,870PIMCO CommoditiesPLUS Strategy
Fund Institutional Class 1,322 8,261PIMCO StocksPLUS Absolute Return
Fund Institutional Class 2,345 25,113
TOTAL U.S. EQUITY FUNDS(Cost $506,359) 544,086
Non – U.S. Equity Funds – 17.3%
Acadian Emerging Markets Portfolio Institutional Class 2,428 54,357
Causeway International Value Fund Institutional Class 2,146 37,174
Fidelity Canada Fund 233 12,722MFS International Value Fund Class I 920 41,635MFS Research International Fund
Class I 1,805 36,018T. Rowe Price Emerging Markets Stock
Fund Class I 805 36,183T. Rowe Price Overseas Stock Fund I
Class 2,929 33,044William Blair International Growth
Fund Class I 1,130 35,192
TOTAL NON – U.S. EQUITY FUNDS(Cost $239,009) 286,325
Bond Funds – 39.1%
BlackRock High Yield Bond Fund Institutional Class 979 7,640
Fidelity Floating Rate High Income Fund 429 4,130Fidelity Investment Grade Bond Fund 7,239 57,331Fidelity New Markets Income Fund 611 9,913Fidelity Total Bond Fund 8,075 85,914Hotchkis & Wiley High Yield Fund
Class I 624 7,644MainStay High Yield Corporate Bond
Fund Class I 1,121 6,444Metropolitan West Total Return Bond
Fund Class I 10,777 114,882
Delaware Portfolio 2024 (Multi-Firm)
Investments December 31, 2017Showing Percentage of Net Assets
Shares Value
PIMCO Real Return Fund Institutional Class 3,319 $ 36,711
PIMCO Total Return Fund Institutional Class 11,187 114,889
Prudential Total Return Bond Fund Class Z 5,907 86,126
Western Asset Core Bond Fund Class I 9,077 114,915
TOTAL BOND FUNDS(Cost $644,499) 646,539
Short-Term Funds – 10.7%
Fidelity Conservative Income Bond Fund Institutional Class 8,820 88,558
Fidelity Investments Money Market Government Portfolio Institutional Class 1.19% (a) 53,035 53,035
Fidelity Short-Term Bond Fund 4,121 35,357
TOTAL SHORT-TERM FUNDS(Cost $177,026) 176,950
TOTAL INVESTMENT IN SECURITIES – 100.0%(Cost $1,566,893) 1,653,900
NET OTHER ASSETS (LIABILITIES) – 0.0% (478)
NET ASSETS – 100% $ 1,653,422
Legend(a) The rate quoted is the annualized seven-day yield of the fund at
period end.

144Annual Report
See accompanying notes which are an integral part of the financial statements.
Delaware Portfolio 2024 (Multi-Firm)
Financial Statements
Statement of Assets and Liabilities
December 31, 2017
AssetsInvestments in securities at value (cost
$1,566,893) $ 1,653,900Receivable for investments sold 143,523Receivable for units sold 770Distributions receivable 2,998
Total assets 1,801,191
LiabilitiesPayable for investments purchased $ 147,271Accrued management and administration
fees 498Total liabilities 147,769
Net Assets $ 1,653,422
Net Asset Value, offering price and redemption price per unit ($1,653,422 / 91,396 units) $ 18.09
Statement of Operations
Year ended December 31,
2017
Investment IncomeIncome distributions from underlying funds $ 26,634ExpensesManagement and administration fees $ 5,127
Total expenses 5,127
Net investment income (loss) 21,507Realized and Unrealized Gain (Loss) on Invest-
mentsNet realized gain (loss) on sale of underlying
funds’ shares 52,158Capital gain distributions from underlying funds 37,719 89,877Change in net unrealized appreciation (depre-
ciation) on underlying funds’ shares 83,574Net gain (loss) 173,451Net increase (decrease) in net assets resulting
from operations $ 194,958

145 Annual Report
See accompanying notes which are an integral part of the financial statements.
Delaware Portfolio 2024 (Multi-Firm)Financial Statements – continued
Statement of Changes in Net Assets
Year ended December 31,
2017
Year ended December 31,
2016Increase (Decrease) in Net Assets:
OperationsNet investment income (loss) $ 21,507 $ 14,905Net realized gain (loss) 89,877 24,019Change in net unrealized appreciation (depreciation) 83,574 34,711Net increase (decrease) in net assets resulting from operations 194,958 73,635
Unit transactionsProceeds from sales of units 451,518 230,218Cost of units redeemed (171,428) (91,652)Net increase (decrease) in net assets resulting from unit transactions 280,090 138,566Total increase (decrease) in net assets 475,048 212,201
Net AssetsBeginning of period 1,178,374 966,173End of period $ 1,653,422 $ 1,178,374
Other InformationUnit transactions
Sold 26,605 15,340Redeemed (9,748) (5,933)Net increase (decrease) 16,857 9,407
Financial Highlights Delaware Portfolio 2024 (Multi-Firm)
Periods ended December 31, 2017 2016 2015 2014 2013Selected Per Unit Data Net asset value, beginning of period $ 15.81 $ 14.83 $ 14.98 $ 14.24 $ 12.10Income from Investment Operations
Net investment income (loss) A .25 .21 .18 .21 .18Net realized and unrealized gain (loss) 2.03 .77 (.33) .53 1.96
Total increase (decrease) from investment operations 2.28 .98 (.15) .74 2.14Net asset value, end of period $ 18.09 $ 15.81 $ 14.83 $ 14.98 $ 14.24
Total Return 14.42% 6.61% (1.00)% 5.20% 17.69%Ratios and Supplemental Data B Net assets, end of period (in $ thousands) $ 1,653 $ 1,178 $ 966 $ 793 $ 524Ratio of expenses to average net assets .35% .35% .35% .35% .35%Ratio of net investment income (loss) to average net assets 1.47% 1.36% 1.18% 1.42% 1.38%Portfolio Turnover Rate 37% 136% 23% 32% 10%
A Calculated based on average units outstanding during the period.B Amounts do not include the activity of any underlying fund.

146Annual Report
Delaware Portfolio 2027 (Multi-Firm)
Investment Summary
Top Holdings as of December 31, 2017% of Portfolio’s
net assetsJPMorgan U.S. Equity Fund Class R6 11.3Western Asset Core Bond Fund Class I 5.6PIMCO Total Return Fund Institutional Class 5.6Metropolitan West Total Return Bond Fund Class I 5.6JPMorgan Small Cap Equity Fund Class R6 5.1Prudential Total Return Bond Fund Class Z 4.2Fidelity Total Bond Fund 4.2LSV Value Equity Fund 4.1Legg Mason BW Diversified Large Cap Value Fund Class I 4.1Fidelity Growth Company Fund 3.9
53.7
Asset Allocation (% of Portfolio’s net assets)
U.S. Equity Funds 41.6%
Non – U.S. Equity Funds 21.0%
Bond Funds 31.2%
Short-Term Funds 6.2%

147 Annual Report
See accompanying notes which are an integral part of the financial statements.
U.S. Equity Funds – 41.6%Shares Value
AB Select U.S. Equity Portfolio Advisor Class 3,634 $ 60,898
BBH Core Select Fund - Retail Class 4,606 49,419Credit Suisse Commodity Return
Strategy Fund 5,972 29,979Fidelity Growth Company Fund 426 76,073Fidelity Real Estate Income Fund 763 9,144JPMorgan Small Cap Equity Fund
Class R6 1,728 99,032JPMorgan U.S. Equity Fund Class R6 13,499 220,437Legg Mason BW Diversified Large Cap
Value Fund Class I 3,837 79,965Loomis Sayles Growth Fund 3,671 57,006LSV Value Equity Fund 2,762 79,965PIMCO CommoditiesPLUS Strategy
Fund Institutional Class 1,556 9,728PIMCO StocksPLUS Absolute Return
Fund Institutional Class 3,561 38,134
TOTAL U.S. EQUITY FUNDS(Cost $751,565) 809,780
Non – U.S. Equity Funds – 21.0%
Acadian Emerging Markets Portfolio Institutional Class 3,363 75,295
Causeway International Value Fund Institutional Class 3,123 54,088
Fidelity Canada Fund 338 18,483MFS International Value Fund Class I 1,337 60,509MFS Research International Fund
Class I 2,622 52,337T. Rowe Price Emerging Markets Stock
Fund Class I 1,116 50,197T. Rowe Price Overseas Stock Fund I
Class 4,260 48,057William Blair International Growth
Fund Class I 1,644 51,170
TOTAL NON – U.S. EQUITY FUNDS(Cost $341,370) 410,136
Bond Funds – 31.2%
BlackRock High Yield Bond Fund Institutional Class 1,153 8,994
Fidelity Floating Rate High Income Fund 506 4,864Fidelity Investment Grade Bond Fund 6,878 54,477Fidelity New Markets Income Fund 720 11,674Fidelity Total Bond Fund 7,680 81,716Hotchkis & Wiley High Yield Fund
Class I 735 8,999MainStay High Yield Corporate Bond
Fund Class I 1,320 7,588Metropolitan West Total Return Bond
Fund Class I 10,240 109,158
Delaware Portfolio 2027 (Multi-Firm)
Investments December 31, 2017Showing Percentage of Net Assets
Shares Value
PIMCO Real Return Fund Institutional Class 1,761 $ 19,472
PIMCO Total Return Fund Institutional Class 10,629 109,164
Prudential Total Return Bond Fund Class Z 5,618 81,912
Western Asset Core Bond Fund Class I 8,625 109,188
TOTAL BOND FUNDS(Cost $605,639) 607,206
Short-Term Funds – 6.2%
Fidelity Conservative Income Bond Fund Institutional Class 5,988 60,119
Fidelity Investments Money Market Government Portfolio Institutional Class 1.19% (a) 35,994 35,994
Fidelity Short-Term Bond Fund 2,812 24,126
TOTAL SHORT-TERM FUNDS(Cost $120,307) 120,239
TOTAL INVESTMENT IN SECURITIES – 100.0%(Cost $1,818,881) 1,947,361
NET OTHER ASSETS (LIABILITIES) – 0.0% (557)
NET ASSETS – 100% $ 1,946,804
(a) The rate quoted is the annualized seven-day yield of the fund at period end.

148Annual Report
See accompanying notes which are an integral part of the financial statements.
Delaware Portfolio 2027 (Multi-Firm)
Financial Statements
Statement of Assets and Liabilities
December 31, 2017
AssetsInvestments in securities at value (cost
$1,818,881) $ 1,947,361Receivable for investments sold 212,752Receivable for units sold 100Distributions receivable 3,229
Total assets 2,163,442
LiabilitiesPayable for investments purchased $ 216,067Accrued management and administration
fees 571Total liabilities 216,638
Net Assets $ 1,946,804
Net Asset Value, offering price and redemption price per unit ($1,946,804 / 100,205 units) $ 19.43
Statement of Operations
Year ended December 31,
2017
Investment IncomeIncome distributions from underlying funds $ 28,711ExpensesManagement and administration fees $ 5,811
Total expenses 5,811
Net investment income (loss) 22,900Realized and Unrealized Gain (Loss) on Invest-
mentsNet realized gain (loss) on sale of underlying
funds’ shares 56,978Capital gain distributions from underlying funds 56,401 113,379Change in net unrealized appreciation (depre-
ciation) on underlying funds’ shares 122,035Net gain (loss) 235,414Net increase (decrease) in net assets resulting
from operations $ 258,314

149 Annual Report
See accompanying notes which are an integral part of the financial statements.
Delaware Portfolio 2027 (Multi-Firm)Financial Statements – continued
Statement of Changes in Net Assets
Year ended December 31,
2017
Year ended December 31,
2016Increase (Decrease) in Net Assets:
OperationsNet investment income (loss) $ 22,900 $ 15,499Net realized gain (loss) 113,379 28,599Change in net unrealized appreciation (depreciation) 122,035 38,511Net increase (decrease) in net assets resulting from operations 258,314 82,609
Unit transactionsProceeds from sales of units 437,594 367,874Cost of units redeemed (105,714) (116,624)Net increase (decrease) in net assets resulting from unit transactions 331,880 251,250Total increase (decrease) in net assets 590,194 333,859
Net AssetsBeginning of period 1,356,610 1,022,751End of period $ 1,946,804 $ 1,356,610
Other InformationUnit transactions
Sold 24,354 23,123Redeemed (5,902) (7,411)Net increase (decrease) 18,452 15,712
Financial Highlights Delaware Portfolio 2027 (Multi-Firm)
Periods ended December 31, 2017 2016 2015 2014 2013Selected Per Unit Data Net asset value, beginning of period $ 16.59 $ 15.49 $ 15.67 $ 14.87 $ 12.26Income from Investment Operations
Net investment income (loss) A .25 .21 .17 .19 .17Net realized and unrealized gain (loss) 2.59 .89 (.35) .61 2.44
Total increase (decrease) from investment operations 2.84 1.10 (.18) .80 2.61Net asset value, end of period $ 19.43 $ 16.59 $ 15.49 $ 15.67 $ 14.87
Total Return 17.12% 7.10% (1.15)% 5.38% 21.29%Ratios and Supplemental Data B Net assets, end of period (in $ thousands) $ 1,947 $ 1,357 $ 1,023 $ 805 $ 523Ratio of expenses to average net assets .35% .35% .35% .35% .35%Ratio of net investment income (loss) to average net assets 1.38% 1.34% 1.04% 1.27% 1.27%Portfolio Turnover Rate 34% 146% 20% 36% 9%
A Calculated based on average units outstanding during the period.B Amounts do not include the activity of any underlying fund.

150Annual Report
Delaware Portfolio 2030 (Multi-Firm)
Investment Summary
Top Holdings as of December 31, 2017% of Portfolio’s
net assetsJPMorgan U.S. Equity Fund Class R6 13.9JPMorgan Small Cap Equity Fund Class R6 6.2LSV Value Equity Fund 5.0Legg Mason BW Diversified Large Cap Value Fund Class I 5.0Fidelity Growth Company Fund 4.8Acadian Emerging Markets Portfolio Institutional Class 4.5Western Asset Core Bond Fund Class I 4.0PIMCO Total Return Fund Institutional Class 4.0Metropolitan West Total Return Bond Fund Class I 4.0AB Select U.S. Equity Portfolio Advisor Class 3.8
55.2
Asset Allocation (% of Portfolio’s net assets)
U.S. Equity Funds 50.4%
Non – U.S. Equity Funds 24.8%
Bond Funds 23.1%
Short-Term Funds 1.7%

151 Annual Report
See accompanying notes which are an integral part of the financial statements.
U.S. Equity Funds – 50.4%Shares Value
AB Select U.S. Equity Portfolio Advisor Class 6,769 $ 113,449
BBH Core Select Fund - Retail Class 8,585 92,122Credit Suisse Commodity Return
Strategy Fund 9,090 45,630Fidelity Growth Company Fund 794 141,885Fidelity Real Estate Income Fund 1,161 13,922JPMorgan Small Cap Equity Fund
Class R6 3,220 184,539JPMorgan U.S. Equity Fund Class R6 25,195 411,435Legg Mason BW Diversified Large Cap
Value Fund Class I 7,149 148,994Loomis Sayles Growth Fund 6,847 106,340LSV Value Equity Fund 5,147 148,994PIMCO CommoditiesPLUS Strategy
Fund Institutional Class 2,370 14,811PIMCO StocksPLUS Absolute Return
Fund Institutional Class 6,638 71,091
TOTAL U.S. EQUITY FUNDS(Cost $1,374,501) 1,493,212
Non – U.S. Equity Funds – 24.8%
Acadian Emerging Markets Portfolio Institutional Class 5,900 132,110
Causeway International Value Fund Institutional Class 5,661 98,046
Fidelity Canada Fund 612 33,472MFS International Value Fund Class I 2,428 109,894MFS Research International Fund
Class I 4,764 95,084T. Rowe Price Emerging Markets Stock
Fund Class I 1,963 88,271T. Rowe Price Overseas Stock Fund I
Class 7,694 86,790William Blair International Growth
Fund Class I 2,978 92,714
TOTAL NON – U.S. EQUITY FUNDS(Cost $607,450) 736,381
Bond Funds – 23.1%
BlackRock High Yield Bond Fund Institutional Class 1,747 13,692
Fidelity Floating Rate High Income Fund 770 7,405Fidelity Investment Grade Bond Fund 7,555 59,835Fidelity New Markets Income Fund 1,096 17,773Fidelity Total Bond Fund 8,408 89,456Hotchkis & Wiley High Yield Fund
Class I 1,118 13,699MainStay High Yield Corporate Bond
Fund Class I 2,009 11,552Metropolitan West Total Return Bond
Fund Class I 11,219 119,592
Delaware Portfolio 2030 (Multi-Firm)
Investments December 31, 2017Showing Percentage of Net Assets
Shares Value
PIMCO Real Return Fund Institutional Class 2,144 $ 23,717
PIMCO Total Return Fund Institutional Class 11,645 119,599
Prudential Total Return Bond Fund Class Z 6,150 89,666
Western Asset Core Bond Fund Class I 9,449 119,624
TOTAL BOND FUNDS(Cost $682,987) 685,610
Short-Term Funds – 1.7%
Fidelity Conservative Income Bond Fund Institutional Class 2,449 24,586
Fidelity Investments Money Market Government Portfolio Institutional Class 1.19% (a) 14,811 14,811
Fidelity Short-Term Bond Fund 1,139 9,775
TOTAL SHORT-TERM FUNDS(Cost $49,191) 49,172
TOTAL INVESTMENT IN SECURITIES – 100.0%(Cost $2,714,129) 2,964,375
NET OTHER ASSETS (LIABILITIES) – 0.0% (845)
NET ASSETS – 100% $ 2,963,530
Legend(a) The rate quoted is the annualized seven-day yield of the fund at
period end.

152Annual Report
See accompanying notes which are an integral part of the financial statements.
Delaware Portfolio 2030 (Multi-Firm)
Financial Statements
Statement of Assets and Liabilities
December 31, 2017
AssetsInvestments in securities at value (cost
$2,714,129) $ 2,964,375Receivable for investments sold 387,157Receivable for units sold 4,603Distributions receivable 4,468
Total assets 3,360,603
LiabilitiesPayable for investments purchased $ 396,208Accrued management and administration
fees 865Total liabilities 397,073
Net Assets $ 2,963,530
Net Asset Value, offering price and redemption price per unit ($2,963,530 / 144,962 units) $ 20.44
Statement of Operations
Year ended December 31,
2017
Investment IncomeIncome distributions from underlying funds $ 40,893ExpensesManagement and administration fees $ 8,998
Total expenses 8,998
Net investment income (loss) 31,895Realized and Unrealized Gain (Loss) on Invest-
mentsNet realized gain (loss) on sale of underlying
funds’ shares 96,502Capital gain distributions from underlying
funds 104,036 200,538Change in net unrealized appreciation (depre-
ciation) on underlying funds’ shares 227,296Net gain (loss) 427,834Net increase (decrease) in net assets resulting
from operations $ 459,729

153 Annual Report
See accompanying notes which are an integral part of the financial statements.
Delaware Portfolio 2030 (Multi-Firm)Financial Statements – continued
Statement of Changes in Net Assets
Year ended December 31,
2017
Year ended December 31,
2016Increase (Decrease) in Net Assets:
OperationsNet investment income (loss) $ 31,895 $ 23,019Net realized gain (loss) 200,538 61,699Change in net unrealized appreciation (depreciation) 227,296 66,830Net increase (decrease) in net assets resulting from operations 459,729 151,548
Unit transactionsProceeds from sales of units 410,068 358,558Cost of units redeemed (118,313) (16,250)Net increase (decrease) in net assets resulting from unit transactions 291,755 342,308Total increase (decrease) in net assets 751,484 493,856
Net AssetsBeginning of period 2,212,046 1,718,190End of period $ 2,963,530 $ 2,212,046
Other InformationUnit transactions
Sold 21,887 22,166Redeemed (6,479) (968)Net increase (decrease) 15,408 21,198
Financial Highlights Delaware Portfolio 2030 (Multi-Firm)
Periods ended December 31, 2017 2016 2015 2014 2013Selected Per Unit Data Net asset value, beginning of period $ 17.07 $ 15.86 $ 16.06 $ 15.23 $ 12.34Income from Investment Operations
Net investment income (loss) A .23 .19 .14 .19 .18Net realized and unrealized gain (loss) 3.14 1.02 (.34) .64 2.71
Total increase (decrease) from investment operations 3.37 1.21 (.20) .83 2.89Net asset value, end of period $ 20.44 $ 17.07 $ 15.86 $ 16.06 $ 15.23
Total Return 19.74% 7.63% (1.25)% 5.45% 23.42%Ratios and Supplemental Data B Net assets, end of period (in $ thousands) $ 2,964 $ 2,212 $ 1,718 $ 1,335 $ 785Ratio of expenses to average net assets .35% .35% .35% .35% .35%Ratio of net investment income (loss) to average net assets 1.24% 1.20% .89% 1.18% 1.29%Portfolio Turnover Rate 34% 133% 14% 29% 6%
A Calculated based on average units outstanding during the period.B Amounts do not include the activity of any underlying fund.

154Annual Report
Delaware Portfolio 2033 (Multi-Firm)
Investment Summary
Top Holdings as of December 31, 2017% of Portfolio’s
net assetsJPMorgan U.S. Equity Fund Class R6 16.4JPMorgan Small Cap Equity Fund Class R6 7.4LSV Value Equity Fund 5.9Legg Mason BW Diversified Large Cap Value Fund Class I 5.9Fidelity Growth Company Fund 5.7Acadian Emerging Markets Portfolio Institutional Class 5.0AB Select U.S. Equity Portfolio Advisor Class 4.5MFS International Value Fund Class I 4.3Loomis Sayles Growth Fund 4.2Causeway International Value Fund Institutional Class 3.8
63.1
Asset Allocation (% of Portfolio’s net assets)
U.S. Equity Funds 59.0%
Non – U.S. Equity Funds 28.5%
Bond Funds 10.9%
Short-Term Funds 1.6%

155 Annual Report
See accompanying notes which are an integral part of the financial statements.
U.S. Equity Funds – 59.0%Shares Value
AB Select U.S. Equity Portfolio Advisor Class 3,921 $ 65,712
BBH Core Select Fund - Retail Class 4,972 53,354Credit Suisse Commodity Return
Strategy Fund 4,461 22,393Fidelity Growth Company Fund 460 82,140Fidelity Real Estate Income Fund 570 6,833JPMorgan Small Cap Equity Fund
Class R6 1,864 106,854JPMorgan U.S. Equity Fund Class R6 14,574 237,989Legg Mason BW Diversified Large Cap
Value Fund Class I 4,144 86,356Loomis Sayles Growth Fund 3,969 61,641LSV Value Equity Fund 2,983 86,356PIMCO CommoditiesPLUS Strategy
Fund Institutional Class 1,163 7,269PIMCO StocksPLUS Absolute Return
Fund Institutional Class 3,842 41,143
TOTAL U.S. EQUITY FUNDS(Cost $805,764) 858,040
Non – U.S. Equity Funds – 28.5%
Acadian Emerging Markets Portfolio Institutional Class 3,260 72,981
Causeway International Value Fund Institutional Class 3,223 55,826
Fidelity Canada Fund 348 19,045MFS International Value Fund Class I 1,381 62,513MFS Research International Fund
Class I 2,709 54,081T. Rowe Price Emerging Markets Stock
Fund Class I 1,083 48,702T. Rowe Price Overseas Stock Fund I
Class 4,382 49,429William Blair International Growth
Fund Class I 1,695 52,773
TOTAL NON – U.S. EQUITY FUNDS(Cost $347,753) 415,350
Bond Funds – 10.9%
BlackRock High Yield Bond Fund Institutional Class 861 6,719
Fidelity Floating Rate High Income Fund 378 3,634Fidelity Investment Grade Bond Fund 1,450 11,485Fidelity New Markets Income Fund 538 8,723Fidelity Total Bond Fund 1,612 17,155Hotchkis & Wiley High Yield Fund
Class I 549 6,723MainStay High Yield Corporate Bond
Fund Class I 986 5,670Metropolitan West Total Return Bond
Fund Class I 2,159 23,010
Delaware Portfolio 2033 (Multi-Firm)
Investments December 31, 2017Showing Percentage of Net Assets
Shares Value
PIMCO Real Return Fund Institutional Class 1,052 $ 11,640
PIMCO Total Return Fund Institutional Class 2,241 23,012
Prudential Total Return Bond Fund Class Z 1,179 17,194
Western Asset Core Bond Fund Class I 1,818 23,016
TOTAL BOND FUNDS(Cost $157,160) 157,981
Short-Term Funds – 1.6%
Fidelity Conservative Income Bond Fund Institutional Class 1,158 11,630
Fidelity Investments Money Market Government Portfolio Institutional Class 1.19% (a) 6,978 6,978
Fidelity Short-Term Bond Fund 542 4,652
TOTAL SHORT-TERM FUNDS(Cost $23,271) 23,260
TOTAL INVESTMENT IN SECURITIES – 100.0%(Cost $1,333,948) 1,454,631
NET OTHER ASSETS (LIABILITIES) – 0.0% (415)
NET ASSETS – 100% $ 1,454,216
Legend(a) The rate quoted is the annualized seven-day yield of the fund at
period end.

156Annual Report
See accompanying notes which are an integral part of the financial statements.
Delaware Portfolio 2033 (Multi-Firm)
Financial Statements
Statement of Assets and Liabilities
December 31, 2017
AssetsInvestments in securities at value (cost
$1,333,948) $ 1,454,631Receivable for investments sold 224,003Receivable for units sold 100Distributions receivable 1,924
Total assets 1,680,658
LiabilitiesPayable for investments purchased $ 226,019Accrued management and administration
fees 423Total liabilities 226,442
Net Assets $ 1,454,216
Net Asset Value, offering price and redemption price per unit ($1,454,216 / 103,558 units) $ 14.04
Statement of Operations
Year ended December 31,
2017
Investment IncomeIncome distributions from underlying funds $ 17,379ExpensesManagement and administration fees $ 3,988
Total expenses 3,988
Net investment income (loss) 13,391Realized and Unrealized Gain (Loss) on Invest-
mentsNet realized gain (loss) on sale of underlying
funds’ shares 39,662Capital gain distributions from underlying funds 59,749 99,411Change in net unrealized appreciation (depre-
ciation) on underlying funds’ shares 111,999Net gain (loss) 211,410Net increase (decrease) in net assets resulting
from operations $ 224,801

157 Annual Report
See accompanying notes which are an integral part of the financial statements.
Delaware Portfolio 2033 (Multi-Firm)Financial Statements – continued
Statement of Changes in Net Assets
Year ended December 31,
2017
Year ended December 31,
2016Increase (Decrease) in Net Assets:
OperationsNet investment income (loss) $ 13,391 $ 7,322Net realized gain (loss) 99,411 18,622Change in net unrealized appreciation (depreciation) 111,999 27,022Net increase (decrease) in net assets resulting from operations 224,801 52,966
Unit transactionsProceeds from sales of units 452,554 430,282Cost of units redeemed (30,449) (12,630)Net increase (decrease) in net assets resulting from unit transactions 422,105 417,652Total increase (decrease) in net assets 646,906 470,618
Net AssetsBeginning of period 807,310 336,692End of period $ 1,454,216 $ 807,310
Other InformationUnit transactions
Sold 35,623 39,757Redeemed (2,374) (1,137)Net increase (decrease) 33,249 38,620
Financial Highlights Delaware Portfolio 2033 (Multi-Firm)
Periods ended December 31, 2017 2016 2015 2014 2013 A
Selected Per Unit Data Net asset value, beginning of period $ 11.48 $ 10.62 $ 10.77 $ 10.19 $ 10.00Income from Investment Operations
Net investment income (loss) B .15 .15 .12 .26 .02Net realized and unrealized gain (loss) 2.41 .71 (.27) .32 .17
Total increase (decrease) from investment operations 2.56 .86 (.15) .58 .19Net asset value, end of period $ 14.04 $ 11.48 $ 10.62 $ 10.77 $ 10.19
Total Return C 22.30% 8.10% (1.30)% 5.69% 1.90%Ratios and Supplemental Data D Net assets, end of period (in $ thousands) $ 1,454 $ 807 $ 337 $ 95 $ 1Ratio of expenses to average net assets .35% .35% .35% .35% .35%E
Ratio of net investment income (loss) to average net assets 1.17% 1.39% 1.09% 2.41% .58%E
Portfolio Turnover Rate 35% 126% 22% 35% —%
A For the period December 18, 2013 (commencement of operations) to December 31, 2013.B Calculated based on average units outstanding during the period.C Total returns for periods of less than one year are not annualized.D Amounts do not include the activity of any underlying fund.E Annualized

158Annual Report
Delaware Portfolio 2036 (Multi-Firm)
Investment Summary
Top Holdings as of December 31, 2017% of Portfolio’s
net assetsJPMorgan U.S. Equity Fund Class R6 18.4JPMorgan Small Cap Equity Fund Class R6 8.3LSV Value Equity Fund 6.7Legg Mason BW Diversified Large Cap Value Fund Class I 6.7Fidelity Growth Company Fund 6.4Acadian Emerging Markets Portfolio Institutional Class 5.5AB Select U.S. Equity Portfolio Advisor Class 5.1MFS International Value Fund Class I 4.8Loomis Sayles Growth Fund 4.8Causeway International Value Fund Institutional Class 4.3
71.0
Asset Allocation (% of Portfolio’s net assets)
U.S. Equity Funds 65.3%
Non – U.S. Equity Funds 31.6%
Bond Funds 2.0%
Short-Term Funds 1.1%

159 Annual Report
See accompanying notes which are an integral part of the financial statements.
U.S. Equity Funds – 65.3%Shares Value
AB Select U.S. Equity Portfolio Advisor Class 271 $ 4,548
BBH Core Select Fund - Retail Class 344 3,692Credit Suisse Commodity Return
Strategy Fund 182 914Fidelity Growth Company Fund 32 5,680Fidelity Real Estate Income Fund 23 276JPMorgan Small Cap Equity Fund
Class R6 129 7,383JPMorgan U.S. Equity Fund Class R6 1,009 16,469Legg Mason BW Diversified Large Cap
Value Fund Class I 286 5,965Loomis Sayles Growth Fund 274 4,262LSV Value Equity Fund 206 5,965PIMCO CommoditiesPLUS Strategy
Fund Institutional Class 47 294PIMCO StocksPLUS Absolute Return
Fund Institutional Class 265 2,836
TOTAL U.S. EQUITY FUNDS(Cost $58,213) 58,284
Non – U.S. Equity Funds – 31.6%
Acadian Emerging Markets Portfolio Institutional Class 218 4,877
Causeway International Value Fund Institutional Class 220 3,816
Fidelity Canada Fund 24 1,302MFS International Value Fund Class I 94 4,271MFS Research International Fund
Class I 185 3,692T. Rowe Price Emerging Markets Stock
Fund Class I 72 3,255T. Rowe Price Overseas Stock Fund I
Class 300 3,379William Blair International Growth
Fund Class I 116 3,611
TOTAL NON – U.S. EQUITY FUNDS(Cost $27,028) 28,203
Delaware Portfolio 2036 (Multi-Firm)
Investments December 31, 2017Showing Percentage of Net Assets
Bond Funds – 2.0%Shares Value
BlackRock High Yield Bond Fund Institutional Class 34 $ 269
Fidelity Floating Rate High Income Fund 16 152Fidelity New Markets Income Fund 22 357Hotchkis & Wiley High Yield Fund
Class I 22 269MainStay High Yield Corporate Bond
Fund Class I 40 232PIMCO Real Return Fund Institutional
Class 43 473
TOTAL BOND FUNDS(Cost $1,759) 1,752
Short-Term Funds – 1.1%
Fidelity Conservative Income Bond Fund Institutional Class 48 482
Fidelity Investments Money Market Government Portfolio Institutional Class 1.19% (a) 285 285
Fidelity Short-Term Bond Fund 22 187
TOTAL SHORT-TERM FUNDS(Cost $954) 954
TOTAL INVESTMENT IN SECURITIES – 100.0%(Cost $87,954) 89,193
NET OTHER ASSETS (LIABILITIES) – 0.0% (20)
NET ASSETS – 100% $ 89,173
Legend(a) The rate quoted is the annualized seven-day yield of the fund at
period end.
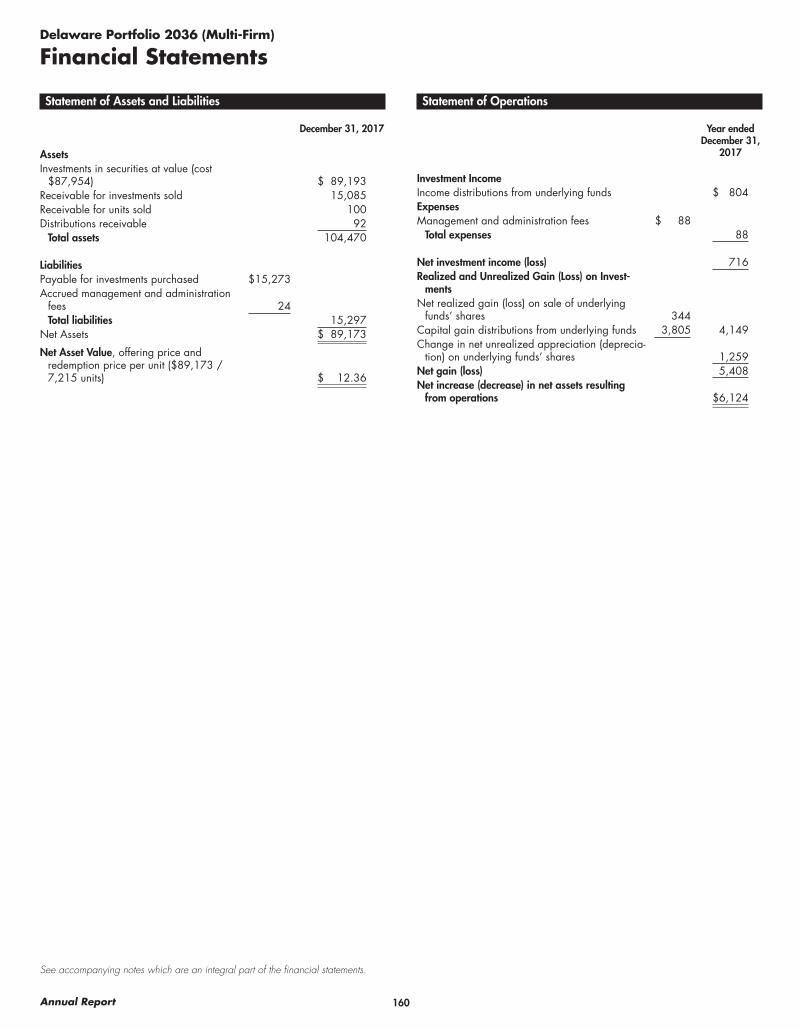
160Annual Report
See accompanying notes which are an integral part of the financial statements.
Delaware Portfolio 2036 (Multi-Firm)
Financial Statements
Statement of Assets and Liabilities
December 31, 2017
AssetsInvestments in securities at value (cost
$87,954) $ 89,193Receivable for investments sold 15,085Receivable for units sold 100Distributions receivable 92
Total assets 104,470
LiabilitiesPayable for investments purchased $ 15,273Accrued management and administration
fees 24Total liabilities 15,297
Net Assets $ 89,173
Net Asset Value, offering price and redemption price per unit ($89,173 / 7,215 units) $ 12.36
Statement of Operations
Year ended December 31,
2017
Investment IncomeIncome distributions from underlying funds $ 804ExpensesManagement and administration fees $ 88
Total expenses 88
Net investment income (loss) 716Realized and Unrealized Gain (Loss) on Invest-
mentsNet realized gain (loss) on sale of underlying
funds’ shares 344Capital gain distributions from underlying funds 3,805 4,149Change in net unrealized appreciation (deprecia-
tion) on underlying funds’ shares 1,259Net gain (loss) 5,408Net increase (decrease) in net assets resulting
from operations $ 6,124

161 Annual Report
See accompanying notes which are an integral part of the financial statements.
Delaware Portfolio 2036 (Multi-Firm)Financial Statements – continued
Statement of Changes in Net Assets
Year ended December 31,
2017
For the period December 14, 2016
(commencement of operations) to December 31,
2016Increase (Decrease) in Net Assets:
OperationsNet investment income (loss) $ 716 $ 6Net realized gain (loss) 4,149 10Change in net unrealized appreciation (depreciation) 1,259 (20)Net increase (decrease) in net assets resulting from operations 6,124 (4)
Unit transactionsProceeds from sales of units 82,053 1,000Net increase (decrease) in net assets resulting from unit transactions 82,053 1,000Total increase (decrease) in net assets 88,177 996
Net AssetsBeginning of period 996 –End of period $ 89,173 $ 996
Other InformationUnit transactions
Sold 7,115 100Net increase (decrease) 7,115 100
Financial Highlights Delaware Portfolio 2036 (Multi-Firm)
Periods ended December 31, 2017 2016 A
Selected Per Unit Data Net asset value, beginning of period $ 9.96 $ 10.00Income from Investment Operations
Net investment income (loss) B .33 .06Net realized and unrealized gain (loss) 2.07 (.10)
Total increase (decrease) from investment operations 2.40 (.04)Net asset value, end of period $ 12.36 $ 9.96
Total Return C 24.10% (.40)%Ratios and Supplemental Data D Net assets, end of period (in $ thousands) $ 89 $ 1Ratio of expenses to average net assets .34% .34%E
Ratio of net investment income (loss) to average net assets 2.80% 12.20%E
Portfolio Turnover Rate 65% 1%
A For the period December 14, 2016 (commencement of operations) to December 31, 2016.B Calculated based on average units outstanding during the period.C Total returns for periods of less than one year are not annualized.D Amounts do not include the activity of any underlying fund.E Annualized
162Annual Report
Notes to Financial StatementsFor the period ended December 31, 2017
1. Organization:
Delaware Qualified Tuition Savings Plan Trust (Trust) was established to promote and operate a higher education savings program – The Delaware College Investment Plan (Plan) – under section 529 of the Internal Revenue Code (IRC) of 1986, as amended. The Plans Management Board is the Trustee of the Trust.
These financials report on the following Portfolios (Portfolios):
Delaware College Portfolio (Fidelity Funds) Delaware Portfolio 2033 (Fidelity Index)Delaware Portfolio 2018 (Fidelity Funds) Delaware Portfolio 2036 (Fidelity Index)Delaware Portfolio 2021 (Fidelity Funds) Delaware Conservative Portfolio (Fidelity Index)Delaware Portfolio 2024 (Fidelity Funds) Delaware Moderate Growth Portfolio (Fidelity Index)Delaware Portfolio 2027 (Fidelity Funds) Delaware Aggressive Growth Portfolio (Fidelity Index)Delaware Portfolio 2030 (Fidelity Funds) Delaware Intermediate Treasury Index PortfolioDelaware Portfolio 2033 (Fidelity Funds) Delaware International Index PortfolioDelaware Portfolio 2036 (Fidelity Funds) Delaware Fidelity 500 Index PortfolioDelaware Conservative Portfolio (Fidelity Funds) Delaware Total Market Index PortfolioDelaware Moderate Growth Portfolio (Fidelity Funds) Delaware Bank Deposit PortfolioDelaware Aggressive Growth Portfolio (Fidelity Funds) Delaware College Portfolio (Multi-Firm)Delaware Money Market Portfolio Delaware Portfolio 2018 (Multi-Firm)Delaware College Portfolio (Fidelity Index) Delaware Portfolio 2021 (Multi-Firm)Delaware Portfolio 2018 (Fidelity Index) Delaware Portfolio 2024 (Multi-Firm)Delaware Portfolio 2021 (Fidelity Index) Delaware Portfolio 2027 (Multi-Firm)Delaware Portfolio 2024 (Fidelity Index) Delaware Portfolio 2030 (Multi-Firm)Delaware Portfolio 2027 (Fidelity Index) Delaware Portfolio 2033 (Multi-Firm)Delaware Portfolio 2030 (Fidelity Index) Delaware Portfolio 2036 (Multi-Firm)
Fidelity Funds Portfolios invest in a combination of Fidelity equity, commodity, fixed-income and short-term funds, which are primarily actively managed by Fidelity Management & Research Company (FMR), an affiliated adviser or sub-adviser, or Geode Capital Management, LLC (Geode), a registered investment adviser. Fidelity Index Portfolios invest in a combination of Fidelity equity, commodity, fixed-income and short-term funds, which are primarily passively managed by FMR, an affiliated adviser or sub-adviser, or Geode. There are individual fund Portfolios which invest in a single equity, fixed-income or money market fund, also managed by FMR, an affiliated adviser or sub-adviser, or Geode. Delaware Bank Deposit Portfolio invests in an interest-bearing account held at Wells Fargo Bank, N.A. Multi-Firm Portfolios invest in a combination of equity, commodity, fixed-income and short-term funds managed by FMR, an affiliated adviser or sub-adviser, or Geode, and non-affiliated mutual funds that participate in Fidelity’s Funds-Network (Third Party funds). Third Party funds and Fidelity equity, commodity, fixed-income and short-term funds are collectively referred to as Underlying Funds.
2. Significant Accounting Policies:
The financial statements have been prepared in conformity with accounting principles generally accepted in the United States of America (GAAP), which require management to make certain estimates and assumptions at the date of the financial statements. Actual results could differ from those estimates. Subsequent events, if any, through the date that the financial statements were issued, April 10, 2018, have been evaluated in the preparation of the financial statements. The Portfolios qualify as investment companies under FASB ASC 946 Financial Services -Investment Companies and follow the accounting and reporting guidance for investment companies. The Portfolios’ Schedules of Investments or Statements of Assets and Liabilities lists each of the Underlying Funds as an investment of each Portfolio but do not include the underlying hold-ings of each Underlying Fund. The following summarizes the significant accounting policies of the Portfolios:
Investment Valuation. Investments are valued as of 4:00 p.m. Eastern time on the last calendar day of the period. Each Portfolio categorizes the inputs to valuation techniques used to value its investments into a disclosure hierarchy consisting of three levels as shown below:
Level 1 – quoted prices in active markets for identical investments
Level 2 – other significant observable inputs
Level 3 – unobservable inputs (including each Portfolio’s own assumptions based on the best information available)
Valuation techniques used to value each Portfolio’s investments by major category are as follows: Investments in the Underlying Funds are valued at their closing net asset value (NAV) each business day and are categorized as Level 1 in the hierarchy. If a Third Party fund’s NAV is unavailable, shares of that fund may be valued by another method that the FMR Fair Value Committee believes reflects fair value in accordance with fair value

163 Annual Report
pricing policies adopted for the Portfolios and is categorized as Level 2 in the hierarchy. As of December 31, 2017, all investments held by the Portfolios are categorized as Level 1 under the Fair Value Hierarchy.
Investment Transactions and Income. For financial reporting purposes, the Portfolios’ investment holdings and NAV include trades executed through the end of the last business day of the period. The NAV per unit for processing participant transactions is calculated as of the close of business of the New York Stock Exchange (NYSE), normally 4:00 p.m. Eastern time, and includes trades executed through the end of the prior business day. Gains and losses on securities sold are determined on the basis of average cost. Income and capital gain distributions from the Underlying Funds, if any, are recorded on the ex-dividend date. Interest income is accrued as earned. There are no distributions of net investment gains or net investment income to the Portfolios’ participants or beneficiaries.
Expenses. Expenses are recorded on the accrual basis. Expense estimates are accrued in the period to which they relate and adjustments are made when actual amounts are known. Expenses included in the accompanying financial statements reflect the expenses of each Portfolio and do not include any expenses associated with the Underlying Funds.
Other. There are no unrecognized tax benefits in the accompanying financial statements in connection with the tax positions taken by each Portfolio. The Portfolios do not file any tax returns since the Trust is exempt from federal and state income tax under Section 529 of the Internal Revenue Code.
3. Fees
The Trustee has entered into a Management and Administrative Services agreement with Fidelity Brokerage Services, LLC (FBS) to provide administrative, record keeping, distribution and marketing services to the Trust. According to this agreement and a related investment advisory agreement with FMR Co., Inc., an investment adviser registered under the Investment Advisers Act of 1940 that provides investment manage-ment services to the Trust, a Management and Administration Fee is charged to the Portfolios at an annual rate based on the net assets of each Portfolio. The Management and Administration Fee has up to three components, a Program Manager Fee that is paid to FMR Co., Inc., a Bank Administration Fee that is paid to FBS and a State Fee that is paid to the Trustee.
For Fidelity Funds Portfolios that invest in underlying actively managed funds, the Program Manager Fee is charged at an annual rate of .15%. For Fidelity Index Portfolios that invest in underlying index funds, the Program Manager Fee is charged at an annual rate of .08%. For Multi-Firm Portfolios that invest in Fidelity funds and Third Party funds, the Program Manager Fee is charged at an annual rate of .30%. For Delaware Bank Deposit Portfolio, the Program Manager Fee is charged at an annual rate ranging from .00% to .05% depending on the daily Federal Funds Target Rate.
The Bank Administration Fee paid to Fidelity for its administration services in connection with Delaware Bank Deposit Portfolio is charged at an annual rate ranging from .00% to .40% depending on the daily Federal Funds Target Rate. The Bank Administration Fee is charged only to the Bank Deposit Portfolio.
For Fidelity Funds Portfolios that invest in underlying actively managed funds, the State Fee is charged at an annual rate of .05%. For Fidelity Index Portfolios that invest in underlying index funds, the State Fee is charged at an annual rate of .01%. For Multi-Firm Portfolios that invest in Fidelity funds and Third Party funds, the State fee is charged at an annual rate of .05%. For Delaware Bank Deposit Portfolio, the State Fee is charged at an annual rate of .05%.
For the period ended December 31, 2017, FMR voluntarily agreed to waive certain expenses of the following Portfolios. Waivers are shown on each Portfolio’s Statement of Operations under the caption “Expense reductions”.
Delaware Money Market Portfolio $ 527Delaware Bank Deposit Portfolio $ 515
4. Other Information:
In the normal course of business, the Portfolios may enter into contracts that provide general indemnifications. The Portfolios’ maximum expo-sure under these arrangements is unknown as this would be dependent on future claims that may be made against the Portfolios. The risk of material loss from such claims is considered remote.
The Portfolios do not invest in the Underlying Funds for the purpose of exercising management or control; however, investments by the Portfolios within their principal investment strategies may represent a significant portion of an Underlying Fund’s net assets. At the end of the period, no Portfolios held a significant portion of the outstanding shares of any Underlying Fund.
5. Change in Independent Registered Public Accounting Firm.
On behalf of the Delaware College Investment Plan, the Delaware College Investment Board has determined not to retain BDO USA, LLP as the Portfolios’ independent auditor and voted to appoint Belfint.Lyons.Shuman. for the fiscal year ended December 31, 2017. For the fiscal years

164Annual Report
Notes to Financial Statements – continued
ended December 31, 2013 through December 31, 2016, audit reports contained no adverse opinion or disclaimer of opinion; nor were their reports qualified as to uncertainty, audit scope, or accounting principles. Further, there were no disagreements between the Portfolios and BDO USA, LLP on accounting principles, financial statements disclosure or audit scope, which if not resolved to the satisfaction of BDO USA, LLP would have caused them to make reference to the disagreement in their report.

165 Annual Report
Independent Auditor’s Report on Internal Control Over Financial Reporting and on Compliance and Other Matters Based on an Audit of Financial Statements Performed in Accordance with Government Auditing Standards
To the Plans Management Board, Trustee of Delaware Qualified Tuition Savings Plan Trust, and the Participants of the Delaware College Investment Plan Dover, Delaware
We have audited, in accordance with the auditing standards generally accepted in the United States of America and the standards applicable to financial audits contained in Government Auditing Standards issued by the Comptroller General of the United States, the financial statements of the 36 investment portfolios (collectively the “Portfolios”) of the Delaware College Investment Plan (Plan), which comprise the statements of assets and liabilities, including the schedules of investments, as of December 31, 2017, and the related statements of operations, statements of changes in net assets, and the financial highlights for the year then ended, and the related notes to the financial statements, and have issued our report thereon dated April 10, 2018.
Internal Control Over Financial ReportingIn planning and performing our audits of the financial statements, we considered the Portfolios’ internal control over financial reporting (internal control) to determine the audit procedures that are appropriate in the circumstances for the purpose of expressing opinions on the financial statements, but not for the purpose of expressing opinions on the effectiveness of the Portfolios’ internal control. Accordingly, we do not express opinions on the effectiveness of the Portfolios’ internal control.
A deficiency in internal control exists when the design or operation of a control does not allow management or employees, in the normal course of performing their assigned functions, to prevent, or detect and correct, misstatements on a timely basis. A material weakness is a deficiency, or a combination of deficiencies, in internal control such that there is a reasonable possibility that a material misstatement of the Portfolios’ financial statements will not be prevented, or detected and corrected on a timely basis. A significant deficiency is a deficiency, or a combination of deficiencies, in internal control that is less ever than a material weakness, yet important enough to merit attention by those charged with governance.
Our consideration of internal control was for the limited purpose described in the preceding paragraph and was not designed to identify all defi-ciencies in internal control that might be material weaknesses or significant deficiencies. Given these limitations, during our audits we did not identify any deficiencies in internal control that we consider to be material weaknesses. However, material weaknesses may exist that have not been identified.
Compliance and Other MattersAs part of obtaining reasonable assurance about whether the Portofios’ financial statements are free from material misstatement, we performed tests of their compliance with certain provisions of laws, regulations, contracts, and grant agreements, noncompliance with which could have a direct and material effect on the determination of financial statement amounts. However, providing opinions on compliance with those provisions was not an objective of our audits and, accordingly, we do not express such opinions. The results of our tests disclosed no instances of noncompli-ance or other matters that are required to be reported under Government Auditing Standards.
Purpose of this ReportThe purpose of this report is solely to describe the scope of our testing of internal control and compliance and the results of that testing, and not to provide an opinion on the effectiveness of the Portfolios’ internal control or on compliance. This report is an integral part of an audit performed in accordance with Government Auditing Standards in considering the Portfolios’ internal control and compliance. Accordingly, this communication is not suitable for any other purpose.
Very truly yours,
166Annual Report
Independent Auditor’s Report on Internal Control Over Financial Reporting and on Compliance and Other Matters Based on an Audit of Financial Statements Performed in Accordance with Government Auditing Standards – continued
April 10, 2018 Wilmington, Delaware

167 Annual Report

offered by the State of Delaware managed by Fidelity Investments
The Delaware College Investment Plan is offered by the State of Delaware and administered by Fidelity Investments. Fidelity, Fidelity Investments and the pyramid design are registered trademarks of FMR LLC. Strategic Advisers is a registered service mark of FMR LLC. The third-party marks appearing in this document are the marks of their respective owners.
Brokerage services provided by Fidelity Brokerage Services LLC, Member NYSE, SIPC.
1.737021.118 515853.12.0 DE-CIT-ANN-0318