impact of leadership style to financial performance of
TRANSCRIPT

Business Systems Research | Vol. 9 No. 1 | 2018
93
Impact of Leadership Style to Financial
Performance of Enterprises
Ivan Miloloža
Faculty for Dental Medicine & Health, University of Osijek, Osijek, Croatia
Abstract
Background: Measurement of financial performance of enterprises is an important
part of balanced scorecard system. Previous research has indicated a relationship
between leadership and financial performance of enterprises. Objectives: Purpose
of the paper is to investigate the impact of leadership styles in Croatian enterprises
to their financial performance. Methods/Approach: Survey research has been
conducted on the sample of Croatian companies, measuring their financial
performance and presence of leadership styles. Results: Overall, democratic style is
the most often present in Croatian enterprises, followed by the authoritarian and
laissez-faire styles. Conclusions: Small enterprises are more successful financially in the
presence of the democratic style. Enterprises in the stagnation phase are more
successful if all leadership styles are mixed together in practice, indicating the need
to push the employees with all possible styles. Enterprises oriented towards
international markets are more successful financially in the presence of the
democratic style and the laissez-faire style.
Keywords: financial performance, leadership styles, democratic, authoritarian,
laissez-faire, international, SME, enterprise
JEL classification: O15
Paper type: Research article
Received: Feb 07, 2018
Accepted: Feb 14, 2018
Citation: Miloloža, I. (2018), “Impact of Leadership Style to Financial Performance of
Enterprises”, Business Systems Research, Vol. 9, No. 1, pp. 93-106.
DOI: 10.2478/bsrj-2018-0008
Introduction The financial perspective includes indicators that are related to the enterprise
strategy (Westerfield, 2003; Parast et al., 2015). In other words, measuring financial
performance will show how the implementation of the strategy contributes to the
creation of final results. The objectives of the financial perspective should bring
about positive results, which affects the results of other perspectives (Kang et al.,
2014). In addition, it is important to keep track of the financial perspective and
balance it with other non-financial perspectives. The focus of the enterprise on
managing relations with customers, suppliers and partners, or on quality of products,
must be aligned with other financial indicators and must impact them positively,
which is true for any other business indicator as well (Kovach et al., 2015).

Business Systems Research | Vol. 9 No. 1 | 2018
94
The main goal of the financial perspective is to increase the shareholder value,
which can be achieved in two ways. The first way is to increase revenue. The steps
leading to the achievement of the first goal are: emergence on new markets,
offering new products and attracting new customers. The other way is to increase
productivity, which can be achieved by improving costs structure or by utilizing
existing assets better through the reduction of capital required to support a
determined business level (Eljelly, 2004). It is important to point out that both ways
which lead to increase in the shareholder value must be carried out actively and
simultaneously. That way it is possible to eliminate the risk of endangering the growth
of the enterprise.
Leading and leadership are two different terms that cannot be used
interchangeably. Leadership can be defined by personal traits or as a process.
Leading is one of the five management functions, and according to some scientists
also the most important one, because it is focused on working with people,
harmonising their relationships and encouraging them to work and perform tasks
more efficiently. Leading consists of a set of processes that direct employees
towards achieving goals more efficiently (Pejic Bach et al., 2006; 2013).
Successful leadership represents one of the most important factors that contribute
to the enterprise success, and it can be defined in several ways that will be
hereinafter set out. Koontz et al. (1990) define leadership as a process of influencing
employees in order to motivate and encourage them to achieve the enterprise's
goals. Griffin (2002) believes that leadership is both a process and a trait. As a
process, leadership represents the focus on activities that a leader takes, and as a
trait, leadership represents leader's traits. Leadership can also be defined as the skill
of encouraging employees to participate voluntarily in the realization of enterprise's
goals (Rožman et al., 2017).
Previous research has shown that leadership styles have a different impact on the
success of an enterprise in the knowledge management area (Miloža 2015a, 2015b,
2015c). The contribution of this research will be to determine the impact of
leadership styles on the financial success of an enterprise.
Literature review Measuring financial success
There is a large number of the financial success measurements and only one
measurement cannot lead to a financial result, thus it is important to use multiple
measurements at the same time. The three most commonly used financial
measurements are: (i) business growth, (ii) value creation and (iii) business
profitability. Financial measurement Business growth includes: revenue to assets ratio,
increase in revenue and assets, revenue from new products and services, as well as
revenue per employee. Financial measurement Value creation includes: economic
value added (EVA), market value added (MVA), stock price and dividends.
Financial measurement Business profitability includes: profit margin, ROE, ROA, ROI,
ROCE and profit per employee.
Financial perspective usually involves indicators that include revenue to costs
ratio, return on investment (ROI), return on equity (ROE) and economic value added
(EVA). Depending on the industry within which an enterprise operates, it is possible to
use indicators such as risk management or measuring intellectual capital. Indicators
from the financial perspective are a prerequisite for selecting other indicators, thus
they need to be defined very carefully.

Business Systems Research | Vol. 9 No. 1 | 2018
95
There is a large number of financial indicators, and the most commonly used ones
are as follows (Niven, 2007): total assets, ratio of profit to assets, return on net assests,
gross margin, net operating profit after taxes, profit per employee, revenue from new
products, revenue and revenue per employee, return on equity (ROE), return on
capital employed (ROCE), return on investment (ROI), economic value added
(EVA), cash flow, debt indicators, interest coverage ratio, accounts receivable
collection period, period of obligations to suppliers, current ratio. In small and
medium-sized enterprises in Croatia, the most commonly used financial indicators
are liquidity indicators and indicators of accounts receivable collection period.
Parmenter (2010) states the following measurements in order to manage the
financial perspective successfully: (i) total assets and total assets per employee, (ii)
return on equity (ROE) and return on capital employed (ROCE), (iii) economic value
added (EVA), (iv) value added per employee, (v) gross margin, (vi) growth rate, (vii)
credit rating, (viii) debt, (ix) dividends and stock price.
Measuring leadership styles Scientists who supported behaviour-based leadership theories tried to define the
best leadership style that would be effective in all situations, which led to several
theories and leadership models such as: authoritarian, democratic and laissez-faire
leadership style. Given the advantages and disadvantages that exist in all three
leadership styles, one can conclude that there is no single best leadership style, but
that leaders must adapt to the situation and their associates in order to achieve the
best result.
Methodology The Leadership Styles Questionnaire, taken from the book Introduction to Leadership
by Northouse (2012) was used as a research instrument. In addition, a questionnaire
for measuring enterprise success in terms of four dimensions of success was used.
Table 1 shows the financial success of all enterprises together. It can be noticed that
respondents from all enterprises believe that items F1. Profitability, F2. Profit and F3.
Return on investment within dimension Financial success are equally important
(average rating 3.50). Cronbach's alpha is greater than 0.7, which indicates that the
financial success indicators are consistent.
Table 1
Financial success of all enterprises together
N Min Max Average St. dev. Cronbach's alpha
Financial success
F1. Profitability 60 2 5 3.533 0.833 0.825
F2. Profit 60 2 5 3.500 0.893
F3. Return on investment 60 2 5 3.517 0.930
Source: Authors’ work
The survey was conducted on a stratified sample of 60 Croatian enterprises total
divided into 6 sub-groups. Of this, there were: (1) 10 small and medium-sized
enterprises in the growth phase (sub-code: SME-growth); (2) 10 small and medium-
sized enterprises in the maturity phase (sub-code: SME-maturity); (3) 10 small and
medium-sized enterprises in the stagnation phase (sub-code: SME-stagnation); (4) 10
large enterprises in the growth phase (sub-code: Large-growth); (5) 10 large

Business Systems Research | Vol. 9 No. 1 | 2018
96
enterprises in the maturity phase (sub-code: Large-maturity) and (6) 10 large
enterprises in the stagnation phase (sub-code: Large-stagnation).
Comparison of average ratings of the presence of leadership styles in all
enterprises together is as follows. The respondents agree mostly with the attitudes
that reflect democratic leadership style, while they agree the least with the attitudes
that reflect laissez-faire leadership style (the lowest average ratings are recorded).
Results Impact of leadership styles on all enterprises together Table 2 shows a regression model with the dependent variable Financial success. All
items of measuring leadership styles, which refer to the authoritarian, democratic
and laissez-faire style, were used as independent variables. Step-wise multiple
regression analysis was used to form the model. A model with a determination
coefficient of 0.254 was established, indicating that the selected model implied
25.4% deviation from the dependent variable.
There is only one statistically significant independent variable in the model that
reflects the authoritarian style – L10. Most employees feel insecure about their work
and need direction (statistically significant at 1% level). Variable L10 has a negative
impact on the dependent variable Financial success in all enterprises.
There is one statistically significant independent variable in the model that reflects
the democratic style – L14. It is the leader’s job to help subordinates find their
“passion” (statistically significant at 1% level). Variable L14 has a positive impact on
the dependent variable Financial success in all enterprises.
There is only one statistically significant independent variable in the model that
reflects the laissez-faire style – L15. In most situations, workers prefer little input from
the leader (statistically significant at 1% level). Variable L15 has a positive impact on
the dependent variable Financial success in all enterprises.
Table 2
Regression model with the dependent variable: Financial success and the
independent variables: items of leadership styles – all enterprises together
Financial success Non-stand.
coefficients
Standard
error
Standardized
coefficients
t P-value
Constant 2.403 0.405 5.936 0.000***
Authoritarian style
L 10. Most employees feel
insecure about their work and
need direction.
-0.271 0.089 -0.393 -3.038 0.004***
Democratic style
L 14. It is the leader’s job to
help subordinates find their
“passion”.
.0.322 0.105 0.375 3.058 0.003***
Laissez-faire style
L 15. In most situations. workers
prefer little input from the
leader.
0.264 0.087 0.371 3.043 0.004***
Model fit
R2 0.254
Adjusted R2 0.214
Note: * 10%, ** 5%, *** 1% probability
Source: Authors’ work

Business Systems Research | Vol. 9 No. 1 | 2018
97
Impact of leadership styles on small and medium-sized enterprises Table 3 shows a regression model with the dependent variable Financial success in
SME enterprises. All items of measuring leadership styles, which refer to the
authoritarian, democratic and laissez-faire style, were used as independent
variables. Step-wise multiple regression analysis was used to form the model. A
model with a determination coefficient of 0.420 was established, indicating that the
selected model implied 42.0% deviation from the dependent variable.
There are two statistically significant independent variables in the model that
reflect the authoritarian style – L10. Most employees feel insecure about their work
and need direction (statistically significant at 5% level) and L13. The leader is the
chief judge of the achievements of the members of the group (statistically significant
at 5% level). Variable L10 has a negative impact on the dependent variable
Financial success in SME enterprises, while variable L13 has a positive impact.
There is only one statistically significant independent variable in the model that
reflects the democratic style – L8. Most workers want frequent and supportive
communication from their leader (statistically significant at 5% level). Variable L8 has
a positive impact on the dependent variable Financial success in SME enterprises.
There is only one statistically significant independent variable in the model that
reflects the laissez-faire – L15. In most situations, workers prefer little input from the
leader (statistically significant at 1% level). Variable L15 has a positive impact on the
dependent variable Financial success in SME enterprises.
Table 3
Regression model with the dependent variable: Financial success and the
independent variables: items of leadership styles in relation to the size of the
enterprise – SME
Financial success - SME Non-stand.
coefficients
Standard
error
Standardized
coefficients
t P-value
Constant 0.096 1.240 0.077 0.939
Authoritarian style
L 10. Most employees feel
insecure about their work
and need direction.
-0.293 0.107 -0.444 -2.744 0.011**
L 13. The leader is the
chief judge of the
achievements of the
members of the group.
0.321 0.152 0.328 2.113 0.045**
Democratic style
L 8. Most workers want
frequent and supportive
communication from their
leader.
0.369 0.197 0.314 1.871 0.073*
Laissez-faire style
L 15. In most situations.
workers prefer little input
from the leader.
0.392 0.118 0.588 3.335 0.003***
Model fit
R2 0.420
Adjusted R2 0.327
Note: * 10%, ** 5%, *** 1% probability
Source: Authors’ work

Business Systems Research | Vol. 9 No. 1 | 2018
98
Impact of leadership styles on large enterprises Table 4 shows a regression model with the dependent variable Financial success. All
items of measuring leadership styles, which refer to the authoritarian, democratic
and laissez-faire style, were used as independent variables. Step-wise multiple
regression analysis was used to form the model. A model with a determination
coefficient of 0.563 was established, indicating that the selected model implied
56.3% deviation from the dependent variable.
There are two statistically significant independent variables in the model that
reflect the authoritarian style – L13. The leader is the chief judge of the achievements
of the members of the group (statistically significant at 10% level) and L16. Effective
leaders give orders and clarify procedures (statistically significant at 10% level).
Variable L13 has a positive impact on the dependent variable Financial success in
large enterprises, while variable L16 has a negative impact.
There are two statistically significant independent variables in the model that
reflect the democratic style – L11. Leaders need to help subordinates accept
responsibility for completing their work (statistically significant at 5% level) and L14. It
is the leader’s job to help subordinates find their “passion” (statistically significant at
1% level). Variable L11 has a negative impact on the dependent variable Financial
success in large enterprises, while variable L14 has a positive impact.
There are two statistically significant independent variables in the model that
reflect the laissez-faire style – L6. Leadership requires staying out of the way of
subordinates as they do their work (statistically significant at 1% level) and L15. In
most situations, workers prefer little input from the leader (statistically significant at 1%
level). Variable L6 has a negative impact on the dependent variable Financial
success in large enterprises, while variable L15 has a positive impact.
Table 4
Regression model with the dependent variable: Financial success and the
independent variables: items of leadership styles – large enterprises Financial success – Large Non-stand.
coefficients
Standard
error
Standardized
coefficients
t P-value
Constant 2.459 0.921 2.671 0.014**
Authoritarian style
L 13. The leader is the chief judge of
the achievements of the members of
the group.
0.332 0.162 0.347 2.045 0.052*
L 16. Effective leaders give orders and
clarify procedures.
-0.162 0.079 -0.328 -2.062 0.051*
Democratic style
L 11. Leaders need to help
subordinates accept responsibility for
completing their work.
-0.326 0.154 -0.390 -2.121 0.045**
L 14. It is the leader’s job to help
subordinates find their “passion”.
0.450 0.128 0.571 3.520 0.002***
Laissez-faire style
L 6. Leadership requires staying out of
the way of subordinates as they do
their work.
-0.325 0.106 -0.472 -3.061 0.006***
L 15. In most situations. workers prefer
little input from the leader.
0.425 0.121 0.506 3.507 0.002***
Model fit
R2 0.563
Adjusted R2 0.449
Note: * 10%, ** 5%, *** 1% probability
Source: Authors’ work

Business Systems Research | Vol. 9 No. 1 | 2018
99
Impact of leadership styles on enterprises in the growth and
maturity phase (leaders) Table 5 shows a regression model with the dependent variable Financial success in
enterprises in the growth and maturity phase (leaders). All items of measuring
leadership styles, which refer to the authoritarian, democratic and laissez-faire style,
were used as independent variables. Step-wise multiple regression analysis was used
to form the model. A model with a determination coefficient of 0.407 was
established, indicating that the selected model implied 40.7% deviation from the
dependent variable.
There is only one statistically significant independent variable in the model that
reflects the authoritarian style – L16. Effective leaders give orders and clarify
procedures (statistically significant at 5% level). Variable L16 has a negative impact
on the dependent variable Financial success in market leader enterprises.
There are three statistically significant independent variables in the model that
reflect the laissez-faire style – L12. Leaders should give subordinates complete
freedom to solve problems on their own (statistically significant at 5% level), L15. In
most situations, workers prefer little input from the leader (statistically significant at
10% level) and L18. In general, it is best to leave subordinates alone (statistically
significant at 1% level). Variable L15 has a positive impact on the dependent
variable Financial success in market leader enterprises, while variables L12 and L18
have a negative impact.
Table 5
Regression model with the dependent variable: Financial success and the
independent variables: items of leadership styles in relation to the growth phase of
the enterprise – Enterprises in the growth and maturity phase (leaders)
Financial success –
Enterprises in the growth and
maturity phase (leaders)
Non-stand.
coefficients
Standard
error
Standardized
coefficients
t P-value
Constant 4.146 0.537 7.728 0.000***
Authoritarian style
L 16. Effective leaders give
orders and clarify procedures.
-0.143 0.078 -0.265 -1.849 0.074**
Laissez-faire style
L 12. Leaders should give
subordinates complete freedom
to solve problems on their own.
-0.182 0.096 -0.276 -1.901 0.067*
L 15. In most situations. workers
prefer little input from the
leader.
0.372 0.108 0.494 3.444 0.002***
L 18. In general. it is best to
leave subordinates alone.
-0.195 0.099 -0.289 -1.962 0.059*
Model fit
R2 0.407
Adjusted R2 0.331
Note: * 10%, ** 5%, *** 1% probability
Source: Authors’ work

Business Systems Research | Vol. 9 No. 1 | 2018
100
Impact of leadership styles on enterprises in the stagnation phase
(followers)
Table 6
Regression model with the dependent variable: Financial success and the
independent variables: items of leadership styles in relation the growth phase of the
enterprise – Enterprises in the stagnation phase (followers)
Financial success –
Enterprises in the stagnation
phase (followers)
Non-stand.
coefficients
Standard
error
Standardized
coefficients
t P-value
Constant -2.146 0.808 -2.657 0.017**
Authoritarian style
L 7. As a rule. employees
must be given rewards or
punishments in order to
motivate them to achieve
organizational objectives.
0.315 0.084 0.407 3.734 0.002***
L 10. Most employees feel
insecure about their work
and need direction.
-0.278 0.075 -0.404 -3.696 0.002***
L 13. The leader is the chief
judge of the achievements
of the members of the
group.
0.680 0.109 0.740 6.257 0.000***
Democratic style
L 8. Most workers want
frequent and supportive
communication from their
leader.
0.273 0.132 0.218 2.068 0.055*
Laissez-faire style
L 3. In complex situations.
leaders should let
subordinates work
problems out on their own.
0.257 0.071 0.407 3.601 0.002***
L 6. Leadership requires
staying out of the way of
subordinates as they do
their work.
-0.176 0.085 -0.227 -2.062 0.056*
L 15. In most situations.
workers prefer little input
from the leader.
0.301 0.072 0.445 4.160 0.001***
Model fit
R2 0.843
Adjusted R2 0.774
Note: * 10%, ** 5%, *** 1% probability
Source: Authors’ work
Table 6 shows a regression model with the dependent variable Financial success
in enterprises in the stagnation phase (followers). All items of measuring leadership
styles, which refer to the authoritarian, democratic and laissez-faire style, were used
as independent variables. Step-wise multiple regression analysis was used to form the
model. A model with a determination coefficient of 0.843 was established, indicating
that the selected model implied 84.3% deviation from the dependent variable.

Business Systems Research | Vol. 9 No. 1 | 2018
101
There are three statistically significant independent variables in the model that
reflect the authoritarian style – L7. As a rule, employees must be given rewards or
punishments in order to motivate them to achieve organizational objectives
(statistically significant at 1% level), L10. Most employees feel insecure about their
work and need direction (statistically significant at 1% level) and L13. The leader is
the chief judge of the achievements of the members of the group (statistically
significant at 1% level). Variables L7 and L13 have a positive impact on the
dependent variable Financial success in market follower enterprises, while variable
L10 has a negative impact.
There is only one statistically significant independent variable in the model that
reflects the democratic style – L8. Most workers want frequent and supportive
communication from their leader (statistically significant at 10% level). Variable L8
has a positive impact on the dependent variable Financial success in market
follower enterprises.
There are three statistically significant independent variables in the model that
reflect the laissez-faire style – L3. In complex situations, leaders should let
subordinates work problems out on their own (statistically significant at 1% level), L6.
Leadership requires staying out of the way of subordinates as they do their work
(statistically significant at 10% level) and L15. In most situations, workers prefer little
input from the leader (statistically significant at 1% level). Variables L3 and L15 have
a positive impact on the dependent variable financial success in market follower
enterprises, while variable L6 has a negative impact
Impact of leadership styles on enterprises oriented towards
domicile markets
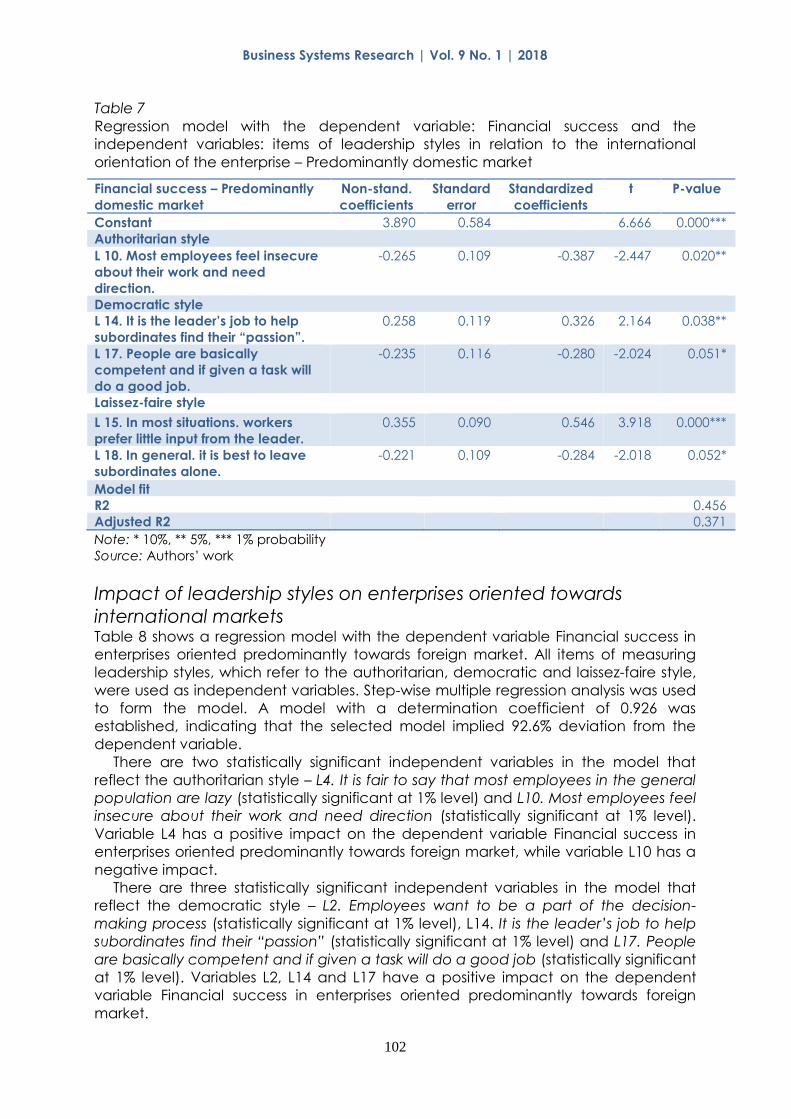
Table 7 shows a regression model with the dependent variable Financial success in
enterprises oriented predominantly towards domestic market. All items of measuring
leadership styles, which refer to the authoritarian, democratic and laissez-faire style,
were used as independent variables. Step-wise multiple regression analysis was used
to form the model. A model with a determination coefficient of 0.456 was
established, indicating that the selected model implied 45.6% deviation from the
dependent variable.
There is only one statistically significant independent variable in the model that
reflects the authoritarian style – L10. Most employees feel insecure about their work
and need direction (statistically significant at 5% level). Variable L10 has a negative
impact on the dependent variable Financial success in enterprises oriented
predominantly towards domestic market.
There are two statistically significant independent variables in the model that
reflect the democratic style – L14. It is the leader’s job to help subordinates find their
“passion” (statistically significant at 5% level) and L17. People are basically
competent and if given a task will do a good job (statistically significant at 10%
level). Variable L14 has a positive impact on the dependent variable Financial
success in enterprises oriented predominantly towards domestic market, while
variable L17 has a negative impact.
There are two statistically significant independent variables in the model that
reflect the laissez-faire style – L15. In most situations, workers prefer little input from the
leader (statistically significant at 1% level) and L18. In general, it is best to leave
subordinates alone (statistically significant at 10% level). Variable L18 has a negative
impact on the dependent variable Financial success in enterprises oriented
predominantly towards domestic market, while variable L15 has a positive impact.
Business Systems Research | Vol. 9 No. 1 | 2018
102
Table 7
Regression model with the dependent variable: Financial success and the
independent variables: items of leadership styles in relation to the international
orientation of the enterprise – Predominantly domestic market
Financial success – Predominantly
domestic market
Non-stand.
coefficients
Standard
error
Standardized
coefficients
t P-value
Constant 3.890 0.584 6.666 0.000***
Authoritarian style
L 10. Most employees feel insecure
about their work and need
direction.
-0.265 0.109 -0.387 -2.447 0.020**
Democratic style
L 14. It is the leader’s job to help
subordinates find their “passion”.
0.258 0.119 0.326 2.164 0.038**
L 17. People are basically
competent and if given a task will
do a good job.
-0.235 0.116 -0.280 -2.024 0.051*
Laissez-faire style
L 15. In most situations. workers
prefer little input from the leader.
0.355 0.090 0.546 3.918 0.000***
L 18. In general. it is best to leave
subordinates alone.
-0.221 0.109 -0.284 -2.018 0.052*
Model fit
R2 0.456
Adjusted R2 0.371
Note: * 10%, ** 5%, *** 1% probability
Source: Authors’ work
Impact of leadership styles on enterprises oriented towards
international markets Table 8 shows a regression model with the dependent variable Financial success in
enterprises oriented predominantly towards foreign market. All items of measuring
leadership styles, which refer to the authoritarian, democratic and laissez-faire style,
were used as independent variables. Step-wise multiple regression analysis was used
to form the model. A model with a determination coefficient of 0.926 was
established, indicating that the selected model implied 92.6% deviation from the
dependent variable.
There are two statistically significant independent variables in the model that
reflect the authoritarian style – L4. It is fair to say that most employees in the general
population are lazy (statistically significant at 1% level) and L10. Most employees feel
insecure about their work and need direction (statistically significant at 1% level).
Variable L4 has a positive impact on the dependent variable Financial success in
enterprises oriented predominantly towards foreign market, while variable L10 has a
negative impact.
There are three statistically significant independent variables in the model that
reflect the democratic style – L2. Employees want to be a part of the decision-
making process (statistically significant at 1% level), L14. It is the leader’s job to help
subordinates find their “passion” (statistically significant at 1% level) and L17. People
are basically competent and if given a task will do a good job (statistically significant
at 1% level). Variables L2, L14 and L17 have a positive impact on the dependent
variable Financial success in enterprises oriented predominantly towards foreign
market.

Business Systems Research | Vol. 9 No. 1 | 2018
103
There are three statistically significant independent variables in the model that
reflect the laissez-faire style – L3. In complex situations, leaders should let
subordinates work problems out on their own (statistically significant at 1% level), L6.
Leadership requires staying out of the way of subordinates as they do their work
(statistically significant at 1% level) and L15. In most situations, workers prefer little
input from the leader (statistically significant at 5% level). Variable L6 has a positive
impact on the dependent variable Financial success in enterprises oriented
predominantly towards foreign market, while variables L3 and L15 have a positive
impact.
Table 8
Regression model with the dependent variable: Financial success and the
independent variables: items of leadership styles in relation to the international
orientation of the enterprise – Predominantly foreign market
Financial success –
Predominantly foreign market
Non-stand.
coefficients
Standard
error
Standardized
coefficients
t P-value
Constant -3.910 1.278 -3.061 0.009***
Authoritarian style
L 4. It is fair to say that most
employees in the general
population are lazy.
0.395 0.120 0.443 3.292 0.006***
L 10. Most employees feel
insecure about their work and
need direction.
-0.199 0.063 -0.280 -3.142 0.008***
Democratic style
L 2. Employees want to be a
part of the decision-making
process.
0.521 0.123 0.512 4.252 0.001***
L 14. It is the leader’s job to
help subordinates find their
“passion”.
0.603 0.098 0.585 6.145 0.000***
L 17. People are basically
competent and if given a task
will do a good job.
0.811 0.142 0.840 5.702 0.000***
Laissez-faire style
L 3. In complex situations.
leaders should let subordinates
work problems out on their
own.
0.449 0.063 0.764 7.132 0.000***
L 6. Leadership requires
staying out of the way of
subordinates as they do their
work.
-0.548 0.074 -0.658 -7.369 0.000***
L 15. In most situations. workers
prefer little input from the
leader.
0.249 0.101 0.271 2.471 0.028**
Model fit
R2 0.926
Prilagođeni R2 0.880
Note: * 10%, ** 5%, *** 1% probability
Source: Authors’ work
Discussion Table 9 shows the impact of different leadership styles on the aggregate financial
success variable. The last three lines of the table show the dominant impact of a
particular leadership style.

Business Systems Research | Vol. 9 No. 1 | 2018
104
Table 9
Impact of different leadership styles on the aggregate variable of financial success
All together All SME Large Growth and
maturity phase
(leaders)
Stagnation
phase
(followers)
International Domicile
L1
L4 1%
L7 1%
L10 -1% -1% -1% -1% -5%
L13 5% 10% 1%
L16 -10% -10%
L2 1%
L5
L8 10%
L11 10% -1%
L14 1% 1% 1% 5%
L17 1% -10%
L3 1% 1%
L6 -1% -10% -1%
L9
L12 -10%
L15 1% 1% 1% 1% 1% 1% 1%
L18 -10% -10%
Authoritarian - - + -
Democratic + + + +
Laissez-faire + + - + +
Note: The table shows the levels of significance and the direction of impact of independent
variables
Source: Authors’ work
Authoritarian leadership style It can be noticed that variable L4 has a statistically significant positive impact on the
financial success only in enterprises oriented towards international market, and the
same goes for variable L7 and enterprises in the stagnation phase (followers). On the
other hand, only variable L10 has a negative impact on virtually all enterprises,
except on large enterprises and enterprises in the growth and maturity phase.
Democratic leadership style It can be noticed that the variables related to the democratic leadership style have
almost entirely positive impact on both large and small enterprises, both market
leaders and followers, and regardless of the market orientation. It is possible to single
out variable L14, which has a statistically significant positive impact on the financial
success in both small and large enterprises, as well as in both enterprises oriented
towards international market and enterprises oriented towards domestic market. On
the other hand, only two variables have a negative impact on the aggregate
variable of financial success. Variable L11 has a negative impact on large
enterprises, while variable L17 has a negative impact on enterprises oriented towards
domestic market.
Laissez-faire leadership style It can be noticed that variable L15 has a statistically significant positive impact on
the aggregate variable of financial success in all enterprises, regardless of their size,
market orientation or growth phase, and the same goes for variable L3 and

Business Systems Research | Vol. 9 No. 1 | 2018
105
enterprises in the stagnation phase (followers) and enterprises oriented towards
international market. On the other hand, variable L6 has a negative impact on large
enterprises, enterprises in the stagnation phase, as well as enterprises oriented
towards international market, which is also true for variable L18 and enterprises in the
growth and maturity phase (leaders) and enterprises oriented towards domestic
market.
Conclusion The research results point to the following differences in financial success. For the
purpose of the conclusion, only the difference in the aggregate variable of financial
success will be analysed. The influence of the authoritarian style is as follows: (i) a
negative impact is present in enterprises in the growth and maturity phase, as well as
in enterprises oriented predominantly towards domicile markets; (ii) a neutral impact
is present in small, medium-sized and large enterprises, in enterprises in the
stagnation phase, as well as in enterprises oriented towards international markets; (iii)
a positive impact is not present in any enterprise group. The impact of the
democratic style is as follows: (i) a negative impact is not present in any enterprise
group; (ii) a neutral impact is present in large enterprises and enterprises oriented
towards domicile market; (iii) a positive impact is present in small enterprises,
enterprises in the stagnation phase and enterprises oriented towards international
markets. The impact of the laissez-faire style is as follows: (i) a negative impact is
present in enterprises in the growth and maturity phase; (ii) a neutral impact is
present in large enterprises, enterprises in the stagnation phase, as well as in both
enterprises oriented towards international markets and enterprises oriented towards
domicile markets, and (iii) a positive impact is not present in any enterprise group.
Overall conclusions are as following: (i) small enterprises are more successful
financially in the presence of the democratic style and the laissez-faire style, while no
leadership style has a statistically significant effect on the financial success in large
enterprises; (ii) enterprises in the stagnation phase are more successful in the
presence of all leadership styles, while no leadership style has a statistically significant
impact on the financial success in enterprises in the growth and maturity phase; (iii)
enterprises oriented towards international markets are more successful financially in
the presence of the democratic style and the laissez-faire style, while no leadership
style has a statistically significant impact on the financial success in enterprises
oriented towards domicile markets.
References 1. Eljelly, A. M. (2004), “Liquidity‐profitability tradeoff: An empirical investigation in an
emerging market”, International journal of commerce and management, Vol. 14, No. 2,
pp. 48-61.
2. Griffin, D. (2002). The emergence of leadership: Linking self-organization and ethics,
Psychology Press, London.
3. Kang, W., Montoya, M. (2014), “The impact of product portfolio strategy on financial
performance: The roles of product development and market entry decisions”, Journal of
Product Innovation Management, Vol. 31, No. 3, pp. 516-534.
4. Koontz, H., Weihrich, H. (1990). Essentials of Management, McGraw-Hill, New York.
5. Kovach, J. J., Hora, M., Manikas, A., Patel, P. C. (2015), “Firm performance in dynamic
environments: The role of operational slack and operational scope”, Journal of
Operations Management, Vol. 37, pp. 1-12.
6. Miloloža, I. (2015a), “Relation of leadership and business performance: balanced
scorecard perspective”, Interdisciplinary Management Research IX, Ekonomski fakultet u
Osijeku, Hochschule Pforzheim University, Osijek, Pforzheim, pp. 159-171.

Business Systems Research | Vol. 9 No. 1 | 2018
106
7. Miloloža, I. (2015b), “Impact of Leadership Style to the BusinessPerformance: Balanced
Scorecard Approach”, in Baćović, M., Milković, M., Pejić Bach, M., Peković, S. (Eds),
Proceedings of theENTERNOVA - ENTerprise REsearch InNOVAtion Conferece, Udruga za
promicanje inovacija i istraživanja u ekonomiji, Zagreb, pp. 222-227.
8. Miloloža, I. (2015c), “Leadership Differences: Internationalization, Size and Development”,
in Baćović, M., Milković, M., Pejić Bach, M., Peković, S. (Eds), Proceedings of
theENTERNOVA - ENTerprise REsearch InNOVAtion Conferece, Udruga za promicanje
inovacija i istraživanja u ekonomiji, Zagreb, pp. 339-346.
9. Niven, P. (2007). Balanced Scorecard: Korak po korak, Masmedia, Zagreb.
10. Northouse, P. G. (2012). Leadership: Theory and practice, Sage, Thousand Oaks.
11. Parast, M. M., Golmohammadi, D., Mcfadden, K. L., Miller, J. W. (2015), “Linking business
strategy to service failures and financial performance: Empirical evidence from the US
domestic airline industry”, Journal of Operations Management, Vol. 38, pp. 14-24.
12. Parmenter, D. (2010). Key performance indicators (KPI): developing, implementing, and
using winning KPIs, John Wiley & Sons, New York.
13. Pejic Bach, M., Knežević, B., Strugar, I. (2006), “Strategic Decision Making in Human
Resource Management Based on System Dynamics Model”, WSEAS Transactions on
Systems, Vol. 5, No. 1, pp. 285-288.
14. Pejic Bach, M., Simic, N., Merkac, M. (2013), “Forecasting Employees' Success at Work in
Banking: Could Psychological Testing Be Used as the Crystal Ball?”, Managing Global
Transitions, Vol. 11, No. 3, pp. 283-299.
15. Rožman, M., Treven, S., Čančer, V. (2017), “Motivation and Satisfaction of Employees in
the Workplace”, Business systems research journal, Vol. 8, No. 2, pp. 14-25.
16. Westerfield, R. J. (2003). Fundamentals of Corporate Finance, McGraw Hill, Boston.
About the author
Asisstant Professor Ivan Miloloža, Ph.D. graduated from the Faculty of Economics and
Business in Zagreb and received a Ph.D. at the Faculty of Economics in Osijek in 2015.
He lived and worked abroad in the period from 1983 to 1986 (Argentina and the
Netherlands). Since 1986, he has been employed by Munja, the only Croatian
battery manufacturer, where he has performed virtually all management functions
and is currently the CEO of the Board (since 1999). He is Assistant Professor at the
Department of Dental Medicine and Health, Dean for Institutional Cooperation and
Development and Chair of the Department of History of Medicine and Social
Sciences. He has performed many social functions in various state bodies,
associations and banks, and was a participant and guest lecturer at numerous
domestic and foreign faculties and international conferences. Author can be
contacted at email: [email protected].