the impact of leadership style on the adoption of …
TRANSCRIPT
i
THE IMPACT OF LEADERSHIP STYLE ON THE ADOPTION OF AGILE
SOFTWARE DEVELOPMENT: A CORRELATIONAL STUDY
by
Mike Kipreos
_______________________
Doctoral Study Submitted in Partial Fulfillment
of the Requirements for the Degree of
Doctor of Business Administration
______________________
Liberty University, School of Business
August 2019
Abstract
Public and private organizations continue to rely prohibitively on classic software development
methodologies such as the waterfall. Private industry more so than the public sector has shown
evidence for a higher rate of success when using agile software development methods.
Consequently, the purpose of this quantitative correlation study was to examine variables that
best predict the adoption of agile methodologies in software development. The study made use
of the UTAUT and MLQ–5X surveys. The primary variable under study was leadership style.
Secondary variables included: performance expectancy, effort expectancy, social influence, and
facilitating factors. A pilot study (N = 30) was conducted in order to evaluate the validity of the
study. This was closely followed by a formal study of 384 panelist. Multiple regression was
performed against each of the variables along with a hierarchical regression at the end of the
study. The regression equation that resulted accounted for 56.4% of the variance in the
behavioral intent to adopt agile methods. Leadership style, specifically transformational
(Inspirational motivation) was found to have a positive impact on the adoption of agile methods.
Facilitating, social influence, effort expectancy, and performance expectancy also had a positive
impact on the adoption of agile methods while individual consideration (transformational
leadership) had a negative impact on the adoption of agile methods. Implications and
recommendations for future research are subsequently presented.
Key words: Agile, Leadership Style, Unified Technology and Acceptance Theory (UTAUT),
Waterfall, MLQ-5X

THE IMPACT OF LEADERSHIP STYLE ON THE ADOPTION OF AGILE SOFTWARE
DEVELOPMENT: A CORRELATIONAL STUDY
by
Mike Kipreos
Doctoral Study Submitted in Partial Fulfillment
of the Requirements for the Degree of
Doctor of Business Administration
Liberty University, School of Business
August 2019
___________________________________________________ Date:____________
Dr. Allen Harper, Dissertation Chair
___________________________________________________ Date:____________
Dr. Gayle Jesse, Dissertation Committee Member
___________________________________________________ Date:____________
Dr. Edward M. Moore, DBA Program Director
Dedication
First, I would like to dedicate this work to my Lord and Savior, Jesus Christ. He has
walked this journey with me. He has carried me through the tough times, the disappointments,
and all of the challenges presented to me, while giving me the courage to continue and the
strength to endure even in the darkest moments when there was but a flicker of hope left. He
was, is and will always be with me (Joshua 1:9)! Next I would like to thank my beautiful wife
who has stood steadfast by my side, never complaining, always the first to raise my spirits, and
giving me the courage to stay the course. She has blessed me with the most precious little girl in
the world. Madeleine, you are my “rock” and the love of my life. Thank you for encouraging
me and pushing me to be the best that I can be. I love you. I also want to thank my parents
Dimitrios and my late mother Petroula Kipreos for tirelessly working long hours and unselfishly
providing all that myself and my siblings needed. We may not have had much, but we definitely
had enough. I miss you mom, but I know you are with me. This is for you. Lastly, I would like
to thank my professors who inspired me to strive for more and even though they may not have
known it at the time, sparked my interest in a career in academia. Thank you all. You will never
truly know how much I admire you for all that you have done for me.

Acknowledgments
I want to acknowledge first and foremost Dr. Harper who guided me through this process
with patience and with grace. He showed great confidence in me even at times when I doubted
myself. He removed much of the anxiety and provided just the right amount of direction while
emphasizing at other times for me to be more independent. Thank you Dr. Harper for creating
an environment to grow. I could not have done this without you. You are a real life blessing. I
also wanted to acknowledge Dr. Jesse, my reader. Thank you for reviewing all of my work and
attention to detail, but most of all thank you for your prayers and words of confidence during this
journey. Thank you for inspiring to even higher standards. I would also like to thank Dr. Moore
for keeping me in line during some of those more stressful moments, but even more importantly,
believing in me. Finally, I would like to thank the School of Business staff and professors for all
that you do for the School of Business and for your kind and inspirational words. Thank you all!

i
Table of Contents
List of Tables ................................................................................................................................. ix
List of Figures ..................................................................................................................................x
Section 1: Foundation of the Study ..................................................................................................1
Background of the Problem ................................................................................................ 2
Problem Statement .............................................................................................................. 3
Purpose Statement ............................................................................................................... 4
Nature of the Study ............................................................................................................. 5
Discussion of method .............................................................................................. 5
Qualitative. .................................................................................................. 5
Mixed. ......................................................................................................... 6
Quantitative. ................................................................................................ 7
Discussion of design. .............................................................................................. 8
Qualitative. .................................................................................................. 8
Mixed. ......................................................................................................... 9
Quantitative. ................................................................................................ 9
Summary of the nature of the study ...................................................................... 10
Research Questions ........................................................................................................... 10
Hypotheses ........................................................................................................................ 11
Theoretical Framework ..................................................................................................... 12
Technology acceptance model .............................................................................. 13
Unified theory of acceptance and the use of technology ...................................... 14
Discussion of relationships between theories and variables ................................. 16

ii
Summary of the conceptual framework ................................................................ 16
Definition of Terms........................................................................................................... 17
Effort expectancy. ................................................................................................. 17
Facilitating conditions. .......................................................................................... 18
Performance expectancy ....................................................................................... 18
Social influence. .................................................................................................... 18
Technology adoption. ........................................................................................... 19
U.S. government employees. ................................................................................ 19
Assumptions, Limitations, Delimitations ......................................................................... 19
Assumptions. ......................................................................................................... 20
Objectivity of participants......................................................................... 20
Validity of the model. ............................................................................... 20
Familiarity with agile methods. ................................................................ 21
Appropriateness of instrument. ................................................................. 21
Limitations ............................................................................................................ 21
Researcher inexperience ........................................................................... 21
Participant scope constraint. ..................................................................... 22
Delimitations ......................................................................................................... 22
Significance of the Study .................................................................................................. 22
Reduction of gaps ................................................................................................. 23
Implications for biblical integration ...................................................................... 23
Relationship to field of study ................................................................................ 24
Summary of the significance of the study............................................................. 24

iii
A Review of the Professional and Academic Literature ................................................... 25
Traditional software development methods .......................................................... 26
Waterfall. .................................................................................................. 26
Requirements and analysis phase. ................................................. 26
System design phase ..................................................................... 27
Coding and implementation phase. ............................................... 27
Integration and testing phase. ....................................................... 27
Deployment of system phase. ....................................................... 27
Maintenance phase. ....................................................................... 28
The spiral model. ...................................................................................... 29
Planning phase. ............................................................................. 30
Risk analysis phase. ...................................................................... 30
Engineering phase. ........................................................................ 30
Evolution phase. ............................................................................ 30
Comparison between waterfall and spiral ................................................. 31
Waterfall advantages. .................................................................... 31
Waterfall disadvantages. ............................................................... 31
Spiral advantages. ......................................................................... 32
Spiral disadvantages...................................................................... 32
Agile methods ....................................................................................................... 33
Notable research on agile and traditional methods ................................... 35
Value of Scrum ......................................................................................... 35
People and processes role in success. ....................................................... 36

iv
Success rates compared............................................................................. 37
Project Management Concerns ................................................................. 37
Prevalent types of agile methods .............................................................. 39
Extreme programming (XP). ........................................................ 39
Crystal methods. ........................................................................... 41
Scrum. ........................................................................................... 42
Lean and Kanban. ......................................................................... 43
User acceptance theories. ...................................................................................... 44
Theory of Reasoned Action (TRA)........................................................... 44
Theory of Planned Behavior (TPB). ......................................................... 45
Technology Acceptance Model (TAM). ................................................... 46
Innovation Diffusion Theory (IDT). ......................................................... 46
Unified Theory of Acceptance and use of Technology (UTAUT). .......... 47
Higher rates of failure in the public sector............................................................ 48
Higher rates of success in the private sector. ........................................................ 50
Influencing factors for agile acceptance. .............................................................. 51
Influence of management and culture on agile acceptance. ..................... 51
Human resource influence on agile acceptance. ....................................... 52
Managerial influence on agile acceptance. ............................................... 52
Customer influence. .................................................................................. 52
Influence of private industry. .................................................................... 53
Process-driven influence. .......................................................................... 54
Lack of available research in the public domain. ................................................. 55

v
Limitations of agile methods. ............................................................................... 56
Not suitable for all projects. .................................................................................. 57
Does the choice of methodology matter?.............................................................. 58
Leadership styles. .................................................................................................. 61
Transformational leadership. .................................................................... 61
Transactional leadership. .......................................................................... 62
Servant leadership ..................................................................................... 62
Autocratic leadership ................................................................................ 63
Laissez-faire leadership ............................................................................ 63
Democratic leadership .............................................................................. 64
Charismatic leadership. ............................................................................. 64
Situational leadership ................................................................................ 65
Summary of the literature review ......................................................................... 66
Transition and Summary of Section 1 .............................................................................. 66
Section 2: The Project ....................................................................................................................68
Purpose Statement ............................................................................................................. 68
Role of the Researcher ...................................................................................................... 69
Participants ........................................................................................................................ 70
Research Method and Design ........................................................................................... 71
Discussion of method ............................................................................................ 71
Discussion of design ............................................................................................. 72
Summary of research method and design ............................................................. 73
Population and Sampling .................................................................................................. 73

vi
Discussion of population....................................................................................... 74
Discussion of sampling ......................................................................................... 74
SurveyGizmo. ........................................................................................... 75
Determining sample size. .......................................................................... 75
Summary of population and sampling .................................................................. 77
Data Collection ................................................................................................................. 77
Instruments ............................................................................................................ 77
UTAUT ..................................................................................................... 78
MLQ-5X ................................................................................................... 79
Data collection techniques .................................................................................... 80
Data organization techniques ................................................................................ 81
Summary of data collection .................................................................................. 81
Data Analysis .................................................................................................................... 82
Variables used in the study ................................................................................... 82
Quantitative data analysis ..................................................................................... 83
Hypothesis 01 and A1. .......................................................................................... 83
Hypothesis 02 and A2 ........................................................................................... 83
Hypothesis 03 and A3. .......................................................................................... 84
Hypothesis 04 and A4. .......................................................................................... 84
Hypothesis 05 and A5. .......................................................................................... 84
Assumptions with regression analysis. ................................................................. 85
Independence of residuals. ........................................................................ 85
Existence of linearity. ............................................................................... 85

vii
Homoscedasticity or residuals. ................................................................. 85
Presence of multicollinearity. ................................................................... 86
Outliers, leverage, and influential points. ................................................. 86
Residual approximate normality. .............................................................. 86
Pilot Study ............................................................................................................. 86
Summary of data analysis ..................................................................................... 87
Reliability and Validity ..................................................................................................... 87
Reliability. ............................................................................................................. 87
Validity. ................................................................................................................ 88
Summary of reliability and validity. ..................................................................... 89
Transition and Summary of Section 2 .............................................................................. 90
Section 3: Application to Professional Practice and Implications for Change ..............................91
Overview of the Study ...................................................................................................... 91
Presentation of the Findings.............................................................................................. 91
Description of the sample. .................................................................................... 92
Demographics. .......................................................................................... 93
Descriptive statistics. ................................................................................ 95
Hypothesis testing. ................................................................................................ 97
Hypotheses 1. ............................................................................................ 97
Hypotheses 2. ............................................................................................ 99
Hypotheses 3. .......................................................................................... 101
Hypotheses 4. .......................................................................................... 103
Hypotheses 5. .......................................................................................... 105

viii
Relationship of hypotheses to research questions ............................................... 106
Post-hoc hierarchical regression analysis. .......................................................... 111
Multiple regression equation............................................................................... 118
Post-hoc g*power analysis .................................................................................. 119
Summary of the findings. .................................................................................... 121
Applications to Professional Practice ............................................................................. 123
Recommendations for Action ......................................................................................... 126
Recommendations for Further Study .............................................................................. 127
Reflections ...................................................................................................................... 128
Summary and Study Conclusions ................................................................................... 130
References ....................................................................................................................................134
Appendix A: IRB Approval .........................................................................................................153
Appendix B: Permission to Use UTAUT Model Image ..............................................................154
Appendix C: Permission to Use the UTAUT Instrument ............................................................155
Appendix D: Permission to Use MLQ-5X Instrument ................................................................156

ix
List of Tables
Table 1. Sample Size.....................................................................................................................76
Table 2. Variable Types ................................................................................................................82
Table 3. Internal Consistency Reliability (ICR) – Pilot Study .....................................................92
Table 4. Demographics – Gender .................................................................................................93
Table 5. Demographics – Age ......................................................................................................94
Table 6. Demographics – Experience ...........................................................................................94
Table 7. Demographics – Voluntariness Use ................................................................................95
Table 8. Descriptive Statistics of Instrument ................................................................................95
Table 9. Internal Consistency Reliability (ICR) ...........................................................................96
Table 10. Regression Analysis for LS ..........................................................................................99
Table 11. Regression Analysis for PE ........................................................................................101
Table 12. Regression Analysis for EE ........................................................................................103
Table 13. Regression Analysis for SI .........................................................................................104
Table 14. Regression Analysis for FC ........................................................................................106
Table 15. Step One of Hierarchical Regression Model ..............................................................113
Table 16. Step Two of Hierarchical Regression Model ..............................................................114
Table 17. Step Three of Hierarchical Regression Model ............................................................115
Table 18. Step Four of Hierarchical Regression Model .............................................................116
Table 19. Step Five of Hierarchical Regression Model - LS ......................................................117
Table 20. Step Five of Hierarchical Regression Model – Final Model ......................................118
Table 21. Summary of Regression Analysis ...............................................................................122

x
List of Figures
Figure 1. Adapted UTAUT model to include the new construct: leadership style. ......................16
Figure 2. The Waterfall Model. ....................................................................................................29
Figure 3. The Spiral Model. ..........................................................................................................30
Figure 4. Theory of Reasoned Action. ..........................................................................................45
Figure 5. Theory of Planned Behavior. .........................................................................................45
Figure 6. Technology Acceptance Model. ....................................................................................46
Figure 7. Diffusion of Innovation Theory.....................................................................................47
Figure 8. Unified Theory of Acceptance and Use of Technology. ...............................................48
Figure 9. Post-hoc G*Power calculation with the parameters used in the study. .......................121

1
Section 1: Foundation of the Study
The adoption of agile methods in private industry, specifically in the domain of
Information Technology (IT) software development, is well documented and has widely been
accepted for the past 15 years (Nuottila, Aaltonen, & Kujala, 2016). The public sector in general
has been much slower to embrace the application of agile methodologies for their IT endeavors
(Larman, 2004). In reality both public and to a lesser extent private organizations continue to
rely on the classic waterfall approach for a majority of their IT efforts. According to “Success in
disruptive times” (2018), 47% of all projects within the past year used a predictive software
development approach. Predictive in this case means traditional or waterfall. In that same study,
only 23% of all projects used agile methods exclusively, while another 23% used a mix of both
agile and traditional methods. With these facts in mind, this study sought to provide possible
reasons why organizations are hesitant to adopt agile methods as a viable alternative. More
succinctly, leadership style was examined with respect to its influence in the adoption of agile
methods.
This section provided the foundation for this research study. First, a brief overview was
given that provided context to the background of the problem. A problem statement followed
that identified a gap between the literature and this study. A purpose statement ensued,
describing the intent and focus of the research, along with the type of study that was conducted,
including the reasons for conducting the study. After the purpose statement, the nature of the
study provided the method and design along with reasons for their selection. This was followed
by research question and hypotheses statements that support the proposed questions. Next, the
theoretical framework was proposed, which helped to provide a visual and explanatory way to
view the independent and dependent variables in the study. Additionally, assumptions,
2
limitations, delimitations, along with Biblical integration were provided. Finally, an exhaustive
review of the related research concludes this section.
Background of the Problem
Despite ever-increasing efforts, multitudes of advancements, strategies, and hard-paid
lessons learned over the years, IT projects continue to fail at an excessively high number in terms
of staying within budget, schedule, and scope boundaries (Standish Group, 2014). For the
purposes of this study, successful projects were those that were completed on time and on
budget. Using this definition, the Standish Group (2014) reported that only 28% of software
development projects were deemed successful. As that report indicated, a total of 55% of IT
projects faced challenges, while as high as 17% outright failed. Numerous studies have been
conducted to identify key critical factors that influence and affect IT project success or failure.
Historically, projects relied on the waterfall methodology. The waterfall methodology,
developed by Royce (1987), is composed of a series of steps that a project moves through from
requirements gathering to development and execution, to testing, implementation and then
finally maintenance. The waterfall methodology is a step through process and does not involve
iterations. As a result, continuous changes in requirements can lead to delayed or in the worst
case abandoned or failed projects. While the waterfall approach has proven to be effective for
larger scale projects and projects where the requirements are fully known in advance, it is not
appropriate in all cases (Pedersen, 2013). Projects where the requirements are not specific,
detailed, or accepted by all stakeholders become susceptible to scope creep. When this happens,
projects risk missing milestones, deadlines, as well as overrunning their budgets. In an effort to
increase the probability of success, many methodologies have been proposed.
3
One such methodology, Agile, has proved to be quite effective across a variety of
industries. According to Ambler (2013), 62% of agile projects have proven to be successful.
Compared with the traditional waterfall methodology, agile methods make use of iterative and
incremental practices to manage software development efforts. Yet even within the Agile
Project Management (APM) realm, few studies have provided empirical assessments of value to
the organization (Cornelius, 2014). Still, even less information is known regarding government
agencies who adopt the APM model. According to Rosacker and Olson (2008), a majority of
these studies are geared towards the private sector. Given these circumstances, this study
attempted to assess the seemingly enigmatic low adoption rate for agile methods in the private
sector and even lower rate for public organizations (Larman, 2004).
Problem Statement
The general problem addressed in this study was despite the documented higher success
rates for agile mediated software development projects, versus traditional waterfall directed
efforts, there continues to be a slow adoption of agile methodologies (Nuottila et al., 2016;
Standish Group, 2015). The specific problem addressed was that the adoption of agile software
development methodologies is slow for private companies and even slower among government
organizations in the United States (Harrison, 2017; Buckhurst, 2017; Wright & Capps, 2011).
The overwhelming majority of IT projects continue to rely on the classic waterfall approach.
Agile software development methodologies are replacing the traditional waterfall model as the
accepted model of choice in industry and government (Larman & Basili, 2003). In a separate
study published by the Standish Group (2015) from 2011 to 2015, 39% of agile projects were
successful, while another 52% reached completion, but with challenges. These findings compare

4
favorably to an overall 16.2% of software projects (in public and private industry) deemed
successful (Standish, 2014).
Both private and public sectors struggle with implementing agile development methods.
With budgets being streamlined across government IT departments, there is a need to be even
more prudent in the use of taxpayer monies. Thus, necessitating the need to maximize success
while reducing waste. A similar case could be made for private organizations. Regrettably, IT
project success rates are unacceptably lower at the government level when compared to the
success rates for comparable IT projects in private industry (Wright, 2013). The research
completed by the Standish Group (2015) showed that IT projects utilizing agile methodologies
had a 400% higher level of success compared to those using Waterfall.
Purpose Statement
The purpose of this quantitative correlation study was to measure if there exists a
relationship between leadership style and the adoption of agile methodologies in software
development. This study made use of and expanded upon the Unified Theory of Acceptance and
Use of Technology (UTAUT) model which examines among other factors, the behavioral intent
to adopt an agile framework (Venkatesh, Morris, Davis, & Davis, 2003). The study was directed
towards all levels of government to include local, city, state, and federal as well as private
organizations within the bounds of the U.S. The goal was to identify and to a certain extent,
justify the organizational shift necessitated when switching from a classic waterfall approach to
that of an agile methodology with regard to those organizations contemplating changing the way
they manage their projects. Thus, this study focused specifically on those organizations that
were either shunning, considering, or were currently using agile methodologies in their software
development efforts. The objective in making this valuation is to add to the body of knowledge

5
by providing additional insight with regard to the effect that leadership style plays in the
adoption and use of agile methodologies. Thus, aiding in the fulfillment of a gap in the body of
knowledge as to the specific impact of leadership style in the adoption of agile methods in
software development. The end goal is to provide valuable information for those organizations
that are considering adopting agile approaches to their software design (Larman, 2004).
Furthermore, the study will provide additional factors that all levels of government and
organizations can take into consideration when contemplating the adoption of agile software
development methodologies.
Nature of the Study
The nature of the study addressed the method and design choices for the research. The
nature of the study included a review of qualitative, mixed, and quantitative methods. First, the
research topic was presented. Understanding the topic helped to provide a more directed
discussion for the research method selected. A justification for the chosen method followed.
Furthermore, a discussion of a variety of designs was also examined. The discussion was
followed by a detailed description for the design instrument selected, along with justification for
its use, before finally concluding with a summary.
Discussion of method. The next three sections discuss the most prevalent research
methods used today. They include qualitative, quantitative, and mixed methods. An
examination of each method was included featuring what makes each unique, including how
information is acquired, analyzed and for which types of studies each is appropriate. Based on
these characteristics, a case was presented for the method of choice for this research.
Qualitative. These methods tend to focus on understanding reasons, gaining deeper
insight, and identifying trends. They use informal methods of obtaining data such as interviews
6
and observations. Observations, open-ended questions, and focus groups are valuable for
gathering qualitative data where conducting statistical analysis or regression testing may be
inappropriate, impractical, or prove unsuitable. Hence, qualitative methods are subjective by
nature as they rely on a researcher’s ability and unavoidable biases in describing life experiences.
Nelson (2016) used a qualitative approach in order to identify reasons for the lack of support for
the use of agile scrum methods, with respect to the perception that it exposes projects to risks and
vulnerabilities. In this case, observations were used, along with inductive reasoning that
ultimately lead to subjective interpretations. Similarly, Cornelius (2014) used a qualitative
multi-case approach, in order to advance to a greater understanding of the value that scrum plays
in organizations. Cornelius (2014) used guiding questions to determine perceived value of scrum
within each organization that was examined. As in the previous study mentioned, this study
utilized perception and subjectivity.
Mixed. These methods focus on or make use of a combination of qualitative methods
and quantitative methods. There is a subjective component as well as an objective component to
these types of studies (Creswell, 2014). Qualitative methods on the other hand focuses on
understanding the problem, individuals, or groups through the use of interviews, case studies,
and live observations of the phenomena of interest. As such, qualitative methods are primarily
descriptive by nature (Creswell, 2014). Mueller (2014) used a mixed methods approach,
specifically the Delphi technique, which is primarily used as a qualitative instrument to obtain a
set of factors that can potentially influence an organization to make the change from using
traditional software development to that of an agile methodology. Once these values were
obtained, they were consolidated and reduced to a discretely organized list of top factors. These
factors were then examined quantitatively in the second phase of this research, which included

7
statistical instruments that allowed Mueller (2014) to focus and further narrow the factors from
the first part of the study. Bird (2010) also used a mixed methods approach focusing on the
opinions, thoughts, and lived experiences of project managers that had used at least one of the
agile methodologies. Bird’s (2010) research included making use of a combination of structured
and open-ended questions. In both of these scenarios the objective was to compare different
perspectives or explain quantitative results through the use of qualitative data (Creswell, 2014).
Quantitative. Quantitative methods generate data that can be used for statistical analysis
and therefore can provide empirical results or evidence for a given set of observations (Creswell,
2014). According to Creswell (2009), quantitative surveys are ideal for testing relationships
between success factors. Quantitative studies frequently focus on the very specific, often taking
a reductionist approach. They test theories and promote objectivity. Quantitative studies deal in
the hard sciences, specifically mathematics and statistics. In one example, Pedersen (2013)
examined which methodology should be used to improve project success rates. In order to do
that, Pedersen (2013) used a Pearson correlation test, which showed a correlation between
communication, user involvement, and use of a quality plan in agile methodology. As in
Pedersen’s research, Misra (2007) used a survey-based quantitative approach to identify success
factors from software development professionals using an agile framework. The common
denominator with quantitative research is the focus on testing relationships, describing cause,
effect, while doing so in a methodical manner through mathematics and statistics.
The research topic is the impact of leadership style on the adoption of agile software
development. This topic is primarily focused on the adoption aspect of a technology. More
precisely, the behavioral intent to adopt an agile methodology was of scientific interest to this
study. Behavioral intent measures the likelihood of adopting an innovation where intentions are
8
predictors for actions (Ajzen & Fishbein, 1980). Ajzen (1991) theorized that a strong behavioral
intention to perform the behavior in question, was tied to a more favorable attitude. This theory
of planned behavior (TPB) has been used with much success by Ekufu (2012) as well. The
nature of this study was most conducive for a quantitative research approach, which will help to
empirically test for the existence of any relationships between technology adoption and other
constructs (Creswell, 2014).
The research method most appropriate for this study was a cross-sectional, quantitative,
non-experimental, correlational study using multiple regression. This correlational study helped
to determine if any of the independent variables had an influence on the dependent variable. In
this case, leadership style to the adoption of agile software development methods. Multiple
regression correlation (MRC) was chosen as the specific method. One of the benefits of MRC is
that it allows for the examination, specifically the presumed causal effects, of correlated
predictors on a dependent variable (Hoyt, Leierer, & Millington, 2006).
Discussion of design. The next three sections discuss the most prevalent research
designs used today. They include qualitative, quantitative, and mixed designs. An examination
of each design was included featuring what made each unique and appropriate for a given type of
research. Also included were examples of how data are acquired (in terms of instruments that
are used) and how that data can then be transformed into valuable information. Based on these
characteristics, a case was presented for the design of choice for this research.
Qualitative. These types of studies may make use of any of the following designs:
narrative, phenomenological, ground theory, case study, or ethnographic. They may include any
number of the following data types: observations, interviews, documents, and audio-video
materials. Korhonen (2013) included research that used a case study built around adaptation.
9
Korhonen (2013) was able to prove the transformation that agile has on a large organization as
well as the immediate discernable effects. Millhollan (2015) conducted a phenomenological
study in order to ascertain what IT leaders perceive to be the most important attributes in terms
of project manager efficacy with respect to success in IT-centric project environments. The key
to this study was the perception that these IT professionals contributed to the efficacy noted
previously. To a large extent, this type of study is subjective by nature.
Mixed. Mixed method designs make use of convergent parallel analysis of data within
the same study. An example mentioned earlier was Mueller (2014) who utilized a combination
of Delphi interviews, followed by surveying to arrive at the top factors motivating IT
professionals to switch to an agile methodology framework within their organizations. In this
situation, an exploratory sequential mixed method design makes the most sense. Likewise, with
Bird (2010) a combination of open and closed-ended questions were necessary in order to
maintain some statistical control.
Quantitative. Quantitative method designs are more descriptive, often involve some type
of correlation and or causal-comparison/quasi-experiment. They utilize surveys, which provide
the necessary quantitative descriptions required of a researcher such as trends, attitudes, or
opinions (Creswell, 2014). Misra (2007) used a post-facto or quasi-experimental design with a
survey that helped to identify agile software development success factors as well as the types of
changes necessary when making the switch from a traditional to an agile framework.
In this study, a non-experimental design was used. Non-experimental designs allow
researchers to use a correlational statistic to describe and measure the degree of association
between two or more variables (Creswell, 2014). Additionally, a non-experimental type of
design supports the use of a survey as the instrument of choice. Use of proven surveys, such as

10
the Hardgrave and Johnson (2003) model can provide inherent validity as they derive their
credibility through proven theories, in this case the technology acceptance model (TAM) and
innovation diffusion theory (IDT). In this study, a survey will be distributed and data will be
collected through the use of online survey tools, as demonstrated by (Lambert, 2011). The
population sampled consisted of IT developers who adopted or were intending to adopt an agile
methodology for software development.
Summary of the nature of the study. The measurement of change or effect on a
dependent variable when confronted by a series of independent variables, as this study proposed,
lends itself to a quantitative approach. It was significant to note that the types of questions that
are asked is what drives the methodology and design for a given study. Other quantitative
studies may also be appropriate such as path analysis and Structural Equation (Malik, Kumra, &
Srivastava, 2013; Abu-Al-Aish & Love, 2013). The most prevalently quantitative method
remains multiple regression. The design will incorporate a survey composed of close-ended
questions, and is very appropriate for a non-experimental study (Lee & Levy, 2014).
Research Questions
This study addressed the problem that despite the documented higher success rates for
agile mediated software development projects, versus traditional waterfall directed efforts, there
continues to be a slow adoption of agile methodologies (Nuottila et al., 2016; Standish, 2015).
There were two types of questions that were examined. The first type of question addressed the
impact of leadership style on the adoption of agile software development methods, while a
second type of questions helped to identify other factors besides leadership style that could
possibly affect this adoption. The primary research question was as follows:

11
RQ1: What is the impact of perceived leadership style (LS) on the adoption of agile
development methods?
The secondary research questions were as follows:
RQ2: What is the impact of perceived performance expectancy (PE) on the adoption of
agile development methods?
RQ3: What is the impact of perceived effort expectancy (EE) on the adoption of agile
development methods?
RQ4: What is the impact of perceived social influence (SI) on the adoption of agile
development methods?
RQ5: What is the impact of perceived facilitating conditions (FC) on the adoption of
agile development methods?
These questions are based on the unified theory of acceptance and use of technology (UTAUT)
model (Venkatesh et al., 2003).
Hypotheses
There were a total of five sets of hypotheses. As with the research questions, they were
broken into a primary hypothesis and four secondary hypotheses. Each set of hypotheses were
tied back to the same numbered research question. The primary hypothesis was as follows:
H01: There is no relationship between perceived LS and the adoption of agile
development methods.
HA1: There is a relationship between perceived LS and the adoption of agile development
methods.
The four sets of secondary hypotheses were as follow:

12
H02: There is no relationship between perceived PE and the adoption of agile
development methods.
HA2: There is a relationship between perceived PE and the adoption of agile development
methods.
H03: There is no relationship between perceived EE and the adoption of agile
development methods.
HA3: There is a relationship between perceived EE and the adoption of agile development
methods.
H04: There is no relationship between perceived SI and the adoption of agile
development methods.
HA4: There is a relationship between perceived SI and the adoption of agile development
methods.
H05: There is no relationship between perceived FC and the adoption of agile
development methods.
HA5: There is a relationship between perceived FC and the adoption of agile development
methods.
Theoretical Framework
This study examined the acceptance and use of a technology, more specifically, agile
methodology adoption. That being the case, this study is most appropriate for those theories that
examine the role of behavioral intent in their investigation (Venkatesh et al., 2003). There were
several theories that explore technology acceptance that are worthy of consideration. The most
widely accepted among them included the technology acceptance model (TAM) and the unified

13
theory of acceptance and use of technology (UTAUT) models (Venkatesh, Thong, & Xu, 2012).
A discussion of these theories follows.
Technology acceptance model. The technology and acceptance model (TAM; Davis,
Bagozzi, & Warshaw, 1989) is an extension of previous IT adoption models, that includes
several underlying theories including, but not limited to the theory of planned behavior (TPB)
advanced by Ajzen (1985) that includes perceived behavioral control, subjective norm, and
attitude towards action or behavior, the theory of task-technology fit (TTF) which has been
applied with respect to the acceptance of IT and the theory of reasoned action (TRA) that
maintains that behavior is motivated by intent and at the same time is influence by an
individual’s attitude toward the behavior in question (Fishbein & Ajzen, 1975). Although TRA
was a precursor to TAM, the TRA construct of attitude was not included in order to improve
understanding of intent. Additionally, TAM proved to be a better predictor of behavioral intent
(BI) in adopting a new technology (R2BI of 0.69) as shown in Mathieson’s (1991) research on the
acceptance of a spreadsheet package than TPB (R2BI of 0.60).
TAM makes use of two factors that influence the decision process of whether an
individual adopts a new technology, perceived usefulness (PU) and perceived ease of use
(PEOU). PU is the expectation by a user that the new technology will improve their job
performance. PEOU refers to the user’s perception on the degree of difficulty that exists in
learning and using a new technology. PEOU influences BI (Gangwar, Date, & Raoot, 2014),
while at the same time being inversely proportional to PU. This means that the easier the
technology seems to be with respect to its use, the more likely that users will be able to carry out
the behavior required to accept and use the technology (Davis et al., 1989). TAM can be an
appropriate model for the initial adoption of a technology (Karahanna, Agarwal, & Angst, 2006).

14
There exists an awareness that TAM lacks predictive power as well as the ability to adopt to
continuous changes in IT (Bagozzi, 2007).
Unified theory of acceptance and the use of technology. The unified theory of
acceptance and the use of technology (UTAUT) theory was proposed by Venkatesh et al. (2003)
and included a combination of factors determining intention of use or adoption of technology.
UTAUT differs from other theories, including the TAM in several ways. The TAM makes use
of two variables whereas the UTAUT model combines approximately 32 variables from eight
other theories, including TAM (Venkatesh et al., 2003). The objective in combining these
theories was to create a single unifying view of user technology adoption, something that the
TAM theory does not do. The eight theories or models that make up UTAUT include the
following:
1. The theory of reasoned action (Fishbein & Ajzen, 1975).
2. The technology acceptance model (Davis et al., 1989).
3. The theory of planned behavior (Ajzen, 1991).
4. The combined TAM and TPB (Taylor & Todd, 1995).
5. The diffusion of innovation theory (Rogers, 1995).
6. The social cognitive theory (Bandura, 1986).
7. The motivational theory (Davis et al., 1989).
8. The PC utilization theory (Thompson, Higgins, & Howell, 1991; Serben, 2014).
UTAUT includes four factors that help to determine intention of use and acceptance,
compared to the two that TAM has to offer. The four factors included: social influence (SI),
performance expectancy (PE), effort expectancy (EE), and facilitating conditions (FC)
(Venkatesh et al., 2003). SI describes the degree to which others influence their decision to use a

15
technology. PE describes the degree to which using a new technology will be advantageous
towards their job performance. EE describes the degree of ease of use associated with a new
technology. Lastly, FC describes the degree to which an individual believes that there is
adequate organizational support in place to support the new technology. It is important to note
that UTAUT had a higher predictability of variance (70%) as a whole, outperforming each of the
eight models that make it up. TAM on the other had exhibited only a 40% level of predictability
between intent and adoption (Oye, Aiahad, & Abrahim, 2014). Most of the research conducted
on technology adoption uses TAM. Part of the reason for this is TAM’s popularity as is evident
in the literature. Additionally, while UTAUT is in fact a more robust model, and able to explain
approximately 70% of intent to use a new technology, it is not without its share of limitations
(Moghavvemi, Salleh, Zhao, & Mattila, 2012). Specifically, the FC factor which is concerned
with the adequate organizational conditions to support new technology adoption cannot account
for unforeseen changes or events that may affect a sudden change in an individual’s beliefs and
therefore ensuing behavior towards the use of new technology (Moghavvemi et al., 2012).
UTAUT nevertheless, remains an overall better predictor of behavior than the alternatives
discussed.
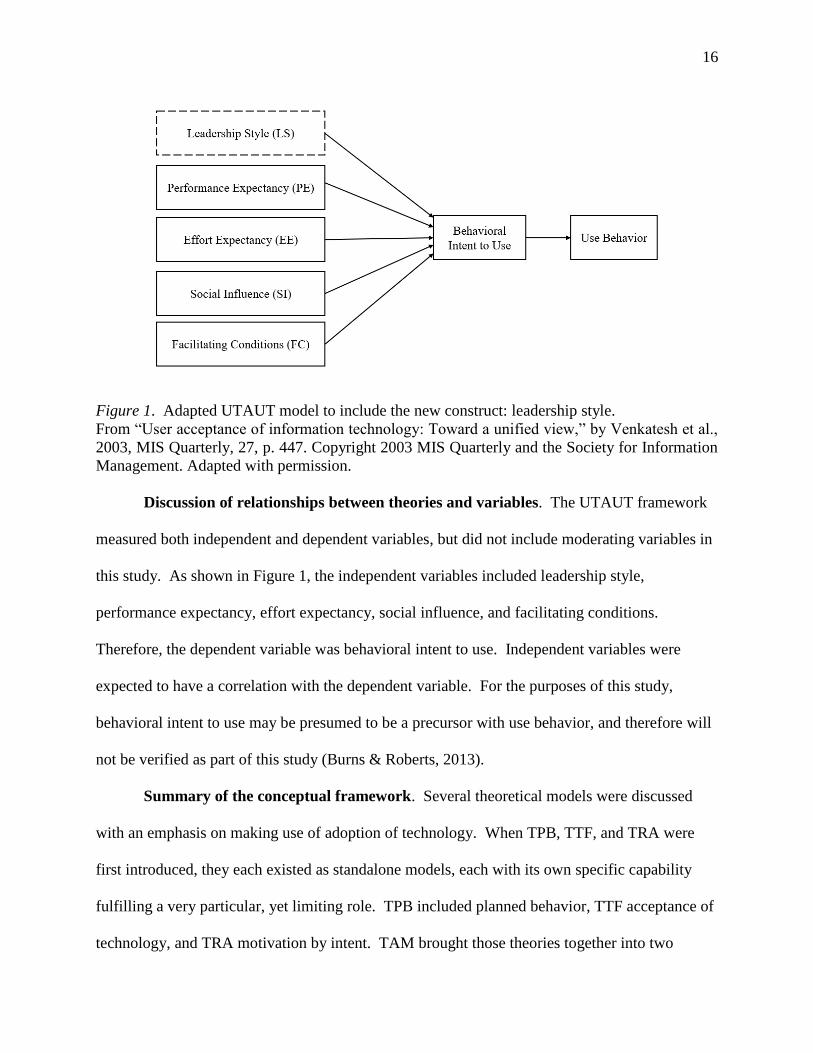
This quantitative, non-experimental, correlation study analyzed the impact of leadership
style on the adoption of the agile software development methods in government organizations.
UTAUT was the theoretical framework that was used. A new construct of leadership style
(shown in the dotted line box of Figure 1) was assessed along with other UTAUT constructs to
determine the impact on the behavioral intent to adopt a technology, in this case agile software
development methods.
16
Figure 1. Adapted UTAUT model to include the new construct: leadership style.
From “User acceptance of information technology: Toward a unified view,” by Venkatesh et al.,
2003, MIS Quarterly, 27, p. 447. Copyright 2003 MIS Quarterly and the Society for Information
Management. Adapted with permission.
Discussion of relationships between theories and variables. The UTAUT framework
measured both independent and dependent variables, but did not include moderating variables in
this study. As shown in Figure 1, the independent variables included leadership style,
performance expectancy, effort expectancy, social influence, and facilitating conditions.
Therefore, the dependent variable was behavioral intent to use. Independent variables were
expected to have a correlation with the dependent variable. For the purposes of this study,
behavioral intent to use may be presumed to be a precursor with use behavior, and therefore will
not be verified as part of this study (Burns & Roberts, 2013).
Summary of the conceptual framework. Several theoretical models were discussed
with an emphasis on making use of adoption of technology. When TPB, TTF, and TRA were
first introduced, they each existed as standalone models, each with its own specific capability
fulfilling a very particular, yet limiting role. TPB included planned behavior, TTF acceptance of
technology, and TRA motivation by intent. TAM brought those theories together into two
17
constructs: PU which examines perceived usefulness and PEOU that ascertains perceived ease of
use. Combined it was a tremendous step forward as noted in its popularity of use in the literature
(Venkatesh et al., 2012). The last theoretical framework discussed was UTAUT, which grew out
of a gap and subsequent need to consolidate several theories into as close to a unifying theory as
we can have today, with respect to technology adoption. It combined eight models into one and
provided four constructs. These factors were PE, which deals with performance expectation, EE
which deals with expected effort, SI which deals with influence from peers and acceptability, and
finally FC which speaks to the proper environment and organizational structure requirement
component for technology adoption. It has been shown that UTAUT is able to account for up to
70% of variance in usage intention as opposed to any of the eight models alone (Venkatesh et al.,
2003). UTAUT compares favorably against TAM, which is only able to account for 40% of the
variance between intent and adoption of technology (Gangwar et al., 2014). For these reasons,
the UTAUT model was chosen for this study. The model was expanded from the original four
constructs of PE, EE, SI, and FC to include a fifth factor, LS, leadership style. These five factors
made up the independent variables that was studied as they examined the dependent variable of
behavioral intent to use, in other words adopt a technology.
Definition of Terms
This study extended the UTAUT framework in order to investigate the influence of
leadership style on the adoption of agile software development methods among U.S. government
employees. An understanding of each of the components of the UTAUT model, leadership style,
and U.S. government employees was essential towards understanding this research.
Effort expectancy. EE is defined as the perceived ease of use of the new technology in
question (Venkatesh et al., 2003). EE, like PE, has its origins in TAM. TAM includes the

18
perceived ease of use (PEOU) construct which references the user’s perception to the level of
difficulty that exists in learning and using a new technology (Davis et al., 1989). Like PE, EE is
one of the strongest predictors for intent to use a technology. One limitation is that it’s
predictability for intent is decreased as the user increases their comprehension of the technology
(Venkatesh et al., 2003). As with the other constructs mentioned, age, gender, and experience
influenced this construct.
Facilitating conditions. FCs can be thought of as an environmental factor in the sense
that it represents the degree to which organizational conditions exist to support new technology
adoption (Venkatesh et al., 2003). With this factor, the infrastructure that is in place becomes the
influencing factor that an individual takes into consideration during the adoption process. FC,
however, cannot account for unanticipated changes or events, which may in turn affect an
individual’s beliefs and consequential behavior towards the use of new technology (Moghavvemi
et al., 2012). While SI considers what others think and FC the readiness of the environment,
another condition has an intrinsic motivational component.
Performance expectancy. Performance expectancy (PE), is concerned with the degree
with which a new technology will help an individual to improve their job performance. PE has
its foundations in TAM where it is known as the perceived usefulness (PU) construct (Davis et
al., 1989). According to Venkatesh et al. (2003), PE is one of the biggest predictors for intention
to adopt a new technology. The last construct that was included in this study was the effort
expectancy (EE) factor.
Social influence. Social influence (SI) reflects the degree to which others influence an
individual’s beliefs to use a new technology (Venkatesh et al., 2003). There are other factors
influencing SI along with PE, EE, and FC. They include gender, age, and experience. SI is not

19
the only influencing factor. There external factors to consider as well. Another construct in this
case was facilitating conditions (FC).
Technology adoption. Several methodologies contributed towards adoption of new
technology, including the theory of planned behavior (TPB), the theory of task technology fit
TTF, and the theory of reasoned action (TRA). Davis et al. (2003) popularized the behavioral
intent to adopt a new technology through the use of the technology acceptance model (TAM).
The unified theory of acceptance and the use of technology (UTAUT) model soon followed
providing a more cohesive approach to technology acceptance, as it meshed the best of eight
other models into one (Venkatesh et al., 2003). The UTAUT model includes the following
constructs: social influence (SI), performance expectancy (PE), effort expectancy (EE), and
facilitating conditions (FC).
U.S. government employees. U.S. government employees include all levels of
government, including local, city, state, and federal. Additionally, only those public employees
age 21 or greater were considered for participation in this study. From this group, only those
employees who used or planned to use agile methods for software development were used in this
study.
Assumptions, Limitations, Delimitations
There were a number of assumptions, limitations, and delimitations that were made with
respect to this study. Assumptions are facts that are considered to be true, however, they were
not proven during the study. As such, they carry a potential risk. Mitigation options were
discussed for each assumption. Limitations represent potential weaknesses in the study.
Delimitations refer to the scope of the study. In addition to discussing what was included in the
study, the discussion also included what was not in scope.

20
Assumptions. Assumptions are actualities that are considered to be true. The following
assumptions were discussed: objectivity of participants, validity of the model, familiarity with
agile methods, and appropriateness of instrument. Each assumption was described and reasons
for its approval were provided.
Objectivity of participants. It was assumed that the respondents were chosen randomly
from a sample set. There was also an assumption that the responses were ingenuous. By
specifying that there was no right answer, the hope was to obtain non-biased responses to
questions that were asked. Additionally, participants remained anonymous so their responses
were not influenced by the opinions, beliefs, attitudes, or personal experiences of other
participants. It was also assumed that the recipients responded to the survey instrument in a
timely manner. There was a risk that some of those participating in the survey were possibly
working in the same organization and through circumstance knew each other and shared
knowledge of the survey presented. Efforts were made to seek individual participants in varying
organizations.
Validity of the model. The UTAUT was the chosen model of use. It was assumed that
the UTAUT was appropriate for use in assessing agile software development. Furthermore, it
was assumed that the model could be extended to include leadership style. There was a risk that
the UTAUT model was not the most appropriate to use. After all, the TAM has been used
extensively as a model to study adoption of technology. The TAM makes use of two variables.
The UTAUT model, however, combines approximately 32 variables from eight other theories,
including TAM (Venkatesh et al., 2003). So while it was not feasible to know which model was
the best fit for this study, the decision to choose the UTAUT model made the most sense given
its wide use and variety of constructs beyond those of other models, including the TAM.

21
Familiarity with agile methods. Another assumption was that the participants were
familiar at minimum with the definition of agile software development methods. Additionally,
some had experience in their use. During the survey, an explanation of what constituted agile
methods was provided along with examples of several of the most prevalent methods in practice
today.
Appropriateness of instrument. This study used a survey measured on a Likert scale.
The survey employed a 5-point scale. According to Dyba (2000), 5-point scales have a higher
reliability than 3 or 7-point scales. While no instruments were perfect, a pilot study was used to
validate the instrument. Using the results from the pilot-study, changes were incorporated back
into the instrument. To further validate the instrument, a Cronbach’s Alpha analysis was
performed (Cronbach, 1951). This confirmation served as mitigation concerning the
appropriateness and validity of the survey instrument.
Limitations. Limitations are limits or constraints that are factor into the research being
conducted. The following limitations were discussed: researcher inexperience and participant
scope constraint. Each limitation was described and provided its own qualification within the
study.
Researcher inexperience. One of the limitations in this study was inexperience. Proper
design, research principles, statistical calculations, result interpretation, and analysis were
performed in order to minimize misrepresentation and misinterpretation of the outcome of the
study. Furthermore, although inexperienced in performing quantitative studies was a valid
concern, it was offset by the supporting committee, including the chair and other experts in their
field, along with the dissertation team who did have the necessary experience.

22
Participant scope constraint. The study was limited to the use of IT staff in the private
sector, as well as all levels of government. The research was conducted through a survey
instrument sent to audiences that were appropriately identified in this field. The sample was
calculated using quantitative testing to identify a suitable sample for the population. The
participants and the results gathered may not have been a true representation of the population
studied. Therefore, any generalizations made to the general public may be skewed.
Delimitations. The study focused on a specific demographic for its participants. The
group included software developers who had adopted, had previously used, or were currently
using agile methods. The age range was limited to those who were 21 years and above and U.S.
citizens. Individuals that were part of the demographic described, but were not software
developers were not included. This was one of the delimitations, as the objective was to survey
developers with varying degrees of agile experience, including those with no experience.
Additionally, while the study examined the effect of leadership style on the adoption of agile
methods, the study did not take into consideration age, gender, experience, or voluntariness of
use.
Significance of the Study
This study was important to the field of software development, specifically with regard to
software development using agile methods. What made it significant was the role leadership
style plays towards adopting an agile framework. There remains a prominent lack of research in
agile software development in government organizations (Nuottila et al., 2016). This is due to
the fact that a majority of these types of studies are geared toward the private sector (Rosacker &
Olson, 2008). Another factor was quite simply the nominal use of agile software development
with respect to private industry, therefore reducing the potential field of candidate organizations

23
available for study. Because of this imbalance of agile method use, an inherent gap exists. This
study will contribute towards closing this gap.
Reduction of gaps. This will study contribute to filling a gap that exists today in the
body of knowledge with regards to the impact that leadership style has on the adoption of agile
software development methods. The research provided insight to the kinds of factors that public
organizations can take into consideration when adopting agile methods. Research at all levels of
government in this area is currently lacking (Nuottila et al., 2016). The study was able to
identify some of the underlying reasons why a portion of both public and private agencies have
adopted alternative project management methodologies, over the classic waterfall methodology,
while others have not or are hesitant to make the switch. Sidky (2007) went as far as to develop
a framework to determine the readiness of an organization for agile. If the study can discover
some of these reasons for not adopting agile, then the knowledge gained can better equip or
prepare those organizations who are considering making such a sweeping organizational change,
more manageable. The results of the study will also help to add to and fill in some of the gaps in
the literature regarding organizations that attempted to or were able to successfully switch to an
agile methodology framework. The more that can be learned from this study the better the
understanding in terms of the influence that leadership style and other factors play in agile
adoption. If knowledge is power and all knowledge comes from God, then it make sense to lean
towards the source of that knowledge.
Implications for biblical integration. Proverbs 18:15 (ESV) tells us that “An intelligent
heart acquires knowledge, and the ear of the wise seeks knowledge.” What this implies, in the
context of organizations, is that if these agencies are trying in earnest to better themselves, then
they should also be diligently seeking and looking for new ideas and ways to make

24
improvements. Accepting low to marginal software development success, when other more
viable solutions exist, is not trying at all but rather settling for less. Making a change from a
traditional software development methodology such as waterfall to an agile framework requires
not only faith, but also courage. Once again, the Bible provides the answer for such challenging
times. Deuteronomy 31:6 (ESV) says, “Be strong and courageous. Do not fear or be in dread of
them, for it is the LORD your God who goes with you. He will not leave you or forsake you.”
Across the board, organizational changes such as those suggested take prayer, seeking God’s
wisdom, and more importantly having faith.
Relationship to field of study. This study is in line with the Information Systems field,
as it is specifically concerned with the development of Information Systems projects. As was
previously mentioned, only about 28% of all projects were completed on time and on budget in
2000 (The Standish Group International, Inc., 2001). Meanwhile, as high as 66% of project
practitioners observed that agile methodologies had a positive effect on the quality of software
delivered (Kong, 2007). The agile methodology in this instance refers to being light or nimble
and taking on a number of software development methods, including Extreme Programming
(XP), Scrum, Crystal Family, and Dynamic Systems Development (DSDM; Kong, 2007). These
methods as well as their classical forerunner methods such as the waterfall and spiral
methodologies, fall under the Information Systems “umbrella” and therefore are appropriate
areas of study within the IS field.
Summary of the significance of the study. Overall, this study focused on the adoption
of technology, specifically agile development, making it very appropriate for the IS field of
study. This research is significant because there is a gap in the literature in terms of factors,
including leadership style contributing or affecting the adoption of agile software development in

25
the public sector. Hartman and Ashrafi (2002) said that cultural and managerial changes were
required for agile methodologies to take root and become effective. While a critical gap exists in
the body of knowledge, research is practically non-existent with respect to leadership style and
the adoption of agile. Even less information exists when the population of interest within this
group is further narrowed to U.S. government entities, regardless of level.
Making a change to agile from ingrained traditional methodologies can not only be
challenging, but also very stressful for any organization, much more so for government agencies
who tend to be more conservative than their counterparts and slow to adopt to changes (Nuottila
et al., 2016). Organizations that ascribe to a Biblical worldview need not fear drastic changes
though intimidating as they seem. Psalm 34:4 tells us that “I sought the Lord, and He answered
me and delivered me from all my fears.” This is the right spirit to have through times of turmoil
such as organization-wide changes that agile adoption can require.
A Review of the Professional and Academic Literature
This section provides a review of the related research and literature with respect to factors
that affect the decision to adopt conventional methods such as Waterfall and Spiral as well as
agile methods such as Extreme programming, Crystal, Scrum, and Dynamic systems for software
development in both public and private industry. This review provides an overview of both of
these categories in order to gain an understanding of their advantages and limitations.
Additionally, user acceptance theories such as TRA, TPB, TAM, IDT, and UTAUT were also
examined. Finally, in order to better understand the role leadership style has in adoption of agile
methods, an independent variable representing a variety of leadership styles was also examined.
These included: transformational, transactional, servant, autocratic, laissez-faire, democratic,
bureaucratic, charismatic, and situational leadership.

26
Traditional software development methods. There are several traditional software
development life cycles (SDLC) being used across industry. Two of the most prevalent models
include the Waterfall and the Spiral methodology. Each is unique in its own right. The
Waterfall methodology steps through a number of processes and concludes with a final product
at the end (Nelson, 2016). The Spiral methodology on the other hand allows for introspection of
the project in-flight and such provides an avenue for review, change if necessary, with the goal
of searching for constant improvement (Alshamrani & Bahattab, 2015). Both methods are
described in further detail below.
Waterfall. Most organizations follow one or two models of software development for
their IT projects, agile and/or Waterfall. Waterfall is the traditional methodology with its basis
in construction and manufacturing. Royce (1987) formally introduced this methodology without
formally addressing the term waterfall as a means to describe this process. In fact, Royce’s
(1987) vision was of a multi-stage process that allowed for revisiting previous steps as necessary.
Royce’s (1987) process is not how the current waterfall model is defined. The waterfall method
was adopted into software development projects with the promises of continued success that it
received in the industries that created it. Such success has been elusive at best, as discussed in
the previous section. The Waterfall method has distinct linear phases where a project only
moves to the next phase when the current or previous stage is completed. The waterfall model
includes the following phases (Alshamrani & Bahattab, 2015).
Requirements and analysis phase. During the requirements and analysis phase the user
requirements, including the functionality for the system under consideration, are documented.
Details of the system to be are often obtained through interviews, surveys, and observations.
Obtaining clear and concise requirements is critical as they represent a contract or agreement

27
between the client and the developers for the software specifications and application features to
that will be developed.
System design phase. The information obtained during the requirements phase is
evaluated and a formal process is devised that includes all of the software components that are
needed to be built in order to satisfy those requirements obtained in the previous phase. During
this phase, critical decisions are made concerning software solutions, design methods,
architecture, database design, and other areas. If it is noticed that some requirements were
missed, the requirements and analysis phase is revisited and any concerns are resolved before
moving forward to the next phase.
Coding and implementation phase. During the coding and implementation phase the
requirements from the previous phase are implemented. At this stage, if the previous phases
were executed correctly, then this phase of the project will be completed with minimal issues.
During this phase all software is unit tested. Unit testing involves testing each individual
component of the larger solution.
Integration and testing phase. During integration and testing a number of tests are
conducted to verify that the software works correctly, but more importantly, meets the
contractual, or more succinctly, user requirements. Integration testing helps to ensure that all
software components work in accord. User acceptance testing (UAT) allows the client to test the
new system with their own data prior to migrating the solution to production. Finally, it is
during this phase that many bugs are resolved and refinements are made to the solution.
Deployment of system phase. During the deployment of the system phase, the solution is
released to the customer for consumption. There are a variety of methods for placing software in
production that must be considered during this phase.

28
Maintenance phase. Often, when software is first released errors are discovered or
modifications are identified. Therefore, this phase, which could be another project often is
another project - its own, is used to fix bugs, provide enhancements, and correct any errors that
were discovered after the software was released.
In practice, there is overlap and phases are revisited for many reasons such as change of
scope and delays, which supports Winston’s process description (1970). Changes in scope, time,
or cost can ultimately determine whether a project is a success, partial failure, or complete
failure. Scope can change for a number of reasons, typically by way of additional requirement
requests from the business unit in the middle of a project. Oftentimes mitigation includes either
including these additions if there are adequate fund and time buffers built into the project, or by
setting these requests aside for a future project phase. Sometimes changes in scope cannot be
overcome (e.g., when management mandates additional requirements where the project resources
are incapable of compensating for the given directed requests).
The waterfall methodology remains relevant even today because managers feel a sense of
comfort in knowing the steps or phases that are part of the Waterfall or software development
life cycle (SDLC) and where the project is in terms of understanding and estimating project
progress. When requirements are clearly defined, and are not likely to change (such as in a
repeated process), then the Waterfall method works well. When there is likelihood that
requirements will change, the Waterfall method becomes a liability as scope changes (Sweeney,
2014). Agile methodologies on the other hand are very different. Figure 2 below provides a
diagram of the Waterfall model.

29
Figure 2. The Waterfall Model.
The spiral model. The spiral model has been considered to be an enhancement over the
waterfall model. Boehm (1988) viewed it as an evolution of sorts based on refinements that
were gained through experience with the use of the waterfall model. The spiral process
combines both design and prototyping in iterative stages, thereby taking advantage of both top-
down and bottom-up design (Alshamrani & Bahattab, 2015). Satalkar (2011) said that the major
distinguishing feature between the waterfall and the spiral model is the latter is risk-driven,
whereas the former is primarily document or even code-driven. The spiral model begins with an
achievable set of requirements and then proceeds through each of the development phases
(except for installation and maintenance). During each subsequent iteration, the development
team is able to use lessons learned (in the risk analysis phase) to improve on the next set of
requirements that will be developed in the next spiral or iteration (Alshamrani & Bahattab,

30
2015). These steps are repeated until the project reaches a conclusion. The spiral model
includes the following phases (Satalkar, 2011):
Planning phase. The planning phase involves the gathering of requirements from the
customer or business unit. Systems analysts work closely with the customers to ensure all
requirements are understood and captured.
Risk analysis phase. One of the outcomes of the risk analysis phase is the identification
of all risks involved with the given set of requirements as well as alternate solutions. Risk is
estimated using the experience gained during previous iterations of the process. Another
outcome in this phase is the delivery of a prototype.
Engineering phase. The engineering phase is also known as the development phase and
it is where the software is created. It is also the stage where software is tested.
Evolution phase. The evolution phase is the official end of that round. This stage allows
the customer to review the work completed so far and provide feedback that will provide
direction for the next round. Figure 3 below provides a graphic of the Spiral model.
Figure 3. The Spiral Model.

31
Comparison between waterfall and spiral. There are many factors that come into play
when comparing the waterfall and spiral models. Some of these factors include differences in
the level of risk, time to completion, budget, and completeness of project requirements. Other
considerations when selecting between the two models include the size of the project and
flexibility for change in the middle of the project (Alshamrani & Bahattab, 2015). Nevertheless,
there are several advantages and disadvantages with either model. The next four subsections
provide some insight.
Waterfall advantages. There are several noteworthy advantages to the waterfall model.
The first is that because of its highly rigid and structural approach, it makes it easier than other
models to specify the work and completion time frame for that work. Additionally, phases do
not overlap and must be completed before moving to a new phase (Pedersen, 2013). Managers
like using it because it follows a linear approach. Developers also find it easier to use as it is not
only well known but also lends itself to a variety of different types of software development
projects. Finally, the waterfall model produces lots of documentation in each phase which can
be helpful for new team members (Pedersen, 2013). These are some of the reasons why the
waterfall methodology has remained and continues to remain a viable option for many
organizations. Discussion of the additional advantages goes beyond the scope of this literature
review, but one should note that no process model is perfect and the waterfall is not without
faults.
Waterfall disadvantages. While there are many advantages to the use of the waterfall
model, several disadvantages must be stated. One of the main disadvantages is the
understanding that all requirements are well known and complete (Hamidi, 2014). A corollary to
this is that requirements will not change. In reality, unless the project is a repeating process,

32
almost all projects will change in some ways and at some point during their process life cycle. A
second disadvantage is that implementation and software integration can be completed on a
predictable schedule (Hamidi, 2014). Again, the fallacy here is not understanding how quickly
technology changes. Another disadvantage that cannot be overlooked is that the customer is not
involved during the development process. Disengagement can lead to instances where the
software does not meet the requirements or specifications of the customer (Pedersen, 2013).
While transparency with the customer is not a strong suite for the waterfall model, it is an
underlying advantage of the spiral process model.
Spiral advantages. Boehm (1988) pointed out that the main advantage to using the spiral
methodology was that its range of options accommodated the best features found in other
software development models. Additionally, due to its risk-driven components, projects that use
this model avoid many of the difficulties and challenges that would otherwise affect projects that
did not use this approach. Additional advantages with this model include the ability to focus
early on in the reuse of software (when and where possible). Allowing for the evolution of
requirements and change to take place provides a way to include quality objectives in the
development process, while focusing on eliminating errors early on (Boehm, 1988). The spiral
model is not without its own set of challenges.
Spiral disadvantages. According to Boehm (1988), there are three main areas that
remain a challenge when using the spiral model: (a) being able to use it for use with contract
driven software approaches, (b) heavy reliance on risk-assessment expertise, and (c) the need to
further elaborate on the spiral model steps. According to Pedersen (2013), the heavy reliance on
assessing risk, mitigation, and specialist in the areas of planning all contribute to additional
expenses in time and costs. Finally, Pedersen (2013) believed that the spiral model is

33
appropriate for use as a full life cycle model. The reason for this as Pedersen (2013) explained is
that explicit process advisement is missing in terms of how goals, obstacles, and alternatives are
established.
Agile methods. Agile methods differ from waterfall methods in several ways. Agile
methods are flexible. A project is broken into a set of miniature projects with each mini-project
completing every two or four week intervals until the entire project is completed (Sweeney,
2014). Waterfall efforts on the other-hand begin on the first of several phases and can only
continue to the next phase when that phase is completed. In waterfall projects, integration and
user acceptance testing happen near the end of the project, whereas with agile methods, testing
occurs throughout each iteration (Sweeney, 2014). Testing software frequently in agile,
compared to testing near the end with the waterfall method, promotes early error detection,
response, and resolution. Another defining difference between the two methodologies is that
agile methods require project teams to be co-located either geographically or through
technology. Co-location greatly improves communication and accountability (Denning, 2013).
Agile methodologies are becoming the go-to methods for managing developmental projects.
Its popularity stems from its quick turnaround time from requirements to completion. There is
an optimization of development time that comes with agile methods that allow them to
accommodate changes seemingly at will while providing a higher degree of project visibility and
customer satisfaction at the same time. The most distinguishing feature of these methodologies
are the “sprints” (discussed earlier), which can be thought of as miniature projects that run from
two or four week intervals producing an application or a component of an application at the end
(Sweeney, 2014). Breaking a larger effort into pieces allows for changes to become incorporated
into the project cycle and improve response time to any obstacles that are discovered along the

34
way (Sweeney, 2014). The daily face to face time with the customer provides an unparalleled
sense of transparency and customer service not seen in classical software development
methodologies.
There are 12 principles of Agile according to the Agile Alliance (Hamidi, 2014). They
are as follows:
1. Our highest priority is to satisfy the customer through early and continuous delivery
of valuable software.
2. Welcome changing requirements, even late in development. Agile processes harness
change for the customer's competitive advantage.
3. Deliver working software frequently, from a couple of weeks to a couple of months,
with a preference to the shorter timescale.
4. Business people and developers must work together daily throughout the project.
5. Build projects around motivated individuals. Give them the environment and support
they need, and trust them to get the job done.
6. The most efficient and effective method of conveying information to and within a
development team is face-to-face conversation.
7. Working software is the primary measure of progress.
8. Agile processes promote sustainable development. The sponsors, developers, and
users should be able to maintain a constant pace indefinitely.
9. Continuous attention to technical excellence and good design enhances agility.
10. Simplicity--the art of maximizing the amount of work not done--is essential.
11. The best architectures, requirements, and designs emerge from self-organizing teams.

35
12. At regular intervals, the team reflects on how to become more effective, then tunes
and adjusts its behavior accordingly.
Notable research on agile and traditional methods. Pedersen (2013) examined which
methodologies should be used to improve project success. The goal of this research was to find
correlations between the uses of agile or waterfall methodologies and critical success factors
(CSFs) to IT project success. Pedersen (2013) showed using variance that there were in fact
significant differences between the use of effective communication, user involvement, and use of
a quality plan between the methods. Pedersen (2013) demonstrated that project success is
positively correlated to effective communication, user involvement, and the use of a quality plan
in the agile methodology. Specifically, Pederson (2013) found a correlation with organizational
reward for agile behavior (r[51] = .35, p = .01) and also a correlation with committed sponsor or
organizational management (r[51] = .44, p < .0001).
Pedersen (2013) again used Pearson’s correlation test and showed that project success
was significantly and positively correlated only with effective communication and use of a
quality plan in the waterfall methodology. With respect to effective communication, Pearson
(2013) noted the significance for organizations that have an oral culture and place a high value
on face-to-face communication (r[53] = .40, p < .0001). Pearson (2013) was also able to
demonstrate that project success, from a quality perspective, was tied to projects that followed a
simple design with complexity being minimized (r[53] = .47, p < .0001). Not surprisingly,
communication and a quality plan is closely tied to project success regardless of methodology
chosen.
Value of Scrum. Cornelius’s (2014) research included utilizing a qualitative multi-case
approach, focused on achieving a greater understanding of the value that Scrum plays in

36
organizations. To accomplish this goal, Cornelius (2014) examined 32 study participants. The
participants spanned 17 industries where Scrum and Scaled Agile methodologies were practiced.
Guiding questions were used to examine the perceived value of Scrum to each of the
organizations and the change management process that was used to implement Scrum within
each organization (Cornelius, 2014). The findings showed that engaging in Scrum improves
team empowerment and collaboration (Cornelius, 2014). Specifically, the majority of
respondents in Cornelius’s (2014) study believed that Scrum allows for a higher level of team
empowerment and collaboration, while at the same time supports efficiency and waste
elimination.
People and processes role in success. Litchmore’s (2016) study extends research
conducted by Chow and Co, who identified key success factors using agile methodologies.
Litchmore’s (2016) research focused on evaluating the effects of two elements, people and
process on the perceived success of software development when using Agile. The study utilized
16 hypotheses and 174 randomly selected SurveyGizmo participants. The Spearman Rank
Correlation and the Kruskal-Wallis H tests were used during the analysis phase. The analysis
conducted showed that the people and process success factors including: project management,
project definition, team capability, and customer involvement positively contributed to scope,
cost, timeliness, and quality. Litchmore (2016) was able to demonstrate that project management
was statistically significant to agile project success (rs = .642, p < .0001) as well as customer
involvement (rs = .548, p < .0001). Meanwhile, the Kruskal-Wallis H tests resulted in values all
greater than 0.05, which means that no agile methods made a significant difference to the success
of agile projects (Litchmore, 2016). Their study demonstrated an improvement in the success
rates for agile software development (Litchmore, 2016). Comparing the success of agile

37
methods versus the Waterfall approach puts the success and failure for each in a clearer
perspective.
Success rates compared. According to Ambysoft’s 2003 Project Success Rates Survey,
projects that used agile methods were successful 64% of the time, while projects that used the
Waterfall approach were successful 49% of the time (Ambler, 2013). Furthermore, only eight
percent of the Agile run projects failed compared to 18% of the Waterfall projects. Additionally,
agile methods run development projects enjoyed a higher level of quality, provided a higher
order of stakeholder value, ROI, and met time and schedule. These results were supported by the
Standish Group. According to the Standish Group’s survey (2015), development project using
Agile methodologies were successful 42% of the time, while failing nine percent of the time.
Their results showed that projects employing the traditional Waterfall method on the other-hand
were successful on 14% of the time, while failing 29% of the time. Additionally, 57% of
Waterfall projects were termed as “Challenged” meaning that while they were completed, they
went over budget, time, or both.
Project Management Concerns. When considering any arguments for or against the use
of agile methodologies, they should be made with respect to the speed of project completion, the
ability to adapt to changes in requirements mid-stream (changes in scope), and the quality of the
final product(s). These are concerns of any project manager. There has been much research
centered about what agile software development means and some details about specific agile
methodologies. There does not appear to be specific empirical research available that would
address the opinions of project managers that utilize these non-traditional software approaches
(Bird, 2010). Because there was no guarantee that these three benefits (i.e., completion time,
scope change, and product quality) were always achieved, Bird (2010) decided to investigate this

38
phenomena. Bird (2010) used a mixed methods approach focusing on the opinions, thoughts,
and lived experiences of project managers that have used at least one of the agile methodologies.
The goal of the research was to determine the effectiveness and efficacy of using agile methods
to ensure rapid deployment in a constantly changing business environment (Bird, 2010). In order
to gain an understanding and appreciation of this newest movement in application development,
the researcher used a sample of Information Technology professionals within the Project
Management Institute (PMI) to complete a survey that included a combination of structured and
open-ended questions. Bird (2010) also included closed-ended questions in order to maintain
some statistical control over research data.
Bird’s (2010) participants attained a consensus that the use of agile development
methodologies is not only a viable option to use for project development, but an effective and
efficient means to deploy applications, while allowing projects the flexibility to adapt to
changing business needs. Additionally, Bird’s (2010) results suggest that the project managers
arrived at a consensus that agile development provides for the timely delivery of application
solutions while at the same time maintaining a high level of quality and therefore approval by the
business unit. Other key advantages discovered included a clearer definition of business goals,
improved team communication, improved team cohesion, and team effectiveness. Finally, all
project managers reported the overall reduction of project time.
Bird (2010) also pointed out some problem areas in one case where the level of quality
was not acceptable and in another instance where poor system performance after implementation
became an issue. Some of the disadvantages that Bird (2010) noted included the high-level of
demand on customer involvement, the need for experienced cohesive teams, the organization not
being in alignment with the agile approach, and the lack of understanding of the agile

39
methodology by the business user community. There are numerous agile methods that are in
practice today. Some of the more prevalent agile methods in use today include extreme
programming, crystal methods, scrum, and dynamic systems development. A closer examination
of each of these methods follows.
Prevalent types of agile methods. As both the business world and technology has
become more unsettled with continuous unpredictable changes, the need to respond to those
fluctuations in an expedient manner has propagated the need for agile methods. Agile methods is
the response to those market changes (Cockburn & Highsmith, 2001). While there are variations
among each method utilized today, there are several commonalities that are worthy of pointing
out. One is the minimizing of time required to share information between people, specifically
the customer and the developers. In order to make this happen, team members (e.g., both
customer and developers) are either co-located or accessible. Documentation is often replaced
through oral discussion and the use of a whiteboard. Lastly, team and cooperation is valued
fostering accountability and a willingness for each team member to contribute to the whole
(Cockburn & Highsmith, 2001). A second commonality is reducing the time between making a
decision and seeing the results of that decision. This is achieved as mentioned earlier by making
users/customer part of the team as well as providing incremental deliverables (Cockburn &
Highsmith, 2001). Next, several sections will discuss four of the more prevalent agile methods
used today: extreme programming (XP), crystal methods, scrum, and dynamic systems
development.
Extreme programming (XP). Extreme programming (XP) is a popular agile methodology
that allows for quick software unit releases while allowing for continual review and feedback
from the customer throughout the duration of the each story (stories are subunits of the final

40
project or deliverable). Some characteristics include individuals working in teams of two,
collaboration and transparency, as well as an adherence to a formal set of defined practices
(Beck, 1999). Below is a list of those practices with a description: planning game – customers
decide which tasks to undertake based on estimates from programmers. Programmers then
implement only those “stories” during that iteration.
1. Small, frequent releases – Since a system can be completed in a small time frame, in
as early as a month in some cases, releases can occur weekly or even daily.
2. Metaphors – used to describe the system and are utilized between the customer and
the programmers.
3. Simple design – The goal is to avoid any ambiguity in the design as well as to make
the best and efficient use of code. Simple design can thus result in a reduction of the
code to the bare minimum number of classes, methods, and other ways.
4. Tests – programmers unit test each software component that they create. Users create
functional tests to test the deliverable software during each iteration. If any test fails
at the end of a given iteration, a decision must be made that includes opportunity
costs for releasing software that includes one or more defects.
5. Refactoring – allows developers to continuously evaluate and make improvements on
existing code for the purpose of introducing efficiency, while allowing for easier
maintenance of the software in the future. Refactoring may include removing
obsolete code, re-writing code, or modifying existing code.
6. Pair programming - where all code is created by pairs of programmers working at one
computer. Pairs rotate frequently between writing and observing code being
developed which serves to improve product quality and lower delivery time.

41
7. Continuous integration – all new code must be integrated into the new system within
a few hours of initial release. All tests must pass or the changes are rolled back.
8. Collective ownership – team members take full ownership of the product and remain
vigilant so that whenever either see an opportunity for improvement, they make it.
9. On-site customer – the customer is part of the team and sits with the team fulltime.
Thus, allowing for immediate problem or question resolution from the development
team, immediate feedback from the customer, as well as transparency into the
process.
10. Forty (40) hour weeks – the developers’ quality of life is well respected and
supported as overtime has often been proven to be a symptom of larger issues.
11. Open workspace – teams are co-located working in a room surrounded by computers
with the paired group at the center.
12. Just rules – teams agree to follow the same rules. The rules can be changed, but the
team members must assess the repercussions before agreeing on the change(s).
Crystal methods. The word crystal and its methods were first coined by Cockburn
(2005). Crystal focuses on communication, specifically osmotic communication where
“questions and answers flow naturally and with surprisingly little disturbance among the team”
(Meyer, 2014). Crystal, unlike XP and Scrum, does not have a set of dogmatic methods and
rules, instead relying on wisdom obtained through developing software as well as classic
software engineering principles. Nevertheless, there are seven values that differentiate Crystal
methods (Meyer, 2014). They are as follows:
1. Frequent delivery – deals with developing and running the programs as they are
created in order to obtain expedient user input and acceptance (Cockburn, 2005).

42
2. Reflective improvement – the development team spends some time once a month or
twice per delivery cycle to hold a retrospective. During these sessions, the team
reflects on their performance and where improvements can be made.
3. Osmotic communication – promotes open channels of communication and
information between team members.
4. Personal safety – supports personal opinions and input in an environment free of
confrontation and negative consequences.
5. Focus – defines the conditions that allow developers to perform at their best.
Characteristics include focusing on only on task at a time, or if side tasks are involved
then they must be related to the overall objectives.
6. Easy access to expert users – while mimicking the use of a subject matter expert
(SME) as used in Scrum and XP, Crystal does not require co-location of this expert
with the team. What is mandated however is that time be allocated on a consistent
basis with the expert user(s) consistently.
7. Technical environment with proper infrastructure – programmers should have all of
the modern tools available at their disposal including automated tests, and
configuration management in order to promote the highest possibility for success.
Scrum. Scrum has grown to become the dominant agile methodology for developing
software of preference. Schwaber and Sutherland are credited with creating the Scrum method
(Kautz, Johansen, & Uldahl, 2016). Scrum is likened more closely to an organizational
methodology while from a technical perspective it shares many of the characteristics found in XP
methodology (Meyer, 2014). Yet there are distinctive practices that set it apart from those of XP
and other agile methods. They include:

43
1. Sprint planning occurs at the very beginning and a backlog is created or updated if
one exists from a previous Sprint.
2. Closed-window rule, allows for changes in requirements but under certain
circumstances and periods during the Sprint.
3. User stories are used to define the tasks for the work to be carried out.
4. Daily Scrum stand up meetings help to track progress and identify risks and issues
that have materialized.
5. Each team along with the customer help to define what “complete” means in
order to make sure what is claimed to be finished truly is.
6. Task boards are used to track progress for individual tasks that are assigned to
each team members. A burn down chart assess the costs on a daily basis as work
is being done.
7. Sprint reviews or retrospectives are conducted to assess the performance on the
previous sprint and prepare the next one.
Lean and Kanban. Both Lean and Kanban methodologies were created in the 1950s
originating in the Japanese manufacturing industry. The Kanban is used as a scheduling system
with its name translating to signboard. Kanban software development methods got their start in
2004 (Ahmad, Markkula, & Oivo, 2013). David Anderson first made use of it as a development
methodology out of need to help a struggling IT team at Microsoft. Kanban uses visualization
through the use of a workflow board allowing teams to readily follow their work in progress
(Ahmad et al., 2013). Jobs are moved along the board with the goal of minimizing the amount of
work in progress. Only those items that are requested are developed. The result is a constant
flow of deliverables to the customer while allowing developers to work on a few items at a time.

44
Lean follows seven principles: eliminate waste, increase learning, hold of decision making as
much as possible, deliver software as quickly as possible, empower the team, and lastly build
integrity into everything you do. The Kanban, on the other hand, does not ascribe to any
particular set of principles.
User acceptance theories. Researchers have searched for years for answers to the
questions of how technology, be it tangible or otherwise, becomes adopted. In other words, what
are the deciding factors that influence and facilitate user acceptance? Early researchers focused
their attention in the areas of non-technical fields (Rogers, 1995). It was not until Fishbein and
Ajzen (1975) introduced the theory of reasoned action (TRA) that technology adaptation
research was first formalized. Since that time a slew of new theories have materialized. The
next section describes several of the most prevalent theories, including the theory of reasoned
action (TRA), the theory of planned behavior (TPB), the theory of technology acceptance model
(TAM), the innovation diffusion theory (IDT), and finally the unified theory of acceptance and
the use of technology (UTAUT).
Theory of Reasoned Action (TRA). The Theory of Reasoned Action was developed by
Fishbein (1967) and is explained through two different types of behaviors. The first is the
individuals own attitude towards performing a given behavior and the second is the perception of
that attitude as it is viewed by the individuals in their environment (Fishbein, 1967). Attitude
represents the feelings and motivations either positive or negative towards a given behavior. The
subjective norm is the perception and level of acceptance for a given behavior by people or
colleagues closest to the individual under consideration. The combination of these two factors
affect behavioral intent and eventually behavior. Figure 4 presented below graphically

45
represents this theory.
Figure 4. Theory of Reasoned Action.
(Fishbein & Ajzen, 1975).
Theory of Planned Behavior (TPB). The TRA was not a perfect model but a good start.
One area that was not accounted for was behavioral intent versus eventual behavior. For
instance, it is possible for an individual to intend to behave a certain way but their actual
behavior is different (Ajzen, 1991). This type of conduct may occur for a number of reasons,
including fear, confidence, and self-control. TPB has subsequently been applied to many
technology related adoption studies in the field of information technology. Examples include
Mishra (2014) in the adoption of M-commerce and Ekufu (2012) predicting cloud computing
adaptation. Figure 5 below provides a diagram of the TPB model.
Figure 5. Theory of Planned Behavior.
(Ajzen, 1985).

46
Technology Acceptance Model (TAM). In creating the TAM model, Davis et al. (1989)
extended previous acceptance models by including the perceived usefulness and perceived ease
of use variables. Perceived usefulness is a developer’s belief that using a given technology will
improve their job performance. Perceived ease of use is the perception that an individual using a
particular technology would find it free of effort (Davis et al., 1989). Davis et al. (1989)
additionally posited that a system or technology that is perceivably easy to use and useful, would
be more likely a system that would be more likely to be used. Schneberger, Amoroso, and
Durfee (2007) extended the TAM model in their research to define influencing factors
surrounding computer-based performance. Figure 6 shows a diagram representation for the
Technology Acceptance Model.
Figure 6. Technology Acceptance Model.
(Davis et al., 1989).
Innovation Diffusion Theory (IDT). IDT was introduced by Rogers (1962) as one the
more prominent of its kind. Diffusion in Roger’s definition is the dissemination of an innovation
over the course of time throughout a society. Innovation on the other hand is a technology,
process, or object that is perceived to be new (Rodgers, 1995). The IDT model is composed of
the following: (a) relative advantage, (b) compatibility, (c) complexity, (d) trialability, and (e)
observability. Relative advantage relates to the degree that the individual believes that the new

47
technology will provide advantages them. Compatibility relates to the degree that the technology
is in agreement with that individual’s lifestyle. Complexity relates to the degree of difficulty of
use of the new technology for that individual. Figure 7 shows a model for the Diffusion of
Innovation Theory.
Figure 7. Diffusion of Innovation Theory.
(Rogers 1995).
Unified Theory of Acceptance and use of Technology (UTAUT). The UTAUT model
came about as the integration of eight other models (Venkatesh et al., 2003). The model
provides the following independent variables:
1. Performance expectancy – represents the degree to which an individual using the
technology will attain improvements in job performance.
2. Effort expectancy – represents the degree of ease of the system.
3. Social influence – represents the degree to which that individual believes that they
should use and\or accept the system based on others’ perceptions for the use of that
system.

48
4. Facilitating conditions – captures the degree to which an individual believes that the
appropriate infrastructure is in place in order to be successful with this new
technology.
Figure 8 represents a drawing of the UTAUT model:
Figure 8. Unified Theory of Acceptance and Use of Technology.
(Venkatesh et al., 2003).
Higher rates of failure in the public sector. John Wooden, the great college basketball
coach, once said, “Failure is not fatal, but failure to change might be” (Biro, 1997). Failure can
be very costly in terms of exceeded project budgets, prolonged completion dates, and inefficient
use of resources. Of course, any one of the aforementioned events occurring can have a
potentially adverse effect on a myriad of associated organizational on-going and future activities.
Therefore, project failure without making efforts to improve is never acceptable. Yet for many
organizations there is a limited understanding of what factors contribute towards a project
success or failure (Aladwani, 2002). With shrinking budgets and limited resources, failed
development projects can no longer be overlooked, much less tolerated. If project success is

49
defined as a project completing on time, on budget, and within scope then organizations have a
long way to go for improvement.
Unfortunately, there is no shortage of failed projects. Failure as defined previously is not
limited to private or public and is not bound by geography or international boundaries. What
follow are some examples of project failures. Regrettably, this is only a sample of thousands of
similar outcomes. Wright and Capps (2011) conducted research based on a survey using IT
auditors and explored the possible causes of Information Systems (IS) failures. Their findings
were sobering. In 2002 for instance, the National Health Service in the UK initiated a project to
benefit the British Post Office, the Department of Social Services, and the computer company
ICL. That effort was abandoned three years later at a cost of 300 million pounds (The
Economist, 2002). The Firearms Program, a Canadian effort, increased from an initial estimate
of C$113 million to over C$1 billion, effectively overrunning the budget by 900% (Auditor,
2002). United States related IT projects wasted $150 billion per annum on failed projects in both
the private and public sector. The European Union wasted $140 billion during that same time
frame. There are groups that provide aggregate statistics measuring success rates that are useful
for this discussion.
One such group is the Standish Group. In 2004, the Standish Group reported a lowly
29% project success rate, with as much as 53% of the projects having major problems and
another 18% considered complete failures. In 2009, the Standish Group’s report revealed that
only 32% of all project succeeded, 44% were termed problematic, and 24% were designated as
failures (Standish Group, 2009). Of even greater concern were projects in the public sector.
According to the Royal Academy of Engineering and the British Computer Society, a staggering
84% of public sector project endeavors failed. The following statistics summarize these

50
findings: 20% to 30% of all IS projects are complete failures, while 30% to 60% are only partial
failures (Wright & Capps, 2011). In other words, failed, problematic, and runaway projects are
much more likely to occur in government than industry, but there is some hope.
The research results, supported by Wright and Capps (2011), indicate that radical
organizational changes are more effective in turning around “runaway” projects than slow
incremental changes. It is important to note at this point that a majority of these projects utilized
the traditional Waterfall approach. The agile methodology has quickly become the method of
choice for development projects for many reasons but especially for its lower rates of failure and
higher rates of success when compared to the Waterfall approach (Sweeney, 2014). Once again,
private industry is the leader in terms of embracing agile methods, whereas the public sector is
lagging.
Higher rates of success in the private sector. With growing concern over project
failure and the need to speed up delivery of new software or features and functionality, more and
more organizations have made the switch to agile methodologies. For some of these
organizations, Agile methods represents a silver bullet that will successful put an end to the now
documented high failure rates in in IT projects (Hansenne & Hibner, 2011). Some of the benefits
of making the switch to an agile methods shop include an improved ROI, a higher level of
customer engagement and satisfaction, increased flexibility for the customer, and transparency
between IT and the client. None of this comes easily. There are many challenges for an
organization looking to move from a traditional methods approach such as a Waterfall to an agile
methodology. Hansenne and Hibner (2011) conducted such a study where they examined the
literature and case studies and conducted interviews regarding organizational adaptation to agile
project management. They then analyzed their findings and came up with the following:
51
Adaptation to an environment less structurally organized and controlled is a difficult
challenge but it is possible with the right type of support, such as that of executive
management.
Traditional project managers are faced with the challenge to adapt from a command
and control style to a project facilitator
Agile adaptation works best when its principles are adopted wholesale companywide
versus in one or two business areas (Hansenne & Hibner, 2011).
Influencing factors for agile acceptance. There are many factors that play a role in
facilitating the use of agile methods within a given organization. Some of these include the
influence of management and culture, human resources, the customer, private industry, and
process. These were examined in further detail in the sections that follow.
Influence of management and culture on agile acceptance. There is cultural and
managerial component that cannot be ignored when adopting agile methods. Hartman and
Ashrafi (2002) indirectly support cultural and managerial changes and challenges required for
agile methodologies to take root and become effective. Hartman and Ashrafi surveyed 36
software owners/sponsors, contractors/suppliers, and consultants on 12 projects. The questions
and answers they received addressed critical success factors (CSF) that consistently emerged by
project phase and the duration of the project. Hartman and Ashrafi’s study provided a list of
commonly reported reasons for software development failure. Some of the more prevalent one’s
included: misunderstood requirements, overly optimistic schedules and budgets, poor
management of resources, unclear charter, and lack of communication. These seeming concerns
or reasons for failure automatically become non-issues with agile methodologies adaptation.
Hartman and Ashraft concluded that when agile methods are applied correctly (e.g., through a

52
sprint or a scrum for instance), clarity of requirements, active and continual engagement not to
mention transparency with the customer, is also required.
Human resource influence on agile acceptance. Conboy, Coyle, Wang, and
Pikkarainen’s (2011) study focused on the human resource component of organizations making
the switch to agile. Although agile methods have been employed by developers for some time,
they have more recently grown in popularity within private and public organizations (Conboy et
al., 2011). The usage of agile methods may not be optional, but they are often part of a
mandatory organizational and in some cases inter-organizational realignment. As such, there can
be quite a few resulting symptomatic personnel challenges. In their research, Conboy et al.
(2011) examined these challenges.
Managerial influence on agile acceptance. Denning (2013) addressed specifically those
veteran managers who insisted on sticking with the traditional hierarchical approach to managing
systems and are weary of making the changes necessary for continuous innovation. Denning’s
(2013) research discussed 10 prevalent myths about agile, while revealing how this methodology
works in practice. Making changes from an outside-in approach often requires reinventing
organizational roles, along with their practices, values, and communication. These changes
allow for organizations to shift their attention to changing customer needs. With respect to
Denning’s research, this study examined the acceptance of agile adoption based on a variety of
leadership styles. It will provide valuable information for organizations that are interested in
understanding the challenges involved with varying types of management in the adoption of
agile methods.
Customer influence. Misra’s (2007) research used a survey-based quantitative approach
to identify success factors from software development practitioners utilizing the agile
53
framework. The research was also done to identify the types of changes that are required when
moving from a traditional framework such as waterfall to an agile project management solution.
A framework was developed to accommodate the research being addressed. The results of the
study indicated that nine of the 14 hypothesized factors were statistically significant with respect
to success that was being measured. Specifically, there was a significant relationship between
success and customer centric issues (Misra’s, 2007). A side effect of the study provided a ranked
list of challenges, and accordingly, changes required to adopt agile software development
methods by those projects that adhere to a plan-driven management plan.
Influence of private industry. For many organizations, private industry sets the standard
for change. Mueller (2014) observed the performance of federal government information
technology (IT) projects because they often look for ways to improve their processes using
private industry as a barometer. Mueller’s (2014) research included a three-round Delphi study
that helped to identify the factors influencing the decisions to implement agile methodologies in
IT projects. After surveying federal and consultant IT experts, 21 factors materialized. The top
five factors in the list affecting the decision to utilize agile development methodologies included
culture, executive sponsorship/involvement, user engagement, agency leadership, and change
management (Mueller, 2014). The results of Mueller’s (2014) study also highlighted that top
five factors mentioned were in alignment with the top five factors identified by the Standish
Group, and of those reported by the Software Engineering Institute. Finally, Mueller (2014)
made the recommendation to integrate these finding into the fabric of enterprise governance
mechanisms and processes with the goal of making the most appropriate software development
solution as early as possible in the selection process.

54
Process-driven influence. Sometimes the existence of a process can make the difference
between success and failure. Sidky’s (2007) research goal was to examine the role of process.
Specifically, Sidky (2007) noted that the lack of a formal process can guide organizations in
adopting agile methods. To remedy this, Sidky (2007) created an Agile Adoption Framework.
The framework is composed of an agile measurement index, and a 4-stage process that when
combined guide and assist the adaptation of agile. The four stages help to determine readiness of
an organization for agile and what set of agile process should be introduced. Five levels were
identified to help to ascertain the potential of an organization for agile. The framework was
presented to a variety of members of the agile community with respectable success and feedback
for improvement.
Every year many organizations make the switch to an agile methodology with the hopes
of obtaining gains in efficiency, a quicker time to market, and reduced resource waste (Esfahani,
2012). The transition itself is far from trivial. In its early stages, it is important to verify the
adaptability of the new methodology to the current organization. If the two are incompatible
then there will be many problems down the road and ultimately lead to internal conflict.
According to Esfahani (2012), a variety of agile adaptation frameworks exist that provide a
variety of checklists. These checklists provide a means for an organization to test its readiness
for becoming agile or to identify shortcomings and therefore identify the changes necessary to
make the adaptation possible. Making this transition is a strategic decision that the organization
must decide and support. Organizations that adopt agile methods across all of their business
units versus an IT only adaptation tend to have a higher opportunity for success which can
becomes an optimum organizational advantage (Esfahani, 2012). Sometimes the process is
arduous, especially for a large distributed organization.

55
Korhonen (2013) studied the agile adaptation of such of an organization in Nokia
Siemens Networks along with the agile practice’s impact. Using a case study built around this
adaptation, Korhonen was able to show that the introduction of agile practices does deliver what
the research on such methodologies have proven over the years. The study also proved that it is
possible to evaluate the impact that agile transformation has on a large organization as well as
prove that the effects of the transformation are immediate and discernable (Korhonen. 2013).
The research also showed that the capability of the development team in terms of experience and
motivation are a big factor in the overall success of agile methodology implementation.
Specifically, development teams that were less experienced but had a positive attitude toward
agile practices, fared better than more experienced resources that were not as fond of the
organizational changes taking place. Defects tend to go down and productivity increases as the
customer must be co-located with the development team making changes. When this happens,
timely feedback is made possible, changes can be implemented sooner, and there is a noted
improvement in customer satisfaction.
Even though methodologies come and go, the role of the project sponsor or executive
remains the same. One needs to remain engaged with the project manager and client throughout
the life of the project. Kloppenborg, Tesch, and Manolis (2014) found that the sponsor who
ensures planning will positively influence meeting the project’s goal and agreements, the project
sponsor who works on stakeholder relations will improve future outcomes. Sponsors who
engage in and facilitate open communications, positively contribute towards customer success.
Lack of available research in the public domain. Despite the increase in research with
respect to agile software development (ASD) in the past few years, there continues to be a lack
of structured information concerning the adoption of these methodologies in the public sector

56
(Vacari & Prikladnicki, 2015). The researchers focused their study to report from a systematic
literature review that would provide information that added to the understanding of the
implications for adopting ASD within public organizations. The main results provided evidence
to support that ASD could be adopted in the public sector. The outcome was not particularly
surprising, as many public agencies have made the jump to ASD. Vacari and Prikladnicki’s
(2015) suggested that a good start ASD adoption with employees who are willing to change and
are strongly supported by upper management that are working on important pilot projects.
Secondarily, Vacari and Prikladnicki (2015) found that job satisfaction was improved for public
organizations, when adopting agile methodologies. There were also some barriers to ASD that
were discovered by Vacari and Prikladnicki that proved challenging to overcome. These hurdles
included overcoming the ingrained use of structure focused methods such as the waterfall or
SDLC, big bang deliveries, and finally the lack of experience in ASD (Vacari & Prikladnicki,
2015). It is important to mention that one of the limitations of this study was that the majority of
the research selected represented a significantly higher success rate than failure, which may have
limited or influenced the results.
Limitations of agile methods. Agile methodology is not appropriate for all
organizations nor all types of projects for that matter. Depending on the organization, agile
adaptation may cause radical change and a high level of stress. This is typically the case where
implementation is attempted, but the culture is not receptive to change, or worst yet, is
incompatible to change. In such a case, strong, active and engaging leadership is a requirement.
When not managed properly, agile techniques remain localized to small teams operating on their
own or in a worst-case scenario are applied partially whenever it makes sense during a traditional
project. When only some teams embrace the agile culture shift and others do not, it creates an

57
internal organizational rift. The rift is due to all members are not on the same page, but rather
function independently on their own accord and pace.
Although there has been a noted shift to agile methodologies, it should be noted that very
few development efforts follow the agile methodology as it is prescribed. Instead, organizations
knowingly or otherwise follow their own ways often mixing in a variety of techniques. Solinski
and Petersen (2016) conducted an exploratory study aimed at discovering the benefits and
limitations of agile methodology adaptation. To this point, many of the benefits of adopting
agile methods in the work place have been examined. Yet, limitations due exist with the use of
agile methods as with any approach. The main limitations, according to Solinski and Petersen’s
(2016) research, include professional skill-specific demands, scalability, and lack of suitability
for specific projects. Other limitations include decreases in motivation or a reluctance to provide
due dates in addition to reporting completed work on time, an increase in stress due to the
continuous deadlines that must be met, and an increase in the complexity of configuration
management as there is a higher increase to coordinate internal releases (Solinski & Petersen,
2016). There are many other limitations as well, such as limitations on team size and limits in
the ability to take on distributed development that affect the decision to use agile methods. Thus,
agile is not a silver bullet solution of all types of projects.
Not suitable for all projects. Despite the many success stories of using agile
methodologies, questions still persist that concern its suitability and the quality of the software
produced which have prevented it from being accepted widespread (Kong, 2007). Kong’s
empirically investigated: (a) how systems developers use agile methodologies and how a
developers use of the development approach is associated with their perception of software

58
quality, (b) why organizations use agile approaches to varying degrees, and (c) whether
organizational culture has an effect on this observation or explains this disparity (Kong, 2007).
Kong’s (2007) study used 57 survey responses from IT software professionals and
analyzed them using a Partial Least Squares (PLS). The results provided credence to the
hypothesis that the developers’ use of agile methodology was directly related to their personal
beliefs of agile to internal performance. After the initial survey, Kong (2007) conducted two
qualitative studies to assess the impact of organizational culture on the organizations adaptation
of agile methodologies. Kong used interviews, observations, and document analysis looking for
cultural assumptions, beliefs, and values in the adoption of agile methodologies in two
organizations. The results provided strong support that organizational culture affects the
organizational adoption of agile methodology. Specifically, an organization that emphasizes a
culture of regulations, and operational excellence is hinders agile adaptation, organizationally
speaking. Conversely, a culture that emphasizes agility and facilitates an extensive adaptation of
agile methodologies.
Does the choice of methodology matter? Organizations have continued to seek ways to
reverse this trend in order to maximize the use of capital invested in IT projects to achieve the
best return on their investments. According to Wright (2013), after more than a half a century of
research focused on project success rates and the expenditure of valuable resources, success rates
continue to remain far too low. Wright (2013) investigated how the choice of software
development methodology, centered on 10 measures of project success, influenced a project’s
success. Wright (2013) conducted a web-based survey and obtained data points from 94 U.S.
based software development Project Managers. Wright (2013) used a classification system
where the methodology examined and represented by the independent variable was either agile,

59
structured, or hybrid in nature. Wright (2013) then used the following 10 Critical Success
Factors (CSF) previously derived from a research study by Turner and Müller (2006):
Performance, in terms of the triple constraint of scope, budget, and schedule.
1. Meeting user requirements.
2. Project team’s satisfaction.
3. User defined, project specific success factor.
4. Achieving project purpose.
5. Reoccurring business with customer.
6. Client satisfaction.
7. End-user satisfaction.
8. Supplier satisfaction.
9. Stakeholder satisfaction.
Wright (2013) then used a combination of Spearman’s rank correlation coefficient and
post-hoc power analysis to ascertain the effects of choosing any one of the aforementioned
measurements of project success against an independent variable, software development
methodology. Study results showed that with regard to supplier information, agile projects had a
higher level of success at the .05 significance level. Interestingly, with respect to the other nine
CSF, the choice of software methodology did not appear to be a factor in project success rates.
The overall results suggest that project managers can make choices in which methodology to
employee on their projects, without concern for the impact on at least nine of the 10 CSFs that
were used in this study. There is a caveat to this study that a statistical significant relationship
was discovered at the .05 level between the chosen software methodology and years of
experience with that methodology and membership with the Project Management Institute (PMI;

60
Wright, 2013). This would indicate the probability of confounding variables. In conclusion,
Wright’s study (2013) failed to provide evidence in support of any given methodology
independently tied to a project success.
According to Pace (2019), much research has focused its attention on the CSFs,
mentioned above, in an effort to address the subject of failure. One of these factors is the use of
different development methodologies. There are no shortages in the variety of methodologies,
many of which tend to be permutations of one another. The challenge for the project manager is
to select the appropriate one for the task ahead. Although many studies have been conducted in
order to find if such a connection exists between a project management methodology and project
success, the results as a whole have been short of conclusive. In light of this reality, Pace (2019)
conducted a study that extended previous research while considering the relationships between
project management methodologies, reported project success, moderating variables of industry,
and project manager experience.
Pace’s (2019) sample consisted of project managers with five or more years of work
experience from North America. All participants had experience with multiple project
management methodologies. Participants were chosen through the use of a random sampling
obtained from a double opt-in access panel (Pace, 2019). The data obtained during the study
were analyzed using Pearson’s correlation coefficient in conjunction with linear regression with
the goal of ascertaining the influence of the moderating variables. Study results indicated that
there exists a weak correlation between project management methodology and reported project
success. Furthermore, the aforementioned correlation is not influenced by industry or by project
management experience (Pace, 2019). These results are of value to organizations looking to
deploy a specific methodology in the hopes of achieving consistent project success. The lack of

61
a strong correlation between project management methodology and project success should at
least ease that angst, but does not contribute towards a solution that Pace (2019) was searching to
achieve.
Leadership styles. Transformational change can have a profound effect on an
organization. In Kuntz and Gomes’ (2012) words it is a disruption in sense making. These
changes have a pronounced effect on the culture, structure, and processes within the
organization. There is a shift from what used to be a tacit norm to that of an implicit adjustment
to the new way of doing things that inherently is part of change (Kuntz & Gomes, 2012). These
changes require the right type of leadership to fill that specific need. Each organization’s culture
and need is different when changes do come about, therefore making it critical to have the proper
leadership in place. The next eight sections examined varying styles of leadership. They include
the following: transformational, transactional, servant, autocratic, laissez-faire, democratic,
charismatic, and situational.
Transformational leadership. Transformational leadership was introduced by Burns
(1978) and is centered on motivating, inspiring, and engaging individuals at the emotional level
(Van Kelle, Visser, Plaat, & Van Der Wijst, 2015). Part of this leadership style is an enduring
commitment to the employee. In an organization that employs transformational leadership to
direct the organization, both expectations and rewards are made explicitly known to those that
follow. Van Kelle et al. (2015) in their research conducted a regression analysis with respect to
identifying social success factors in agile software development. Their study showed that value
congruence, the degree of agility, and transformational leadership were the most significant
predictors of success. In a separate study, Aga, Noorderhaven, and Vallejo (2016) were able to

62
demonstrate the significance of team building as a mediating factor with transformational
leadership that ultimately improves project success.
Transactional leadership. Transformational leadership seeks to uplift the psyche and
morale of their followers. Transactional leaders on the other hand, tend to focus on their
followers self-interests (Spencer, Buhalis, & Moital, 2012). They engage those they lead with a
reward-driven approach. In order to understand more about the role that transactional and
transformational leadership plays in organizational innovation, Prasad and Junni (2016)
examined the CEOs who fit these leadership roles. Using multiple regression analysis, Prasad
and Junni’s findings indicated that although both leadership styles mentioned have a positive
effect on organizational innovation; transformational leadership was more appropriate in a
dynamic environment. This is in line with Burns (1978) who posited that transformational and
transactional leadership are exact opposites of each other. Bass (1985) soon realized that there
may be varying degrees of relationships between these two leadership styles. Nevertheless,
transaction leadership continues to appeal to those who demand a more conventional style of
management with clear objectives, rewards for success, and correction for failure.
Servant leadership. Servant leadership can be defined as leadership whose primary
focus is to serve yet at the same time empower their followers. In this style of leadership the
good of the whole, or in this case the organization, is place above the individual (Chu, 2011).
Jesus, arguably the single most significant figure that comes to mind when one considers servant
leadership, sets the ultimate example of what servant leadership looks like. In Matthew 20:28
(New International Version), Jesus states that “...the Son of Man did not come to be served, but
to serve, and to give His life as a ransom for the many.” Jesus refers to himself as the “Son of
Man” over 80 times in the Gospels (Thompson, 2015). Servant leadership is just as important in
63
the business world. Tseng (2017) conducted a study that included servant leadership through
examining how the IT adoption intention and knowledge sharing intention would be influenced
with respect to several leadership styles and organizational cultures. Tseng’s (2017) research
showed IT involvement had a direct positive influence on IT adoption, which also affected
knowledge sharing. Tseng was also able to show that organizational culture and leadership style
had an effect on knowledge sharing intent and IT adoption (2017). This study examined the
influence of leadership styles on IT adoption, specifically agile methods.
Autocratic leadership. Both transactional and transformational leaders, although
different in their approach to management, nevertheless utilize their authority as their primary
source of power (Bonner, 2010). In this regard they are functioning from an autocratic platform.
Autocratic leadership is what is seen in traditional types of organizations. It is characterized as
being more controlling in its execution than other styles of leadership. An interesting note is that
agile leadership as a whole tends to be more on the democratic side (Bonner, 2010). To test this
point, Basahel (2015) examined how scrum methodology, which tends to be more democratic, as
it emphasizes self-forming teams, could be used to manage academic institutions. The results
supported Basahel’s initial premise.
Laissez-faire leadership. Laissez-faire style of leadership is characterized by avoidance.
Management governs in a passive mode, while not responding to situations and problems when
they present themselves (Lawal, 2015). Furthermore, the leader often does not provide clear
goals to attain, refrains from making decisions, and avoids confrontation (Bass, 1985; Bass &
Avolio, 1990). In a related study, Miloloža (2018) investigated to what extent varying types of
leadership styles, including laissez-faire impact the areas of knowledge management and human
resource management. Miloloža’s (2018) findings suggested that small enterprises tend to

64
perform better under laissez-faire type of leadership as well as the democratic style. Meanwhile,
autocratic style had a negative impact on those same small enterprises (Miloloža, 2018). These
study results may indicate that micromanagement in small organizations is detrimental to their
performance. Finally, those enterprises that were in a growth-maturity phase, were more
successful in the areas of knowledge management under the direction of laissez-faire guidance.
Democratic leadership. Democratic leadership style places the focus on the people.
Leadership input is shared with the group. The democratic leader is part of the team. Some of
the noted qualities of such leaders include openness, helpfulness, and active participation
(Smolović Jones, Smolović Jones, Winchester, & Grint, 2016). Those they lead often see such
leaders as benevolent, encouraging, and trustworthy (Cutcher-Gershenfeld & McGregor, 2006).
Fiaz, Su, and Saqib (2017) studied the impact of democratic, laissez-faire, and autocratic
leadership impact employee motivation. Results of this study showed that autocratic relationship
had a negative effect on motivation, while democratic, and laissez-faire leadership had a positive
influence on motivating employees. Furthermore, while the results were consistent with
autocratic leadership they were not so in tune with democratic. Fiaz et al. (2017) posited that the
ingrained bureaucratic environment was at least partially a factor for this outcome. Fiaz et al.
(2017) concluded that there is a preference of style that is able to provide a high level of attention
for both the people and the work. The best choice of leadership style in this case would be
democratic.
Charismatic leadership. Weber (1947) considered charismatic leadership something that
followers bestowed on a leader rather than distinct intrinsic qualities. In other words it was the
followers who provided this attribution to the leader (Weber, 1947). Taking this a step further
Waldman and Yammarino (1999) believed that it was the relationship between a leader and their

65
followers that defined charisma. The relationship was based on trust, commitment, which was
reflected in the desire to follow the leader’s vision (Waldman & Yammarino, 1999). Trust and
commitment are significant when considering organizational change. In their research, Oreg and
Berson (2011) showed that a leaders’ disposition with regards to change was positively related to
followers’ intentions to resist the given change. This is where charismatic leaders can help
followers overcome these challenges that some of them may have in times of organizational
change (Oreg & Berson, 2011). Neufeld, Dong, and Higgins (2007) conducted a study that
examined the influence of charismatic leadership on IT use and acceptance. Utilizing the
UTAUT framework, they surveyed sever organizations that had engaged in large IT projects.
Their results showed that charisma was positively related to among other thing performance and
effort expectancy. This study examined the influence of eight separate leadership styles,
including charismatic leadership, on adoption of agile methods.
Situational leadership. According to Fiedler (1967) the effectiveness of the group or
followers for a situational leader proceed analogous to changes in the environment of the
organization at stake. A situational leader is influenced by the degree of uncertainty about a
given situation, the relationship between the leader and those who follow the leader (with regards
to the desire to adhere to that leader’s requests) as well as the leader’s legitimate authority to
distribute those directions (Lee-Kelley & Kin Leong, 2003). Situational leaders are the
chameleons of the managerial realm, able to switch into other types of leadership roles as the
situation demands it. They can go in one instance from a transformational leader providing
performance-based incentives to their followers to an autocratic leader by-passing collective
input and making a pivotal, instinctual decision (Lazzari, 2018). The situational leader as one

66
might imagine is therefore a leader that has that rare ability to “wear different hats” as the
organizational climate changes and along with that new demands.
Summary of the literature review. This section discussed several significant areas of
research as it pertains to the literature review and this study. After a brief overview on the
literature review and its organization, the first section described the problem with projects in
general, exhibiting high failure rates and low success rates. Specifically, the case was made that
continuing to accept failing projects can no longer be an option, especially when alternatives
exist. The next section explained the differences between the traditional approaches such as
Waterfall and Spiral followed by agile methods approach to development projects. It also
provided an overview of the success and failure rates for both methodologies. Agile methods
overall have a higher success rate than Waterfall as well as a lower failure rate than Waterfall.
For those reasons, a case could be made for organizations that continue to employee the
traditional Waterfall approach to consider making the switch at an organizational level to an
agile method solution. Of course, this type of change is not an easy one to make and there are
many considerations that must be examined. Studies were included in this literature review that
examine various aspects technology acceptance. Along this theme, the final sections of the
literature review focused on a variety of topics ranging from user acceptance theories, leadership
styles, influencing areas from business as well as examining limitations for each type of
methodology.
Transition and Summary of Section 1
The first section helped to define the nature of the problem and frame a research question
around it based on that problem. The UTAUT acceptance theory was selected as the conceptual
framework of choice and expanded to include the independent variable of leadership. Next

67
hypotheses were created to examine relationships between the leadership and UTAUT
independent variables and the dependent acceptance variable. The literature review helped to
provide an overview of the literature that exists in this area including both agile and traditional
methods as well as user acceptance theories and leadership styles. The next section provides
more details concerning what data were gathered, how they were acquired, techniques that were
used to analyze it, along with a summarization of the results and finally recommendations for
future research.

68
Section 2: The Project
Section 1 defined the problem under consideration in this study as the need to address the
marked apprehension in the adoption of agile software development methods in both private and
even larger hesitation among government organizations as the primary methodology of choice.
The problem under consideration is defined. A cross-sectional review of the literature has
revealed that gaps remain for studies of this nature that involve state government and private
industry entities and the assessment of leadership style on the adoption of a agile methodologies
in software development. Thus, a justification exists in conducting this study. With a firm
understanding of the research problem, the purpose of the study, a proposed conceptual
framework, and completed literature review, the attention now shifts to laying-out the details of
how this study will be conducted. Section 2 includes information on the roles of the variety of
stakeholders involved, the number and types of participants required, the research design, the
planned instruments, and data collecting and analysis. As a starting point, a re-framing of the
purpose of this study reinforced the intent of the research.
Purpose Statement
The purpose of this quantitative correlation study was to measure if there exists a
relationship between leadership style and the adoption of agile methodologies in software
development. This study made use of and expanded upon the Unified Theory of Acceptance and
Use of Technology (UTAUT) model, which examined among other factors, the behavioral intent
to adopt an agile framework (Venkatesh et al., 2003). The study was directed towards all levels
of government to include local, city, state, and federal as well as private organizations within the
bounds of the U.S. The goal was to identify, and to a certain extent, justify the organizational
shift necessitated when switching from a classic waterfall approach to that of an agile

69
methodology with regard to those organizations contemplating changing the way they manage
their projects. Thus, this study focused specifically on those organizations that were either
shunning, considering, or were currently using agile methodologies in their software
development efforts. The objective in making this valuation was to add to the body of
knowledge by providing additional insight with regard to the effect that leadership style plays in
the adoption and use of agile methodologies. This fulfills a gap in the body of knowledge as to
the specific impact of leadership style in the adoption of agile methods in software development.
The end goal was to provide valuable information for those organizations that are considering
adopting agile approaches to their software design (Larman, 2004). Furthermore, the study
provided additional factors that all levels of government and organizations can take into
consideration when contemplating the adoption of agile software development methodologies.
Role of the Researcher
There are many instruments available for quantitative research studies. No instrument,
however significant, is more important than the individual(s) performing the study. This person
is the key mechanism (Creswell, 2009). This researcher is the one responsible for the
investigation, collection, and interpretation of data. In this study, the first task was to identify a
cross-representation of participants who was involved in this study. Other tasks included
choosing the specific and appropriate interview/survey questions, as well as analyzing,
interpreting and formally presenting the results obtained. Furthermore it was the researcher who
was responsible for submitting to the Institutional Review Board (IRB) and gaining approval to
conduct this investigation. Many times, researchers bring their own set of biases to the study,
though unintentionally, through life experiences or work. Such was the case in this instance
where there was experience working at a state government organization that exclusively relied

70
on the waterfall methodology from its early beginnings, as the predominant method of choice,
and more recently switched to using an agile methodology, specifically Kanban and Scrum. The
experience was specifically in an environment where agile, prior to the organizational shift,
never formally received due consideration. Any bias held was eliminated through the use of
established survey instruments. The participants were selected randomly through SurveyGizmo,
an organization providing survey services, minimizing if not eliminating any internal bias (Gast
& Ledford, 2014). Using a third party survey vendor helped to avoid any conflict of interest
between the researcher and the research participants, who remained anonymous. Quantitative
methods were used in this study. As Maiocco (2017) demonstrated, using quantitative methods
enables impartiality in the analysis of the data, especially given that the data were obtained and
determined from each research participant.
Participants
Participants were solicited from both the private and public sector. Participants included
former and current software developers, software engineers, and programmers. Any potential
candidates had to meet several requirements before they were considered for participation in this
study, including age (>21 years) and location (United States of America). This ensured that
vulnerable populations were not included in the research. Participants were asked to respond to a
variety of questions through an online survey ensuring anonymity with each other. Additionally,
according to Adler and Ziglio (1996), participants must possess knowledge and experience on
the topic at hand. They also had to have the ability and willingness to participate in the study.
As such, they were allowed to opt out at any time during the study. They had to be able to
commit to the time demand that the survey required of them. Participants also had to be able to
communicate and express themselves in the English language. Finally, the IRB, a group that

71
ensures participant protection, was solicited for approval prior to conducting this research in
order to protect the participants’ legal rights.
Research Method and Design
There are three predominant methods used when conducting scholarly research. They are
quantitative, qualitative, and mixed-methods (a combination of both quantitative and qualitative).
Selection of the appropriate method is critical and often drives the choice for design selection as
well (Cooper & Schindler, 2008; Leedy & Ormrod, 2013). In the following sections, the
selected method was described along with the consequent choice of design method. Justification
was provided for the choices specified.
Discussion of method. The research method chosen for this study was a quantitative,
non-experimental, correlational study using regression analysis. This decision was largely
driven by the nature of the research questions proposed. The research questions focused on
examining the relationships between several independent variables and a single dependent
variable. Quantitative studies are appropriate when empirically testing for the existence of
relationships between independent and dependent variables (Creswell, 2014). In fact, they are
ideal for numerical research when testing of hypotheses (Goduka, 2012). Such was the case with
this study, where five hypotheses were closely examined. The first hypothesis examined the
impact of leadership style on technology-use and acceptance and the remaining four helped to
identify other factors besides leadership style that may have influenced technology adoption.
Using quantitative methods provides an avenue for the discovery of new information (O'Dwyer
& Bernauer, 2013). The use of a quantitative methods also allowed for the examination of a
large group of people, in this case software developers from both private and public industry, and
be able to draw a generalization about this population with regard to the acceptance and use of

72
given technology, specifically agile (Creswell, 2014). Fowler (2009) noted that this ability to
generalize to a large population from a small one was an advantage of quantitative methods.
Additionally, quantitative methods depend on linear characteristics in their analysis
(Starke, 2010). Patten (2009) noted that at the core of (and therefore intrinsic to) quantitative
research, is in the means by which researchers are able obtain their data, the type of data
(quantifiable), and the ability to perform statistical-based analysis on this data.
Discussion of design. The choice of design is derived from the research methodology
selected and the problem that is to be addressed through the research (Creswell, 2014). This
research examined if correlations existed between the independent variables of leadership style,
performance expectancy, effort expectancy, social influence, facilitating conditions and the
dependent variable, behavioral intent to use/adopt a technology (agile). This study used a
multiple regression correlation (MRC). MRC will allow for the evaluation of presumed causal
effects between a dependent variable and other constructs or correlated predictors (Hoyt et al.,
2006). In fact, MRC is an appropriate analysis tool to use for determining the influence of
multiple coefficient factors, such as the ones in this study, and the significance to each construct
(Carter, Ludwig, Hobbs, & Campbell, 2011). This further supported by Comiskey, Curtis, and
Dempsey (2016) who noted that using a correlated design could allow for the establishment of
correlation between variables or the direction of a relationship between them. The (UTAUT)
theoretical framework and derived hypotheses lend themselves to non-experimental survey
design (Venkatesh et al., 2003). Hence, research employs a non-experimental instrument in that
the statistical relationship that will be assessed will not involve any intervention by external
means, no variables will be manipulated (Vogt, 2007). This means that any conclusions that are
drawn must be derived by some other means, in this case MRC analysis. Additionally, the
73
survey design was cross-sectional, which as Creswell (2014) explained, all data will be collected
at one specific point in time.
Summary of research method and design. As discussed earlier, the problem being
examined, the types of questions that are being asked, and the ensuing hypotheses, drive the
methodology and design of choice for a given study. This study measured changes or effects on
a dependent variable (technology use or acceptance of agile) with respect to a set of independent
variables: leadership style, performance expectancy, effort expectancy, social influence, and
facilitating conditions. Therefore, this study lent itself to the use of quantitative methods. There
are other quantitative methods such as path analysis and Structural Equation (Malik et al., 2013;
Abu-Al-Aish & Love, 2013), but the most prevalent quantitative method continues to be multiple
regression. The design will incorporate a survey composed of close-ended questions, and is very
appropriate for a non-experimental study (Lee & Levy, 2014). Correlational design is the most
appropriate design to study such relationships between dependent and independent variables
(Thapliyal & Thakre, 2017). In conclusion, a quantitative, non-experimental, correlational study
was used for this study.
Population and Sampling
In an ideal scenario, it would be possible to measure an entire population of interest. For
the majority of research conducted, this is not realistic. Instead, researchers take a sampling of
data from the total population of interest and apply analytical methods to that sample in order to
generalize results back to the original, larger population. In the following sections, the
population size, sampling method, sampling size, sampling frame, participant eligibility criteria,
and relevance of characteristics for the selected sample were all discussed.

74
Discussion of population. The sample was drawn from the U.S. population. According
to the U.S. Census, the United States had a population of 327,167,434 in 2017, of which 73.3%
were 21 years of age or older. This is the age group and geographic space that were surveyed for
the purpose of this study. According to the U.S. Bureau of Labor Statistics (2016), there were
approximately 1,246,200 employed in the broad category of software development in the United
States. This group includes the following occupations: software developers and programmers,
computer programmers, software developers for applications, software developers for systems
software, and web developers. The sample that was used in this study was drawn from this
population, which also included the constraints for age and geographic location as previously
outlined.
Discussion of sampling. It is critical to choose the correct population to sample from.
Just as important is to choose the appropriate sample size to analyze. In quantitative studies,
such as this, the goal is to select a large enough sample space so as to minimize the probability
for type I and type II errors, yet at the same time avoid selecting too large of a population that
would make it impractical to conduct the research. Choosing the right sample frame ensures that
the sample that will be examined represents the target population of interest (Fowler, 2014). The
target population included software developers from the U.S. that included programmers and
systems and applications developers. These individuals had to be currently working or had
worked under the authority of some kind of leadership. It was acceptable if they were a leader so
long as they were currently or were formally working under some type of leadership. This was
critical as the objective of this research was to examine the influence of perceived leadership
(from a follower’s perspective) in order to examine leadership style influence on the adaptation
of agile methods. Constraining the participants to followers eliminated any bias that a leader

75
would inherently bring with them in perceiving their own leadership abilities. This would have
mistakenly placed the focus on the influence of leadership style (from the leader’s perspective)
instead of from the follower’s, therefore missing the objectives for this study. As a final
constraint, participants less than 21 years of age were excluded from this population.
SurveyGizmo. The sample selected came from SurveyGizmo. SurveyGizmo is an online
survey development solution. SurveyGizmo’s audience panel served as the sample frame for this
study. It is well understood that random sampling is the preferred method for selecting a sample
from the population being sampled. As such, it has the best opportunity for providing the least
amount of bias irrespective of instrument used (Creswell, 2014). Using probability sampling
allows for the generalizability of the results back to the overall target SurveyGizmo in order to
generalize the results that were obtained from the research back to the target population.
Determining sample size. As mentioned previously, just as important as it is to select the
correct population, it is also imperative to use the appropriate sample size. In 1960, the research
division of the National Education Associated published an article titled “Small Sample
Techniques” in the NEA Research Bulletin. This article contained a formula for calculating the
sample population while taking into account the population being studied, the degree of accuracy
expressed as a proportion, and chi-square. The formula for determining the sample size is as
follows:
s = X2NP(1 – P) / d2(N – 1) + X2P(1 – P).
s = required sample size.
X2 = the table value of chi-square for 1 degree of freedom at the desired confidence
level (3.841).
N = the population size.
P = the population proportion (assumed to be .50 since this would provide the maximum
sample size).
d = the degree of accuracy expressed as a proportion (.05). (Krjcie & Morgan, 1970, pp.
607-610).

76
Unfortunately, even though the formula had obtain acceptance by the research
community, a table had not been readily available for ease of use, where researchers could
determine their sample size by confidence level and margin of error. Krejcie and Morgan (1970)
recognized an opportunity to create such a table. They created a table based off of the formula
outlined in the NEA Research Bulletin mentioned earlier that one could look-up the required
sample size based on estimated population size at a .05 margin of error. The scientist at
Research-Advisors.com used Krejcie and Morgan’s formula and created a table and a
spreadsheet that allows the user to set a specific value for the population of interest, a confidence
level of either 95% or 99%, and a margin of error of 5.0, 3.5, 2.5, or 1.0. Table 1 provides a
snapshot of Krejcie and Morgan’s (1970) table.
Table 1
Sample Size Population
Size
Confidence = 95%
Margin of Error
Confidence = 99%
Margin of Error
5.0% 3.5% 2.5% 1.0% 5.0% 3.5% 2.5% 1.0%
10 10 10 10 10 10 10 10 10
20 19 20 20 20 19 20 20 20
30 28 29 29 30 29 29 30 30
50 44 47 48 50 47 48 49 50
75 63 69 72 74 67 71 73 75
100 80 89 94 99 87 93 96 99
1000 278 440 606 906 399 575 727 943
10,000 370 727 1332 4899 622 1193 2098 6239
100,000 383 778 1513 8762 659 1336 2585 14227
1,000,000 384 783 1534 9512 663 1352 2647 16317
10,000,000 384 784 1536 9594 663 1354 2653 16460 Note. Reprinted from “Determining Sample Size for Research Activities”, by Krejcie & Morgan, 1970. Retrieved
from https://www.research-advisors.com/tools/SampleSize.htm
In most academic settings the confidence level used to determine sample size is 95%
while the acceptable margin of error tends to be at five percent (5%; Kotrlik & Higgins, 2001).
This research used the same confidence levels. Population size for software developers in the

77
U.S. was estimated at 1.25 Million in 2016 (data from the Bureau of Labor Statistics). Given
this information, a sample size of at least 384 was necessary.
Summary of population and sampling. While it is not practical to examine an entire
population, researchers are able, through the use of appropriate statistical means, to sample a
subset of the population and extrapolate, with a fair amount of certainty, the results back to the
entire population. This process is called generalization. In order for generalization to take place,
it is imperative to sample the appropriate sample frame, but just as critical is the selection of the
correct sample size. One proven means for doing that is using the formula outlined above, along
with the appropriate parameters that will help to minimize both type I and II errors. This study
used the chart that was created based on the calculation in Table 1 to conclude that a sample size
of 384 participants was needed, given the chosen confidence level of 95% and margin of error of
five percent (5%), in order to be able to generalize any results obtained back to the entire
population.
Data Collection
Instruments. This research study will make use of two survey instruments, Bass and
Avolio’s (2004) Multifactor Leadership Questionnaire (MLQ-5X rater form) and the Venkatesh
et al. (2003) Unified Theory and use of Technology (UTAUT). The MLQ-5X was used to assess
software developers’ perception of leadership style, while the UTAUT assessed software
developers’ user acceptance of agile methods. Both MLQ-5X and the UTAUT were validated
tools that were used to examine the relationship between leadership style perception, which
included: transformational leadership, transactional leadership, and passive avoidant leadership
and the UTAUT constructs of: social influence (SI), performance expectancy (PE), effort
expectancy (EE), and facilitating conditions (FC; Venkatesh et al., 2003). Neufeld et al. (2007)

78
demonstrated that instruments may be repurposed for other use. In this case, the context was
changed to agile methods while examining leadership style perception from the perspective of
followers.
UTAUT. Venkatesh et al. (2003) as a retort to an ever expanding array of competing
acceptance models, devised a model that integrated several models into one unified model, the
UTAUT. Specifically, the UTAUT model combines approximately 32 variables from eight other
theories. This single model integrates the most prominent existing constructs and represents
them in terms of five relationships where behavioral intention is grounded on performance
expectancy (PE), effort expectancy (EE), social influence (SI), and facilitating conditions (FC)
(Neufeld et al., 2007). PE can be defined as the degree to which an individual using a system
believes that it will help them to perform better in their occupation. EE is a measurement of ease
of use for a given technology. SI is the degree to which an individual believes in the importance
of using a given system based on the perception of others. Finally, FC is the degree to which an
individual believes that the infrastructure exist to support a given system (Ajzen, 1991). PE, EE,
and SI are closely related to behavioral intent (BI), while FC is directly related to use behavior
(UB; Venkatesh et al., 2003). In this study, and in accord with the UTAUT instrument, PE, EE,
SI, and FC were the independent variables while BI served as the dependent variable (see Figure
8 for a representation of the UTAUT model). The UTAUT survey included 31 questions that
were measured as scale or interval data using a Likert style questionnaire. Concerning validity,
all internal consistency reliabilities were greater than .7, according to Venkatesh et al. (2003)
supporting the instrument’s reliability. Furthermore, the UTAUT under empirical testing was
able to explain as high as 70% of the variance in IT adoption (Venkatesh et al., 2003). Gupta,

79
Dasgupta, and Gupta (2008) were also able to validate through their own research the reliability
of the UTAUT model.
MLQ-5X. Bass and Avolio (1995) created the multifactor leadership questionnaire
(MLQ-X5 rater, short form) that provides a set of questions that assess the leadership style from
the follower’s perspective. The MLQ-X5 has been widely used in many works of research, thus
has become the choice instrument when assessing leadership style. This study used the rater’s
form of the MQL-X5, which provided for followers to complete a leadership style evaluation of
their leaders(s) from their own perspective. The MLQ-X5 survey included 45 questions that can
typically be answered within a 15 minute time period (Avolio & Bass, 2004). Each question is
measured on an ordinal scale, just like with the UTAUT questions. Using ordinal scales allows
for ranking of responses (Krishnaswamy, Aggarwal, Daley, Renschler, & Lundqvist, 2009). The
MLQ-X5 survey questions focused on the following independent variables: transformational
leadership (e.g., idealized influence, inspirational motivation, intellectual stimulation, and
individual consideration), and transactional leadership (e.g., contingent reward, management by
exception) and passive avoidant leadership. Once again, the dependent variable was behavioral
intent (BI) to use a technology. In this case, the BI to adopt agile methods were examined. From
a reliability standpoint, MLQ-X5 has a range from moderate to good validity (Pittenger, 2001).
As with the UTAUT instrument, the MLQ-X5 survey instrument’s reliability and validity scores
are high with a Cronbach coefficient α > .70 (Bass & Avolio, 1995). Additionally, the MLQ-X5
instrument is proven as an extensively used instrument for research in journals, dissertations, and
books (Northouse, 2016). Finally, Avolio and Bass (2004) also confirmed the MLQ-X5’s
reliability in their own research.

80
Data collection techniques. Participants included individuals from the following
categories: software developer, programmer, and application and systems developer.
Additionally, these volunteers had to be at least 21 years of age, and from the United States. A
third party vendor such as SurveyGizmo, an online data collecting provider, was solicited to
acquire the survey participants for this study. A total of 59 questions were included in each
survey with an estimated 15 minute completion time. Mind Garden provided 28 of the 59
question on the survey, with 31 coming from the UTAUT constructs. There were also four
questions of demographic nature. In order to obtain access to those 28 questions, Mind Garden
provided permission for the use of the survey questions that were part of the MLQ-X5 rater
form. This version of the MLQ-X5 was for followers to answer questions with respect to their
leader(s). The MLQ-X5 is normally a 45 question survey. In order to avoid survey fatigue by
the survey takers and to ensure a higher probability of obtaining an adequate number of
completed surveys, only 28 questions were used from the 45. Those questions were broken
down as follows: 20 relate to transformational leadership and eight relate to transactional
leadership, specifically management by exception (active). Questions dealing with laissez-faire
or management by exception (passive) were eliminated. This has been proven an effective
technique for focusing on effective leadership by Zhu, Sosik, Riggio, and Yang (2012) and
Zhuplatova (2015). Specifically, this part of the survey (the MLQ-X5 constructs) provided
necessary feedback on the participants’ perception of leadership style with regards to their
leader(s). The UTAUT portion assessed four constructs with regard to behavioral intent to use or
adopt agile methods. The responses to both the MLQ-X5 and UTAUT survey questions were
captured using a Likert scale. For leaderships (MLQ-X5) questions, the participants had the
ability to select from the following 5-scaled options: 4 for frequently if not always, 3 for fairly

81
often, 2 for sometimes, 1 for once in a while, and 0 for not at all. UTAUT survey questions on
the other hand included a 7-point Likert scale: 1 for strongly disagree, 2 for moderately disagree,
3 for somewhat disagree, 4 for neutral, 5 for somewhat agree, 6 for moderately agree, and 7 for
strongly agree (Venkatesh et al., 2003). Once the data were accumulated, they were processed
using IBM SPSS in preparation for analysis of the results.
Data organization techniques. Data were collected through SurveyGizmo. Survey data
were gathered anonymously using random sampling. No identifying data such as name, social
security number, logon id, or password were captured or maintained. Data were collected over
an HTTPS connection. Before taking a survey, participants signed an informed consent form
that ensured anonymity. Once the survey was complete, it was downloaded from SurveyGizmo
over HTTPS and stored locally on a computer with encryption. The data were not accessible to
any outside parties. Lastly, any paper documentation was discarded.
Summary of data collection. Data collection entails the specific instruments that were
used during the research process to capture, organize, and secure the data. This study used two
different instruments to obtain the data needed to satisfy the required research. The first
instrument was the UTAUT model, which made use of four constructs and a total of 39 questions
in assessing the effect of those constructs on behavioral intent and use adoption. An additional
set of 28 questions coming from the MLQ-X5 survey were added to the UTAUT survey. This
allowed the UTAUT model to expand and include questions on the perception of leadership style
of leaders from the perspective of their followers. The MLQ-X5 was a third party vendor, like
SurveyGizmo. SurveyGizmo facilitated obtaining random volunteers, hosting the surveys, as
well as providing the resultant data. The researcher was responsible with ensuring that the
selected vendors met the demanded level of anonymity and confidentiality as required by the

82
participants. Finally, the researcher was responsible for the resultant data to remain secure for
the duration of the research.
Data Analysis
Variables used in the study. Data were collected through a single survey instrument
that combined survey questions from both the Venkatesh et al. (2003) UTAUT model and Bass
and Avolio’s (2004) MLQ. The UTAUT model provided 31 questions to the survey with
contributions from the following independent variables: social influence (SI), performance
expectancy (PE), effort expectancy (EE), and facilitating conditions (FC). The data gathered
were interval (scale) as questions were measured using Likert scales (Allen & Seaman, 2007).
The MLQ provided the 28 questions to the overall survey with contributions from the leadership
style (LS) independent variable. LS is composed of multiple sub-factors that include:
transformational leadership (e.g., idealized influence, inspirational motivation, intellectual
stimulation, and individual consideration) and transactional leadership (e.g., contingent reward,
management by exception; Bass, 1990). As with the data gathered for the UTAUT model, the
data gathered using the MLQ portion of the survey were interval (scale) and therefore measured
using Likert scales (Allen & Seaman, 2007). There was a single dependent variable that was
analyzed for influence by the independent variables mentioned, behavioral intent (BI) to use a
technology (Venkatesh et al., 2003). Table 2 shows the variable names along with their type.
Table 2
Variable Types Variable Role of data Type of data
Social influence (SI) Independent Scale
Performance expectancy (PE) Independent Scale
Effort expectancy (EE) Independent Scale
Facilitating conditions (FC) Independent Scale
Leadership style (SE) Independent Scale
Behavioral intent (BI) Dependent Scale
Note. Variables, Roles, and Data Types

83
Quantitative data analysis. Descriptive statistics analysis was performed on the data in
order to substantiate quality and validity. Demographic data were analyzed for trends and
patterns as shown by Rehman, Esichaikul, and Kamal (2012). Additionally, the mean, median,
and the mode along with frequency distribution by demographic breakdown was also provided.
Descriptive statistics were also used to identify outliers in the data. Malik et al. (2013) found
that multiple regression was an acceptable means for determining the influence of one or more
independent variables on a dependent variable. This study made use of multiple independent
variables and their influence on a single dependent variable. Raines (2013) confirmed that when
using scale data, such as in this study, regression is an appropriate approach. The effect(s) or
influence of the independent variables on the dependent variable helped in answering the
primary research question as well as the secondary questions.
The primary research question was as follows: What is the impact of perceived leadership
style (LS) on the adoption of agile development methods? In order to answer this question and
secondary questions (see the section on Research Questions), a closer examination of the
associated hypothesis was required.
Hypothesis 01 and A1. Leaderships style (LS) was measured as follows:
H01: There is no relationship between perceived LS and the adoption of agile
development methods.
HA1: There is a relationship between perceived LS and the adoption of agile development
methods.
Hypothesis 02 and A2. Performance expectancy (PE) was measured as follows:
H02: There is no relationship between PE and the adoption of agile development
methods.

84
HA2: There is a relationship between PE and the adoption of agile development methods.
Hypothesis 03 and A3. Effort expectancy (EE) was measured as follows:
H03: There is no relationship between perceived EE and the adoption of agile
development methods.
HA3: There is a relationship between perceived EE and the adoption of agile development
methods.
Hypothesis 04 and A4. Social influence (SI) was measured as follows:
H04: There is no relationship between perceived SI and the adoption of agile
development methods.
HA4: There is a relationship between perceived SI and the adoption of agile development
methods.
Hypothesis 05 and A5. Facilitating conditions (FC) was measured as follows:
H05: There is no relationship between perceived FC and the adoption of agile
development methods.
HA5: There is a relationship between perceived FC and the adoption of agile development
methods.
These hypotheses each postulate a relationships between an independent variable (LS,
PE, EE, SI, and FC) with the dependent variable behavioral intent (BI). The data analysis
provided evidence for or against the existence and extent of relationships between each
independent variable and the dependent variable. The data results therefore indirectly provided
an answer to the research questions through the provision of evidence on the effect or influence
of leadership style on the behavioral intent of software developers to adopt agile methods. More
specifically, the relationships between the independent variables and dependent variable was

85
calculated using multiple regression. Multiple regression is often used to determine the influence
of the independent variables on the dependent variable and the significance of each independent
variable as shown by Carter et al. (2011). Regression analysis allows for the evaluation of
influence of one or more independent variables on an independent variable (Morgan, Leech,
Gloeckner, & Barrett, 2013). T-tests was also used to determine if the mean of a population
significantly differed from the hypothesized mean (Morgan et al., 2013). Finally, a correlational
analysis was used to determine the level of significance for α = .05 and confidence interval =
95% (Lacort, 2014). For all of these calculations, the statistical package for social sciences
(SPSS) software was used.
Assumptions with regression analysis. In order to use multiple regression analysis,
several assumptions must first be met. The assumptions that were confirmed were as follow:
Independence of residuals. Independence of residuals is related to ensuring that the data
is composed of independent observations. This means that adjacent observations are
independent. This study made use of the Durbin-Watson statistic to test for this assumption
(Laerd Statistics, 2015).
Existence of linearity. Another assumption was that there needed to exist a linear
relationship between the dependent variable and each independent variable. Likewise, there also
needs to be a relationship between the dependent variable and the independent variables as a
whole (Vogt, 2007). Linearity in both cases was affirmed using a scatter plot of studentized
residuals versus unstandardized values as well as partial regression plots, respectively.
Homoscedasticity or residuals. Homoscedasticity means that the residuals are equal
across the predicted dependent variable. Confirmation of homoscedasticity was confirmed

86
through the examination of the plot of studentized residuals against unstandardized predicted
values (Laerd Statistics, 2015).
Presence of multicollinearity. Multicollinearity is a condition where two or more
independent variables are highly correlated with each other. In a multicollinearity scenario it
becomes difficult to identify which of the independent variables involved contributes to the
variance explained in the dependent variable. Multicollinearity was confirmed through visual
observation of the correlation coefficients and Tolerance/VIF values (Mertler & Vannatta, 2013).
Outliers, leverage, and influential points. Outliers, leverage, and influential points
represent unusual data with respect to regression analysis. They can each have a negative effect
on the regression equation which effects the ability to make sound predictions on the dependent
variable based on observations from the independent variables. Casewise diagnostics and
studentized deleted residuals, leverage points were used to examine outliers and influential
points (Laerd Statistics, 2015). Cook’s Distance was used to assess influential points.
Residual approximate normality. The requirement that was checked here was that
residuals are normally distributed. When they are, it allows for the sound determination of
statistical significance. Residual approximation for normality was evaluated using histograms
along with P-P plots and Q-Q plots of studentized residuals (Laerd Statistics, 2015).
Pilot Study. A pilot study was performed to verify the reliability of the survey
instrument. A pilot study can be especially useful when looking to validate an instrument,
method, troubleshoot a problem, or to determine research feasibility (Vogt, 2007). Given its
value, prior to performing the full scale survey, a smaller sample (N = 30) was collected using
SurveyGizmo. The smaller sample was analyzed to confirm a Cronbach’s alpha of at least .70
(Vogt, 2007). Taking the time to do a pilot study allows for the best opportunity for success.

87
Summary of data analysis. This section discussed several keys points with regards to
data analysis. The first was the recognition of all of the variables involved along with their
types. The specific independent variables and dependent variable were identified along with the
specific data type for each such as scale, ordinal, or nominal. Table 2 includes a listing of the
variables in this study along with their type. Second, an exegesis of which descriptive statistics
were captured followed. Third, the original research question was presented along with all of the
hypotheses that were part of this study. The goal here was to make clear which statistical tools
were used and why they were chosen. In this case multiple regression was the prevailing choice
as it allowed researchers to measure any effects that independent variables may have had on the
dependent variable in this study. In order to verify that the choice of instrument is sound, a pilot
study was proposed and benchmarks created that satisfied validity for the actual study.
Inferential, post-hoc testing helped to formally conclude the acceptance or rejection of the null
hypotheses.
Reliability and Validity
This study utilized two well-known and tested instruments, the MLQ-5X rater survey and
the UTAUT. The reliability and validity for each of these instruments has been demonstrated
time and time again as they each continue to be the instruments of choice for evaluating
leadership style and technology adoption respectively. This section discussed the reliability and
validity for each of these instruments as it pertained to this study.
Reliability. Reliability is a measure of repeatability of a given study which may include
consistency of results, and the stability of a study (Merriam & Tisdell, 2015; Creswell, 2014).
One way to measure reliability is using Cronbach’s alpha. In research, an alpha of .70 or larger
is considered desirable (Young, 2010; Bass & Avolio, 2004). In the case of the MLQ-X5 survey,

88
the coefficient alphas for the MLQ transformational constructs were all above the .70 standard
(.76 < α < .89; Bass & Avolio, 1995). Reliability is also at a satisfactory or at a high level when
it comes to transactional leadership as measured in the MLQ (.73 < α < .89; Bass & Avolio,
1995). Venkatesh et al. (2003) in the case of the UTAUT model, performed 48 separate validity
tests that were distributed between two studies and included eight models having three time
periods each. The goal was to measure convergent and discriminant validity. The results
showed that all internal consistency reliabilities were greater than .70 (Venkatesh et al., 2003).
In order to confirm reliability of the research in this study, a pilot study was conducted. The
pilot provided evidence for the reliability of both the MLQ-5X survey and the UTAUT model.
Conducting a pilot study proved particularly useful to certify and validate instruments in Vogt’s
(2007) study. The pilot study included a smaller sample size (N=30) with survey’s being
collected from a third party vendor such as SurveyGizmo. The results were analyzed to ensure
that there was a Cronbach alpha of at least .70.
Validity. According to Swanson and Holton (2005), the measures are only valid if they
measure what they are supposed to measure. In fact, quantitative research demands this. In
quantitative research, the instruments and means used during a given research study must be
valid and reliable in order for that study to have any merit. Creswell (2009) noted that it is
critical to ensure internal validity if the results of any given study are to be trusted, especially if
the intent is to generalize a given sample size to the overall population. In the case for the
UTAUT model, internal consistency reliabilities (ICRs) were all shown to be greater than .70
(Venkatesh et al., 2003). ICRs can be compromised and as a result affect the overall
interpretation of the research results (Creswell, 2014). Validity has also been shown with respect
to the MLQ-5X many times over (Rowold, 2005). In a separate study by Bagheri, Shirzadmehr,

89
and Rezaei (2015), MLQ found a Cronbach’s Alpha of α = .95. A pilot study was performed on
a smaller sample of N = 30 that further validated the use of both instruments in this study. There
were two areas that could have proved troubling to researchers. They were internal and external
validity.
Internal validity affects how correctly a researcher is able to distill the correct facts out of
a study and make generalizations towards a population (Creswell, 2014). A number of factors
can affect internal validity. Some include inconsistent survey results, when survey takers rush
through a survey without answering the questions truthfully, quitting a survey in midstream, or
selecting participants that are not all capable of answering without some form of bias. Internal
threats can be minimized by applying sound and well-tested instruments, analyzing and making
use of survey results that are complete and show no sign of being completed in haste, and lastly
selecting from a wide range of individuals from various groups. External validity speaks to the
ability to consider the study’s potential for generalization. This can occur if incorrect inferences
are made during the data analysis phase of a study (Creswell, 2014).
Summary of reliability and validity. In quantitative research, the instruments and
means used during a given research study must be valid and reliable in order for that study to
have any merit or for the results to be accepted. This study made use of two instruments, the
MLQ-5X and the UTAUT model. Both of these instruments have been shown through statistical
means to be reliable and valid. This reliability makes them so popular when studying either
leadership influence or technology adoption. Cronbach’s alpha score is one means reliability
that is checked, and in the case for both instruments, it has an Alpha score of α > .70 standard
that researchers are looking for (Young, 2010). This research made use of a pilot study to further
validate these instruments before moving on to the full study.

90
Transition and Summary of Section 2
In Section 1, the focus was on outlining the problem to be studied which resulted in the
creation of a problem statement followed by a description of the nature of the study and resulting
research questions, the ensuing hypotheses, and literature review. With this foundation in place,
Section 2 outlined the “how to” component of the study. The role of the researcher was
identified but also the participants in the study along with the research methods and designs
chosen. In Section 2, the population was identified along with the sampling means, instruments
that will be used, as well as collection methods. The final component was a justification for the
choice of instruments by way of substantiating the reliability and validity on those instruments.
The third and final section makes use of the groundwork that was put in place during Section 1
and the research plan developed in Section 2, in order to conduct the study and subsequently
provide an analysis of the resultant data.

91
Section 3: Application to Professional Practice and Implications for Change
Section 3 includes the outcomes of the pilot study, the official study, a descriptive
analysis of the demographic data gathered, followed by the results of the hypotheses testing.
Based on those results, recommendations were provided for applications to professional practice
and action. Lastly, Section 3 also includes recommendations for further study, reflections, as
well as an overall summary for the study.
Overview of the Study
This study was conducted to examine the role that leadership style plays in the adoption
of agile methods among software developers. The research was initiated as an approach to
examine the disparate lesser use of agile methods compared to traditional sequential methods,
such as the waterfall, given the pronounced higher success rates of the former (Nuottila et al.,
2016; Standish, 2015). A combined survey instrument was used to test Bass and Avolio’s (1992)
leadership constructs (MLQ-5X) in conjunction with Venkatesh et al.’s (2003) adoption and use
of technology (UTAUT) model. The goal of the research was to answer to following questions:
What is the impact of perceived leadership style, performance expectancy, effort expectancy,
social influence, and facilitating conditions on the adoption of agile methods? Multiple
regression was used to identify if there was a significant statistical relationship between the
leadership style and the willingness to adopt agile methods.
Presentation of the Findings
In Section 2, the desire to conduct a pilot study was discussed. The original UTAUT
instrument examined four constructs: PE, EE, SI, and FC. With the addition of the LS construct
to the UTAUT model, there was a need to validate and demonstrate internal consistency
remained in acceptable range given that the UTAUT instrument was enhanced to determine any

92
possible LS influencing factors against the BI dependent variable (Vogt, 2007). In order to
provide evidence for this, a pilot study of N = 30 of random software developers, using the
SurveyGizmo platform, age 21 or older, completed a survey that combined the constructs from
both the UTAUT model (examines intent to use a technology) with the MLQ-5X survey
(examines influence of leadership style). The internal consistency of this constructs was
examined using IBM SPSS Statistics, version 24. The results are shown below in Table 3. They
a high level of internal consistency with a Cronbach’s Alpha of at least .7, the recommended
minimum (Cronbach, 1951; Vogt, 2007).
Table 3
Internal Consistency Reliability (ICR) – Pilot Study
Name Variable Items Alpha
(α)
Performance Expectancy PE 4 .889
Effort Expectancy EE 4 .951
Social Influence SI 4 .879
Facilitating Conditions FC 4 .851
Behavioral Intent (to use system) BI 3 .952
Transformational and Transactional Leadership LS 28 .968
Idealized Attributes or Idealized Influence (Attributes)
LS-IA or
II(A) 4 .869
Idealized Behaviors or Idealized Influence (Behaviors)
LS-IB or
II(B) 4 .901
Inspirational Motivation LS-IM 4 .904
Intellectual Stimulation LS-IS 4 .904
Intellectual Consideration LS-IC 4 .828
Contingent Reward LS-CR 4 .845
Mgmt. by Exception (Active) LS-MBEA 4 .845 Note. N=30
Description of the sample. Once the pilot study was completed, a separate survey
sample of N = 384 was obtained, using SurveyGizmo, again from a random population of
panelist with the same demographic constraints as the pilot study that was previously discussed.
This larger population (N = 384), in contrast to that of the pilot study (N = 30), enables for the

93
generalization of any results obtained in a given statistical analysis of that population (Vogt.
2007). As a whole, 1,101 respondents participated. Of those responding, 414 provided complete
surveys (including both the pilot study and the main study) for a 37.5% completion rate. The
next section includes a descriptive analysis of the demographics for the main study as provided
by the separate survey (N = 384).
Demographics. The next four tables describe some fundamental demographics from the
main study. Table 4 below shows a frequency distribution with respect to gender. The
distribution shows a slightly higher percentage in the number of female software developers
compared to that of their male constituents.
Table 4
Demographics – Gender
Gender N %
Female 209 54.4
Male 175 45.6
Missing 0 0.0
Total 384 100.0 Note. N = number of responses, % = percentage of participants.
Table 5 shows a frequency distribution of age. The data indicates that a majority of the
panelist fall in the 24–34 and the 45–54 age groups. Combined, they making up a total of 64.6%
of the overall survey respondents.

94
Table 5
Demographics – Age
Range (years) N %
21-24 59 15.4
25-34 140 36.5
45-54 108 28.1
55-64 45 11.7
65-74 32 8.3
75 or older 0 0.0
Total 384 100.0 Note. N = number of responses, % = percentage of participants.
A frequency distribution for the number of years of experience by range is shown below
in Table 6. The majority of respondents were in the 1-5 and 6-10 year age ranges (70%).
Table 6
Demographics – Experience Range (years) N %
Less than 1 48 12.5
1-5 159 41.4
6-10 110 28.6
11-15 44 11.5
16-20 16 4.2
More than 20 7 1.8
Total 384 100.0
Note. N = number of responses, % = percentage of participants.
Table 7 shows a frequency distribution for voluntariness use. This question asked the
respondent to indicate the reason for their use of agile methods in the work place. The goal was
grasp an understanding for the reason for using these methods and ranged from it being
voluntary to mandatory and even an option to indicate that they had never used agile
methodologies in the workplace. In this case nearly half of all respondents indicated that the use
of agile methods was mandatory for use in the work place (49%), while a close second was
voluntary but for personal use (32.3%).

95
Table 7
Demographics – Voluntariness Use
Type N %
Voluntary (for personal use) 124 32.3
Voluntary (for business use) 49 12.8
Mandatory (for business use) 188 49.0
Never used agile methods 23 6.0
Total 384 100.0
Note. N = number of responses, % = percentage of participants.
Descriptive statistics. Table 8 that follows includes several of the more common
descriptive statistics using the responses obtained from the main study. As the statistics indicate,
there is a lightly right distribution of the mean scores. There is also a slight negative skewness
for all scores. All values are well within the accepted range of +1.0 and -1.0. Under these
circumstances approximate normality is affirmed, allowing for the use of parametric statistics
(Morgan et al., 2013).
Table 8
Descriptive Statistics of Instrument
Variable Items N Min. Max. Mean Std. Dev. Skewness Kurtosis
PE 4 384 1 7 4.568 1.524 -.389 -.453
EE 4 384 1 7 4.882 1.411 -.550 -.005
SI 4 384 1 7 4.721 1.388 -.364 -.118
FC 4 384 1 7 4.660 1.233 -.364 .240
BI 3 384 1 7 5.077 1.557 -.503 -.392
LS 28 384 0 5 2.555 0.763 -.590 .728
LS-IA or II(A) 4 384 0 5 2.608 0.879 -.702 .573
LS-IB or II(B) 4 384 0 5 2.601 0.835 -.464 .195
LS-IM 4 384 0 5 2.660 0.923 -.621 .124
LS-IS 4 384 0 5 2.544 0.888 -.532 .283
LS-IC 4 384 0 5 2.556 0.923 -.561 .155
LS-CR 4 384 0 5 2.559 0.906 -.615 .152
LS-MBEA 4 384 0 5 2.358 0.943 -.357 -.310
Note. Each variable represents the mean of the items for that construct. LS is a combination of the other
sub constructs: IA, IB, IM, IS, IC, CR, and MBEA. BI is the only dependent variable.

96
In addition to the reliability statistics obtained in the pilot study, a separate reliability test
using Cronbach’s Alpha was performed for the main study. Table 9 shows the results from that
calculation.
Table 9
Internal Consistency Reliability (ICR)
Name Variable Items Alpha (α)
Performance Expectancy PE 4 .870
Effort Expectancy EE 4 .863
Social Influence SI 4 .854
Facilitating Conditions FC 4 .699
Behavioral Intent (to use system) BI 3 .908
Transformational and Transactional Leadership LS 28 .956
Idealized Attributes or Idealized Influence (Attributes) LS-IA or II(A) 4 .806
Idealized Behaviors or Idealized Influence (Behaviors) LS-IB or II(B) 4 .763
Inspirational Motivation LS-IM 4 .838
Intellectual Stimulation LS-IS 4 .819
Intellectual Consideration LS-IC 4 .802
Contingent Reward LS-CR 4 .818
Mgmt. by Exception (Active) LS-MBEA 4 .803
Note. N=384
* FC α < .70, after dropping FC3, new α = .779.
More specifically, Table 9 shows that almost all of the calculated Alpha scores are
greater than or equal to .763 with the exception of the Facilitating Conditions (FC) construct
(.699). Alpha scores of at least .7 indicate an acceptable level of internal consistency, meaning
that the appointed constructs are measuring the same thing (Vogt, 2007). When one of the four
components that make up the FC construct, specifically FC3 “Agile methods are not compatible
with other methods I use” is removed, the new Alpha value for FC increases to .779, well within
the acceptable range for internal consistency. In this case, FC3 was removed from any
calculations going forward in order to maintain an Alpha above .699, in this case .779.

97
Hypothesis testing. The first part of the findings focused on demographic results
obtained from the study, measurements of internal reliability among constructs within the
proposed framework, as well as evidence for normality allowing for the use of parametric
statistical measurements. The focus in this section is on the use inferential statistics in order to
evaluate each of the five hypotheses proposed and discussed in Sections 1 and 2. The decision to
reject or fail to reject were evaluated against a 95% confidence level, which means that there is a
five percent chance of mistakenly rejecting the null hypothesis when in it is true (Type I error).
The hypotheses that follow were all tested using the t-statistic where t ≤ .05 is rejected, while t >
.05 is not rejected.
Hypotheses 1. Hypothesis H01 and HA1 examined to what extent, if any, does leadership
style (LS) impact a software developer’s intention to adopt agile development methods. The
hypotheses were as follows:
H01: There is no relationship between perceived LS and the adoption of agile
development methods.
HA1: There is a relationship between perceived LS and the adoption of agile development
methods.
In order to test the null hypothesis, H01, the mean of BI was regressed on the mean of
each of the leadership style (LS) constructs, shown in Table 10 below. There was an
independence of residual as assessed with a Durbin-Watson statistic of 2.128 (Field, 2013; Laerd
Statistics, 2015). Values between 1.5 and 2.5 are considered fairly normal (Field, 2013).
Linearity was confirmed using a combination of scatterplots of BI against each LS construct as
well as Q-Q plots that included expected versus observed values for each LS construct. In both

98
cases, verification was affirmed using studentized residuals versus unstandardized values that
included partial regression plots (Vogt, 2007).
Visual inspection of the plots indicated a linear relationship between the independent
variables (LS) and the dependent variable (BI). There was homoscedasticity, as assessed by
visual inspection of a plot of studentized residuals versus unstandardized predicted values (Vogt,
2007). There was no multicollinearity. This was confirmed as all tolerance values were greater
than 0.1 (Field, 2013). An evaluation of unusual points was conducted next that included an
assessment of potential outliers, leveraging points, and influential points.
Cases 135 and 263 with studentized values of 3.229 and -3.252, respectively, were
initially identified as possible candidate outliers (studentized residuals with values greater than ±
3 in absolute value are believed by some to be outliers). It is important not to take the cutoff of ±
3 literally, but instead use it as a warning for further investigation. In fact, of bigger concern is
the impact of the existence of a given outlier has on the regression analysis (Yuen & Ortiz,
2017). One way to assess the influence of any given data point is to use Cook’s D value. Cook’s
D value is able to measure the level or effect of change on the model coefficient if a given
observation were to be removed from the set of data under examination. Cook’s D values above
1.0 are considered influential values (Cook, 1977). The Cook D values obtained for cases 135
and 263 were .059 and .011, respectively. Both indicated negligible influence on the regression.
Finally, all leverage values were less than .2 (Field, 2013). Normality was established by visual
inspection of a histogram (standardized residuals), Q-Q, and P-P Plots. R2 for the overall model
was 25.8% with an adjusted R2 of 24.4%, a small to nearly medium size effect according to
Cohen (1988). The regression model for predicting BI was statistically significant, F(7, 376) =
18.692, p< .001, adj. R2 = .244. The IA or II (A) and IM variables were both found to be a

99
statistically significant predictors of BI, p < .05. The overall model was significant (p < .001),
therefore, the null hypothesis is rejected. As a result, the alternative hypothesis was accepted
that there is a relationship between perceived LS and the adoption of agile development methods.
Table 10
Regression Analysis for LS
Model Unstandardized Standardized Collinearity
Coefficients Coefficient Statistics
B SE β t p Tolerance
1 Constant 2.629 .247
10.637 .000*
IA or II(A) .302 .142 .171 2.121 .035* .305
IB or II(B) .136 .154 .073 .885 .377 .290
IM .458 .137 .272 3.342 .001* .298
IS .101 .152 .058 .670 .504 .263
IC -.200 .138 -.119 -1.455 .146 .296
CR .195 .145 .113 1.342 .181 .276
MBEA -.067 .092 -.040 -.729 .466 .641
Note. F(7,376) = 18.692, p < .001, adj. R2 = .244. Dependent variable: BI.
* individual sub constructs have p < .05. Constant, IA or II(A) and IM are significant.
Hypotheses 2. Hypothesis H02 and HA2 examined to what extent, if any, does
performance expectancy (PE) impact a software developer’s intention to adopt agile
development methods. The hypotheses were as follows:
H02: There is no relationship between perceived PE and the adoption of agile
development methods.
HA2: There is a relationship between perceived PE and the adoption of agile development
methods.
In order to test the null hypothesis, H02, the mean of BI was regressed on the mean of
each of the performance expectancy (PE) constructs, shown in Table 11 that follows. There was
an independence of residual as assessed with a Durbin-Watson statistic of 1.725 (Field, 2013;
Laerd Statistics, 2015). Linearity was confirmed using a combination of scatterplots of BI
100
against each PE construct as well as Q-Q plots that included expected versus observed values for
each PE construct. In both cases, verification was affirmed using studentized residuals versus
unstandardized values that included partial regression plots (Vogt, 2007).
Visual inspection of the plots indicated a linear relationship between the independent
variables (PE) and the dependent variable (BI). There was homoscedasticity, as assessed by
visual inspection of a plot of studentized residuals versus unstandardized predicted values (Vogt,
2007). There was no multicollinearity. This was confirmed as all tolerance values were greater
than 0.1 (Field, 2013). An evaluation of unusual points was conducted next that included an
assessment of potential outliers, leveraging points, and influential points.
Cases 34, 79, 103, 275, and 365 each exhibited a studentized value of 3.347 and initially
identified as possible candidate outliers. But, upon further inspection and assessing the influence
of each of those data points on the equation for the regression using Cook’s D value, it was
determined that all values were less than 1.0 (all values were less than .05) and thus considered
non-influential (Cook, 1977). Thus, indicating negligible influence on the regression. Finally,
all leverage values were less than .2 (Field, 2013). Normality was established by visual
inspection of a histogram (standardized residuals), Q-Q, and P-P Plots. The R2 for the overall
model was 38.2% with an adjusted R2 of 37.5%, a large size effect according to Cohen (1988).
The regression model for predicting BI was statistically significant, F(4, 379) = 58.538, p< .001.
The PE1, PE2, and PE4 variables were found to be statistically significant predictors of BI, p <
.05. Therefore, the null hypothesis is rejected. As a result, the alternative hypothesis was
accepted that there is a relationship between perceived PE and the adoption of agile development
methods.

101
Table 11
Regression Analysis for PE
Model Unstandardized Standardized Collinearity
Coefficients Coefficient Statistics
B SE β t p Tolerance
1 Constant 2.265 .204 11.079 .000*
PE1 .183 .049 .232 3.713 .000* .419
PE2 .223 .056 .255 3.954 .000* .391
PE3 .091 .055 .104 1.645 .101 .410
PE4 .120 .049 .127 2.458 .014* .615
Note. F(4,373) = 58.538, p < .001, adj. R2 = .375. Dependent variable: BI.
* individual sub constructs have p < .05. Constant, PE1, PE2, and PE4 is significant.
Hypotheses 3. Hypothesis H03 and HA3 examined to what extent, if any, does effort
expectancy (EE) impact a software developer’s intention to adopt agile development methods.
The hypotheses were as follows:
H03: There is no relationship between perceived EE and the adoption of agile
development methods.
HA3: There is a relationship between perceived EE and the adoption of agile development
methods.
In order to test the null hypothesis, H03, the mean of BI was regressed on the mean of
each of the effort expectancy (EE) constructs, shown in Table 12 that follows. There was an
independence of residual as assessed with a Durbin-Watson statistic of 1.807 (Field, 2013; Laerd
Statistics, 2015). Linearity was confirmed using a combination of scatterplots of BI against each
PE construct as well as Q-Q plots that included expected versus observed values for each EE
construct. In both cases, verification was affirmed using studentized residuals versus
unstandardized values that included partial regression plots (Vogt, 2007).

102
Visual inspection of the plots indicated a linear relationship between the independent
variables (EE) and the dependent variable (BI). There was homoscedasticity, as assessed by
visual inspection of a plot of studentized residuals versus unstandardized predicted values (Vogt,
2007). There was no multicollinearity. This was confirmed as all tolerance values were greater
than 0.1 (Field, 2013). An evaluation of unusual points was conducted next that included an
assessment of potential outliers, leveraging points, and influential points.
Cases 3, 103, 178, 275, 283, and 365 each exhibited a studentized values greater than ± 3
in absolute value and were therefore initially identified as possible candidate outliers. Upon
assessing the influence of each of those data points on the equation for the regression using
Cook’s D value, it was determined that all values were less than 1.0 (all values were less than
.14) and thus considered non-influential (Cook, 1977). Thus, indicating negligible influence on
the regression. Finally, all leverage values were less than .2 (Field, 2013). Normality was
established by visual inspection of a histogram (standardized residuals), Q-Q, and P-P Plots. The
R2 for the overall model was 39.9% with an adjusted R2 of 39.3%, a large size effect according to
Cohen (1988). The regression model for predicting BI was statistically significant, F(4, 379) =
62.986, p< .001. The EE1, EE2, EE3, and EE4 variables were found to be statistically
significant predictors of BI, p < .05. The overall model was found to be statistically significant
(p < .001), therefore, the null hypothesis is rejected. As a result, the alternative hypothesis was
accepted that there is a relationship between perceived EE and the adoption of agile development
methods.

103
Table 12
Regression Analysis for EE
Model Unstandardized Standardized Collinearity
Coefficients Coefficient Statistics
B SE β t p Tolerance
1 Constant 1.675 .224 7.472 .000*
EE1 .140 .053 .151 2.618 .009* .477
EE2 .125 .051 .137 2.469 .014* .515
EE3 .217 .052 .238 4.137 .000* .481
EE4 .213 .057 .221 3.748 .000* .456
Note. F(4,379) = 62.968, p < .001, adj. R2 = .393. Dependent variable: BI.
* individual sub constructs have p < .05. Constant, EE1, EE2, EE3, and EE4 are significant.
Hypotheses 4. Hypothesis H04 and HA4 examined to what extent, if any, does social
influence (SI) impact a software developer’s intention to adopt agile development methods. The
hypotheses were as follows:
H04: There is no relationship between perceived SI and the adoption of agile
development methods.
HA4: There is a relationship between perceived SI and the adoption of agile development
methods.
In order to test the null hypothesis, H04, the mean of BI was regressed on the mean of
each of the social influence (SI) constructs, shown in Table 13 that follows. There was an
independence of residual as assessed with a Durbin-Watson statistic of 1.767 (Field, 2013; Laerd
Statistics, 2015). Linearity was confirmed using a combination of scatterplots of BI against each
SI construct as well as Q-Q plots that included expected versus observed values for each SI
construct. In both cases, verification was affirmed using studentized residuals versus
unstandardized values that included partial regression plots (Vogt, 2007).
Visual inspection of the plots indicated a linear relationship between the independent
variables (SI) and the dependent variable (BI). There was homoscedasticity, as assessed by

104
visual inspection of a plot of studentized residuals versus unstandardized predicted values (Vogt,
2007). There was no multicollinearity. This was confirmed as all tolerance values were greater
than 0.1 (Field, 2013). An evaluation of unusual points was conducted next that included an
assessment of potential outliers, leveraging points, and influential points.
Cases 3, 103, 117, and 365 each exhibited a studentized values greater than ± 3 in
absolute value and were therefore initially identified as possible candidate outliers. But, upon
assessing the influence of each of those data points on the equation for the regression using
Cook’s D value, it was determined that all values were less than 1.0 (all values were less than
.09) and thus considered non-influential (Cook, 1977), thus, indicating negligible influence on
the regression. Finally, all leverage values were less than .2 (Field, 2013). Normality was
established by visual inspection of a histogram (standardized residuals), Q-Q, and P-P Plots. The
R2 for the overall model was 46.1% with an adjusted R2 of 45.6%, a large size effect according to
Cohen (1988). The regression model for predicting BI was statistically significant, F(4, 379) =
81.144, p< .001. The SI1, SI2, SI3, and SI4 variables were all found to be statistically
significant predictors of BI, p < .05. The overall model was statistically significant (p < .001)
therefore, the null hypothesis is rejected. As a result, the alternative hypothesis was accepted
that there is a relationship between perceived SI and the adoption of agile development methods.
Table 13
Regression Analysis for SI
Model Unstandardized Standardized Collinearity
Coefficients Coefficient Statistics
B SE β t p Tolerance
1 Constant 1.509 .208 7.250 .000*
SI1 .135 .051 .144 2.660 .008* .486
SI2 .222 .053 .231 4.206 .000* .473
SI3 .103 .048 .111 2.154 .032* .531
SI4 .293 .047 .321 6.282 .000* .546 Note. F(4,379) = 81.144, p < .001, adj. R2 = .456. Dependent variable: BI. * individual sub constructs have p < .05. Constant, SI1, SI2, SI3, and SI4 are significant.

105
Hypotheses 5. Hypothesis H05 and HA5 examined to what extent, if any, do facilitating
conditions (FC) impact a software developer’s intention to adopt agile development methods.
The hypotheses were as follows:
H05: There is no relationship between perceived FC and the adoption of agile
development methods.
HA5: There is a relationship between perceived FC and the adoption of agile development
methods.
Recall that during the ICR analysis, it was determined that FC3 had a low score for
Cronbach’s Alpha of .699, less than the ideal minimum of .70. Because of this, FC3 was
dropped from the analysis. In order to test the null hypothesis, H05, the mean of BI was
regressed on the mean of each of the facilitating conditions (FC) constructs, shown in Table 14
that follows. There was an independence of residual as assessed with a Durbin-Watson statistic
of 1.867 (Field, 2013; Laerd Statistics, 2015). Linearity was confirmed using a combination of
scatterplots of BI against each FC construct as well as Q-Q plots that included expected versus
observed values for each construct. In both cases, verification was affirmed using studentized
residuals versus unstandardized values that included partial regression plots (Vogt, 2007).
Visual inspection of the plots indicated a linear relationship between the independent
variables (FC) and the dependent variable (BI). There was homoscedasticity, as assessed by
visual inspection of a plot of studentized residuals versus unstandardized predicted values (Vogt,
2007). There was no multicollinearity. This was confirmed as all tolerance values were greater
than 0.1 (Field, 2013). An evaluation of unusual points was conducted next that included an
assessment of potential outliers, leveraging points, and influential points.

106
Cases 3, 6, 103, and 181 each exhibited a studentized values greater than ± 3 in absolute
value and were therefore initially identified as possible candidate outliers. But, upon assessing
the influence of each of those data points on the equation for the regression using Cook’s D
value, it was determined that all values were less than 1.0 (all values were less than .20) and thus
considered non-influential (Cook, 1977). Thus, indicating negligible influence on the regression.
Finally, all leverage values were less than .2 (Field, 2013). Normality was established by visual
inspection of a histogram (standardized residuals), Q-Q, and P-P Plots. The R2 for the overall
model was 48.1% with an adjusted R2 of 47.7%, a large size effect according to Cohen (1988).
The regression model for predicting BI was statistically significant, F(3, 380) = 117.458, p<
.001. The FC1, FC2, and FC4 variables were all found to be statistically significant predictors of
BI, p < .05. The overall model was statistically significant p < .001, therefore, the null
hypothesis is rejected. As a result, the alternative hypothesis was accepted that there is a
relationship between perceived FC and the adoption of agile development methods.
Table 14
Regression Analysis for FC
Model Unstandardized Standardized Collinearity
Coefficients Coefficient Statistics
B SE β t p Tolerance
1 Constant 1.348 .208 6.476 .000*
FC1 .343 .047 .365 7.316 .000* .548
FC2 .302 .047 .317 6.468 .000* .568
FC4 .112 .040 .126 2.833 .005* .695
Note. F(3,380) = 117.458, p < .001, adj. R2 = .477. Dependent variable: BI.
* individual sub constructs have p < .05. Constant, FC1, FC2, and FC4 are significant.
Relationship of hypotheses to research questions. The hypotheses stemmed from two
types of research questions. The primary question examined the effect of leadership style on the
adoption of agile methods. Secondary questions examined four different constructs from the
UTAUT model (PE, EE, SI, and FC) and their influence on adoption of agile methods. The

107
random survey of 384 users as well as 30 separate users during the pilot study were beneficial in
gaining some insight into the influencers mentioned on the determinant, behavioral intent (BI).
The primary research question asked was to what extent if any does leadership style (LS)
impact the adoption of agile development methods? The following hypothesis were used to
answer this question:
H01: There is no relationship between perceived LS and the adoption of agile development
methods.
HA1: There is a relationship between perceived LS and the adoption of agile development
methods.
The null hypothesis was rejected and LS was shown to have a statistically significant
impact on the intent to adopt agile methods (p < .001). This was shown in Table 10, as measured
by the MLQ-5X instrument. Approximately 24.4% of the variance in the behavioral intent (BI)
to use agile methods was explained by the instrument (Bass & Avolio, 1995). The post-hoc
analysis performed explains that leadership style (LS) when measured on its own merit has a
positive effect on BI (F(7, 376) = 18.692, p< .001, adj. R2 = .244), and adjusted effect of 24.4%.
Furthermore, of the seven LS constructs employed, idealized attributes/influence (IA) and
inspirational motivation (IM) were statistically significant (p < .05). Therefore, IA and IM
variables statistically made a positive contribution to the regression model (Field, 2013). These
results are in line with (Prasad & Junni, 2016). IA and IM are both components of
transformational leadership. Kuntz and Gomes (2012) explained that changes from the norm,
such as making an adoptive change to utilizing agile methods, requires an implicit adjustment
with the right kind of leadership, one that transforms. Van Kelle et al. (2015) further confirmed
the effects of social success factors, with regard to transformational leadership, in the adoption of

108
agile software development. The results of this regression indicated that LS, and in particular IA
and IM, had a positive impact on the adoption of agile methods.
The second research question asked: to what extent if any does performance expectancy
(PE) impact the adoption of agile development methods? The following hypothesis examined
this question:
H02: There is no relationship between PE and the adoption of agile development methods.
HA2: There is a relationship between PE and the adoption of agile development methods.
As with LS, the null hypothesis was rejected and PE was shown to have a significant
statistical impact on the intention to adopt agile methods (p < .001). Table 11 shows the key
results for PE. PE explained 37.5% of the variance in BI to adopt agile method. According to
Venkatesh et al. (2003), PE is one of the biggest predictors for intention to adopt a new
technology. This is in accord then with the results obtained for PE. Of the four internal
constructs, PE1, PE2, and PE4 were statistically significant (p < .05), while contributing to the
overall regression model (Field, 2013). The results of this regression indicate that PE had a
positive effect on the adoption of agile methods.
The third research question asked: to what extent if any does effort expectancy (EE)
impact the adoption of agile development methods? The following hypothesis examined this
question:
H03: There is no relationship between perceived EE and the adoption of agile development
methods.
HA3: There is a relationship between perceived EE and the adoption of agile development
methods.

109
As with PE, the null hypothesis was rejected and EE was shown to have a significant
statistical impact on the intention to adopt agile methods (p < .001). Table 12 shows the key
results for EE. EE explained 39.3% of the variance in BI to adopt agile methods. In Venkatesh
et al.’s (2003) own study, EE accounted for 10% of the variance in intention to adopt a new
technology. All four internal constructs, EE1, EE2, EE3, and EE4 were statistically significant
(p < .05), while contributing to the overall regression model (Field, 2013). One possible reason
behind the disparity between Venkatesh et al.’s results and this study may be in the
understanding of the technology. Agile may be perceived as challenging to understand and
utilize thus the higher degree of variance discovered in the study versus Venkatesh et al. (2003).
According to Venkatesh et al. (2003), one limitation of EE is that intent is decreased as the user
increases their comprehension of the technology. The results of this regression indicate that EE
positively impacts the adoption of agile methods.
The fourth research question asked: to what extent if any does social influence (SI)
impact the adoption of agile development methods? The following hypothesis examined this
question:
H04: There is no relationship between perceived SI and the adoption of agile development
methods.
HA4: There is a relationship between perceived SI and the adoption of agile development
methods.
Like PE and EE, the null hypothesis was rejected and SI was shown to have a significant
statistical impact on the intention to adopt agile methods (p < .001). Table 13 shows the key
results for SI. SI explained 45.6% of the variance in BI to adopt agile methods. Venkatesh et al.
(2003) research showed that SI explained only two percent of the variance in his regression

110
model. In this study, all four of the internal constructs were statistically significant (p < .05) to
the regression model (Field, 2013). It is possible that with the proliferation of technology since
Venkatesh et al.’s (2003) study that more individuals are likely to be influenced by social media
and therefore more likely to adopt a technology with peer pressure as a motivator, thus
accounting for the higher SI variance between Venkatesh and this study. This regression also
indicated that SI positively impacts the adoption of agile methods.
The fifth research question asked: to what extent if any does facilitating conditions (FC)
impact the adoption of agile development methods? The following hypothesis examined this
question:
H05: There is no relationship between perceived FC and the adoption of agile development
methods.
HA5: There is a relationship between perceived FC and the adoption of agile development
methods.
As in PE, EE, and SI, the null hypothesis was rejected and FC was shown to have a
statistical significant impact on the intention to adopt agile methods (p < .001). Table 14 shows
the key results for FC. FC explained 47.6% of the variance in BI to adopt agile methods. Again,
this result was much higher than expected. Venkatesh et al.’s (2003) own study produced a
seven percent explanation for the variance with FC alone. Three of the four internal constructs
(FC1, FC2, and FC4) were statistically significant (p < .05) to the regression model (Field,
2013). One possible explanation for the disparity between the studies is that both personal and
business technology has changed and with it the infrastructure required to use and adopt it. Most
businesses make concerted efforts to provide their employees with the necessary tools that they
required to do their job effectively. This is more pronounced now then back in 2003. These
111
environmental factors affect the willingness to adapt to change (Moghavvemi et al., 2012). As
with PE, EE, SI, this regression was also found to positively impact the adoption of agile
methods.
Post-hoc hierarchical regression analysis. A post-hoc hierarchical regression analysis
was performed in order to predict the dependent variable, behavioral intent (BI), based on the
inclusion of multiple determinants (PE, EE, SI, FC, and LS). This type of statistical analysis
allows for the examination of how much additional variation in the dependent variable can be
explained by the addition of one or more independent variables (Warner, 2013). Any increase or
decrease of R2 in each step could then be inspected (Tabachnick & Fidell, 2013). The new null
and alternate hypotheses of the post-hoc research question are as follows:
H0PH: There is no relationship between perceived PE, EE, SI, FC, LS and the adoption of agile
development methods.
HAPH: There is a relationship between perceived PE, EE, SI, FC, LS and the adoption of agile
development methods.
In order to assess H0PH, the research questions and hypotheses for this study were re-
examined using a five-step hierarchical regression model (Tables 15 to 20). Each table
represents the results obtained after each step in the regression process where an additional
determinant was added to the model. This process was repeated until all determinants were
added to the final model. Table 20, therefore, represents the statistics obtained from the final
model.
The first set of determinants examined were from the UTAUT model. They were added
first, before including any other elements to the regression, as the UTAUT constructs provide the
framework for technology adoption. Following the inclusion of the UTAUT factors, leadership

112
style (LS) constructs were added to complete the model. Adding (LS) factors after the UTAUT
elements allowed for a better understanding of the role of how each of those predictors affect the
overall model and therefore the adoption of agile methods.
Each of the UTAUT four independent variables (PE, EE, SI, and FC) were added to the
hierarchical model in the noted order. This was followed by the addition of seven independent
variables from leadership style (IA, IB, IM, IS, IC, CR, and MBEA) added one at a time to
understand the cumulative influence of each leadership style variable on the behavioral intent to
adopt agile methods but also with respect to the UTAUT constructs already in place. As with all
regressions performed earlier, hierarchical regression analysis also requires that certain criteria
first be satisfied (see the assumptions with regression analysis section).
The independence of observations criteria was met with Durbin-Watson values in the
acceptable range of 1.751 (Field, 2013; Laerd Statistics, 2015). Normal values for Durbin-
Watson should be between 1.5 and 2.5 (Field, 2013). The existence of linearity was supported
through the visual inspection of scatter plots and partial regression plots. The presence of
homoscedasticity was confirmed using scatterplots of the studentized residuals versus the
unstandardized predicted values for each construct, thereby affirming that this assumption was
met (Vogt, 2007). The absence of multicollinearity was affirmed through the visual inspection
of Tolerance/VIF values. All values were found to be within the acceptable range as all
tolerance values were greater than 0.1 (Field, 2013). The presence of outliers, leverage, and
influential points were tested using casewise diagnostics, studentized deleted residuals, and
leverage points. Several values during the five step regression were found to be outside of the
acceptable tolerance range of studentized deleted residuals greater than ±3 standard deviations.
Those values were examined with respect to Cook’s D and found to be within the acceptable

113
range, all less than 1. Residuals were found to be normally distributed as confirmed through the
visual inspection of P-P plots and Q-Q plots of studentized residuals. Thus, all criteria for the
regression assumptions were satisfied.
The first construct that was added to the hierarchical regression was performance
expectancy (PE). This UTAUT construct examined the research question of “What is the impact
of perceived performance expectancy (PE) on the adoption of agile development methods?” The
related null hypothesis stated that, “There is no relationship between perceived PE and the
adoption of agile development methods.” Table 15 displays the results of the hierarchical
multiple regression model adding performance expectancy (PE) to the model. The overall model
was statistically significant (p < .001) and accounted for 37.5% of the variance in the adoption of
agile methods. This finding provided evidence to support the rejection of the null hypothesis.
PE contributed positively to the model. PE was found to be a positive contributor to the
behavioral intent to adopt agile methods (p < .001; see Table 15).
Table 15
Step One of Hierarchical Regression Model
Unstandardized Standardized Coefficients Coefficient
Variable B SE β t p
Constant
2.213
.199
11.145
.000*
PE
.627 .041 .614 15.205 .000*
Note. Full Model: F(1, 382) = 231.191, p < .001, adj. R2 = .375. Dependent variable: BI. Step One of Hierarchical
Regression Model Predicting Agile Development Methods Acceptance. Based on Performance Expectancy (N=384)
* individual item has p < .001. Constant and PE are significant.
The second construct that was added to the regression was effort expectancy (EE). This
UTAUT construct examined “What is the impact of perceived leadership style (LS) on the
adoption of agile development methods?” The related null hypothesis predicted that, “There is

114
no relationship between perceived EE and the adoption of agile development methods.” Table
16 displays the results of the hierarchical multiple regression model for EE as well as PE and the
BI dependent variable predicting the adoption of agile development methods. The overall model
was significant (p < .001) and accounted for 42.5% of the overall variance in agile methodology
adoption. This finding provided evidence to support the rejection of the null hypothesis. Both
PE and EE contributed positively to the model. The combination of PE and EE had a positive
effect on the behavioral intent to adopt agile methods (see Table 16).
Table 16
Step Two of Hierarchical Regression Model
Note. Full Model: F(2, 381) = 198.456, p < .001, adj. R2 = .425. ∆ R2 = .032, p < .001
Dependent variable: BI. Step Two of Hierarchical Regression Model Predicting Agile Development Methods
Acceptance. Based on Previous Variables Now Adding in Effort Expectancy (N = 384)
* individual item has p < .001. Constant, PE and EE are significant.
The third construct added to the regression model was social influence (SI). This
UTAUT construct examined “What is the impact of perceived social influence (SI) on the
adoption of agile development methods?” The related null hypothesis predicted that, “There is
no relationship between perceived SI and the adoption of agile development methods.” Table 17
displays the results of the hierarchical multiple regression model after adding social influence
(SI) to the model. The overall model was statistically significant (p < .001) and accounted for
50.3% of the variance in the adoption of agile methods. This finding provided support to reject
the null hypothesis. Two of the three independent variables that were part of step three of the
Unstandardized Standardized Coefficients Coefficient
Variable B SE β t p
Constant
1.595
.218
7.307
.000*
PE
EE
.312
.422
.067
.073
.305
.382
4.638
5.808
.000*
.000*
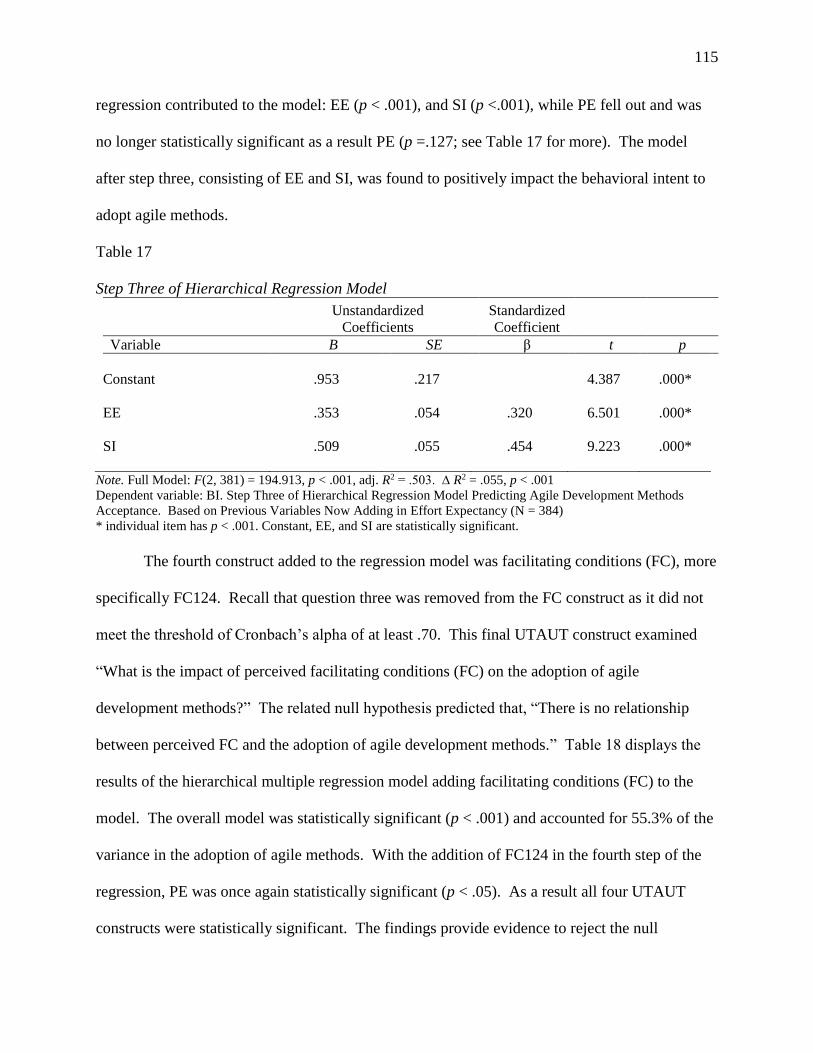
115
regression contributed to the model: EE (p < .001), and SI (p <.001), while PE fell out and was
no longer statistically significant as a result PE (p =.127; see Table 17 for more). The model
after step three, consisting of EE and SI, was found to positively impact the behavioral intent to
adopt agile methods.
Table 17
Step Three of Hierarchical Regression Model
Unstandardized Standardized Coefficients Coefficient
Variable B SE β t p
Constant
.953
.217
4.387
.000*
EE
SI
.353
.509
.054
.055
.320
.454
6.501
9.223
.000*
.000*
Note. Full Model: F(2, 381) = 194.913, p < .001, adj. R2 = .503. ∆ R2 = .055, p < .001
Dependent variable: BI. Step Three of Hierarchical Regression Model Predicting Agile Development Methods
Acceptance. Based on Previous Variables Now Adding in Effort Expectancy (N = 384)
* individual item has p < .001. Constant, EE, and SI are statistically significant.
The fourth construct added to the regression model was facilitating conditions (FC), more
specifically FC124. Recall that question three was removed from the FC construct as it did not
meet the threshold of Cronbach’s alpha of at least .70. This final UTAUT construct examined
“What is the impact of perceived facilitating conditions (FC) on the adoption of agile
development methods?” The related null hypothesis predicted that, “There is no relationship
between perceived FC and the adoption of agile development methods.” Table 18 displays the
results of the hierarchical multiple regression model adding facilitating conditions (FC) to the
model. The overall model was statistically significant (p < .001) and accounted for 55.3% of the
variance in the adoption of agile methods. With the addition of FC124 in the fourth step of the
regression, PE was once again statistically significant (p < .05). As a result all four UTAUT
constructs were statistically significant. The findings provide evidence to reject the null

116
hypothesis. Several variables contributed to the model. Adding FC124 to PE, EE, and SI
positively impacted the behavioral intent to adopt agile methods (see Table 18).
Table 18
Step Four of Hierarchical Regression Model
Unstandardized Standardized Coefficients Coefficient
Variable B SE β t p
Constant
.642
.213
3.021
.003**
PE
EE
SI
FC124
.147
.142
.261
.382
.065
.070
.066
.059
.144
.129
.232
.342
2.270
2.038
3.978
6.490
.024*
.042*
.000***
.000***
Note: Full Model: F(4, 379) = 119.560, p < .001, adj. R2 = .553. ∆ R2 = .005, p < .001
Dependent variable: BI.
Step Four of Hierarchical Regression Model Predicting Agile Development Methods Acceptance. Based on
Previous Variables Now Adding in Facilitating Conditions (N = 384)
* individual items have p < .05. PE, EE are significant.
** individual item has p < .005. Constant is significant.
*** individual items have p < .001. SI and FC124 are significant.
The fifth construct added to the regression model was leadership style (LS). With the
UTAUT constructs now in place, demonstrating the established statistically significant adoption
of technology, LS constructs were introduced. Adding the (LS) factors at this point in time, after
the UTAUT elements, provided a better understanding how each LS predictor effects the overall
model and consequently leadership style on the adoption of agile methods. LS is composed of a
combination of the following seven independent variables: idealized attributes (IA), idealized
behaviors (IB), inspirational motivation (IM), intellectual stimulation (IS), individual
consideration (IC), contingent reward (CR), and management by exception – active (MBEA).
All seven LS constructs were added to the regression with only IM (p = .001) and IC (p = .046)
demonstrating statistical significance with IM positively and IC negatively contributing to the

117
overall regression that included the four UTAUT independent variables (PE, EE, SI, FC124).
The complete results, including non-statistically significant LS constructs are shown in the Table
19 below:
Table 19
Step Five of Hierarchical Regression Model - LS
Unstandardized Standardized Coefficients Coefficient
Variable B SE β t p
IA
IB
IM
IS
IC
CR
MBEA
.046
.041
.291
.005
-.167
-.022
-.045
-
-
.087
-
.084
-
-
-
-
.173
-
-.099
-
-
.802
.709
3.348
.084
-2.000
-.360
-1.113
.423
.479
.001**
.933
.046*
.719
.266
Note. IA, IB, IS, CR, and MBEA are non-significant. Step Five of Hierarchical Regression Model Predicting Agile
Development Methods Acceptance. Based on Previous Variables Now Showing only Leadership Style Constructs
(N = 384)
* individual item has p < .05. IC is significant.
** individual item has p < .005. IM is significant.
The fifth construct as noted above examined leadership style specifically “What is the
impact of perceived leadership style (LS) on the adoption of agile development methods?” The
related null hypothesis predicted that, “There is no relationship between perceived LS and the
adoption of agile development methods.” Table 20 displays the results of the hierarchical
multiple regression model with the addition of those LS variables that were statistically
significant IM (p = .001) and IC (p = .046). The final model indicates that LS (IM and IC) is
statistically significant. IM and IC are constructs found in transformational leadership. This is
consistent with other findings that transformational leadership has shown significance when
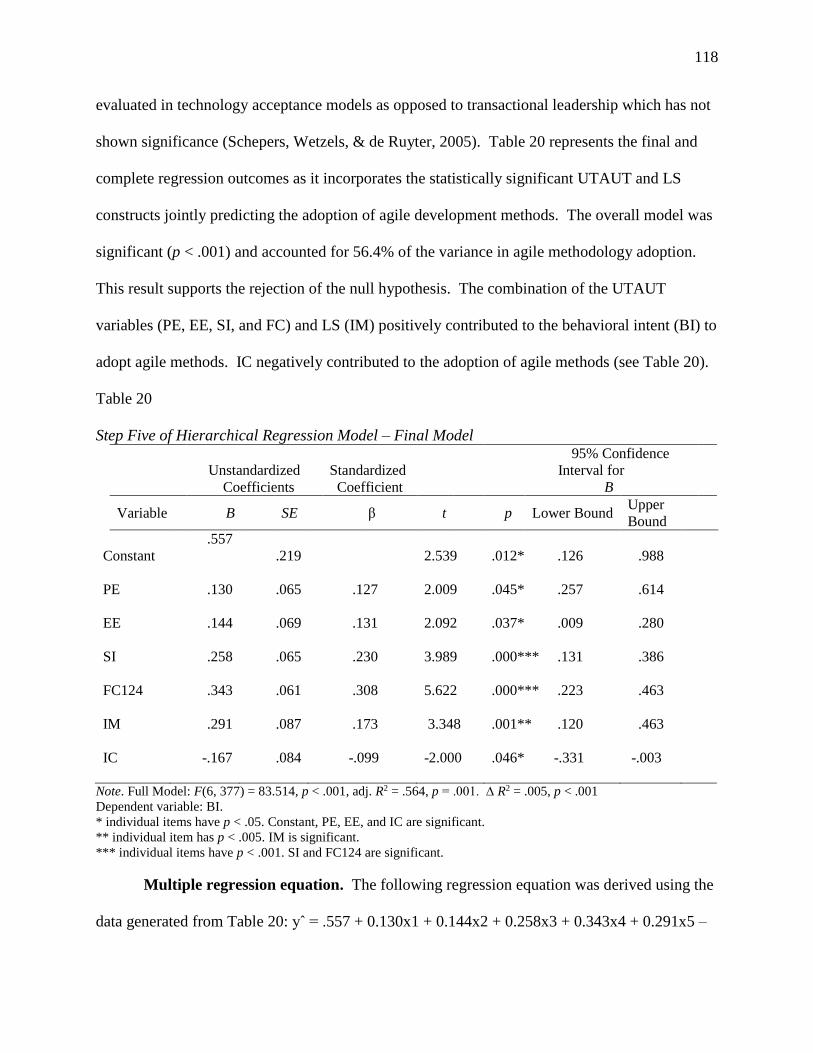
118
evaluated in technology acceptance models as opposed to transactional leadership which has not
shown significance (Schepers, Wetzels, & de Ruyter, 2005). Table 20 represents the final and
complete regression outcomes as it incorporates the statistically significant UTAUT and LS
constructs jointly predicting the adoption of agile development methods. The overall model was
significant (p < .001) and accounted for 56.4% of the variance in agile methodology adoption.
This result supports the rejection of the null hypothesis. The combination of the UTAUT
variables (PE, EE, SI, and FC) and LS (IM) positively contributed to the behavioral intent (BI) to
adopt agile methods. IC negatively contributed to the adoption of agile methods (see Table 20).
Table 20
Step Five of Hierarchical Regression Model – Final Model
Unstandardized Standardized
95% Confidence
Interval for
Coefficients Coefficient B
Variable B SE β t p Lower Bound Upper
Bound
Constant
.557
.219
2.539
.012* .126
.988
PE
EE
SI
FC124
IM
IC
.130
.144
.258
.343
.291
-.167
.065
.069
.065
.061
.087
.084
.127
.131
.230
.308
.173
-.099
2.009
2.092
3.989
5.622
3.348
-2.000
.045* .257
.037* .009
.000*** .131
.000*** .223
.001** .120
.046* -.331
.614
.280
.386
.463
.463
-.003
Note. Full Model: F(6, 377) = 83.514, p < .001, adj. R2 = .564, p = .001. ∆ R2 = .005, p < .001
Dependent variable: BI.
* individual items have p < .05. Constant, PE, EE, and IC are significant.
** individual item has p < .005. IM is significant.
*** individual items have p < .001. SI and FC124 are significant.
Multiple regression equation. The following regression equation was derived using the
data generated from Table 20: yˆ = .557 + 0.130x1 + 0.144x2 + 0.258x3 + 0.343x4 + 0.291x5 –
119
0.167x6. This equation makes it possible to predict the behavioral intent (BI) to adopt agile
methods. BI is represented by yˆ, .557 represents the constant in the model, while the values of
0.130 + 0.144 + 0.258 + 0.343 + 0.291, and -0.167 represent the slope coefficients for PE, EE,
SI, FC, IM, and IC, respectively. Furthermore, the "Lower Bound" and "Upper Bound" columns
found under the "95% Confidence Interval for B" column represent the upper and lower
boundaries of the plausible slope values. For instance, there is a 95% certainty that the slope for
FC will fall between 0.223 and 0.463. As an example, with every one unit increase in FC, there
is a 0.343 increase in BI. The other five slope coefficients work the same way each affecting the
dependent variable BI by the value of their coefficient. Combined, in a single equation, they
each play a significant role in predicting the value of BI. The final model, included LS (IM, IC),
PE, EE, SI, and FC. LS (IM), PE, EE, SI, and FC positively impact the behavioral intent (BI) to
adopt agile methods, while LS(IC) negatively impact the BI to adopt agile methods. With
respect to the regression equation, the most influential constructs from largest to smallest were as
follows: FC124, IM, SI, EE, PE, and IC. These findings are discussed throughout the remaining
sections.
Post-hoc g*power analysis. A post-hoc G*Power analysis was performed to ascertain
the power of this study. The study’s initial sample size of N = 384 was determined using Krejcie
and Morgan’s (1970) table (see Table 1). This initial sample size was a worst case scenario
given the population of 1.25 Million in 2016 software developers in the U.S., according to the
Bureau of Labor Statistics. The G*Power analysis allows researchers to conduct post-hoc
analysis given the sample population (N), the significance level (α), and effect size (f2). Alpha
also represents the probability of making a type I error. Given those parameters the power (1 –
β) can be computed, that is 1 minus the probability of having a type II error. In other words,

120
power, (1 – β) is the probability of correctly rejecting the null hypothesis or simply stated, not
making a type II error. The larger that power is and the closer that power approaches 1 the better
and the less likelihood of resulting in a type II error.
Power was calculated using the following values either entered directly or calculated
before being used: N = 384, α = .05, f2 (calculated using the tool with the result of that
computation being placed back into the tool in order to compute power), and adj. R2 = .564
(Faul, Erdfelder, Lang, & Buchner, 2007). Using the values from above results in a reported
power of “1.0000000.” This translates into a 100% chance of correctly rejecting the null
hypothesis. In other words, there is a zero chance of making a type II error. A perfect 100%
chance of this type of result is not possible of course and merely marks a limitation of the
reporting capability of the G*Power tool. This occurs due the extremely low value for β <
.0000000. Thus, when power (1 – β) is calculated it is similar to subtracting 1 from .0000000,
which results in “1.0000000” reported by the tool. The net effect of this result provides an
extremely high level of assurance in the results.

121
Figure 9. Post-hoc G*Power calculation with the parameters used in the study.
It is interesting to note that the generally accepted power is β = .80 making this an
extremely powerful result and consequently study (Aberson, 2011). Finally, with α = .05 there is
a 95% certainty of not making a type I error (rejecting the null hypothesis when it is in fact true).
Summary of the findings. The study focused on answering five research questions
centered about the prospective influence of leadership style as well as the four prominent
UTAUT constructs of performance expectancy, effort expectancy, social influence, and
facilitating conditions on the adoption of agile software development methods. Demographic
data were presented at first, followed by an assessment for suitability to conduct multiple
regression analysis on the data. Several statistical evaluations were performed to ensure that

122
multiple regression was an appropriate instrument for the study. After the choice was confirmed,
the dependent variable BI was regressed on the mean of each construct in the study’s model.
Each of the null hypothesis proposed were rejected providing evidence for the existence of a
positive relationship or effect of each of the constructs on the adoption of agile methods. Table
21 below shows a summary of the regression analysis for each individual construct from the first
part of the study (Models 1 – 5) as well as the overall results when combining all six constructs
from the second part of the study (Model 6).
Table 21
Summary of Regression Analysis Model Factors F Regression df Residual df p Adj. R2
1 PE 58.538 4 373 .000* .375
2 EE 62.968 4 379 .000* .393
3 SI 81.144 4 379 .000* .456
4 FC124 117.458 3 380 .000* .477
5 LS 18.692 7 376 .000* .244
6 All 83.514 6 377 .000* .564 Note. Dependent variable: BI. *Each model was statistically significant. (p < .001).
A post-hoc, stepwise, hierarchical regression analysis was conducted in order to predict
the dependent variable, behavioral intent (BI), based on the independent variables (PE, EE, SI,
FC, and LS). The final model was statistically significant (p < .001) and accounted for 56.4% of
the variance explained in the adoption of agile methods. Six variables individually significantly
contributed to the overall model. Those variables were PE (p < .05), EE (p < .05), SI (p < .001),
FC124 (p < .001), IM (p < .005), and IC (p < .05). This is consistent with finding in other
studies (Venkatesh et al., 2003). The results (see Table 20) indicate that all six constructs (PE,
EE, SI, FC, IM and IC) were significant. Both IM and IC represent transformational leadership
constructs. It can be concluded based on these findings that leadership style, specifically
transformational leadership (IM), has a positive impact on the adoption of agile methods. It is

123
also true that transactional leadership has little to no effect on the intent to adopt agile methods.
Meanwhile, the largest factors to positively impact the intent to adopt agile methods include
having facilitating conditions in place (FC124), inspirational motivation from leadership (IM),
the effect of social influence (SI), the amount of effort expected or required to adopt agile
methods (EE), and the expectation to improve work performance as a motivating factor to adopt
agile methods (PE). Finally, independent consideration had a small negative effect on the
adoption of agile methods.
Applications to Professional Practice
This study contributed to further understanding of the knowledge gap with regard to how
leadership style affects the adoption of agile software development methods. The study found
that leadership style (IM) has a positive impact on the adoption of agile methods, while
leadership style (IC) had a negative impact on the adoption of agile methods. With respect to the
hierarchical regression, the most influential style was found to be that of the transformational
leadership (IM and IC). More specifically, IM had a positive impact and IC had a negative
impact on the adoption of agile methods. The findings imply that inspirationally motivation
(IM) positively impacts a subordinates desire to adopt agile methods, which those who practice
individual consideration (IC) negatively impact a subordinates desire to adopt agile methods.
Based on these results a recommendation can be made for organizations that practicing IM can
serve as a catalyst to positively impact followers to adopt agile methods. Transactional
leadership through inference was shown to have little or no impact on the adoption of agile
methods. The study therefore determined that those software developers who work or worked in
settings that ascribed to a more transformational leadership approach were more likely to adopt
the use of agile software development. In contrast, software developers who work or have

124
worked in a more transactional leadership environment were less likely to embrace the adoption
of agile software development. These results are critical in the context of beginning to
understand what types of influencing factors are pivotal when it comes to making the decision to
adopt agile methods.
The findings of this research can also be viewed from a different perspective, that is, to
examine why software developers choose not to adopt agile methods. For instance, projects
using agile software development methods were shown to have a 400% higher level of success
than traditional methods, they were only utilized 30% of the time as opposed to 44% usage for
traditional methods (Standish Group, 2015). Some reasons for this illogicality rests in the fact
that traditional methods have been around longer, IT managers are more familiar with them so
they feel a sense of safety in using them. Another reason is that the adoption of agile methods
requires a cultural shift for the entire organization. This is not an easy change to make,
especially in the public sector. Lastly, traditional methods have defined sequential steps that are
known and easy to follow. Furthermore, organizations can use this information to better
understand themselves and the role transformational leadership plays for those companies that
are currently using agile methods but additionally for those that are contemplating adopting agile
techniques.
The findings can also equip organizations (HR for instance) in their hiring decisions,
especially if they are currently working in an agile environment and they have not had the level
of success that was expected. On an individual scale, performance expectancy (PE), effort
expectancy (EE), social influence (SI), and facilitating conditions (FC), all constructs of the
UTAUT model used in this study, were each found to have a positive impact on the adoption of
agile methods. This demonstrates that leadership style (transformational) is not the only

125
influencing factor in the behavioral intent of the software developer. As with leadership style,
knowing which constructs influence agile adoption, allows organizations to make informed in-
flight decisions on their internal personnel or place the right type of leader in place.
Lastly, through the use of the multiple regression equation developed in this study,
organizations now have a new tool to use where they can examine the individual factors (PE, EE,
SI, FC, LS (IM and IC) and their respective influence, but also their magnitude and consequently
their effect on the adoption of agile methods. Real-world recommendations is suggested in the
next section.
Transformational leadership was identified as being the statistically significant leadership
style when it comes to adopting agile methods. Parallels with transformational leadership can be
drawn from the Bible. There is no greater example of a transformational leader than Jesus
Christ. Transformational leaders provide a clear vision for their followers. Jesus did this on a
number of occasions, communicating visions of the future to his disciples (Matthew 16:13-28;
Luke 24:46-49). Transformational leaders express confidence in those they lead. In Matthew
16:12-18, Jesus tells Peter that he is His rock upon which Jesus will built His church.
Transformational leaders empower their followers to achieve the vision. A great example of this
is in Acts 1:18 where the Holy Spirit comes upon the disciples allowing them to become more
powerful in their ability to witness for Him. Given that this type of leadership was effective for
Christ, it should not come as a surprise that the same type of leadership (transformational) was
the one most statistically significant leadership type among software developers in making the
decision to adopt agile methods.

126
Recommendations for Action
Using the regression equation developed it is easy to see that facilitating conditions
(FC124) has the biggest impact on the adoption of agile methods. Organizations that are limited
in monetary resources and want to make the switch to agile methods could place their resources
on creating an infrastructure that will support agile methods. This may include training and
hiring of experts and consultants. Leadership style, specifically transformational (IM), showed a
positive impact on the behavioral intent to adopt agile software development methods. Based on
this finding, organizations seeking or entertaining the idea of utilizing agile software
development practices should develop a hiring process that includes for the evaluation of a
candidate’s leadership style, specifically one that includes transformational leadership
characteristics, specifically the ability to motivate others through inspiration. Conversely, IC
showed a negative impact on the adoption of agile methods. This result indicates that the
adoption of agile methods is not predicated on leaders who spend time understanding the
individualized needs and concerns of each subordinate. Inspirational motivation (IM), however,
was the second biggest factor in the regression equation after FC124. As such, hiring and
maintaining inspirational leaders will have a positive effect on the adoption of agile methods.
This can be accomplished through the use of any number of tools available to HR that evaluate
personality types and leadership styles including the MLQ – self rater survey for leaders.
Another recommendation, this time geared towards those organizations that currently
have agile practices in place, is to evaluate the leadership in place and provide further feedback
and training where needed. Learning opportunities such as training leaders helps to ensure that
management is promoting a culture of transformational leadership which is conducive to the
success and flourishment of agile practices. In order to make this happen, evaluations and

127
training must be part of the organization’s overall annual budget. These types of events must be
planned and executed systematically as part of HR annual practices.
Social influence (SI) is another big contributor towards the adoption of agile methods
after FC124 and LS (IM). Peers are very influential in how other employees respond, change,
and adopt to new conditions and tools. Therefore, it make sense that SI would also have a
positive effect. Individual consideration LS (IC) in contrast has a negative, although minor,
impact according to the regression equation. One reason for this could be the fact that it is
challenging at best as a leader to be able to understand each individual’s motivation and what
drives him or her to adopt agile methods. Everyone’s motivation is different and could possibly
be conflicting with others, thereby promoting a negative influence on the adoption of agile
methods.
A final recommendation, again for those organizations that are already actively engaged
in the use of agile methods, would be to put together a training program that begins with the
evaluation of internal employees. The goal of such a training program would be to identify
potential transformational leaders within the organization and train them to be the
transformational leaders of tomorrow. While the identification of such potential leaders and
training is critical to the on-going success of the organization, it would not have to be budgeted
necessarily annually, but rather as the need arises. Some examples would include organizational
growth and expansion, additional hires, and attrition of leadership from key positions.
Recommendations for Further Study
The same study could also be conducted using a different population, focusing
exclusively on members from the public sector. Despite the increasing adoption and use of agile
software development (ASD) there is an information gap on the adoption of these methodologies

128
in government organizations (Vacari & Prikladnicki, 2015). A future study could also
incorporate demographics as predictors such as gender, age, and experience. The study made
use of MLQ-5X as the primary survey instrument for assessing leadership style. While the
MLQ-5X is arguably the most known instrument of its type, it is limited in that it measures
specifically for transformational, transactional, and laissez-faire styles of leadership. Therefore,
another option for a future study could be with the use of alternative instruments that are able to
assess other types of leadership styles and their effects on agile software development adoption.
Finally, since this study found that transformational leadership (IM) had a positive impact on
leadership style, it may be worthwhile investigating the characteristics of inspirational
motivation in order better to understand why it has a positive impact within this type of
leadership.
Reflections
The doctoral research process is a demanding and strenuous journey that demands
attention to detail, an acceptance that there will be setbacks along the way, but one that requires
discipline and resolve to see the investigation through to its completion. I had a strong desire to
examine the effects of leadership style on the adoption of agile software development methods,
having worked within a state government organization that seemingly overnight and surprisingly
made the jump from a predominately traditional software development approach (waterfall). I
have worked in the IT field under the direction of varying leadership styles. Thus, I had a deep
desire to examine the role of leadership on the intent to adopt agile software development
methods. The results of the study affirmed certain preconceptions held by myself that a
managerial style that exhibits transformational characteristics plays a statistically significant role
in the adoption of agile methods (see Hypothesis 1).
129
The main challenge of this study was securing the required number of completed surveys
(384) from software developer panelist in the public sector domain. Organizations that focus on
obtaining panelist for research could not guarantee more than a fraction of the total required.
Due to the DBA program’s time limitation constraints, the risk of obtaining that many surveys
and not completing the study versus adjusting the population demographic and finishing the
research did not justify keeping with the original proposal. This setback, at the time, was
eventually rectified by extending the survey to include both public sector and private industry
personnel. It is important to note that I did not have any influence on the participants as they
were randomly chosen by Survey Gizmo and remained anonymous to me. Another obstacle, this
time in the data, was the discovery of what were then thought to initially be outliers. Additional
research was necessary on understanding of how to properly identify outliers, their effects on the
regression model, and solutions. The outliers turned out to be inconsequential as to their effect
on the regression model negligible. I benefited from the temporary setback by gaining a deeper
understanding on how to the data analysis process works while obtaining real-world experience
in the discipline.
Leadership is extensively discussed throughout the Bible. Some of the leaders that come
to mind include Moses, King Solomon, and King David. The greatest of all leaders is of course
is Jesus Christ. Jesus exhibited the true essence of leadership, transforming everyone that He
encountered during His shortened life on Earth. One trademark of transformational leadership is
the ability for a leader to present a clear vision that is appealing to his or her followers. Jesus
frequently communicated and explained his vision for the Kingdom as well as future events.
This is evidenced by the incredible amount of people that followed him and bought into His
vision. According to the Pew Research Center, there were 2.2 Billion Christians worldwide in

130
2015, representing the largest religious group in the world. Another quality of transformational
leadership is the level of trust and confidence that leaders place in those that follow them. An
example of this is when Jesus places His trust in Peter telling him that he is the “rock” on which
He will build His church upon. Transformational leaders also empower others by placing them
in positions to be successful so that their vision can be accomplished. On the day of Pentecost,
the Holy Spirit came upon His disciples giving them the ability to speak in tongues, thus making
it possible to fulfill His vision of spreading the gospel to all ends of the Earth. It should come as
no surprise then that transformational leadership is a very effective approach with regards to
bringing about drastic change as Jesus was able to do. Similarly a radical change is essential
with respect to the change required when considering adopting an agile methodology, especially
in a traditional culture that prescribes to a sequential methods approach.
Summary and Study Conclusions
This quantitative correlational study was designed to examine the relationship (if any)
between leadership style and the adoption of agile software development methods. The study
used the Venkatesh et al. (2003) UTAUT model which included four constructs: effort
expectancy (EE), performance expectancy (PE), social influence (SI), and facilitating conditions
(FC). The model was extended to incorporate a fifth construct, leadership style (LS). The five
constructs served as the independent variables while behavioral intent (BI) represented the lone
dependent variable. The study combined two sets of surveys. The first consisted of questions
from the UTAUT model and examined EE, PE, SI, and FC. The second set of questions were
from the MLQ-5X survey, an instrument that examines LS. The study population consisted of
software developers in the U.S. who have previously or are currently working under a leader.

131
Survey Gizmo provided 414 completed surveys for the study, of which 30 were used in a pilot
study while the remaining 384 were used in the formal study.
The primary question for the study asked to what extent if any does LS impact the
adoption of agile development methods? The study’s findings showed a positive relationship
between LS (IM) and the adoption of agile methods. Conversely, IC had a negative impact on
the adoption of agile methods). LS was able to explain approximately 24.4% of the variance in
the behavioral intent (BI) to adopt agile methods before the addition of other independent
variables to the regression equation. This is consistent with the literature (Prasad & Junni, 2016).
Van Kelle et al. (2015) used regression analysis in order to identify social success factors in agile
software development. Van Kelle et al.’s study (2015) demonstrated that of those influences
studied, transformational leadership was the most significant predictor of success. Similarly, this
study identified individual consideration (IC) and inspirational motivation (IM), both
transformational leadership constructs of LS, as the primary influencing factors (the former
having a negative impact and having a positive impact) for the BI to adopt agile methods.
Similar results were confirmed by Van Kelle et al. (2015). A post-hoc hierarchical regression
analysis was conducted that included PE, EE, SI, and FC, and LS. When all constructs are
combined, the synergistically result in an adjusted effect size of 56.4% which is considered large
(Cohen, 1988). Furthermore, LS (IM and IC) was statistically significant in the final model.
This indicates that LS, specifically transformational leadership (IM), positively impacts BI to
adopt agile methods. Meanwhile, IC, also a component of transformational leadership, had a
negative impact on the adoption of agile methods. An inference can also be made that
transactional leadership has minimal to no impact on the adoption of agile methods. Therefore,
it is recommended that business managers focusing their attention on inspiring their subordinates
132
and directing them towards a shared vision, in this case adopting agile methods rather than
negotiating with a follower by promising something and in exchange adopt agile methods. FC
influences BI the most. FC is followed in order of magnitude by IM, SI, EE, PE, and IC to a
smaller extent (see the regression equation for more information).
Finally, a post-hoc G*Power analysis was performed to help quantify the power of the
study where a worst case sample population was used N = 384, to compute the power of the
study (1 – β). The results obtained indicated that the probability of correctly rejecting a false null
hypothesis (not making a type II error) is approximately 100% or (β = 1). This is due to the large
effect size f2 = 1.293 and adj. R2 of .564 used in the study. This outcome a very powerful in light
of the generally accepted power of (β = .80) used in most studies, thereby making the results
even more reliable.
In conducting the study, I sought to provide companies with new information that can
benefit two types of organizations. The first type, are those entities that currently have agile
methods in place and utilize those practices on a daily basis in either a majority or all of their
efforts. Based on the results of the study, the first type of organizations stand to benefit by
recognizing the value of making use of transformational leadership (IM, IC) for the improvement
and continued use of agile methods. These types of organizations can use this information to
develop training programs for their current leaders that reinforce transformational leadership
qualities and skills, but also provide a culture that is supportive to the hiring of transformational
leaders that support agile methods.
The second type of organization is considering making the switch from a traditional
sequential methodology approach, such as waterfall, to one that makes use of agile methods in its
software development process. The study suggests that PE, EE, SI, FC, and LS (IM and IC) are

133
all critically influential factors that contribute towards a successful adoption of agile methods.
This second type of organization stands to benefit from this study through understanding of the
biggest influencing factors in the regression equation. Using this information, organizations of
this kind can put in place facilitating conditions such as the proper infrastructure, training, and
tools to be successful. Transformational leadership style, specifically inspirational motivation,
was the second biggest factor in the successful adoption of agile methods (see the regression
equation for information for the complete list of influential coefficients with respect to the
adoption of agile methods).
The study was a success in that the results of this research closes the gap in the literature
concerning leadership style and the adoption of agile software development methods for software
developers in the U.S. The results provide a clear indication that LS (IM) has a positive impact
in the adoption of agile methods as do EE, PE, SI, and FC. Conversely, IC had a negative impact
on the adoption of agile methods. Finally, as discussed earlier, this study may be replicated
using a different demographic such as local, state, or federal government employees. This study
may also serve as a starting point to better understand how specific aspects of transformation
leadership play in the role to adopt a given technology, such as agile methods.

134
References
Aberson, C. L. (2011). Applied power analysis for the behavioral sciences. New York, NY:
Routledge. doi:10.4324/9780203860274
Abu-Al-Aish, A., & Love, S. (2013). Factors influencing students’ acceptance of m-learning: An
investigation in higher education. International Review of Research in Open and
Distance Learning, 14(5).
Adler, M., & Ziglio. E. (1996). Gazing into the oracle: The Delphi method and its application to
social policy and public health. London, UK: Jessica Kingsley Publishers.
Aga, D. A., Noorderhaven, N., & Vallejo, B. (2016). Transformational leadership and project
success: The mediating role of team-building. International Journal of Project
Management, 34, 806-818. doi:10.1016/j.ijproman.2016.02.012
Ahmad, M. O., Markkula, J., & Oivo, M. (2013). Kanban in software development: A systematic
literature review. Paper presented at the 9-16. doi:10.1109/SEAA.2013.28
Ajzen, I. (1985). From intentions to actions: A theory of planned behavior. Springer Series in
Social Psychology (pp. 11-39). Berlin, GE: Springer.
Ajzen, I. (1991). The theory of planned behavior. Organizational Behavior and Human Decision
Processes, 50, 179-211.
Ajzen, I., & Fishbein, M. (1980). Understanding attitudes and predicting social behavior.
Englewood Cliffs, NJ: Prentice-Hall.
Allen, I. E., & Seaman, C. A. (2007). Likert scales and data analyses. Quality Progress, 40(7),
64-65.

135
Alshamrani, A., & Bahattab, A. (2015). A comparison between three SDLC models waterfall
model, spiral model, and Incremental/Iterative model. International Journal of Computer
Science Issues (IJCSI), 12(1), 106-111.
Ambler, S. (2013). 2013 IT project success rates survey results. Retrieved from
http://www.ambysoft.com/surveys/success2013.html
Avolio, B. J., & Bass, B. M. (2004). Multifactor leadership questionnaire (MLQ). Mind Garden,
29.
Bagozzi, R. P. (2007). The legacy of the technology acceptance model and a proposal for a
paradigm shift. Journal of the Association for Information Systems, 8(4), 243-254.
Basahel, A. (2015). Adopting scrum agile project management for managing academic
institutions. B V I C A M's International Journal of Information Technology, 7(1), 795-
798.
Bass, B. M. (1985). Leadership and performance beyond expectation. New York, NY: Free
Press.
Bass, B. M., & Avolio, B. J. (1990). Manual for the Multifactor Leadership Questionnaire. Palo
Alto, CA: Consulting Psychologists Press.
Bass, B. M., & Avolio, B. J. (1992). Multifactor leadership questionnaire-short form 6S.
Binghamton, NY: Center for Leadership Studies.
Bass, B. M., & Avolio, B. J. (1995). MLQ multifactor leadership questionnaire technical report.
Binghamton University, NY: Center for Leadership Studies.
Bass, B. M., & Avolio, B. J. (2004). Multifactor Leadership Questionnaire: Manual and sampler
set (3rd ed.). Redwood City, CA: Mind Garden.
Beck, K. (1999). Embracing change with extreme programming. Computer, 32, 70-77.

136
Bagheri, H., Shirzadmehr, A., & Rezaei, M. (2015). Designing and fabrication of new
molecularly imprinted polymer-based potentiometric nano-graphene/ionic liquid/carbon
paste electrode for the determination of losartan. Journal of Molecular Liquids, 212, 96-
102.
Biro, B. (1997). Beyond success: The 15 secrets to effective leadership and life based on
legendary coach John Wooden’s Pyramid of Success. Hamilton, MT: Pygmalion.
Boehm, B. (1988). Spiral model of software development and enhancement. Computer, 21(5),
61-72. doi:10.1109/2.59
Bonner, N. A. (2010). Predicting leadership success in agile environments: an inquiring systems
approach. Academy of Information and Management Sciences Journal, 13(2), 83-103.
Buckhurst, K. (2017, November 17). Agile IT delivery challenges government DNA.
GovTech.com. Retrieved from http://www.govtech.com/budget-finance/Agile-IT-
Delivery-Challenges-Government-DNA-Industry-Perspective.html
Burns, J. M. (1978). Leadership. New York, NY: Harper & Row.
Burns, S., & Roberts, L. (2013). Applying the theory of planned behaviour to predicting online
safety behaviour. Crime Prevention and Community Safety, 15(1), 48-64.
doi:10.1057/cpcs.2012.13
Carter, L., Ludwig, C. S., Hobbs, J., & Campbell, R. (2011). The role of security and trust in the
adoption of online tax filing. Transforming Government: People, Process and Policy,
5(4), 303-318. doi:10.1108/17506161111173568
Chu, R. I. M. (2011). Conflict management styles of pastors and organizational servant
leadership: A descriptive study (Unpublished doctoral dissertation). Southern Baptist
theological Seminary, Louisville, Kentucky.
137
Cockburn, A. (2005). Crystal clear — A human-powered methodology for small teams. Boston,
MA: Addison-Wesley.
Cockburn, A., & Highsmith, J. (2001). Agile software development, the people factor.
Computer, 34(11), 131-133. doi:10.1109/2.963450
Cohen, J. (1988). Statistical Power Analysis for the Behavioral Sciences (2nd ed.). New York,
NY: Academic Press.
Comiskey, C., Curtis, E. A., & Dempsey, O. (2016). Importance and use of correlational
research. Nurse Researcher (2014+), 23(6), 20. doi: 10.7748/nr.2016.e1382
Conboy, K., Coyle, S., Wang, X., & Pikkarainen, M. (2011). People over process: key people
challenges in agile development. IEEE Software, 99, 47-57.
Cook, R. D. (1977). Detection of influential observation in linear regression. Technometrics,
19(1), 15-18. doi:10.1080/00401706.1977.10489493
Cooper, D. R., & Schindler, P. S. (2008). Business research methods. New York, NY: McGraw-
Hill/Irwin.
Cornelius, D. A. (2014). The value of scrum to organizations: A case study (Order No. 3674139).
Available from ProQuest Dissertations & Theses Global. (1614428022). Retrieved from
http://ezproxy.liberty.edu/login?url=http://search.proquest.com.ezproxy.liberty.edu
/docview/1614428022?accountid=12085
Creswell, J. W. (2009). Research design: Qualitative, quantitative, and mixed methods
approaches. Thousand Oaks, CA: Sage.
Creswell, J. W. (2014). Research design: Qualitative, quantitative and mixed methods
approaches (4th ed.). Thousand Oaks, CA: Sage.
138
Cronbach, L. J. (1951). Coefficient alpha and the internal structure of tests. Psychometrika,
16(3), 297-334.
Cutcher-Gershenfeld, J., & McGregor, D. (2006). The human side of enterprise. New York, NY:
McGraw-Hill.
Davis, F. D., Bagozzi, R. P., & Warshaw, P. R. (1989). User acceptance of computer technology:
A comparison of two theoretical models. Management Science, 35(8), 982-1003.
Denning, S. (2013). Why Agile can be a game changer for managing continuous innovation in
many industries. Strategy & Leadership, 41(2), 5-11. doi:10.1108/10878571311318187
Dyba, T. (2000). An instrument for measuring key factors of success in software process
improvement. Empirical Software Engineering, 5(4), 357-390.
Ekufu, T. K. (2012). Predicting cloud computing technology adoption by organizations: An
empirical integration of technology acceptance model and theory of planned behavior.
(Doctoral dissertation). ProQuest Dissertations and Theses database. (1143076636).
Esfahani, H. C. (2012). Transitioning to agile: A framework for pre-adoption analysis using
empirical knowledge and strategic modeling (Doctoral dissertation, University of
Toranto). ProQuest Dissertations and Theses database.
Faul, F., Erdfelder, E., Lang, A., & Buchner, A. (2007). G*Power 3: A flexible statistical power
analysis program for the social, behavioural, and bioedical sciences. Behavior Research
Methods, 39(2), 175-191.
Fiaz, M., Su, Q., & Saqib, A. (2017). Leadership styles and employees' motivation: Perspective
from an emerging economy. Journal of Developing Areas, 51(4), 143-156.
Fiedler, F., E. (1967). A contingency model of leadership effectiveness. New York, NY:
McGraw-Hill.

139
Field, A. (2013). Discovering statistics using IBM SPSS statistics. Thousand Oaks, CA: Sage.
Fishbein, M. (1967). Attitudes and the prediction of behavior. In M. Fishbein (Ed.), Readings in
attitude: Theory and measurement (pp. 477-492). New York, NY: Wiley.
Fishbein, M., & Ajzen, I. (1975). Belief, attitude, intention, and behavior: An introduction to
theory and research. Reading, MA: Addison-Wesley.
Fowler, F. J. (2009). Survey research methods (4th ed.). Thousand Oaks, CA: Sage.
Fowler, F. J. (2014). Survey research methods. Boston, MA: Sage.
Gangwar, H., Date, H., & Raoot, A. D. (2014). Review on IT adoption: insights from recent
technologies. Journal of Enterprise Information Management, 27(4), 488-502.
Gast, D. L., & Ledford, J. R. (Eds.). (2014). Single case research methodology: Applications in
special education and behavioral sciences. New York, NY: Routledge.
Goduka, N. (2012). From positivism to indigenous science: A reflection on world views,
paradigms and philosophical assumptions. Africa Insight, 41(4), 123-138.
Gupta, B., Dasgupta, S., & Gupta, A. (2008). Adoption of ICT in a government organization in a
developing country: An empirical study. Journal of Strategic Information Systems, 17,
140-154.
Hamidi, K. (2014). Agile software development, and its limitations (Order No. 1526256).
Available from ProQuest Dissertations & Theses Global. (1657347226). Retrieved from
http://ezproxy.liberty.edu/login?url=https://search-proquest-com.ezproxy
.liberty.edu/docview/1657347226?accountid=12085
Hansenne, R., & Hibner, A. (2011). Overcoming Organisational Challenges related to Agile
Project Management Adoption. MBA Thesis, Blekinge Institute of Technology,
Karlskrona, Sweden.

140
Hardgrave, B. C., & Johnson, R. A. (2003). Toward an information systems development
acceptance model: The case of object-oriented systems development. IEEE
Transactions on Engineering Management, 50(3), 322-336.
Harrison, L. (2017, November 17). Survey: Government still has a long ways to go in adopting
agile. GovTech.com. Retrieved from http://www.govtech.com/biz/Survey-Government-
Still-Has-a-Ways-to-Go-in-Adopting-Agile.html
Hartman, F., & Ashrafi, R. A. (2002). Project management in the information systems and
information technologies industries. Project Management Journal, 33(3), 5-15.
Hoyt, W. T., Leierer, S., & Millington, M. J. (2006). Analysis and interpretation of findings
using multiple regression techniques. Rehabilitation Counseling Bulletin, 49(4), 223-233.
Smolović Jones, S., Smolović Jones, O., Winchester, N., & Grint, K. (2016). Putting the
discourse to work: On outlining a praxis of democratic leadership development.
Management Learning, 47(4), 424-442.
Karahanna, E., Agarwal, R., & Angst, C. M. (2006). Reconceptualizing compatibility beliefs in
technology acceptance research. MIS Quarterly, 781-804.
Kautz, K., Johansen, T. H., & Uldahl, A. (2016). The perceived impact of the agile development
and project management method scrum on team leadership in information systems
development. In Transforming Healthcare through Information Systems
(pp. 167-183). Springer, Cham.
Kloppenborg, T. J., Tesch, D., & Manolis, C. (2014). Project success and executive sponsor
behaviors: Empirical life cycle stage investigations. Project Management Journal, 45(1),
9-20.
141
Kong, S. (2007). Agile software development methodology: Effects on perceived software quality
and the cultural context for organizational adoption. Newark, NJ: Rutgers The State
University of New Jersey-Newark.
Korhonen, K. (2013). Evaluating the impact of an agile transformation: a longitudinal case study
in a distributed context. Software Quality Journal, 21(4), 599-624.
Kotrlik, J. W., & Higgins, C. C. (2001). Organizational research: Determining appropriate
sample size in survey research. Information Technology, Learning, and Performance
Journal, 19(1), 43-50.
Krejcie, R. V., & Morgan, D. W. (1970). Determining sample size for research activities.
Educational and Psychological Measurement, 30(3), 607-610.
Krishnaswamy, D., Aggarwal, P., Daley, R. S., Renschler, M., & Lundqvist, P. (2009). U.S.
Patent Application No. 12/268,905. U.S. Patents.
Kuntz, J. R. C., & Gomes, J. F. S. (2012). Transformational change in organizations: A
self-regulation approach. Journal of Organizational Change Management, 25(1),
143-162
Lacort, M. O. (2014). Descriptive and inferential statistics: Summaries of theories and exercises
solved. Morrisville, NC: Lulu.com.
Laerd Statistics. (2015). Simple linear regression using SPSS Statistics. Statistical tutorials and
software guides. Retrieved from https://statistics.laerd.com/
Lambert, T. (2011). Cross sectional study of agile software development methods and project
performance (Order No. 3457416). Available from ProQuest Dissertations & Theses
Global. (873820775). Retrieved from http://ezproxy.liberty.edu/login?url=https:
//search-proquest-com.ezproxy.liberty.edu/docview/873820775?accountid

142
=12085
Larman, C. (2004). Agile and iterative development: A manager’s guide. Boston, MA: Addison-
Wesley.
Larman, C., & Basili, V. R. (2003). Iterative and incremental development: A brief history. IEEE
Computer Society, 36(6), 47-56.
Lawal, G. A. (2015). Leadership styles and adoption of information technology in the Nigerian
ministry of foreign affairs (Order No. 3712578). Available from ProQuest Dissertations
& Theses Global. (1709243605). Retrieved from http://ezproxy.liberty.edu/login
?url=https://search-proquest-com.ezproxy.liberty.edu/docview/1709243605
?accountid=12085
Lazzari, Z. (2018, August 14). 5 Different Types of Leadership Styles. Small Business -
Chron.com. Retrieved from http://smallbusiness.chron.com/5-different-types-leadership-
styles-17584.html
Lee, A., & Levy, Y. (2014). The effect of information quality on trust in e-government systems’
transformation. Transforming Government: People, Process and Policy, 8(1), 76-100.
Leedy, P. O., & Ormrod, J. E. (2013). Practical research planning and design (10th ed.). Upper
Saddle River, NJ: Pearson Education.
Lee-Kelley, L., & Kin Leong, L. (2003). Turner's five-functions of project-based management
and situational leadership in IT services projects. International Journal of Project
Management, 21(8), 583-591.
Litchmore, K. A. (2016). A comparative study of agile methods, people factors, and process
factors in relation to project success (Doctoral dissertation, Capella University).
Retrieved from www. search.proquest.com

143
Maiocco, K. A. (2017). A quantitative examination of the relationship between leadership and
organizational commitment in employees of faith-based organizations (Order No.
10690559). Available from Dissertations & Theses @ Liberty University;
ProQuest Dissertations & Theses Global. (2002376245). Retrieved from
http://ezproxy.liberty.edu/login?url=https://search-proquest-com
.ezproxy.liberty.edu/docview/2002376245?accountid=12085
Malik, A., Kumra, R., & Srivastava, V. (2013). Determinants of consumer acceptance of m-
commerce. South Asian Journal of Management, 20(2), 102-126.
Mathieson, K. (1991). Predicting user intentions: Comparing the technology acceptance model
with the theory of planned behavior. Information Systems Research, 2(3), 173-191.
Merriam, S. B., & Tisdell, E. J. (2015). Qualitative research: A guide to design and
implementation. Hoboken, NJ: John Wiley & Sons.
Mertler, C. A., & Vannatta, R. A. (2013). Advanced and multivariate statistical methods. Los
Angeles, CA: Pyrczak.
Meyer, B. (2014). Agile: The good, the hype and the ugly. Berlin, GE: Springer Science &
Business Media.
Millhollan, C. (2015). A phenomenological study of factors that influence project manager
efficacy: The role of soft skills and hard skills in IT-centric project environments (Order
No. 3702340). Available from ProQuest Dissertations & Theses Global. (1682496611).
Retrieved from http://ezproxy.liberty.edu/login?url=https://search.proquest.com
/docview/1682496611?accountid=12085

144
Miloloža, I. (2018). Impact of leadership styles on enterprise success in the area of knowledge
and human resource management. Managing Global Transitions, 16(2), 103-122.
doi:10.26493/18s4-693s.16.103-122
Misra, S. C. (2007). Adopting agile software development practices: Success factors, changes
required, and challenges (Order No. NR27106). Available from ProQuest Central;
ProQuest Dissertations & Theses Global. (304888117). Retrieved from
http://ezproxy.liberty.edu/login?url=https://search-proquest-com
.ezproxy.liberty.edu/docview/304888117?accountid=12085
Mishra, S. (2014). Adoption of M-commerce in India: Applying theory of planned behavior
model. Journal of Internet Banking & Commerce, 19(1), 1-17.
Moghavvemi, S., Salleh, N. A. M., Zhao, W., & Mattila, M. (2012). The entrepreneur's
perception on information technology innovation adoption: An empirical analysis of the
role of precipitating events on usage behavior. Innovation: Management, Policy &
Practice, 14(2), 231-246.
Morgan, G. A., Leech, N. L., Gloeckner, G. W., & Barrett, K. C. (2013). IBM SPSS for
introductory statistics: Use and interpretation (5th ed.). New York, NY: Routledge.
Mueller, T. J. (2014). Factors influencing the decision to employ agile methods on federal
information technology projects (Order No. 3620432). Available from ProQuest
Dissertations & Theses Global. (1537427075). Retrieved from http://ezproxy
.liberty.edu/login?url=http://search.proquest.com.ezproxy.liberty.edu
/docview/1537427075?accountid=12085

145
Nelson, F. F. (2016). An analysis of information technology factors that influence the lack of
adoption of agile scrum methodology: A qualitative study (Order No. 10156661).
Available from ProQuest Dissertations & Theses Global. (1839259407).
Retrieved from http://ezproxy.liberty.edu/login?url=https://search
-proquest-com.ezproxy.liberty.edu/docview/1839259407
?accountid=12085
Neufeld, D. J., Dong, L., & Higgins, C. (2007). Charismatic leadership and user acceptance of
information technology. European Journal of Information Systems, 16(4), 494-510.
doi:10.1057/palgrave.ejis.3000682
Northouse, P. G. (2016). Leadership theory and practice (7th ed.). Thousand Oaks, CA: Sage.
Nuottila, J., Aaltonen, K., & Kujala, J. (2016). Challenges of adopting agile methods in a public
organization. International Journal of Information Systems and Project Management,
4(3), 65-85. doi:10.12821/ijispm040304
O'Dwyer, L. M., & Bernauer, J. A. (2013). Quantitative research for the qualitative researcher.
Thousand Oaks, CA: Sage.
Oreg, S., & Berson, Y. (2011). Leadership and employees’ reactions to change: the role of
leaders’personal attributes and transformational leadership style. Personnel Psychology,
64(3), 627-659.
Oye, N. D., Aiahad, N., & Abrahim, N. (2014). The history of UTAUT model and its impact on
ICT acceptance and usage by academicians. Education and Information Technologies,
19(1), 251-270. doi:10.1007/s10639012-9189-9

146
Pace, M. (2019). A correlational study on project management methodology and project success.
Journal of Engineering, Project, and Production Management. doi:10.2478/jeppm-2019-
0007
Patten, M. L. (2009). Understanding research methods: An overview of the essentials. Glendale,
CA: Pyrczak Publishing.
Pedersen, M. (2013). A quantitative examination of critical success factors comparing agile and
waterfall project management methodologies (Doctoral dissertation, Capella University;
Order No. 3602588). Available from ProQuest Central; ProQuest Dissertations & Theses
Global. (1468678982). Retrieved from http://ezproxy.liberty.edu/login?url=https
://search-proquest-com.ezproxy.liberty.edu/docview/1468678982
?accountid=12085
Pittenger, D. J. (2001). [Review of the multifactor leadership questionnaire for research], the
fourteenth mental measurements yearbook. Lincoln, NE: Buros Institute of Mental
Measurements.
PMI. (2018). Success in Disruptive Times [PDF] (10th ed., p. 11). Retrieved from
https://www.pmi.org/-/media/pmi/documents/public/pdf/learning/thought-
leadership/pulse/pulse-of-the-profession-2018.pdf?sc_lang_temp=en
Prasad, B., & Junni, P. (2016). CEO transformational and transactional leadership and
organizational innovation: The moderating role of environmental dynamism.
Management Decision, 54(7), 1542-1568. doi:10.1108/MD-11-2014-0651
Raines, D. A. (2013). Are you statistically literate? A basic overview of statistics. Neonatal
Network, 32(4), 289-294.

147
Rehman, M., Esichaikul, V., & Kamal, M. (2012). Factors influencing e-government adoption in
Pakistan. Transforming Government: People, Process and Policy, 6(3), 258-282.
doi:10.1108/17506161211251263
Rogers, E. M. (1962). Diffusion of innovations. New York, NY: Free Press.
Rogers, E. M. (1995). Diffusion of innovations (4th ed.). New York, NY: Free Press.
Rosacker, K. M., & Olson, D. L. (2008). Public sector information system critical success
factors. Transforming Government: People, Process and Policy, 2(1), 60-70.
doi:10.1108/17506160810862955
Rowold, J. (2005). Psychometric properties of the German translation by Jens Rowold. Mind
Garden, Inc., 1-28. Retrieved from http://www.mindgarden.com/search?controller
=search&orderby=position&orderway=desc&search_query=Multifactor
+Leadership +Questionnaire+++Psychometric+properties+of+the
+German+translation+by+Jens+Rowold+#horizontalTab1
Royce, W. W. (1987, March). Managing the development of large software systems: concepts
and techniques. In Proceedings of the 9th international conference on Software
Engineering (pp. 328-338). IEEE Computer Society Press.
Satalkar, B. (2011). Comparison between waterfall model and spiral model. Retrieved from
http://www.buzzle.com/articles/waterfall-model-vs-v-model.html
Schepers, J., Wetzels, M., & de Ruyter, K. (2005). Leadership styles in technology acceptance:
do followers practice what leaders preach?. Managing Service Quality: An International
Journal, 15(6), 496-508.

148
Schneberger, S., Amoroso, D. L., & Durfee, A. (2007). Factors that influence the performance of
computer-based assessments: An extension of the technology acceptance model. The
Journal of Computer Information Systems, 48(2), 74-90.
Serben, D. F. (2014). The examination of factors influencing social media usage by African
American small business owners using the UTAUT model (Order No. 3613968).
Available from ProQuest Central. (1529461309). Retrieved from http://ezproxy
.liberty.edu/login?url=https://search-proquest-com.ezproxy.liberty.edu
/docview/1529461309?accountid=12085
Sidky, A. (2007). A structured approach to adopting agile practices: The agile adoption
framework (Order No. 3288679). Available from ProQuest Dissertations & Theses
Global. (304791169). Retrieved from http://ezproxy.liberty.edu/login?url=http:
//search.proquest.com.ezproxy.liberty.edu/docview/304791169
?accountid=12085
Solinski, A., & Petersen, K. (2016). Prioritizing agile benefits and limitations in relation to
practice usage. Software Quality Journal, 24(2), 447-482.
Spencer, A. J., Buhalis, D., & Moital, M. (2012). A hierarchical model of technology adoption
for small owner-managed travel firms: An organizational decision-making and leadership
perspective. Tourism Management, 33(5), 1195-1208. doi:10.1016 /j.tourman
.2011.11.011
Standish Group International. (2014). The chaos report. Retrieved from http://www
.standishgroup.com/custom_chronicles/showfile.php?File=ChaosManifest2013.pdf
Standish Group International. (2015). The chaos report. Retrieved from https://www.infoq
.com/articles/standish-chaos-2015

149
Starke, R. E. (2010). Qualitative research. New York, NY: The Guildford Press.
Swanson, R. A., & Holton, E. F. (2005). Research in organizations: Foundations and methods in
inquiry. San Francisco, CA: Berrett-Koehler Publishers, Inc.
Sweeney, M. (2014). Agile vs waterfall: Which method is more successful? Retrieved from
http://clearcode.cc/2014/12/agile-vs-waterfall-method/
Tabachnick, B. G., & Fidell, L. S. (2013). Using multivariate statistics (6th ed.). Upper Saddle
River, NY: Pearson.
Taylor, S., & Todd, P. A. (1995). Understanding information technology usage: A test of
competing models. Information Systems Research, 6(2), 144-176.
Thapliyal, P., & Thakre, G. D. (2017). Correlation study of physicochemical, rheological, and
tribological parameters of engine oils. Advances in Tribology. doi:
10.1155/2017/1257607
Thompson, B. (2015). Servant, leader, or both? A fresh look at Mark 10:35-45. The Journal of
Applied Christian Leadership, 9(2), 54-65.
Thompson, R. L., Higgins, C. A., & Howell, J. M. (1991). Personal computing: toward a
conceptual model of utilization. MIS Quarterly, 125-143.
Tseng, S. M. (2017). Investigating the moderating effects of organizational culture and
leadership style on IT-adoption and knowledge-sharing intention. Journal of Enterprise
Information Management, 30(4), 583-604. doi:10.1108/JEIM-04-2016-0081
Turner, J. R., & Müller, R. (2006). Choosing appropriate project managers: Matching their
leadership style to the type of project. Newtown Square, PA: Project Management
Institute.

150
U.S. Census Bureau. (2017, May). May 2017 national occupational employment and wage
estimates United States. Retrieved from https://www.bls.gov/oes/current/oes_nat.htm
U.S. Census Bureau. (2017, July). Population estimates, July 1, 2017, (V2017). Retrieved
February 17, 2019, from http://www.census.gov/quickfacts/
Vacari, I., & Prikladnicki, R. (2015). Adopting agile methods in the public sector: a systematic
literature review. In Embrapa Informática Agropecuária-Artigo em anais de congresso
(ALICE). In International Conference on Software Engineering and Knowledge
Engineering, 27, 2015, Pittsburgh. Proceedings... Pittsburgh: Pittsburgh
University, 2015.
Van Kelle, E., Visser, J., Plaat, A., & Van Der Wijst, P. (2015). An empirical study into social
success factors for agile software development. Proceedings of the 37th International
Conference on Software Engineering, 1, 77-80. doi:10.1109/CHASE.2015.24
Venkatesh, V. L., Morris, M. G., Davis, G. B., & Davis, F. D. (2003). User acceptance of
information technology: Toward a unified view. MIS Quarterly, 27(3), 425-478.
Venkatesh, V. L., Thong, J. Y., & Xu, X. (2012). Consumer acceptance and use of information
technology: Extending the unified theory of acceptance and use of technology. MIS
Quarterly, 36(1), 157-178.
Vogt, P. (2007). Quantitative research methods for professionals. Boston, MA: Allyn and
Bacon.
Waldman, D. A., & Yammarino, F. J. (1999). CEO charismatic leadership: levels-of-
management and levels-of-analysis effects. Academy of Management Review, 24(2), 266-
285.
Warner, R. M. (2013). Applied statistics: From bivariate through multivariate techniques (2nd

151
ed.). Thousand Oaks, CA: Sage.
Weber, M. (1947). Max Weber: The theory of social and economic organization. New York,
NY: The Free Press.
Wright, G. P. (2013). Success rates by software development methodology in information
technology project management: A quantitative analysis (Order No. 3590342). Available
from ProQuest Dissertations & Theses Global. (1431540788). Retrieved from
http://ezproxy.liberty.edu/login?url=https://search-proquest-com.ezproxy
.liberty.edu/docview/1431540788?accountid=12085
Wright, K., & Capps, C. (2011). A survey of information systems development project
performance. Academy of Information and Management Sciences Journal, 14(1), 87-105.
Young, R. (2010). Evaluating the perceived impact of collaborative exchange and formalization
on information security. Journal of International Technology and Information
Management, 19(3), 19-37.
Yuen, K., & Ortiz, G. A. (2017). Outlier detection and robust regression for correlated data.
Computer Methods in Applied Mechanics and Engineering, 313, 632-646.
doi:10.1016/j.cma.2016.10.004
Zhu, W., Sosik, J. J., Riggio, R. E., & Yang, B. (2012). Relationships between transformational
and active transactional leadership and followers' organizational identification: The role
of psychological empowerment. Journal of Behavioral and Applied Management,
13(3), 186-212.
Zhuplatova, I. (2015). A correlational study of transformational and transactional leadership
and organizational commitment in small entrepreneurial firms (Order No. 10089542).
Available from ProQuest Dissertations & Theses Global. (1779253234). Retrieved

152
from http://ezproxy.liberty.edu/login?url=https://search-proquest-com.ezproxy
.liberty.edu/docview/1779253234?accountid=12085
153
Appendix A: IRB Approval

154
Appendix B: Permission to Use UTAUT Model Image
Subject: RE: Request for permission to use your UTAUT Model
Hello Mike,
I have a meeting tomorrow with Dr. Venkatesh and I will speak to him on this. You can use this
email as an approval to use UTAUT for your study. Let me know if any questions.
Have a blessed day :)
______________________________________________________________________________
Subject: Request for permission to use your UTAUT Model
Greetings Dr. Venkatesh,
I am a doctoral candidate in the School of Business at Liberty University working on my
dissertation. I am writing to you today to seek permission to expand on your UTAUT model
from the source provided below for my dissertation. My study involves technology acceptance,
in this case agile software development and I would be adding a leadership style independent
variable to your model to test for correlation in adopting the use of agile. My population will be
the public sector (provided that I can find enough individuals to reply to my survey). Please let
me know if you have any questions for me and of course if I may proceed with using your
model. Here is the document that I am referencing from your research:
“User acceptance of information technology: Toward a unified view,” by V. Venkatesh et al.,
2003, MIS Quarterly, 27, p. 447. Copyright 2003 MIS Quarterly and the Society for Information
Management.
Thank you for your time!
Mike Kipreos
Assistant Professor of Computer Science & Information Systems
School of Business (434) 582-7444
Liberty University | Training Champions for Christ since 1971

155
Appendix C: Permission to Use the UTAUT Instrument
Hello Mike,
I have forwarded your request to your website administrator. Not to hold you back, you can take
this email as an approval to use the instrument. Though, its very strange that you are the only one
facing issues. We get request from everywhere and they never encountered problem with their
request.
Have a blessed day!
Ankur
______________________________________________________________________________
Subject: RE: Request for permission to use your UTAUT Model
Ankur,
I would like to thank you and Dr. Venkatesh for permission to use the UTAUT diagram in my
dissertation. With this email, I would like to ask for permission to use the UTAUT instrument as
part of my survey questions. The title of my research is The Impact of Leadership Style on the
Adoption of Agile Software Development: A Correlational Study. The intent of my research is to
study the adoption and use of agile methods, as a technology, among software developers.
May I have permission to utilize the UTAUT instrument for my research?
Thank for your time and consideration in this matter,
Mike Kipreos
Doctoral Candidate, Liberty University

156
Appendix D: Permission to Use MLQ-5X Instrument

157