impact of leadership style on employee … · issn: 2289-4519 page 114 through proper leadership....
TRANSCRIPT
ISSN: 2289-4519 Page 112
International Journal of Accounting & Business Management
www.ftms.edu.my/journals/index.php/journals/ijabm
Vol. 5 (No.2), November, 2017
ISSN: 2289-4519 DOI: 24924/ijabm/2017.11/v5.iss2/112.130
This work is licensed under a
Creative Commons Attribution 4.0 International License.
Research Paper
IMPACT OF LEADERSHIP STYLE ON EMPLOYEE PERFORMANCE (A
CASE STUDY ON A PRIVATE ORGANIZATION IN MALAYSIA)
Abdul Basit Lecturer
School of Accounting & Business Management
FTMS College, Malaysia
Veronica Sebastian
MBA Graduate
Lord Ashcroft International Business School
Anglia Ruskin University, UK
Zubair Hassan Senior Lecturer
School of Accounting & Business Management
FTMS College, Malaysia
ABSTRACT
The purpose of this study is to identify the impact of leadership style on employee
performance. A sample size of 100 was used from one private organization in Selangor,
Malaysia using convenience sampling technique. The study used quantitative approaches,
and a questionnaire was designed. A five-point Likert scale questionnaire was used to
determine the impact of leadership style on employee performance. SPSS software was used
in analysing the questionnaires. Demographic analysis, normality test, reliability test
(Cronbach’s Alpha), descriptive analysis and regression analysis were presented. Descriptive
statistics show that the most significant value associated with employee performance is
democratic leadership style followed by laissez-faire leadership style and autocratic
leadership style. Democratic leadership style has the highest mean value corresponding to
3.784 and standard deviation value of 0.8124, laissez-faire leadership style scores the second
highest mean value corresponding to 3.416 and standard deviation value of 0.5858, and
autocratic leadership style has the lowest mean value corresponding to 3.404 and standard
deviation value of 0.7330 indicating that autocratic leadership style is poorly correlated with
employee performance. Regression coefficient analysis shows that there is a significant and
positive impact of democratic and laissez-faire leadership styles on employee performance.
Autocratic leadership style beta coefficient value is -0.168 with a significant value of 0.025
which is higher than 0.01, hence autocratic leadership is found to have a negative significant
impact on employee performance.
Key Terms: Leadership; Employee Performance; Democratic Leadership; Autocratic Leadership;
Laissez-faire Leadership
ISSN: 2289-4519 Page 113
1. INTRODUCTION
The purpose of this study is to investigate the impact of leadership style on employee
performance in private companies and governmental agencies in Malaysia. Leadership is
simply “the art of influencing people so that they will strive willingly towards the
achievement of goals” (Igbaekemen, 2014). Leadership plays a crucial role in creating an
enthusiastic atmosphere and culture in an organization (Alghazo & Al-Anazi, 2016).
Hurduzue (2015) proclaimed that effective leadership style could promote excellence in the
development of the members of the organisation. According to Skoogh (2014), it is safe to
say that leadership has played an important role since the dawn of history of mankind.
Since corporations strive to search great leaders that can lead them to success, endless
efforts have been put out by researchers to identify how best leaders operate. As a result,
many leadership theories had been developed over the years. Lewin’s Leadership Style
(1939) identified that there are three different leadership styles; democratic, autocratic and
laissez-faire (Billig, 2015). In 1964, “Grid” was established by Robert Blake and Jane
Mouton (Molloy, 1998). Hersey and Blanchard (1969) developed a leadership theory that is
now known as the situational leadership theory (McCleskey, 2014). In 1970’s,
transformational theory which focused on motivations and values in measuring how leaders
approach power was developed by Burns (1978) and was later expanded by Bass (1985)
(Levine, 2000). Bass (1985) transformational leadership theory focused on how a leader
influences followers by his/her qualities (Levine, 2000).
The importance of leadership style is not unknown and it is shown by a significant
number of studies that have been conducted on leadership style in developed and developing
countries (Babatunde, 2015; Iqbal, et al., 2015; Mohammed, et al., 2014; Paracha, et al.,
2012; Zumitzavan & Udchachone, 2014). Lewin’s leadership style, however, appears to be a
significant subject where leadership style is concerned as various studies have been
conducted on Lewin’s leadership style (Bhatti, et al., 2012; Khan, et al., 2015; Leng, et al.,
2014; Anbazhagan & Kotur, 2014; Yao, et al., 2017; Ping, 2015; Omolayo, 2007; Benjamin,
2015; Longe, 2014; Kotur & Anbazhagan, 2014). In Malaysia particularly, similar kind of
studies have also been conducted (Arham, 2014; Leng, et al., 2014; Nasir, et al., 2014; Lo, et
al., 2009; Soha, et al., 2016).
In Malaysia, employees especially in governmental agencies are long criticized for
poor performance, lack of flexibility, inefficiency, poor accountability and red tape (Said, et
al., 2015). Leadership in Malaysia has long been linked with preference for hierarchy and
relationship (Ansari, et al., 2004). According to Hofstede (2001), Malaysia is best known as a
place where leaders have the most authority and power, laws and regulations are set by the
leaders, and leaders control and they are the decision maker (Jayasingam & Cheng, 2009). As
stated by Ansari, et al. (2004), Malaysian employees are obliged to obey, implement and they
do not allowed disagreeing with their leaders. “Seniors (superiors or elders) are respected and
obeyed. They are the decision-makers and subordinates are obliged to implement. In general,
societal norm dictates that juniors do not disagree with seniors. Thus anger and hostility
against a superior are suppressed and displaced, and the tendency is to appease the superior”
(Ansari, et al., 2004; Jayasingam & Cheng, 2009).
This research sought to investigate and understand the impact of different leadership
styles (autocratic, democratic and laissez-faire) and their effects on employee performance in
organization. After completion the study on this topic, this research will be beneficial for
employees to identify which leadership style is good for them in terms of work satisfaction
and the success of their careers. It can be beneficial for leaders to understand which types of
leadership impacts on employee performance and how employees can also be motivated

ISSN: 2289-4519 Page 114
through proper leadership. It is helpful to companies in Malaysia too in identifying great
leaders that can improve performance of the company and lead the company to great success.
Research Objectives
To examine the impact of Democratic Leadership Style on Employee Performance
To examine the impact of Autocratic Leadership Style on Employee Performance
To examine the impact of Laissez-Faire Leadership Style on Employee Performance
2.0. LITERATURE REVIEW
Tannenbaum, Weschler and Mussarik (1961) defined leadership as “interpersonal
influence exercised in a situation and directed, through the communication process, toward
the attainment of the specialized goal or goals” ( cited in Ali, 2012). According to Northouse
(2004), leadership is directing a group of people to accomplish designated goal ( cited in
Packard, 2009). Yukl (2008) defined leadership as a process where one person exerted
influence intentionally to a group of people in an organization through relationship, structure,
and guide. Leadership, as defined by Gharibvand (2012) is how the leader communicates in
general and relates to people, the way in which the leader motivates and trains the
subordinates and the way leaders provides direction to his/her team to execute their tasks.
Sharma & Jain (2013) defined leadership as a process of which a person influences other
people to accomplish an objective and directing in a way that makes it more cohesive and
coherent.
Dahl (1989) and Fishkin (1991) proclaimed that democratic leadership influences people in a
manner consistent with the basics of democratic principles and processes, such as
deliberation, equal participation, inclusiveness and self-determination (cited in Gastil, 1994).
According to White & Lippitt (1960), democratic leaders actively encourage and stimulate
group decisions and group discussions ( cited in Choi, 2007). Kuczmarski and Kuczmarski
(1995) defined characteristic of democratic leaders as influential, helpful, knowledgeable, a
good listener, encouraging, guiding, respecting and situation-centered ( cited in Ray & Ray,
2012). Mullins (1999) stated that democratic leadership style centralised more on people and
interaction is greater within the group (cited in Puni, et al., 2014).
In accordance to Khan, et al. (2015), autocratic leadership is where manager retains as
much power and decision-making authorisation as possible. Melling & Little (2004) stated
that autocratic leaders are high-handed leaders and are the centre of every activities that go on
in the establishment and all authority emanated from them and ends with them (cited in Akor,
2014). According to Iqbal, et al. (2015), autocratic leaders are characterized by an “I tell”
philosophy; autocratic leaders tell other people what to do. Nwankwo (2001) and Enoch
(1999) described autocratic style as a leadership style where leaders exclusively make
decisions and production is emphasized at the expense of any human consideration (cited in
Akor, 2014).
Deluga (1992) proclaimed that laissez-faire leadership style is associated with
unproductiveness, ineffectiveness and dissatisfaction (cited in Koech & Namusonge, 2012).
According to Bass & Avolio (1997) and Hartog & Van Muijen (1997), laissez faire leaders
avoid making decisions, the provision of rewards and the provision of positive/negative
feedback to subordinates (cited in Mester, et al., 2003). Jones & Rudd (2007) described
laissez-faire leadership as leadership in an inactive form characterized by unwillingness to be
actively involved and a view that the best leadership comes from disassociation from
activities. Cilliers, Van Eeden & Van Deventer (2008) stated that these leaders avoid active
ISSN: 2289-4519 Page 115
participation in responsibility of goals setting and avoid being involved when leadership
direction is needed (cited in Ejimabo, 2015).
Kurt Lewin and colleagues (White, Lewin & Lippitt, 1939; Lewin, 1948) defined
three classical styles of leadership in decision making: autocratic, democratic and laissez-
faire (Billig, 2015). Gastil (1994) proclaimed that democratic leaders believe in group
participation and majority rule in the decision making, autocratic leadership style imposes
tight control and expects obedience and laissez-faire leadership style has low involvement of
activities, leaving matters to their followers and very little involvement in decisions making.
“Grid” was first established by Robert Blake and Jane Mouton and was published in
1964 (Molloy, 1998). Blake and Mouton’s (1982) managerial grid reflected two dimensions
of leadership; “Concern for People” reflecting to the degree to which leader care for team
member’s needs, areas of personal development and interest when deciding how best to
achieve goal, whereas “Concern for Production” refers to the degree how leader focuses on
company productivity, efficiency and objectives when deciding how best to achieve goals
(Bolden, et al., 2003).
Situational leadership originally was developed by Hershey and Blanchard (1969;
1979; 1996) to describe leadership style and stress the need to connect leadership style to the
maturity level of the followers (cited in McCleskey, 2014). According to Graeff (1997) and
Grint (2011), this theory emphasized that instead of applying just one leadership style,
successful leaders should change the leadership style based on the details of tasks and the
maturity of their followers as well as having a rational understanding of a situation (cited in
McCleskey, 2014).
Empirical Studies
Ojokuku, et al. (2012) conducted a research on the Impact of leadership Style on
Organizational Performance: A Case Study of Nigeria Bank in Nigeria. The sample size used
by the researchers is 60. The study contained twenty of random picked banks in Ibadan,
Nigeria. A structured questionnaire was used to collect data from the heads of accountants,
heads of operations, and branch managers on face-to-face basis. Inferential statistical tool was
used and one hypothesis was formulated to analyse data. Regression analysis was used to
study the dimensions of significant effect of leadership style on followers and performance.
The findings showed that there was positive and negative correlation between performance
and leadership style. There was 23 percent variance of performance found in leadership style
jointly predict organizational performance. This study concluded that transformational and
democratic leadership styles have positive effect on both performance and followers, and are
highly recommended to banks especially in this global competitive environment.
Dalluay & Jalagat (2016) conducted a research on title Impacts of Leadership Style
effectiveness of Managers and Department Heads to Employees’ job Satisfaction and
Performance on Selected Small-Scale Businesses in Cavite, Philippines. The sample size
used is 150. Survey questionnaires were designed to study the effects of manager leadership
styles on employees’ performance and satisfaction. 150 respondents were selected from
corporations in Cavite, Philippines through random sampling with Slovin formula wit n =
N/(1+Ne2). Data were analysed by using weighted mean, percentages, multiple regression
and correlation coefficient. Percentages specifically were used to analyse demographic
variables (gender, age, length of service and leadership styles). Weighted mean were used to
survey questionnaires on leadership styles, and correlation coefficient and multiple regression
were used to study the relationship between variables on leadership style, job performance
and job satisfaction. The finding concluded that corporations should constantly making the
most of leadership style which enhances employees performance and employee job
satisfactory level even though there is still rooms for improvements.
ISSN: 2289-4519 Page 116
A researched was conducted by Widayanti & Putranto (2015) on Analysing the
Relationship between Transformational Leadership and Transactional Leadership Style on
Employee Performance in PT.TX Bandung in Indonesia. The sample size used by the
researcher is 92. The objective of this research is to find the relationship between
transactional and transformational leadership to employee performance and the significant
relationship between these two variables. This research consists of primary and secondary
data. Primary data was collected through Multifactor Leadership Questionnaire (MLQ) based
on Slovin Theory method. Secondary data was collected from the office assessment of
employee performance. Validity and reliability test were used to measure quality of data.
Multiple regression analysis is used to find the relationship because it has more than one
independent variable. Data was sent for pass the classic assumption tests such as
multicollinearity test, normality test, heteroscedasticity test and autocorrelation test before
multiple regression analysis. The result proved that transactional and transformational
leadership has positive relationship and it effects to employee performance either
concurrently or partially.
Akram, et al. (2012) conducted a research title How Leadership Behaviours Affect
Organizational Performance in Pakistan. Sample size used by the researchers is 1000, where
500 questionnaires were distributed to managers and another 500 to employees of various
private and public sector companies in 66 cities through random selection. Non-probability
sampling technique is used in this study. Two questionnaires were designed for managers and
employees. Questions were related to leadership behaviours and organizational performance.
Five point Likert scale was applied. Correlation analysis and regression analysis were applied
to analyse the relationship and the effect of leadership behaviours on performance. SPSS
version 16 was used to analyse the reliability of questions, and the reliability was checked in
term of Cronbach’s Alpha. The findings concluded that leadership behaviours are interrelated
and have high positive impact with employee performance.
Nasir, et al. (2014) did a research on The Relationship of Leadership Styles and
Organizational Performance among IPTA Academic Leaders in Klang Valley Area in
Malaysia. The study used correlation methods to measure the relationship between leadership
styles and organizational performance. Five public universities in Selangor were chosen. 201
academic leaders were chosen as the sample size. The questionnaire prepared in a form of
closed-ended questions. The survey instruments from Kouzes and Posner Leadership
Practices inventory-Individual Contribution Self Survey (1997) and Multifactor Leadership
Questionnaire (MQL) had been adapted. Likert-Scale was used. All data were analysed by
using SPSS version 20.0. The hypothesis testing from normality test with Normal Probability
Plots for variables and other visual presentation measures such as histogram and box plot.
Pilot test is used to test the consistency of questionnaire. Cronbach’s alpha is used to test
reliability. The findings concluded that leadership behaviours are interrelated and have high
positive impact with organizational performance.
Leng, et al. (2014) did research on title in The Impact of Leadership Styles on
Employee Commitment in Retail Industry in Malaysia. Sample size used by the researchers is
384. The researchers used questionnaires as the research instrument. SAS software version
9.3 was used to run tests of reliability, Pearson correlation and linear regression. The findings
concluded that there was a significant impact of leadership styles towards employee
commitment.
Sakiru, et al. (2013) conducted a research on title in Relationship between Employee
Performance, Leadership Styles and Emotional Intelligence in an Organization in Malaysia.
Sample size used by the researchers is 180. Data was collected using three instruments;
Multifactor Leadership Questionnaire, ECP and parastatal performance evaluation process.

ISSN: 2289-4519 Page 117
Work performance was taken and recorded using organization’s performance evaluation
process. ECP factors are used to measure emotional intelligence. Cronbach’s alpha reliability
coefficient is used for MQL factors. Linear regression analysis is used. These findings
concluded that there is a substantial relationship between worker performance with emotional
intelligent and leadership style.
Ismail, et al. (2011) worked on a research titled Interaction between Leaders and
Followers as an Antecedent of Job Performance: An Empirical Study in Malaysia. Sample
size used by the researchers is 200. This study used a cross-sectional method to integrate the
research literature, the in-depth interview, pilot study and the actual survey to collect data.
Convenience sampling technique was used. SPSS version 16 is used to analyse validity and
reliability of data. Pearson correlation analysis and descriptive statistic is used to access
research variables. Standardized coefficient of Stepwise regression analysis was used. The
findings confirmed that interaction between leaders and followers does act as full antecedent
of job performance.
Based on various studies conducted before, several variables have been adopted in
this study to measure employee performance. Democratic leadership has been adopted as an
independent variable (Iqbal, Haider and Anwar, 2015). Autocratic leadership was also
adopted as an independent variable (Akor, 2014; Iqbal, Anwar and Haider, 2015;). Laissez-
faire leadership was also adopted as an independent variable (Wang & Huynh, 2013; Barbu,
2011). Employee performance has been adopted as the dependent variable (House, 1991;
Haddad, 2011; Sean & Hong, 2014; Malik, 2014).
Conceptual Framework
Figure 1 Conceptual Framework
This leadership encourages innovation, team work, creativity and people are often
being engaged in projects that lead to increased performance, job satisfaction and increased
productivity (Verba, 2015). Iqbal, et al. (2015) stated that democratic leaders makes no
suggestions, however they enquire the opinions of others. This leadership promotes all team
members to participate to make final decision and develop entire process to reach their goals
(Trivisonno & Barling, 2016). One of the major benefit of democratic leadership style is that
the process facilitates in development of some additional leaders who can majorly sere the
organization and have active involvement on the part of everyone in the team (Armstrong &
Taylor, 2014). Democratic leaders encourage and invite team members to play a significant
role in the final decision making process but the ultimate power relies in the hands of leaders
ISSN: 2289-4519 Page 118
and he/she guides the team on what to do, how to do, and employees communicate their
suggestions, experience and recommendations (Skogstad, 2015).
H1: Democratic leadership style has positive significant impact on employee performance.
Autocratic leadership represents all those leaders who makes decision without the
consent of team members and is usually applied when quick decision is taken and team
agreement is not important for acquisition of successful results (Boehm, et al., 2015). Little
opportunity are given to staff and team members to make suggestions, even if it is in the best
interest of the team or organization (Amanchukwu, et al., 2015). An autocratic leader mostly
makes selection on the basis of their own judgments and ideas that rarely include follower’s
advice and these leaders have absolute control over the group (Zareen, et al., 2015).
According to Iqbal, et al. (2015), autocratic leaders give orders without explaining the
reasons or future intentions.
H2: Autocratic leadership style has positive significant impact on employee performance.
In this style the performance of workforce entirely relies on team member’s ability,
skills and capabilities (Adler & Reid, 2008). Team members are free to take decision in their
own way and leaders provide complete freedom to subordinates to work as per their own way
and take major decisions (Coyle‐Shapiro, 2013). Some renowned researchers have stated that
Laissez-Faire style had led to increased job satisfaction and better performance of employees,
but could be damaging if team does not manage their time well or if they are not self-
motivated to do their work efficiently (Martin, 2013). Laissez-Faire leadership style usually
leads to increased chaos in the organization as every individual believe him or her as own
leader (Monzani, 2015).
H3: Laissez-faire leadership style has positive significant impact on employee performance.
1. RESEARCH DESIGN AND METHODOLGY
Research Design and Strategy
This study conducted an explanatory research as the study needs to investigate the
impact of leadership styles on performance of employees. The explanatory research design
involved formulating the hypothesis and collecting the information on this basis that leads to
achievement of the objectives of the research. Also, the researcher needs to measure the
performance and its variations due to different styles of leaders and thus quantitative method
is used as it is the most suitable for the study. This will help in analysing the information
statistically and determining the impact as per the objectives defined.
Data Collection
The most suitable method to collect primary data is to distribute questionnaire. A five-
point Likert scale questionnaire was developed to provide the respondents ease of answering
the questions as per their level of agreement (McLeod, 2008). The Likert scale follows the
format of: 1) Strongly Disagree; 2) Disagree; 3) Neither Agree nor Disagree; 4) Agree; 5)
Strongly Agree. The development of the questionnaire was based on the following variables;
democratic leadership, autocratic leadership, laissez-faire leadership and employee
performance.

ISSN: 2289-4519 Page 119
Table 1 items included in measurement Scale
VARIABLES FACTORS SOURCE
Democratic
Leadership
1. Advice (Iqbal, et al., 2015)
2. Decision making (Chaudhary, 2014)
3. Shared (Men, 2010)
4. Consultation (Lumbasi, 2015)
5. Involvement (Iqbal, et al., 2015)
Autocratic
Leadership
1. Assessed by leader (Anyango,2015)
2. Policies (Lumbasi, 2015)
3. Orders and procedures (Chaudhary, 2014)
4. Rewards or punishments in order to get
better performance
(Iqbal, et al., 2015)
5. Refuses to explain his/her actions (Anyango,2015)
Laissez-Faire
Leadership
1. Freedom (Chaudhary, 2014)
2. Leadership barriers (Iqbal, et al., 2015)
3. Communicate properly (Anyango,2015)
4. Express my views (Chaudhary, 2014)
5. Stays out of the way (Anyango,2015)
Employee
Performance
1. Democratic leadership (Bhatti, et al., 2012 )
2. Autocratic leadership (Kotur & Anbazhagan, 2014)
3. Laissez-Faire leadership (Khan, et al., 2015)
4. Transformational leadership (Sougui, et al., 2016)
5. Transactional leadership (Sougui, et al., 2016)
A total of 150 questionnaires were distributed using convenience sampling method to
employees from different departments such as administration department, marketing
department, sales department, production department, human resource department, service
department, finance department and management. Convenience sampling method was
applied as it is affordable, easy and subjects are readily available (Etikan, et al., 2016).
However, only 130 questionnaires were filled. 30 respondents filled the questionnaire yet
they did not complete it and other 20 did not cooperate, which gives a total of 100 valid
responses hence a total of 67 percent valid response rate.
Accessibility and Ethical Issues
It is important to have the permission of the involving party before carrying out an
investigation, hence the researcher came to a consensual agreement with the management and
the HR department to ensure no complications arose. Also, the researcher distributed
questionnaires only during break time as interrupting the subjects during work hours is
inappropriate and may affect responses. Furthermore, the researcher made sure no violation
of confidentiality (of personal information and responses) arose. The researcher ensures no
revelation of identity or other personal information was enquired when preparing
questionnaires. There were also issue of trust from the respondents; however, confidentiality
was guaranteed to avoid unnecessary issues.
Data Analysis
Quantitative approach was used in this study and it involved using statistical tools to
evaluate the collected facts and data. SPSS is the software used in analysing the collected
data to gain meaningful conclusions. Data analysis, normality test, reliability test, descriptive
analysis and regression analysis was conducted by using SPSS to determine the impact of
leadership styles on employee performance.
ISSN: 2289-4519 Page 120
2. RESULTS AND DISCUSSION
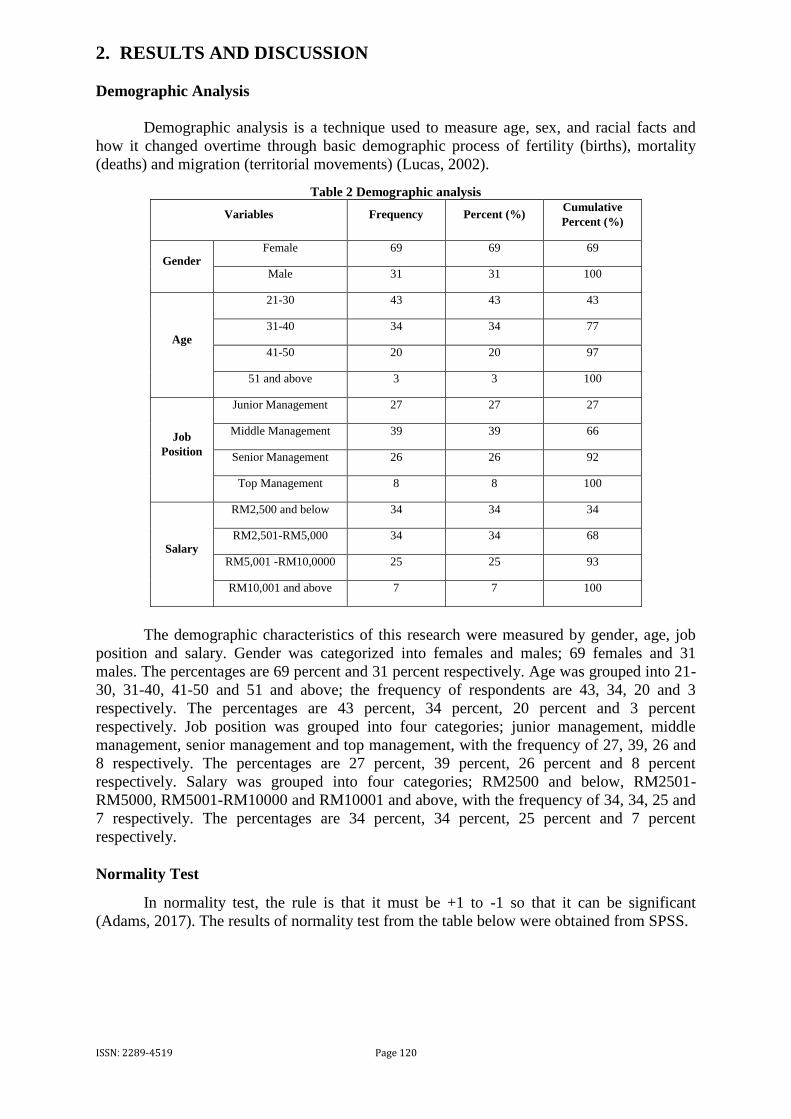
Demographic Analysis
Demographic analysis is a technique used to measure age, sex, and racial facts and
how it changed overtime through basic demographic process of fertility (births), mortality
(deaths) and migration (territorial movements) (Lucas, 2002).
Table 2 Demographic analysis
Variables Frequency Percent (%) Cumulative
Percent (%)
Gender Female 69 69 69
Male 31 31 100
Age
21-30 43 43 43
31-40 34 34 77
41-50 20 20 97
51 and above 3 3 100
Job
Position
Junior Management 27 27 27
Middle Management 39 39 66
Senior Management 26 26 92
Top Management 8 8 100
Salary
RM2,500 and below 34 34 34
RM2,501-RM5,000 34 34 68
RM5,001 -RM10,0000 25 25 93
RM10,001 and above 7 7 100
The demographic characteristics of this research were measured by gender, age, job
position and salary. Gender was categorized into females and males; 69 females and 31
males. The percentages are 69 percent and 31 percent respectively. Age was grouped into 21-
30, 31-40, 41-50 and 51 and above; the frequency of respondents are 43, 34, 20 and 3
respectively. The percentages are 43 percent, 34 percent, 20 percent and 3 percent
respectively. Job position was grouped into four categories; junior management, middle
management, senior management and top management, with the frequency of 27, 39, 26 and
8 respectively. The percentages are 27 percent, 39 percent, 26 percent and 8 percent
respectively. Salary was grouped into four categories; RM2500 and below, RM2501-
RM5000, RM5001-RM10000 and RM10001 and above, with the frequency of 34, 34, 25 and
7 respectively. The percentages are 34 percent, 34 percent, 25 percent and 7 percent
respectively.
Normality Test
In normality test, the rule is that it must be +1 to -1 so that it can be significant
(Adams, 2017). The results of normality test from the table below were obtained from SPSS.

ISSN: 2289-4519 Page 121
Table 3 Normality test
Descriptive Statistics
N Skewness Kurtosis
Statistic Statistic Std. Error Statistic Std. Error
DLS1 100 -1.069 .241 1.298 .478
DLS2 100 -.683 .241 -.121 .478
DLS3 100 -.386 .241 -.761 .478
DLS4 100 -.581 .241 -.377 .478
DLS5 100 -.538 .241 .129 .478
ALS1 100 -.238 .241 -.538 .478
ALS2 100 -.563 .241 .213 .478
ALS3 100 -.891 .241 .482 .478
ALS4 100 -.594 .241 -.008 .478
ALS5 100 -.284 .241 -.596 .478
LFLS1 100 -.776 .241 -.276 .478
LFLS2 100 -.275 .241 -.609 .478
LFLS3 100 -.727 .241 .102 .478
LFLS4 100 -.262 .241 -.905 .478
LFLS5 100 -.289 .241 -.554 .478
EP1 100 -.105 .241 -.398 .478
EP2 100 -.355 .241 -.285 .478
EP3 100 -.587 .241 .336 .478
EP4 100 -.453 .241 -.019 .478
EP5 100 -.478 .241 -.496 .478
EP6 100 -.460 .241 -.170 .478
Valid N
(listwise)
100
According to above table, skewness statistics illustrates an acceptable range except
DLS 1 which valued above 1. The kurtosis statistics value is also in acceptable range,
however DLS 1 is above the accepted value. Data will be considered normal further
reliability test be conducted.
ISSN: 2289-4519 Page 122
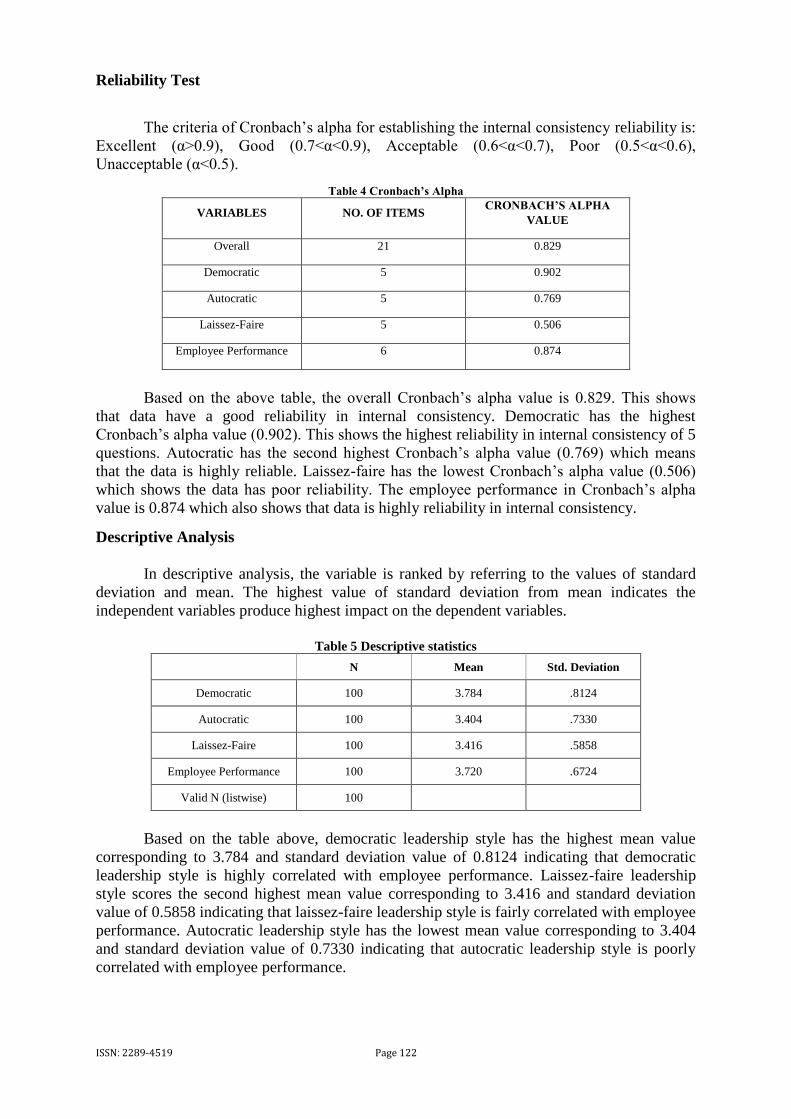
Reliability Test
The criteria of Cronbach’s alpha for establishing the internal consistency reliability is:
Excellent (α>0.9), Good (0.7<α<0.9), Acceptable (0.6<α<0.7), Poor (0.5<α<0.6),
Unacceptable (α<0.5).
Table 4 Cronbach’s Alpha
VARIABLES NO. OF ITEMS CRONBACH’S ALPHA
VALUE
Overall 21 0.829
Democratic 5 0.902
Autocratic 5 0.769
Laissez-Faire 5 0.506
Employee Performance 6 0.874
Based on the above table, the overall Cronbach’s alpha value is 0.829. This shows
that data have a good reliability in internal consistency. Democratic has the highest
Cronbach’s alpha value (0.902). This shows the highest reliability in internal consistency of 5
questions. Autocratic has the second highest Cronbach’s alpha value (0.769) which means
that the data is highly reliable. Laissez-faire has the lowest Cronbach’s alpha value (0.506)
which shows the data has poor reliability. The employee performance in Cronbach’s alpha
value is 0.874 which also shows that data is highly reliability in internal consistency.
Descriptive Analysis
In descriptive analysis, the variable is ranked by referring to the values of standard
deviation and mean. The highest value of standard deviation from mean indicates the
independent variables produce highest impact on the dependent variables.
Table 5 Descriptive statistics
N Mean Std. Deviation
Democratic 100 3.784 .8124
Autocratic 100 3.404 .7330
Laissez-Faire 100 3.416 .5858
Employee Performance 100 3.720 .6724
Valid N (listwise) 100
Based on the table above, democratic leadership style has the highest mean value
corresponding to 3.784 and standard deviation value of 0.8124 indicating that democratic
leadership style is highly correlated with employee performance. Laissez-faire leadership
style scores the second highest mean value corresponding to 3.416 and standard deviation
value of 0.5858 indicating that laissez-faire leadership style is fairly correlated with employee
performance. Autocratic leadership style has the lowest mean value corresponding to 3.404
and standard deviation value of 0.7330 indicating that autocratic leadership style is poorly
correlated with employee performance.

ISSN: 2289-4519 Page 123
Regression Analysis
When Durbin-Watson are at value of 2, it means there is no auto correlation, value
approaching 0 means there is positive correlation, and value towards 4 means there is
negative correlation. The rule of thumb is that a “good fit” model is predicted by a minimum
of 60 percent variance in dependent variable making the model for the research a good fit by
having a value of Adjusted R Square higher than 60 percent. Durbin-Watson test calculates
the auto correlation of the residual from the regression analysis which state that the
acceptable range for Durbin-Watson is within the range of 1.5-2.5.
Table 6 Model summaryb
Model R R Square Adjusted R
Square
Std. Error of
the Estimate Durbin-Watson
1 .729a .531 .517
.4675821469826
47 1.659
a. Predictors: (Constant), Laissez-Faire, Autocratic, Democratic
b. Dependent Variable: Employee Performance
According to the above table, R square value is 0.531 which indicates that 53.1
percent of the dependent variables can be predicted by independent variables. The adjusted R
square is 0.517 which shows that model is not a good fit model as the value is less than 0.60.
The Durbin-Watson value shows no auto correlation among the selected respondents for this
study as the value falls in a range of 1.5-2.5.
Additional analysis will be on coefficients where the range of alpha value of 0.05,
0.001 or 0.01 is used to explain the significant of the variable.
Table 7 Coefficienta
Model
Unstandardized
Coefficients
Standardized
Coefficients t Sig.
B Std. Error Beta
1 (Constant) 1.477 .362 4.081 .000
Democratic .481 .064 .581 7.542 .000
Autocratic -.154 .068 -.168 -2.274 .025
Laissez-Faire .277 .090 .241 3.071 .003
a. Dependent Variable: Employee Performance
As per shown on the above table, democratic leadership style beta coefficient value is
0.581 with a significant value of 0.000 which is lower than 0.01, hence democratic leadership
is found to have a positive significant impact on employee performance. This finding is
similar to Ojokuku, et al. (2012) where they found that democratic leadership style, in which
employees are allowed to have sense of belonging, believed higher responsibility can be
carried out with little supervision, and leaders help followers achieve their visions and needs,
enhance organizational efficiency. This had been supported by Iqbal, et al. (2015) and Bhatti,
et al. (2012) research.
ISSN: 2289-4519 Page 124
Autocratic leadership style beta coefficient value is -0.168 with a significant value of
0.025 which is higher than 0.01, hence autocratic leadership is found to have a negative
significant impact on employee performance. This finding is similar to Jayasingam & Cheng
(2009) where they found autocratic power produces negative influence on employee
performance. This has been supported by Puni, et al. (2014) and Akor (2014) research.
Laissez-faire leadership style beta coefficient value is 0.241 with a significant value
of 0.003 which is lower than 0.01, hence laissez-faire leadership is found to have a positive
significant impact on employee performance. This finding is similar to a study conducted by
Chaudhry & Javed (2012) in which the result indicates that there is positive and significant
relationship between laissez faire leadership and employee performance. This had been
supported by Nuhu (2010) and Sougui, et al. (2016) research.
Discussion
The results indicate that democratic leadership has a positive significant impact on
employee performance. This supports Iqbal, et al. (2015) that stated under the influence of
democratic leadership employees to some extent has discretionary power to do work that
leads to a better performance. Therefore, democratic leadership produces more motivated
employees that eventually leads to an increased performance. H1: Accepted
The results show that autocratic leadership has a negative significant impact on
employee performance. This supports Jayasingam & Cheng (2009) that stated autocratic
leaders dominates all actions and decisions all the while restricting the innovativeness and
creativity of employees. Therefore, autocratic leaders tend to limit the performance of
employees. H2: Rejected
The results show that laissez-faire leadership has a positive significant impact on
employee performance. This supports Sougui, et al. (2016) that stated laissez-faire leaders
allow freedom on how employees do their work and employees perform with no leadership
barriers. Therefore, employee’s performance is better as employees enjoy working with less
authority from leaders. H3: Accepted
Table 8 Summary of hypothesis
Hypothesis Beta value Sig Result
H1: Democratic leadership style has a
positive significant impact on employee
performance
0.581 0.000 Accepted
H2: Autocratic leadership style has a
positive significant impact on employee
performance
-0.168 0.025 Rejected
H3: Laissez-faire leadership style has a
positive significant impact on employee
performance
0.241 0.003 Accepted
3. CONCLUSION
Based on the results, democratic leadership style has a significant positive impact on
employee performance. This indicates that when democratic approach is applied,
performance of employees would increase. Therefore, Malaysian leaders is encouraged to
adopt democratic leadership style and involve team members in the decision making process
since it is confirmed that performance of employees is the best under this style of leadership.
Malaysian leaders should encourage innovation, team work and creativity that leads to job
satisfaction, increased productivity and subsequently increased performance.
Autocratic leadership style, however, shows a significant negative impact on employee
performance. This indicates that performance of employees would not increase when

ISSN: 2289-4519 Page 125
autocratic approach is applied. Even though Malaysian leaders prefer and are most known to
lead through autocratic leadership style, in the view of globalization, autocratic leadership
style may no longer be accepted by employees who are now becoming more knowledgeable,
independent and competent.
Laissez-faire leadership style has positive impact on employee performance, which
indicates that employee performance would increase when laissez-faire leadership style is
applied. Laissez-faire leadership style is considered as moderate leadership style. This
technique is being suited when employees understands their responsibilities well and possess
strong analytical skills. This approach can be used when leaders are very much confident on
team members and in any condition should not blame each other for mistakes.
Recommendation
Organizations need to have highly capable leaders to lead their employees in daily
operation and accomplish the organizational goals. Based on the findings of this research,
democratic leadership style has greater impact than laissez-faire leadership and autocratic
styles in terms of employee performance. In order to stay in the competitive business
environment, it is recommended that the right leader with high capability be identified at all
levels of the organization, especially public sectors in Malaysia. Organizations in Malaysia
should make use of the recommendations to adopt democratic leadership instead of autocratic
leadership style. It should be known that employees are the most important asset in the
organization, and employee performance highly depends on leadership style. Organizations
with good leadership capability will further improve performance. Therefore, serious
attention should be given to make leadership a higher priority.
Limitations
This section defines the limitations that are possible in accomplishing the research in
a successful way. There are various aspects that may lead to limit the accuracy of research
outcomes. The first point of concern is regarding sampling. As selecting a sample cannot
access the complete population, there can be differences in assumptions made on the part of
complete population. Further other limitations involve the interest of respondents in
answering the questions. They might be influenced to answer it without concerning over its
seriousness and fill it so as to save their time. As the sample selected is from 100
respondents, it cannot justify the impact of leadership style on employee performance issue
on the base from the same organization because of large number of population cannot be
studied with a sample. Also the respondents might involve in biasness while answering as
they might not feel comfortable in agreeing to the problems they face in the organization. The
sample of the study might be another limitation. The organization is a private sector
company, which governmental agency might have limiting the impact they could have on
their surroundings. Thus these limitations explain the hurdles that researcher might face in
completing the investigation and fulfilling all the aims and objectives with better accuracy.
Future research Direction
The upcoming research may be conducted with inclusion of more and different
variables such as gender of superior and number of years working with superior. As only one
organization participated in this study, future researcher could widen the number of
organizations. The future researcher can enlarge a bigger sample data size in different
industries such as travel, banking, retailing services and hospitality industries for a broader
view. Furthermore, researcher can expand this model to include employees work outcomes
such as turnover intention, work performance and work commitment. In addition, the future
researcher should focus on other organizations – be it government sector or private sectors -

ISSN: 2289-4519 Page 126
in other states in Malaysia by applying Bass Transformational Leadership (1985) model with
Lewin’s Leadership Style (1939) model.
REFERENCES
Adams, R., 2017. Good Data. [Online] Available at:
https://help.gooddata.com/display/doc/Normality+Testing+-
+Skewness+and+Kurtosis[Accessed 16 11 2017].
Adler, R. W. & Reid, J., 2008. THE EFFECTS OF LEADERSHIP STYLES AND BUDGET
PARTICIPATION ON JOB SATISFACTION AND JOB PERFORMANCE. ASIA-PACIFIC
MANAGEMENT ACCOUNTING JOURNAL, 3(1), pp. 21-46.
Akor, P. U., 2014. Influence of Autocratic Leadership Style on the Job Performance of Academic
Librarians in Benue State. Journal of Educational and Social Research, 4(7), pp. 148-152.
Akram, M., Alam, H. M., Ali, L. & Mughal, M. M., 2012. How Leadership Behaviors Affect
Organizational Performance in Pakistan. Journal of Economics and Behavioral Studies, 4(6),
pp. 354-363.
Alghazo, A. M. & Al-Anazi, M., 2016. The Impact of Leadership Style on Employee’s Motivation.
International Journal of Economics and Business Administration, 2(5), pp. 37-44.
Ali, A., 2012. Leadership and its Influence in Organizations – A Review of Intellections. International
Journal of Learning & Development, 2(6), pp. 73-85.
Amanchukwu, R. N., Stanley, G. J. & Ololube, N. P., 2015. A Review of Leadership Theories,
Principles and Styles and Their Relevance to Educational Management. Management, 5(1),
pp. 6-14.
Anbazhagan, S. & Kotur, B. R., 2014. Worker Productivity, Leadership Style Relationship. IOSR
Journal of Business and Management (IOSR-JBM), 16(8), pp. 62-70.
Ansari, M. A., Ahmad, Z. A. & Aafaqi, R., 2004. Organizational Leadership in the Malaysian
Context. Leading in High Growth Asia, pp. 109-138.
Arham, A. F., 2014. LEADERSHIP AND PERFORMANCE: THE CASE OF MALAYSIAN SMEs
IN THE SERVICES SECTOR. International Journal of Asian Social Science, 4(3), pp. 343-
355.
Armstrong, M., Taylor & S. (2014). Armstrong's handbook of human resource management practice.
Kogan Page Publishers.
Babatunde, O., 2015. The Impact of Leadership Style on Employee’s Performance in an Organization.
IISTE, 5(1), pp. 193-206.
Benjamin, O. A., 2015. IMPACT OF ORGANISATIONAL CULTURE A ND LEADERSHIP
STYLE ON QUALITY OF WORK-LIFE AMONG EMPLOYEES IN NIGERIA. AFRICAN
JOURNAL FOR THE PSYCHOLOGICAL STUDY OF SOCIAL ISSUES , 18(1), pp. 109-
121.
Bhatti, N. et al., 2012 . The Impact of Autocratic and Democratic Leadership Style. International
Business Research, 5(2), pp. 192-201.
Billig, M., 2015. Kurt Lewin's leadership studies and his legacy to social psychology: is there nothing

ISSN: 2289-4519 Page 127
as practical as a good theory?. Journal for the Theory of Social Behaviour, 45(4), pp. 440-
460.
Boehm, S. A., Dwertmann, D. J., Bruch, H. & Shamir, B., 2015. The missing link? Investigating
organizational identity strength and transformational leadership climate as mechanisms that
connect CEO charisma with firm performance. The Leadership Quarterly, 26(1), p. 156–171.
Bolden, R., Gosling, J., Marturano, A. & Dennison, P., 2003. A REVIEW OF LEADERSHIP
THEORY AND COMPETENCY FRAMEWORKS, Exeter: Chase Consulting and the
Management Standards Centre.
Chaudhry, A. Q. & Javed, H., 2012. Impact of Transactional and Laissez Faire Leadership Style on
Motivation. International Journal of Business and Social Science, 3(7), pp. 258-264.
Choi, S., 2007. Democratic Leadership: The Lessons of Exemplary Models for Democratic
Governance. International Journal of Leadership Studies, 2(3), pp. 243-262.
Coyle-Shapiro & J (2013). The impact of a TQM intervention on teamwork: A longitudinal
assessment. Team Performance Management: An International Journal
Dalluay, D. V. S. & Jalagat, D. R. C., 2016. Impacts of Leadership Style Effectiveness of Managers
and Department Heads to Employees’ Job Satisfaction and Performance on Selected Small-
Scale Businesses in Cavite, Philippines. International Journal of Recent Advances in
Organizational Behaviour and Decision Sciences (IJRAOB), 2(2), pp. 734-751.
Ejimabo, N. O., 2015. AN APPROACH TO UNDERSTANDING LEADERSHIP DECISION
MAKING IN ORGANIZATION. European Scientific Journal, 11(11), pp. 1-24.
Etikan, I., Musa, S. A. & Alkassim, R. S., 2016. Comparison of Convenience Sampling and Purposive
Sampling. American Journal of Theoretical and Applied Statistics, 5(1), pp. 1-4.
Gastil, J., 1994. A Definition and Illustration of Democratic Leadership. Human Relations, 47(8), pp.
953-975.
Gharibvand, S., 2012. The Relationship between Malaysian Organizational Culture, Participative
Leadership Style, and Employee Job Satisfaction among MalaysianEmployees from
Semiconductor Industry. International Journal of Business and Social Science, 3(16), pp. 289-
298.
Hurduzue, R.-E., 2015. THE IMPACT OF LEADERSHIP ON ORGANIZATIONAL
PERFORMANCE. SEA - Practical Application of Science, 3(1(7)), pp. 289-294.
Igbaekemen, G. O., 2014. IMPACT of Leadership Style on Organisation Performance: A Strategic
Literature Review. Public Policy and Administration Research, 4(9), pp. 126-136.
Iqbal, N., Anwar, S. & Haider, N., 2015. Effect of Leadership Style on Employee Performance.
Arabian Journal of Business and Management Review, 5(5), pp. 1-6.
Ismail, A., Tiong, C. S., Ajis, M. N. & Dollah, N. F., 2011. INTERACTION BETWEEN LEADERS
AND FOLLOWERS AS AN ANTECEDENT OF JOB PERFORMANCE: AN EMPIRICAL
STUDY IN MALAYSIA. s.l.:s.n.
Jayasingam, S. & Cheng, M. Y., 2009. Leadership Style and Perception of Effectiveness:
Enlightening Malaysian Managers. Asian Social Science , 5(2), pp. 54-65.
Jones, D. W. & Rudd, R. D., 2007. Transactional, Transformational, or Laissez-Faire Leadership: An
assessment of College of Agriculture Academic Program Leaders (Deans) Leadership Styles.
s.l., s.n.

ISSN: 2289-4519 Page 128
Khan, M. S. et al., 2015. The Styles of Leadership: A Critical Review. International Institute for
Science, Technology and Education (IISTE), 5(3), pp. 87-93.
Koech, P. M. & Namusonge, P. G., 2012. The Effect of Leadership Styles on Organizational
Performance at State Corporations in Kenya. International Journal of Business and
Commerce, 2(1), pp. 1-12.
Kotur, B. R. & Anbazhagan, S., 2014. Influence of Leadership Styles on Self Performance. IOSR
Journal of Business and Management (IOSR-JBM), 16(5), pp. 111-119.
Leng, C. S. et al., 2014. The Impact of Leadership Styles on Employee Commitment in Retail
Industry. s.l.:s.n.
Levine, M. F., 2000. THE IMPORTANCE OF LEADERSHIP: AN INVESTIGATION OF
PRESIDENTIAL STYLE AT FIFTY NATIONAL UNIVERSITIES. Denton : University of
North Texas.
Lo, M.-C., Ramayah, T. & Min, H. W., 2009. Leadership styles and organizational commitment: a
test on Malaysia manufacturing industry. African Journal of Marketing Management, 1(6),
pp. 133-139.
Longe, O. J., 2014. Leadership Style Paradigm Shift and Organisational Performance: A Case of the
Nigerian Cement Industry. African Research Review, 8(4), pp. 68-83.
Lucas, D., 2002. The scope of demography. s.l.:s.n.
Martin & S.L. (2013). Directive versus empowering leadership: A field experiment comparing
impacts on task proficiency and proactivity. Academy of Management Journal. Vol. 56 (5)
pp. 1372-1395
McCleskey, J. A., 2014. Situational, Transformational, and Transactional Leadership and Leadership
Development. Journal of Business Studies Quarterly, 5(4), pp. 117-130.
McLeod, S., 2008. Simply Pychology. [Online]
Available at: https://www.simplypsychology.org/likert-scale.html
[Accessed 16 11 2017].
Mester, C., Visser, D. & Roodt, G., 2003. LEADERSHIP STYLE AND ITS RELATION TO
EMPLOYEE ATTITUDES AND BEHAVIOUR. SA Journal of Industrial Psychology, 29(2),
pp. 72-82.
Mohammed, U. D. et al., 2014. The Relationship between Leadership Styles and Employees’
Performance in Organizations (A Study of Selected Business Organizations in Federal Capital
Territory, Abuja Nigeria). European Journal of Business and Management, 6(22), pp. 1-11.
Molloy, P. L., 1998. A Review of the Managerial Grid Model of Leadership and its Role as a Model
of Leadership Culture. s.l.:s.n.
Monzani & L. (2015). The moderator role of followers’ personality traits in the relations between
leadership styles, two types of task performance and work result satisfaction. European
Journal of Work and Organizational Psychology. Vol. 24(3) pp. 444-461
Nasir, H. M., Nordin, R., Seman, S. A. A. & Rahmat, A., 2014. The Relationship of Leadership Styles
and organizational performance among IPTA Academic Leaders in Klang Valley Area,
Malaysia. Business & Entrepreneurship Journal, 3(2), pp. 45-65.
Ojokuku, R., Odetayo, T. & Sajuyigbe, A., 2012. Impact of Leadership Style on Organizational

ISSN: 2289-4519 Page 129
Performance: A Case Study of Nigerian Banks. American Journal of Business and
Management, 1(4), pp. 202-207.
Omolayo, B., 2007. Effect of Leadership Style on Job-Related Tension and Psychological Sense of
Community in Work Organizations: A Case Study of Four Organizations in Lagos State,
Nigeria. Bangladesh e-Journal of Sociology, 4(2), pp. 30-37.
Packard, T., 2009. Leadership and Performance in Human Services Organizations. In: The Handbook
of Human Services Management. s.l.:s.n., pp. 143-164.
Paracha, M. U. et al., 2012. Impact of Leadership Style (Transformational &
TransactionalLeadership) On Employee Performance & Mediating Role of Job Satisfaction”
Study of Private School (Educator) In Pakistan. Global Journal of Management and Business
Research, 12(4), pp. 54-64.
Ping, A. T., 2015. The Relationship between Leadership Styles and Employees’ Job Satisfaction in
Small and Medium Enterprises (SMEs). s.l.:s.n.
Puni, A., Ofei, S. B. & Okoe, A., 2014. The Effect of Leadership Styles on Firm Performance in
Ghana. International Journal of Marketing Studies, 6(1), pp. 177-185.
Ray, S. & Ray, I. A., 2012. UNDERSTANDING DEMOCRATIC LEADERSHIP: SOME KEY
ISSUES AND PERCEPTION WITH REFERENCE TO INDIA’S FREEDOM MOVEMENT.
Afro Asian Journal of Social Sciences, 3(1), pp. 1-26.
Said, J., Alam, M. M. & Aziz, M. A. A., 2015. Public accountability system: Empirical assessment of
public sector of Malaysia. Asian Journal of Scientific Research, 8(2), pp. 225-2368.
Sakiru, O. K., Enoho, D. V., Kareem, S. D. & Abdullahi, M., 2013. Relationship between employee
performance, leadership styles and emotional intelligence in an organization. IOSR Journal
Of Humanities And Social Science (IOSR-JHSS), 8(2), pp. 53-57.
Sharma, D. M. K. & Jain, S., 2013. Leadership Management: Principles, Models and Theories. Global
Journal of Management and Business Studies, 3(3), pp. 309-318.
Skoogh, J., 2014. Social and Emotional Competence among Managers. s.l.:s.n.
Soha, H. M., Osman, A., Manaf, A. H. A. & Abdullah, M. S., 2016. LEADERSHIP STYLES
AFFECTING THE INDIVIDUALS’ COMMITMENT: A STUDY OF THE PUBLIC
UNIVERSITY IN NORTHERN STATE OF MALAYSIA. Asian Journal of Social Sciences
and Humanities, 5(1), pp. 80-86.
Trivisonno, M. & Barling (2016). Organizational leadership and employee commitment. Handbook of
Employee Commitment. Vol. 22 pp. 305.
Verba & S. (2015). Small groups and political behavior: A study of leadership. Princeton University
Press.
Widayanti, A. T. & Putranto, N. A. R., 2015. ANALYZING THE RELATIONSHIP BETWEEN
TRANSFORMATIONAL AND TRANSACTIONAL LEADERSHIP STYLE ON
EMPLOYEE PERFORMANCE. JOURNAL OF BUSINESS AND MANAGEMENT, 4(5),
pp. 561-568.
Yao, L., Woan, K. S., Li, F. & Ahmad, M. H., 2017. The Relationship between Leadership Styles and
Employee Engagement: Evidences from Construction Companies in Malaysia. The Social
Sciences , 12(6), pp. 984-988.
Yukl, G., 2008. The Importance of Flexible Leadership. San Francisco, CA, Society for Industrial-
Organizational Psychology.

ISSN: 2289-4519 Page 130
Zareen, M., Razzaq, K. & Mujtaba, B., 2015. Impact of Transactional, Transformational and Laissez-
Faire Leadership Styles on Motivation: A Quantitative Study of Banking Employees in
Pakistan. Public Organization Review, 15(4), pp. 531-549.
Zumitzavan, V. & Udchachone, S., 2014. The impact of different styles of ‘leadership’ and levels of
organisational innovation’ on ‘organisational performance’: a case of hospitality industry in
Thailand. WSEAS TRANSACTIONS on BUSINESS and ECONOMICS, 11(1), pp. 272-282
IJABM is a FTMS Publishing Journal