impact of landscape composition and configuration on forest … · impact of landscape composition...
TRANSCRIPT

Biological Conservation 184 (2015) 117–126
Contents lists available at ScienceDirect
Biological Conservation
journal homepage: www.elsevier .com/ locate /biocon
Impact of landscape composition and configuration on forest specialistand generalist bird species in the fragmented Lacandona rainforest,Mexico
http://dx.doi.org/10.1016/j.biocon.2015.01.0140006-3207/� 2015 Elsevier Ltd. All rights reserved.
⇑ Corresponding author. Tel.: +52 443 3222777x32850.E-mail address: [email protected] (V. Arroyo-Rodríguez).
Emilia Carrara a, Víctor Arroyo-Rodríguez a,⇑, Jorge H. Vega-Rivera b, Jorge E. Schondube a,Sandra M. de Freitas c, Lenore Fahrig c
a Centro de Investigaciones en Ecosistemas, Universidad Nacional Autónoma de México (UNAM), Morelia, C.P. 58190 Michoacán, Mexicob Instituto de Biología, Universidad Nacional Autónoma de México (UNAM), Mexico City C.P. 04510, Mexicoc Geomatics and Landscape Ecology Laboratory, Department of Biology, Carleton University, Ottawa, Ontario K1S 5B6, Canada
a r t i c l e i n f o
Article history:Received 11 September 2014Received in revised form 12 January 2015Accepted 13 January 2015
Keywords:Biodiversity crisisHabitat fragmentationHabitat lossHuman-modified landscapesNeotropical birdsLandscape structure
a b s t r a c t
With accelerated land-use change throughout the tropics, an increasing proportion of global biodiversityis located in human-modified landscapes. Understanding the relative effects of landscape compositionand configuration on biodiversity is needed to design effective conservation strategies. Yet this topic ispoorly understood because most studies have been performed at the patch scale, and do not assess theimpact of landscape structure on species. Using a multi-model inference approach, we assessed the rel-ative effect of landscape composition (i.e. percentage of forest cover and matrix composition) and land-scape configuration (i.e. number of forest patches and forest edge density) on a- and b-diversity of birdsin 17 forest fragments and three areas of continuous forest within the Lacandona rainforest, Mexico. Wetested these impacts at two spatial scales (100 and 500 ha) for forest specialist and generalist birds. Ingeneral, forest specialist birds showed stronger responses to landscape characteristics than generalistspecies, particularly to variations in landscape composition at the 100-ha scale. The loss of forest coverrepresented the main threat to forest specialist birds, with a negative impact on a-diversity that was con-sistent across the two spatial scales. In contrast, at the two spatial scales generalist birds seemed to befavored by forest loss, as a-diversity of these birds increased in landscapes with lower forest cover andhigher number of forest patches. If current deforestation rates continue, several forest specialists arelikely to disappear. Future conservation and management initiatives should therefore prevent deforesta-tion in this biodiversity-rich but vanishing tropical forest ecosystem.
� 2015 Elsevier Ltd. All rights reserved.
1. Introduction
Continuous rainforests are being rapidly converted to human-modified tropical landscapes (HMTLs), largely due to acceleratedhuman population growth and increasing demands for agriculturallands and forest products (Laurance et al., 2014). These landscapesare highly heterogeneous, showing different composition and spa-tial configuration, where composition refers to the types and pro-portions of different forms of land covers, and configurationrefers to the spatial arrangement of a given land use/land coverclass (sensu Dunning et al., 1992). Both landscape compositionand configuration defines the heterogeneity or structure of a land-scape, and can have different impacts on biodiversity (Fahrig,
2003; Fahrig et al., 2011; Tscharntke et al., 2012; Newbold et al.,2014). Nevertheless, the available information on this topic is veryscarce as most studies in HMTLs have been performed at the patchscale, and do not assess, nor control for, the independent effectsthat landscape composition and configuration may have on biodi-versity (Fahrig, 2003). Also, the majority of existing landscape-scale studies are focused on temperate ecosystems (McGarigaland Cushman, 2002). It is thus necessary to adopt a landscape per-spective that distinguishes between composition and configurationin tropical ecosystems, to obtain a better understanding of species’responses to land-use changes in HMTLs, and improve manage-ment and conservation strategies in the tropics (Gardner et al.,2009; Melo et al., 2013).
Studies from temperate forests evaluating the independenteffects of landscape composition and configuration have usuallyfound that landscape configuration (e.g. number or density of

118 E. Carrara et al. / Biological Conservation 184 (2015) 117–126
forest patches) shows a variable and weaker effect on biodiversitythan landscape composition (e.g. habitat amount) (Trzcinski et al.,1999; Fahrig, 2003; Smith et al., 2011). In fact, fragmentation perse (i.e. the breaking apart of habitat after controlling for habitatloss; sensu Fahrig, 2003) can have negative, positive, or neutraleffects on different taxa (Fahrig, 2003; Betts et al., 2006; Ethierand Fahrig, 2011). The negative effects can be related to the lossof landscape connectivity and the increase in forest edge (Murcia,1995; Laurance et al., 2002). Nevertheless, by increasing the num-ber of patches, fragmentation can promote the creation of subpop-ulations, favoring metapopulation dynamics and speciespersistence in more fragmented landscapes (Hanski, 1999). Otherpositive effects of fragmentation per se reviewed by Fahrig(2003) include: (1) increasing access to resources in forest edges,(2) reducing inter-patch isolation distances with increasing frag-mentation per se; and (3) improving access from home patchesto resources located in other neighboring patches, as indicated inthe landscape complementation and supplementation hypotheses(Dunning et al., 1992).
In forested landscapes, variations in species responses to forestfragmentation and inter-patch isolation may be related to differ-ences in the amount of old-growth forest cover in the landscape(Villard and Metzger, 2014) and to differences in matrix composi-tion (Fahrig et al., 2011). Evidence indicates that the effect of forestfragmentation may be higher in landscapes with lower (Trzcinskiet al., 1999) or intermediate forest cover (Villard and Metzger,2014). At the same time, landscapes with heterogeneous matrices,such as those with live fences, isolated trees, secondary forests, anddifferent types of land covers, can maintain more resources(Dunning et al., 1992; Fahrig et al., 2011) and higher landscapeconnectivity (Antongiovanni and Metzger, 2005; Fahrig, 2007),thus supporting more species than landscapes with homogeneousmatrices (see the ‘‘landscape insurance hypothesis’’; Tscharntkeet al., 2012). For example, secondary forests are expected to con-tain resources for both forest specialist and habitat generalist birds(Blake and Loiselle, 2001), and also improve landscape connectivityfor forest-specialist species (Stouffer and Bierregard, 1995; Pinottiet al., 2012). In contrast, open-habitat matrices can inhibit birds’dispersal movements in HMTLs (Castellón and Sieving, 2006;Ibarra-Macias et al., 2011).
Changes in landscape composition and configuration not onlyalter patterns of local diversity (a), but also the composition andstructure of remaining assemblages, potentially altering the spe-cies turnover (b-diversity) across multiple spatial scales (Flohreet al., 2011; Karp et al., 2012; Arroyo-Rodríguez et al., 2013;Püttker et al., 2014). For example, both increases (i.e. biotic differ-entiation) and declines (i.e. biotic homogenization) of b-diversityhave been reported in HMTLs (Arroyo-Rodríguez et al., 2013).However, the relative impact of landscape composition and config-uration on b-diversity remains poorly understood, particularly inthe tropics (but see Karp et al., 2012).
Here we examined the relative effects of landscape compositionand configuration on a- and b-diversity of birds within old-growthforest in a fragmented biodiversity hotspot – the Lacandona rain-forest, Mexico. As landscape composition we considered the per-centage of old-growth forest cover in the landscape and thepercentage of secondary forest cover in the matrix. As measuresof landscape configuration we included the number of old-growthforest patches and forest edge density. Since the responses of spe-cies to landscape composition and configuration can be scale-dependent (Smith et al., 2011; Thornton et al., 2011; Garmendiaet al., 2013; San-José et al., 2014), these landscape metrics weremeasured at two spatial scales, within 100-ha and 500-ha land-scapes. Also, as the impact of landscape change on species mayvary according to the habitat specificity of species (Fahrig, 1998;Lindell et al., 2004; Pardini et al., 2010; Newbold et al., 2014), we
separately assessed the response of forest interior specialist (thosethat use forest as the primary habitat) and habitat generalist spe-cies (those that use resources from different land covers and foreststrata in HMTLs).
Based on the hypotheses and empirical evidence describedabove, we predicted that both a- and b-diversity will have strongerassociations with landscape composition, than with landscape con-figuration, particularly when considering forest specialist species,which will be strongly and positively associated with the percent-age of old-growth forest cover in the landscape. It has beenreported that forest edge density in the landscape can have bothpositive and negative effects on biodiversity, depending on the vul-nerability of the species to forest edge effects (reviewed by Ewersand Didham, 2006). Thus, we predicted that forest interior special-ist species will have a negative association with forest edge den-sity, whereas forest generalist species would be positively relatedto this factor because of increasing access to resources, in both for-est edges and the neighboring matrix. Finally, regarding the com-position of the landscape matrix, secondary forests are expectedto contain more resources and refuges for both specialist and gen-eralist birds than other covers of the matrix (Stouffer andBierregard 1995; Pardini et al., 2005; Banks-Leite et al., 2010);thus, we predicted that the diversity of birds will increase inpatches surrounded by a matrix dominated by secondary forests.
This is a timely study for the conservation of birds, given that:(1) landscape-scale studies on tropical birds are very scarce (butsee Cerezo et al., 2010; Kennedy et al., 2011); (2) the Lacandonaregion is one of the biologically richest Mexican ecosystems(González-García, 1993; Medellín, 1994); and (3) the region isexperiencing a very high annual deforestation rate (annual rateof 2.1% between 1990 and 2010; Courtier et al., 2012), but to ourknowledge, no study to date has evaluated the impact of landscapespatial changes on bird community in this vanishing biodiversityhotspot.
2. Materials and methods
2.1. Study area
The Lacandona region is located in the southern part of Chiapas,Mexico (100–1500 m a.s.l.; Fig. 1), and represents the westernmostpart of the Mayan forest, which extends through Guatemala to theBelize Mayan Mountains, and north to the middle portion of theYucatan Peninsula. With an extent of 13,000 km2, this region rep-resents one of the largest areas of tropical rainforest in Mexico,and a priority area for biodiversity conservation in Mesoamerica.Yet it has been strongly deforested during the last 40 years, owingto national policies that promoted agroforestry, agriculture, andcattle ranching. This was particularly evident in the Marqués deComillas region (MCR) (Martínez, 2003; Courtier et al., 2012),which is located in the southeastern border of the Montes AzulesBiosphere Reserve (MABR; Fig. 1). The climate is hot and humid,with annual precipitation averaging 2500–3500 mm, and averagemonthly temperatures of 24–26 �C. The study was conducted intwo adjacent lowland areas (100–200 m a.s.l.) with similar soiland weather conditions, thus avoiding confounding factors relatedto altitude, weather and soil. These areas, the continuous forest ofMABR and the fragmented forest of MCR, are separated by theLacantún River (Fig. 1).
2.2. Study landscapes
Following McGarigal and Cushman (2002), we adopted a patch-landscape approach, in which response variables are evaluatedwithin old-growth forest patches (forest patches hereafter) and

Fig. 1. Location of 17 forest patches in the Marqués de Comillas region (MCR) and three reference areas within the Montes Azules Biosphere reserve (MABR) in the Lacandonarainforest, southeastern Mexico. The 500-ha buffers surrounding each sampling site is also indicated (the spatial structure of such buffers is indicated in Fig. 2).
E. Carrara et al. / Biological Conservation 184 (2015) 117–126 119
landscape variables are measured within a specified radius fromthe center of these patches. In particular, we sampled 20 sites:17 forest patches in MCR, ranging from 3 to 92 ha, and separatedfrom each other by at least 2 km, and three areas (100 ha each)of continuous forest in MABR separated from each other by at least4 km and located at least 1 km from the forest edge (Fig. 1). Withrecent SPOT 5 satellite images (March 2011) and the ‘‘region grow-ing’’ algorithm of the GIS SPRING program (Camara et al., 1996) wefirst made a supervised classification considering six land covertypes: old-growth forests, secondary forests, arboreal crops (i.e.palm and rubber plantations), shrub crop (i.e. corn, chili and beanplantations), cattle pastures, and human settlements. Then, basedon field observations in 152 sampling points distributed through-out the region, we found that overall classification accuracy was77%. We finally used the GIS GRASS program (GRASS, 2011) tocharacterize the spatial configuration of the landscapes surround-ing each site (i.e. forest patches and reference areas) at two spatialscales: within a 100-ha buffer and within a 500-ha buffer from thecenter of each sampling site (100- and 500-ha landscapes, hereaf-ter; Figs. 1 and 2; also see online Appendix Table A1). We selectedthese buffer sizes because they are large enough to include thehome range of several populations of birds (see Odum andKuenzler, 1955; Schoener, 1968, and reference therein), as wellas large variation in the explanatory variables (Table A1).
2.3. Bird surveys
Birds were sampled using unlimited radius point counts (Bibbyet al., 2000). All points were located inside the forest, that is, forestpatches in MCR and reference areas within MABR. Each site (patchand reference area) was sampled three times, once per month,between May and August 2012 (wet season), following a randomlyselected order. Point counts were distributed by dividing each sitein three sections, and during each visit we sampled a different sec-tion. During each visit, point counts were separated 200 m fromeach other to increase independency (Hutto et al., 1986). The num-ber of point counts was proportional to the size of the patches,
with three point counts sampled in patches of <10 ha, 6 points inpatches of 10–30 ha, 9 points in patches of 30–50 ha, and 15 pointsin patches of >50 ha. The number of point counts conducted in ourreference areas (MABR) varied from 21 to 30, because of variationsin weather conditions during our sampling dates. The total pointssurveyed were 130 in patches and 72 in continuous forest. In eachpoint count we recorded all birds seen or heard during a 15 minperiod. We only considered birds that were perched on trees, onthe floor, feeding or using other resources of the forest. We ignoredbirds that fly by our point counts. Surveys began at sunrise(5.30 am) and finished at 10.30 am. Data in all point counts wascollected by the same observer (E.C.).
Based on Stotz et al. (1996), the species were classified in twogroups: (1) forest interior specialists (species inhabiting forestinterior and that are rarely found in other habitat types); and (2)habitat generalists (species that use a variety of habitats includingforest interior, secondary forests, forest edges and open areas). Weexcluded migratory birds, aquatic birds, raptors, or nocturnal birds,as our point count sampling method was not designed to sampleeffectively all these groups. Due to identification problems, speciesfrom the Troglodytidae family were also excluded from theanalysis.
2.4. Response variables
Our response variables were mean a-diversity per patch andb-diversity within patches. We first evaluated the accuracy of birdinventories, using the coverage estimator for infrequent speciesrecommended by Chao and Jost (2012) with the SPADE program(Chao and Shen, 2010):
bCinfreq ¼ 1� Q 1Pki¼1iQ i
ðt � 1ÞQ 1
ðt � 1ÞQ 1 þ 2Q 2
� �
where Qi is the number of species that are observed in exactly kpoint counts (k = 1, 2,. . ., t), based on presence/absence data. Thus,

Fig. 2. Spatial structure of the 500-ha landscapes studied in the Lacandona ranforest, Mexico. Numbers correspond to those showed in Fig. 1 and Table A1.
120 E. Carrara et al. / Biological Conservation 184 (2015) 117–126
Q1 and Q2 are the number of species observed in one and two pointcounts, respectively.
Because sampling coverage was highly variable among sites(Table A1), we used the average number of species per samplepoint as the response variable (mean a-diversity), which was notrelated to the number of count points within the sites (R2 = 0.02,p = 0.53), being thus independent of sampling effort. b-diversitywithin each site was first calculated using a multiplicative parti-tion (Jost, 2007; Whittaker, 1960), i.e. b = c/a, where a refers tomean a-diversity per count point, and c refers to the total numberof species sampled in each site. Nevertheless, because this measurewas significantly correlated with sampling effort, we used the min-imum number of points (n = 3) per site. In particular, in sites with>3 points, we randomly selected a sampling point within each site,and we then selected the two nearest points to avoid the bias asso-ciated with differences in inter-point distance. Thus, b-diversitywas finally estimated considering c-diversity and mean a-diversitywithin these 3 points.
2.5. Predictor variables
For all 100- and 500-ha landscapes we measured metrics oflandscape composition and configuration that can be of key rele-vance for birds (Villard et al., 1999; Trzcinski et al., 1999; Cerezoet al., 2010; Smith et al., 2011) and other organisms (reviewedby Ewers and Didham, 2006). In particular, composition metricswere the percentage of old-growth forest cover in the landscape,and the percentage of the matrix covered by secondary forests.The later metric was selected because secondary forests are verycommon in the region (Table A1), and this land cover is the most
similar to the original vegetation in terms of composition andstructure, thus representing a good indicator of matrix permeabil-ity to movements of birds, as well as of resource availability withinthe matrix, particularly for forest specialist species. Also, the per-centage of the matrix covered by secondary forests was not corre-lated with the percentage of the matrix covered by other landcovers in the matrix (p > 0.13 in all cases and for both spatialscales), thus indicating that this metric was independent of thecomposition of other land cover classes in the matrix. Configura-tion metrics included the number of old-growth forest patches inthe landscape and forest edge density, which was measured asthe length of all old-growth forest borders divided by the total areaof the landscape (expressed as m/ha). Other aspects of landscapeconfiguration, such as forest patch aggregation and connectivitywere not explicitly addressed. Reference areas were consideredas having 100% forest cover, zero forest edge density, and zero per-centage of secondary forest in the matrix (Table A1).
2.6. Data analyses
To identify the landscape attributes with the strongest influenceon a- and b-diversity of forest specialists and generalists we usedgeneralized linear models (Crawley, 2007). We fixed a Gaussiandistribution after verifying that a- and b-diversity showed a Nor-mal distribution (Shapiro–Wilk test). To avoid multi-collinearityproblems between the predictor variables in multivariate models,we estimated the variance inflation factor (VIF) of each predictorusing the car package for R version 3.0.1 (R Core Team 2013).Generally, a VIF > 4 indicates possible collinearity, and a VIF > 10indicates severe collinearity (Neter et al., 1996). Our analysis

E. Carrara et al. / Biological Conservation 184 (2015) 117–126 121
indicated a possible collinearity between factors measured at dif-ferent scales. Thus, we performed two independent analyses: onefor assessing the effect of the 100-ha landscape metrics and onefor the 500-ha landscape metrics. Because the three referenceareas showed the same values for all landscape metrics(Table A1), we merged the response variables from these three ref-erence areas into one single value by considering mean a- andb-diversity per reference area. We therefore included one singlereference site in the regression models, thus avoiding pseudorepli-cation problems.
We used a multi-model inference approach to identify the sub-set of models with the most empirical support, from a total of 16possible models (Burnham and Anderson, 2002). We ranked themodels from the best to the worst based on the Akaike’s informa-tion criterion corrected for small samples (AICc). The set of modelswith a difference in AICc (DAICc) < 2 from the top model were con-sidered to have equivalently strong empirical support and similarplausibility (Burnham and Anderson, 2002). To evaluate the impor-tance of each predictor and produce model-averaged parameterestimates, we used Akaike weights (wi), which represent the prob-ability that a particular model is selected as the best fitting modelif the data are collected again under identical circumstances(Whittingham et al., 2005). This model can be therefore consideredas the best model for a particular dataset. Thus, we summed wi ofranked models until the total was >0.95 (Whittingham et al., 2005).The set of models for which Rwi was 0.95 represents the modelsfor which we have 95% confidence that the set contains the bestapproximating model out of our 16 candidate models (Burnhamand Anderson, 2002; Whittingham et al., 2005). The relative impor-tance of each predictor was assessed based on the sum of Akaikeweights (Rwi) of each candidate model in which such predictorappeared (Burnham and Anderson, 2002). All models were builtusing the package glmulti for R version 3.0.1 (Calcagno andMazancourt, 2010). Following Crawley (2007), the goodness-of-fitof the models was estimated as: (explained deviance by the com-plete model � 100)/explained deviance by the null model.
3. Results
We recorded 84 bird species from 25 families (Table A2). Ninespecies (11%) were ubiquitous, occurring in all reference sitesand in >80% of the patches. In contrast, 11 species (12%) were onlyrecorded in reference sites, and 16 species (19%) were recordedexclusively in forest patches. Overall, 20 species (24% of all speciesrecorded) were forest specialist, and 64 (71%) were generalist spe-cies (Table A2).
3.1. Species response to changes in landscape composition andconfiguration
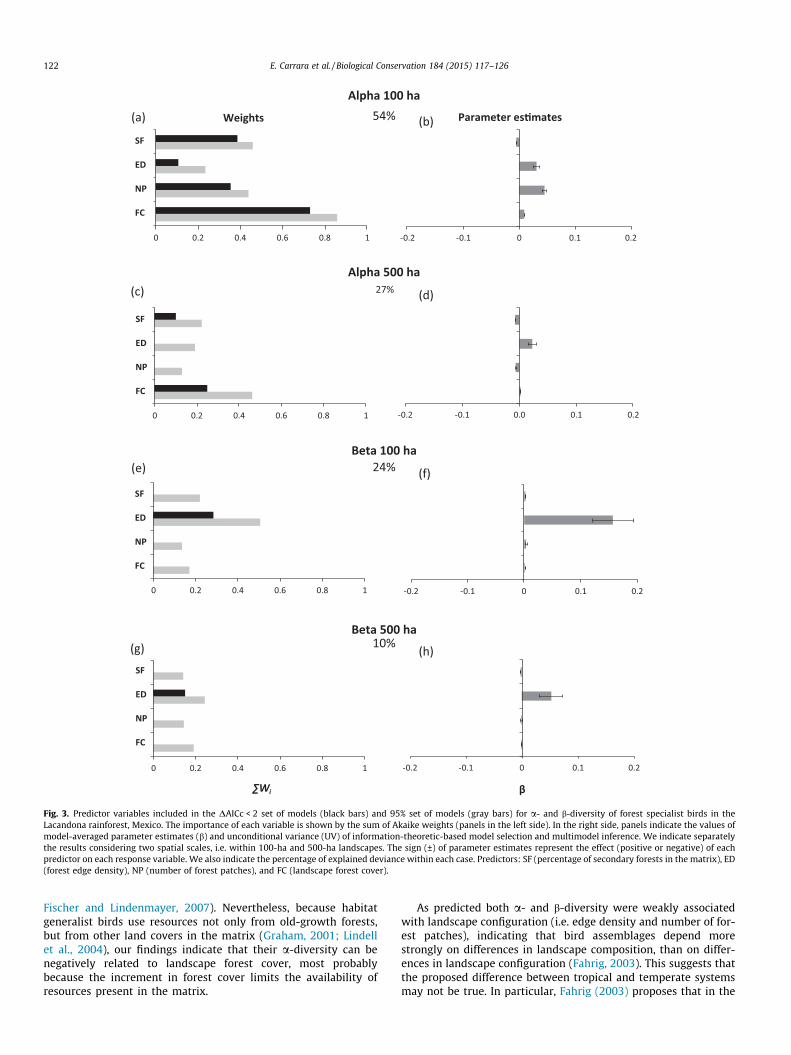
Our results indicate that a model-averaging approach wasappropriate because for most cases, the best model received lim-ited support (i.e. low Akaike weights) relative to alternative models(Table A3). In general, the diversity of forest specialist species had astronger association with the landscape metrics (10–54% ofexplained deviance; Fig. 3) than the diversity of forest generalistbirds, in which the models explained 623% of total deviance(Fig. 4). Also, in both groups of species the associations were stron-ger for a-diversity (10–54% of explained deviance) than forb-diversity (10–24% of explained deviance).
For the forest specialist group, the strongest associationbetween species diversity and landscape metrics was found fora-diversity at the 100-ha landscape scale (54% of explained devi-ance, Fig. 3a and b). In particular, a-diversity of forest specialistswas positively associated with old-growth forest cover and
negatively related to the percentage of secondary forest cover(Fig. 3b). These relationships also hold true at the 500-ha scale(Fig. 3c and d), suggesting that these metrics are the most impor-tant landscape drivers of a-diversity of specialist birds. Interest-ingly, at both scales, a-diversity of forest specialists was alsopositively related to forest edge density, but the sum of Akaikeweights was notably low (Fig. 3a and c). The effect of the numberof forest patches on a-diversity was scale dependent, changingfrom positive at the 100-ha scale (Fig. 3b) to negative at the 500-ha scale (Fig. 3d). Surprisingly, b-diversity for this group of birdswas explained mainly by a positive relation with forest edge den-sity at both scales (Fig. 2e–h). Again, at the smaller scale there wasmore deviance explained (24% of explained deviance in 100-halandscape versus 10% in 500-ha ones).
Regarding the forest generalist-species group, a-diversityincreased principally with a decrease of old-growth forest and sec-ondary forest cover, and an increase in the number of forestpatches in 100-ha landscapes (Fig. 4a and b). Yet none of these fac-tors showed a strong association with a-diversity at the 500-hascale, as indicated by the very low Akaike weights (Fig. 4c). Forb-diversity, of which only 12% of the deviance was explained atboth scales, the only landscape metric included in the best modelswas forest cover (Fig. 3e and g), showing a negative relation withforest generalists’ b-diversity (Fig. 3f and h).
4. Discussion
Our results show that landscape composition and configurationaffect the diversity of rainforest birds in the Lacandona region,Mexico, adding valuable information on the drivers of speciesdiversity in HMTLs. Several of our findings can be highlighted. First,as predicted, and consistent with previous studies in temperateareas (e.g. Fahrig, 1998, 2003; Smith et al., 2011), old-growth forestcover showed the strongest association with the diversity of forestspecialist species, with a positive effect on a-diversity at both spa-tial scales. Second, and contrary to our expectations, forest edgedensity was positively related to the diversity of forest specialistspecies, whereas the percentage of secondary forest in the matrixtended to be negatively related to a-diversity of both forest spe-cialist and generalist species. Third, as expected (Fahrig, 1998;Pardini et al., 2010; Newbold et al., 2014), the strength of all asso-ciations was higher for forest specialist than for habitat generalistspecies. Nevertheless, within both groups of birds, a-diversity wasmore strongly associated with landscape spatial changes than wasb-diversity. Finally, in general, species diversity was more stronglyassociated with landscape metrics measured at the 100-ha scalethan at 500-ha scale.
4.1. Species’ response to landscape changes
Bird a-diversity was positively and more strongly related tovariations in landscape forest cover than to variations in edgedensity and number of forest patches, particularly when consider-ing forest specialist species. This result is not surprising (seeFahrig, 2003), as this ecological group is expected to be more vul-nerable than the generalist group to changes in the amount ofhabitat available for them (Fahrig, 1998; Gillies and St. Clair,2010; Aben et al., 2010; Newbold et al., 2014). In particular, hab-itat heterogeneity and resource availability is expected toincrease with forest cover (Báldi, 2008; Zanette et al., 2000), thuscontributing to maintain more species, particularly those that aredependent on forest interior areas (Lindell et al., 2004). Also,landscapes with higher forest cover can maintain larger popula-tions, reducing the probability of extinction that results fromdemographic and environmental stochasticity (Hanski, 1999;
0 0.2 0.4 0.6 0.8 1
SF
ED
NP
FC
0 0.2 0.4 0.6 0.8 1
0 0.2 0.4 0.6 0.8 1
0 0.2 0.4 0.6 0.8 1
(g)
(a)
SF
ED
NP
FC
SF
ED
NP
FC
SF
ED
NP
FC
-0.2 -0.1 0 0.1 0.2
-0.2 -0.1 0.0 0.1 0.2
-0.2 -0.1 0 0.1 0.2
(f)
-0.2 -0.1 0 0.1 0.2
(h)
∑Wi β
(b)
(c) (d)
(e)
Alpha 100 ha54%
Alpha 500 ha27%
Beta 100 ha24%
Beta 500 ha10%
Parameter es�matesWeights
Fig. 3. Predictor variables included in the DAICc < 2 set of models (black bars) and 95% set of models (gray bars) for a- and b-diversity of forest specialist birds in theLacandona rainforest, Mexico. The importance of each variable is shown by the sum of Akaike weights (panels in the left side). In the right side, panels indicate the values ofmodel-averaged parameter estimates (b) and unconditional variance (UV) of information-theoretic-based model selection and multimodel inference. We indicate separatelythe results considering two spatial scales, i.e. within 100-ha and 500-ha landscapes. The sign (±) of parameter estimates represent the effect (positive or negative) of eachpredictor on each response variable. We also indicate the percentage of explained deviance within each case. Predictors: SF (percentage of secondary forests in the matrix), ED(forest edge density), NP (number of forest patches), and FC (landscape forest cover).
122 E. Carrara et al. / Biological Conservation 184 (2015) 117–126
Fischer and Lindenmayer, 2007). Nevertheless, because habitatgeneralist birds use resources not only from old-growth forests,but from other land covers in the matrix (Graham, 2001; Lindellet al., 2004), our findings indicate that their a-diversity can benegatively related to landscape forest cover, most probablybecause the increment in forest cover limits the availability ofresources present in the matrix.
As predicted both a- and b-diversity were weakly associatedwith landscape configuration (i.e. edge density and number of for-est patches), indicating that bird assemblages depend morestrongly on differences in landscape composition, than on differ-ences in landscape configuration (Fahrig, 2003). This suggests thatthe proposed difference between tropical and temperate systemsmay not be true. In particular, Fahrig (2003) proposes that in the

0 0.2 0.4 0.6 0.8 1
SF
ED
NP
FC
0 0.2 0.4 0.6 0.8 1
0 0.2 0.4 0.6 0.8 1
0 0.2 0.4 0.6 0.8 1
SF
ED
NP
FC
SF
ED
NP
FC
SF
ED
NP
FC
-0.08 -0.04 0 0.04 0.08
-0.08 -0.04 0.00 0.04 0.08
-0.08 -0.04 0 0.04 0.08
-0.08 -0.04 0.00 0.04 0.08
∑Wi β
(a) (b)
(c)
(e)
(g)
(d)
(f)
(h)
Alpha 100 ha23%
Alpha 500 ha10%
Beta 100 ha12%
Beta 500 ha12%
Parameter es�matesWeights
Fig. 4. Predictor variables included in the DAICc < 2 set of models (black bars) and 95% set of models (gray bars) for a- and b-diversity of habitat generalist birds. The sum ofAkaike weights (panels in the left side) indicates the importance of each variable. In the right side, panels indicate the values of model-averaged parameter estimates (b) andunconditional variance (UV) of information-theoretic-based model selection and multimodel inference. We indicate separately the results considering two spatial scales, i.e.within 100-ha and 500-ha landscapes. The sign (±) of parameter estimates represent the effect (positive or negative) of each predictor on each response variable. We alsoindicate the percentage of explained deviance within each case. Predictors: SF (percentage of secondary forests in the matrix), ED (forest edge density), NP (number of forestpatches), and FC (landscape forest cover).
E. Carrara et al. / Biological Conservation 184 (2015) 117–126 123
tropics habitat fragmentation per se (i.e. controlling for habitatloss) could have a negative effect on species diversity, as fragmen-tation per se results in smaller forest patches and higher forest
edge in the landscape, and tropical species usually respond nega-tively to these habitat spatial patterns (e.g. Laurance et al., 2002;Lindell et al., 2007). Yet we found that, in agreement with Smith

124 E. Carrara et al. / Biological Conservation 184 (2015) 117–126
et al. (2011), the impact of forest loss was consistent across severalspatial scales, whereas the impact of the number of old-growth for-est patches was weak and varied across scales. This can be relatedto the fact that the remaining forest cover is relatively high in theregion (>40% of forest cover), which means that the remaining for-est patches tend to be large, presenting a high landscape connec-tivity, thus facilitating inter-patch animal movements (see Ewersand Didham, 2006; Fischer and Lindenmayer, 2007; Pardini et al.,2010; Villard and Metzger, 2014).
Contrary to our expectations, a-diversity of both forest special-ist and generalist birds was negatively related to the percentage ofsecondary forests in the matrix. Both specialist and generalist birdshave been observed using resources from this type of forests(Lindell et al., 2004; Gillies and St. Clair, 2010). However, there isevidence that species richness and composition in secondary forestis different from that in primary forest (Banks-Leite et al., 2010;Newbold et al., 2014), and some studies show that the ability ofbird species to use secondary habitats in the tropics does notreduce their risk of becoming locally extinct as a result of defores-tation (Harris and Pimm, 2004). In fact, secondary forest could beacting as ecological traps for some birds, by acting as a low-qualityhabitat that birds prefer over high-quality habitats (e.g. because ofthe very high productivity of secondary forests; Chazdon, 2014)but in which they have lower fitness (e.g. because they are exposedto higher predation pressures and competition for food resources,or present lower nesting success; see Battin, 2004). This could helpto explain the negative relationship between a-diversity of bothgroups of birds and secondary forest in the matrix, but furtherstudies are required to demonstrate if reproductive success islower in secondary forests or if birds suffer higher predation pres-sures in this land cover type.
Forest edge density showed the weakest impact on bird diver-sity, but most associations with this factor tended to be positive.In fact, this factor was included in the best subset of models fora- and b-diversity of forest specialist birds at the 100-ha scale,and for b-diversity at the 500-ha scale (with a positive effect inall cases). We expected a negative impact of forest edge densitybecause this factor is related to negative edge effects (see Lindellet al., 2007). However, forest edge density is also related to patchshape complexity, which is known to increase the probability ofpatch colonization, thus increasing the interchange of speciesand individuals in patches with more complex shapes (Ewers andDidham, 2006). This can explain why a- and b-diversity withinsites increased in landscapes with higher forest edge density.
Interestingly, a-diversity was more strongly associated withlandscape composition and configuration than b-diversity amongsampling points (i.e. within sites). Because of dispersal limitationand variations in environmental conditions, b-diversity usuallyincreases with the isolation distance among sampling areas(Hubbell, 2001; Karp et al., 2012; Arroyo-Rodríguez et al., 2013).Nevertheless, in our study sites the composition and structure ofvegetation did not differ significantly among forest patches(Hernández-Ruedas et al., 2014), and b-diversity was estimatedthrough points located close to each other, with inter-point dis-tances remaining almost constant across sites. This can help toexplain why the associations between the landscape predictorsand b-diversity were weaker than the associations with a-diversity.
4.2. Conclusions and conservation implications
Our findings support the idea that a multi-scale analysis isrequired to accurately assess the impact of landscape structureon species’ responses (Cerezo et al., 2010; Smith et al., 2011;Thornton et al., 2011; Fahrig, 2013), as in our study, bird diversitywas more strongly influenced by local-scale landscape patterns
(i.e. by landscape metrics measured at the 100-ha than landscapemetrics at the 500-ha). This can be associated with the fact thatspecies diversity was evaluated at the patch level, and our sampleswere probably more representative of the 100-ha landscapes thanof the 500-ha landscapes. Yet the negative impact of forest coverloss on a-diversity of specialist birds was consistent across thetwo spatial scales, indicating that habitat loss is an importantthreat to forest specialist birds in fragmented landscapes (Fahrig,1998; Villard et al., 1999; Castellón and Sieving, 2006; Stoufferet al., 2006; Smith et al., 2011; Newbold et al., 2014). Therefore,if current land-use changes continue in the region (see Courtieret al., 2012), it is highly probable that the number of forest-depen-dent species will decline in the near future (Karp et al., 2012). Thisprocess could alter key ecological relationships among birds andtheir environment (e.g. plant pollination, seed dispersal, seed dep-redation, pest control; Breitbach et al., 2010; Anderson et al., 2011),potentially threatening the maintenance of ecosystem integrity.
In contrast to forest specialists, however, habitat generalistsseems to be favored by deforestation, as a-diversity of this groupof birds was negatively related to forest cover and positivelyrelated to the number of forest patches. It is well known that spe-cies that are able to use resources from forest edges and other ele-ments of the anthropogenic matrix, not only have a lowerprobability of extinction in forest patches, but they tend to befavored by deforestation (Bierregaard et al., 1992; Stouffer andBierregard, 1995; Laurance et al., 2002; Lindell et al., 2004;San-José et al., 2014).
Such positive effect of deforestation on generalist birds is how-ever expected to be higher in moderately managed than in severelydeforested landscapes (e.g. Melo et al., 2013). In this sense, weworked in a region in which: (1) deforestation is a relatively recentevent (<40 years ago); (2) the remaining forest cover is relativelyhigh (approximately 40%); and (3) the matrix that surrounds theforest patches is very heterogeneous. Under this landscape sce-nario we can expect landscape connectivity and resource availabil-ity to still be very high, thus contributing to the maintenance oftheir original fauna (Garmendia et al., 2013; San-José et al., 2014;Hernández-Ordóñez et al., 2014) and flora (Hernández-Ruedaset al., 2014). Yet the future of birds in this region is uncertain, asthere is an increasing support for the production of oil palm (Elaeisguineensis) plantations (see the ‘Trópico Húmedo’ project;SAGARPA, 2013), and many bird species are unable to adapt to con-version of forest to oil palm plantations (e.g. Koh and Wilcove,2008). Therefore, future conservation and management initiativesin the region should consider the key relevance of preventing fur-ther deforestation, to maintain at least the current levels of forestcover. This will help to maintain landscape connectivity andresources that can be of key relevance for the conservation of birdsin this biodiversity hotspot.
Acknowledgments
This research was funded by the Programa de Apoyo a Proyec-tos de Investigación e Innovación Tecnológica (PAPIIT), DGAPA-UNAM (Projects IA-203111, IB-200812 and RR-280812). ECobtained a scholarship from CONACyT, Mexico. The Centro deInvestigaciones en Ecosistemas (UNAM) provided logical support.H. Ferreira and A. Valencia provided technical support, and A.Navarrete provided the SPOT images. C. Dobler digitized the maps.We are indebted to the local people of the Marqués de Comillasregion. Part of this paper was analyzed while EC was on a researchstay at the Geomatics and Landscape Ecology Laboratory, CarletonUniversity funded by the Programa de Apoyo a los Estudios dePosgrado (PAEP), UNAM, and the Programa de Becas Mixtas paraBecarios CONACyT nacionales, CONACyT.

E. Carrara et al. / Biological Conservation 184 (2015) 117–126 125
Appendix A. Supplementary data
Supplementary data associated with this article can be found, inthe online version, at http://dx.doi.org/10.1016/j.biocon.2015.01.014.
References
Aben, J., Adriaensen, F., Thijs, K.W., Pellikka, P., Siljander, M., Lens, L., et al., 2010.Effects of matrix composition and configuration on forest bird movements in afragmented Afromontane biodiversity hotspot. Anim. Conserv. 15, 658–668.
Anderson, S.H., Kelly, D., Ladley, J.J., Molloy, S., Terry, J., 2011. Cascading effects ofbird functional extinction reduce pollination and plant density. Science 331,1068–1071.
Antongiovanni, M., Metzger, J., 2005. Influence of matrix habitats on the occurrenceof insectivorous bird species in Amazonian forest fragments. Biol. Conserv. 122,441–451.
Arroyo-Rodríguez, V., Rös, M., Escobar, F., Melo, F.P.L., Santos, B.A., Tabarelli, M.,et al., 2013. Plant b-diversity in fragmented rain forest: testing floristichomogenization and differentiation hypotheses. J. Ecol. 6, 1449–1458.
Báldi, A., 2008. Habitat heterogeneity overrides the species–area relationship. J.Biogeogr. 35, 675–681.
Banks-Leite, C., Ewers, R.M., Metzger, J.P., 2010. Edge effects as the principal cause ofarea effects on birds in fragmented secondary forest. Oikos 119, 918–926.
Battin, J., 2004. When good animals love bad habitats: ecological traps and theconservation of animal populations. Conserv. Biol. 18, 1482–1491.
Betts, M.G., Forbes, G.J., Diamond, A.W., Taylor, P.D., 2006. Independent effects offragmentation on forest songbirds: an organism-based approach. Ecol. Appl. 16,1076–1089.
Bibby, C.K., Burgess, N.D., Hill, D.D., Mustoe, S.H., 2000. Bird Census Techniques,second ed. British Trust of Ornithology, Academic Press, Great Britain.
Bierregaard, R.O., Lovejoy, T.E., Kapos, V., Dossantos, A.A., Hutchings, R.W., 1992.The biological dynamics of tropical rainforest fragments. BioScience 42, 859–866.
Blake, J.G., Loiselle, B.A., 2001. Bird assemblages in second-growth and old-growthforests, Costa Rica: perspectives from mist nets and point counts. The Auk 118,304–326.
Breitbach, N., Laube, I., Steffan-Dewenter, I., Böhning-Gaese, K., 2010. Bird diversityand seed dispersal along a human land-use gradient: high seed removal instructurally simple farmland. Oecologia 162, 965–976.
Burnham, K.P., Anderson, D.R., 2002. Model selection and Multimodel Inference, aPractical Information-Theoretic Approach, second ed. Springer Science +Bussines Media Inc, USA.
Calcagno, V., Mazancourt, C., 2010. Glmulti: an R package for easy automated modelselection with (generalized) linear models. J. Stat. Software 34, 1–29.
Camara, G., Souza, R.C.M., Freitas, U.M., Garrido, J., 1996. Spring: integrating remotesensing and GIS by object-oriented data modelling. Comput. Graphics 20, 395–403.
Castellón, T.D., Sieving, K.E., 2006. An experimental test of matrix permeability andcorridor use by an endemic undestory bird. Conserv. Biol. 20, 135–145.
Cerezo, A., Perelman, S., Robbins, C.S., 2010. Landscape-level impact of tropicalforest loss and fragmentation on bird occurrence in eastern Guatemala. Ecol.Mod. 221, 512–526.
Chao, A., Jost, L., 2012. Coverage-based rarefaction and extrapolation: standardizingsamples by completeness rather than size. Ecology 93, 2533–2547.
Chao, A., Shen, T.J., 2010. Program SPADE: species prediction and diversityestimation. Program and user’s guide. CARE, Hsin-Chu, Taiwan.
Chazdon, R.L., 2014. Second growth. The promise of tropical forest regeneration inan age of deforestation. The University of Chicago Press, Chicago, IL.
Courtier, S., Núñez, J.M., Kolb, M., 2012. Measuring tropical deforestation with errormargins: a method for REDD monitoring in south–eastern Mexico. In:Sudarshana, P. (Ed.), Tropical Forests. InTech Shanghai, China, pp. 269–296.
Crawley, M.J., 2007. The R Book. John Wiley & Sons Ltd.Dunning, J.B., Danielson, B.J., Pulliam, H.R., 1992. Ecological processes that affect
populations in complex landscapes. Oikos 65, 169–175.Ethier, K., Fahrig, L., 2011. Positive effects of forest fragmentation, independent of
forest amount, on bat abundance in eastern Ontario, Canada. Landscape Ecol.26, 865–876.
Ewers, R.M., Didham, R.K., 2006. Confounding factors in the detection of speciesresponses to habitat fragmentation. Biol. Rev. 81, 117–142.
Fahrig, L., 1998. When does fragmentation of breeding habitat affect populationsurvival? Ecol. Model. 105, 273–292.
Fahrig, L., 2003. Effects of habitat fragmentation on biodiversity. Ann. Rev. Ecol.Evol. Syst. 34, 487–515.
Fahrig, L., 2007. Non-optimal animal movement in human-altered lanscapes. Funct.Ecol. 21, 1003–1015.
Fahrig, L., 2013. Rethinking patch size and isolation effects: the habitat amounthypothesis. J. Biogeogr. 40, 1649–1663.
Fahrig, L., Baudry, J., Brotons, L., Burel, F.G., Crist, T.O., Fuller, R.J., et al., 2011.Functional landscape heterogeneity and animal biodiversity in agriculturallandscapes. Ecol. Lett. 14, 101–112.
Fischer, J., Lindenmayer, D.B., 2007. Landscape modification and habitatfragmentation: a synthesis. Global Ecol. Biogeogr. 16, 265–280.
Flohre, A., Fischer, C., Aavik, T., Bengtsson, J., Berendse, F., Bommarco, R., et al., 2011.Agricultural intensification and biodiversity partitioning in Europeanlandscapes comparing plants, carabids, and birds. Ecol. Appl. 21, 1772–1781.
Gardner, T.A., Barlow, J., Chazdon, R., Ewers, R.M., Harvey, C.A., Peres, C.A., et al.,2009. Prospects for tropical forest biodiversity in a human-modified world. Ecol.Lett. 12, 561–582.
Garmendia, A., Arroyo-Rodríguez, V., Estrada, A., Naranjo, E.J., Stoner, K.E., 2013.Landscape and patch attributes impacting medium- and large-sized terrestrialmammals in a fragmented rain forest. J. Trop. Ecol. 29, 331–344.
Gillies, C.S., St. Clair, C.C., 2010. Functional responses in habitat selection by tropicalbirds moving through fragmented forest. J. Appl. Ecol. 47, 182–190.
González-García, F., 1993. Avifauna de la reserva de la biosfera ‘‘Montes Azules’’selva Lacandona, Chiapas, México. Acta Zool. Mex. 55, 1–86.
Graham, C., 2001. Factors influencing movement patterns of Keel-Billed Toucans ina fragmented tropical landscape in southern Mexico. Conserv. Biol. 15, 1789–1798.
GRASS Development Team, 2011. Geographic Resources Analysis Support System(GRASS) Software. Open Source Geospatial Foundation Project.
Harris, G.M., Pimm, S.L., 2004. Bird species’ tolerance of secondary forest habitatsand its effects on extinction. Conserv. Biol. 18, 1607–1616.
Hanski, I., 1999. Metapopulation Ecology. Oxford University Press, Nueva York.Hernández-Ordóñez, O., Martínez-Ramos, M., Arroyo-Rodríguez, V., González-
Hernández, A., González-Zamora, A., Zárate, D., Reynoso, V.H., 2014. Checklist,distribution and conservation status of the amphibians and reptiles in theLacandona rainforest, Mexico: an update after 20 years of research. Trop.Conserv. Sci. 7, 1–25.
Hernández-Ruedas, M.A., Arroyo-Rodríguez, V., Meave, J.A., Martínez-Ramos, M.,Ibarra-Manríquez, G., Martínez, E., et al., 2014. Conserving tropical tree diversityand forest structure: the value of small rainforest patches in moderately-managed landscapes. PLoS One 9, e98932.
Hubbell, S.P., 2001. The Unified Neutral Theory of Biodiversity and Biogeography.Princeton University Press, Princeton.
Hutto, R.L., Pletschet, S.M., Hendricks, P., 1986. A fixed-radius point count methodfor nonbreeding and breeding season use. The Auk 103, 593–602.
Ibarra-Macias, A., Robinson, W.D., Gaines, M.S., 2011. Experimental evaluation ofbird movements in a fragmented Neotropical landscape. Biol. Conserv. 144,703–712.
Jost, L., 2007. Partitioning diversity into independent alpha and beta components.Ecology 88, 2427–2439.
Karp, D.S., Rominger, A.J., Zook, J., Ranganathan, J., Ehrlich, P.R., Daily, G.C., 2012.Intensive agriculture erodes b-diversity at large scales. Ecol. Lett. 15, 963–970.
Kennedy, C.M., Campbell Grant, E.H., Neel, M.C., Fagan, W.F., Marra, P.P., 2011.Landscape matrix mediates occupancy dynamics of Neotropical avianinsectivores. Ecol. Appl. 21, 1837–1850.
Koh, L.P., Wilcove, D.S., 2008. Is oil palm agriculture really destroying tropicalbiodiversity? Conserv. Lett. 1, 60–64.
Laurance, W.F., Lovejoy, T.E., Vasconcelos, H.L., Bruna, E.M., Didham, R.K., Stouffer,P.C., et al., 2002. Ecosystem decay of Amazonian forest fragments: a 22-yearinvestigation. Conserv. Biol. 16, 605–618.
Laurance, W.F., Sayer, J., Cassman, K.G., 2014. Agricultural expansion and its impactson tropical nature. Trends Ecol. Evol. 29, 107–116.
Lindell, C.A., Chomentowski, W.H., Zook, J.R., 2004. Characteristics of bird speciesusing forest and agricultural land covers in southern Costa Rica. Biodivers.Conserv. 13, 2419–2441.
Lindell, C.A., Riffel, S.K., Kaiser, S.A., Battin, A.L., Smith, M.L., Sisk, T.D., 2007. Edgeresponses of tropical and temperate birds. J. Ornithol. 119, 205–220.
Martínez, E., 2003. Marqués de Comillas. In: Lichtinger, V., Enkerlin, E., Enríquez C.,García, P. (Eds.), La Deforestación en 24 Regiones PRODERS. Secretaría de MedioAmbiente y Recursos Naturales, Mexico City, pp. 124–131.
McGarigal, K., Cushman, S.A., 2002. Comparative evaluation of experimentalapproaches to the study of habitat fragmentation effects. Ecol. Appl. 12, 335–345.
Medellín, R.A., 1994. Mammal diversity and conservation in the Selva Lacandona,Chiapas, Mexico. Conserv. Biol. 8, 780–799.
Melo, F.P.L., Arroyo-Rodríguez, V., Fahrig, L., Martínez-Ramos, M., Tabarelli, M.,2013. On the hope for biodiversity-friendly tropical landscapes. Trends Ecol.Evol. 28, 461–468.
Murcia, M., 1995. Edge effects in fragmented forests: implications for conservation.Trends Ecol. Evol. 10, 58–62.
Neter, J., Kutner, M.H., Nachtsheim, C.J., Wasserman, W., 1996. Applied LinearStatistical Models, fourth ed. Irwin, Chicago.
Newbold, T., Hudson, L.N., Phillips, H.R.P., Hill, S.L.L., Contu, S., Lysenko, I., et al.,2014. A global model of the response of tropical and sub-tropical forestbiodiversity to anthropogenic pressures. Proc. R. Soc. B 281, 20141371.
Odum, E.P., Kuenzler, E.J., 1955. Measurement of territory and home range size inbirds. The Auk 72, 128–137.
Pardini, R., de Arruda Bueno, A., Gardner, T.A., Prado, P.I., Metzger, J.P., 2010. Beyondthe fragmentation threshold hypothesis: regime shifts in biodiversity acrossfragmented landscapes. PloS One 5, e13666.
Pardini, R., Marques de Souza, S., Braga-Neto, R., Metzger, J.P., 2005. The role offorest structure, fragment size and corridors in maintaining small mammalabundance and diversity in an Atlantic forest landscape. Biol. Conserv. 124,253–266.
Pinotti, B.T., Pagotto, C.P., Pardini, R., 2012. Habitat structure and food resources forwildlife across successional stages in a tropical forest. Forest Ecol. Manage. 283,119–127.

126 E. Carrara et al. / Biological Conservation 184 (2015) 117–126
Püttker, T., de Arruda A., Prado, P.I., Pardini, R., 2014. Ecological filtering or randomextinction? Beta-diversity patterns and the importance of niche-based andneutral processes following habitat loss. Oikos (in press), http://dx.doi.org/10.1111/oik.01018.
SAGARPA, 2013. Secretaría de Agricultura, Ganadería, Desarrollo Rural, Pesca yAlimentación. Proyectos Estratégicos – Trópico Húmedo. http://www.sagarpa.gob.mx/ProgramasSAGARPA/2013/protrans/tropicohumedo/Paginas/Descripci%C3%B3n.aspx (accessed May 2013).
San-José, M., Arroyo-Rodríguez, V., Sánchez-Cordero, V., 2014. Association betweensmall rodents and forest patch and landscape structure in a fragmentedrainforest. Trop. Conserv. Sci. 7, 403–422.
Schoener, T.W., 1968. Sizes of feeding territories among birds. Ecology 49, 123–141.Smith, A.C., Fahrig, L., Francis, C.M., 2011. Landscape size affects the relative
importance of habitat amount, habitat fragmentation, and matrix quality onforest birds. Ecography 34, 103–113.
Stotz, D.F., Fitzpatrick, J.W., Parker, T.A., Moskovits, D.K., 1996. Neotropical BirdsEcology and Conservation. Chicago University Press.
Stouffer, P.C., Bierregard, R.O., 1995. Use of Amazonian forest fragments byunderstory insectivorous birds. Ecology 76, 2129–2145.
Stouffer, P.C., Bierregaard Jr., R.O., Strong, C., Lovejoy, T.E., 2006. Long-termlandscape change and bird abundance in Amazonian rainforest fragments.Conserv. Biol. 20, 1212–1223.
Thornton, D.H., Branch, L.C., Sunquist, M.E., 2011. The relative influence of habitatloss and fragmentation: do tropical mammals meet the temperate paradigm?Ecol. Appl. 21, 2324–2333.
Trzcinski, M.K., Fahrig, L., Merriam, G., 1999. Independent effects of forest cover andfragmentation on the distribution of forest breeding birds. Ecol. Appl. 9, 586–593.
Tscharntke, T., Tylianakis, J.M., Rand, T.A., Didham, R.K., Fahrig, L., Batáry, P., et al.,2012. Landscape moderation of biodiversity patterns and processes – eighthypotheses. Biol. Rev. 87, 661–685.
Villard, M.A., Metzger, J.P., 2014. Beyond the fragmentation debate: a conceptualmodel to predict when habitat configuration really matters. J. Appl. Ecol. 51,309–318.
Villard, M.A., Trzcinski, M.K., Merriam, G., 1999. Fragmentation effects on forestbirds: relative influence of woodland cover and configuration on landscapeoccupancy. Conserv. Biol. 13, 774–783.
Whittaker, R.H., 1960. Vegetation of the Siskiyou mountains, Oregon and California.Ecol. Monogr. 30, 279–338.
Whittingham, M.J., Swetnam, R.D., Wilson, J.D., Chamberlain, D.E., Freckleton, R.P.,2005. Habitat selection by yellowhammers Emberiza citronella on lowlandfarmland at two spatial scales: implications for conservation management. J.Appl. Ecol. 42, 270–280.
Zanette, L., Doyle, P., Tremont, S.M., 2000. Food shortage in small fragments:evidence from an area-sensitive passerine. Ecology 81, 1654–1666.