impact of income on nutrient intakes: implications for
TRANSCRIPT
Impact of income on nutrient intakes: implications for undernourishment and obesity
Article
Accepted Version
Salois, M. J., Tiffin, R. and Balcombe, K. G. (2012) Impact of income on nutrient intakes: implications for undernourishment and obesity. Journal of Development Studies, 48 (12). pp. 1716-1730. ISSN 1743-9140 doi: https://doi.org/10.1080/00220388.2012.658376 Available at http://centaur.reading.ac.uk/25024/
It is advisable to refer to the publisher’s version if you intend to cite from the work. See Guidance on citing .
To link to this article DOI: http://dx.doi.org/10.1080/00220388.2012.658376
Publisher: Taylor and Francis
All outputs in CentAUR are protected by Intellectual Property Rights law, including copyright law. Copyright and IPR is retained by the creators or other copyright holders. Terms and conditions for use of this material are defined in

the End User Agreement .
www.reading.ac.uk/centaur
CentAUR
Central Archive at the University of Reading
Reading’s research outputs online

1
Impact of Income on Nutrient Intakes: Implications for Undernourishment and Obesity
Abstract
The relationship between income and nutrient intake is explored. Nonparametric, panel, and
quantile regressions are used. Engle curves for calories, fat, and protein are approximately
linear in logs with carbohydrate intakes exhibiting diminishing elasticities as incomes
increase. Elasticities range from 0.10 to 0.25, with fat having the highest elasticities.
Countries in higher quantiles have lower elasticities than those in lower quantiles. Results
predict significant cumulative increases in calorie consumption which are increasingly
composed of fats. Though policies aimed at poverty alleviation and economic growth may
assuage hunger and malnutrition, they may also exacerbate problems associated with obesity.
Keywords: calorie and nutrient consumption, food and nutrition policy, income elasticities,
nonparametric, panel, quantile regression.
2
Introduction
The number of undernourished people in the world increased from 854 million in
2006 to an estimated 1.02 billion in 2009, representing the greatest amount of hungry people
in nearly half a century (FAO 2009). The FAO (2009) contends that while the current
economic crisis plays a role in the global escalation of hunger, surging domestic food prices
and deteriorating household incomes are especially to blame. Paradoxically, the growing
international prevalence of hunger and starvation resulting from energy and nutrient
deficiencies continues amidst global concern regarding the rapidly increasing prevalence of
chronic diseases resulting from overweight and obesity. As of 2005, an estimated 1.6 billion
adults over age fifteen were overweight and 400 million were obese (WHO 2006). Although
the spread of obesity was confined historically to the developed countries, emerging trends
indicate the growth of overweight and obesity in the developing world (Hossain et al. 2007).
In fact, in many developing countries both childhood malnutrition and adult obesity are
concurrently observed within households resulting in a "dual burden of disease" (Doak et al.
2004; Caballero 2005). The links between economic growth, nutrition, and health highlight
the importance of understanding the relationship between income and nutritional status. Poor
nutrition can spur a cycle leading to poor health which in turn results in low productivity and
diminished economic growth with further declines in nutrition. Nutritional status plays an
important role in a number of health and socio-economic indicators including the prevalence
of disease, educational attainment, and labour market outcomes (Pinstrup-Andersen 2007).
A potential key determinant of nutritional status is income. Therefore, studies on the
relationship between income and nutrient intake receive considerable attention. Knowledge
of these elasticities is a critical component in the design of policies to combat malnutrition in
poor countries and to improve diets in both rich and poor countries. For example, a large
elasticity suggests a policy designed to increase the income of the poor and promote

3
economic growth is an effective long-term strategy. Conversely, a small elasticity suggests
limited scope for income-enhancing economic policies. Just as important, knowing how
calorie and nutrient elasticities change with income becomes necessary in light of the obesity
epidemic. The process of economic development spurs a "nutrition transition" in which diets
high in carbohydrates are replaced with more varied diets high in fat (Popkin 1994). If
calorie-income elasticities show no indication of decreasing at higher incomes there is a
stronger need for public programs to influence diets in developed and developing countries.
Estimates of the income elasticity are abundant and the true approximate magnitude
remains a controversial topic because of the wide range of estimates. Bouis and Haddad
(1992) provide a good review and find elasticity estimates in the range of 0.01 to 1.18. With
the evidenced mixed, the debate persists regarding the actual relationship between nutrient
intake and income and the appropriate economic policies for combating hunger and
malnutrition. Also left unclear is the extent the nutrition transition is expected to occur in the
developing economies, which involves not only a worsening in diet quality across the
developing world but also a likely global epidemic from diet-related chronic disease. The role
of income in nutrition is clearly important for developing countries. However, as people in
developed countries consume calories at increased levels, asking if further increases in
income are likely to aggravate problems associated with obesity also becomes important.
The objective of this paper is to assess the relationship between income and nutrient
intake in a cross-national sample of developing and developed countries across two different
time periods. This paper aims to determine if there is a significantly positive relationship
between income and calorie-macronutrient intakes. This paper contributes to the literature in
three ways. First, while most studies tend to focus on one country in a single year using
household-level data, the data also allow the nutrient-income relationship to vary between
levels of economic development and between time periods, which provides a broader view of

4
assessing the nutrition transition. Estimates from an aggregate Engel curve using international
data also provide a global perspective and generalize results at a macroeconomic level.
Second, while the literature tends to focus on calorie intakes, this paper decomposes
calories into three important macronutrients (carbohydrates, proteins, and fats), permitting the
relationship with income to differ between nutrients. Income elasticity estimates that break
down calorie intake into individual nutrients are important from a policy perspective. For
example, economic growth may increase total calorie intake, reducing problems related to
undernutrition, but may also result in a greater proportion of fat in the diet, aggravating
problems of obesity and diet-related chronic diseases. The income-calorie elasticity alone is
not enough to guide policy makers. Understanding the general composition of the diet and the
consumption of particular nutrients becomes crucial in this context.
Third, three estimators are utilized: panel regression, nonparametric regression, and
quantile regression. Most studies assume a parametric relationship, which imposes strict
assumptions. In addition to using a panel estimator to test for time-effects, this paper also
uses a nonparametric estimator. Since the nonparametric approach lets the relationship be
both non-linear and non-monotonic, calorie intakes between poor households and rich
households can respond differently to income. Quantile regression assesses the heterogeneity
in intake response to income across countries over time. Since the effect of income may differ
across the distribution of calorie intake, particular segments of the intake distribution are of
great interest, especially from a public health and nutrition policy perspective.
Literature Review
Historically, the "conventional wisdom" of the World Bank and other development
institutions was that deficient energy intake and hunger can be assuaged through income
growth (World Bank 1980, 1981). However, a series of articles emerged in the 1980s casting
doubt on the role of income (Wolfe and Behrman 1983; Behrman and Wolfe 1984; Behrman
5
and Deolalikar 1987). The role of income continues to be interest since contrasting results
appear throughout the literature. While the positive relationship between nutrient intake and
income is reinforced in some studies, other studies find either small or insignificant income
elasticities (Sahn 1988; Ravallion 1990; Bouis 1994). Although a substantial literature warns
against an income-focused policy, the role of income is still considered important by many
institutions. According to the latest FAO (2009, p.36) report on food insecurity, the recent
"diminished economic access to food because of higher prices was compounded by lower
incomes." While a number of early papers substantiate the conventional wisdom of the World
Bank before the "revisionist" papers emerged in the 1980s (Pinstrup-Andersen and Caicedo
1978; Ward and Sanders 1980), more recent studies further counter the revisionist regime
(Subramanian and Deaton 1996; Dawson and Tiffin 1998; Tiffin and Dawson 2002; Abdulai
and Aubert 2004) and emphasize an income-drive approach. Table 1 provides a summary of
recent studies since the review in Bouis and Haddad (1992). The estimated calorie elasticities
are of moderate magnitude (between 0.2 and 0.5) and most authors conclude that improving
income is crucial to combating malnutrition.
The existing evidence on income elasticities for nutrient intake from single-country
studies reveals considerable differences (Pitt and Rosenzweig 1985; Berhman and Deolalikar
1989). Different approaches partly explain the variation in estimates. One important
difference is how the Engel curve and resulting income elasticity is estimated. Generally two
approaches to estimate the income-calorie relationship are followed in the literature. The first
approach uses individual level data obtained from household surveys. Some micro-level
studies follow an indirect approach and use food expenditure survey data to estimate a model
of food demand and then convert food demand elasticities into nutrient demand elasticities.
Other micro-level studies opt for a direct approach and use food diaries based on individual
dietary intake recall to estimate the nutrient-income elasticities directly. The second approach
6
uses aggregate data on average per capita dietary energy supply derived from national food
balance sheets. Aggregate studies either employ annual time series data for a specific country
or use cross-sectional data on a number of countries in a specific year. Studies using
aggregate data tend to obtain smaller elasticities than those that use more micro-level data.
Even if reasonably sized and statistically significant income-calorie elasticities are
found, the role of income in nutritional status is still unclear since people may shift the
composition of their nutrient consumption as income increases (Behrman and Deolalikar
1989). Evidence suggests that as incomes rise household expenditure on food increases
because more expensive food is being purchased, but the nutrient content of these foods does
not increase proportionately (Pitt 1983; Behrman, Deolalikar, and Wolfe 1988).
Improvements in income may result in increases in food expenditures or total calorie intake
but this may not coincide with a diet more rich in nutrients (Behrman and Deolalikar 1987).
Households tend to increase the variety of their diet based on features other than nutrient
content, such as taste and quality, as they substitute away from cheaper sources of calories
towards more expensive ones. Conversely, studies that uncover a small or zero elasticity do
not necessarily imply that a change in income does not affect nutrition. For example, a drop
in income may result in unchanged calorie intake, but the consumption of vital nutrients may
fall as households substitute towards cheaper and less nutritious foods.
In addition to problems of deficient calorie and nutrient intake is the problem of
excessive intake leading to overweight and obesity. The World Health Organization (2006)
projects that by 2015 nearly 2.3 billion adults will be overweight and over 700 million will be
obese. As developing countries experience economic growth, overweight and obesity are on
the rise in low- and middle-income countries, particularly in urban areas (WHO 2006).
Higher income countries tend to obtain most of their dietary energy supply from fat
(Drewnowski 2003). The analysis in Drewnowski and Popkin (1997) reveals a global

7
convergence towards a diet deriving a higher proportion of energy from fat across a sample
of developed and developing countries. Specifically, they warn about the possibility that a
diet containing close to 30% of energy from fat could become the global norm. Also
worrying is the trend that the nutrition transition is occurring at lower levels of income than
previously thought. As pointed out in Popkin and Ng (2007, p.200), "even poor nations had
access to a relatively high-fat diet by 1990 when a diet deriving 20% of energy (kilocalories)
from fat was associated with countries that have a GNP of only $750 per capita".
Data and Econometric Methods
A cross-sectional sample of 171 developing and developed countries across two time
periods (1990-1992 and 2003-2005) is constructed using national income and nutrient data
(see the available appendix for countries included). Aggregate data on national income data is
sourced from the International Financial Statistics of the International Monetary Fund and is
the Gross Domestic Product (GDP) for each country in billions of 2005 U.S. dollars. To
convert these values to per capita terms, population data is obtained from the Penn World
Tables. Hence, income refers to GDP per capita and not household income or total
expenditure. Aggregate data on average per capita dietary energy supply are derived from
national food balance sheets obtained from the FAO Statistics Division. Dietary energy
consumption per person is defined as the amount of food, in kilocalories per day, for each
individual in the total population. The measure is based on food available for human
consumption computed as the residual from the total food supply available from production
and trade less waste and other non-food uses, such as from industry or agriculture (see FAO
1996 for a full description of the data). Similar data are constructed for key macronutrients
including carbohydrates, proteins, and fats. It should be noted that the FAO uses country-
level data on per capita energy and macronutrient supply to proxy per-capita intakes. Thus,
when the term 'intake' is used availability data is being used to proxy actual intake.

8
Three main estimation methods are employed in this paper. All three are Bayesian.
First, there is the nonparametric approach outlined in Chapter 10 of Koop (2003). The second
is a linear (in parameters) panel regression that can be estimated using the framework
outlined in Chib and Greenberg (1995). Finally, the recently developed method for estimating
quantile regressions (the Bayesian Exponentially Tilted Empirical Likelihood, BETEL
method) outlined in Lancaster and Sung (2010). When using the panel approach, alternative
models are evaluated using the Bayesian Deviance Information Criteria (DIC) outlined in
Spiegelhalter et al. (2002). A full description of each of the methods can be found in the
references above, therefore, the coverage here is succinct.
The Nonparametric Approach
The motivation for a nonparametric approach is because the relationships between
calorie or nutrient consumption and incomes may be highly non-linear and plausibly non-
monotonic. Finding a nonlinear relationship implies the impact of income on calorie intake is
affected by the actual level of calorie intake. For example, a higher income elasticity of
calorie intake ought to be expected for poor households since they may have insufficient
income to pay for adequate nutrition. On the other hand, high calorie consumers may not be
as greatly affected by a marginal increase in income as low calorie consumers and as such
will have a smaller elasticity. Nonparametric procedures allow for such possibilities and
mitigate problems of statistical bias resulting from an incorrectly specified parametric form.
Some studies argue that the relationship is linear (Bhargava 1991), while other studies
uncover important nonlinearities in the income-calorie relationship (Gibson and Rozelle
2005; Skoufias 2003). Of the studies that use nonparametric methods to investigate the
potential for nonlinearities find they are not present (Subramanian and Deaton 1996; Abdulai
and Aubert 2004), while other studies conclude the income elasticity is better described by a
curve rather than a line (Roy 2001; Gibson and Rozelle 2002; Skoufias 2003).
9
The flexibility of the nonparametric approach also allows the examination of whether
simple functional forms may be viable. Therefore, the nonparametric approach is employed
first before investigating the relationships using parametric methods. The nonparametric
approach assumes:
i i iy f x e , (1)
where iy is the average consumption in country i of calories or one of the nutrient groups,
and ix is per capita income in country i . Alternatively iy and ix may be logged values of
these variables. The error term ie is assumed to be independently and identically normally
distributed. As outlined in Koop (2003), the nonparametric relationship can be modelled by
estimating if x at each point value of ix . The estimation of the nonparametric relationship
requires a smoothing parameter to be estimated. This parameter is analogous to bandwidth
selection using classical kernel estimation. Within the Bayesian approach to estimation, this
parameter can be estimated by maximizing the marginal likelihood of the relationship or
through cross-validation, with the former method used (Koop 2003). When using the
nonparametric approach, the models are estimated for the two periods separately. Thus, there
are two sets of nonparametric regressions for each of the time periods.
The Panel Approach
The main benefit of the panel approach is an ability to control for both individual and
temporal unobserved heterogeneity via group fixed effects and time fixed effects. Group
fixed effects control for permanent differences between individual countries (i.e., differences
across countries that are constant over time) while time fixed effects control for impacts
common to all countries but that vary through time (i.e., differences over time that are
common to all groups). For the panel approach, the models investigated are of the form
2 3
1 2 3it t t it t it t it ity x x x e , (2)

10
where 2~ 0,ite N , , 0it jtE e e for all i j and
2
*,it jtE e e where *t t . Also,
ity denotes the dependent variable (calories or nutrients or logs of these variables) for
country i at time t and itx is per capita income (or logged values) for country i at time t .
Since there are only two time periods, the values of t are one and two. A cubic relationship
deals with functions that have variable second derivatives whereby the function may be
convex and concave over alternative regions of the variable space.
The imposition of restrictions are investigated, such as *it it (no time effects)
and/or 2 0t and/or 3 0t , in which case the function may become quadratic or linear (or
linear in logs). The Bayesian approach further allows imposition and investigation of whether
inequality restrictions are consistent with the data. For example, in the cubic relationship the
hypothesis might be that 3 0t since consumption of calories or nutrients may not increase
at an accelerating rate as incomes rise. An alternative panel approach (i.e., a "within country
and between time" regression) assumes that *jt jt for all j along with *it it ie e z is
also estimated, where iz is a normally distributed country effect. Finally, a first-difference
model regression is estimated.
The Quantile Approach
Concerns regarding obesity and hunger solicit special attention to the tails of the
intake distribution, where dietary excess and deficiency occurs, rather than at the means.
Since most previous studies rely on a form of ordinary least squares (either parametric or
nonparametric), the marginal effects of income derived from these studies are assumed to be
the same over the distribution of calorie intake. Since this is a very strong assumption, results
from these studies are of limited value. Quantile regression relaxes this assumption and
allows for heterogeneous responses of calorie intake to income. Despite the strong appeal of
quantile regression in application to nutrition problems, very few studies employ them. The
11
few that use a quantile approach focus on nutrient intakes for one country only (Fousekis and
Lazaridis 2005; Skoufias et al. 2009; Shankar 2010).
Unlike the previous two approaches, the BETEL does not have an explicit functional
form for the likelihood. Instead, the empirical likelihood is constructed by optimizing an
entropy measure for any given value of the parameters. The empirical likelihood is multiplied
by some relatively diffuse priors to obtain the posterior distribution of the parameters, and
then this can be mapped using a Metropolis-Hastings algorithm. The BETEL approach can be
used more generally than for quantile regressions. The moment conditions are derived from
the condition that (for two variables iy and ix )
Pr |i i iy x x . (3)
The parameters and represent the intercept and slopes for the th quantile. Like
the nonparametric regressions, quantile regressions are run separately for each time period.
Empirical Results
Discussion of the results proceeds sequentially examining the nonparametric results
first, followed by the panel regression results, and then the quantile results (focus is on the
elasticity estimates with the full set of parameter estimates in the appendix). As stated, the
nonparametric regressions were run separately over the two periods (1990-1992 and 2003-
2005). Only the latter period is presented, since the nonparametric plots are almost the same
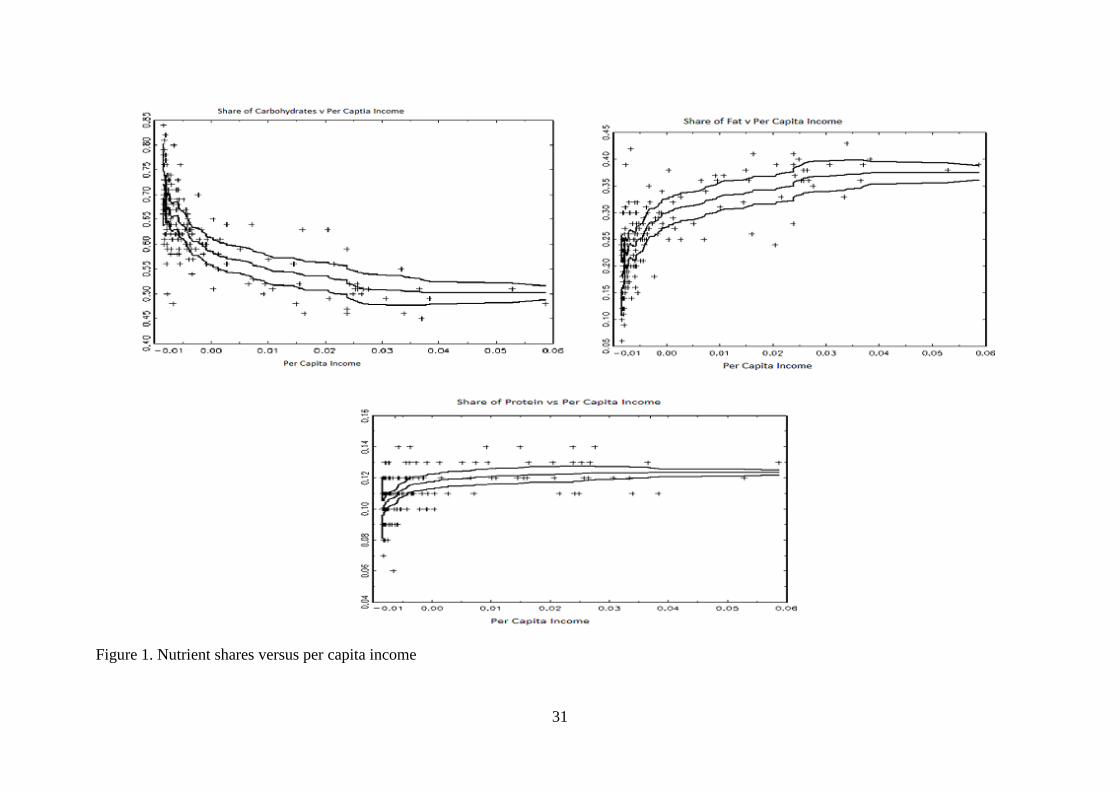
between the two periods. First, figure 1 examines the raw nutrient shares modelled as a
function of the raw per capita variable. The middle line is the fitted (mean) nonparametric
relationship, with the two outside lines containing the 95% confidence intervals for the mean.
As seen from the plots, the relationship between shares of nutrients and per capita income
appears to be non-linear, with poorer countries having relatively high levels of carbohydrates
as a proportion of their diet (top left hand corner of figure 1). As incomes increase, however,
the shares of carbohydrates decrease with a small rise in proteins but a much larger rise in

12
fats. In the poorest countries, about 80% to 85% of the diet is in the form of carbohydrates
and only around 10% in fats. As incomes increase though, there is a rapid switch to fats,
levelling off at around a 50% share in carbohydrates and a 38% share in fats, with the
remainder being proteins. Warnings from Drewnowski and Popkin (1997) on the possibility
of a diet containing close to 30% of energy from fat has in fact become the norm.
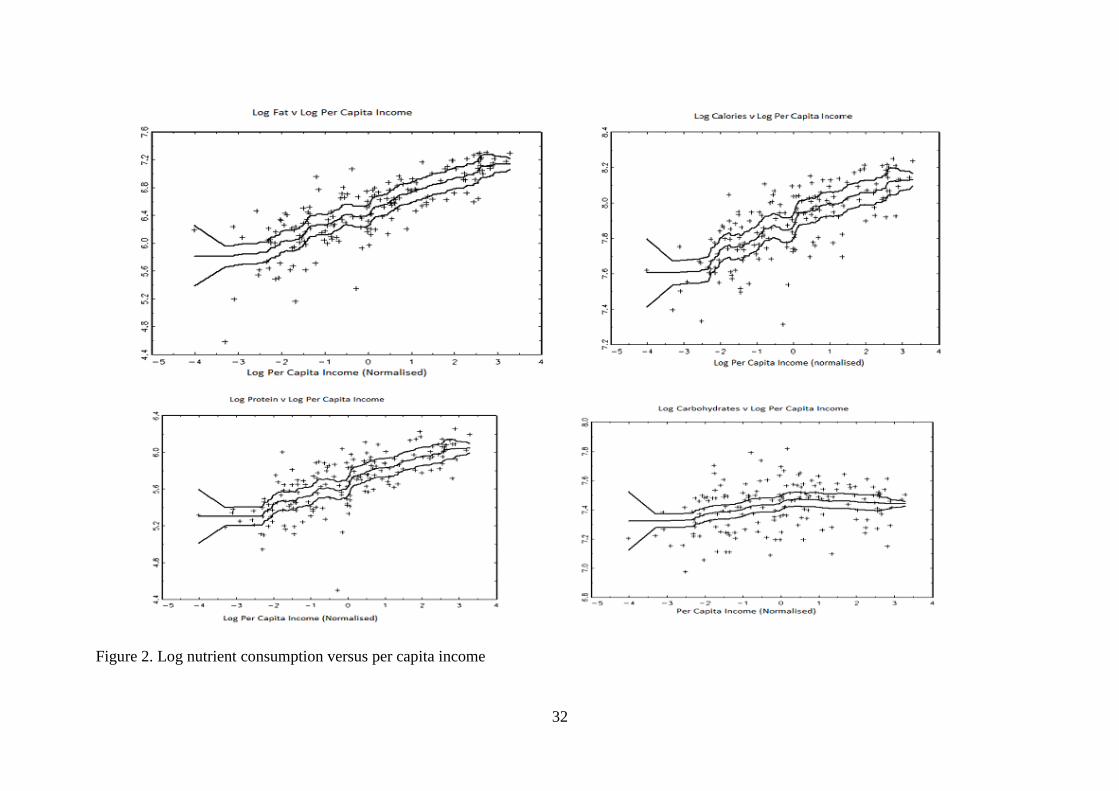
The second set of nonparametric plots in figure 2 are for the logged calorie and nutrient
consumptions regressed against logged per capita income (the relationships between the raw
data were also examined, and these were highly nonlinear and are not presented). What is
more interesting about the fitted curves using the logged data is that for each of the variable
pairs, the nonparametric curves are quite linear. In other words, the data are consistent with
being linear in logs, and therefore have constant elasticities. There is some evidence of a
slightly lower slope at very low levels of per capital income for total calories, fats, and
proteins. Surprisingly, however, the increase in consumption of these quantities towards the
upper end of the income range does not appear to level off. This implies that as per capita
incomes rise, a percentage increase in per capita incomes continues to give the same
percentage increase in calories, along with increases in fats, proteins, and carbohydrates. Also
evident is that the carbohydrate line is much flatter, meaning that increases in incomes are not
leading to the same increases in carbohydrates as for fats and proteins. This is consistent with
the nonparametric results using nutrient shares.
In view of the nonparametric results, the linear in log specifications represent plausible
empirical characterizations of the relationships between calories/nutrients and per capita
income. This hypothesis is explored further using parametric methods. As outlined in the
methods section, a set of panel regressions are specified, where the variables have been
logged prior to estimation. Before presenting parameter estimates, alternative specifications
including only a quadratic term and excluding a cubic or quadratic term are investigated first.

13
No other restrictions are imposed at this stage, with further restrictions investigated
subsequently. The DIC for each of the models is computed, with the preferred model being
the one with the lowest DIC. The results are presented in table 2. The models with the lowest
DIC are highlighted in bold, and the linear (in variables) specification is preferred for total
calories, protein, and fats. However, the quadratic model is preferred for carbohydrates.
Results conclude that the panel results are broadly in concordance with the nonparametric
results and suggest that calories, protein, and fats have approximately constant elasticities
over per capita incomes. This is not the case, however, for carbohydrates. The restrictions on
the parameters across the time periods are investigated in table 3 in order to test whether the
relationships differ across the two periods (1990-2 and 2003-5). For these comparisons the
linear models are used, even for carbohydrates. As can be seen from the results in table 3,
while there is evidence that the constants in the models can be restricted across the two
periods none of the models support constant elasticities across the two periods, suggesting
that there have been changes in consumption patterns other than those driven by incomes.
Table 4 presents the elasticities from the panel approach. The linear model results are
given in table 4 as well as results from a first-difference model. As mentioned above, the
quadratic model is preferred for carbohydrates, therefore carbohydrates are discussed further
below. Results in table 4 reveal that while the DIC does not support constant elasticities over
the two periods, the differences in elasticities across the periods is very small. The calorie
elasticity is about 0.09 for both periods and both have 95% elasticity confidence intervals
contained within the interval (0.072, 0.104). Both protein and fat elasticities are significantly
larger than the calorie elasticities (at about 0.14-0.15 and 0.23-0.24, respectively), whereas
the carbohydrate elasticity is much smaller (at around 0.02-0.025). This is consistent with the
previous results regarding nutrient shares. Overall, results suggest that a 10% increase in per
capita incomes will lead to around a 1% rise in calorie consumption, but with the larger
14
components being an increase in fat consumption, followed by protein consumption, with a
very small increase in carbohydrate consumption. As already noted, however, the
carbohydrate elasticity does not appear to be constant. To further investigate carbohydrate
consumption the income elasticity is estimated at each level of income. These are plotted in
figure 3 for the two time periods, which again are very similar. The basic picture that emerges
is that the carbohydrate elasticity is around 0.10 for very low levels of income, decreasing at
a decreasing rate from there on, but remaining positive until around $US7500 per year.
Beyond this point carbohydrate consumption has a negative elasticity.
The results for the quantile regressions are presented in table 5. Again, these are linear
in log specifications for each of the variables. Table 5 reports the upper 75%, the median, and
the lower 25% percentile elasticity estimates. In all cases, for all quantiles, the results are
very similar to the estimated elasticities from the panel results. Of central interest is whether
there seems to be a divergence between the different percentile values. As can be seen by
table 5, these are very small. A large divergence between the lower and the upper percentiles
would mean that countries with a higher consumption (for a given level of per capita income)
are responding differently to those with a lower consumption (for a given level of per capita
income). For example, if for calories the 0.25 was much smaller than 0.75 then
countries with lower consumption of calories or nutrients would be less responsive to income
changes than those with relatively high consumption of calories. This, arguably would be the
most worrying scenario, since increased incomes would be having the least effect on those
with the lowest consumption, and increased incomes would be having the highest effect on
those with the highest income. From table 5, however, the opposite tends to be true. For both
periods, the majority of the variables have non-decreasing or increasing elasticities moving
down the percentile groups. Therefore, those consuming relatively small amounts of calories
15
or nutrients (for a given level of income) tend to be the most responsive to changes in the
levels of income. As already noted though, the divergence between the quantiles is small.
Discussion and Limitations
There are two caveats associated with the results: the first involves limitations
inherent in the data and the second involves a potential specification bias from omitted
variables. First, the use of aggregate average per capita GDP as a measure of consumer
income is not ideal. The nutrient consumption of different individuals or households may be
affected in different ways by changes in GDP, which also may arise for different reasons. For
example, sanctions and draughts may have similar effects to lower per capita GDP, however,
the effect on food consumption from these two occurrences may be quite different. Thus,
distributional questions such as how a given change in per capita GDP affects different food
consumers or how such distributional consequences vary according to the cause of the change
in GDP, are beyond the scope of this paper. Limitations with the FAO data have also
received attention in the literature (Gabbert and Weikard 2001; Nube 2001; Smith 1998;
Svedberg 1999, 2002). Measurement error may be present, specifically in regards to the
margin of errors present in agricultural production statistics from developing countries.
Obtaining reliable and consistent data on food production can be problematic, especially from
countries in Sub-Saharan Africa and South Asia. Not only are food production systems
complex in these countries but there is also a heavy reliance on subsistence agriculture, the
output of which is often under-measured (if measured at all). In these cases, the per capita
availability of nutrients in the FAO data may be underestimated (which can potentially result
in over-estimated parameters and income elasticities).
The second caveat regarding potential specification bias involves omission of other
variables in the models that may be correlated with per capita income, thereby biasing the
income elasticity estimate. Maternal education and employment, which micro-level evidence
16
has shown to be important in controlling for income, are examples (Behrman and Wolfe
1984; Sahn 1994; Glewwe 1999). Within the aggregate macroeconomic framework, data
availability preclude their inclusion. Despite these limitations, the approach in this paper fits
within a body of literature that examines the nutrient-income relationship at the aggregate
level, and complements similar studies undertaken at a more disaggregate level.
To summarize, calories, fats, and proteins have positive significant income elasticities.
The data on these variables are also consistent with having constant elasticities across the
income range. Carbohydrate consumption is found to have high positive elasticities only at
low income levels, becoming negative at high incomes. A quantile regression yields similar
elasticity estimates to the nonparametric and panel approaches at both the upper and lower
quantiles, but there is some evidence to suggest that higher consuming countries (for both
calories and nutrient components) had slightly lower elasticities than for those in the lower
quantiles. In line with the majority of previous studies, the small but positive income
elasticities suggest that income growth will increase calorie consumption and increase all
nutrient consumption for low income countries (below US$7500). However, the elasticity
estimates fall below the majority of existing estimates.
In terms of overall calorie consumption, a 10% rise in incomes is required for 1% rise
in calorie consumption. Thus, rather large increases in income are needed for an
improvement in the nutrition status of people in poorer countries. The implications for higher
income countries are perhaps no less important. Findings suggest that this overall rise in
calorie consumption as incomes rise holds also for rich countries. Thus, for countries that are
already consuming well beyond the recommended calorie levels, further increases in income
will lead to even larger consumption of calories. Moreover, the consumption of fat has the
largest elasticity at around 2.5 that of overall calorie consumption, meaning that the larger
component of increased calorie consumption will be in terms of fats. While these elasticities
17
may seem small, in the absence of any other change in behavior, extrapolating current income
growth predicts significant cumulative increase in calorie consumption that would exacerbate
existing problems associated with obesity. Such has been the case in parts of Asia, like China,
where economic growth paralleled marked increases in obesity rates (Popkin and Ng 2007).
Comparing the elasticity estimates to the existing literature, the income elasticity of
calories is on the smaller side, though closest in magnitude to estimates obtained in similar
cross-country studies (Reutlinger and Selowsky 1976; Dawson 1997) and a few micro-level
studies based on food intake diaries (Wolfe and Behrman 1983; Strauss and Thomas 1989;
Bhargava 1991; Skoufias et al. 2009). Most studies that use individual or household level
data typically find the income-calorie elasticity to be around 0.30 (Duncan and Strauss 1995).
Making comparisons with regard to the income- macronutrients elasticities is more difficult
since fewer results exist. Behrman and Doelalikar (1987) obtain an income-protein elasticity
of about 0.20, which is close to their income-calorie elasticity of 0.19 (they did not estimate
elasticities for carbohydrates or fats). Fousekis and Lazaridies (2005) obtain a mean income
elasticities of 0.39 for protein, 0.30 for carbohydrates, and 0.61 for fats and oils.
Overall, the results obtained in this paper have two important implications. First, the
impact of economic growth on calorie and macronutrient intake is likely to be small and as
substantial as some studies have concluded (Subramanian and Deaton 1996; Meng, Gong,
and Wang 2009).In fact, some studies suggest that good nutrition is a driver of economic
growth and therefore development policies should be geared specifically towards reducing
chronic malnutrition in order to spur economic growth rather than focusing on economic
growth to spur good nutrition (Correa and Cummins 1970; Strauss 1986; Strauss and Thomas
1998; Fogel 2004). Second, economic growth may also change the structure of diets and the
composition of nutrient intakes. In particular, results here suggest that as countries become
richer not only are calorie intakes on an increasing trajectory, but that diets become

18
increasingly composed of fats rather than proteins or carbohydrates. These results are in
accord with the nutrition transition hypothesis of Popkin (2004). Economic growth, while
contributing to the alleviation of malnutrition, also results in diets that become composed
more of fats, worsening rates of obesity and obesity-related diseases.
Conclusion
This paper examined the relationship between calorie/nutrient consumption and per
capita incomes using a two-period panel of 171 countries and extends the literature in two
important ways. First, the relationship between income and average calorie intake is
disaggregated into important nutrient components: carbohydrates, proteins, and fats. The
disaggregation of calorie intake permits the relationship with income to differ between each
nutrient. Most of the literature on nutrition and income, especially in the development
literature, focuses entirely on total energy (calorie) intake. While the income elasticity of
calories infers how the total level of energy is affected by income, it reveals nothing about
how income affects diet composition. The few studies that do estimate nutrient-income
elasticities (Pitt and Rosenzweig 1985; Behrman and Deolalikar 1987; Behrman and Wolfe
1987; Skoufias et al. 2009) confine their analysis to a single country.
Second, this study employs three different estimators (nonparametric, parametric, and
quantile) for a robust interpretation of the income-nutrient relationship. A nonparametric
estimator allows the relationship between income and calorie or nutrient consumption to be
non-linear and non-monotonic. The parametric panel estimator permits estimation of both
'within-country' and 'between-time' effects and allows for testing of changes in the
relationship over time. The nonparametric estimator allows the relationship between income
and nutrient consumption to differ along the income distribution. In other words, rich
countries and poor countries are allowed to respond differently to increases in income. The
quantile estimator lets the marginal effect of income on calorie/nutrient intake to be different

19
over the entire intake distribution. In this case, the impact of income may be different
between rich and poor countries, which consume calories at different levels, so improvements
in income may not impart equal benefits. While some studies use both parametric and
nonparametric estimators, few studies utilize quantile regression.
Results suggest that development strategies aimed at improving economic growth may
be insufficient at improving nutrient intake and may at worst exacerbate problems of poor
diet and obesity in both developing and developed countries. Even in the absence of targeted
policies, the global economic crisis will likely worsen the quality of diets internationally. In
response to falling incomes, households will turn to fatty and calorie-dense, but nutrient poor,
inexpensive processed foods. As the composition of diets change towards more fatty foods,
countries across the globe will experience deteriorating nutritional status and health. Global
efforts to improve diets require the coordinated design and implementation of policies that
can address the dual public health problems of nutrient excess and deficiency.
While this paper focused on macronutrients, micronutrient deficiency (primarily iron,
vitamin A, iodine, and zinc) is also a problem, and it often goes in hand with obesity.
According to the WHO (2010): "Global increases in overweight and obesity are attributable
to a number of factors including a global shift in diet towards increased intake of energy-
dense foods that are high in fat and sugars but low in vitamins, minerals and other
micronutrients." Micronutrient deficiency can cause or exacerbate a number of health and
economic problems including blindness, early mortality, stunted mental development, and
reduced labor productivity (UNICEF 2004). The empirical relationship between income and
micronutrient consumption remains a viable area for future research.
20
REFERENCES
Abdulai, A., and D. Aubert. 2004. Nonparametric and parametric analysis of calorie
consumption in Tanzania. Food Policy 29(2): 113-129.
Aromolaran, A.B. 2004. Household income, women's income share and food calorie intake in
South Western Nigeria. Food Policy 29(5): 507-530.
Babatunde, R.O., A.O. Adejobi, and S.B. Fakayode. 2010. Income and calorie intake among
farming households in rural Nigeria: results of parametric and nonparametric analysis.
Journal of Agricultural Science 2(2): 135-146.
Behrman, J.R., and A.B. Deolalikar. 1987. Will developing country nutrition improve with
income? Journal of Political Economy 95(3): 492-507.
Behrman, J.R., and A.B. Deolalikar. 1989. Is variety the spice of life? Implications for calorie
intake. Review of Economics and Statistics 71(4): 666-672.
Behrman, J.R., A.B. Deolalikar, and B.L. Wolfe. 1988. Nutrients: impacts and determinants.
World Bank Economic Review 2(3): 299-320.
Behrman, J.R., and B.L. Wolfe. 1984. More evidence on nutrition demand: income seems
overrated and women's schooling underemphasized. Journal of Development
Economics 14(1): 105-128.
Behrman, J.R.., and B.L. Wolfe. 1987. How does mother's schooling affect family health,
nutrition, medical care usage, and household sanitation? Journal of Econometrics 36(1-
2): 185-204.
Bhargava, A. 1991. Estimating short and long run income elasticities of foods and nutrients
for rural South India. Journal of the Royal Statistical Society (Series A) 154(1): 157-
174.
21
Bouis, H.E. 1994. The effect of income on demand for food in poor countries: are our food
consumption databases giving us reliable estimates? Journal of Development
Economics 44(1): 199-226.
Bouis, H.E., and L.J. Haddad. 1992. Are estimates of calorie-income elasticities too high? A
recalibration of the plausible range. Journal of Development Economics 39(2): 333-
364.
Caballero, B. 2005. A nutrition paradox -- underweight and obesity in developing countries.
New England Journal of Medicine 352(15): 1514-1516.
Chibb, S. and E. Greenberg 1995. Hierarchical analysis of SUR models with extensions to
correlated serial errors and time-varying parameter models. Journal of Econometrics
68(2): 339-360.
Correa, H., and G. Cummins. 1970. Contribution of nutrition to economic growth. American
Journal of Clinical Nutrition 23(5): 560-565.
Dawson, P.J. 1997. The demand for calories in developing countries. Oxford Development
Studies 25(3): 361-369.
Dawson, P.J. 2002. Nutrition in Pakistan: estimating the economic demand for calories.
Pakistan Journal of Nutrition 1(1): 64-66.
Dawson, P.J., and R. Tiffin. 1998. Estimating the demand for calories in India. American
Journal of Agricultural Economics 80(3): 474-481.
Doak, C.M., L.S. Adair, M. Bentley, C. Monteiro, and B.M. Popkin. 2005. The dual burden
household and the nutrition transition paradox. International Journal of Obesity 29(1):
129-136.
Drewnowski, A. 2003. Fat and sugar: an economic analysis. Journal of Nutrition 133(3):
838S-840S.
22
Drewnowski, A., and B.M. Popkin. 1997. The nutrition transition: new trends in the global
diet. Nutrition Reviews 55(2): 31-43.
Food and Agriculture Organization. 2009. State of Food Insecurity in the World. Rome, Italy.
Fogel, R.W. 2004. Health, nutrition, and economic growth. Economic Development and
Cultural Change 52(3): 643-658.
Fousekis, P., and P. Lazaridis. 2005. The demand for selected nutrients by Greek households:
an empirical analysis with quantile regressions. Agricultural Economics 32(3): 267-
279.
Gabbert, S., and H.-P. Wiekard. 2001. How widespread is undernourishment: A critique of
measurement methods and new empirical results. Food Policy 26(3): 209-228.
Gibson, J., and S. Rozelle. 2002. How elastic is calorie demand? Parametric, Nonparametric
and Semiparametric results for urban Papua New Guinea. Journal of Development
Studies 38(6): 23-46.
Glewwe, P. 1999. Why does mother’s schooling raise child health in developing countries?
Evidence from Morocco. Journal of Human Resources 34(1): 124–159.
Grimard, F. 1996. Does the poor's consumption of calories respond to changes in income?
Evidence from Pakistan. Pakistan Development Review 35(3): 257-283.
Hossain, P., B. Kawar, and M. El Nahas. 2007. Obesity and diabetes in the developing world:
a growing challenge. New England Journal of Medicine 356(13): 213-215.
Koop G. 2003. Bayesian Econometrics. Sussex, England: Wiley.
Lancaster T. and Sung .J.J. 2010. Bayesian Quantile Regression Methods. Journal of Applied
Econometrics 25(2): 287-307.
Meng, X., X. Gong, and Y. Wang. 2009. Impact of growth and economic reform on nutrition
availability in urban China: 1986-2000. Economic Development and Cultural Change
57(2): 261-295.

23
Nube, M. 2001. Confronting dietary energy supply with anthropometry in the assessment of
undernutrition prevalence at the level of countries. World Development 29(7): 1275-
1289.
Pinstrup‐Andersen P. 2007. Agricultural research and policy for better health and nutrition in
developing countries: a food systems approach. Agricultural Economics 37(S1):187-
198.
Pinstrup-Andersen, P., and E. Caicedo. 1978. The potential impact of changes in income
distribution on food demand and human nutrition. American Journal of Agricultural
Economics 60(3): 402-415.
Pitt, M.M. 1983. Food preferences and nutrition in rural Bangladesh. Review of Economics
and Statistics 65(1): 105-114.
Pitt, M.M., and M.R. Rosenzweig. 1985. Health and nutrient consumption across and within
households. Review of Economics and Statistics 67(2): 212-223.
Popkin, B.M. 1994. The nutrition transition in low-income countries: an emerging crisis.
Nutrition Reviews 52(9): 285-298.
Popkin, B.M. 2004. The nutrition transition: worldwide obesity dynamics and their
determinants. International Journal of Obesity 28: S2-S9.
Popkin, B.M., and S.W. Ng. 2007. The nutrition transition in high- and low-income
countries: what are the policy lessons? Agricultural Economics 37(S1): 199-211.
Ravallion, M. 1990. Income effects on undernutrition. Economic Development and Cultural
Change 38(3): 489-515.
Reutlinger, S. and M. Selowsky. 1976. Malnutrition and poverty: magnitude and policy
options. World Bank staff occasional papers no. 23; Johns Hopkins University Press.
Baltimore, USA.

24
Roy, N. 2001. A semiparametric analysis of calorie response to income change across income
groups and gender. Journal of International Trade and Economic Development 10(1):
93-109.
Sahn, D.E. 1988. The effect of price and income changes on food-energy intake in Sri Lanka.
Economic Development and Cultural Change 36(2): 315-340.
Shankar, B. 2010. Socio-economic drivers of overnutrition in China. Journal of Human
Nutrition and Dietetics 23(5): 471-479.
Skoufias, E. 2003. Is the calorie-income elasticity sensitive to price changes? Evidence from
Indonesia. World Development 31(7): 1291-1307.
Skoufias, E., V. Di Maro, T. Gonzalez-Cossiom, and S. Rodriguez Ramirez. 2009. Nutrient
consumption and household income in rural Mexico. Agricultural Economics 40(6):
657-675.
Smith, L. 1998. Can FAO’s measure on chronic undernourishment be strengthened? Food
Policy 23(5): 425-445.
Spiegelhalter D.J., N.G. Best, B.P. Carlin, and A. van der Linde. 2002. Bayesian Measures of
Model Complexity and Fit. Journal of the Royal Statistical Society: Series B (Statistical
Methodology) 64 (4): 583 - 639.
Strauss, J. 1986. Does better nutrition raise farm productivity? Journal of Political Economy
94(2): 297-320.
Strauss, J., and D. Thomas. 1998. Health, nutrition, and economic development. Journal of
Economic Literature 36(2): 766-817.
Subramanian, S., and A. Deaton. 1996. The demand for food and calories. Journal of
Political Economy 104(1): 133-162.
Svedberg, P. 1999. 841 million undernourished? World Development 27(12): 2081-2098.
25
Svedberg, P. 2003. Undernutrition overestimated. Economic Development and Cultural
Change 51(5): 5-36.
Tiffin, R. and P.J. Dawson. 2002. The demand for calories: some further estimates from
Zimbabwe. Journal of Agricultural Economics 53(2): 221-232.
UNICEF. 2004. Vitamin and Mineral Deficiency, A Global Progress Report. NY: New York.
Ward, J.O., and J.H. Sanders. 1980. Nutritional determinants and migration in the Brazilian
Northeast: a case study of rural and urban Ceará. Economic Development and Cultural
Change 29(1): 141-163.
Wolfe, B.L. and J.R. Behrman. 1983. Is income overrated in determining adequate nutrition?
Economic Development and Cultural Change 31(3): 525-549.
World Bank. 1980. World Development Report. Washington, DC: USA.
World Bank. 1981. World Development Report. Washington, DC: USA.
World Health Organization. 2004. Global Strategy on Diet, Physical Activity and Health.
Geneva: Switzerland.
World Health Organization. 2006. Obesity and Overweight Factsheet. Geneva: Switzerland.

26
Table 1. Summary of Recent Studies
Author Year Data Level Model Timeframe Country
Calorie
Elasticity
Bhargava 1991 Individual Panel 1976-1977 India 0.13
Grimard 1996 Household Cross-sectional 1984-1985 Pakistan 0.40-0.50
Subramanian and Deaton 1996 Household Cross-sectional 1983 India 0.40-0.55
Dawson 1997 Aggregate Cross-sectional 1992 41 DCs 0.07
Dawson and Tiffin 1998 Aggregate Time-series 1961-1992 India 0.34
Roy 2001 Individual Panel 1976-1978 India <0-0.15
Dawson 2002 Aggregate Time-series 1961-1998 Pakistan 0.19
Gibson and Rozelle 2002 Household Cross-sectional 1985-1987 Papua New Guinea 0.18-0.59
Tiffin and Dawson 2002 Aggregate Time-series 1961-1992 Zimbabwe 0.31
Skoufias 2003 Household Cross-sectional 1996, 1999 Indonesia 0.01-0.45
Abdulai and Aubert 2004 Household Panel 1998-1999 Tanzania 0.49
Aromolaran 2004 Household Cross-sectional 1999-2000 Nigeria 0.19
Skoufias et al. 2009 Household Cross-sectional 2003-2004 Mexico <0-0.07
Meng, Gong, and Wang 2009 Household Panel 1986-2000 China 0.20-0.49
Babatunde et.al 2010 Household Cross-sectional 2006 Nigeria 0.18

27
Table 2. DIC for Functional Forms
Calories Carbs Protein Fats
Cubic -1180.25 -1109.16 -966.52 -738.66
Quadratic -1178.46 -1109.56 -967.91 -738.32
Linear -1180.93 -1102.93 -969.28 -741.57

28
Table 3. DIC for Restrictions Across Periods for Linear Models
Calories Carbs Protein Fats
Unrestricted -1180.93 -1102.93 -969.28 -741.57
Constant Elasticities -1178.20 -1103.60 -969.27 -733.40
Constant Intercept -1182.60 -1104.83 -971.27 -739.89
Constant All Parameters -1151.22 -1090.24 -947.37 -716.88

29
Table 4. Elasticity Estimates from Linear Panel Regression
Calories Carbohydrates Proteins Fats
Mean Stdv Mean Stdv Mean Stdv Mean Stdv
2003-2005 0.086 0.006 0.020 0.007 0.140 0.009 0.230 0.014
1990-1992 0.092 0.006 0.025 0.007 0.148 0.009 0.241 0.014
First-Difference 0.074 0.030 0.026 0.036 0.162 0.041 0.209 0.060

30
Table 5. Quantile Elasticity Estimates
Calories Carbohydrates Proteins Fats
2003-05 beta stdv beta stdv beta stdv beta stdv
0.75 0.083 0.009 0.016 0.007 0.130 0.012 0.197 0.020
0.50 0.088 0.007 0.020 0.009 0.140 0.007 0.229 0.016
0.25 0.089 0.010 0.026 0.010 0.152 0.011 0.257 0.024
1990-92 beta stdv beta stdv beta stdv beta stdv
0.75 0.093 0.008 0.019 0.007 0.137 0.012 0.217 0.018
0.50 0.094 0.007 0.019 0.010 0.147 0.010 0.264 0.021
0.25 0.094 0.008 0.028 0.007 0.156 0.014 0.274 0.027
31
Figure 1. Nutrient shares versus per capita income
32
Figure 2. Log nutrient consumption versus per capita income

33
Figure 3. Carbohydrate income elasticity