impact of glucose meter accuracy on the efficacy of
TRANSCRIPT

Impact of glucose meter accuracy on the efficacy of glycemic control in critically ill patients after
cardiovascular surgery
Brad S. Karon1 and Sandra K. Bryant2
1 Department of Laboratory Medicine and Pathology
2 Division of Biomedical Statistics and Informatics
Mayo Clinic
Rochester, MN

Disclosures
• None
2

Error simulation models—accuracy required for moderate glycemic control (MGC, target glucose 110-150 mg/dL)
3 category dosing error critical

Error simulation models--MGC
Error condition
10% TEa
% Bias/CV
10% TEa
Gaussian
15% TEa
% Bias/CV
15% TEa
Gaussian
20% TEa
% Bias/CV
20% TEa
Gaussian
1cat Up to 60%
29% Up to 80%
39% Up to 90%
83%
2 cat 0.2% 0.2% Up to 5% 2% Up to 20%
6%
≥ 3 cat 0% 0% 0% 0.02% 0.2% 0.3%
Karon et al., Diabetes Tech Ther 2013;15:996-1003
TEa = total allowable error = bias + (1.65 X CV)

Empiric validation of MGC error model
• 4017 paired glucose meter and serum glucose drawn within 5 minuteso Glucose meter ~ 20% TEa
• Empirically observed dosing errors close to those predicted by Gaussian model at 20% TEao Observed bias much less than ± 20%
• What is impact of ≥ 2 category dosing errors?
Error condition
20% TEa% bias/CV
20% TEaGaussian
Empiric data
1 cat error Up to 90% 83% 39%2 cat error Up to 20% 6% 4%≥ 3 cat error 0.2% 0.3% 0.3%
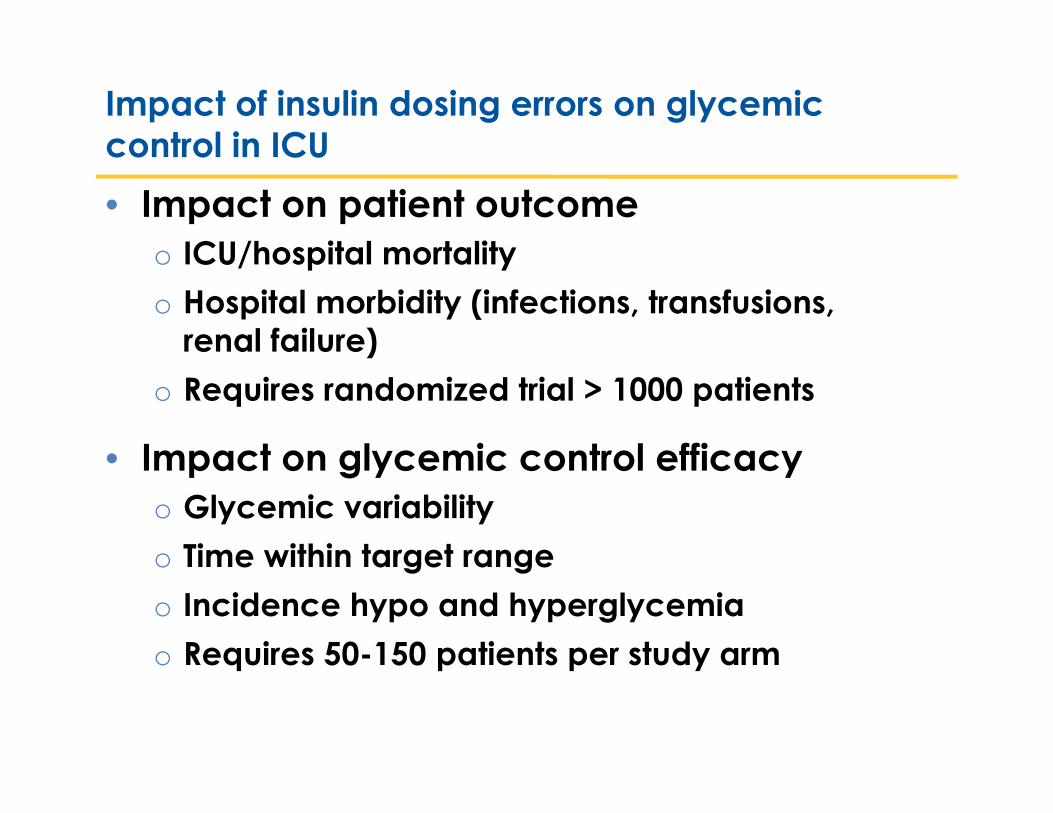
Impact of insulin dosing errors on glycemic control in ICU• Impact on patient outcome
o ICU/hospital mortalityo Hospital morbidity (infections, transfusions,
renal failure)o Requires randomized trial > 1000 patients
• Impact on glycemic control efficacyo Glycemic variabilityo Time within target rangeo Incidence hypo and hyperglycemiao Requires 50-150 patients per study arm

Study design
• Determine accuracy of two glucose meters each used in same ICU patient populationo Paired meter/serum samples collected within 5 min
• Retrospective review patients post cardiovascular surgery placed on glycemic control in CVS ICUo 12-24 consecutive (30-120 min) glucose values on
insulin drip o Period 1 (45 patients monitored with AccuChek Inform)o Period 2 (54 patients monitored with StatStrip)o No change infusion protocol, testing personnel, etco Outcome glycemic variability from consecutive
glucose values, time within target range, incidence hypo and hyperglycemia

Results—glucose meter accuracy in ICU
• 1602 paired whole blood meter vs. serum glucoseo 6 ICU areas, Aug-Oct 2012 (Period 1), Inform 1
-60
-40
-20
0
20
40
60
80
0 50 100 150 200 250 300 350 400 450 500
Who
le b
lood
min
us la
b se
rum
gl
ucos
e (m
g/dL
)
Mean glucose (mg/dL)

Results—glucose meter accuracy in ICU
• 1093 paired whole blood vs. serum glucoseo 6 ICU areas, June-Aug 2013 (Period 2), StatStrip
-60
-40
-20
0
20
40
60
80
0 50 100 150 200 250 300 350 400 450 500
Who
le b
lood
min
us la
b se
rum
gl
ucos
e (m
g/dL
)
Mean glucose (mg/dL)

Results—glucose meter accuracy in ICU
• Reduced bias, TEa from ~20% 12.5%
• Diabetes Tech Ther 2014; DOI: 10.1089/dia.2014.0074
Period 1 Period 2Median (IQR) bias (mg/dL) 11 (6 - 18 ) mg/dL 1 (-5 - 5) mg/dL% within 20%/15 mg/dLserum
92% 98%
% within 15%/15 mg/dL(NACB) serum
80% 97%
% within 12.5%/12.5 mg/dL(CLSI POCT12-A3) serum
69% 95%

Study design
• Measures glycemic variabilityo Standard deviation (SD)o Continuous overall net glycemic action (CONGA)
Patient demographics Period 1(9-11/2012)
Period 2 (12/13-3/14)
P value
Mean ± SD age (range) 66 ± 13 (28-85) 64 ± 12 (29-86) 0.6237Gender 27 M/ 18 F 35 M/ 19 FDiabetes 24 ND/ 21 D2 29 ND/ 25 D2Median (range) number glucose values
21 (12-24) 22 (12-24) 0.14
Median (IQR) glucose value (mg/dL)
142 (126-158) 137 (125-149) 0.01
Median (IQR) value ND 134 (120-150) 134 (122-145) 0.16Median (IQR) value D2 148 (133-166) 141 (129-153) 0.02

Results—Glycemic variability and time within target range
Period 1 (n=45) Period 2 (n=54) P valueMedian (IQR) standarddeviation (SD)
22.4 (16.4-29.3) mg/dL
15.4 (12.2-19.8) mg/dL
< 0.0001
Median (IQR) CONGA
20.5 (16.0-25.6) mg/dL
12.1 (9.9-17.4) mg/dL
< 0.0001
Median (IQR) time in target range (%)
62.5 (46.7-72.5) % 71.1 (61.1-84.6) % 0.003
• Overall results (non-diabetic and diabetic type 2)
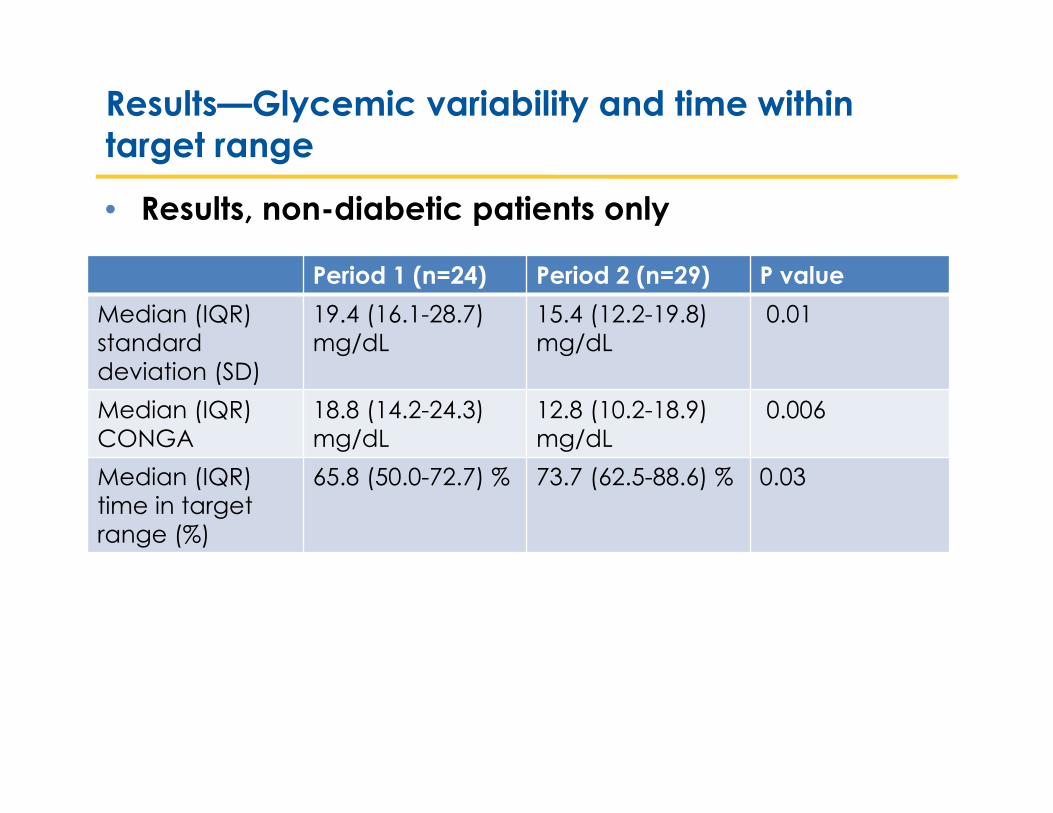
Results—Glycemic variability and time within target range
• Results, non-diabetic patients only
Period 1 (n=24) Period 2 (n=29) P valueMedian (IQR) standarddeviation (SD)
19.4 (16.1-28.7) mg/dL
15.4 (12.2-19.8) mg/dL
0.01
Median (IQR) CONGA
18.8 (14.2-24.3) mg/dL
12.8 (10.2-18.9) mg/dL
0.006
Median (IQR) time in target range (%)
65.8 (50.0-72.7) % 73.7 (62.5-88.6) % 0.03

Results—Incidence of hypo and hyperglycemia
• Hypoglycemia (< 70 mg/dL), non-diabetic patients• 1 patient, 1 value Period 1• 0 patients, 0 values Period 2
• Hyperglycemia (> 200 mg/dL), non-diabetic patients• 6 patients, 13 values Period 1• 1 patient, 2 values Period 2
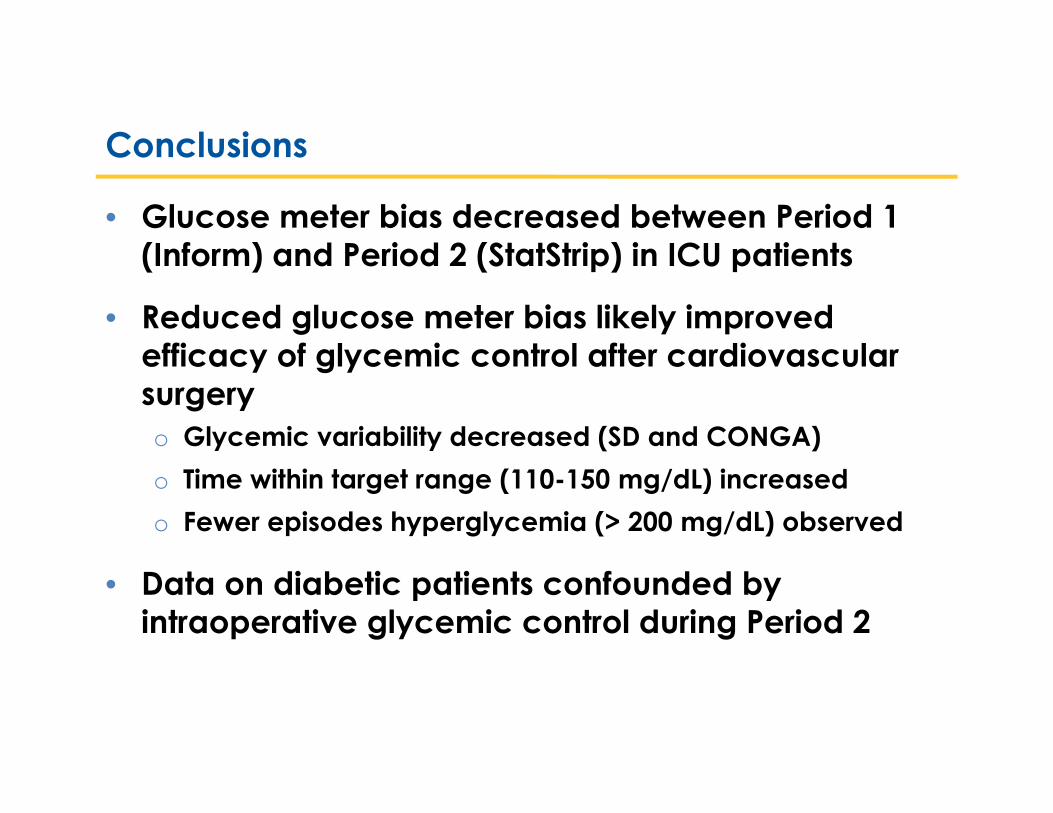
Conclusions
• Glucose meter bias decreased between Period 1 (Inform) and Period 2 (StatStrip) in ICU patients
• Reduced glucose meter bias likely improved efficacy of glycemic control after cardiovascular surgeryo Glycemic variability decreased (SD and CONGA)o Time within target range (110-150 mg/dL) increasedo Fewer episodes hyperglycemia (> 200 mg/dL) observed
• Data on diabetic patients confounded by intraoperative glycemic control during Period 2