impact of generic milk advertising on new york state markets
TRANSCRIPT

NationalInstitute forCommodityPromotionResearch &Evaluation
Department of Applied Economics and ManagementCollege of Agriculture and Life Sciences
Cornell University, Ithaca, New York 14853
December 2004NICPRE 04-04R.B. 2004-11
Impact of Generic Milk Advertisingon New York State Markets, 1986-2003
by:
Harry M. Kaiser, Yu Wang, and Todd M. SchmitCornell University

The National Institute ForCommodity Promotion Research and Evaluation
The National Institute for Commodity Promotion Research and Evaluation was initially funded bya CSRS Special Grant in April 1994. The Institute is an offshoot of The Committee on Commod-ity Promotion Research (NEC-63). A component of the Land Grant committee structure to coor-dinate research in agriculture and related fields, NEC-63 was established in 1985 to foster qualityresearch and dialogue on the economics of commodity promotion.
The Institute’s mission is to enhance the overall understanding of economic and policy issuesassociated with commodity promotion programs. An understanding of these issues is crucial toensuring continued authorization for domestic checkoff programs and to fund export promotionprograms. The Institute supports specific research projects and facilitates collaboration amongadministrators and researchers in government, universities, and commodity promotion organiza-tions. Through its sponsored research and compilations of related research reports, the Instituteserves as a centralized source of knowledge and information about commodity promotion eco-nomics.
The Institute is housed in the Department of Applied Economics and Management at CornellUniversity in Ithaca, New York as a component of the Cornell Commodity Promotion ResearchProgram.
Institute Objectives
• Support, coordinate, and conduct studies to identify key economic relationshipsand assess the impact of domestic and export commodity promotion programs onfarmers, consumers, and the food industry.
• Develop and maintain comprehensive databases relating to commodity promotionresearch and evaluation.
• Facilitate the coordination of multi-commodity and multi-country research andevaluation efforts.
• Enhance both public and private policy maker’s understanding of the economicsof commodity promotion programs.
• Facilitate the development of new theory and research methodology.
It is the Policy of Cornell University actively to support equality of educational and employment
opportunity. No person shall be denied admission to any educational program or activity or be
denied employment on the basis of any legally prohibited discrimination involving, but not limited to,
such factors as race, color, creed, religion, national or ethnic origin, sex, age or handicap. The
University is committed to the maintenance of affirmative action programs which will assure the
continuation of such equality of opportunity.

Impact of Generic Milk Advertising on New York State Markets, 1986-2003
Harry M. Kaiser, Yu Wang, and Todd M. Schmit*
Under the Dairy and Tobacco Adjustment Act of 1983, farmers are assessed 15 cents per
hundredweight (cwt) on all milk sold in the contiguous United States. In 2003, New York dairy
farmers contributed approximately $17.93 million to federally-authorized dairy promotion and
advertising funds. These contributions are allocated not only to the national program,1 but also to
the regional, state, and local programs operating in markets where milk is ultimately sold. The
federal legislation specifies that at least 5 cents of the 15 cent per cwt checkoff must be allocated
to the national program, and allows for credits of up to 10 cents per cwt for contributions to
authorized regional, state, or local promotion programs. In 2003, of the $17.93 million paid by
New York dairy farmers, approximately $11.95 million was allocated to regional, state, and local
programs operating in the markets where New York milk is sold.
The largest regional program operating in New York state is the American Dairy
Association and Dairy Council (ADADC). Other programs receiving financial support from
New York dairy farmers include Milk for Health on the Niagara Frontier, which is located in the
Buffalo area, and the Rochester Health Foundation. In addition, to the extent that New York
state milk flows to New England, the New England Dairy Promotion Board receives New York
dairy farmers’ financial support. Finally, some New York state milk flows west into Ohio,
* The authors are professor, graduate research assistant, and research associate, respectively, in the Department of Applied Economics and Management at Cornell University. Funding for this project came from the New York State Dairy Promotion Order. 1 Operated by Dairy Management, Incorporated (DMI).

2
where ADADC Mideast receives financial support from New York state dairy promotion funds.
These advertising and promotion organizations are engaged in a wide range of
promotional activities including nutrition education, various point-of-sale merchandising
activities, and media advertising. The present study focuses solely on the media advertising
activities in five New York markets--New York City, Albany, Syracuse, Rochester, and Buffalo.
The majority of dairy checkoff funds in New York state have been invested in media advertising.
Under contract with the New York Milk Promotion Advisory Board (NYMPAB), ADADC
implements the advertising programs in the New York City, Albany, and Syracuse markets.
Through a contractual relationship with the Rochester Health Foundation, ADADC places
advertising in the Rochester market as well. Milk for Health on the Niagara Frontier operates an
independent advertising program in the Buffalo market.
This economic report provides an updated analysis on the responsiveness of fluid milk
sales to milk advertising in the New York City, Albany, Syracuse, Rochester, and Buffalo
markets. A previous study by Cornell economists was conducted in 2002 (Kaiser and Chung).
Given the length of time that has passed since this was last studied, it is important to reexamine
the relative responsiveness and rates of return associated with advertising among these markets.
The following sections describe the conceptual fluid milk demand model used to evaluate
advertising in the markets being analyzed, document the data collected for this analysis, discuss
some specific issues related to model estimation, and report and interpret the econometric
results. Finally, the econometric results are used to simulate the impacts of the New York state
advertising program on the farm milk price and producer rates of returns for these five markets.

3
The Model
In each market, per capita fluid milk sales are assumed to be affected not only by generic
advertising expenditures, but also by the retail price of milk, prices of substitutes for milk,
consumer income, competing advertising expenditures for milk substitutes, and race and age
population demographic variables. In addition, the demand equation for each market
incorporates a set of variables to account for seasonality in fluid milk consumption. The general
form for the demand equation for each market can be expressed as:
Quantity = f(milk price, substitute price, income, age demographics, race demographics, competing beverage advertising expenditures, generic milk advertising expenditures, seasonality).
Regardless of the functional form chosen for estimation, economic theory provides a
basis for expectations as to the signs of the price and income variables. With fluid milk quantity
as the dependent variable, the estimated coefficient for fluid milk price should have a negative
sign. In other words, the expected consumer response to an increase in the price of milk is lower
consumption. When the price of a substitute for milk rises, making milk a relatively better buy,
the effect should be to increase milk consumption. Thus, the estimated coefficient for any
substitute price is expected to be positive. The estimated coefficient for income is expected to
have a positive sign. When income rises, consumers can be expected to purchase more milk, as
well as more of most goods.
One can also make reasonable hypotheses on the expected signs for the race and age
demographics, competing advertising, and milk advertising variables. The proportion of the
population less than 10 years old is an important milk consuming age cohort and therefore is
expected to be positively correlated with milk consumption. However, once children reach the
4
age of 10 and over, they start to abandon milk and switch to competing beverages such as soda.
Accordingly, we expect the percent of population between 10-14 years old to be negatively
correlated with milk consumption. In terms of racial demographics, Hispanics tend to consume
more milk than Caucasians, while African Americans typically consume less milk than
Caucasians. Some studies have also shown Asians consume more milk than Caucasians (Schmit
and Kaiser). Accordingly, we expected the percent of the population that is Hispanic and that is
Asian to have a positive correlation with milk consumption, and the percent of the population
that is African American to have a negative correlation. Advertising of milk substitutes should
also decrease milk consumption. Therefore, there should be an inverse relationship between
competing advertising expenditures and milk consumption. If milk advertising is effective, an
increase in milk advertising should be associated with greater milk consumption; thus estimated
generic milk advertising coefficients should have positive signs when this advertising is working
as intended.
Data
For each of the five markets being analyzed, the relevant market area is assumed to be the
dominant market area (DMA) for the television stations broadcasting from the major city in the
market. In each market, this definition leads to a multi-county designation. Of the five markets
included in this study, the New York City market is the only one in which a significant portion
of the DMA lies outside the boundaries of New York state. The New York City DMA includes
roughly the northern half of New Jersey. In the past, we have obtained fluid milk sales data for
the New Jersey portion of the New York City DMA from the New Jersey Department of
Agriculture, and more recently from the Market Administrator’s Office for Order #2.
Unfortunately, data are no longer available from either of these sources. Therefore, in the

5
present analysis of the New York City DMA, only the New York State portion is considered, and
it is assumed that per capita milk sales in northern New Jersey are the same as per capita sales in
New York City. All data used in the model were collected on a monthly basis over the period
1986-2003.
Fluid milk sales for each of the five markets are estimates based on data collected by the
Division of Dairy Industry Services and Producer Security (DIS), New York State Department of
Agriculture and Markets. Each year, in May and October, every plant and milk dealer with route
sales in New York state must file a report showing the amounts of milk sold in each county in
which they do business. In addition, all plants from which processed fluid milk is delivered to
New York state dealers, or sold on routes in New York state, must file monthly plant reports.
Based on these reports, it is possible to trace all milk sold into any designated market area back
to the plants in which it was processed. Based on the May report, and the monthly plant reports
for May, plant-specific allocation factors can be developed and applied to the monthly plant
reports to estimate monthly in-market sales for January through June. Likewise, the October
report provides the basis for estimating monthly in-market sales for July through December.
Fluid milk prices for each market comes from the DIS publication titled Survey of Retail
Milk Prices for Selected Markets in NYS. This report contains retail prices for each type of milk
(whole, 2%, 1%, and skim) in various container sizes for several cities in New York. The price
series used in this analysis are for whole milk in half-gallon containers.
The Consumer Price Index (CPI) for nonalcoholic beverages in the Northeast is used as a
proxy for the substitute price in each equation. This series is available in the CPI Detail Report
published by the Federal Bureau of Labor Statistics. This same report is also the source for the
CPI for all items which is used as a deflator for income.

6
Two different income measures were used in this study. The first is from the New York
State Department of Labor’s Employment Review. For each of the five markets being studied,
this periodical contains timely reports of average weekly earnings of production workers in the
manufacturing sector. Liu and Forker also used this variable as a proxy for consumer income.
The second was per capita income for each region collected from the U.S. Census Bureau. Since
this figure was only available on an annual basis, it was extrapolated to a quarterly basis using
state-wide seasonal trends in income. Based on the best statistical results, we used the average
weekly earning measure in the demand functions for New York City and Rochester, and the
regional income measure for Buffalo and Syracuse. Neither measure was used in Albany
because of statistical problems.
Nominal advertising expenditures for competing beverages were based on monthly
AD*VIEWS data (Copyright 2004, Nielsen Media Research) and provided by Lowe World Wide,
Inc., the marketing agency contracted for the national milk advertising campaign with Dairy
Management, Inc. The products included coffee and tea, bottled water, fruit and vegetable
juices, carbonated beverages, and other nonalcoholic, non-dairy beverages. To adjust for
inflation and seasonal change in media costs, these expenditures were deflated by Media Cost
Indices provided by Lowe World Wide, Inc. The resulting advertising expenditures, which are
on a national basis, were then prorated on a population basis to obtain an estimate of the portion
of the national advertising effort affecting each of the New York state markets. For the Albany
and New York City demand models, bottled water advertising was used to represent competing
advertising, and for Rochester juice advertising was used. None of the competing advertising
products gave the correct signs in the Buffalo and Syracuse models and were subsequently
excluded.

7
Monthly nominal generic advertising expenditures on radio and television in New York
City, Albany, Syracuse, and Rochester markets were provided by ADADC from their contracted
advertising agency handling the fluid milk account. Nominal radio and television expenditures
in the Buffalo market are provided by DIS from audits of Milk for Health on the Niagara
Frontier. For all five markets, adjustments are made to advertising expenditures to transform
them into a measure of advertising effort. These adjustments account for not only year-to-year
inflation in media costs, but also quarter-to-quarter variations in media costs within any year.
Monthly national fluid milk advertising expenditures were supplied by Lowe World Wide, Inc.
and Dairy Management, Inc. These expenditures are deflated and prorated on a population basis
to obtain an estimate of the portion of the national fluid milk advertising effort affecting each of
the markets under study here.
Estimation
A double-log equation of the following form was specified for each market:
(1) ln SALESt = α0 + α 1 ln (PRICEt/SUBt) + α 2 ln INCOMEt + α 3 ln DEMOGRt m n 3 + Σ βi ln BEVADt-i + Σ ωj ln MILKADt-j + Σ δk DUMQk,t , i=0 j=0 k=1 where SALESt is quarterly per capita fluid milk sales, PRICEt is the average quarterly retail fluid
milk price, SUBt is the quarterly nonalcoholic beverage price index, INCOMEt is the quarterly
income measure deflated by the CPI for all items, DEMOGRt are quarterly age and/or race
demographic variables, BEVADt is a vector of deflated advertising expenditures for competing
milk products in the current and previous quarters, MILKADt is a vector of deflated generic milk
advertising expenditures in the current and previous quarters, and DUMQk,t is a vector of

8
quarterly dummy variables for the first, second, and third quarter of the year. Because there is a
high correlation between the retail fluid milk price and the nonalcoholic beverage price index,
inclusion of these two variables separately in the model causes multicollinearity problems. To
deal with this problem, a ratio of the retail milk price to the nonalcoholic beverage price index is
used. Quarterly data from 1986 through 2003 are used to estimate the coefficients in equation
(1). The model was estimated using two-stage least squares by estimating a price instrument for
the endogenous retail milk price as a function of exogenous variables in the model.
The coefficients on all advertising variables are estimated with a second order
polynomial distributed lag function with endpoint restrictions imposed. This approach is used to
estimate the effect on current quarterly sales of not only current quarterly advertising, but also
advertising in past quarters. This assumes that the impact of advertising is distributed over time
rather than being limited to only the quarter that the advertising is implemented, which is a
common assumption (Liu and Forker, Kaiser and Reberte). The length of the lag for each
market was set at four quarters.
One advantage of the double-log form is that it provides coefficient estimates that are
direct estimates of elasticities. An estimated elasticity is a measure of the percentage change in
the dependent variable, sales in this case, resulting from a one percent change in an independent
variable, all else held constant. In the equation specified above, α1 is the own price elasticity
(the elasticity of milk sales with respect to the milk price), α2 is the income elasticity (the
elasticity of milk sales with respect to income), α3 is a vector of racial and age elasticities (the
elasticity of milk sales with respect to racial and age demographics), and βi and ωj are the
competing and own advertising elasticities (the elasticity of milk sales with respect to competing
beverage and milk advertising expenditures in the current and previous months).

9
Results
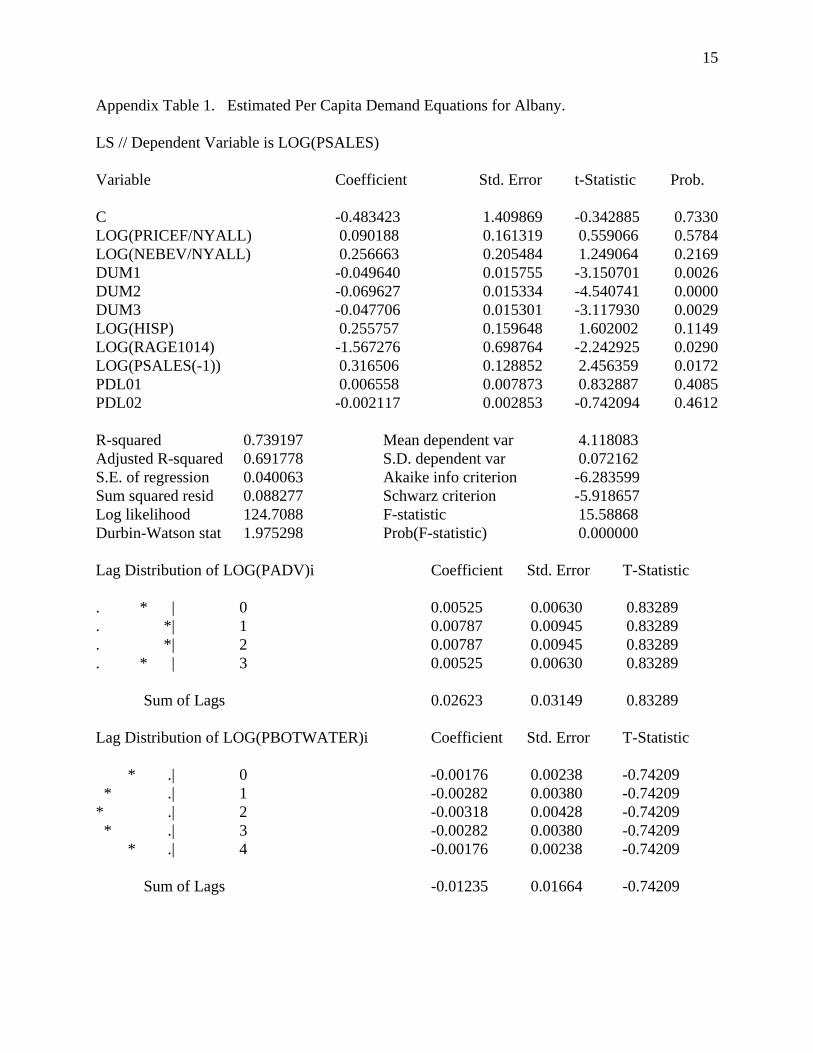
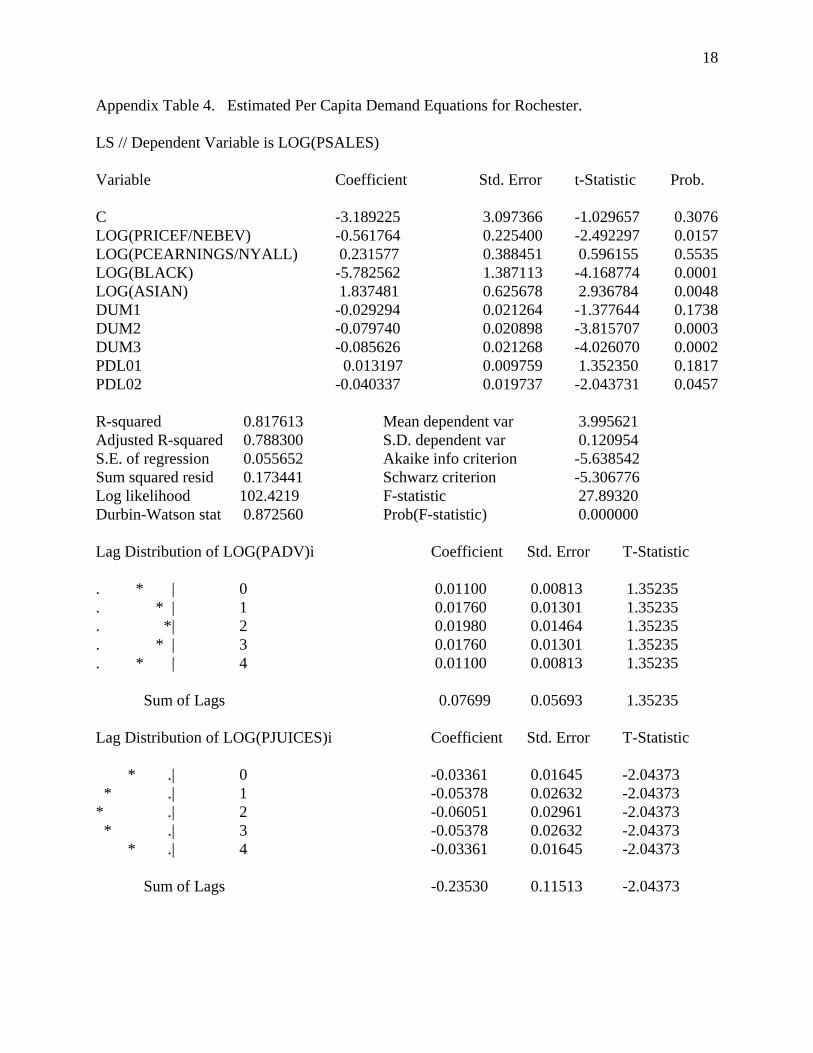
The estimation results are presented for each market in the Appendix of this report. In this
section, the focus is on the estimated generic milk advertising elasticities for each of the five
markets.
Generic milk advertising had a positive impact on milk sales in all markets, and was
statistically significant in four out of the five markets. Syracuse had the highest average long-
run generic milk advertising elasticity of 0.090, i.e., a ten percent increase in generic milk
advertising expenditure resulted in an average increase in per capita milk sales of 0.9 percent.2
Buffalo and Rochester were close behind with average long-run advertising elasticities of 0.079
and 0.077, respectively. New York City had an advertising elasticity of 0.048, which was also
statistically significant. Albany had the lowest advertising elasticity of 0.038, which was the
only statistically insignificant elasticity. Interestingly, all of the advertising elasticities were
higher than the ones estimated two years ago by Kaiser and Chung. These results indicated that
generic fluid milk advertising in New York state have had a positive impact on milk sales.
The estimated model was used to simulate the impact of New York state generic milk
advertising on producer returns. The model was simulated under two advertising scenarios over
the 1986-2003 period: (1) with combined national and New York state milk advertising
expenditures equal to historic monthly levels, and (2) with national milk advertising
expenditures equal to historic levels, but no New York state generic milk advertising. This
implicitly assumes that dollars spent on the New York program have the same impact as dollars
spent on the national program. A comparison of the results of the two scenarios provides a
measure of the state program’s impact on New York markets. The bottom-line measure that

10
New York dairy farmers are interested in is whether the benefits of state-level advertising are
greater than the costs in each of the five markets.
The benefits of fluid milk advertising are the additional Class I revenues created by
increasing fluid milk sales since milk going into fluid use receives a premium (Class I
differential) compared to milk going into manufactured dairy products. Accordingly, the
benefits in each market due to state milk advertising are equal to:
BENEFIT = DF * ∆SALES * POP,
where: BENEFIT is the monetary value of benefits in the market due to state-level advertising,
∆SALES is the change in per capita sales in the market due to state-level milk advertising, and
POP is the market population. The benefits associated with New York state generic milk
advertising were computed quarterly from 1986 to 2003 by simulating the above two scenarios
and taking the difference in per capita sales to obtain ∆SALES. To account for inflation, the
Class I differential in each market was deflated by the CPI (in 2003 dollars). The cost in each
market due to state milk advertising is the advertising cost. As was the case before, to account
for inflation, advertising cost (COST) was deflated by the Media Cost Index (in 2003 dollars).
A benefit-cost ratio for state-level advertising in each market can then be calculated as:
BCR = BENEFIT/COST.
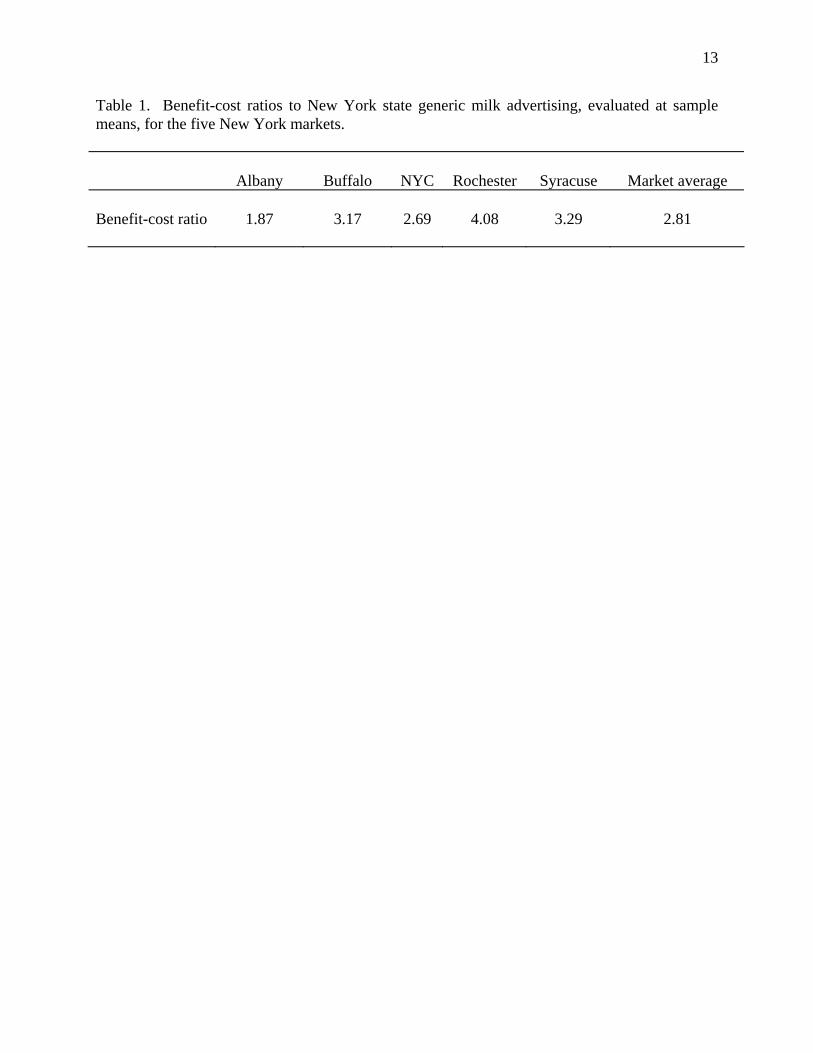
Table 1 displays the estimated average BCRs to New York state generic milk advertising
from 1986 to 2003 for the five markets and a weighted average for all five markets. It is clear
from these findings that state spending on generic milk advertising over the period 1986-2003
has been profitable for dairy farmers. The weighted average BCR for the five markets was 2.81,
2 The estimated advertising elasticity for Buffalo may be biased upward for two reasons. First, there are some milk sales in this market from Canadians living over the border which are attributed to the Buffalo population. Second, there is some milk advertising from Ontario in this market which is not included in the demand equation.

11
i.e., an additional dollar spent on state generic milk advertising resulted in an average increase of
$2.81 in Class I revenue. This figure is higher than our previous study using similar data over
the period 1986-1999, which estimated an average BCR for New York state of 2.12.
In terms of individual New York state markets, Rochester had the highest BCR (4.18),
which is followed by Syracuse (3.29) and Buffalo (3.17). All markets had benefit-cost ratios
above one indicating that the New York state contribution to the overall advertising program had
benefits that exceeded costs, on average, over this period of time.
Conclusion The purpose of this study was to examine the responsiveness of fluid milk sales to milk
advertising in the New York City, Albany, Syracuse, Rochester, and Buffalo markets. Fluid
milk demand equations for New York City, Albany, Syracuse, Rochester, and Buffalo were
estimated with quarterly data from 1986-2003. The demand equations included the following
explanatory variables: retail milk price, nonalcoholic beverage price index, per capita earnings
(or income) in the manufacturing sector, population percentages by age and race, competing
beverage advertising expenditures, generic milk advertising expenditures, and seasonality
variables.
The results indicated that generic milk advertising was positive and statistically
significant in all but one market. The highest advertising elasticity was in the Rochester market,
followed by Syracuse and Buffalo. The model was simulated to determine the impact of the
New York state portion of advertising expenditures on producer milk returns. Benefit-cost ratios
were also estimated for each of the five markets. The weighted average BCR for the five
markets was 2.81. In terms of individual New York state markets, Rochester had the highest

12
BCR, which was followed by Syracuse and Buffalo. All of the market BCRs were above 1.00,
indicating that New York state’s contribution to the overall advertising program had benefits that
exceeded costs, on average, over this period of time.
13
Table 1. Benefit-cost ratios to New York state generic milk advertising, evaluated at sample means, for the five New York markets.
Albany
Buffalo
NYC
Rochester
Syracuse
Market average Benefit-cost ratio
1.87
3.17
2.69
4.08
3.29
2.81

14
References
Kaiser, H.M. and C.J. Chung. “Impact of Generic Milk Advertising on New York State
Markets.” NICPRE Bulletin 02-01, Department of Agricultural, Managerial, and Resource Economics, February 2002.
Kaiser, H.M. and J.C. Reberte. “Impact of Generic Fluid Milk Advertising on Whole, Lowfat,
and Skim Milk Demand.” Journal of Dairy Science. 79(1996):2284-91. Kinnucan, H. W. Demographic Versus Media Advertising Effects on Milk Demand: The Case
of the New York City Market. Northeastern Journal Agricultural Economics. 15:(1986)66.
Kinnucan, H. W. and O. D. Forker. “Seasonality in the Consumer Response to Milk Advertising
With Implications for Milk Promotion Policy.” American Journal of Agricultural Economics 68(1986):562.
Liu, D.J. and O.D. Forker. “Optimal Control of Generic Fluid Milk Advertising Expenditures.”
American Journal of Agricultural Economics. 72(1990)1047-55. Schmit, Todd M. and Harry M. Kaiser. “Decomposing the Variation in Generic Advertising
Response Over Time.” American Journal of Agricultural Economics, 86(2004):139-153. Thompson, S. R. “Sales Response to Generic Promotion Efforts and Some Implications of Milk
Advertising on Economic Surplus.” Journal of the Northeastern Agricultural Economics Council. 3(1974):78.
Thompson, S. R. and D. A. Eiler. “Producer Returns from Increased Milk Advertising.”
American Journal of Agricultural Economics. 57(1975):505. Ward, R. W. “Economic Returns From the Beef Checkoff.” UF#NCA94.1, National Cattlemen's
Association, 1994.
15
Appendix Table 1. Estimated Per Capita Demand Equations for Albany. LS // Dependent Variable is LOG(PSALES) Variable Coefficient Std. Error t-Statistic Prob. C -0.483423 1.409869 -0.342885 0.7330 LOG(PRICEF/NYALL) 0.090188 0.161319 0.559066 0.5784 LOG(NEBEV/NYALL) 0.256663 0.205484 1.249064 0.2169 DUM1 -0.049640 0.015755 -3.150701 0.0026 DUM2 -0.069627 0.015334 -4.540741 0.0000 DUM3 -0.047706 0.015301 -3.117930 0.0029 LOG(HISP) 0.255757 0.159648 1.602002 0.1149 LOG(RAGE1014) -1.567276 0.698764 -2.242925 0.0290 LOG(PSALES(-1)) 0.316506 0.128852 2.456359 0.0172 PDL01 0.006558 0.007873 0.832887 0.4085 PDL02 -0.002117 0.002853 -0.742094 0.4612 R-squared 0.739197 Mean dependent var 4.118083 Adjusted R-squared 0.691778 S.D. dependent var 0.072162 S.E. of regression 0.040063 Akaike info criterion -6.283599 Sum squared resid 0.088277 Schwarz criterion -5.918657 Log likelihood 124.7088 F-statistic 15.58868 Durbin-Watson stat 1.975298 Prob(F-statistic) 0.000000 Lag Distribution of LOG(PADV)i Coefficient Std. Error T-Statistic . * | 0 0.00525 0.00630 0.83289 . *| 1 0.00787 0.00945 0.83289 . *| 2 0.00787 0.00945 0.83289 . * | 3 0.00525 0.00630 0.83289 Sum of Lags 0.02623 0.03149 0.83289 Lag Distribution of LOG(PBOTWATER)i Coefficient Std. Error T-Statistic * .| 0 -0.00176 0.00238 -0.74209 * .| 1 -0.00282 0.00380 -0.74209 * .| 2 -0.00318 0.00428 -0.74209 * .| 3 -0.00282 0.00380 -0.74209 * .| 4 -0.00176 0.00238 -0.74209 Sum of Lags -0.01235 0.01664 -0.74209

16
Appendix Table 2. Estimated Per Capita Demand Equations for Buffalo. LS // Dependent Variable is LOG(PSALES) Variable Coefficient Std. Error t-Statistic Prob. C -3.725303 2.468700 -1.509014 0.1375 LOG(PRICEF/NEBEV) -0.036687 0.180365 -0.203404 0.8396 LOG(PCINCOME/NYALL) 0.354592 0.246395 1.439122 0.1562 LOG(BLACK) -0.959324 0.379005 -2.531166 0.0145 LOG(HISP) 0.334594 0.140654 2.378846 0.0211 LOG(RAGE1014) -0.582946 0.451819 -1.290221 0.2028 LOG(PSALES(-1)) 0.452749 0.123734 3.659059 0.0006 DUM1 -0.076563 0.017025 -4.497242 0.0000 DUM2 -0.094185 0.015360 -6.131700 0.0000 DUM3 -0.079705 0.013916 -5.727453 0.0000 PDL01 0.007435 0.003630 2.048231 0.0457 R-squared 0.829095 Mean dependent var 4.092357 Adjusted R-squared 0.795584 S.D. dependent var 0.076137 S.E. of regression 0.034423 Akaike info criterion -6.578504 Sum squared resid 0.060434 Schwarz criterion -6.201109 Log likelihood 126.9594 F-statistic 24.74115 Durbin-Watson stat 1.820740 Prob(F-statistic) 0.000000 Lag Distribution of LOG(PADV)i Coefficient Std. Error T-Statistic . * | 0 0.00620 0.00302 2.04823 . * | 1 0.00991 0.00484 2.04823 . *| 2 0.01115 0.00544 2.04823 . * | 3 0.00991 0.00484 2.04823 . * | 4 0.00620 0.00302 2.04823 Sum of Lags 0.04337 0.02117 2.04823

17
Appendix Table 3. Estimated Per Capita Demand Equations for New York City. LS // Dependent Variable is LOG(PSALES) Variable Coefficient Std. Error t-Statistic Prob. C -1.843240 0.626923 -2.940138 0.0048 LOG(PRICEF/NEBEV) -0.019110 0.092254 -0.207152 0.8366 LOG(PCEARNINGS/NYALL) 0.131553 0.086328 1.523869 0.1332 LOG(RAGE1014) -1.466993 0.278487 -5.267731 0.0000 LOG(PSALES(-1)) 0.182425 0.134686 1.354447 0.1810 DUM1 -0.038284 0.012669 -3.021883 0.0038 DUM2 -0.040277 0.011129 -3.619030 0.0006 DUM3 -0.052209 0.010956 -4.765264 0.0000 PDL01 0.006746 0.004477 1.506739 0.1375 PDL02 -0.004907 0.001881 -2.608764 0.0116 R-squared 0.920409 Mean dependent var 3.887124 Adjusted R-squared 0.907618 S.D. dependent var 0.093796 S.E. of regression 0.028509 Akaike info criterion -6.976357 Sum squared resid 0.045514 Schwarz criterion -6.644592 Log likelihood 146.5699 F-statistic 71.95541 Durbin-Watson stat 1.701424 Prob(F-statistic) 0.000000 Lag Distribution of LOG(PADV)i Coefficient Std. Error T-Statistic . * | 0 0.00562 0.00373 1.50674 . * | 1 0.00899 0.00597 1.50674 . *| 2 0.01012 0.00672 1.50674 . * | 3 0.00899 0.00597 1.50674 . * | 4 0.00562 0.00373 1.50674
Sum of Lags 0.03935 0.02612 1.50674 Lag Distribution of LOG(RBOTWATER/USPOP)i Coefficient Std. Error T-Statistic * .| 0 -0.00409 0.00157 -2.60876 * .| 1 -0.00654 0.00251 -2.60876 * .| 2 -0.00736 0.00282 -2.60876 * .| 3 -0.00654 0.00251 -2.60876 * .| 4 -0.00409 0.00157 -2.60876 Sum of Lags -0.02863 0.01097 -2.60876
18
Appendix Table 4. Estimated Per Capita Demand Equations for Rochester. LS // Dependent Variable is LOG(PSALES) Variable Coefficient Std. Error t-Statistic Prob. C -3.189225 3.097366 -1.029657 0.3076 LOG(PRICEF/NEBEV) -0.561764 0.225400 -2.492297 0.0157 LOG(PCEARNINGS/NYALL) 0.231577 0.388451 0.596155 0.5535 LOG(BLACK) -5.782562 1.387113 -4.168774 0.0001 LOG(ASIAN) 1.837481 0.625678 2.936784 0.0048 DUM1 -0.029294 0.021264 -1.377644 0.1738 DUM2 -0.079740 0.020898 -3.815707 0.0003 DUM3 -0.085626 0.021268 -4.026070 0.0002 PDL01 0.013197 0.009759 1.352350 0.1817 PDL02 -0.040337 0.019737 -2.043731 0.0457 R-squared 0.817613 Mean dependent var 3.995621 Adjusted R-squared 0.788300 S.D. dependent var 0.120954 S.E. of regression 0.055652 Akaike info criterion -5.638542 Sum squared resid 0.173441 Schwarz criterion -5.306776 Log likelihood 102.4219 F-statistic 27.89320 Durbin-Watson stat 0.872560 Prob(F-statistic) 0.000000 Lag Distribution of LOG(PADV)i Coefficient Std. Error T-Statistic . * | 0 0.01100 0.00813 1.35235 . * | 1 0.01760 0.01301 1.35235 . *| 2 0.01980 0.01464 1.35235 . * | 3 0.01760 0.01301 1.35235 . * | 4 0.01100 0.00813 1.35235 Sum of Lags 0.07699 0.05693 1.35235 Lag Distribution of LOG(PJUICES)i Coefficient Std. Error T-Statistic * .| 0 -0.03361 0.01645 -2.04373 * .| 1 -0.05378 0.02632 -2.04373 * .| 2 -0.06051 0.02961 -2.04373 * .| 3 -0.05378 0.02632 -2.04373 * .| 4 -0.03361 0.01645 -2.04373 Sum of Lags -0.23530 0.11513 -2.04373

19
Appendix Table 5. Estimated Per Capita Demand Equations for Syracuse. LS // Dependent Variable is LOG(PSALES) Variable Coefficient Std. Error t-Statistic Prob. C -1.992284 3.354636 -0.593890 0.5550 LOG(PRICEF/NEBEV) -0.031915 0.163566 -0.195122 0.8460 LOG(PCINCOME/NYALL) 0.253806 0.333535 0.760957 0.4499 LOG(BLACK) -0.966361 0.384243 -2.514977 0.0148 LOG(HISP) 0.245834 0.124684 1.971649 0.0536 LOG(PSALES(-1)) 0.534331 0.108980 4.903041 0.0000 DUM1 -0.086861 0.015167 -5.727177 0.0000 DUM2 -0.099273 0.013005 -7.633240 0.0000 DUM3 -0.078895 0.012450 -6.337069 0.0000 PDL01 0.007195 0.003620 1.987791 0.0517 R-squared 0.830612 Mean dependent var 4.087621 Adjusted R-squared 0.803389 S.D. dependent var 0.076750 S.E. of regression 0.034031 Akaike info criterion -6.622216 Sum squared resid 0.064856 Schwarz criterion -6.290450 Log likelihood 134.8832 F-statistic 30.51139 Durbin-Watson stat 1.846255 Prob(F-statistic) 0.000000 Lag Distribution of LOG(PADV)i Coefficient Std. Error T-Statistic . * | 0 0.00600 0.00302 1.98779 . * | 1 0.00959 0.00483 1.98779 . *| 2 0.01079 0.00543 1.98779 . * | 3 0.00959 0.00483 1.98779 . * | 4 0.00600 0.00302 1.98779 Sum of Lags 0.04197 0.02112 1.98779

20
Appendix Table 6. Definition of Variables in Demand Models.
LOG(PSALES) = natural logarithm of per capita fluid milk sales;
C = regression intercept;
LOG(PRICEF/NYALL) = natural logarithm of retail fluid milk price instrumental variable
divided by Consumer Price Index for all items in New York state;
LOG(NEBEV/NYALL) = natural logarithm Consumer Price Index for non-alcoholic beverages
in Northeast divided by Consumer Price Index for all items in New York state;
DUM1 = indicator variable for quarter 1, equals 1 for quarter 1, 0 elsewise;
DUM2 = indicator variable for quarter 2, equals 1 for quarter 2, 0 elsewise;
DUM3 = indicator variable for quarter 3, equals 1 for quarter 3, 0 elsewise;
LOG(HISP) = natural logarithm of percent of region’s Hispanic population;
LOG(RAGE1014) = natural logarithm of percent of regions population between 10-14 years of
age ;
LOG(PSALES(-1)) = = natural logarithm of per capita fluid milk sales lagged one quarter;
LOG(PADV)i = natural logarithm of per capita generic milk advertising;
LOG(PBOTWATER)i = natural logarithm of per capita bottle water advertising;
LOG(PCINCOME/NYALL) = natural logarithm of per capita income divided by Consumer
Price Index for all items in New York state;
LOG(BLACK) = natural logarithm of percent of region’s African American population;
LOG(PCEARNINGS/NYALL) = natural logarithm of per capita earnings divided by Consumer
Price Index for all items in New York state;
LOG(ASIAN) = natural logarithm of percent of region’s Asian American population;
LOG(PJUICES)i = natural logarithm of per capita fruit juice advertising.
