impact of farmer groups on crop enterprise...
TRANSCRIPT
IMPACT OF FARMER GROUPS ON CROP ENTERPRISE PRODUCTIVITY AND
ECONOMIC WELFARE OF SMALLHOLDER FARMERS IN SOUTH KIVU
TERRITORIES, DEMOCRATIC REPUBLIC OF CONGO
OCHIENG’ DENNISH OTIENO
A Thesis Submitted to the Graduate School in Fulfillment of the Requirements of the
Master of Science Degree in Agricultural and Applied Economics of Egerton University
EGERTON UNIVERSITY
August, 2012

ii
DECLARATION AND RECOMMENDATION
DECLARATION
This thesis is my original work and has not been presented for award of any degree in this or
any other University.
Ochieng’ Dennish Otieno
KM17/2073/08
Department of Agricultural Economics and Business Management
Sign-------------------------
Date-------------------------
RECOMMENDATION
This thesis has been submitted to the graduate school for examination with our
recommendation as University supervisors.
Dr George Owuor (PhD)
Senior Lecturer, Department of Agricultural Economics and Agribusiness Management,
Egerton University
Sign--------------------------
Date--------------------------
Dr Eliud .A. Birachi (PhD)
International Center for Tropical Agriculture (CIAT), Kigali.
Sign--------------------------
Date--------------------------

iii
COPYRIGHT
No part of this thesis may be reproduced or transmitted in any form or means, electronic,
mechanical including photocopying, recording or any information storage and retrieval
system without prior permission of the author or Egerton University on that behalf.
©2012 Ochieng Dennish Otieno
All rights reserved

iv
DEDICATION
I dedicate this work to my late dad Ochieng’, mum Akoth and my sisters Apondi, Adhiambo
and Anyango for their support and to research institutions in DRC for their participatory
approach in disseminating technologies to improve agricultural productivity among
smallholder farmers.
v
ACKNOWLEDGEMENT
I am extremely grateful to all those who gave me invaluable insights to this work. My special
thanks go to those who made themselves readily available and from whom my knowledge
became richer. These people are numerous to list. However my indebtedness is high to Dr
Owuor and Dr Birachi, my supervisors with minds of fine agribusiness specialists, who
challenged me towards substantial improvement of this thesis. Dr Mutai, department chair,
for his facilitation in the CMAAE program. Egerton University, for giving me opportunity to
pursue the MSc course and the research support through Graduate School. I also
acknowledge the CMAAE secretariat for their financial support while at University of
Pretoria. Special thanks to CIAT-Africa coordinator, Dr Robin Buruchara for the research
support under the CSO-DioBass Project in DRC and from which my study was incorporated.
Most sincere thanks to Sylvain Mapatano of Plateform-DioBass in Bukavu and Adrien
Chiffizi for their willful logistical support in timely data collection in the vast territories.
Charles Ooko and Addalla, went beyond friendship to lend hands in improving the
penultimate draft. So did Ochieng Justus, a colleague, friend and an important critic whose
views I had to consider seriously. Thanks for the prayers from my family and Addalla that
saw me navigate through the program. Finally, to the almighty God be the glory for His
mercies are good. The views expressed herein do not reflect in any way the views of CIAT,
Plateform-DioBass or Egerton University with which I am associated.
vi
ABSTRACT
In spite of the efforts and the emergence of numerous group based interventions for
technology dissemination, the productivity and technology uptake levels of smallholder
farmers of South Kivu, democratic Republic of Congo (DRC) still remain low. The
objectives of this study were therefore to describe the changes in input use, value of
production and incomes, determine changes in institutional linkages resulting from group
based interventions, quantify the economic gains from the group interventions and finally to
determine the factors that influenced the economic gain. Data was collected using structured
interview schedule. Multi-stage sampling technique was used to obtain a sample of 360
smallholder farmers (120 farmers from each territory) .The three territories (Ngweshe,
Mwenga and Kabare) were purposively selected because of the interventions that were
implemented therein, their variability in productivity and income among smallholders.
Descriptive statistics (mean comparisons) was used to address objective 1 and objective 2.
Economic surplus model was used to address objective 3 and then OLS regression used to
address objective 4.Data were analyzed using SPSS software. The findings revealed
significant differences in the use of top dressing fertilizer, productivity (value of production)
and number of meetings attended among the group and non group farmers(at p<0.05). From
the OLS regression, it was established that the factors that significantly influence economic
gain were credit (-0.415), radio farmer programmes (0.004) and off-farm income (0.561) at
p<0.05.The differences in input use levels, value of production and economic gains between
group and non group farmers underscore the importance of farmer groups in improving
productivity and welfare of smallholders in Congo. The study therefore recommends policy
interventions to increase credit access by farmers and information access via farmer radio
programmes as well as promotion of projects that incorporate more income generating
activities along with the technology package to make the new innovations affordable to the
resource poor farmers.

vii
TABLE OF CONTENTS
DECLARATION AND RECOMMENDATION .................................................................. ii
COPYRIGHT ......................................................................................................................... iii
DEDICATION......................................................................................................................... iv
ACKNOWLEDGEMENT ....................................................................................................... v
ABSTRACT ............................................................................................................................. vi
TABLE OF CONTENTS ...................................................................................................... vii
LIST OF TABLES .................................................................................................................. ix
LIST OF FIGURES ................................................................................................................. x
CHAPTER ONE ...................................................................................................................... 1
INTRODUCTION.................................................................................................................... 1
1.1 Background Information.................................................................................................. 1
1.2 Statement of the problem ................................................................................................. 2
1.3 Objectives of the study .................................................................................................... 3
1.4 Hypotheses ...................................................................................................................... 3
1.5 Justification of the study .................................................................................................. 3
1.6 Scope and limitations of the study ................................................................................... 4
1.7 Operational definition of terms ........................................................................................ 4
CHAPTER TWO ..................................................................................................................... 6
LITERATURE REVIEW ....................................................................................................... 6
2.1 Smallholder agriculture in Africa..................................................................................... 6
2.2 Technical and institutional challenges in smallholder agriculture in Africa ...................... 7
2.3 Nature of Agriculture in South Kivu ............................................................................... 7
2.4 Theoretical background ................................................................................................... 9
2.4.1 NIE and the concept of collective action ............................................................... 9 2.4.2 Theoretical Model............................................................................................... 11
2.4.3 Conceptual framework ........................................................................................ 13 2.3.4 The Empirical model .......................................................................................... 14
CHAPTER THREE ............................................................................................................... 18
METHODOLOGY ................................................................................................................ 18
3.1 Study area ..................................................................................................................... 18

viii
3.2 Sampling design and techniques .................................................................................... 20
3.3 Data collection method .................................................................................................. 20
3.4 Model Specification and Statistical Analysis ................................................................. 21
3.4.1 Comparative statistics ......................................................................................... 21 3.4.2 Economic Surplus model .................................................................................... 21
3.4.3 Ordinary Least Squares regression ...................................................................... 21
CHAPTER FOUR .................................................................................................................. 23
RESULTS AND DISCUSSIONS .......................................................................................... 23
INTRODUCTION .............................................................................................................. 23
4.1 Factor use among group and non-group farmers. ........................................................... 25
4.2 Value of production across Territories ........................................................................... 27
4.3 Comparison of factor use within group and non group farmers in 2007 and 2009
production years. ................................................................................................................. 28
4.4 Socio Economic Factors Hypothesized to Influence Economic Gains ............................ 29
4.5 Factors that influenced economic gains of smallholder farmers in South Kivu, DRC. .... 30
CHAPTER FIVE ................................................................................................................... 33
CONCLUSION AND POLICY IMPLICATIONS ............................................................. 33
5.1 Conclusions ................................................................................................................... 33
5.3 Suggestions for Further Research .................................................................................. 35
REFERENCES ....................................................................................................................... 36
APPENDICES ........................................................................................................................ 41
APPENDIX ONE: INTERVIEW SCHEDULE ................................................................. 41
APPENDIX TWO : DESCRIPTIVE STATISTICS (2009) ............................................... 54
APPENDIX 3 Age of household head, education level and number of children ............. 55
APPENDIX 4 Gender distribution among the sampled respondents ............................... 55
APPENDIX 5. Value of production and off farm income for households ........................ 56
APPENDIX 6. Mean agricultural and non agricultural expenditure by households ..... 57
APPENDIX 7 Household wealth in the regions .................................................................. 58
APPENDIX 8. Inorganic and organic fertilizer usage in the regions ............................. 59
APPENDIX 9. Distance and time to nearest input market ................................................ 60

ix
LIST OF TABLES
Table 1: Tabular representation of study area ...................................................................... 18
Table 2: Sampling procedure ............................................................................................... 20
Table 3: Mean comparisons for 2007 between group and non-groups on factors use ........... 25
Table 4: Mean comparisons for 2009 between group and non-groups on factors use ........... 26
Table 5: Means of value of production in Kabare, Ngweshe and mwenga............................ 27
Table 6. Within group and within nongroup differences before and after interventions ........ 29
Table 7: Regression results for factors that influence Economic Gains ................................ 31

x
LIST OF FIGURES
Figure 1: Conceptual Framework ........................................................................................ 13
Figure 2: Equilibrium and Economic surplus ....................................................................... 15
Figure 3: Effect of technology on supply ............................................................................. 15
Figure 4: Diagrammatic representations of I, J and K parameters ........................................ 16
Figure 5: Map of South Kivu province ................................................................................ 19

xi
ACRONYMS AND ABBREVIATIONS
CAPRi Collective Action and Property Rights
CBOs Community Based Organizations
CIALCA Consortium for Improving Agriculture-based Livelihood in Central
Africa.
DRC Democratic Republic of Congo
FBOs Farmer Based Organizations
GBI Group Based Initiatives
Km Kilometers
Kg Kilogram
MDGs Millennium Development Goals
UN United Nations
US$ United States dollar
MFIs Micro Finance Institutions
CIAT International Center for Tropical Agriculture
NIE New Institution Economics
GOUPMENTs The sub territories
1
CHAPTER ONE
INTRODUCTION
1.1 Background Information
Over the past four decades (from 1960 to 1999) the estimated rate of agricultural
productivity change was 0.83% annually in East and Central Africa countries, although the
average rate from 1985 to 1999 was 1.9% annually. Former British colonies exhibited
significantly higher productivity gains than others, while countries that had been colonies of
Portugal or Belgium like the Democratic Republic of Congo, DRC exhibited significant
reduction in productivity especially during political conflicts (Lilyan et al., 2004; Cirimwami
and Mashika, 1999).
Like most of Sub-Saharan Africa countries, DRC depends to a great extent on the growth
of the agricultural sector, from which over 60% of the population derives its livelihood.
According to the UN Millennium Project (2005a), the Millennium Development Goal (MDG)
number one of poverty reduction forms an integral part of agricultural dependence in Sub-
Saharan Africa and DRC in particular. Efforts to improve and sustain the sector's
productivity therefore would be crucial to the nation’s economic development and the welfare
of her people.
For a long time, measures to alleviate poverty among smallholder farmers in Africa have
focused on individual farmers all through the 21st century. However, these have not yielded
much success, forcing research and development organizations to focus their efforts on
technological innovations and other interventions through groups or community based
approaches. The potential gain in productivity through group interventions is a major factor
underlying the need for developing countries to promote groups. Group actions are analyzed
within the concept of collective action. This concept is well developed under the theory of the
New Institutional Economics (NIE). It is based on institutional approach to solving societal
problems, and focuses on the conditions under which groups of people with common interests
choose and act to achieve their respective interest (Clague, 1997), a concept that is important
in a country like DRC where government institutions are generally weak and recovering from
the second conflict (from 1997 to 2003) . The farmer groups fill some of the voids generated
by this situation for example in input and output marketing.

2
Group networks are important because they create long-lasting relationships between
individual farmers and expand the opportunity for the development partners to relax current
liability limits. Among the most notable theories of moral hazard are models by Stiglitz
(1990), Ghatak and Guinane (1999) and Ghatak (1999). Stiglitz shows how peer monitoring
under joint liability mitigate moral hazardous behavior among group members. He observes
that group members under joint liability reduce the cost of monitoring activities of the group
and subsequent outcomes of its activities.
Group approaches to dissemination of innovations is preferred to farmer to farmer
approach since it has helped in strengthening seed systems and tailoring them towards
specific agro-ecological and socio-economic environments. This facilitates coordination in
seed distribution, genetic management, monitoring performance and seed production by the
known groups, seed rich in quality, germination and vigour. The group experiments allow
farmers to explore new products with limited risks and expense as well as having more
influence in the selection process.
The synergies in the group projects enable farmers, researchers and donors understand
farmer strategies and practices of soil fertility management before developing appropriate
technologies that fit various production micro-niches. Collective feedback of farmers’
concerns are responded to. Besides, farmers also gain from information and trainings offered
through the groups in their activities to even help them in output marketing.
1.2 Statement of the problem
South Kivu Province located in Eastern DRC in central Africa is recovering from the
aftermath of political conflict. The DRC Government and international research institutions
in collaboration with Non Governmental Organizations (NGOs) have been striving to
productively engage the war returnees in agriculture. This has been implemented through
several interventions (for example through community-based organizations, CBOs and
Farmer –based organizations, FBOs). The interventions have been in form of group based
introduction of improved technologies such as improved inputs and organization for markets.
In spite of the efforts and the emergence of numerous group based interventions for
technology dissemination, the productivity and technology uptake levels still remain low. For
example the application or inorganic fertilizer use is less than 20 kilograms (kgs) per hectare
while organic matter application rates are below 500 kgs per hectare. Overall crop production
levels are relatively low with banana and cassava production per household consistently
3
below 6 tons per season, largely ranging between 0.5 – 2 tons. Grain legume production is
consistently below 800 kg per season ranging between 100 – 500 kg per season. There is
limited empirical evidence of the impacts of farmer groups on the rural farming households in
terms of the differentials in incomes, and its contribution to poverty reduction by improving
household welfare from the time the interventions were initiated (2007) to the present.
1.3 Objectives of the study
The general objective of the study was to determine the impact of farmer groups on
smallholders’ productivity and economic welfare in South Kivu territories of the Democratic
Republic of Congo.
The specific research objectives were:
1. To compare input use, value of production and incomes between group members and
non group members before and after the interventions.
2. To determine changes in the institutional linkages as a result of group interventions.
3. To establish the impact of group interventions on smallholder farmers’ economic
gains.
4. To determine the production and institutional support factors that influenced
economic gains among smallholder farmers.
1.4 Hypotheses
1. There were no significant changes in input use, productivity and incomes resulting
from the group interventions among smallholders.
2. There were no significant changes in institutional linkages resulting from the
group interventions.
3. There was no significant impact of group interventions on economic gains of
smallholder farmers.
4. The production and institutional support factors did not significantly influence
economic gains of smallholder farmers.
1.5 Justification of the study
In trying to improve agricultural productivity, technological interventions have been
introduced and adopted by farmers. This has been through individual efforts and collective
(group) efforts. However, empirical evidence of the impacts of group efforts on productivity
and economic welfare of smallholders of the South Kivu territories is limited to be able to

4
assist in bridging the information gap on whether there is need to upscale the efforts or not.
The need to link with other institutions depends on the success of the existing group efforts
and without impact assessment, it would be impossible to advocate for up scaling the group
efforts even to other regions of the Democratic Republic of Congo. This study is a
contribution to on-going research with policy implications on ways of improving productivity
among smallholder farmers in DRC and the potential role of group approaches to technology
dissemination among the farmers. Information on value of production, input use levels and
economic gains from crop farming would be of much importance to the private sector and
NGOs interested in linking with farmer organizations in value chains.
1.6 Scope and limitations of the study
Owing to resource limitations, the study only focused on smallholders in three South Kivu
territories of DRC with analysis confined to farm level production interventions, institutional
linkages and productivity to measure income and general welfare improvement both prior and
after the project interventions. The data used was from 2007 to 2009 production years. The
smallholders’ production being predominantly subsistence with limited commercialization,
there was limited record keeping thus the study relied on recall method to gather data of
interest in cases where records were not kept.
1.7 Operational definition of terms
Collective action: The coming together of farmers to pursue a common interest that
improve their welfare.
Group Based Interventions (GBI): Collective action that targets groups like producer
organizations.
Group members: Farmers who are members of the group based initiatives.
Household: An independent farmer and the dependants who have lived with him or her for a
period exceeding six months (Ellis, 1988).
Non group members: Farmers who are not members of any group based initiatives.
Productivity: Is the output per unit of input used (Kg/ha)
Smallholders: Refers to those farmers owning farms that are less than one hectare.
The consumer surplus: The amount that consumers benefit by being able to purchase a
product for a price that is less than they would be willing to pay for.

5
Producer surplus: The amount that producers benefit by selling at a market price that is
higher than they would be willing to sell for.
Economic surplus: Total surplus which is the summation of producer surplus and consumer
surplus.
Economic welfare: The economic gains from engaging in the agricultural activities also
referred to as Social Gains measured in monetary terms.
Social Capital: Informal norm that promotes cooperation between two or more individuals and
can range from a norm of reciprocity between individuals.
Impact evaluation: It is a process of systematic and objective identification of the effects of
an intervention on target groups.
Technology: Is the systematic knowledge and its application to production process.

6
CHAPTER TWO
LITERATURE REVIEW
The chapter discusses smallholder agriculture in Africa and its challenges to achieving the
objectives of increasing productivity and reducing poverty and elaborates the theory
underlying the role of collective action in improving productivity and welfare of
smallholders. It emphasizes adoption of new technologies through the farmer groups,
presents conceptual framework and empirical model for impact assessment and concludes
with a discussion of alternative models to analyze impact assessment and their limitations.
2.1 Smallholder agriculture in Africa
Smallholder agriculture continues to play a key role in contributing largely to the GDPs
and foreign exchange earnings of most African economies. This is evident in the populations
and their distribution as smallholders and importance of food expenditures for people
(Kirsten et al., 2009). The potential contribution of expansion of agricultural activities to
poverty reduction beyond the agricultural sector through spillover effects is also recognized
in recent literature (World Bank, 2008). Arguments in favor of agricultural projects are
therefore valid although the projects yield mixed results.
Success stories of African agriculture have been seen for example in the cultivation of
new cash crops like cocoa and cotton across African countries (Carr, 2001 and Tiffen, 2003),
the development, dissemination and adoption of high yielding crop varieties (Smale and
Jayne, 2003). The most notable success in research include the control of cassava mealbug
and cassava mosaic, development of new rice for Africa (Gabre Madhin and Haggblade,
2003) and the tissue culture bananas. The need to intensify the use of these new technologies
has been of essence in most African countries, including DRC due to the inevitable need to
respond to rapid population growth and also the changes in socio economic systems. Both
institutions and institutional changes are therefore vital in determining smallholder’s capacity
to positively respond to new challenges and opportunities, either in production or marketing
of the yields (UN Millennium Project, 2005b).

7
2.2 Technical and institutional challenges in smallholder agriculture in Africa
Attempts to increase agricultural productivity and welfare of smallholders in Africa have
had challenges partly unique to other parts of the world. For example, fertilizer use per
hectare in Africa from 1980 to 2005 on average was lower at 9kg/ha compared to 70-
150kg/ha in the Caribbean and South East Asian countries (Crawford, Jayne and Kelly, 2005;
Crawford et al., 2003). This could be partly attributed to poor implementation of agricultural
policies. From an institutional perspective, free market has failed in yielding expected returns
due to weak institutional support for market and private sector development, with cultural,
political and legal factors undermining enforcement of property rights and contracts (World
Bank, 2008, 2003 and 2002).
Some African States like DRC are weak as evidenced by lack of strong institutions to
foster exchange and property rights together with lack of capacity to implement policies
efficiently. Besides these weaknesses, some of the States also fail to provide both soft and
hard public goods like communication infrastructure, feeder roads and access to information
that shape the institutional environments in which smallholder farmers need to operate (Pande
and Udry, 2005). The problem is most significant in countries currently experiencing or have
experienced conflicts that lead to displacement of populations and infrastructural
breakdowns.
There are high transaction costs especially in service delivery to smallholders in the
developing countries thereby stifling the supply and access to input and output markets,
management and technical information (Dorward, Kydd and Poulton, 2005ab; Bardhan,
2001). The solutions to these problems in smallholder agriculture point towards nurturing
farmer organizations (collective action) to allow smallholders and their service providers to
realize economies of scale in service access and delivery (Peacock et al., 2004). The
arguments in favor of group approach to solving farmer problems forms the basis of this
study on impact of farmer groups in disseminating technologies on productivity and
economic welfare of smallholders in DRC.
2.3 Nature of Agriculture in South Kivu
According to CIALCA Baseline Survey Report (2007), the agricultural production system
in South Kivu is entirely small scale. Despite the fact that agricultural mechanization forms
the key to yielding high productivity and value addition, this area still relies on traditional
agricultural system where mechanization is almost absent. This signals a glaring lack of
8
modern technology adoption which culminates into low returns for the small scale farmers in
South Kivu. Indeed, the most striking feature is gender bias in agricultural enterprises where
women are more involved in subsistence farming as compared to large scale production
enterprises (Vandamme, 2008). The role of agricultural input use has also been highlighted as
major significant boost to small scale farmers in South Kivu. However, credit accessibility
and utilization to the intended purpose has significantly deteriorated due to what is associated
with moral hazardous behavior of smallholders whereby they use the cash credit for other
unintended purposes (CIALCA, 2007).
In an attempt to increase productivity of crops such as cassava, beans, sweet potatoes,
maize and bananas, the group system for credit access and farm management has been
witnessed in South Kivu (Mastaki, 2006). This approach would upscale technology adoption
since the smallholder farmers would be able to purchase inputs using the cash credit while at
the same time benefit from the group trainings offered to them. The trainings mainly focus on
integrated pest management practices and conservation agriculture which promotes integrated
soil fertility management practices.
Approaches to technology dissemination
There are numerous approaches to technology dissemination. The popularity of these
approaches is purely dependent on easy of adoption and sustainability. The reason is, the
more sustainable an approach is, the more its ability to create wealth across the generations.
Among the most common approaches is the Training and Visit (T&V) approach systems. The
key aspect of this approach is its ability to put in more pressure toward participation of
agricultural stakeholders and giving emphasis on “learners” (farmers) ability to acquire new
skills and monitor the response of each and every technological dimension (Chirwa and
Aggarwal, 2000). In order to incorporate the challenges experienced both at household and
farm levels in driving agricultural productivity; a new group approach has been popular in the
recent past. This system has been lauded to be the most effective in dealing with
heterogeneous farmers who to a larger extent exhibit a complex behavioral response toward
farm management (Chirwa and Aggarwal, 2000)
On the other hand, Action-Research approach has also been noted among the most
responsive and dynamic approaches in agricultural production. The system enables a pure
platform of communication between researchers and the farmers in understanding and
analyzing the strategic agricultural issues in a practical manner. South Kivu has equally

9
embraced the Enhanced Rural Innovation (ERI) approach in its attempt to consolidate the
gains in agriculture across the diverse groups. This approach has been fronted by CIAT
research group; which argues that in order to capture the hidden challenges in rural
development, there is need to place higher priority on research and extension. This approach
augments other approaches by emphasizing adoption of appropriate productivity increasing
technologies by smallholder farmers. Farmers are involved in development and selection of
the best technologies therefore enhancing sustained utilization of the introduced crop
varieties as well as other inputs.
Agricultural Technologies versus farmer groups’ performance
The importance of agricultural technologies cannot be overemphasized since they
contribute to increased productivity and consequently food security. South Kivu, given its
agricultural potential especially in food crops has evolved from wide range of agricultural
technologies. In order to embrace home-based production system, Integrated Pest
Management (IPM) technology has been used tremendously in this region (Lunze, 2000).
Additionally; uses of modern pest control methods have been adopted in order to confront the
recent strain of crop pests and diseases. Murhula (2004) argues that attempts to increase crop
productivity in South Kivu needs to be coupled by progressive technologies. As a result
therefore, new varieties of Cassava, beans and maize among other cereals have been adopted
with an aim of improving productivity. According to CIALCA report (2007), the sole
medium to introduce and sustain these technologies is through farmer groups. It is envisaged
that through this system, farmers’ ability to borrow (groups forming the major collateral) and
management funds are adequate since incidences of default are reduced.
2.4 Theoretical background
2.4.1 NIE and the concept of collective action
Collective Action concept is developed under the NIE theory based on institutional
approach to societal problems where farmers form groups with collective interests and decide
to act to achieve them (Ostron, 1965; Runge, 1984; North, 1990; Clague, 1997).The
collective action through groups can be instituted through coordinated activities across
individual farms like Integrated Pest Management (IPM) and moving from on-farm
technologies to those that operate at larger spatial scales (Ruth et al., 2004). The groups
members can act individually or through an organization.
10
Voluntary collectivization of interests of community members also affects resource
management and agricultural production systems in interaction with other factors like risk,
labor, wealth, information and marketing. Social capital together with collective action
among community members facilitate access to information and allow farmers to participate
in technology development. It also provides access to credit, with social bonds anchored on
trust, providing collateral (Owuor, 2008 and Owuor et al., 2004 and Owuor, 2002).
The reciprocity arrangements, social capital and collective action offer ways to overcome
labor shortage especially for farm activities that require intense labor effort in concentrated
periods and are also interdependent with property rights which reinforces collective action
among group members (Meinzen-Dick et al., 2001).
New Institution economics explains how institutions change to influence individual
performance (North, 1990 and Ostron, 1990) and by seeking to determine the impact of group
interventions in crop enterprises on productivity, this study takes the role of institutional
approach to solving problem of low productivity.
Several collective action based researches have been undertaken in the past. For example:
Nelson et al.,(2004) analyzed collective action as an investment theory in the United States ;
Paxton et al.,(2000) employed collective action in the analysis of success of group loan
repayment behavior in Burkina Faso; Owuor (2008) used it in analyzing effect of groups on
credit access and productivity in Kenya; Meinzen-Dick et al., (2001), in the analysis of the
role of collective action in natural resource management and Shiferaw et al.,(2008) in
evaluating role of collective action forged between institutions and rural market
imperfections in Kenya.
Studies on impacts of collective action in farmer groups in crop enterprises on
productivity and welfare of smallholders in Sub Saharan Africa are limited particularly in the
DRC, the study area.
In view of the above literature, it is evident that despite the fact that collective action is an
integral component of ways to improving agricultural productivity, limited information exist
on its contribution in disseminating technologies within farmer groups to influence
productivity and household welfare.
The basis of this study therefore was on the effect of groups through theories that combine
social capital and collective action to access information, production technologies and
markets to maximize household welfare. Given that farm households are both producers and
consumers, maximization of their welfare implies gaining through both producer and
11
consumer surpluses. Based on this, the theoretical model within which farm households
would maximize both their consumption and production hinge on agricultural household
model as exemplified by Strauss (1986a) within the utility maximization framework.
The maximization of producer and consumer surpluses as an effort to improve economic
welfare over time can be appropriately analyzed using economic surplus model which is
instrumental in evaluating the impact of interventions among households over time.
2.4.2 Theoretical Model
Agricultural production in South Kivu is predominantly subsistence with limited
commercialization. The agricultural households therefore combine two units of
microeconomic analysis- the firm and the household. The household is both a consumer and a
producer thus integrating production and consumption decisions is the appropriate approach
to modeling economic behavior of agricultural households.
There is multiplicity of relationship between production and consumption activities of
households. This study used utility theory within the agricultural household model (Singh,
Squire and Strauss, 1986) to analyze impact of farmer groups in crop enterprises on
productivity and welfare of smallholders. Household commodity consumption and labor
supply decisions are based on the maximum earnings realized from profit maximizing
production. A recursive model with profit and utility maximizing components forms the
framework for analysis of household production and consumption behavior, which becomes
tractable in empirical analyses (Strauss, 1986b).
In any production cycle, the household is assumed to maximize utility over a set of
consumption variables: generated on-farm (Xa); market purchased goods (Xm) and leisure
(Xl).The utility maximized is dependent on the household preferences that is also influenced
by household characteristics(Rhh) like member’s composition, subject to consumption (cash
and time constraints) and production constraints.
The utility function is:
Max U = U (Xa, Xm ,X,Rhh,)…………………………………………………………………….……Equation 1
Subject to:
i) Cash constraint: pmXm = pa (Qa - Xa) - p,(L -F)-p,V + Z …………………….…Equation 2
ii) Time constraint: Xl + F = T ……………………………………………………….…Equation 3
iii) Output constraint: Qa = Q (L,V \ A,K)…………………………………………Equation 4

12
Where T is total stock of household time; L is total labor input; F is household labour
input so that L – F, if positive is hired labour, otherwise off-farm labour; pm and pa are prices
of market purchased goods (Xm) and staple (Xa) respectively; Qa is a vector of staple
production such that Qa - Xa is the vector of marketable surplus; pl is the wage; V is the vector
of variable input ( For example pesticides and fertilizers); c is a vector of variable input’s
market price; Z refers to any nonfarm and non-labor incomes such as remittances and
transfers; A is fixed acreage of land while K is fixed stock of capital.
The underlying assumptions are that: household labour and hired labour are perfectly
substitutable; labour is valued at market wage; producers are price takers and all the prices
(pa, pv, pl, pm) are not affected by actions of the household. These are the assumptions of a
perfect (ideal) market (Varian, 2006).
Equation 2 implies that the household requires a cash of pmXm to buy what it does not
produce and the cash is obtained from the marketable surplus, pa (Qa - Xa). The income is
used to pay for the market purchased goods consumed (pmXm), hired labor (pvV) and the
material inputs pl (L -F). Any deficits can be met by the remittances and transfers (Z).
The time constraint in the third equation indicates the total time allocated among farm
production, off-farm employment and leisure while equation 4 (production technology)
indicates relationship between output and input. Agricultural innovations enter the production
constrained household function indirectly through new technologies such as new input saving
and high yielding crop varieties.
By substituting production constraint into income constraint for Qa and time constraint
into cash constraint for F, the consumption and production constraints collapse into a single
constraint in equation 5.
pmXm + paXa + plXl = ptT + π +Z ………………………………………….…..….Equation 5
Where π (farm profits) = pa Qa(L,V \ A,K) - plL - pvV .The right hand side of equation 5
refers to the value of full income associated with profit maximizing behavior of the
household (Becker, 1965) which is denotable as ‘y’ to yield equation 6.
y = pmXm + paXa + plXl ……………………………………………………………………………….………Equation 6
The farm household maximizes net farm income conditional on expenditure and
technology constraints and then allocates the income (remittances and transfers included)
among the consumption commodities. This is possible with the assumption of a perfect
market to enable separability of farm production and consumption decisions. Input and output

13
markets are however imperfect and producers (households) are not canonically price takers
thus the right hand side of equation 6 can be reduced into output influencing factors like farm
characteristics (Rf), household characteristics (Rhh), market characteristics (Rmk) and
technology characteristics(Rt) outlined in equation 7.
S = f (Rhh, Rt, Rf,Rmk) ………………………………………………….…....…Equation 7
New technologies influence output of the household and by extension productivity. The
effects of new technologies disseminated through farmer groups on productivity and welfare
is best evaluated via the economic surplus model. To capture factors that influenced
economic gains, the model was estimated by Ordinary Least Squares routine that has been
used in measuring economic gains in several impact studies.
2.4.3 Conceptual framework
In figure 1, farmer characteristics include level of education, age and gender that influence
the farm management practices.
Figure 1: Conceptual Framework for the relationship between Intervention Linkages
and productivity in crop enterprises.
Source: Own conceptualization, 2010.
Changes in economic gains
Farmer support programs
-Fertilizer and seed distribution
-Number of Extension services
-Production costs(US$)
-Market access (Km)
-Crop prices(US$)
Production factors
-Labour availability
-crop chemicals
-Soil Fertility
-Technologies
-Other Inputs
purchased
Institutional support factors
-Farmer groups
-Training and extension
-Financial services
-infrastructure
Farmer characteristics
and management
practices
Increased income from production

14
It includes the decisions to use new technologies, purchase fertilizers, hire labour or use crop
chemicals which influence productivity of crop enterprises. The management practices are
also influenced by institutional factors like participation in farmer organizations where
farmers are trained on the use of new technologies, crop varieties, ways to access financial
services, input and output markets. The farmer support programmes in extension and seed
distribution are carried out by research institutions and development partners particularly in
DRC through the farmer groups. This influences production cost, market access and yield
prices which in turn influences economic gains by smallholder farmers thereby increasing
their incomes. The money income is used to improve the welfare of the farming households
through the production and consumption activities.
2.3.4 The Empirical model
The main thrust of this impact study was to compare a situation before the intervention
against the alternative situation after the intervention by using the concepts of supply,
demand and equilibrium in transforming agronomic data on economic values. Supply
represents producers’ production values while demand represents consumers’ consumption
values whose interactions result in equilibrium quantity and price.
Production levels are dependent on a range and level of inputs used such as: land, labor,
seeds, fertilizers and chemicals, each having a cost to the producer. The relationship between
production cost and yield levels is depicted in equation 8 and that between purchase price and
quantity consumed is illustrated in equation 9.
……………………………………………………………Equation 8
……………………………………………………………..Equation 9
Where (bs) and (bd) are slopes of supply and demand curves respectively; as and ad are
intercepts of the curves; ps is the price of quantity supplied and pd is the price of quantity
demanded; Qs is the quantity supplied while Qd, quantity demanded.

15
Figure 2:Equilibrium and Economic surplus
The consumer surplus shows up above the price and below the demand curve, since the
consumer is paying less for the item than the maximum that they would pay. The producer
surplus shows up below the price and above the supply curve, since that is the minimum that
a producer can produce that quantity with.
The impact of innovation (new technology) on economic surplus
Any change in economic surplus is a measure of social gains derived from new innovation.
Figure 3 below shows the area representing social gain in an ex- post impact assessment.
Figure 3: Effect of technology on supply

16
Area R represents the social gain due to reduction in production costs at the observed level
of production (Q1) and area T represents a correction for the change in quantity caused by the
new technology (adjustment for change in quantity associated with price change). The height
of R is measured in terms of money per unit of output since effects of group interventions are
measured in terms of productivity, for example, increased crop yield per ha. Figure 4 shows a
combination of data on input changes (vertical shift) and output changes (horizontal shift) to
obtain a new shift.
The distance K ( see figure 4) represented cost reduction in production (net gain) – the
height of area R in figure 3.A new technology raises output for a given set of inputs by
quantity J (in kg), a product of yield gain per ha and are planted with the new technology( in
ha). However the new technology requires investment in new inputs like hybrid seeds and
chemicals therefore I represented adoption costs ($/kg) per hectare divided by average yield
(in Kg/ha).
Figure 4:Diagrammatic representations of I, J and K parameters
Since parameters J, I, K and ∆Q are not directly observable, they were estimated using the
formulas outlined in the subsequent equations.
..........………………………………………...…………..…..…...Equation 10
In equation 10, ∆Y(kg/ha) was the yield increases resulting from adoption of the new
technology, t was the proportion of total area under new technology (adoption rate) and A
17
was the total area in crop in hectares and J was measured in proportional terms (j) as the
increase in quantity produced as a share of total quantity.
⁄ …………………………………………..…………………………Equation 11
⁄ ................................................................Equation 12
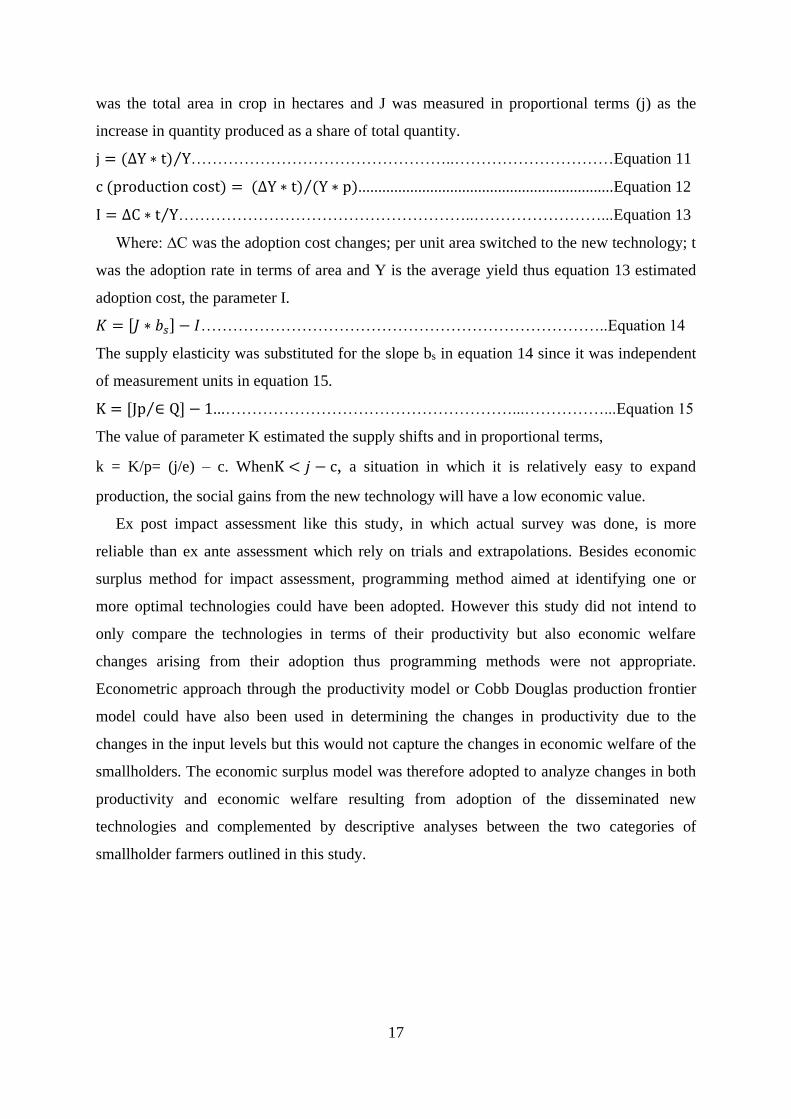
⁄ ………………………………………………..……………………...Equation 13
Where: ∆C was the adoption cost changes; per unit area switched to the new technology; t
was the adoption rate in terms of area and Y is the average yield thus equation 13 estimated
adoption cost, the parameter I.
[ ] …………………………………………………………………..Equation 14
The supply elasticity was substituted for the slope bs in equation 14 since it was independent
of measurement units in equation 15.
[ ] ⁄ ...………………………………………………...……………...Equation 15
The value of parameter K estimated the supply shifts and in proportional terms,
k = K/p= (j/e) – c. When , a situation in which it is relatively easy to expand
production, the social gains from the new technology will have a low economic value.
Ex post impact assessment like this study, in which actual survey was done, is more
reliable than ex ante assessment which rely on trials and extrapolations. Besides economic
surplus method for impact assessment, programming method aimed at identifying one or
more optimal technologies could have been adopted. However this study did not intend to
only compare the technologies in terms of their productivity but also economic welfare
changes arising from their adoption thus programming methods were not appropriate.
Econometric approach through the productivity model or Cobb Douglas production frontier
model could have also been used in determining the changes in productivity due to the
changes in the input levels but this would not capture the changes in economic welfare of the
smallholders. The economic surplus model was therefore adopted to analyze changes in both
productivity and economic welfare resulting from adoption of the disseminated new
technologies and complemented by descriptive analyses between the two categories of
smallholder farmers outlined in this study.

18
CHAPTER THREE
METHODOLOGY
3.1 Study area
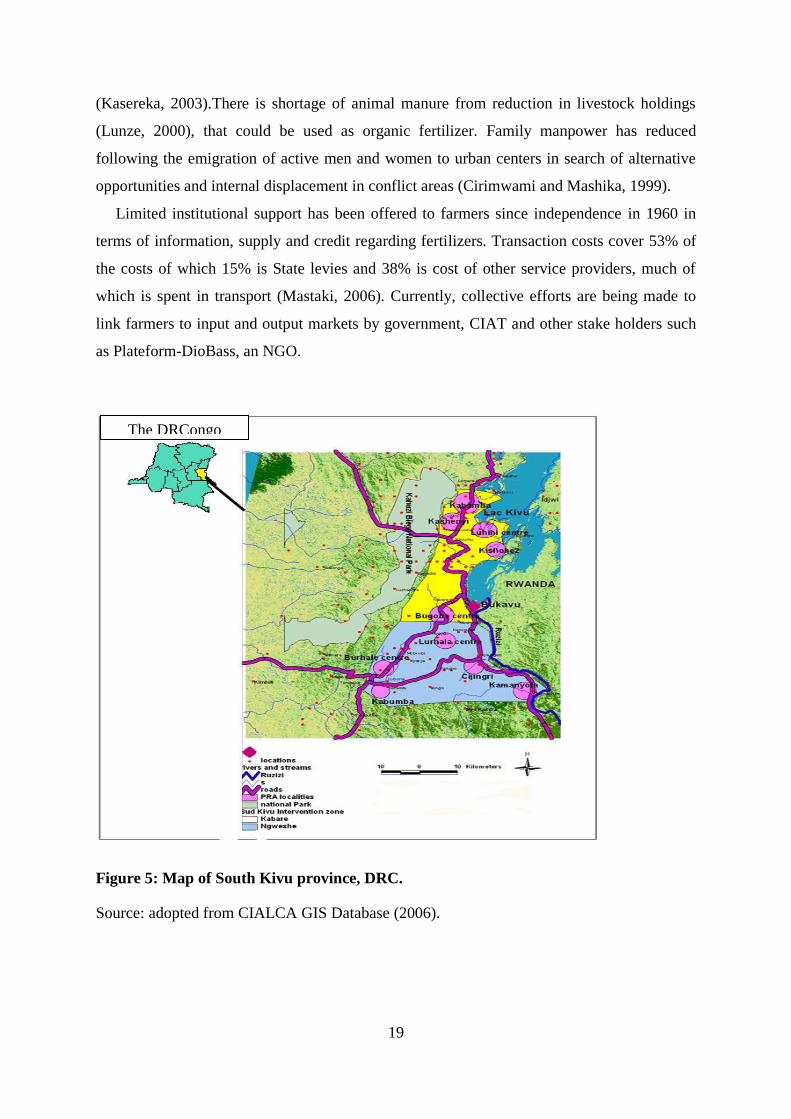
South Kivu (SK) Province borders the provinces of Nord-Kivu to the north, Maniema to
the west, and Katanga to the south. To the east it borders the countries of Rwanda, Burundi,
and Tanzania. In official DRC categorization, the Province has one city, Bukavu with
territories like Baraka, Fizi, Kabare, Katana, Kaziba, Lemera, Mwenga, Nundu, Nyangezi,
Shabunda, Uvira and Walungu. SK Province has experienced civil strife that displaced the
population, the immediate one ended in 2003 (the second Congo war).The study covered
three territories namely Kabare, Walungu (Ngweshe) and Mwenga and their respective sub
territories (referred to as groupments) as indicated in table 1.
Table 1 Tabular representation of territories and groupments under study in SK
Province.
TERRITORIES GROUPMENTS
Kabare Bugorhe
Mudaka
Mwenga Mushinga
Burhinyi
Ngweshe Nyangezi
Kamanyola
The highlands of the region are densely populated area with up to 300 persons per square
kilometer in some rural areas (Mühlenberg et al., 1995). The population comprises 83% of
farmers with mean household acreage of 0.8 hectares (ha), 58% of them are below the mean
and a paltry 10% having up to 1.5ha (Murhula, 2004). Annual decline in productivity has
been estimated at 0.98% while low annual increment in agricultural production is estimated at
2% compared to the population growth rate of 3.3% (Vandamme, 2008 and Mastaki, 2006)
Most farmers have limited access to improved crop varieties of major crops like maize,
cassava, sweet potatoes, bananas and common beans. The decline in productivity has also
been partly attributed to reduction in soil fertility and high levels of soil erosion such that an
estimate of 80 kg/ha of nitrogen, Phosphorus and Potassium nutrients are lost annually
19
(Kasereka, 2003).There is shortage of animal manure from reduction in livestock holdings
(Lunze, 2000), that could be used as organic fertilizer. Family manpower has reduced
following the emigration of active men and women to urban centers in search of alternative
opportunities and internal displacement in conflict areas (Cirimwami and Mashika, 1999).
Limited institutional support has been offered to farmers since independence in 1960 in
terms of information, supply and credit regarding fertilizers. Transaction costs cover 53% of
the costs of which 15% is State levies and 38% is cost of other service providers, much of
which is spent in transport (Mastaki, 2006). Currently, collective efforts are being made to
link farmers to input and output markets by government, CIAT and other stake holders such
as Plateform-DioBass, an NGO.
Figure 5: Map of South Kivu province, DRC.
Source: adopted from CIALCA GIS Database (2006).
The DRCongo

20
3.2 Sampling design and techniques
All the smallholders in South Kivu territories constituted the sampling frame. Multi-stage
sampling technique was used to arrive at a sample of 360 smallholders. The territories were
purposively selected and the six groupments formed the strata. The chance of being a
member or non member of a group was therefore equal in all the groupments. The
groupments were used as sampling points for the farmer groups, with an average of 10 groups
per groupment, making a total of 60 groups.
In determining sample size, proportionate to size sampling methodology was used as
developed by Groebner and Shanon (2005) and Poate and Daplyn (1995):
n = z2pq/ e 2
Where:
n = sample size
P = proportion of the population of interest
q = 1-P (the weighting variable)
z = standard variate at confidence level ( = 0.05)
e = margin of error.
The area under the normal curve corresponding to 95% confidence interval is 1.96 (z value in
the statistical tables). Using a p value of 0.5 and acceptable error of 8.95%, a sample size of
120 smallholders was obtained. This was replicated in each territory.
Table 2: Sampling procedure for group and non-group members
Stage List used Sampling method Sample size
One Regions Purposive sampling Three
Two Farmer groups Stratified proportionate sampling Sixty
Three Households Random sampling within groups Ten
3.3 Data collection method
This study used primary data that was collected using structured interview schedules.
21
3.4 Model Specification and Statistical Analysis
3.4.1 Comparative statistics
Comparative statistics was used in the mean comparisons of input use, value of
production (productivity) and economic gains between group members and non group
members in 2007 and 2009 (objective 1) and to determine the changes in institutional
linkages resulting from the group interventions (objective 2).
3.4.2 Economic Surplus model
Economic surplus model was used estimate economic gains (objective 4) from crop
production as developed by Masters et al., (1996). This is a proxy measure of economic
welfare changes over time resulting from the group interventions. Equation 16 below was the
formula for estimating economic gains:
….…………………………………………Equation 16
Where Q is the observed quantity produced; K being the vertical shift in supply and
∆Q (Q1- Qo ) is change in quantity due to the new innovation(expressed in equation 17).
[ ⁄ ] ………………………………..…………...Equation 17
Where ∆Q is the equilibrium; e is the demand elasticity; p is the produce price and ϵ is the
supply elasticity. The values chosen for the elasticity has less influence on the results of the
analysis than the other parameters therefore e and ϵ are assumed to be zero (0) and one (1)
respectively. This results in the canceling out of the ∆Q term in the formula for Social Gains
thereby reducing to equation 18.
……………………………………………..……………..……..….Equation 18
Economic gains were the measure of economic welfare of the smallholders.
3.4.3 Ordinary Least Squares regression
In determination of the factors that influenced the economic gains, Ordinary Least Squares
regression was used whereby the explaining variable was economic gain while the
explanatory variables were the changes in the institutional factors and production factors.
The variables selected explained the changes in the dependent variable (economic gain) thus used
in the censored OLS regression that was specified as:
+ ……...........................................Equation 19
22
Where:
Pchange= changes in production resulting from the intervention
GMchange-change in the number of group meetings attended
Creditchange=change in farm credit offered in cash to the smallholders
TLRchange= change in frequency of listening to radio farmer programmes
Extctchange = changes in number of extension contacts in equation 12
ε = is the error term which is independently and normally distributed with zero mean and constant
variance (Greene, 2003).
REMchange= change in amounts of remittances
OFFINchange= change in off-farm income
OFFITchange= change in time spent in off-farm activities
Pricechange= change in produce prices
GRPmem= change in group membership

23
CHAPTER FOUR
RESULTS AND DISCUSSIONS
INTRODUCTION
This chapter presents a discussion of results on: the general household profile; the
differences in factor use (production and institutional support factors) between the group and
non-group farmers before and after the interventions; the value of production across the
territories; difference in economic gains between the group and non-group farmers and finally
the determinants of the economic gains. Before the interventions (2007), only inorganic
fertilizer use (planting and top dressing fertilizers) was significantly different between group
and non-group farmers. However, after the intervention the difference persisted although with
an increase in use of fertilizers among group farmers and a decrease among independent
farmers. There was significant difference in economic gains and value of production between
the two groups of farmers, with the group farmers having a greater magnitude of the latter
variables than independent farmers. The changes in the use of production factors (credit and
off-farm income) and institutional factor (radio farmer programmes and group membership)
significantly influenced economic gains by smallholder farmers of South Kivu province.
General Characteristics of Households in the Regions
The overall mean age of the household head was 45 years. The mean number of schooling
years of the household heads was 5 years implying that most household heads did not go
beyond primary school level. The average number of children per household was 6 (see
appendix 3) with the lowest number observed in Mudaka (5). Of the sampled household
heads, women and men constituted 47 % and 53 % respectively (see appendix 4). Higher
proportions of women were noted in Burhinyi (73%) and Mushinga while lower proportions
of women were observed in Bugorhe at 27%.
Farm income constituted a major source of income for farm households and was
supplemented by off farm incomes. The mean farm value of production ranged from USD
182 in Mudaka to 1132 in Nyangezi in 2007 (see appendix 5). While in 2009 it ranged from
USD 205 for Bugorhe to USD 1092 for Kamanyola. The variation in value of production was
greater between the six regions assessed with the two regions in the northern axis (Bugorhe
and Mudaka) reporting relatively lower values. The regions in the south west (Nyangezi and
Kamanyola reported higher production values. The variation in production valuesin 2009 was
lower than in 2007. However, the mean value of production was lower in 2009 relative to
24
2007. Other than Mudaka and Kamanyola, all regions recorded decreased production values.
The harvest for 2009 long rain season was expected the following year, which explained the
consistently lower values of production.
The average expenditure on agriculture in 2007 ranged between USD 21 to USD 67(see
Appendix 6). The mean expenditure in 2009 was USD 59, an amount higher than that
expended in 2007. With regard to non-agricultural expenditure, expenditure in 2007 was
relatively higher than in 2009. Wealth status of households was computed by estimating the
monetary value of various assets owned by the households in 2007 and in 2009. During the
2007 period, the mean wealth level of the households was USD 209 (appendix 7). In the
regions, the averages ranged from a mean low of USD 100 in Nyangezi to a mean high of
USD 308 in Mushinga. In the year 2009, the mean wealth level was USD 247, an increase of
about 20%. The lowest mean wealth level was realized in Mudaka and the highest in
Nyangezi. Mushinga and Burhinyi show declines in wealth levels while the rest of the
regions show increases in wealth levels
Fertilizers included planting fertilizer and top dress fertilizer that farm households used in
their production activities. Their costs were computed for each crop enterprise that the
household applied the fertilizer per year. Organic fertilizers were also evaluated for their
usage by the households. Organic fertilizers include farm yard manure and compost manure.
The table below presents the findings on fertilizer use in the regions and over the two year
period (see appendix 8). In the earlier period of 2007, the mean quantity of inorganic
fertilizer used by the households was 115 kg. The amounts varied from USD 6 in Kamanyola
to 196 kg in Mushinga in 2007 (appendix 8). For the current period, the mean value of
fertilizer used was 122 kg, ranging from USD 10 in Kamanyola to 183 kg in Nyangezi. This
shows an increase in the use of fertilizer used between the two periods except for Mudaka
and Mushinga which showed declines.
With regard to organic manure, the average quantities of the manure used in 2007 were
1400 kg. Once more Kamayola had the lowest use of the organic manure whereas Bugorhe
had the highest usage at about 4.6 tons. In 2009, there was an increase in the organic manure
used in the regions to about 1.9 tons. Higher usage was reported in Bugorhe and Mudaka.
Market access was captured by distance and time to various facilities such as major roads,
markets or urban centers. With regard to input markets, the mean distance to the nearest
market for inputs was 9.5 km (see appendix 9). This ranged from 1.2 km for Bugorhe to a
high of 15km for Nyangezi.. The average time to reach the input markets ranged from a low
of 17 minutes in Mushinga to a high of 48 minutes.
25
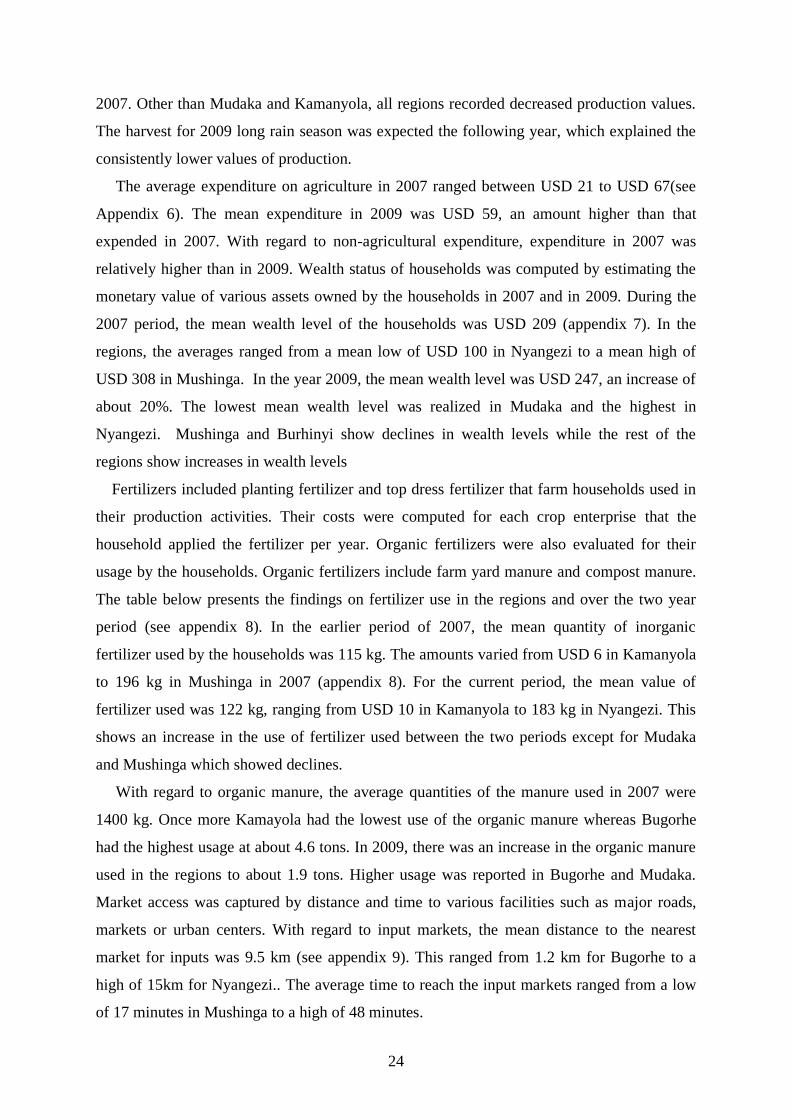
4.1 Factor use among group and non-group farmers.
The 2007 results in Table 3 showed that there was significant difference in factors use
between group and non-group members. The first five factors were production factors while
the rest were institutional factors. Significant difference in factors use was noted in the use of
fertilizers where the p-value was 0.001 and t-value was -2.719. The results indicated that non-
group members used more fertilizer at 112kg/ha compared to the group members used
19kg/ha on average. The non-group members similarly used more top dressing fertilizer than
group members at 109kg/ha compared to the group members who used a paltry 3kg/ha (at
0.001 p-value and t-value of-3.945). The group members however used more organic manure
at 1847kg/ha compared to 910kg/ha by non group members. This could be attributed to the
availability and affordability of the organic manure compared to the inorganic fertilizer by
the poor farmers who dominated the groups.
The non-group members were observed to have had more extension contacts, an
institutional factor (five times a month) than group members who had three contacts per
month on average. The non group farmers attended farmer meetings only twice in a month
and this could be linked to their sizable resource endowment that they afforded new
technologies thus did not value the meetings. There were however no significant differences
in the use of other factors such as new varieties, credit, group meetings among both group
and non group members.
Table 3.Mean comparisons for 2007 between group and non-groups on factor use
Variable Group Nongroup T P
Production factors
total planting fertilizer earlier period 19.1601 111.7379 -2.719 0.001
total top dress fertilizer earlier 2.4913 109.3409 -3.945 0.001
organic manure earlier period 1847.251 909.4731 2.203 0.001
number of new varieties in 2007 1.6667 1.7308 -0.067 0.947
technology received in 2007 1.713 2.1441 -0.37 0.712
Institutional support factors
number of times attended training 2007 2.77 5.37 -2.269 0.024
number of extension contacts in 2007 2.3956 5.8377 -2.246 0.026
number of times listened to agric programs on radio
2007 5.2303 6.5349 -0.495 0.621
number of farmer group meetings attended in 2007 7.9322 5.5948 1.183 0.238
borrowed funds in 2007 0.3904 4.1681 -1.333 0.184
Value of production 716.11 752.84 -0.100 0.241
26
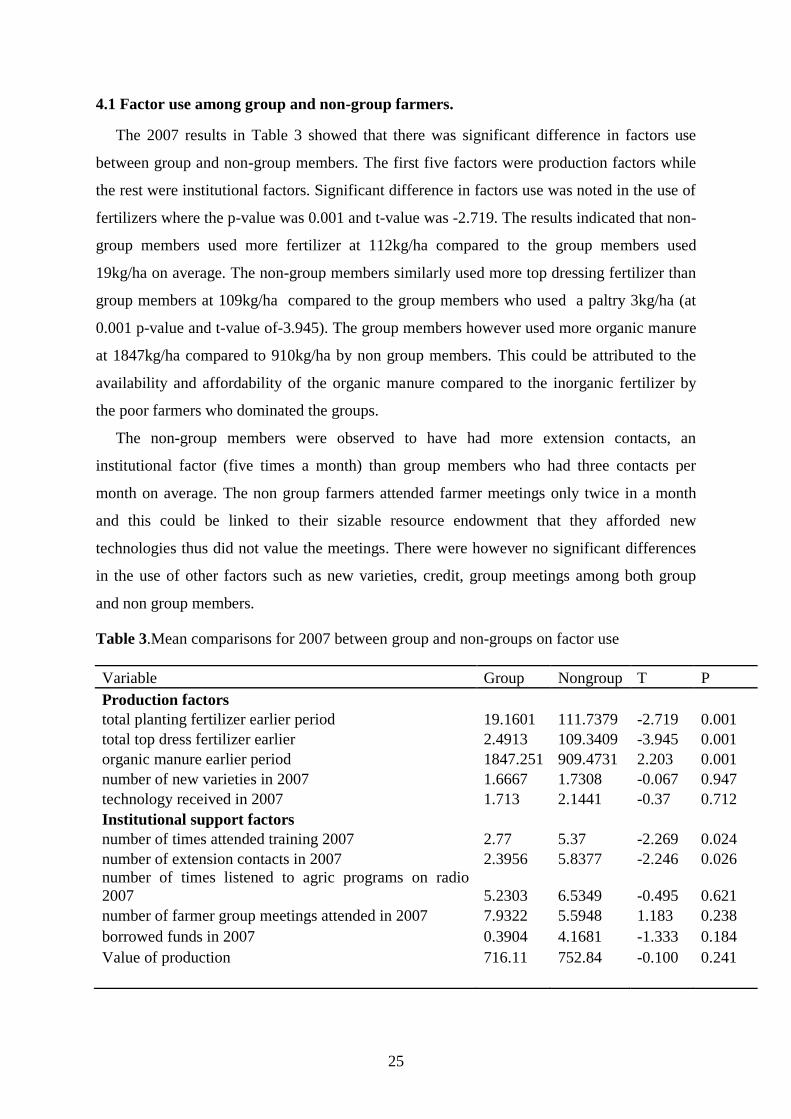
The 2009 results in Table 4 indicated that there were differences between group and non
group farmers in terms of the use of fertilizer, number of new technologies adopted and
number of farmer group meetings attended (p=0.001).
Table 4.Mean comparisons for 2009 between group and non-group farmers on factors
use
The non group members on average used more planting fertilizer at 141kg/ha compared to
41kg/ha used by group members. Similarly, non-group members significantly used more top-
dressing fertilizer at 107kg/ha compared to 10kg/ha by group members (p=0.001). Organic
manure was however used more by group member at18064kg/ha compared to 797kg/ha used
by non-group members on average, a situation also replicated in the earlier period (2007).
This was the case because interventions in the project areas encouraged farmers especially
those in the farmer groups to use organic manure for sustainable soil fertility management.
Besides organic manure, other soil fertility management practices included terracing to
mitigate soil erosion and mixed cropping was encouraged by the intervention through farmer
groups. The significant difference in the use of organic fertilizer and subsequent increase
from the earlier period (2007) is validated by the fact that the group members significantly
attended more meetings compared to non group farmers and possibly learnt about these
practices and embraced them. This relates to the issue of affordability and access to the
inorganic fertilizers. The resource poor farmers could possibly not afford the inorganic
Variable Group nongroup t P
Production factors total planting fertilizer current period 40.8514 141.3683 -1.875 0.063
top dress fertilizer current period 9.9317 107.2436 -3.58 0.001
Organic manure current period 18063.95 797.0665 1.041 0.001
number of new varieties in 2009 9.1311 4.7069 -1.112 0.271
technology received in 2009 4.7952 1.1333 1.715 0.088
Institutional support factors
number of times attended training in 2009 3.9265 3.9005 0.02 0.984
number of extension contacts in 2009 5.1346 2.7029 1.466 0.144
number of times listened to agric programs on radio in
2009 7.5913 5.3377 0.778 0.437
number of farmer group meetings attended in 2009 8.0995 2.6532 5.463 0.001
borrowed funds in 2009 29.0986 28.4679 0.026 0.98
Value of production 798.28 272.14 3.502 0.001
Economic gains 50.20 14.02 1.710 0.001
27
fertilizers (top dressing and planting fertilizers) thus used the organic manure available in
their farm yards.
The group members adopted more technologies (five) than non-group members who
adopted one technology on average. The group members could have had more knowledge on
the existing new technologies through the group meetings they attended to discuss their
experiences from implementing the technologies thereby increasing the adoption level among
group farmers compared to the independent farmers.
The differences in the use of production and institutional factors influenced in the
significant difference in the value of production between the group (US$792) and non group
farmers (272) at p=0.001 and also the economic gains by the smallholder farmers. The
economic gains were established to be greater among the group farmers ($50) than the
independent farmers ($14) This could have resulted from the increase in the use of fertilizers,
organic manure, new varieties and technologies among group farmers compared to the non-
group farmers who heavily relied on inorganic fertilizers thereby increasing the value of
production among group farmers. These results are similar to the study by Ochieng (2010)
that observed that access to extension services, membership to farmer groups and off farm
income influenced the adoption of full package of chicken management interventions to
achieve higher flock productivity.
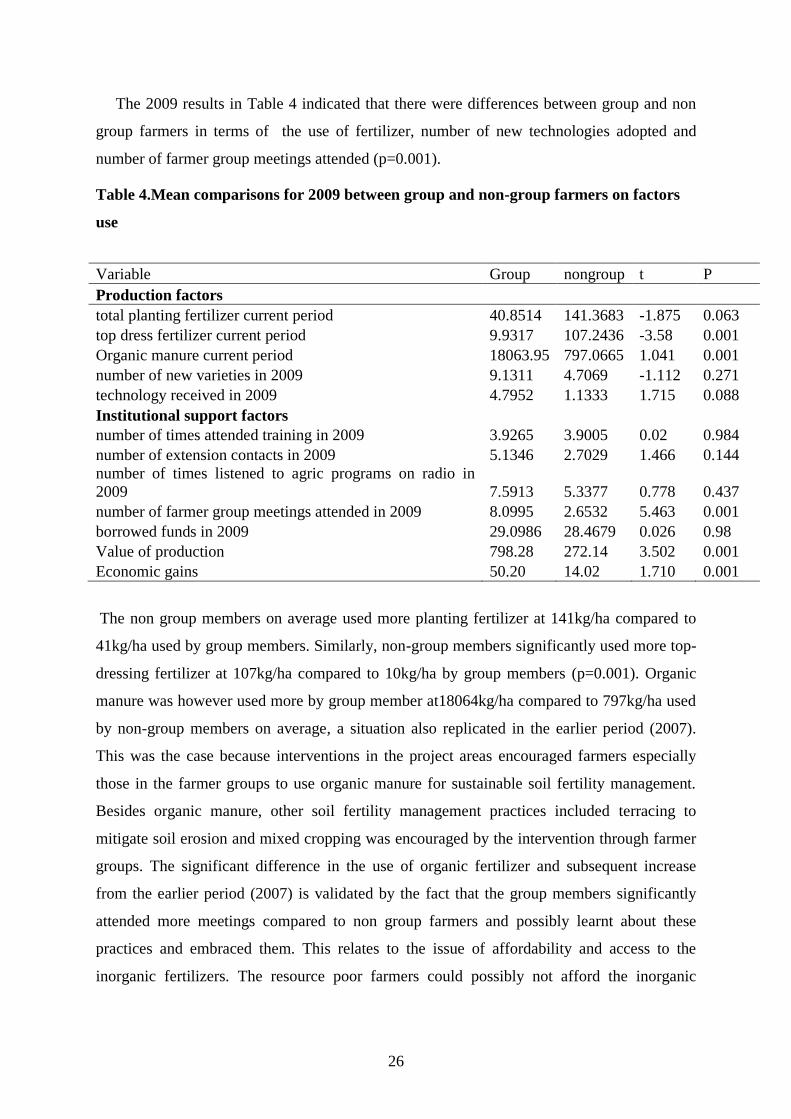
4.2 Value of production across Territories
The results in table 5 reveal that there was increase in the value of production (output in
monetary terms) used as a measure of productivity across the three territories. Ngweshe
experienced significantly greater productivity increase (45%) compared to Kabare (15%) and
Mwenga (11%). From the study, it was also observed that there was active group
participation in Ngweshe especially by women compared to the other two territories and this
could have contributed to the variation in productivity.
Table 5 Mean of value of production in Kabare, Ngweshe and Mwenga
Territory Mean(2007) Mean (2009) % change
Kabare 257.2106 296.1476 15%
Ngweshe 751.0494 1089.2697 45%
Mwenga 570.3954 632.8186 11%
Total 550.1583 730.6082 33%

28
4.3 Comparison of factor use within group and non group farmers in 2007 and 2009
production years.
Results in table 6 show that on average, the group members increased their borrowings by
US$ 29 compared to US$ 24 by non-group members. From figures 6 and 7, majority of
borrowers obtained credit from commercial banks (46.49%) and Cooperatives (41.34%)
before the intervention. This situation was however reversed in 2009 where the farmers
reduced their borrowings from commercial banks (to 20.89%) and began to source credit
from other sources that included friends (53.93%), neighbours (7.49%), money lenders
(4.79%) and NGOs. This could have been occasioned by the stringent lending regulations
imposed by the commercial banks and cooperatives and the risk of default faced by farmers.
In the case of lending by MFIs, Cooperatives and commercial banks, the result could be
because these financial institutions preferred group lending to individual lending as a way of
overcoming moral hazardous behavior of default in repayment among borrowers. This also
aimed at minimizing fungibility of funds meant for agricultural investment to improve
productivity. The group members could also have been more informed about availability of
funds through the farmer training programs as well as the monthly group meetings and the
agricultural programs on radio.
The number of new varieties adopted increased among both group and non-group
members in 2009 (means of 9 and 5 respectively) compared to 2 in 2007. The number of new
technologies adopted and extension contacts however only increased among group members
and decreased among non-group members. This could be because the latter group reduced
their frequency of extension contacts, trainings on agricultural practices and also the times
listened to agricultural programs on radio in 2009 compared to 2007. The group members
also gain confidence in adopting technologies demonstrated on their experimental plots.

29
Table 6. Within group and within nongroup differences in factor use in before and after
intervention
Within Group Within Non-group
Variable Change Direction of
change
change Direction of
change
Production factors
Planting fertilizer 22 +ve 30 +ve
Top dressing fertilizer 8 +ve -2.1 -ve
Organic manure 909.47 +ve 112.4 +ve
New varieties 7 +ve 0.3 +ve
Technologies 3 +ve 1 +ve
Institutional support factors
Farmer training 1 +ve 1.5 +ve
Number of extension contacts 3 +ve 3.14 +ve
Number of times listened to
Radio programs per month
3 +ve 1.2 +ve
Group meetings attended per
month
0.2 +ve 2.95 +ve
Credit 28.71 +ve 24.3 +ve
4.4 Socio Economic Factors Hypothesized to Influence Economic Gains
This section presents the priori assumptions and results on changes in both production and
institutional factor changes that influence economic gain. It seeks to partially address the 3rd
objective which was to determine economic gain by discussing the factors that influenced the
gains, with an aim of directing policy intervention to increase productivity among
smallholder farmers in Congo, DRC. Finally the section ends with interpretation and
discussion of the Ordinary Least Squares estimates of the hypothesized factors.
Priori assumptions of factors that influence economic gains.
The study hypothesized that changes in production, number of group meetings attended,
amount of credit, frequency of listening to radio programmes, number of extension contacts,
number of farmer trainings attended, and amount of remittances, off farm income, prices and
time spent in off farm activities were most influential in determining economic gains among
the smallholder farmers.

30
The increase in production and by extension, productivity could increase the value of
production in monetary terms thereby increasing the gains. The increase in the number of
group meetings attended, extension contacts, farmer trainings, group membership and
frequency of listening to radio programmes would increase access to information necessary
for the farmers to access input and output markets as well as improving the agricultural
practices. This could promote sound crop husbandry thus increasing productivity and
consequently increase the economic gains (social gains). The remittances and off farm
incomes realized by the farming households were hypothesized to augment their net income
that could be invested in agricultural and non agricultural activities therefore resulting in
economic gains. Credit from commercial banks, cooperatives, MFIs, NGOs, input stores,
SHGs, money lenders, friends and neighbours was also assumed to influence positively the
yields through input purchases and investment in off-farm enterprises to generate incomes
thus increasing economic gains.
4.5 Factors that influenced economic gains of smallholder farmers in South Kivu, DRC.
The economic surplus model was used in the analysis of economic gain that was
hypothesized to be positively influenced by increase in productivity (value of production)
after the intervention. This involved the computation of total farm and nonfarm income, the
summation then subsequent difference of which constituted economic gains. Economic gain
(dependent variable) was hypothesized to be influenced by the changes in explanatory
variables like: yield, price, extension contacts, remittances, number of group meetings
attended, and number of times listened to agricultural radio programs, group membership and
time spent in off farm activities in censored Ordinary Least Squares regression (OLS).
The model indicated a Durbin Watson value of 2.367 and f-value of 5.367 which was
significant at 0.001%. The Durbin Wu test for serial autocorrelation validated the model as fit
since the calculated value of 2.367>2. The correlation coefficients were observed to have
values less than 0.8 thereby confirming that there was no multicollinearity between the
explanatory variables. The R2 value of 55% meant that 55% changes in economic gain was
explained by the changes in the explanatory variables at p<0.05.
Credit, Off -farm income and Economic Gains
Credit and economic gains
From the results in table7, credit change was observed to be counterintuitive (p<0.05). This
however could have resulted from high fungibility of the credit borrowed by the farmers for
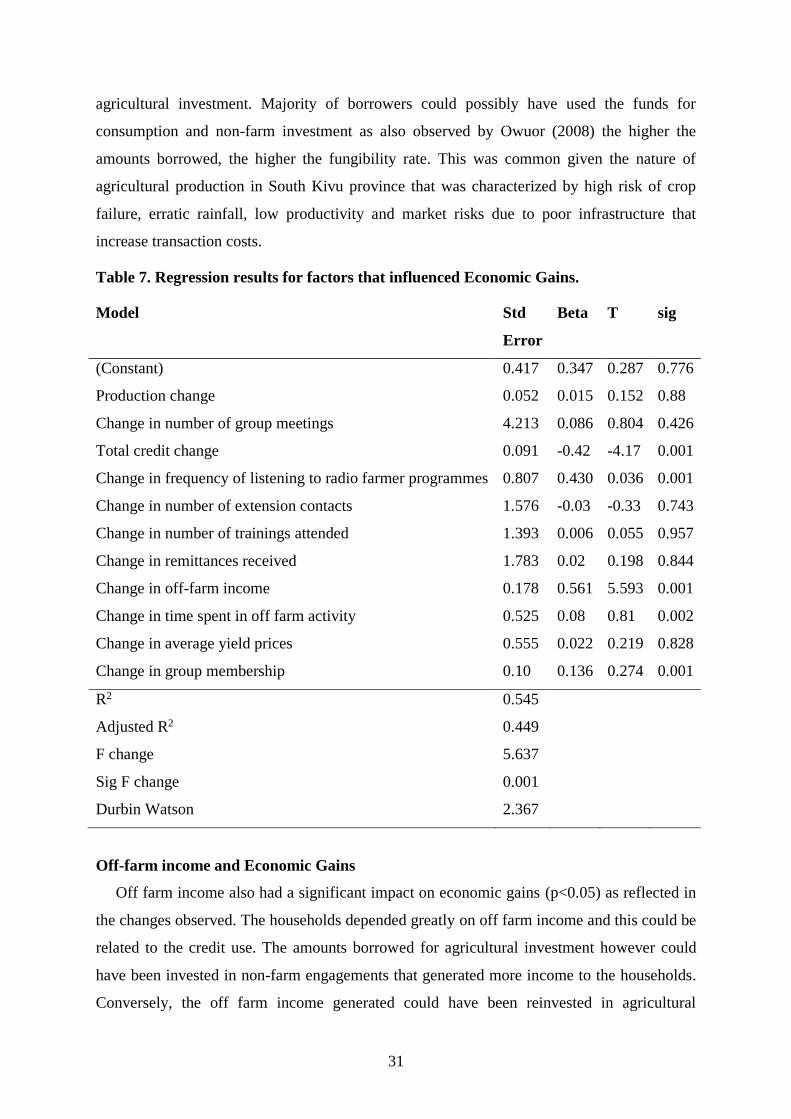
31
agricultural investment. Majority of borrowers could possibly have used the funds for
consumption and non-farm investment as also observed by Owuor (2008) the higher the
amounts borrowed, the higher the fungibility rate. This was common given the nature of
agricultural production in South Kivu province that was characterized by high risk of crop
failure, erratic rainfall, low productivity and market risks due to poor infrastructure that
increase transaction costs.
Table 7. Regression results for factors that influenced Economic Gains.
Model Std
Error
Beta T sig
(Constant) 0.417 0.347 0.287 0.776
Production change 0.052 0.015 0.152 0.88
Change in number of group meetings 4.213 0.086 0.804 0.426
Total credit change 0.091 -0.42 -4.17 0.001
Change in frequency of listening to radio farmer programmes 0.807 0.430 0.036 0.001
Change in number of extension contacts 1.576 -0.03 -0.33 0.743
Change in number of trainings attended 1.393 0.006 0.055 0.957
Change in remittances received 1.783 0.02 0.198 0.844
Change in off-farm income 0.178 0.561 5.593 0.001
Change in time spent in off farm activity 0.525 0.08 0.81 0.002
Change in average yield prices 0.555 0.022 0.219 0.828
Change in group membership 0.10 0.136 0.274 0.001
R2 0.545
Adjusted R2 0.449
F change 5.637
Sig F change 0.001
Durbin Watson 2.367
Off-farm income and Economic Gains
Off farm income also had a significant impact on economic gains (p<0.05) as reflected in
the changes observed. The households depended greatly on off farm income and this could be
related to the credit use. The amounts borrowed for agricultural investment however could
have been invested in non-farm engagements that generated more income to the households.
Conversely, the off farm income generated could have been reinvested in agricultural
32
enterprises through purchase of inputs to increase productivity and consequently economic
gains among the smallholder farmers.
Farmer Radio Programmes and Economic Gains
From the results in table 7, it was observed that the changes in the number of times
farmers listened to the radio programmes had a positive and significant influence on
economic gains (p=0.001 and t= -4.152). There are various common media used to transmit
agricultural information to farmers in South Kivu Province. The media mainly comprise
leaflets, magazines, pamphlets, newspapers, radio and television but radio was the main
channel of communication because of its affordability, timeliness and capability of
disseminating information to farmers within a wide geographical area. Given the poor state of
infrastructure in Congo for example the road network and electricity, radio had the potential
of being used as the medium of communication since topography, time, road network and
distance could not hinder dissemination of information. Besides, Nwuzor (2000) also
observed that radio programmes had an advantage of being done anywhere through the use of
compact disks and tapes using local languages therefore illiteracy is not an impediment.
The radio farmer programmes enhance the extent of adoption of improved agricultural
technologies like fertilizer application in cassava + beans + maize intercrop, weeding,
planting of early season crops, modern land preparation and pest control in the food crop
farms. Farmers also become knowledgeable on markets particularly the prevailing prices
through the radio programmes. All the information given to farmers assists them in increasing
their enterprises’ productivity, value of production and consequently this translates to
economic gains. Nevertheless, the adoption of the technologies were generally low as
indicated in tables 3, 4 and 5 although productivity increased among group and non group
farmers. Table 6 results reaffirm this situation as changes in new technologies adopted did
not significantly influence economic gains. The result is similar to that of study by Agwu et
al., 2008 which observed that adoption of the improved agricultural technologies were
generally low in Nigeria despite the use of radio farmer programmes particularly in Enugu
State. They identified the possible major constraints to this as: the short duration of
programmes and their appropriate scheduling, irrelevant questions asked and feedback from
the presenters. A study in DRC on radio farmer programmes however has not been done.

33
CHAPTER FIVE
CONCLUSION AND POLICY IMPLICATIONS
5.1 Conclusions
In this study, economic surplus model was used to determine the economic gains by
smallholder farmers from crop production and a comparison of the gains done between group farmers
versus that of non-group farmers, and there was significant difference. Economic gains were
positively influenced by productivity and in the analysis; productivity was higher among group
farmers than the non-group farmers. The adoption of new varieties and other technologies was also
higher for group farmers than non-group farmers and this influenced economic gains as well as the
radio farmer programmes and group membership. The latter factors facilitated adoption of
productivity increasing technologies especially among group farmers as also found in similar studies
in Africa. The use of inorganic fertilizers however remained minimal largely due to unavailability
and high prices.
. There has been widespread notion that farm credit in cash has positive influence on farm
income by increasing farm input purchases thereby increasing productivity and incomes. This study
however negated this notion since economic gain had a negative relationship with farm credit while
off-farm income had a positive influence on economic gains. A plausible reason for this is fungibility
of credit where farmers invested the farm credit in off-farm ventures to generate more off-farm
income reinvested in agricultural activities to increase economic gains. Based on these findings,
farmer groups appear to be influential in the dissemination of agricultural technologies that increase
crop productivity thereby increasing incomes of smallholder farmers.
5.2 Policy implications
With respect to the results on input use levels and productivity, the Congolese
Government needs to increase awareness on good agricultural practices that increase
productivity and economic gains of smallholder farmers. This could be done by developing
well functioning input and output markets as well as making the inputs available and
affordable to farmers. The adoption of new technologies (inorganic fertilizers, crop varieties,
pesticides) was observed to be low therefore there is need to focus on capacity building

34
approach as the best way in future projects to enhance problem solving capacities of farmers.
The application of new technologies is one of the sure means of increasing productivity in
subsistence farming where production factors are scarce. It has been established in most cases
that adoption decision is strongly influenced by availability of credit, level of income and
extension services therefore attempts to upscale activities that promote them is underscored.
Regarding information access through farmer radio programmes, there is need to allocate
more air time to the programmes so as to improve the adoption of new agricultural
technologies. The promising information access strategy revolves around vigorous
promotional activities via radio and should be carried out by interested NGOs, development
partners and research institutions and other stakeholders to encourage the formation of
farmers’ radio listening groups across the groupments. This is to allow for timely flow of
information on good agricultural practices that improve productivity and economic welfare of
smallholder farmers. There is also the need to support local organizations that can effectively
offer extension services to farmers.
Time spent on off-farm activities influenced economic gain of the smallholder farmers
through off-farm income realized. The smallholder farmers spent more time in off-farm
activities like running small business enterprises to augment their income. The development
partners should also initiate programs that promote the development of micro enterprises so
that the smallholders realize more income which in turn could be reinvested in agriculture to
increase productivity and enhance economic gains. The positive significant influence of off-
farm income on economic gain could only be substituted if future interventions incorporate
more income generating activities along with the technology package to enable the resource
poor farmers afford improved technologies whose adoption seemed low.
Membership to farmers’ organization was observed to have a positive significant influence
on economic gain. It should be encouraged among smallholders in order to boost productivity
and incomes as observed in the mean differences in these variables between group and non-
group farmers.
In line with the regression results, more credit needed to be availed to the farmers to
increase economic gains. This could be done through innovative ways to enable the resource
poor farmers access cash credit for example credit in kind (input provision) given the risk
averse nature of smallholder farmers. The financial institutions should however issue more
cash credit in kind to reduce fungibility of the funds and this could be in form of material
inputs necessary to increase agricultural productivity.
35
5.3 Suggestions for Further Research
The study focused on farm level productivity and economic gains from the interventions. It
would however be important to evaluate the factors that influence group formation and socio-
economic factors that influence adoption of new innovations by farmers on DR Congo.
Agricultural policies in DRC have not been updated since 1974 therefore this would help in
policy formulation aimed at up scaling technology uptake to increase agricultural
productivity. There is also need to research on the nature and content of radio farmer
programmes, their relevance and acceptability by the farmers to find ways of improving
them.
36
REFERENCES
Agwu, A.E., Ekwueme, J.N., and Anyanwu, A.C. (2008). Adoption of improved Agricultural
Technologies disseminated via Radio Farmer Programme by farmers in Enugu State,
Nigeria.Available online at http://www.academicjournals.org/AJB.
Bardhan, P.K. (2001). Institutions, reforms and agricultural performance in current and
emerging issues for economic analysis and policy research.ed.K.G.Stamoulis. Rome:
Economic and Social department, Food and Agriculture Organization of the United
Nations.
Becker, G. (1965). The Theory of the Allocation of Time. Economic Journal. Vol 75, pp.492-
518.
Carr, S. (2001). Changes in African Smallholder Agriculture in the 20th Century and the
challenges on the 21st Century. Africa Crop Science Journal 9(1): 331-338.
Chirwa, R.M., and Aggarwal, V.D. 2000. Bean Seed Dissemination Systems in Malawi: A
Strategy. Journal of Sustainable Agriculture. 15(4). 5-24.
Cirimwami, K.J.P., and Mashika B.K.A. (1999). La maîtrise de l’espace rural en vue de la
sécurité alimentaire à Kabare-centre: analyse des stratégies d’exploitastion du terroir
local. Cahiers du CERPRU 13: 33-44
Clague, C. (1997). The New Institutional Economics and Economic Development. Institutions
and Economic Development; Growth and Governance in Less Developed and Post-
Socialist Countries. John Hopkins University Press, Baltimore and London. Pp. 13-
36.
Consortium for Improving Agriculture-based Livelihoods in Central Africa, CIALCA.
(2007). Baseline Report. The Democratic Republic of Congo.
Crawford, E., Jayne.T.S., and Kelly V.A. (2005). Alternative approaches to promoting
fertiliser use in Africa with particular reference to the role of fertilizer subsidies. East
Lansing: Michigan State University.
Crawford, E., Kelly.V.A., Jayne.T.S., and Howard J. (2003). Input use and market
development in Sub Saharan Africa: An Overview. Food Policy 28(4): 276-300.
37
Doward A.R., Kydd.J., and Poulton C. (2005a). Coordination risk and cost impacts on
economic development in poor rural areas. Paper presented at the Agricultural
Economics Society Conference, Nottingham, U.K., April.
…………………………………………… (2005b). Beyond Liberalization: “Development
Coordination” Policies for African Smallholder Agriculture. IDS Bulletin 36(2):80-
85.
Ellis, F. (1988). Peasant Economics; Farm Households and Agrarian Development.
Cambridge University PRESS, Cambridge.
Gabre-Madhin, E.Z., and Haggblade S. (2003). Success in African Agriculture: Results of an
expert survey. Market and Structured Studies Division Discussion Paper
53.Washington, D.C., International Food Policy Research Institute.
Ghatak, M.(1999). Group Lending, Local information and Peer Selection.Journal of
Development Economics. Vol 60, pp.27-50.
Ghatak, M., and Guinane, T. (1999). The Economics of Lending With Joint Liability: Theory
and Practice. Journal of Development Economics. Vol. 60, pp. 195– 228.
Greene. W.H. (2003). Econometric Analysis. Fifth Edition., Pearson Education International.,
Upper Saddle River, New Jersey, USA.
Groebner, D.F and Shannon, P.W. (2005). Business Statistics. A decision Making Approach.
Pentice Hall .
Karki, L.B., and Bauer, S. (2004). Technology Adoption and household Food
Security.Analyzing factors determining technology adoption and impact of project
intervention: A case of smallholder peasants in Nepal. A paper presented in the
Deutscher Tropentag held o 5-7 October, 2004, Humboldt-University, Berlin.
Kasereka, B. (2003). Aménagement du terroir et érosion des terres autour de Bukavu.
Communication personnelle. Séminaire sur la lutte anti-érosive autour de Bukavu,
tenu à Bukavu du 27au 29 mai 2003.
Kirsten, J.F., Doward A.R., Poulton.C., and Vink N. (2009). Institutional Economics
Perspectives on African Agricultural Development. International Food Policy
Research Institute.
Lilyan, E.F., Richard.K.P., and Bingxin Y. (2004). Institutitons and Agricultural Productivity
in Saharan Africa. Department of Agricultural Economics, University of
Nebraska.Lincon, U.S.A. Pp 160-180.
38
Lunze, L.(2000). Possibilités de gestion de la fertilité des sols au Sud-Kivu montagneux.
Cahiers du CERPRU 14: 23-26
Mastaki, L.N. (2006). Le rôle des goulots d`étranglement de la commercialisation dans
l`adoption des innovations agricoles chez les producteurs vivriers du Sud-Kivu (Est
de la RD.Congo), PhD dissertation originale, Université des sciences agronomiques
de Gembloux, Unité d’Economie et Développement Rural.
Masters, W.A., Coulibaly, D., Sidibe, M. and Williams, A. 1996. The Economic Impact of
Agricultural Research: A Practical Guide. Department of Agricultural Economics.
Purdue University. West Lafayette, IN.47907. Available at
www.aec.msu.edu/fs2/zambia/.../Masters_EconSurplusManual-English.pdf
Meinzen-Dick, R.S., Knox A.,and Di Gregorio M.(2001). Collective Action, property rights,
and devolution of natural resource management:Exchange of knowledge and
implications for policy. CAPRi Working Paper. Washington, D.C.: International Food
Policy Research Institute.
Mühlenberg, M., Slowik, J., and Steinhauer-Burkart, B. (1995). Kahuzi-Biega National Park.
IZCN-GTZ Project.
Murhula, A.J. (2004). Diagnostic du terroir autour du Parc National de Kahuzi-Biega et
possibilités d’optimiser son utilisation, cas du groupement Bugorhe en Collectivité-
Chefferie de Kabare. Mémoire Licence, ISDR Bukavu.
Nelson, J.B., Kaboolian.N., and Craver A.K. (2004). Bridging Social Capital and Investment
Theory of Collective Action: Evidence from the Concord Project. Annual report by
the American Association of Political Science, Chicago Press.
North, D.C. (1990). Institutions, Institutional Change and Economic Performance.
Cambridge University Press, New York.
Nwuzor, B. (2000).Nature and Role of Agricultural Extension in Economic Development.
Enugu, Econas publishing Company, p.48.
Ochieng’, J. (2010). Evaluation of Effect of Management Intervention in Smallholder
Indigenous Chicken Production in Rongo and HomaBay Districts, Kenya.
Unpublished Masters thesis of Egerton University.
Ostron, M. (1965).The Logic of Collective Action. Cambridge University Press, Cambridge.
39
Ostron, M. (1990).The evolution of Institutions for Collective Action. Cambridge University
Press, Cambridge.Pp260-296.
Owuor, G. (2002). Impact of Financial Self-Help Groups’ Credit on Agricultural Production.
The Case of maize Production in Siaya, Kenya. Unpublished Masters Thesis.
Egerton university.
Owuor, G. (2008). Evaluation of the Effects of Group-Credit Linkages on Smallholder
Farmers’ Productivity and Poverty Reduction in Nakuru and Kakamega Districts,
Kenya. Unpublished PhD Thesis. Egerton University.
Owuor, G., Wangia, S.M., Onyuma, S., Mshenga, P., and Gamba, P. (2004). Self-Help
Groups, A Social Capital for Agricultural Productivity.The Case of Smallholder
Maize Farmers in Ukwala Division, Siaya District, Kenya. Paper accepted for
Publication by the Egerton Joournal of Humanities.
Pande, R., and Udry C.R. (2005). Institutions and Development: A view from below.
Economic Growth Center Discussion Paper 928.New Haven, Conn., U.S.A.: Yale
University.
Paxton, J., Graham.D., and Thraen C. (2000).Modeling Group Loan Repayment Behaviour:
New insights from Burkina Faso. Economic Development and Cultural Change.
Peacock, C., A.Jowett, A.R.Doward, C.Poulton, and Urey I. (2004). Reading the Poor: A call
to action. Investment in Smallholder agriculture in Sub Saharan Africa. Unpublished
report, farm-Africa, London.
Poate, C.D. and Daplyn P.F. (1995). Survey Design and Analyses.London.Oxford University
Press.
Runge, C.F. (1984). Institutions and the Free Rider: The Assurance Problem in Collective
Action. Journal of Politics, Vol.46.1. pp.150-160.
Rutherford, A. (2001). Introducing ANOVA and ANACOVA: A GLM approach. Thousand
Oaks, CA: Sage Publications.
Shiferaw, B., Obare.G., and Muricho G. (2008). Rural market imperfections and the role of
Institutions in Collective Action to improve Markets for the poor. Natural Resource
Forum, Vol.32.pp.25-39.
Singh, I., Squire, L., and Strauss.J. (1986). Agricultural Household Models: Extensions,
Applications and Policy. John Hopkins University Press, Baltimore, Maryland.
40
Smale, M., and Jayne T.S. (2003). Maize in Eastern and Southern Africa: “Seeds” of success
in retrospect. Environment and Production Technology Division Discussion Paper
97.Washington, D.C: International Food Policy Research Institute.
Stiglitz, J. (1990). Peer Monitoring and Credit Markets. World Bank Economic Review, Vol.
4, No. 3. pp. 197-203.
Strauss, J. (1986a). Estimating the Determinants of Food Consumption and Caloric
Availability in Rural Sierra Leone. John Hopkins University Press, Baltimore,
Maryland.
….……….. (1986b). The Theory of Comparative Statics of Agricultural Household Models:
A general Approach. John Hopkins University Press, Baltimore, Maryland.
Tiffen, M. (2003). Transition in Sub Saharan Africa: Agriculture, urbanization and income
growth. World Development 31: 1343-1367.
Turner, J.R., and Thayer J.F. (2001). Introduction to analysis of variance: Design, analysis
and interpretation. Thousand Oaks, CA: Sage Publications.
United Nations Millennium Project. (2005a). Halving Hunger: It can be done. New York:
United Nations Task Force on Hunger.
……………………………………… (2005b). Investing in development: A practical plan to
achieve the millennium Development Goals. New York.
Vandamme, E. (2008). Nutrient deficiencies in soils of Walungu, South Kivu, Democratic
Republic of Congo. Thesis, Katholieke Universiteit Leuven.
Varian, H. (2006). Microeconomic Theory.6th edition. Prentice Hall.
World Bank. (2002). Institutions for Markets.World Development Report.Washington, D.C.
……………. (2003). Sustainable development in a dynamic world: transforming institutions,
growth and quality of life. World Development Report. Washington, D.C.
……………. (2008). Agriculture for development. World Development Report. Washington,
D.C.
Wright, D.B. (2006). Comparing groups in a before-after design: When t test and ANACOVA
produce different results. British Journal of Education, 76, 663-676.
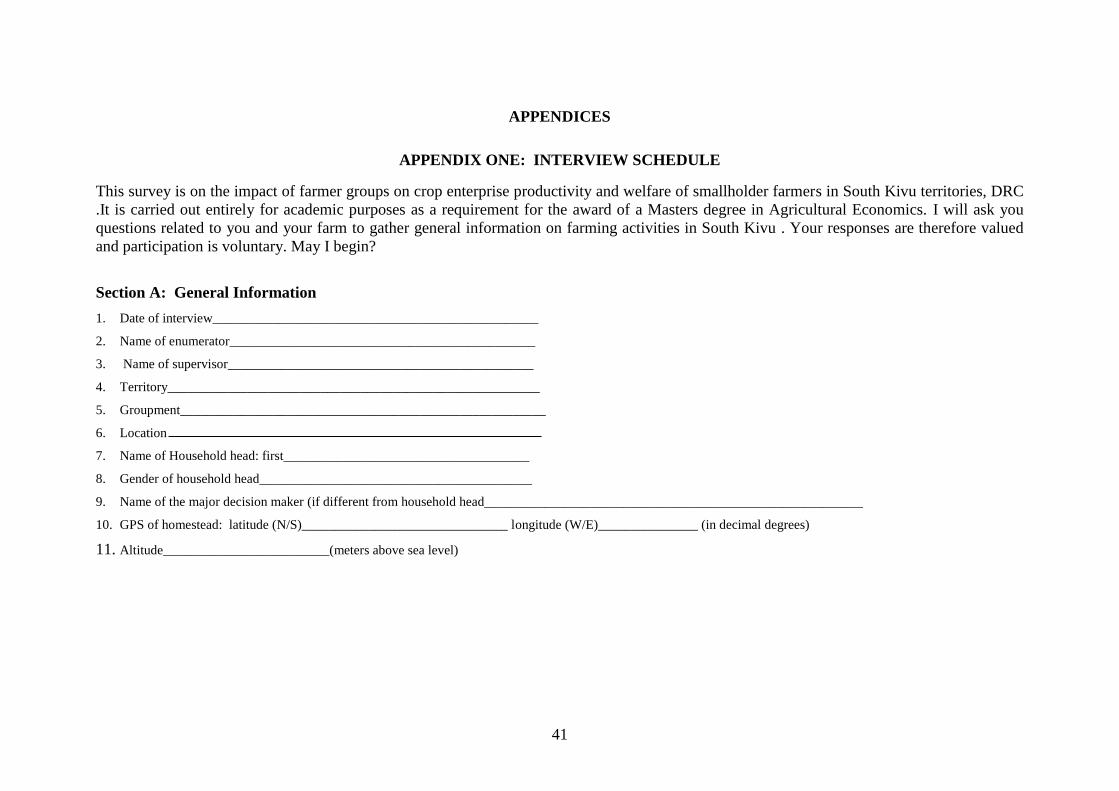
41
APPENDICES
APPENDIX ONE: INTERVIEW SCHEDULE
This survey is on the impact of farmer groups on crop enterprise productivity and welfare of smallholder farmers in South Kivu territories, DRC
.It is carried out entirely for academic purposes as a requirement for the award of a Masters degree in Agricultural Economics. I will ask you
questions related to you and your farm to gather general information on farming activities in South Kivu . Your responses are therefore valued
and participation is voluntary. May I begin?
Section A: General Information
1. Date of interview_________________________________________________
2. Name of enumerator______________________________________________
3. Name of supervisor______________________________________________
4. Territory________________________________________________________
5. Groupment_______________________________________________________
6. Location
7. Name of Household head: first_____________________________________
8. Gender of household head_________________________________________
9. Name of the major decision maker (if different from household head_________________________________________________________
10. GPS of homestead: latitude (N/S)_______________________________ longitude (W/E)_______________ (in decimal degrees)
11. Altitude_________________________(meters above sea level)

42
SECTION B : Household profile before the interventions
Relation to
Head
Name Age Gender Resident
0-No
1-Yes
Education
(yrs)
% of time
Working on farm
% of
time
Workin
g
Wages
Per
Period
In US $
period Type work if any
1 Respondent
2 Head
3 Spouse
4 Sibling:1
5 2
6 3
7 4
5
6
Relatives: 1
2
3
8 4
Relatives: 1
2
3
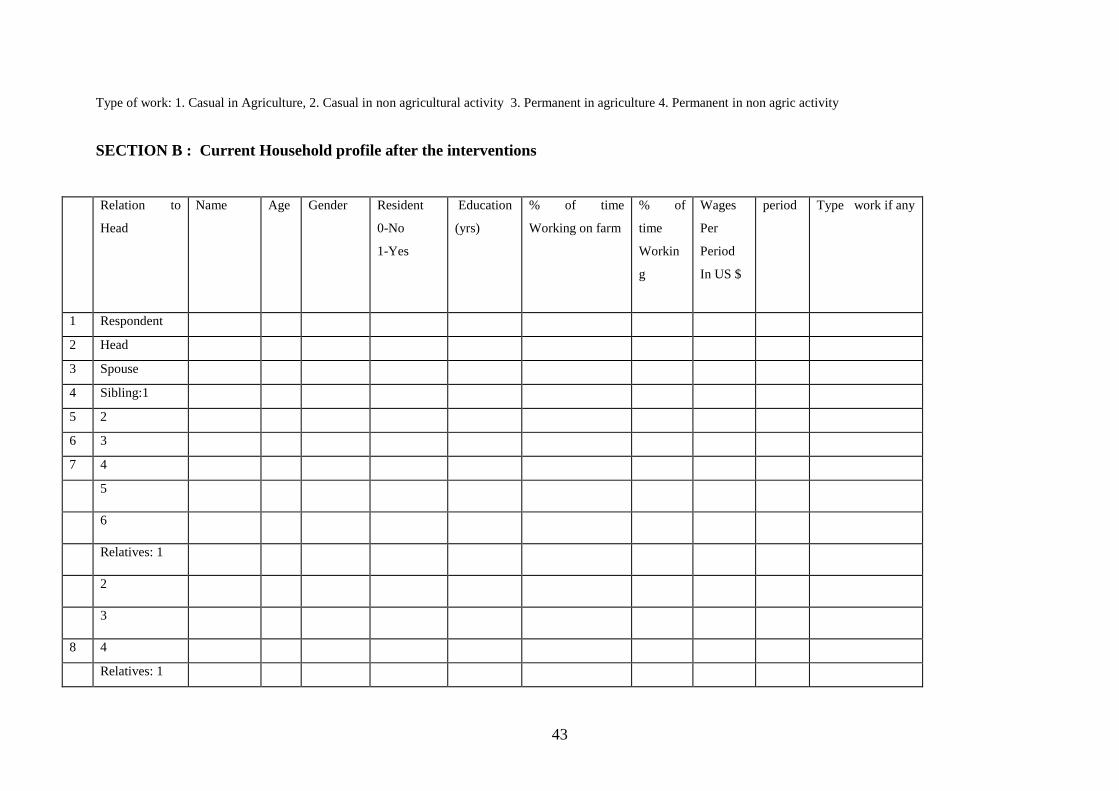
43
Type of work: 1. Casual in Agriculture, 2. Casual in non agricultural activity 3. Permanent in agriculture 4. Permanent in non agric activity
SECTION B : Current Household profile after the interventions
Relation to
Head
Name Age Gender Resident
0-No
1-Yes
Education
(yrs)
% of time
Working on farm
% of
time
Workin
g
Wages
Per
Period
In US $
period Type work if any
1 Respondent
2 Head
3 Spouse
4 Sibling:1
5 2
6 3
7 4
5
6
Relatives: 1
2
3
8 4
Relatives: 1
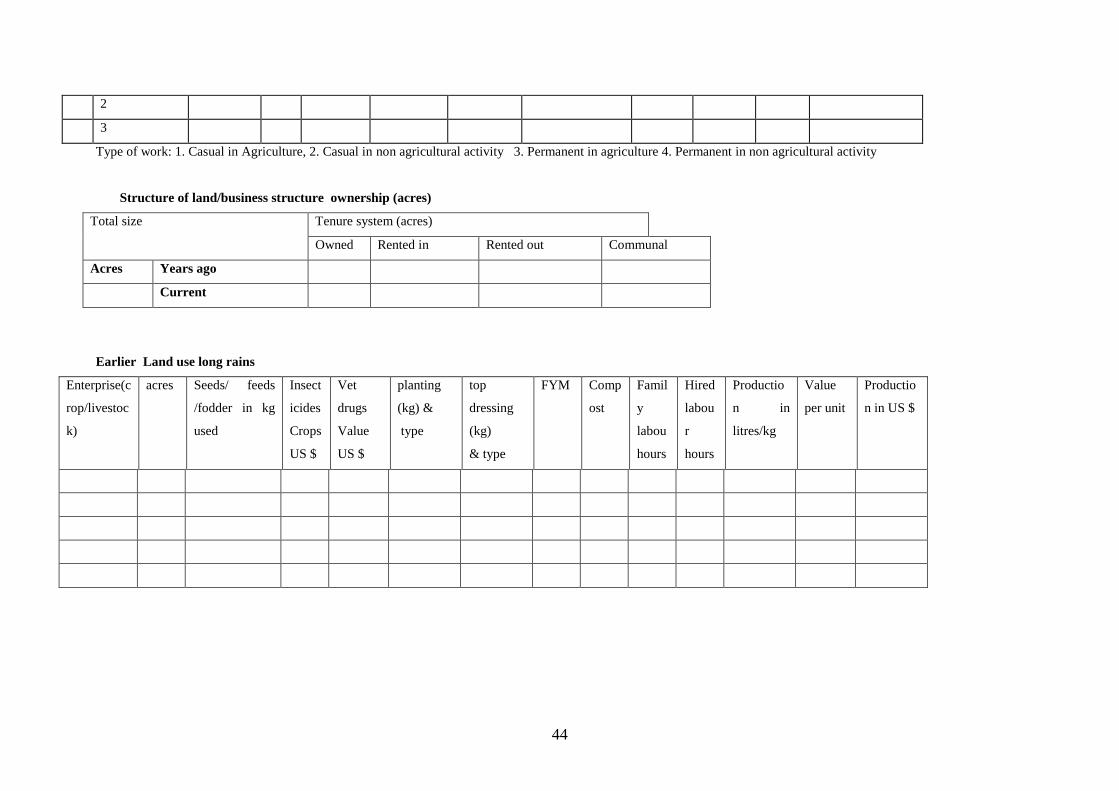
44
2
3
Type of work: 1. Casual in Agriculture, 2. Casual in non agricultural activity 3. Permanent in agriculture 4. Permanent in non agricultural activity
Structure of land/business structure ownership (acres)
Total size
Tenure system (acres)
Owned Rented in Rented out Communal
Acres Years ago
Current
Earlier Land use long rains
Enterprise(c
rop/livestoc
k)
acres Seeds/ feeds
/fodder in kg
used
Insect
icides
Crops
US $
Vet
drugs
Value
US $
planting
(kg) &
type
top
dressing
(kg)
& type
FYM Comp
ost
Famil
y
labou
hours
Hired
labou
r
hours
Productio
n in
litres/kg
Value
per unit
Productio
n in US $

45
Current Land use long rains
Enterprise(c
rop/livestoc
k)
acres Seeds/ feeds
/fodder in kg
used
Insect
icides
Crops
US $
Vet
drugs
Value
US $
planting
(kg) &
type
top
dressing
(kg)
& type
FYM Comp
ost
Famil
y
labou
hours
Hired
labou
r
hours
Productio
n in
litres/kg
Value
per unit
Productio
n in US $
Earlier average Land use in the short rains
Enterprise acres Seeds/ feeds
/fodder in kg
used
Insect
icides
Crops
US $
Vet
drugs
Value
US $
Planting
fertilizer
(kg) &
type
top
dressing
fertiliser
(kg)
& type
FYM Comp
ost
Famil
y
labou
hours
Hired
labou
r
hours
Productio
n in
litres/kg
Value
per unit
Productio
n in US $
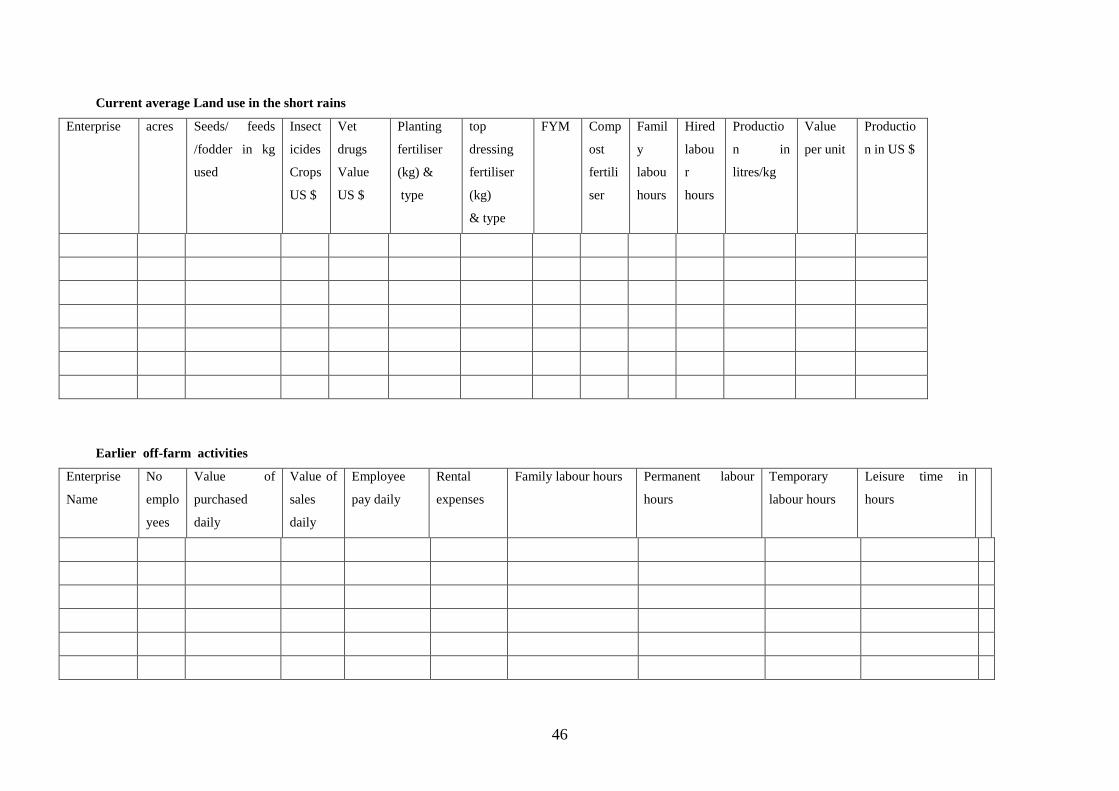
46
Current average Land use in the short rains
Enterprise acres Seeds/ feeds
/fodder in kg
used
Insect
icides
Crops
US $
Vet
drugs
Value
US $
Planting
fertiliser
(kg) &
type
top
dressing
fertiliser
(kg)
& type
FYM Comp
ost
fertili
ser
Famil
y
labou
hours
Hired
labou
r
hours
Productio
n in
litres/kg
Value
per unit
Productio
n in US $
Earlier off-farm activities
Enterprise
Name
No
emplo
yees
Value of
purchased
daily
Value of
sales
daily
Employee
pay daily
Rental
expenses
Family labour hours Permanent labour
hours
Temporary
labour hours
Leisure time in
hours

47
Current Off –farm Activities
Enterprise
Name
No
emplo
yees
Value of
purchased
daily
Value of
sales
daily
Employee
pay daily
Rental
expenses
Family labour hours Permanent labour
hours
Temporary
labour hours
Leisure time in
hours
Average Annual Household Income sources
Earlier Income Current Income
Type of earning Amount Time period in days Amount Time period in days
Employment income
Income from business
Income from farm produce sales (milk, crop produce)
Income from sale of livestock and other assets eg land, vehicle
Transfer earnings from relatives, sons, daughters etc
Value of gifts
Land rented out income
Buildings rented out income
Other structures rented out income
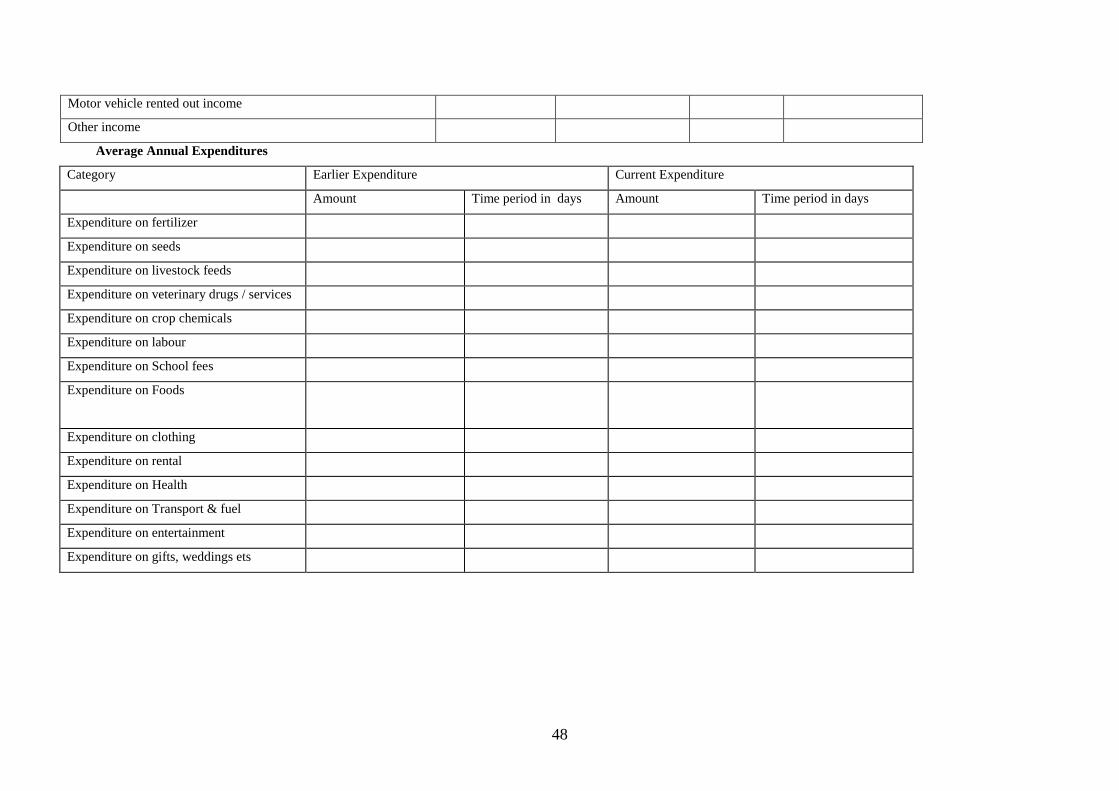
48
Motor vehicle rented out income
Other income
Average Annual Expenditures
Category Earlier Expenditure Current Expenditure
Amount Time period in days Amount Time period in days
Expenditure on fertilizer
Expenditure on seeds
Expenditure on livestock feeds
Expenditure on veterinary drugs / services
Expenditure on crop chemicals
Expenditure on labour
Expenditure on School fees
Expenditure on Foods
Expenditure on clothing
Expenditure on rental
Expenditure on Health
Expenditure on Transport & fuel
Expenditure on entertainment
Expenditure on gifts, weddings ets

49
Asset endowments (numbers)
Earlier Asset Endowments Current Asset Endowments
Asset Number Value per unit Number Value per Unit
Oxen
Dairy Cattle
Other Cattle
Donkeys
Camels
Goats
Sheep
Pigs
Paultry
Carts
Vehicle
Tractors
Plough
Wheel barrows
Hoes/Jembes
Pangas/Slashers
TV
Radio
Bicycles
Computer
Furniture
Other assets

50
Access to market
Km Tramarc road Km Earth road
Earlier time Current time Earlier time Current time
Input market Nearest
Most important (urban)
Output market Nearest
Most important (urban)
SECTION B: INSTITUTIONAL SUPPORT
1. Have attended farmer training school (y/n) ___ Number of days in the past : _____ Number of times current ____________
2. Number extension contacts in the past _______________Number current _________
3. Number of times per month you listen to agricultural programs on the radio in the past____________ number of times current_____________
4. Frequency of attendance to farmer group meetings in the past-----------------, Current ____
5. Credit Access (Yes-1, No-0)___ in the Past_______________Access Current ___________________
6. a) Borrowed (Yes-1, No-0) in the past time ____________Borrowed Cuurent___________________
7. If yes, source Earlier times
borrowed
0-No
1-Yes
Credit
type
Money –
1
In kind-2
Amt
Seaso
n
one
(US
$)
Amount
Season
two
(US $)
Total
annual
amount
(US $)
If from SHG
was group
linked to
MFI
(0-No, 1-
Yes)
If linked
which
MFI
Collateral
guarantee?
1.Savings with
group
2. Savings with MFI
1. Asset
2. Orher (specify)
If SHG,
Current
Money
value in
US $
If SHG
Current
assets

51
Formal Commercial banks
Semi-
formal
AFC
Cooperatives
Micro-Finance
institution
NGO project
Other
Informal Input-store
Self-help
Groups
Moneylender
Neighbors
Friends
Family
Other
8. If yes, source Current times
borrowed
0-No
1-Yes
Credit
type
Money –
1
In kind-2
Amt
Seaso
n
one
(US
$)
Amount
Season
two
(US $)
Total
annual
amount
(US $)
If from SHG
was group
linked to
MFI
(0-No, 1-
Yes)
If linked
which
MFI
Collateral
guarantee?
1.Savings with
group
2. Savings with MFI
3. Asset
4. Orher (specify)
If SHG,
Current
Money
value in
US $
If SHG
Current
assets
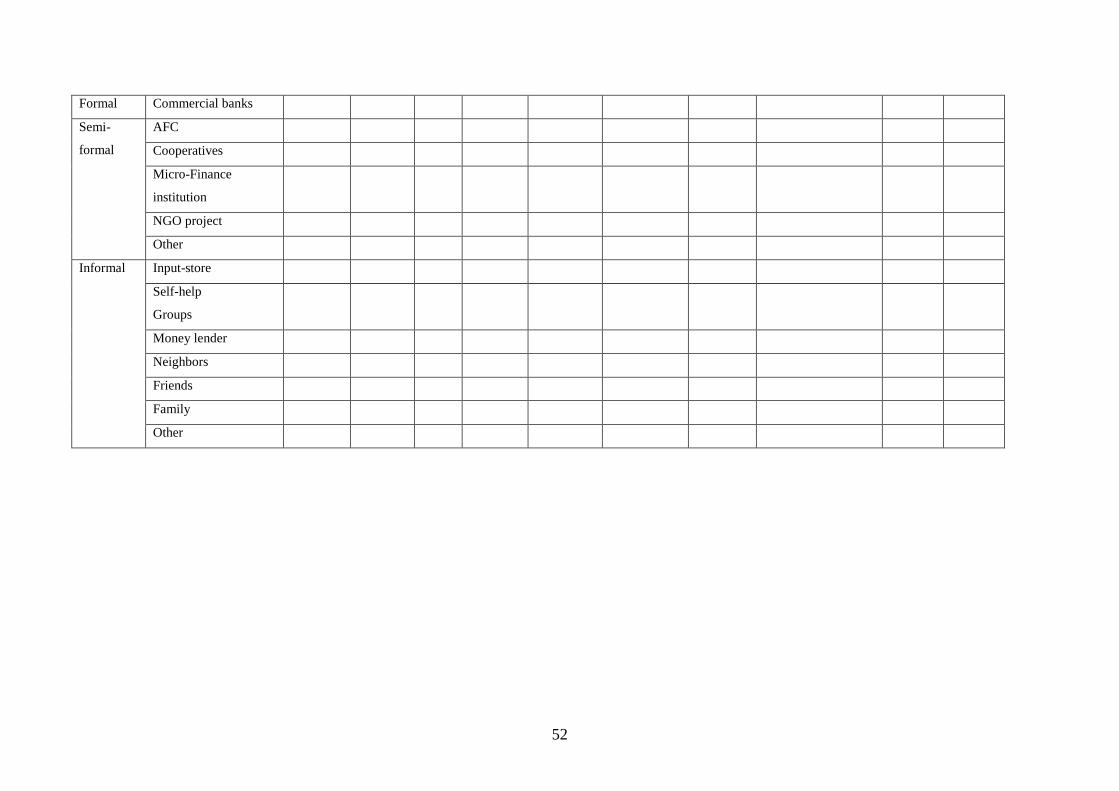
52
Formal Commercial banks
Semi-
formal
AFC
Cooperatives
Micro-Finance
institution
NGO project
Other
Informal Input-store
Self-help
Groups
Money lender
Neighbors
Friends
Family
Other
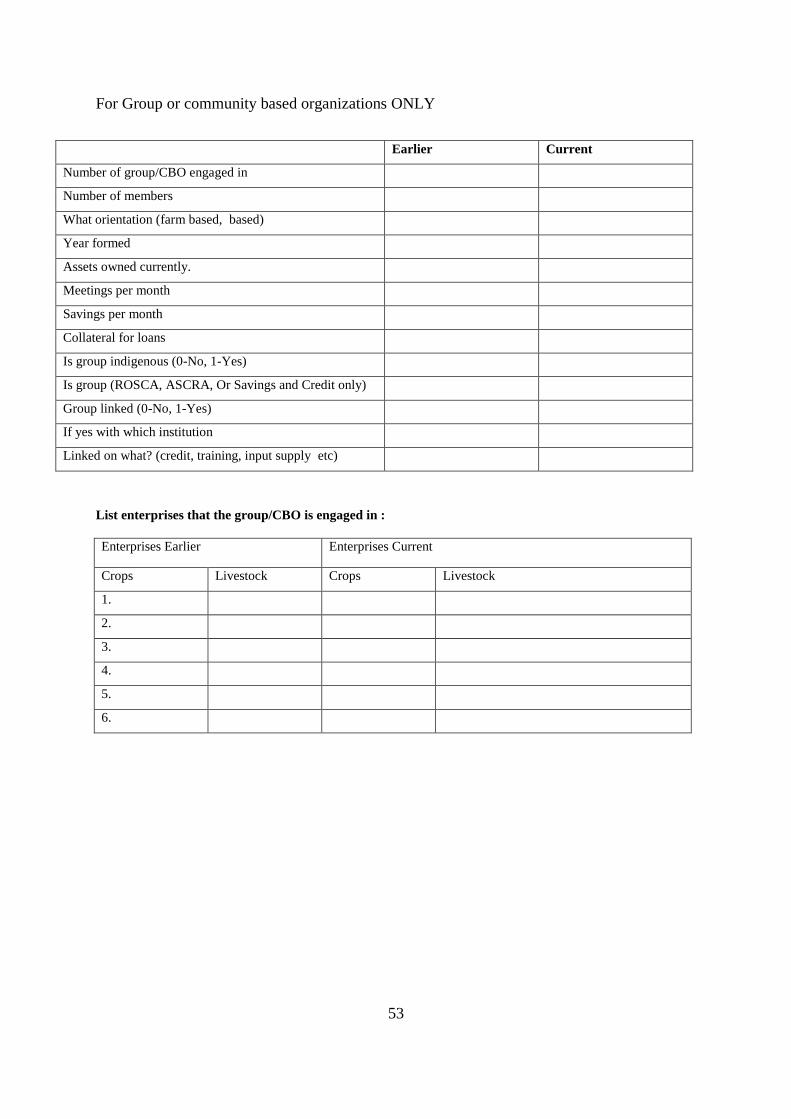
53
For Group or community based organizations ONLY
Earlier Current
Number of group/CBO engaged in
Number of members
What orientation (farm based, based)
Year formed
Assets owned currently.
Meetings per month
Savings per month
Collateral for loans
Is group indigenous (0-No, 1-Yes)
Is group (ROSCA, ASCRA, Or Savings and Credit only)
Group linked (0-No, 1-Yes)
If yes with which institution
Linked on what? (credit, training, input supply etc)
List enterprises that the group/CBO is engaged in :
Enterprises Earlier Enterprises Current
Crops Livestock Crops Livestock
1.
2.
3.
4.
5.
6.
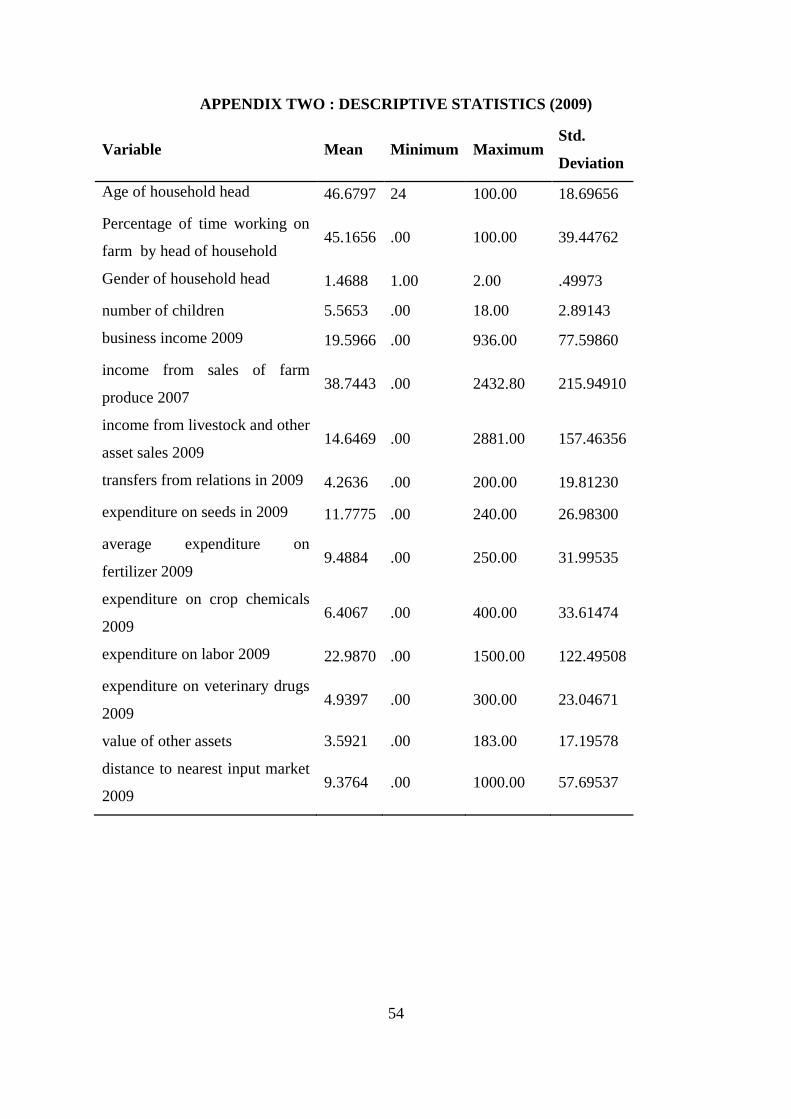
54
APPENDIX TWO : DESCRIPTIVE STATISTICS (2009)
Variable Mean Minimum Maximum Std.
Deviation
Age of household head 46.6797 24 100.00 18.69656
Percentage of time working on
farm by head of household 45.1656 .00 100.00 39.44762
Gender of household head 1.4688 1.00 2.00 .49973
number of children 5.5653 .00 18.00 2.89143
business income 2009 19.5966 .00 936.00 77.59860
income from sales of farm
produce 2007 38.7443 .00 2432.80 215.94910
income from livestock and other
asset sales 2009 14.6469 .00 2881.00 157.46356
transfers from relations in 2009 4.2636 .00 200.00 19.81230
expenditure on seeds in 2009 11.7775 .00 240.00 26.98300
average expenditure on
fertilizer 2009 9.4884 .00 250.00 31.99535
expenditure on crop chemicals
2009 6.4067 .00 400.00 33.61474
expenditure on labor 2009 22.9870 .00 1500.00 122.49508
expenditure on veterinary drugs
2009 4.9397 .00 300.00 23.04671
value of other assets 3.5921 .00 183.00 17.19578
distance to nearest input market
2009 9.3764 .00 1000.00 57.69537

55
APPENDIX 3 Age of household head, education level and number of children
Region
Age of respondent,
yrs
Educational level, years of
schooling
Number of
children
Bugorhe 45.7 3.6 5.7
Mudaka 48.7 4.7 4.9
Mushinga 49.1 5.6 5.4
Burhinyi 44.0 4.2 5.8
Nyangezi 43.9 5.5 5.7
Kamanyol
a 39.6 4.8 6.0
APPENDIX 4 Gender distribution among the sampled respondents
0%
20%
40%
60%
80%
100%
Bu
gorh
e
Mu
dak
a
Mu
shin
ga
Bu
rhin
yi
Nya
nge
zi
Kam
anyo
la
Region
Female
male
Pro
po
rtio
no
f h
ou
seh
old
hea
ds
(%)
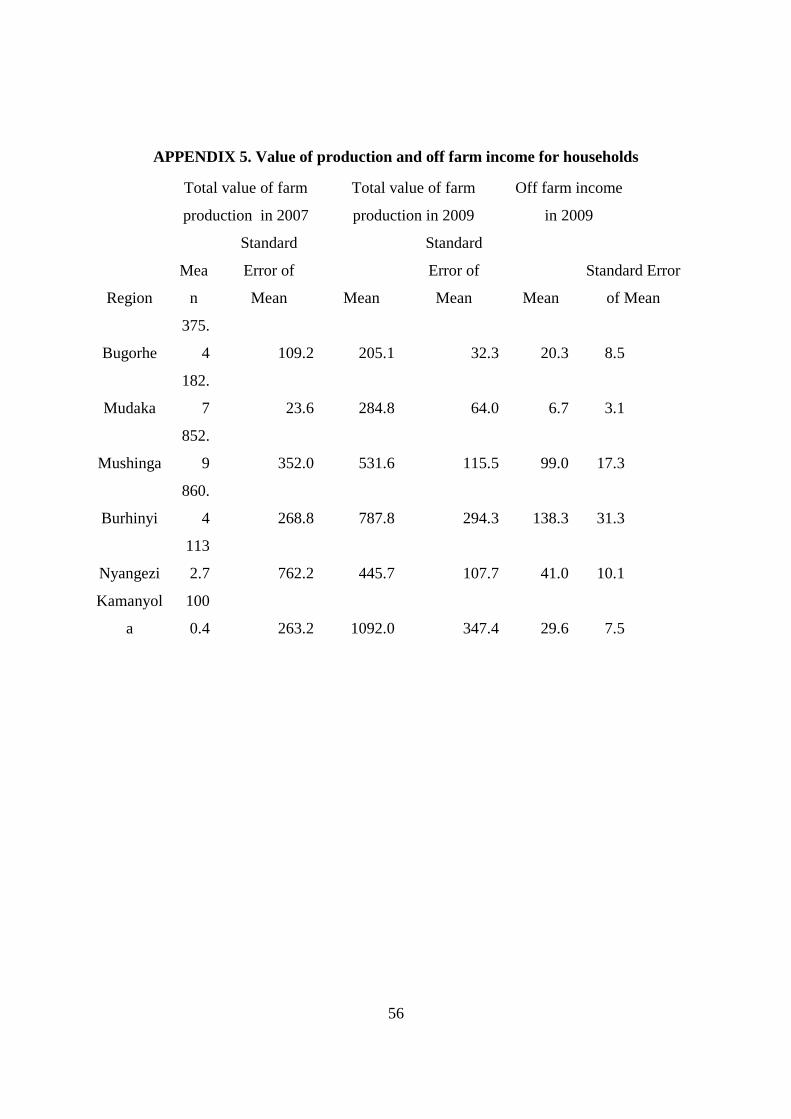
56
APPENDIX 5. Value of production and off farm income for households
Total value of farm
production in 2007
Total value of farm
production in 2009
Off farm income
in 2009
Region
Mea
n
Standard
Error of
Mean Mean
Standard
Error of
Mean Mean
Standard Error
of Mean
Bugorhe
375.
4 109.2 205.1 32.3 20.3 8.5
Mudaka
182.
7 23.6 284.8 64.0 6.7 3.1
Mushinga
852.
9 352.0 531.6 115.5 99.0 17.3
Burhinyi
860.
4 268.8 787.8 294.3 138.3 31.3
Nyangezi
113
2.7 762.2 445.7 107.7 41.0 10.1
Kamanyol
a
100
0.4 263.2 1092.0 347.4 29.6 7.5
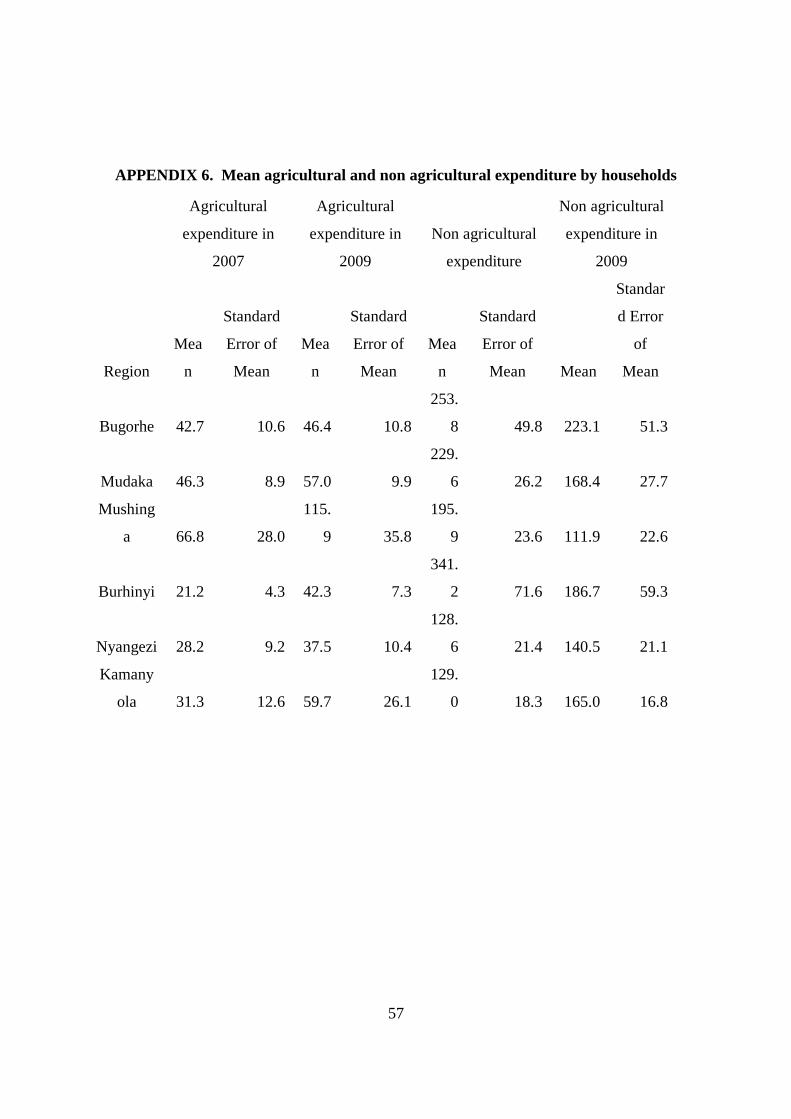
57
APPENDIX 6. Mean agricultural and non agricultural expenditure by households
Agricultural
expenditure in
2007
Agricultural
expenditure in
2009
Non agricultural
expenditure
Non agricultural
expenditure in
2009
Region
Mea
n
Standard
Error of
Mean
Mea
n
Standard
Error of
Mean
Mea
n
Standard
Error of
Mean Mean
Standar
d Error
of
Mean
Bugorhe 42.7 10.6 46.4 10.8
253.
8 49.8 223.1 51.3
Mudaka 46.3 8.9 57.0 9.9
229.
6 26.2 168.4 27.7
Mushing
a 66.8 28.0
115.
9 35.8
195.
9 23.6 111.9 22.6
Burhinyi 21.2 4.3 42.3 7.3
341.
2 71.6 186.7 59.3
Nyangezi 28.2 9.2 37.5 10.4
128.
6 21.4 140.5 21.1
Kamany
ola 31.3 12.6 59.7 26.1
129.
0 18.3 165.0 16.8
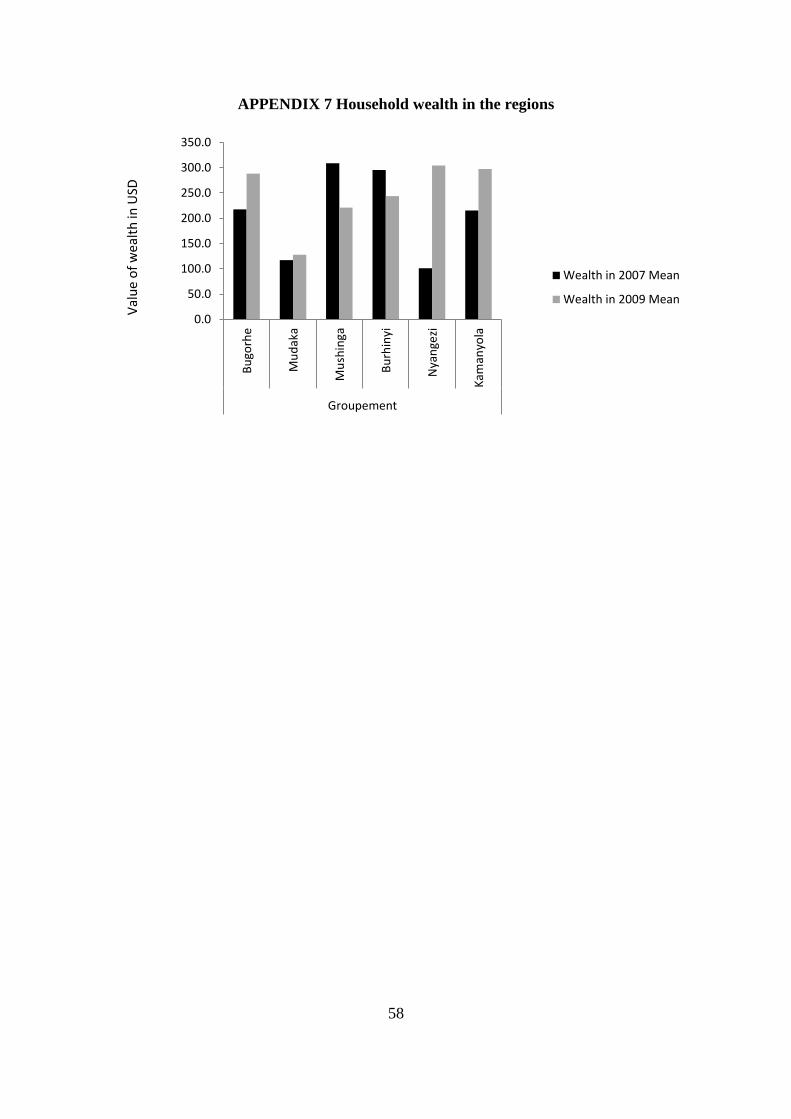
58
APPENDIX 7 Household wealth in the regions
0.0
50.0
100.0
150.0
200.0
250.0
300.0
350.0
Bu
gorh
e
Mu
dak
a
Mu
shin
ga
Bu
rhin
yi
Nya
nge
zi
Kam
anyo
la
Groupement
Wealth in 2007 Mean
Wealth in 2009 Mean
Val
ue
of
we
alth
in U
SD

59
APPENDIX 8. Inorganic and organic fertilizer usage in the regions
Inorganic
fertilizer earlier
period
Inorganic
fertilizer current
period
organic manure
earlier period
Organic manure
current period
Group
ement Mean
Standar
d Error
of Mean Mean
Standard
Error of
Mean Mean
Standar
d Error
of
Mean Mean
Standa
rd
Error
of
Mean
Bugor
he 85.2 28.6 103.0 51.9 2355.0 532.3
5636.
0 1634.9
Muda
ka 120.8 80.1 66.3 33.3 4678.1 976.3
4423.
9 1329.8
Mushi
nga 196.2 50.9 170.5 44.5 297.2 43.7 324.4 50.1
Burhin
yi 133.3 37.5 176.2 79.7 643.3 295.2 546.3 270.6
Nyang
ezi 131.5 85.4 183.3 113.5 118.4 43.9 70.7 25.9
Kama
nyola 6.2 3.4 10.7 4.7 5.3 3.2 10.2 5.1
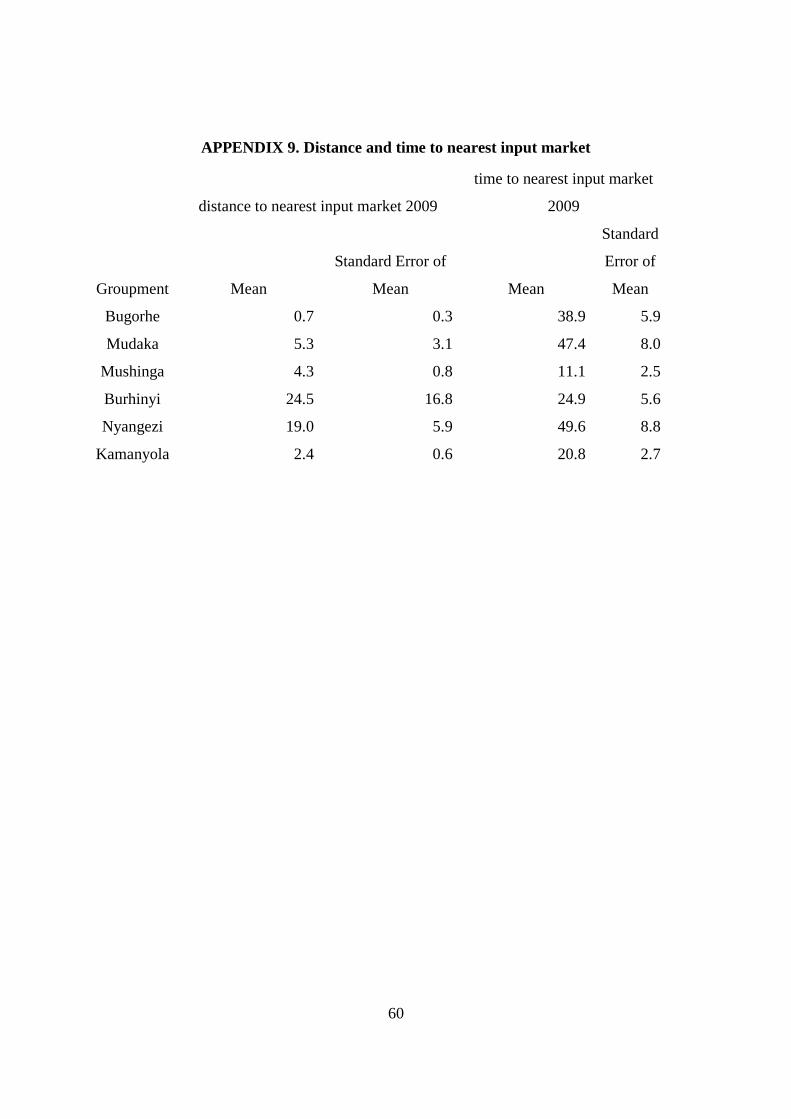
60
APPENDIX 9. Distance and time to nearest input market
distance to nearest input market 2009
time to nearest input market
2009
Groupment Mean
Standard Error of
Mean Mean
Standard
Error of
Mean
Bugorhe 0.7 0.3 38.9 5.9
Mudaka 5.3 3.1 47.4 8.0
Mushinga 4.3 0.8 11.1 2.5
Burhinyi 24.5 16.8 24.9 5.6
Nyangezi 19.0 5.9 49.6 8.8
Kamanyola 2.4 0.6 20.8 2.7