impact evaluation of site-specific activities under the
TRANSCRIPT
Raul Pitoro, Songqing Jin,
Mywish K. Maredia, Gerhardus
Schultink, and Ellen Payongayong
Report submitted by
Michigan State University for
Comments
July 31, 2016
Baseline Report for the National Land Administration Interventions in
Districts and Municipalities in Northern Mozambique under MCA-
Mozambique’s Land Tenure Services Project
ii
Baseline Report for the National Land Administration
Interventions in Districts and Municipalities in Northern
Mozambique under MCA-Mozambique’s Land Tenure
Services Project
by
Raul Pitoro, Songqing Jin, Mywish K. Maredia, Gerhardus Schultink, and
Ellen Payongayong
Report Submitted by Michigan State University to the Millennium Challenge Corporation for
Comment –October 6, 2016
i
Acknowledgement
This report is prepared by Michigan State University (MSU) and funded through a collaborative
agreement between the United States Department of Agriculture (USDA) Foreign Agricultural
Service (FAS) and MSU, with financing and guidance provided by the Millennium Challenge
Corporation.
The authors express their gratitude to government staff in Municipalities and SPGCs offices in
northern Mozambique. Thanks also to Richard Gaeta and Jennifer Witriol Lisher, Millennium
Challenge Corporation (MCC) for their support and guidance, and to the local MCA Project
team, especially Mario Ruy Marques, Carlos Mugoma and Ventura Mufume for their tireless
assistance in facilitating the data collection.
The views expressed herein do not necessarily reflect the opinions of the Mozambican Ministry
of Agriculture, Michigan State University, Millennium Challenge Corporation, United States
Department of Agriculture Foreign Agricultural Service, nor the Mozambican Millennium
Challenge Account Office.
The authors thank the following individuals for their contributions in the planning, coordination,
and execution of field research activities that underline this study:
The DNTF’s staff especially: Teresa Nube, Halima Selemane, Municipalities’ staff: Anlawe
Ahmade, Celso Come, Fiel Chiambe, Alfredo Munguambe, Deocleciano Manjate, Bonifacio,
Ussene Ali, Micas, Sigauque, Samuel Luciano Cheba, Santana, Jose Ernesto Muidumbe,
Marques, Elton Paulo, Cesar Come, Soares, Jose Mario, Zainadine, Cazula, SPGC’s staff: Silva
João, Cristiano Macario, Tiago Mirione, and Lazaro Mathlava; and HTSPE’s team: Bruno
Lopez, Xavier Lucas, José Ivo, André Pinheiro, and Odete Mugumela. Our special thanks goes
to Rafael Uaiene, Faculty member, MSU Department of Agricultural, Food and Resource
Economics (AFRE); Constantino Cuambe, Director of the Northern Research Zonal Center
within the National Institute for Agricultural Research, and Venancio Salegua, Socio-economist
within the Northeastern Research Zonal Center within the National Institute for Agricultural
Research.
Authors’ Affiliations:
Raul Pitoro, Research Associate, AFRE, MSU
Songqing Jin, Associate Professor, AFRE, MSU
Mywish Maredia, Professor, AFRE, MSU
Ellen Payongayong, Survey Specialist, AFRE, MSU
Gerhardus Schultink, Professor of International Resource Development and AgBioResearch,
and Project Director, CSUS, MSU

ii
Glossary
AFRE Department of Agricultural, Food and Resource Economics
CSUS Department of Community Sustainability
CENACARTA National Center for Cartography “Centro Nacional de Cartografia e
Teledetecção.”
DNTF National Directorate for Land and Forest
DUAT “Direito de Uso e Aproveitamento de Terra” or Land Use Right (an
official document provided by the land administration office providing
formalized, long-term use rights for a particular land parcel)
LAUs Land Administration Units
LIMS Land Information Management System
LTR Land Tenure Regularization
LSP Land Tenure Services Project, a component of the five-year compact
signed by the Millennium Challenge Corporation (MCC) and the
Republic of Mozambique aiming to establish a more efficient and secure
access to land by improving the local capacity in land administration.
MCA Millennium Challenge Account
MCC Millennium Challenge Corporation
MINAG Ministry of Agriculture
MSU Michigan State University
NLPAG National Land Project Advisory Group
SPGC “Serviços Provinciais de Geografia e Cadastro”, or provincial land
administrations offices
STATA Data Analysis and Statistical Software
iii
TABLE OF CONTENTS
Acknowledgement ........................................................................................................................................ i
Glossary ....................................................................................................................................................... ii
TABLE OF CONTENTS ........................................................................................................................... iii
LIST OF TABLES ...................................................................................................................................... v
LIST OF FIGURES ..................................................................................................................................... v
EXECUTIVE SUMMARY ........................................................................................................................ vi
1 Introduction ........................................................................................................................................ 1
1.1 Overview of the Land Project ......................................................................................... 1
1.2 Objectives of this report .................................................................................................. 2
2 Evaluation Design of the Institutional Strengthening Activities (ISA) of the Land Project............... 3
2.1 Overview of the activity being evaluated and expected impacts .................................... 3
2.2 Evaluation approach ....................................................................................................... 4
2.3 Identification issues ....................................................... Error! Bookmark not defined.
3 Data ..................................................................................................................................................... 5
3.1 Sampling ......................................................................................................................... 5
3.2 Geographic coverage of the IE and identifying comparison group ................................ 6
3.3 Data collection ................................................................................................................ 8
3.4 Data issues: Some useful lessons from the baseline data ............................................. 10
4 Baseline Data Findings ..................................................................................................................... 11
4.1 Number of Land Transactions ...................................................................................... 11
4.1.1 Number of land transaction over the years ............................................................ 11
4.1.2 Number of land transactions by land size ............................................................. 12
4.1.2.1 Land Size of those with DUATs by Land Use ................................................. 13
4.1.2.2 Land Size of those with DUATs over time ...................................................... 14
4.1.3 Number of Land Transactions by Land Use ............................................................ 15
4.1.3.2 Land Use of those with DUATs by land size ................................................... 16
4.1.3.2 Land Use of those with DUATs over time ....................................................... 17
4.2 DUAT Transaction times .............................................................................................. 20
4.2.1 Transaction time by parcel size ............................................................................. 20
4.2.2 Percentage of transactions within 90 day limit ..................................................... 22
4.2.3 Transaction time by land size ................................................................................ 22
4.2.4 Transaction times over the years ........................................................................... 23
4.3 Land Conflicts .............................................................................................................. 26
4.4 DUAT transfers ............................................................................................................ 26
4.5 Gender heterogeneity of key indicators ........................................................................ 29
5 Conclusions and Recommendations ................................................................................................. 32
6 Implications to Evaluation and Next steps ....................................................................................... 34
Annex 1: Records held in SPGC and Municipalities ................................................................................ 36
iv
Annex 2: Population by Municipality in the Project intervention area ..................................................... 37
Annex 3: Average number of DUATs registered per year in the Districts and Municipalities ................. 38
Annex 4. Provisional DUAT process (Authorization of application) ....................................................... 39
Annex 5: Propensity score matching ......................................................................................................... 40
Annex 6: Testing the logic framework and the contamination effect: Short-term Project effect.............. 42
Annex 7: Key indicators by gender of DUAT holder, by land size, by treatment group .......................... 43
Annex 8: Number of existing DUAT in the Districts and municipalities over time ................................. 44
References ................................................................................................................................................. 45
v
LIST OF TABLES
Table 1: Evaluation of Activity II ................................................................. Error! Bookmark not defined.
Table 2: Impact pathway for the Institutional Strengthening Activities (ISA) of the Land Project ................... 4
Table 3: Selection criteria met by the eight Municipalities selected for Land Project activities in four Northern
provinces ...................................................................................................................................................... 6
Table 4: Selection criteria met by the 12 Districts selected for Land Project activities in four Northern
provinces ...................................................................................................................................................... 6
Table 5: Selected treatment and control Municipalities .................................................................................. 7
Table 6: Selected control Districts ................................................................................................................. 7
Table 7: Summary on data requirements and analysis .................................................................................... 9
Table 8: Number of DUATs transacted by province by treatment group in rural and urban areas.................. 11
Table 9: Number of parcels with approved DUATs recorded by land size group .......................................... 13
Table 10: Area of parcels with DUATs in rural and urban areas by use by treatment group .......................... 14
Table 11: Area of parcels with DUATs in rural areas by use by treatment group .......................................... 14
Table 12: Average parcel area for DUAT transactions by land size category over time in the Districts and
Municipalities ............................................................................................................................................. 15
Table 13: Main use of parcel with DUATs in rural and urban areas ............................................................. 16
Table 14: Main use of parcels with DUATs by land size class in Districts.................................................... 16
Table 15: Percentage of District DUAT Transactions Conducted over Time by Main Use of Parcel
(<1,000ha) .................................................................................................................................................. 18
Table 16: Percentage of District DUAT Transactions Conducted over Time by Main Use of Parcel (1,001-
10,000ha) ................................................................................................................................................... 18
Table 17: Percentage of District DUAT Transactions Conducted over Time by Main Use of Parcel
(>10,000ha) ................................................................................................................................................ 19
Table 18: Percentage of DUAT Transactions Conducted Over Time by Main Use of Parcels in the
Municipalities ............................................................................................................................................. 19
Table 19: Average DUAT Transaction and delimitation time by use type by land size by treatment group ... 21
Table 20: Average DUAT Transaction time (days) in rural and urban areas by treatment group over time for
land size ..................................................................................................................................................... 23
Table 21: Average DUAT Transaction time (days) in rural and urban areas by treatment group over time by
land size group............................................................................................................................................ 25
Table 22: Percentage of land DUAT transfers by gender of the landholder by treatment group ..................... 26
Table 23: Percentage of transferred DUATs by land use, land size overtime ................................................ 28
Table 24: Transaction times (in days) for transferred DUATs by land use, land size over time ..................... 28
Table 25: Outcome indicators by gender of DUATs’ owner in the Districts and Municipalities .................... 29
LIST OF FIGURES
Figure 1: Trend of DUAT transfers in the selected Municipalities ........................................................... 27
vi
EXECUTIVE SUMMARY
This study aims at establishing a baseline for the impact evaluation of the MCA-MCC Land
Project’s institutional strengthening of the land administration system in Mozambique. The
assessment focuses on whether the activity resulted in changes to 3 key variables: a) number of
land conflicts as result of formalization of land use rights, b) number of land transactions and c)
transaction time transpired to apply for a DUAT, specifically the amount of time between the
DUAT application date and issuance date for clear legal rights for access and land use by
Municipalities and provincial land administration offices (SPGCs). The number of land
transactions, such as formal land use right application and land use right transfers, is an
indicator of land market growth, while the “DUAT transaction” time is an indicator of
efficiency in providing land administration services. Using a quasi-experimental design, this
evaluation will measure changes in these variables using the administrative records at Land
Administration Units (LAUs) within Municipalities and Districts. Essentially, this assessment is
to use difference-in-difference (DID) approach to measure the difference of outcome indicators
between participants (treatment group) and nonparticipants (comparison group) before and after
program intervention.
1
Institutional Strengthening Impact Evaluation
Baseline Report for the Land Administration Interventions in Districts and Municipalities
in Northern Mozambique under MCA-Mozambique’s Land Tenure Services Project
1 Introduction
This report is organized as follows: Section 1 provides an introduction, Section 2 presents and discusses
the methodology; Section 3 describes the data used; Section 4 presents and discusses the main results
focusing mainly on the treatment-control comparison on the main outcome indicators; Chapter 5 draws
conclusions and provides recommendation; and finally, Section 6 presents the main challenges faced and
lays out the next steps towards the proposed impact evaluation.
1.1 Overview of the Land Project
The Government of the Republic of Mozambique and the Millennium Challenge Corporation (MCC), on
behalf of the United States Government, signed a Compact Agreement (which entered into force on
September 22, 2008) for a US $507 million grant to be implemented over a 5-year period. The overall
objective of the proposed Program was to reduce poverty through economic growth in the four Northern
Provinces of Mozambique (Niassa, Cabo Delgado, Nampula, and Zambézia). The Program involved
crucially needed investments in water, sanitation, and transport infrastructure, land tenure security,
agriculture, capacity building, and institutional strengthening.
The Land Tenure Services Project (or simply the “Land Project”) of the Mozambique MCA compact
aims to establish more efficient and secure access to land by improving the policy and regulatory
framework, helping beneficiaries meet their immediate needs for registered land rights and better access
to land for investment. The aim of the project was to improve the overall land governance system not only
to formalize/provide DUATs on parcels. More specifically, the Land Project’s objectives are to (i)
increase the level and value of the investment on land; (ii) expand access to land; (iii) reduce the costs
associated with acquiring land user rights; and (iv) resolve and prevent conflicts over land. Investments
are targeted to all four Northern Provinces, at all levels of administration – National, Provincial, and
District / Municipal – and across a range of beneficiaries, including individual rural landholders, rural
communities, urban landholders, and domestic and international investors.
The Land Project consists of three main types of activities and several component activities that will be
implemented at different levels of geopolitical aggregation (i.e., national, provincial, District, Municipal,
priority/“hot spots” areas, etc.). Overall, the Land Project works on improving policy, upgrading public
land administration agencies (the title registry and cadastre), and facilitating site-specific land access. The
three main types of activities described above (Activities I, II and III) address concerns widely shared
across the private sector, government, and civil society with solutions that bring together their diverse
perspectives. Benefits from the Land Tenure Services Project are projected to accrue to (i) rural
households; (ii) urban households; (iii) communities; and (iv) business enterprises and investors in the
form of increased income, lower transaction costs, and greater investment opportunities.
The specific activities are described as below:
Policy Monitoring Activity (Activity I) (all activities under Activity I were implemented at the national
level): Support for an improved policy environment, including addressing implementation problems for
2
the existing land law and engaging in the regulatory review to improve upon it. Examples of activities
include:
1. Development of a national land administration regulatory framework and needs assessment
2. Formation of Land Policy Consultative Forum that will provide technical and logistical support to
monitor progress on land legislation reform and implementation. It is worth noting that little occurred
beyond needs assessment and holding of the land policy consultative forum.1
3. A broad campaign of public education, outreach and increasing awareness of non-judicial dispute
resolution methods
4. Expanded program on legal and judicial training to paralegals
5. Advisory services to DNTF
Capacity Building Activity or Institutional strengthening (Activity II) 2: Building the institutional
capacity to implement policies and provide quality public land-related services. Examples of activities
under Activity II include:
1. Development of LIMS (national level)3
2. Professional development and training, and upgrading of facilities (4 Provincial SPGCs, 12
selected District land service offices and 8 selected Municipalities)
3. Technical assistance for cadastral development in selected municipalities (8 selected
Municipalities)
Site-specific Activity (Activity III)4: Facilitating access to land use by helping people and business with
(i) clear information on land rights and access; (ii) resolution of conflict with more predictable and speedy
resolution of land and commercial disputes – which in turn creates better conditions for investment and
business development; and (iii) registering their grants of land use (land titles to long-term or perpetual
use rights). Examples of activities include:
1. Mapping and needs assessment and rights inventory exercise (all 12 selected Districts and 8
Municipalities) and piloting an approach to area-wide registration of land rights in “Priority areas”;
streamlining investor and farmer access to land by making available simple informational tools and
guidelines (selected hotspot areas within the 12 Districts and 8 Municipalities). This includes but not
limited to gathering the existing data from each province up to end December 2008 and the
assessment of gaps and inconsistencies to identify the specific needs. 2. Support of the Community Land Fund (ITC) (3 provinces – Zambezia, Nampula, and Niassa). Initially
established by a coalition of donors and implemented in Inhambane, Cabo Delgado, and Manica
provinces, in 2009 it was replicated and funded by the Land component of MCA to support the
community land delimitation, registration, negotiations, and resource planning (MINAG, 2011c).
1.2 Objectives of this report
1 Legislation such as ability to transfer a DUAT was never reformed, which led to continued difficulties in
transferring land rights. 2 With respect to LIMs, it was first planned for project areas but then was expanded to all 10 provinces. LIMS
training, however, was supposed to be covered by other donors and not the project while the technical assistance and
upgrading occurred across 4 provinces and 12 Districts and 8 Municipalities within these provinces 3 The further development of LIMS was initially planned to be installed in DNTF, 4 SPGCs, and 8 Municipalities.
Then, it was later expanded to another 6 SPGCs on the basis of a needs assessment early 2013, rendering it a
national coverage (10 provinces). Complementary activities such as training, especially on the additional 6 SPGCs
was funded by other donors given the insufficient time to be completed this activity with MCC funding. 4 MSU is evaluating the Activity 3 in separate evaluation reports.
3
This report summarizes the baseline evaluation of the impact of Activity II- the institutional strengthening
and capacity building in the District and municipal land offices. As indicated above, Activity II consists
of three components: 1) Institutional strengthening of land administration at the national level and
outreach and sensitization; 2) Institutional Strengthening and Support to the Provincial Cadastral Offices
in the Northern Provinces; and 3) Support to the Cadastral Development in the Municipalities of the
Northern Provinces.These efforts aimed to produce the following outputs: Reduced processing time to
obtain DUAT; Increased number of people trusting and utilizing formal land system; increased number of
formal land transactions5, increased number of females entering the land administration profession, and
increased number of land users trained.
Given that the strengthening of the municipal or district land offices is expected to lead to an improved
and increased use of the formal land registration system, the goal of this study is to evaluate the impact of
the institutional strengthening of the land administration system in Mozambique, particularly in (1)
reducing DUAT transaction time, 2) increasing the number of formal land DUAT-related land transfers
— both first time DUATs and transfers, as well as 3) track whether land regularization activities in
Activity 3 helped reduce the number of land conflicts. What sets this evaluation apart from others is that it
does not rely on household surveys but on administrative data to establish the control/treatment groups.
Earlier attempt to use household survey was not successful to understand the big picture as it failed to
capture a sufficient sample size of those undertaking formal transactions.
There was an earlier evaluation attempt using the national agricultural survey (TIA) data, but it was not
effective due to lack of representativeness of the MCC interventions sites in the TIA data at the provincial
level (insufficient sample size of those undertaking formal transactions). Therefore, the results of that
evaluation would only give an overall trend which is not representative for lower administrative unit-level
interventions.
2 Evaluation Design of the Institutional Strengthening Activities (ISA) of the Land Project
2.1 Overview of the activity being evaluated and expected impacts
The institutional strengthening activities (ISA) to be evaluated are a subset of activities under Activity II
that include professional development and training, upgrading facilities, and assistance to the
development of municipal and district LIMS in selected municipalities and districts in 4 Northern
provinces (column 1 of table 3). Ideally, the impact evaluation of the ISA is to compare outcomes
between the situation “with” ISA and the situation “without” ISA for a given municipality or district.
Unfortunately, it is not possible to observe the situation “with” ISA and the situation ‘without’ ISA for
any given municipality or district in the same time. In practice, the effects of ISA is estimated by
comparing outcomes between municipalities (districts) receiving ISA and those not receiving ISA before
and after the intervention. In order to argue that the identified effects of ISA through the evaluation
exercise described in this section to be causal, we implicitly assume that all the other nation-wide
activities under Activity I and Activity II have the same effects across municipalities and districts and the
change in outcomes between the treatment and control municipalities/districts remain constant in absence
of the intervention. We will come back to the evaluation method later.
For better exposition of the intended goal of this evaluation effort, we present in table 2 the impact
pathway of the ISA, focusing on linking the activities to short-term outputs and then consequently to the
outcomes the intervention aims to achieve. As indicated in table 2, the ISA (i.e., investments made to
upgrade the municipal or district land administration systems) would lead to a number of outputs at the
5 Similarly to the Lesotho Project, the thought was that only those in middle to upper class would increase number of
formal land transactions as those are the ones with the means and interest in accessing the system.
4
municipal or district level (e.g., increased number of clients aware of the land law, increased number of
Cadastral officers trained, upgraded facilities). The ultimate objective of these activities is to increase
efficiency and effectiveness of the municipal and district land administration offices which is explicitly
measured by a number of outcome indicators the key of which include (1) reduced processing time to
obtain DUAT, (2) reduced cost of obtaining DUAT; (3) increased number of DUATs demanded, (4)
increased number of land transactions, and (5) reduced incidence of land disputes.
Table 2: Impact pathway for the Institutional Strengthening Activities (ISA) of the Land Project
Activities Outputs Outcomes Impact indicators
Professional
development and
training and further
development of national
level LIMS
Technical assistance to
the upgrading of
facilities and cadastral
development (ISA)
Outreach of Land Law
and use rights conducted
Comprehensive approach
to professional
development and training
implemented
Improvement of the
National Land
Administration System
(LIMS)
Increased awareness of
Land Law
Increased number of
Cadastral officers
trained
Upgraded facilities and
IT equipment
Improved/more
effective operational
procedures
Reduced processing time
to obtain a DUAT;
Reduced cost of
obtaining a DUAT;
Increased demand for
DUATs;
Increased number of land
transfers;
Reduced number of land
disputes.
2.2 Evaluation approach
By conducting an impact evaluation of the different activities under the Land Project (i.e., site-specific
hotspot activities in urban areas, site-specific activities in rural areas, and institutional strengthening
activities), we intend to quantitatively estimate the effect on population attributes due to the
implementation of the relevant activities under the Land Project. Specifically, we use the difference-in-
difference (DID) approach to evaluate the three separate evaluations – evaluation of the institutional
strengthening activities, evaluation of the urban hotspot activities and the evaluation of the rural hotspot
activities.6
The DID approach essentially measures the difference of outcome indicators between participants
(treatment group) and nonparticipants (comparison group) before and after program intervention. In the
context of panel data (a cross-sectional times series , such as a baseline survey and a follow-up survey of
the same communities or households), DID is a common and valid method to estimate the impact of an
intervention if the assumption that unobserved heterogeneity is time invariant and uncorrelated with the
treatment effect is satisfied. While the main advantage of DID is its ability to allow for the selection of
unobserved factors, its assumption of constant selection bias over time may be unrealistic in practice.
Let Y be the outcome of interest (e.g., total number of DUATs issued or the average time lapse between
application and issuance of a DUAT). Our goal is to evaluate the impact of the institutional strengthening
of LIMS on Y. Specifically, we can achieve this evaluation through DID as:
DID = E[Y1T-Y0
T]-E[Y1C-Y0
C] (1)
where the superscripts T and C refer to treatment and control units respectively; the subscripts 1 and 0
refer to time period 1 (after the intervention) and time period 0 (the baseline period), respective. The
regression counterpart of (1) with multiple years of data before and after the intervention can be written as
the following:
6 For the rural site-specific and urban site-specific hotspot activities, we can also combine the DID with the
propensity score matching (PSM) method to further improve the reliability of the estimated impacts.
5
Yij = α + βTj + γt + δ(Tij*t) + ρXi + εij (2)
Where, subscript i stands for a specific district or municipality, j for a specific output, Ti is the treatment
dummy variable (=1 for treatment districts or municipalities, =0 for control districts/municipalities), t is a
vector of time dummies for different years, Xi is a vector of other district/municipality or parcel level
control variables, β captures the regional difference between the treatment and control groups, γ captures
the common time trend effects over time, and δ is the vector of parameters of interest, measuring the
impact of institutional strengthening program on outcomes of interest (e.g., time reduction in the process
of DUAT issuance), and εil is the idiosyncratic error that is assumed to be normally distributed with mean
zero and unity variance. To test that the δs corresponding to all the pre-intervention years are jointly
equal to zero is to check the validity of DID method. (the “parallel” assumption under DID).
DID is widely used in the impact evaluation of policy interventions especially when the RCT-based data
are not available (see discussion by Duflo, Glennerster, and Kremer, 2007; Ravallion, 2005). The DID
approach was also used by similar studies on land titling projects in other countries (Deininger et al.
,2011, Di Tella, 2007; Field, 2007).
3 Data
3.1 Sampling
The sampling strategy adopted for this evaluation consists of three main steps described as follows:
Step 1: used the Land Administrative Units (LAUs) (i.e., districts/municipalities) as sampling units. MSU
used the list of DUATs/parcels registered in those units (administrative records) over the past 31 years as
the sampling frame;
Step 2: based on the sampling frame, MSU divided the DUATs registered into two groups, namely; one
group consisting of DUATs registered sporadically pre-project implementation (20117) and a second
group composed of those DUATs registered after the project implementation was completed (e.g. October
2013). This strategy is intended to compare the processing time of sporadic DUAT registration before and
after the intervention because the systematic registration under the capacity building and systems
installation could bias time. For this reason, any land registrations occurred between January 2012 and
September 2013 were not used as it may not be possible to separate systematic project registration from
sporadic registration when the two types of registrations occur at the same time and place, and project
contractors were still aiding land officers with processing DUATs. However, we believe that 20118, is an
ideal time threshold period to capture sporadic registration. We provide more discussion in section 3.2.
Step 3: To attribute the impact to MCC’s interventions, MSU considered the districts/municipalities
where MCC had interventions as the treatment sites and selected districts/municipalities that share similar
characteristics to those of the treatment sites (but were not targeted under Activity II) as our control
group.
7 We use 2011 of the cut-off point based on the assumption that the LSP project activities under Pillar II would have been
implemented by December 2011. This is most likely not a realistic time frame. Hence the exact cut-off time frame (T) was
determined based on discussions with MCA Land team. 8 According to MINAG (2010c), the technical assistance for the land component of the MCA was planned in the following four
stages: a) Inception: June – September 2009; b) Needs Assessment: October 2009 – October 2010; c) Implementation: November
2010 – March 2013; and Exit Strategy: April 2013 – May 2013.
6
3.2 Geographic coverage of the IE and identifying comparison group
The ISA was implemented in all the 8 municipalities and 12 districts as listed in Tables 1 and 2. Because
the municipalities and districts serve very different clients who demand DUATs for different types of land
(urban land versus rural land), it makes more sense to evaluate the ISA in municipalities and districts
separately. Based on the discussion in the previous section, one of the critical steps for a rigorous impact
evaluation is to identify the reliable counterfactual group (control group). According to Tables 2 and 3,
the 8 municipalities and 12 districts were chosen according to a wide variety of selection criteria. It is
important to identify the control municipalities/districts that face similar issues as the treatment
municipalities/districts. We classify all the 8 selected treatment municipalities into seven different groups
(A, B, C, D, E, F, and G), and the twelve districts into seven different groups (I, II, III, IV, V, VI, VII) as
well, according to the selection criteria and similarity in geographic location and the condition of local
land administration system prior to intervention. The classification of the Municipalities and Districts is
indicated in the last column of Tables 3 and 4.
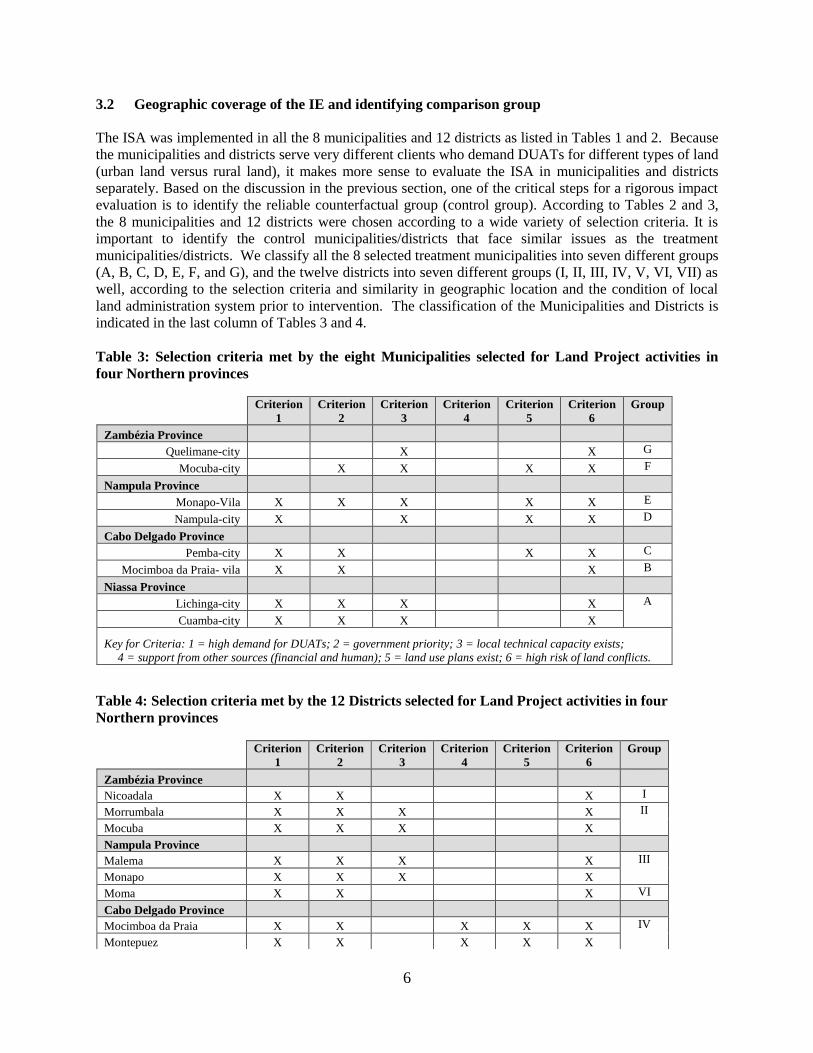
Table 3: Selection criteria met by the eight Municipalities selected for Land Project activities in
four Northern provinces
Table 4: Selection criteria met by the 12 Districts selected for Land Project activities in four
Northern provinces
Criterion
1
Criterion
2
Criterion
3
Criterion
4
Criterion
5
Criterion
6
Group
Zambézia Province
Quelimane-city X X G
Mocuba-city X X X X F
Nampula Province
Monapo-Vila X X X X X E
Nampula-city X X X X D
Cabo Delgado Province
Pemba-city X X X X C
Mocimboa da Praia- vila X X X B
Niassa Province
Lichinga-city X X X X A
Cuamba-city X X X X
Key for Criteria: 1 = high demand for DUATs; 2 = government priority; 3 = local technical capacity exists;
4 = support from other sources (financial and human); 5 = land use plans exist; 6 = high risk of land conflicts.
Criterion
1
Criterion
2
Criterion
3
Criterion
4
Criterion
5
Criterion
6
Group
Zambézia Province
Nicoadala X X X I
Morrumbala X X X X II
Mocuba X X X X
Nampula Province
Malema X X X X III
Monapo X X X X
Moma X X X VI
Cabo Delgado Province
Mocimboa da Praia X X X X X IV
Montepuez X X X X X
7
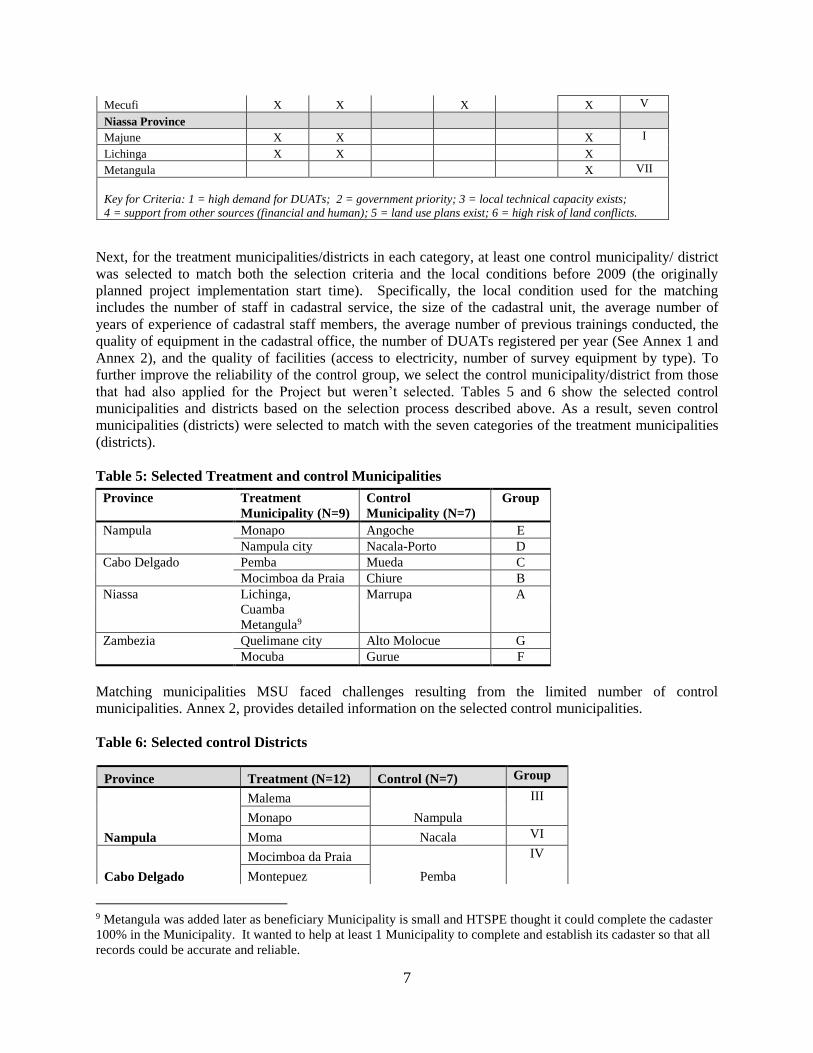
Next, for the treatment municipalities/districts in each category, at least one control municipality/ district
was selected to match both the selection criteria and the local conditions before 2009 (the originally
planned project implementation start time). Specifically, the local condition used for the matching
includes the number of staff in cadastral service, the size of the cadastral unit, the average number of
years of experience of cadastral staff members, the average number of previous trainings conducted, the
quality of equipment in the cadastral office, the number of DUATs registered per year (See Annex 1 and
Annex 2), and the quality of facilities (access to electricity, number of survey equipment by type). To
further improve the reliability of the control group, we select the control municipality/district from those
that had also applied for the Project but weren’t selected. Tables 5 and 6 show the selected control
municipalities and districts based on the selection process described above. As a result, seven control
municipalities (districts) were selected to match with the seven categories of the treatment municipalities
(districts).
Table 5: Selected Treatment and control Municipalities
Province Treatment
Municipality (N=9)
Control
Municipality (N=7)
Group
Nampula Monapo Angoche E
Nampula city Nacala-Porto D
Cabo Delgado Pemba Mueda C
Mocimboa da Praia Chiure B
Niassa Lichinga, Marrupa A
Cuamba
Metangula9
Zambezia Quelimane city Alto Molocue G
Mocuba Gurue F
Matching municipalities MSU faced challenges resulting from the limited number of control
municipalities. Annex 2, provides detailed information on the selected control municipalities.
Table 6: Selected control Districts
9 Metangula was added later as beneficiary Municipality is small and HTSPE thought it could complete the cadaster
100% in the Municipality. It wanted to help at least 1 Municipality to complete and establish its cadaster so that all
records could be accurate and reliable.
Mecufi X X X X V
Niassa Province
Majune X X X I
Lichinga X X X
Metangula X VII
Key for Criteria: 1 = high demand for DUATs; 2 = government priority; 3 = local technical capacity exists;
4 = support from other sources (financial and human); 5 = land use plans exist; 6 = high risk of land conflicts.
Province Treatment (N=12) Control (N=7) Group
Nampula
Malema
Nampula
III
Monapo
Moma Nacala VI
Cabo Delgado
Mocimboa da Praia
Pemba
IV
Montepuez
8
3.3 Data collection
Based on the discussion above, identifying the program effects of the institutional strengthening activities
will depend on administrative data from the treatment and control municipalities or districts before and
after the program implementation. The first important question related to data collection is how many
years of data are needed for the analysis? In general, we would like to have as many years as possible
based on the availability of the administrative data. The MSU visited Mozambique in the summer of
2013 and collected the baseline data for the study. We collected administrative land record data as early
as in 1981 with the assistance of each land administrative office. The primary purpose of collecting data
from the pre-reform years is to allow the test for pre-trend difference between the treatment and control
municipalities/districts. While it is not necessary to have data from the distant past to test/control for the
pre-program trend, it is beneficial to have as many years as possible for the analysis
On the other hand, more care is needed when it comes to the data from the post-reform period.
Specifically, we cannot use the data from the years during and immediately after the implementation of
the project activities because of the contamination effects of the program (i.e., artificially speeding DUAT
processing and lowering the cost of DUAT issuance), it is important to exclude the data from those years.
While there is no standard rule as to how many years should be excluded, we think it is reasonable to
assume that the contamination effects is unlikely to be significant after two years from the completion of
the intervention. During the visit to collect the baseline data for this project, we found that the
implementation year of the institutional strengthening activities was 2012-2013 in almost all the
municipalities or districts, so the administrative land record data from 2012 to 2014 was excluded. We did
not account for the pre-project material “contamination” resulting from outreach or preparation activities
that took place before 2012 as we felt that was minimal. As for when the end-line data collection after
these few years of buffer period should be implemented, one critical rule is that the data collection should
be conducted before any of the control areas starts to receive the (spillover) effects of a similar program.
We recommend the end-line survey to be conducted in 2018/2019, so we have about 4-5 years useful
post-reform data for analysis.
The second important question is which variables in the land administrative data set should be
used? While ideally parcel level characteristics are preferred together with detailed owner characteristics
of those applying for DUAT, we are facing the reality of a limited number of variables available in the
administrative land records. To meet our objectives to evaluate the impacts of the institutional
strengthening activities on three main outcome indicators, namely, the total number of DUATs issued, the
time to process a DUAT (from application to issuance), and the number of land transfers (though we are
interested in the monetary cost, information on cost is not available), we collected administrative record
data on: (1) time when the application was filed; (2) time when a DUAT was issued; (3) time when each
land transfer occurred. Besides these key variables, we also have data on the following variables:
(1) Area of the parcel
(2) The main use of a parcel from municipality data: residence, commerce, industry, social/religion,
public services, residence & commerce.
Mecufi Palma V
Niassa
Majune
Cuamba
I
Lichinga
Metangula Mandimba VII
Nicoadala I
Zambézia Morrumbala Alto Molocue II
Mocuba
9
(3) The main use of a parcel from SPGC data: agricultural production (annual & perennial crops),
forest plantations, livestock production (cattle & others), public services, commerce & industry,
residence, tourism, social & religion, crop-livestock production, community.
(4) Gender of the DUAT holder
To address the objectives of the study, two baseline data sets: the administrative land record data on urban
land from the municipal cadastral office (for the municipality evaluation) and administrative land record
data on rural land from district SPGC offices. While the administrative land record data from the SPGC’s
offices were available in digital form, the data from municipal cadastral offices are analog records. For
the baseline data collection, it took little effort to copy the digitized data from district SPGC offices, but a
lot of time and effort converting the paper form land administrative data from the municipal cadastral
offices into digital form— For the transaction times, the as application date-stamped and time approved
by the government data was retrieved from the administrative records and municipalities land
administrative units, while the DUAT secondary transactions were collected only on the municipality
units as the SPGC data does not systematically record this type of information.
In 2014, to establish pre-intervention baseline data MSU collected administrative records in both ,
municipalities and districts covering 1981 to 2011. MSU retrieved a total of 5,785 previously digitized
district records by SPGCs (in Access database) containing records for the four northern provinces
covering 57 Districts from 1988 to 2014. But, for our analysis, we discarded records with incomplete
information, location and period beyond the study focus and remained with only 1,997 district records
covering 1988 to 2011 from 12 treatment and 7 control districts with complete information, including area
of parcel, main use of a parcel, gender of the DUAT holder, data of DUAT application, and data of
DUAT authorization. Note that these records do not represent all records but a subsample the evaluation
sites. Several records were incomplete and from a period outside the target our study period.
For the Municipality data MSU copied 4,035 municipal records to PDF files from sampled nine treatment
(includes the additional Municipality added later by HTSPE as indicated earlier) and seven control
Municipalities from 1988 to 2011. After discarding records with incomplete information, location and
period beyond the study focus and remained with only 3,774 Municipality records which are used for the
analysis. Table 6 summarizes the data requirements, availability and analysis performed.
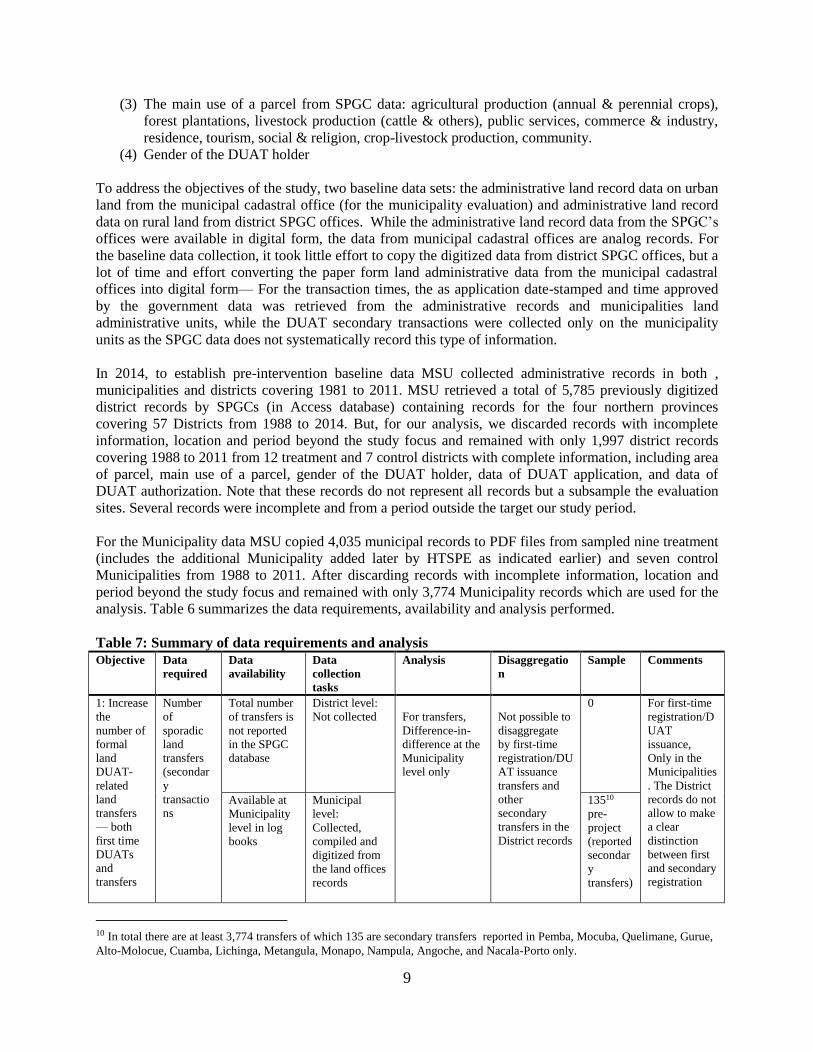
Table 7: Summary of data requirements and analysis
Objective Data
required
Data
availability
Data
collection
tasks
Analysis Disaggregatio
n
Sample Comments
1: Increase
the
number of
formal
land
DUAT-
related
land
transfers
— both
first time
DUATs
and
transfers
Number
of
sporadic
land
transfers
(secondar
y
transactio
ns
Total number
of transfers is
not reported
in the SPGC
database
District level:
Not collected
For transfers,
Difference-in-
difference at the
Municipality
level only
Not possible to
disaggregate
by first-time
registration/DU
AT issuance
transfers and
other
secondary
transfers in the
District records
0 For first-time
registration/D
UAT
issuance,
Only in the
Municipalities
. The District
records do not
allow to make
a clear
distinction
between first
and secondary
registration
Available at
Municipality
level in log
books
Municipal
level:
Collected,
compiled and
digitized from
the land offices
records
13510
pre-
project
(reported
secondar
y
transfers)
10 In total there are at least 3,774 transfers of which 135 are secondary transfers reported in Pemba, Mocuba, Quelimane, Gurue,
Alto-Molocue, Cuamba, Lichinga, Metangula, Monapo, Nampula, Angoche, and Nacala-Porto only.
10
2A:
Reduce
DUAT
transaction
time for
first-time
registratio
ns
DUAT
processing
time for
sporadic
first-time
registratio
ns
The District
level records
are available
and already
digitized11.
District level:
Retrieved from
the SPGCs data
base
Difference-in-
difference at the
Municipalities
and Districts
levels
Disaggregated
by
residential/com
mercial and
urban/rural
1,997
District
cases
pre-
project
valid
cases
In the
Municipality,
DUAT
processing
time is
available in
paper files
though Not
Digitized
Municipal
Level:
Collected and
digitized
3,774
municipa
l pre-
project
valid
cases
2B:
Reduce
DUAT
transaction
time for
secondary
registratio
ns
DUAT
processing
times for
sporadic
secondary
registratio
ns
(transfers
and other
secondary
transactio
ns)
Not available
in Districts
Not collected N/A N/A 0 The
secondary
transactions
are not clearly
reported in
the
administrative
records
3: track
whether
the project
interventio
ns helped
reduce the
number of
land
conflicts
Number
of land
conflicts
Available in
paper log
book in
Municipality
in Mocimboa
da Praia only
Collected N/A N/A Formally
registere
d two12
between
2006 and
2011
Limited data
availability
for a rigorous
analysis
N/A: Not applicable
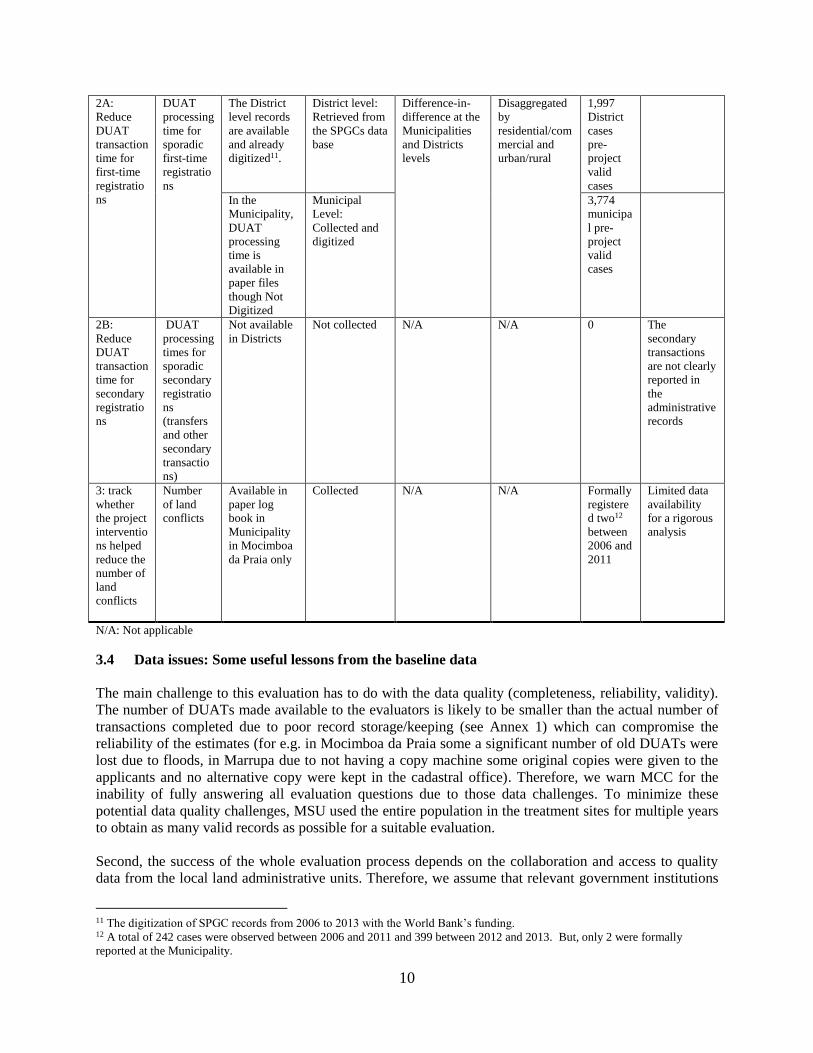
3.4 Data issues: Some useful lessons from the baseline data
The main challenge to this evaluation has to do with the data quality (completeness, reliability, validity).
The number of DUATs made available to the evaluators is likely to be smaller than the actual number of
transactions completed due to poor record storage/keeping (see Annex 1) which can compromise the
reliability of the estimates (for e.g. in Mocimboa da Praia some a significant number of old DUATs were
lost due to floods, in Marrupa due to not having a copy machine some original copies were given to the
applicants and no alternative copy were kept in the cadastral office). Therefore, we warn MCC for the
inability of fully answering all evaluation questions due to those data challenges. To minimize these
potential data quality challenges, MSU used the entire population in the treatment sites for multiple years
to obtain as many valid records as possible for a suitable evaluation.
Second, the success of the whole evaluation process depends on the collaboration and access to quality
data from the local land administrative units. Therefore, we assume that relevant government institutions
11 The digitization of SPGC records from 2006 to 2013 with the World Bank’s funding. 12 A total of 242 cases were observed between 2006 and 2011 and 399 between 2012 and 2013. But, only 2 were formally
reported at the Municipality.
11
responsible for granting the access to those data will keep records systematically and easily accessible
promptly once the appropriate clearance to access them is obtained.
Third, out of 16 municipalities, MSU visited, only the Mocimboa da Praia Municipality had well-
maintained records on land conflicts, preventing any rigorous analysis of land-related conflict.
Finally, we are not able to evaluate the impacts of this program on cost savings associated with DUAT
process or the number of land disputes/conflicts because the administrative data have no information on
these variables. While collecting information on these important variables will not help us much in this
impact evaluation due to the lack of this information in the baseline, it will be valuable to compare
whether the cost and disputes (were reported) are indeed lower in municipalities or districts that were
affected by the institutional strengthening activities, especially with the assumption that the differences
between the treatment and control groups prior to the intervention were similar.
4 Baseline Data Findings
Below follows summary of findings from land records accessed in 2013 covering all historic records of
sporadic land use rights from 1981-2011 in the 20 treatment and 20 control areas. Data analysis is
provided by municipality and districts—the two levels of data collected. Results on land used for
communities should be interpreted with care. As per local legislation, there is no DUAT for communities
but associations or other organized collective groups can apply for DUAT. Communities register their
land use rights through a completely different mechanism, the community land delimitation (CLD). The
DUAT transaction times results reported referring to first-time transactions in the districts and both first
time and transfers in the municipalities.
The results are sequentially organized in six distinct sections as follows: (1) the number of land
transactions (by land size, by use, over the years); (2) Description of land parcels with DUATs; (3)
DUAT transaction times (by land size, by use, over the years; and 90 day limit); (4) the number of land
conflicts; (5) the number of land transfers; and (6) the heterogeneity of the key variables by the gender of
the DUAT holder.
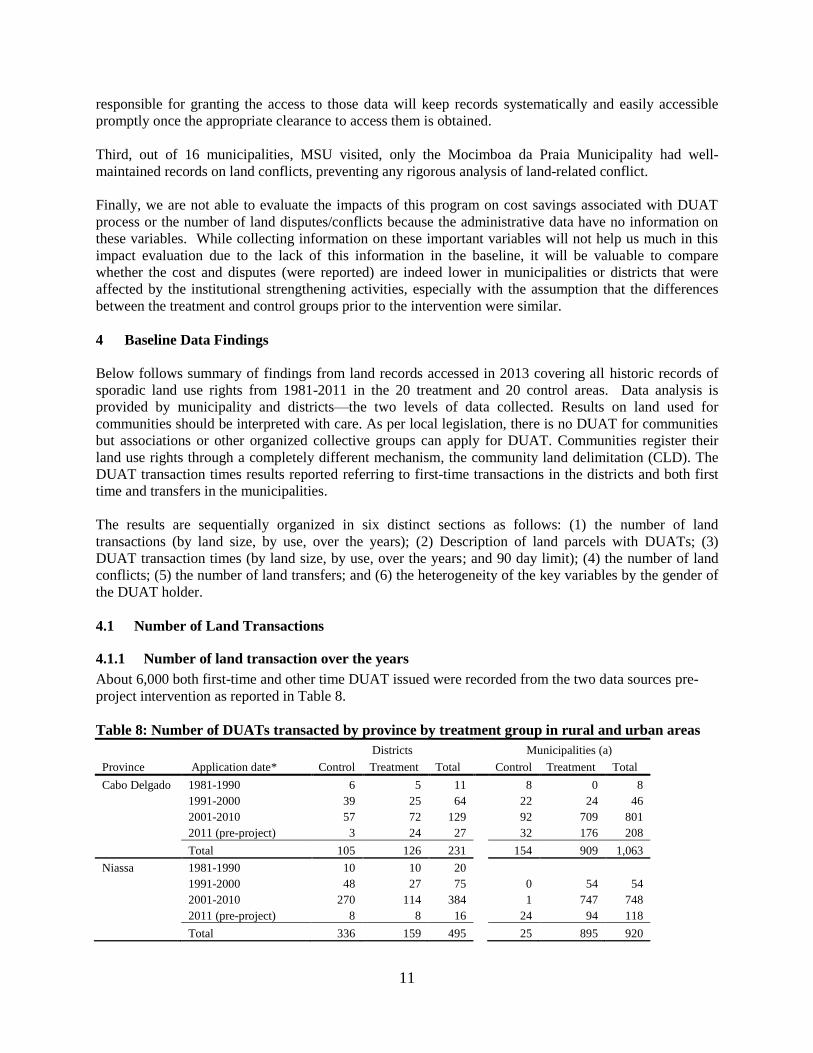
4.1 Number of Land Transactions
4.1.1 Number of land transaction over the years
About 6,000 both first-time and other time DUAT issued were recorded from the two data sources pre-
project intervention as reported in Table 8.
Table 8: Number of DUATs transacted by province by treatment group in rural and urban areas
Application date*
Districts
Municipalities (a)
Province Control Treatment Total
Control Treatment Total
Cabo Delgado 1981-1990 6 5 11
8 0 8
1991-2000 39 25 64
22 24 46
2001-2010 57 72 129
92 709 801
2011 (pre-project) 3 24 27
32 176 208
Total 105 126 231
154 909 1,063
Niassa 1981-1990 10 10 20
1991-2000 48 27 75
0 54 54
2001-2010 270 114 384
1 747 748
2011 (pre-project) 8 8 16
24 94 118
Total 336 159 495
25 895 920
12
Zambezia 1981-1990 0 88 88
1991-2000 1 163 164
5 8 13
2001-2010 47 616 663
205 312 517
2011 (pre-project) 6 54 60
86 55 141
Total 54 921 975
296 375 671
Nampula 1981-1990 0 15 15
0 8 8
1991-2000 12 41 53
46 122 168
2001-2010 43 144 187
249 425 674
2011 (pre-project) 28 13 41
226 44 270
Total 83 213 296
521 599 1,120
Total 578 1,419 1,997
996 2,778 3,774
Source: Authors calculations from SPGC data, 2013; Municipalities Data, 2013 and 2014
* The records collected are from 1988 to2011. Data presented in decades but for the case of municipality, the first
decade (1980-1990) refers to 1988-1989 because data for earlier years are not available. We intentionally isolated
2011 to measure the potential material contamination due to outreach activities prior to the actual intervention.
The number of DUAT transactions in districts and municipalities within the four provinces varies across
provinces and treatment status. Results in Table 7 show that the largest number of DUAT transactions
was observed in Zambezia and Niassa provinces for rural districts and in Cabo Delgado and Niassa
provinces for municipalities. There are also huge differences in numbers of transactions/DUATs between
control and treatment (996 vs 2778 in municipalities and 578 vs. 1419 for districts). Part of the
differences could be resulted from the fact that there are more treatment districts/communities than
control districts/communities. And part of the reason is that the demand for transactions/DUATs has
historically been higher in the treatment districts/communities than the control districts/communities,
suggesting that the ISA intervention targeted at areas with more economic potential.
These differences have an implication on the quality of evaluation. Ideally, we would like the number of
transactions/DUATs to be balanced between treatment and control sites, as in the case of randomized
controlled intervention. If the balance is not achieved, specific econometrics technique is needed in order
to address the pre-program biases. The DID approach discussed earlier allow for the pre-program
difference between the treatment and control sites as long as the difference is constant over time in
absence of the program. The constant difference over time is known as the “parallel assumption” in DID.
Given we have many years of data before the intervention, we checked the validity of this assumption by
running a simple regression of the number of transactions/DUATs (as well as other variables) on year
dummies, treatment dummy and the interaction terms of the year dummies and treatment dummy and
found that the coefficients of the interaction terms are jointly not significant in the Districts, suggesting
that the parallel trend assumption is satisfied.
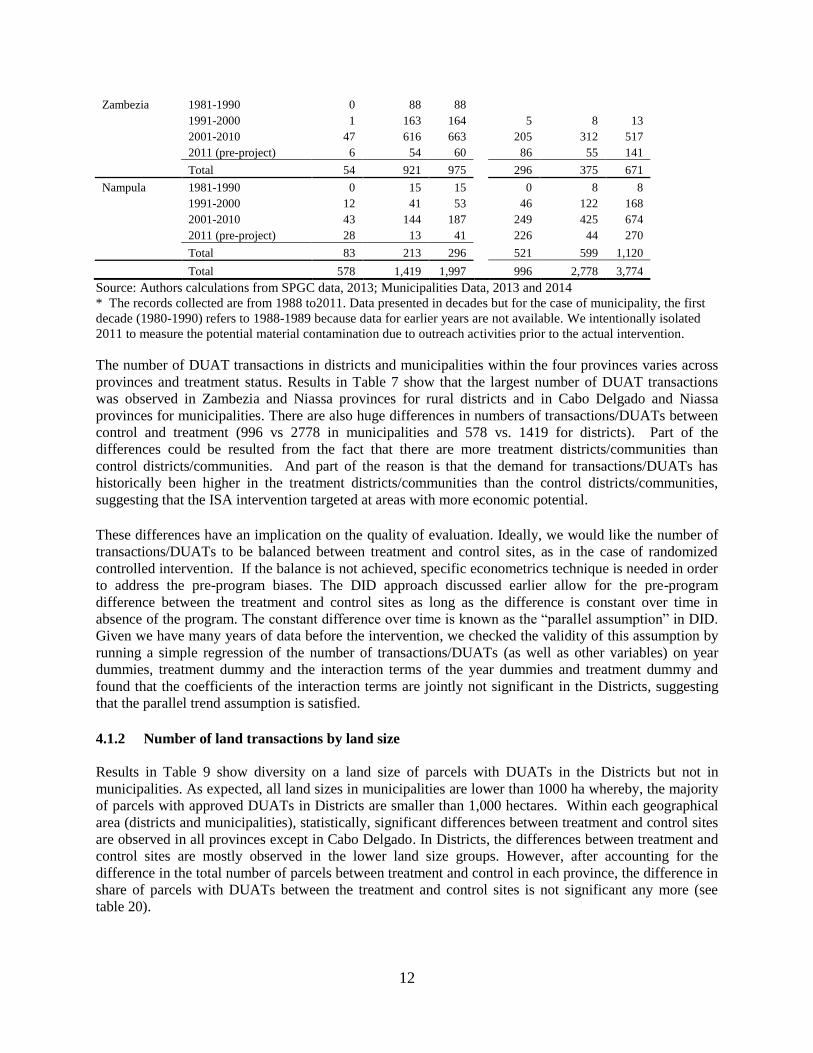
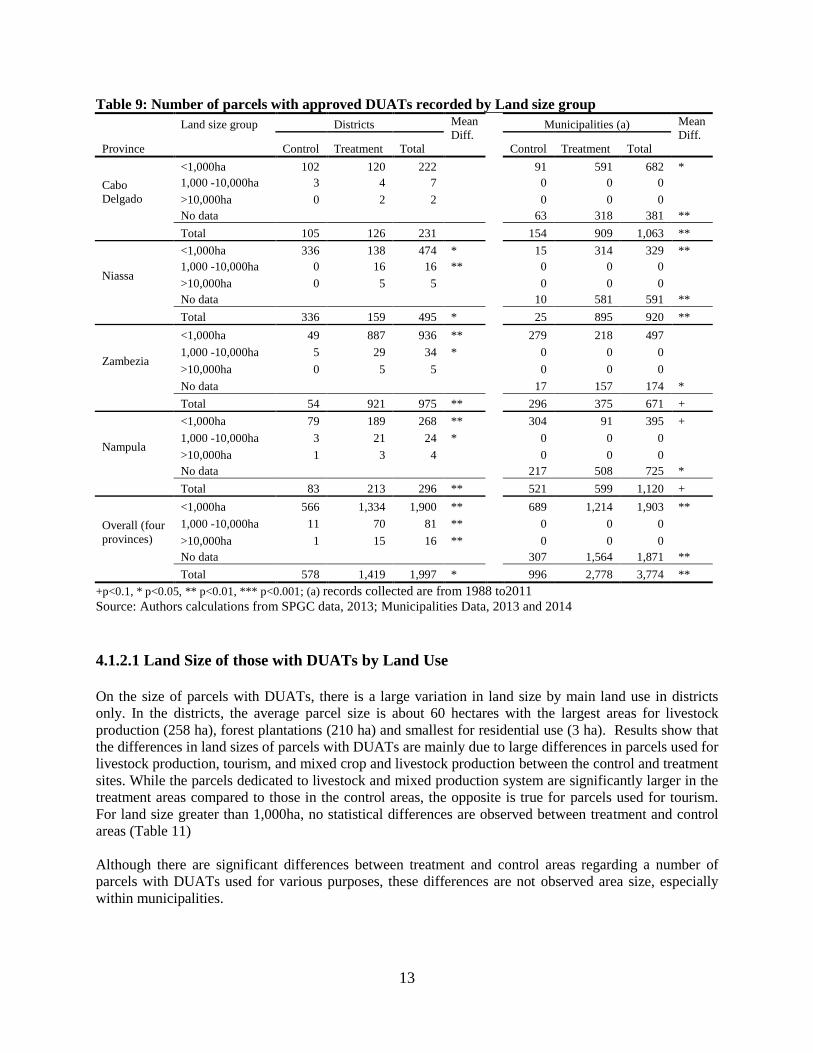
4.1.2 Number of land transactions by land size
Results in Table 9 show diversity on a land size of parcels with DUATs in the Districts but not in
municipalities. As expected, all land sizes in municipalities are lower than 1000 ha whereby, the majority
of parcels with approved DUATs in Districts are smaller than 1,000 hectares. Within each geographical
area (districts and municipalities), statistically, significant differences between treatment and control sites
are observed in all provinces except in Cabo Delgado. In Districts, the differences between treatment and
control sites are mostly observed in the lower land size groups. However, after accounting for the
difference in the total number of parcels between treatment and control in each province, the difference in
share of parcels with DUATs between the treatment and control sites is not significant any more (see
table 20).
13
Table 9: Number of parcels with approved DUATs recorded by Land size group
Land size group Districts Mean
Diff.
Municipalities (a) Mean
Diff.
Province Control Treatment Total
Control Treatment Total
Cabo
Delgado
<1,000ha 102 120 222
91 591 682 *
1,000 -10,000ha 3 4 7
0 0 0
>10,000ha 0 2 2
0 0 0
No data
63 318 381 **
Total 105 126 231
154 909 1,063 **
Niassa
<1,000ha 336 138 474 *
15 314 329 **
1,000 -10,000ha 0 16 16 **
0 0 0
>10,000ha 0 5 5
0 0 0
No data
10 581 591 **
Total 336 159 495 *
25 895 920 **
Zambezia
<1,000ha 49 887 936 **
279 218 497
1,000 -10,000ha 5 29 34 *
0 0 0
>10,000ha 0 5 5
0 0 0
No data
17 157 174 *
Total 54 921 975 **
296 375 671 +
Nampula
<1,000ha 79 189 268 **
304 91 395 +
1,000 -10,000ha 3 21 24 *
0 0 0
>10,000ha 1 3 4
0 0 0
No data
217 508 725 *
Total 83 213 296 **
521 599 1,120 +
Overall (four
provinces)
<1,000ha 566 1,334 1,900 **
689 1,214 1,903 **
1,000 -10,000ha 11 70 81 **
0 0 0
>10,000ha 1 15 16 **
0 0 0
No data
307 1,564 1,871 **
Total 578 1,419 1,997 * 996 2,778 3,774 **
+p<0.1, * p<0.05, ** p<0.01, *** p<0.001; (a) records collected are from 1988 to2011 Source: Authors calculations from SPGC data, 2013; Municipalities Data, 2013 and 2014
4.1.2.1 Land Size of those with DUATs by Land Use
On the size of parcels with DUATs, there is a large variation in land size by main land use in districts
only. In the districts, the average parcel size is about 60 hectares with the largest areas for livestock
production (258 ha), forest plantations (210 ha) and smallest for residential use (3 ha). Results show that
the differences in land sizes of parcels with DUATs are mainly due to large differences in parcels used for
livestock production, tourism, and mixed crop and livestock production between the control and treatment
sites. While the parcels dedicated to livestock and mixed production system are significantly larger in the
treatment areas compared to those in the control areas, the opposite is true for parcels used for tourism.
For land size greater than 1,000ha, no statistical differences are observed between treatment and control
areas (Table 11)
Although there are significant differences between treatment and control areas regarding a number of
parcels with DUATs used for various purposes, these differences are not observed area size, especially
within municipalities.
14
Table 10: Area of parcels with DUATs in rural and urban areas by use by treatment group
Parcel use Control Treatment Total
Mean
differences
A. Districts (<1,000ha)
Ag. production (annual & perennial crops) 53.6 77.5 71.6
Forest plantations 189.0 217.8 210.3
Livestock production (cattle & others) 125.6 298.3 258.1 **
Public services 0.8 1.8 1.4
Commerce & industry 15.5 19.8 18.8
Residence 4.4 2.6 3.3
Tourism 116.9 8.6 23.1 **
Social & religion 6.1 9.3 8.8
Crop-livestock production 148.8 240.1 207.8 **
Total 43.5 65.7 59.1 **
B. Municipalities (ha)
Residential 0.1 0.1 0.1
Commerce 0.1 0.3 0.2
Industry 0.0 5.5 4.6
Social/religion/political party 0.3 1.7 1.0
Public services 17.0 19.3 18.0
Residence and commerce 0.2 0.1 0.1
Agriculture 10.0 . 10.0
Total 0.4 0.2 0.3
Source: Authors calculations from SPGC data, 2013; Municipalities Data, 2013 and 2014
+p<0.1, * p<0.05, ** p<0.01, *** p<0.001 (a) There are few observations for computing t-statistics
Table 11: Area of parcels with DUATs in rural areas by use by treatment group
Parcel use Control Treatment Total Control Treatment Total Difference
A B
C D
[A-B] [C-D]
1,001-10,000ha >10,000ha
Ag. production (annual &
perennial crops) 1,400.5 2,477.8 2,358.1 1400.5 2477.813 2358.111
Forest plantations 2,918.4 3,514.8 3,349.1 2918.4 3514.802 3349.134
Livestock production 2,000.0 1,740.8 1,769.6 2000 1740.797 1769.597
Commerce 1,439.0 4,081.7 3,421.0 1439 4081.73 3421.048
Residence . 4,357.0 4,357.0 . 4357 4357
Tourism . 3,666.7 3,666.7 . 3666.667 3666.667
Social & religion . 7,153.0 7,153.0 . 7153.02 7153.02
Crop-livestock production 1,000.0 2,067.8 2,005.0 1000 2067.843 2005.029
Community . 5,000.0 5,000.0 . 5000 5000
Total 2,166.5 2,657.6 2,590.9 2166.546 2657.584 2590.9
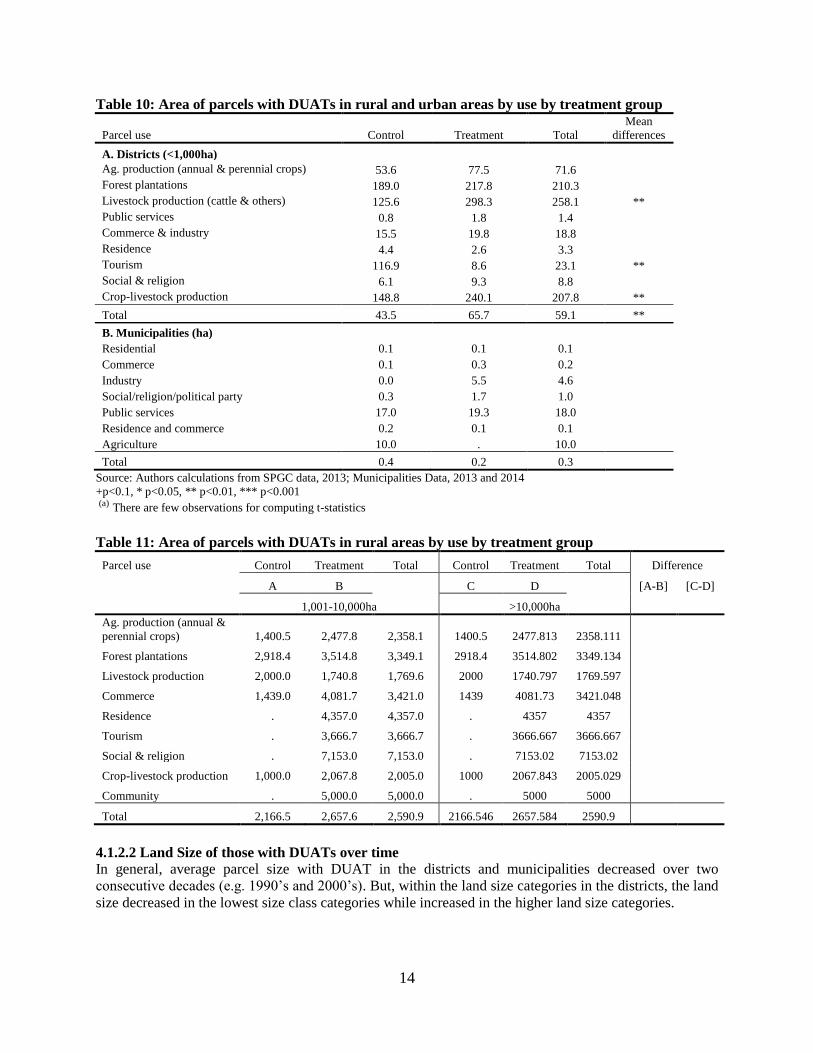
4.1.2.2 Land Size of those with DUATs over time
In general, average parcel size with DUAT in the districts and municipalities decreased over two
consecutive decades (e.g. 1990’s and 2000’s). But, within the land size categories in the districts, the land
size decreased in the lowest size class categories while increased in the higher land size categories.
15
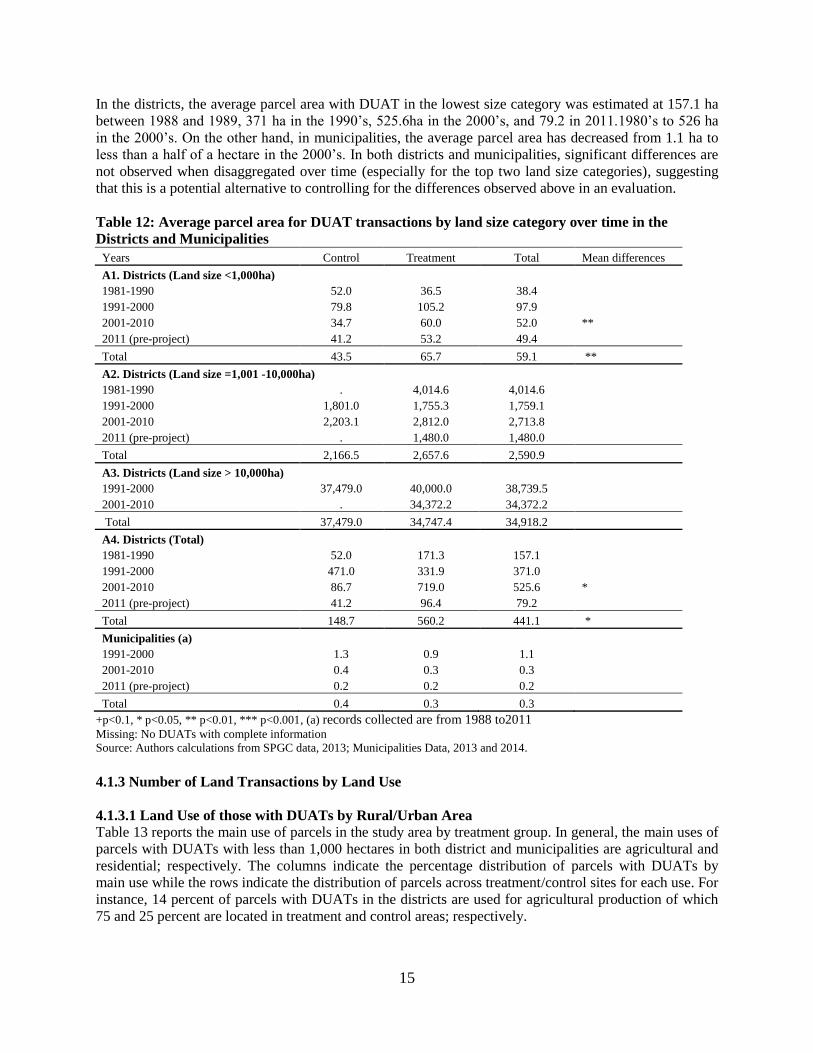
In the districts, the average parcel area with DUAT in the lowest size category was estimated at 157.1 ha
between 1988 and 1989, 371 ha in the 1990’s, 525.6ha in the 2000’s, and 79.2 in 2011.1980’s to 526 ha
in the 2000’s. On the other hand, in municipalities, the average parcel area has decreased from 1.1 ha to
less than a half of a hectare in the 2000’s. In both districts and municipalities, significant differences are
not observed when disaggregated over time (especially for the top two land size categories), suggesting
that this is a potential alternative to controlling for the differences observed above in an evaluation.
Table 12: Average parcel area for DUAT transactions by land size category over time in the
Districts and Municipalities
Years Control Treatment Total Mean differences
A1. Districts (Land size <1,000ha)
1981-1990 52.0 36.5 38.4
1991-2000 79.8 105.2 97.9
2001-2010 34.7 60.0 52.0 **
2011 (pre-project) 41.2 53.2 49.4
Total 43.5 65.7 59.1 **
A2. Districts (Land size =1,001 -10,000ha)
1981-1990 . 4,014.6 4,014.6
1991-2000 1,801.0 1,755.3 1,759.1
2001-2010 2,203.1 2,812.0 2,713.8
2011 (pre-project) . 1,480.0 1,480.0
Total 2,166.5 2,657.6 2,590.9
A3. Districts (Land size > 10,000ha)
1991-2000 37,479.0 40,000.0 38,739.5
2001-2010 . 34,372.2 34,372.2
Total 37,479.0 34,747.4 34,918.2
A4. Districts (Total)
1981-1990 52.0 171.3 157.1
1991-2000 471.0 331.9 371.0
2001-2010 86.7 719.0 525.6 *
2011 (pre-project) 41.2 96.4 79.2
Total 148.7 560.2 441.1 *
Municipalities (a)
1991-2000 1.3 0.9 1.1
2001-2010 0.4 0.3 0.3
2011 (pre-project) 0.2 0.2 0.2
Total 0.4 0.3 0.3
+p<0.1, * p<0.05, ** p<0.01, *** p<0.001, (a) records collected are from 1988 to2011
Missing: No DUATs with complete information
Source: Authors calculations from SPGC data, 2013; Municipalities Data, 2013 and 2014.
4.1.3 Number of Land Transactions by Land Use
4.1.3.1 Land Use of those with DUATs by Rural/Urban Area
Table 13 reports the main use of parcels in the study area by treatment group. In general, the main uses of
parcels with DUATs with less than 1,000 hectares in both district and municipalities are agricultural and
residential; respectively. The columns indicate the percentage distribution of parcels with DUATs by
main use while the rows indicate the distribution of parcels across treatment/control sites for each use. For
instance, 14 percent of parcels with DUATs in the districts are used for agricultural production of which
75 and 25 percent are located in treatment and control areas; respectively.
16
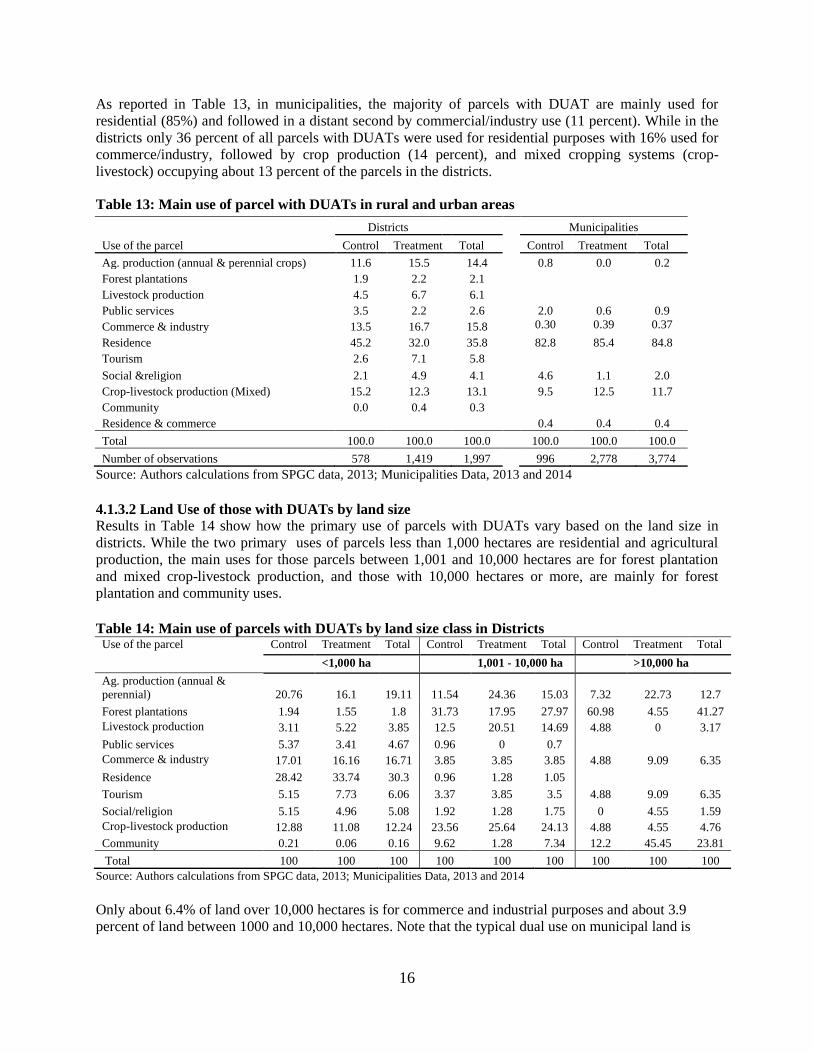
As reported in Table 13, in municipalities, the majority of parcels with DUAT are mainly used for
residential (85%) and followed in a distant second by commercial/industry use (11 percent). While in the
districts only 36 percent of all parcels with DUATs were used for residential purposes with 16% used for
commerce/industry, followed by crop production (14 percent), and mixed cropping systems (crop-
livestock) occupying about 13 percent of the parcels in the districts.
Table 13: Main use of parcel with DUATs in rural and urban areas
Districts
Municipalities
Use of the parcel Control Treatment Total
Control Treatment Total
Ag. production (annual & perennial crops) 11.6 15.5 14.4
0.8 0.0 0.2
Forest plantations 1.9 2.2 2.1
Livestock production 4.5 6.7 6.1
Public services 3.5 2.2 2.6
2.0 0.6 0.9
Commerce & industry 13.5 16.7 15.8
0.30 0.39 0.37
Residence 45.2 32.0 35.8
82.8 85.4 84.8
Tourism 2.6 7.1 5.8
Social &religion 2.1 4.9 4.1
4.6 1.1 2.0
Crop-livestock production (Mixed) 15.2 12.3 13.1
9.5 12.5 11.7
Community 0.0 0.4 0.3
Residence & commerce
0.4 0.4 0.4
Total 100.0 100.0 100.0
100.0 100.0 100.0
Number of observations 578 1,419 1,997
996 2,778 3,774
Source: Authors calculations from SPGC data, 2013; Municipalities Data, 2013 and 2014
4.1.3.2 Land Use of those with DUATs by land size
Results in Table 14 show how the primary use of parcels with DUATs vary based on the land size in
districts. While the two primary uses of parcels less than 1,000 hectares are residential and agricultural
production, the main uses for those parcels between 1,001 and 10,000 hectares are for forest plantation
and mixed crop-livestock production, and those with 10,000 hectares or more, are mainly for forest
plantation and community uses.
Table 14: Main use of parcels with DUATs by land size class in Districts
Use of the parcel Control Treatment Total Control Treatment Total Control Treatment Total
<1,000 ha 1,001 - 10,000 ha >10,000 ha
Ag. production (annual &
perennial) 20.76 16.1 19.11 11.54 24.36 15.03 7.32 22.73 12.7
Forest plantations 1.94 1.55 1.8 31.73 17.95 27.97 60.98 4.55 41.27
Livestock production 3.11 5.22 3.85 12.5 20.51 14.69 4.88 0 3.17
Public services 5.37 3.41 4.67 0.96 0 0.7
Commerce & industry 17.01 16.16 16.71 3.85 3.85 3.85 4.88 9.09 6.35
Residence 28.42 33.74 30.3 0.96 1.28 1.05
Tourism 5.15 7.73 6.06 3.37 3.85 3.5 4.88 9.09 6.35
Social/religion 5.15 4.96 5.08 1.92 1.28 1.75 0 4.55 1.59
Crop-livestock production 12.88 11.08 12.24 23.56 25.64 24.13 4.88 4.55 4.76
Community 0.21 0.06 0.16 9.62 1.28 7.34 12.2 45.45 23.81
Total 100 100 100 100 100 100 100 100 100
Source: Authors calculations from SPGC data, 2013; Municipalities Data, 2013 and 2014
Only about 6.4% of land over 10,000 hectares is for commerce and industrial purposes and about 3.9
percent of land between 1000 and 10,000 hectares. Note that the typical dual use on municipal land is
17
residence & commerce and those parcels used for residence and home/vegetable garden are classified as
for residential purpose.
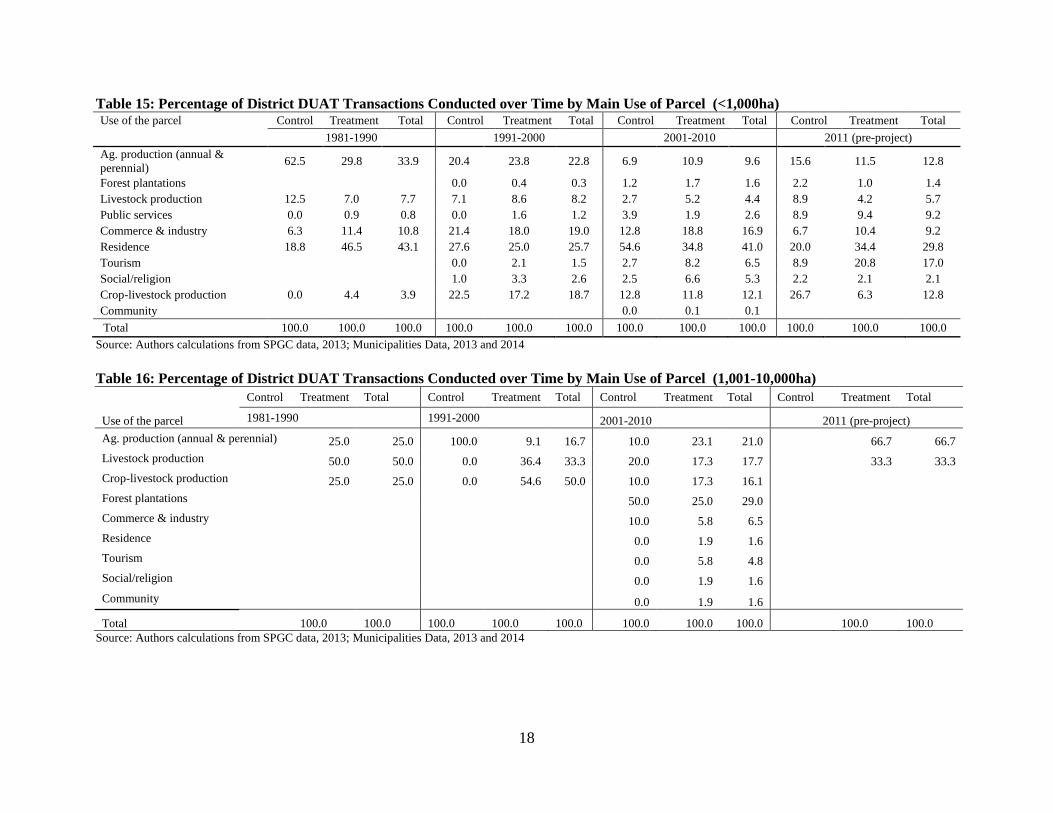
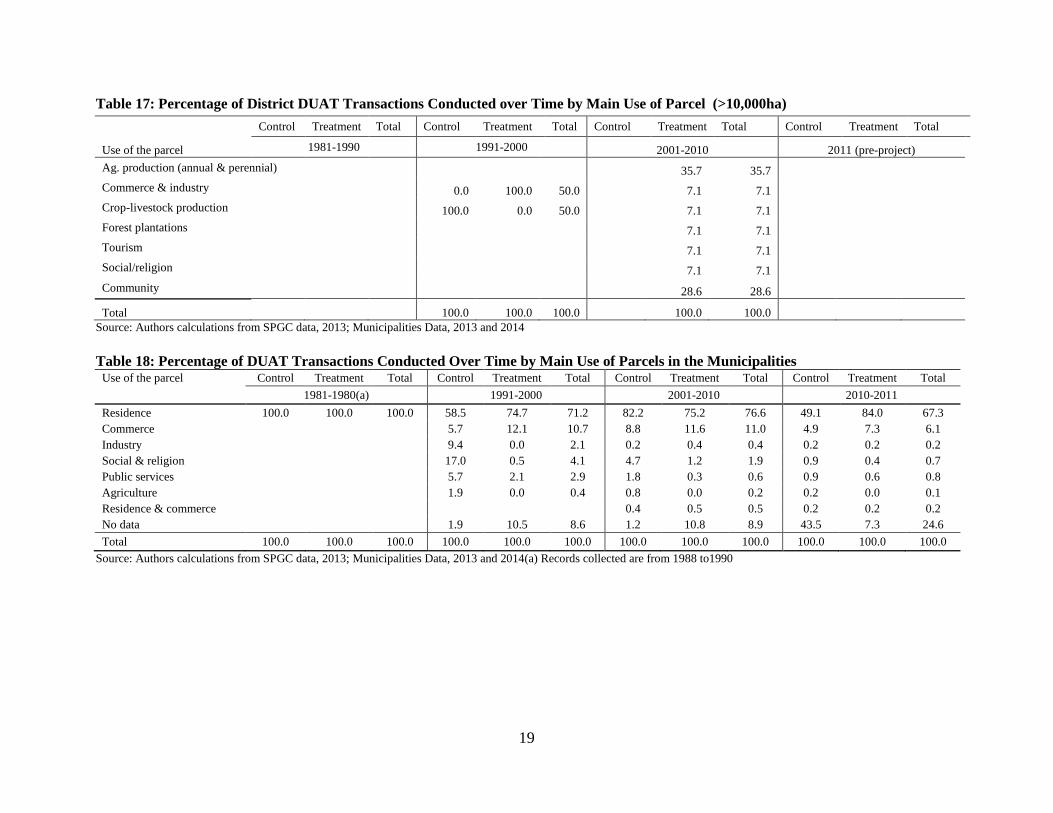
4.1.3.2 Land Use of those with DUATs over time
To understand the changes over time, Table 15 to Table 18, present the number of parcels with DUATs
by land use over time for the districts and municipalities, respectively. Results show that for parcels less
than 1,000ha in the districts, an increase in the proportion of parcels with DUAT has been observed in
those intended for residential and tourism while a decrease in proportion has been noted for those used for
agricultural production, commerce and industry and crop-livestock production over the two consecutive
decades. Similarly, for the same land size group, parcels with DUAT in the municipalities have also
observed a slight increase in the proportion of those intended for residential use and a significant decrease
for those used for social and religion purposes.
In the districts, parcels within the land size of 1,001-10,000ha, results show an increase in the proportion
of parcels used for agricultural production while those used for livestock production observed a decrease
in proportion.
18
Table 15: Percentage of District DUAT Transactions Conducted over Time by Main Use of Parcel (<1,000ha) Use of the parcel Control Treatment Total Control Treatment Total Control Treatment Total Control Treatment Total
1981-1990 1991-2000 2001-2010 2011 (pre-project)
Ag. production (annual &
perennial) 62.5 29.8 33.9 20.4 23.8 22.8 6.9 10.9 9.6 15.6 11.5 12.8
Forest plantations
0.0 0.4 0.3 1.2 1.7 1.6 2.2 1.0 1.4
Livestock production 12.5 7.0 7.7 7.1 8.6 8.2 2.7 5.2 4.4 8.9 4.2 5.7
Public services 0.0 0.9 0.8 0.0 1.6 1.2 3.9 1.9 2.6 8.9 9.4 9.2
Commerce & industry 6.3 11.4 10.8 21.4 18.0 19.0 12.8 18.8 16.9 6.7 10.4 9.2
Residence 18.8 46.5 43.1 27.6 25.0 25.7 54.6 34.8 41.0 20.0 34.4 29.8
Tourism
0.0 2.1 1.5 2.7 8.2 6.5 8.9 20.8 17.0
Social/religion
1.0 3.3 2.6 2.5 6.6 5.3 2.2 2.1 2.1
Crop-livestock production 0.0 4.4 3.9 22.5 17.2 18.7 12.8 11.8 12.1 26.7 6.3 12.8
Community
0.0 0.1 0.1
Total 100.0 100.0 100.0 100.0 100.0 100.0 100.0 100.0 100.0 100.0 100.0 100.0
Source: Authors calculations from SPGC data, 2013; Municipalities Data, 2013 and 2014
Table 16: Percentage of District DUAT Transactions Conducted over Time by Main Use of Parcel (1,001-10,000ha)
Control Treatment Total Control Treatment Total Control Treatment Total Control Treatment Total
Use of the parcel 1981-1990 1991-2000 2001-2010 2011 (pre-project)
Ag. production (annual & perennial) 25.0 25.0 100.0 9.1 16.7 10.0 23.1 21.0 66.7 66.7
Livestock production
50.0 50.0 0.0 36.4 33.3 20.0 17.3 17.7 33.3 33.3
Crop-livestock production
25.0 25.0 0.0 54.6 50.0 10.0 17.3 16.1
Forest plantations
50.0 25.0 29.0
Commerce & industry
10.0 5.8 6.5
Residence
0.0 1.9 1.6
Tourism
0.0 5.8 4.8
Social/religion
0.0 1.9 1.6
Community 0.0 1.9 1.6
Total 100.0 100.0 100.0 100.0 100.0 100.0 100.0 100.0 100.0 100.0
Source: Authors calculations from SPGC data, 2013; Municipalities Data, 2013 and 2014
19
Table 17: Percentage of District DUAT Transactions Conducted over Time by Main Use of Parcel (>10,000ha)
Control Treatment Total Control Treatment Total Control Treatment Total Control Treatment Total
Use of the parcel 1981-1990 1991-2000 2001-2010 2011 (pre-project)
Ag. production (annual & perennial)
35.7 35.7
Commerce & industry
0.0 100.0 50.0
7.1 7.1
Crop-livestock production
100.0 0.0 50.0
7.1 7.1
Forest plantations
7.1 7.1
Tourism
7.1 7.1
Social/religion
7.1 7.1
Community 28.6 28.6
Total 100.0 100.0 100.0 100.0 100.0
Source: Authors calculations from SPGC data, 2013; Municipalities Data, 2013 and 2014
Table 18: Percentage of DUAT Transactions Conducted Over Time by Main Use of Parcels in the Municipalities
Use of the parcel Control Treatment Total Control Treatment Total Control Treatment Total Control Treatment Total
1981-1980(a) 1991-2000 2001-2010 2010-2011
Residence 100.0 100.0 100.0 58.5 74.7 71.2 82.2 75.2 76.6 49.1 84.0 67.3
Commerce
5.7 12.1 10.7 8.8 11.6 11.0 4.9 7.3 6.1
Industry
9.4 0.0 2.1 0.2 0.4 0.4 0.2 0.2 0.2
Social & religion
17.0 0.5 4.1 4.7 1.2 1.9 0.9 0.4 0.7
Public services
5.7 2.1 2.9 1.8 0.3 0.6 0.9 0.6 0.8
Agriculture
1.9 0.0 0.4 0.8 0.0 0.2 0.2 0.0 0.1
Residence & commerce
0.4 0.5 0.5 0.2 0.2 0.2
No data
1.9 10.5 8.6 1.2 10.8 8.9 43.5 7.3 24.6
Total 100.0 100.0 100.0 100.0 100.0 100.0 100.0 100.0 100.0 100.0 100.0 100.0
Source: Authors calculations from SPGC data, 2013; Municipalities Data, 2013 and 2014(a) Records collected are from 1988 to1990
20
4.2 DUAT Transaction times
This section analyses the variation of DUAT transaction times over time, by land use, and land size.
4.2.1 Transaction time by parcel size
Results reported in Table 19 indicate that the average DUAT’s transaction time between 1988 and 2011
was about 472 and 116 days in districts and municipalities; respectively. In the districts, it took much
longer to obtain a DUAT for agricultural production (a little over 2 years), for livestock production (about
1.5 year), and for residence and commerce/industry use (a little more than 1 year), while parcels used for
social and religion purposes are quicker to obtain DUAT (about 6 months). In general, significant
differences in DUATs transaction times are observed between controls and treatments in districts, mainly
on parcels used for livestock production, residence, and mixed production system (crop-livestock), where
much longer processing times are observed in treatment areas. Note that each transaction time in Table 19
is an average of a large period (23 years), which could mask large differences over time. Disaggregating
the data by time periods reveal that the data is extremely biased by 1980s/1990s data. When looking at
last decade or two, it is much more even in terms of timing between districts and municipalities, in fact,
2000-2010 municipalities took longer than districts. The analysis on transaction times disaggregated by
time periods will be presented later.
Within the municipalities, the transaction times are much shorter (three to four times) perhaps due to their
accessibility compared to the districts where in some cases landholders have to travel long distances to the
administration office to apply. However, when looking at the historic data trends, we find that the
difference in transaction times between districts and municipalities in the most recent data (over the last
10 years) is small. With similar application procedures in both district and municipality areas, the
relatively small parcel sizes in the municipalities compared to those in the districts could have been a
reason for such shorter processing times. On average, it took about 116 days for a landholder to obtain a
DUAT within municipality areas. As in the districts, significant differences between treatment and control
sites are observed in municipalities, but the treatment sites have significantly shorter processing time than
their counterparts which took only 115 days to approve a DUAT application. These differences are
mainly observed in parcels used for industry and social/religion purposes. Although the transaction times
are significantly larger in the control than in the treatment areas for industry and social/religion parcels,
there is still room for a potential effect of capacity building in reducing transaction time. However, when
we control for parcel size, these differences are only significant for the smaller land size category
(<1,000ha).
Given that the average transaction time in treatment areas is largely beyond the intended 90 days limit
(except in treatment areas for industry, public services and community and in control areas for tourism)
by the Ministry of Agriculture, investments in strengthening local capacity, while improving efficiency in
local land administration units, may not be sufficient to reduce the transaction time if such procedures are
not linked to reforms to simplify the current lengthy registration process and to meet the 90 days period
for processing DUAT, as intended. We present further analysis with data disaggregated by time and land
size categories below. Care must be exercised while interpreting these results because looking at the data
over time; results show an impressive reduction in the transaction times, especially in the last decade and
the last year before the LTR’s intervention. In fact, in the year 2011, the transaction times in both regions
are well below the 90 days. So again, data over 23 years prior to intervention may not be a realistic
baseline data. Instead, data from the last decade or even shorter are better as a baseline. How many years
prior to the intervention should be included also depends on the number of post-intervention years for
which we will have data for evaluation.
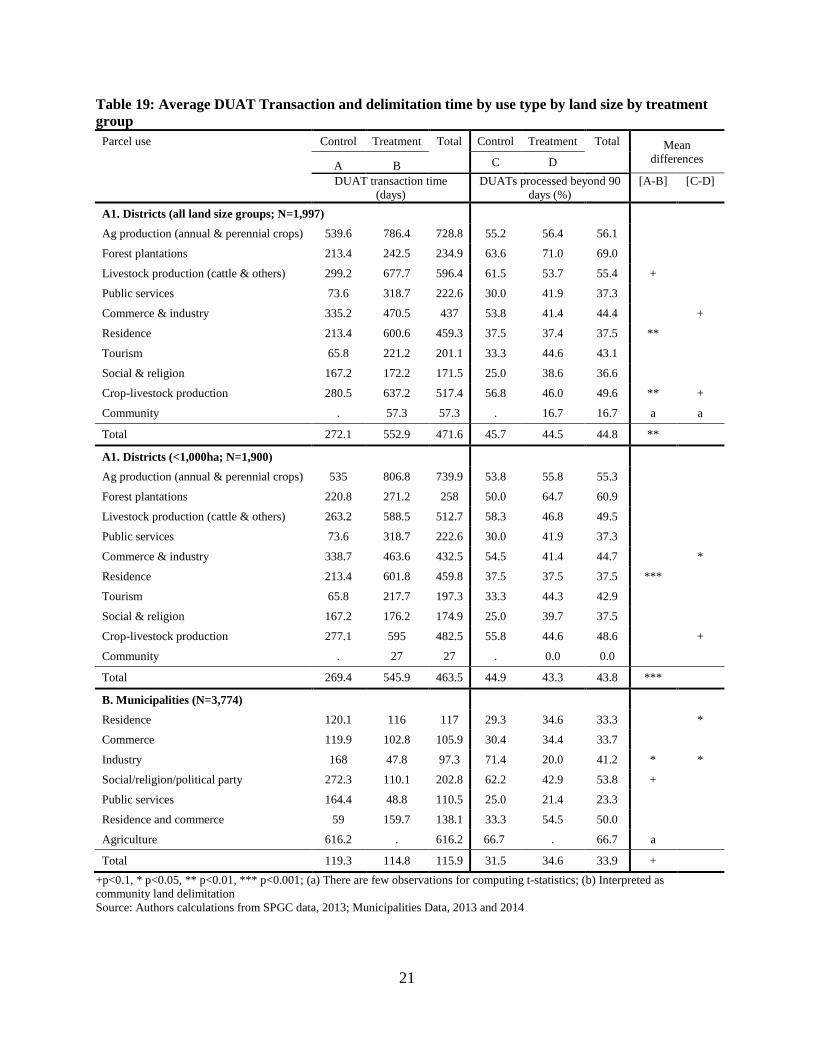
21
Table 19: Average DUAT Transaction and delimitation time by use type by land size by treatment
group
Parcel use Control Treatment Total Control Treatment Total Mean
differences
A B C D
DUAT transaction time
(days)
DUATs processed beyond 90
days (%)
[A-B] [C-D]
A1. Districts (all land size groups; N=1,997)
Ag production (annual & perennial crops) 539.6 786.4 728.8 55.2 56.4 56.1
Forest plantations 213.4 242.5 234.9 63.6 71.0 69.0
Livestock production (cattle & others) 299.2 677.7 596.4 61.5 53.7 55.4 +
Public services 73.6 318.7 222.6 30.0 41.9 37.3
Commerce & industry 335.2 470.5 437 53.8 41.4 44.4
+
Residence 213.4 600.6 459.3 37.5 37.4 37.5 **
Tourism 65.8 221.2 201.1 33.3 44.6 43.1
Social & religion 167.2 172.2 171.5 25.0 38.6 36.6
Crop-livestock production 280.5 637.2 517.4 56.8 46.0 49.6 ** +
Community . 57.3 57.3 . 16.7 16.7 a a
Total 272.1 552.9 471.6 45.7 44.5 44.8 **
A1. Districts (<1,000ha; N=1,900)
Ag production (annual & perennial crops) 535 806.8 739.9 53.8 55.8 55.3
Forest plantations 220.8 271.2 258 50.0 64.7 60.9
Livestock production (cattle & others) 263.2 588.5 512.7 58.3 46.8 49.5
Public services 73.6 318.7 222.6 30.0 41.9 37.3
Commerce & industry 338.7 463.6 432.5 54.5 41.4 44.7
*
Residence 213.4 601.8 459.8 37.5 37.5 37.5 ***
Tourism 65.8 217.7 197.3 33.3 44.3 42.9
Social & religion 167.2 176.2 174.9 25.0 39.7 37.5
Crop-livestock production 277.1 595 482.5 55.8 44.6 48.6
+
Community . 27 27 . 0.0 0.0
Total 269.4 545.9 463.5 44.9 43.3 43.8 ***
B. Municipalities (N=3,774)
Residence 120.1 116 117 29.3 34.6 33.3
*
Commerce 119.9 102.8 105.9 30.4 34.4 33.7
Industry 168 47.8 97.3 71.4 20.0 41.2 * *
Social/religion/political party 272.3 110.1 202.8 62.2 42.9 53.8 +
Public services 164.4 48.8 110.5 25.0 21.4 23.3
Residence and commerce 59 159.7 138.1 33.3 54.5 50.0
Agriculture 616.2 . 616.2 66.7 . 66.7 a
Total 119.3 114.8 115.9 31.5 34.6 33.9 +
+p<0.1, * p<0.05, ** p<0.01, *** p<0.001; (a) There are few observations for computing t-statistics; (b) Interpreted as
community land delimitation
Source: Authors calculations from SPGC data, 2013; Municipalities Data, 2013 and 2014
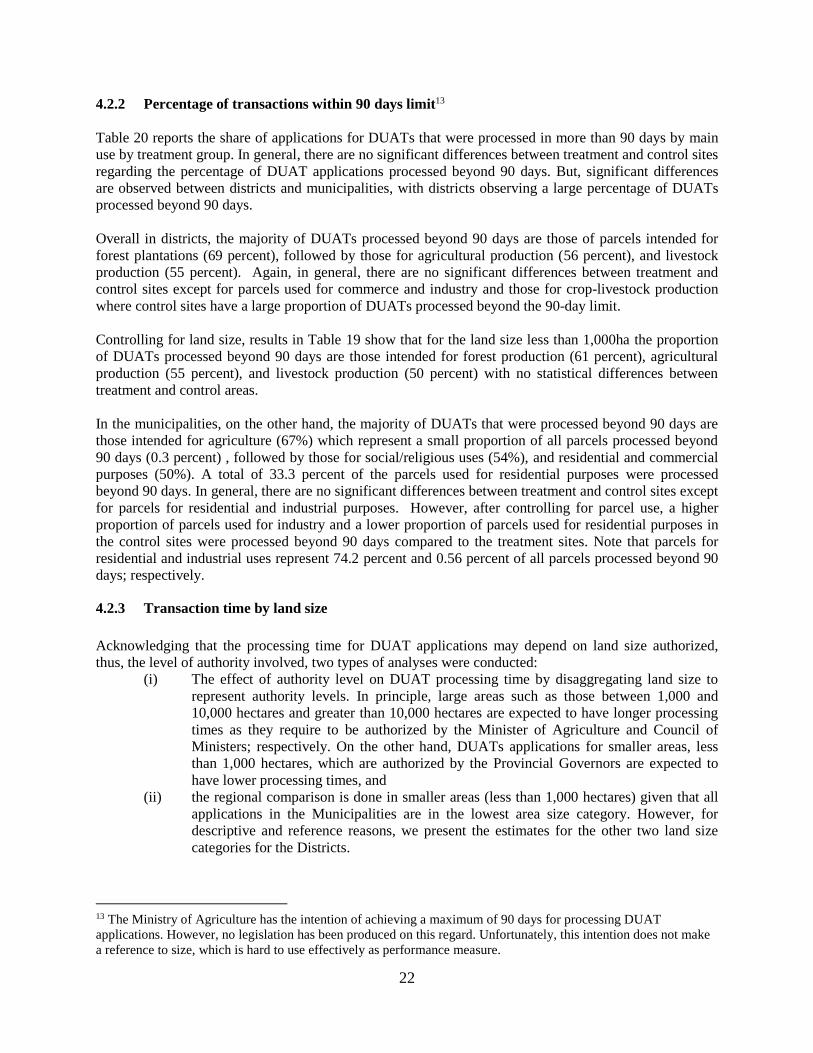
22
4.2.2 Percentage of transactions within 90 days limit13
Table 20 reports the share of applications for DUATs that were processed in more than 90 days by main
use by treatment group. In general, there are no significant differences between treatment and control sites
regarding the percentage of DUAT applications processed beyond 90 days. But, significant differences
are observed between districts and municipalities, with districts observing a large percentage of DUATs
processed beyond 90 days.
Overall in districts, the majority of DUATs processed beyond 90 days are those of parcels intended for
forest plantations (69 percent), followed by those for agricultural production (56 percent), and livestock
production (55 percent). Again, in general, there are no significant differences between treatment and
control sites except for parcels used for commerce and industry and those for crop-livestock production
where control sites have a large proportion of DUATs processed beyond the 90-day limit.
Controlling for land size, results in Table 19 show that for the land size less than 1,000ha the proportion
of DUATs processed beyond 90 days are those intended for forest production (61 percent), agricultural
production (55 percent), and livestock production (50 percent) with no statistical differences between
treatment and control areas.
In the municipalities, on the other hand, the majority of DUATs that were processed beyond 90 days are
those intended for agriculture (67%) which represent a small proportion of all parcels processed beyond
90 days (0.3 percent) , followed by those for social/religious uses (54%), and residential and commercial
purposes (50%). A total of 33.3 percent of the parcels used for residential purposes were processed
beyond 90 days. In general, there are no significant differences between treatment and control sites except
for parcels for residential and industrial purposes. However, after controlling for parcel use, a higher
proportion of parcels used for industry and a lower proportion of parcels used for residential purposes in
the control sites were processed beyond 90 days compared to the treatment sites. Note that parcels for
residential and industrial uses represent 74.2 percent and 0.56 percent of all parcels processed beyond 90
days; respectively.
4.2.3 Transaction time by land size
Acknowledging that the processing time for DUAT applications may depend on land size authorized,
thus, the level of authority involved, two types of analyses were conducted:
(i) The effect of authority level on DUAT processing time by disaggregating land size to
represent authority levels. In principle, large areas such as those between 1,000 and
10,000 hectares and greater than 10,000 hectares are expected to have longer processing
times as they require to be authorized by the Minister of Agriculture and Council of
Ministers; respectively. On the other hand, DUATs applications for smaller areas, less
than 1,000 hectares, which are authorized by the Provincial Governors are expected to
have lower processing times, and
(ii) the regional comparison is done in smaller areas (less than 1,000 hectares) given that all
applications in the Municipalities are in the lowest area size category. However, for
descriptive and reference reasons, we present the estimates for the other two land size
categories for the Districts.
13 The Ministry of Agriculture has the intention of achieving a maximum of 90 days for processing DUAT
applications. However, no legislation has been produced on this regard. Unfortunately, this intention does not make
a reference to size, which is hard to use effectively as performance measure.
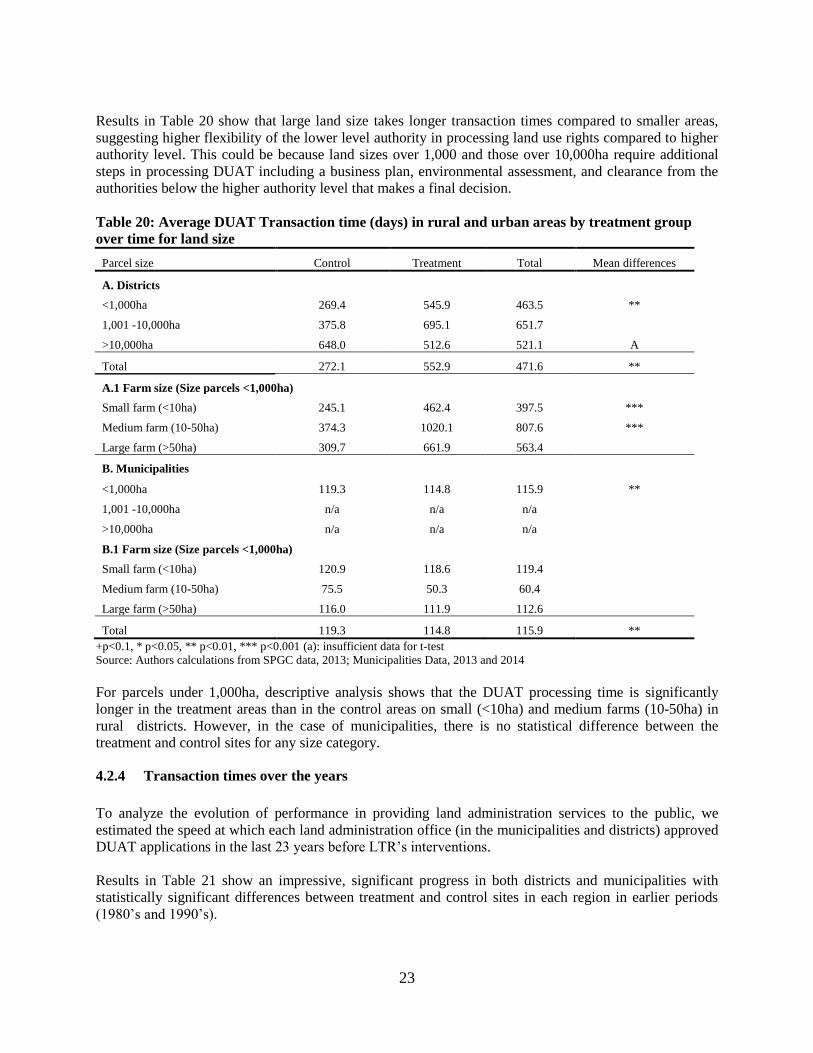
23
Results in Table 20 show that large land size takes longer transaction times compared to smaller areas,
suggesting higher flexibility of the lower level authority in processing land use rights compared to higher
authority level. This could be because land sizes over 1,000 and those over 10,000ha require additional
steps in processing DUAT including a business plan, environmental assessment, and clearance from the
authorities below the higher authority level that makes a final decision.
Table 20: Average DUAT Transaction time (days) in rural and urban areas by treatment group
over time for land size
Parcel size Control Treatment Total Mean differences
A. Districts
<1,000ha 269.4 545.9 463.5 **
1,001 -10,000ha 375.8 695.1 651.7
>10,000ha 648.0 512.6 521.1 A
Total 272.1 552.9 471.6 **
A.1 Farm size (Size parcels <1,000ha)
Small farm (<10ha) 245.1 462.4 397.5 ***
Medium farm (10-50ha) 374.3 1020.1 807.6 ***
Large farm (>50ha) 309.7 661.9 563.4
B. Municipalities
<1,000ha 119.3 114.8 115.9 **
1,001 -10,000ha n/a n/a n/a
>10,000ha n/a n/a n/a
B.1 Farm size (Size parcels <1,000ha)
Small farm (<10ha) 120.9 118.6 119.4
Medium farm (10-50ha) 75.5 50.3 60.4
Large farm (>50ha) 116.0 111.9 112.6
Total 119.3 114.8 115.9 **
+p<0.1, * p<0.05, ** p<0.01, *** p<0.001 (a): insufficient data for t-test Source: Authors calculations from SPGC data, 2013; Municipalities Data, 2013 and 2014
For parcels under 1,000ha, descriptive analysis shows that the DUAT processing time is significantly
longer in the treatment areas than in the control areas on small (<10ha) and medium farms (10-50ha) in
rural districts. However, in the case of municipalities, there is no statistical difference between the
treatment and control sites for any size category.
4.2.4 Transaction times over the years
To analyze the evolution of performance in providing land administration services to the public, we
estimated the speed at which each land administration office (in the municipalities and districts) approved
DUAT applications in the last 23 years before LTR’s interventions.
Results in Table 21 show an impressive, significant progress in both districts and municipalities with
statistically significant differences between treatment and control sites in each region in earlier periods
(1980’s and 1990’s).
24
In the districts, the cadastral offices took about seven years to approve an application for DUAT in the
1980’s, while in the two years preceding the LTR’s intervention (2011), the processing time was reduced
to about 80 days. Although municipalities are quicker in processing DUAT applications, the much slower
incremental improvement was observed over time, with processing times changing from about eight
months in the 1980’s to a little more than two months in 2011. Results show that the transaction time
decreased by 75% in municipalities and by 97% in districts.
Significant differences between treatment and control sites were observed in the earlier periods where
treatment sites had larger processing times than their counterparts. This trend has been similar to one
observed in the municipalities with processing times decreasing from about eight months in the 1980’s to
about 65 days in the last year, pre-project. But, contrary to the districts, the treatment areas in the
municipalities observed significantly shorter processing times compared to the control areas in 1980’s and
1990’s but, in the 2000’s, the treatment sites larger DUAT processing times.
The main implication of the fact that the processing times between the treatment and control sites are
statistically significantly in the 1980s/1990s but not in the 2000s again reinforce the early argument that
the baseline should not go far back before the project intervention. As per these results, the realistic
baseline for this evaluation should be the last decade or even shorter. In the final evaluation, we can
explore the different time lengths for the baseline period.
The results from Tables 21 also show an impressive improvement in reducing the percentage of DUATs
processed beyond the 90-day limit. In the districts, the percentage of DUATs processed beyond the time
limit reduced from 91 percent in the 1980’s to 22 percent in the last two years before the project
implementation (about 70 percent improvement). As indicated above, although the municipalities appear
to have lower processing times compared to districts the performance improvement between the two
periods in the analysis is smaller for the same land size group.
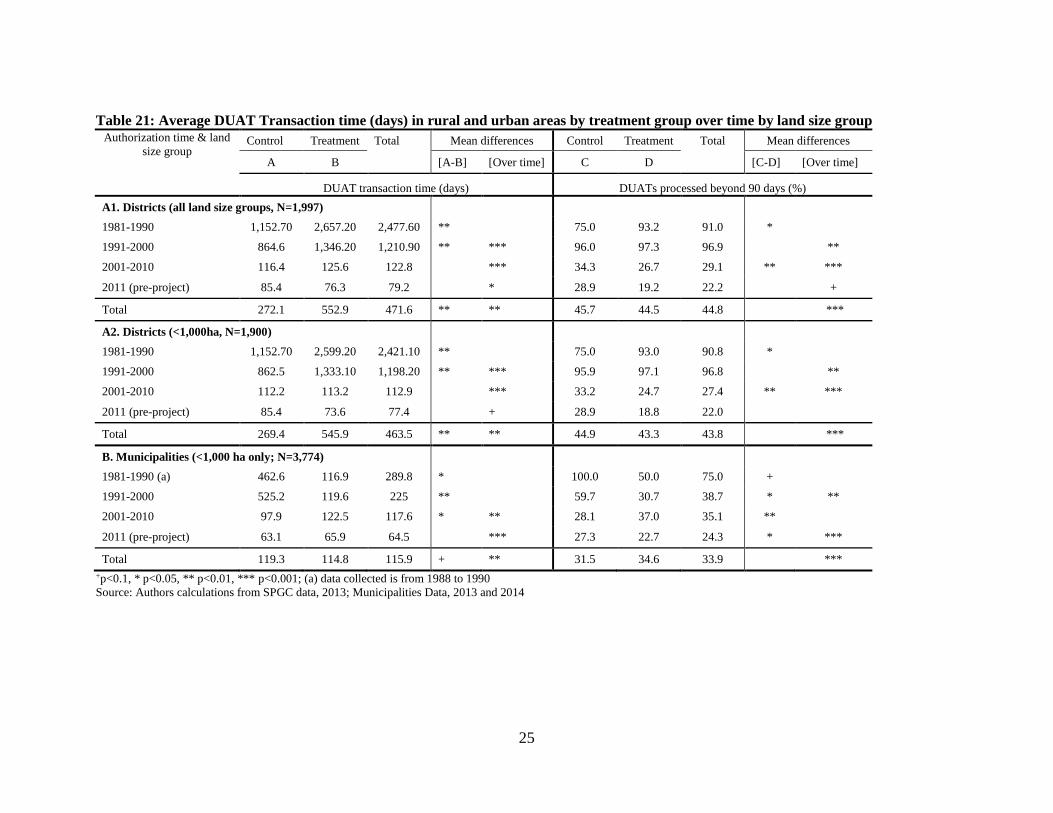
25
Table 21: Average DUAT Transaction time (days) in rural and urban areas by treatment group over time by land size group Authorization time & land
size group Control Treatment Total Mean differences Control Treatment Total Mean differences
A B [A-B] [Over time] C D [C-D] [Over time]
DUAT transaction time (days) DUATs processed beyond 90 days (%)
A1. Districts (all land size groups, N=1,997)
1981-1990 1,152.70 2,657.20 2,477.60 **
75.0 93.2 91.0 *
1991-2000 864.6 1,346.20 1,210.90 ** *** 96.0 97.3 96.9
**
2001-2010 116.4 125.6 122.8
*** 34.3 26.7 29.1 ** ***
2011 (pre-project) 85.4 76.3 79.2
* 28.9 19.2 22.2
+
Total 272.1 552.9 471.6 ** ** 45.7 44.5 44.8 ***
A2. Districts (<1,000ha, N=1,900)
1981-1990 1,152.70 2,599.20 2,421.10 **
75.0 93.0 90.8 *
1991-2000 862.5 1,333.10 1,198.20 ** *** 95.9 97.1 96.8
**
2001-2010 112.2 113.2 112.9
*** 33.2 24.7 27.4 ** ***
2011 (pre-project) 85.4 73.6 77.4
+ 28.9 18.8 22.0
Total 269.4 545.9 463.5 ** ** 44.9 43.3 43.8 ***
B. Municipalities (<1,000 ha only; N=3,774)
1981-1990 (a) 462.6 116.9 289.8 *
100.0 50.0 75.0 +
1991-2000 525.2 119.6 225 **
59.7 30.7 38.7 * **
2001-2010 97.9 122.5 117.6 * ** 28.1 37.0 35.1 **
2011 (pre-project) 63.1 65.9 64.5
*** 27.3 22.7 24.3 * ***
Total 119.3 114.8 115.9 + ** 31.5 34.6 33.9 ***
+p<0.1, * p<0.05, ** p<0.01, *** p<0.001; (a) data collected is from 1988 to 1990 Source: Authors calculations from SPGC data, 2013; Municipalities Data, 2013 and 2014
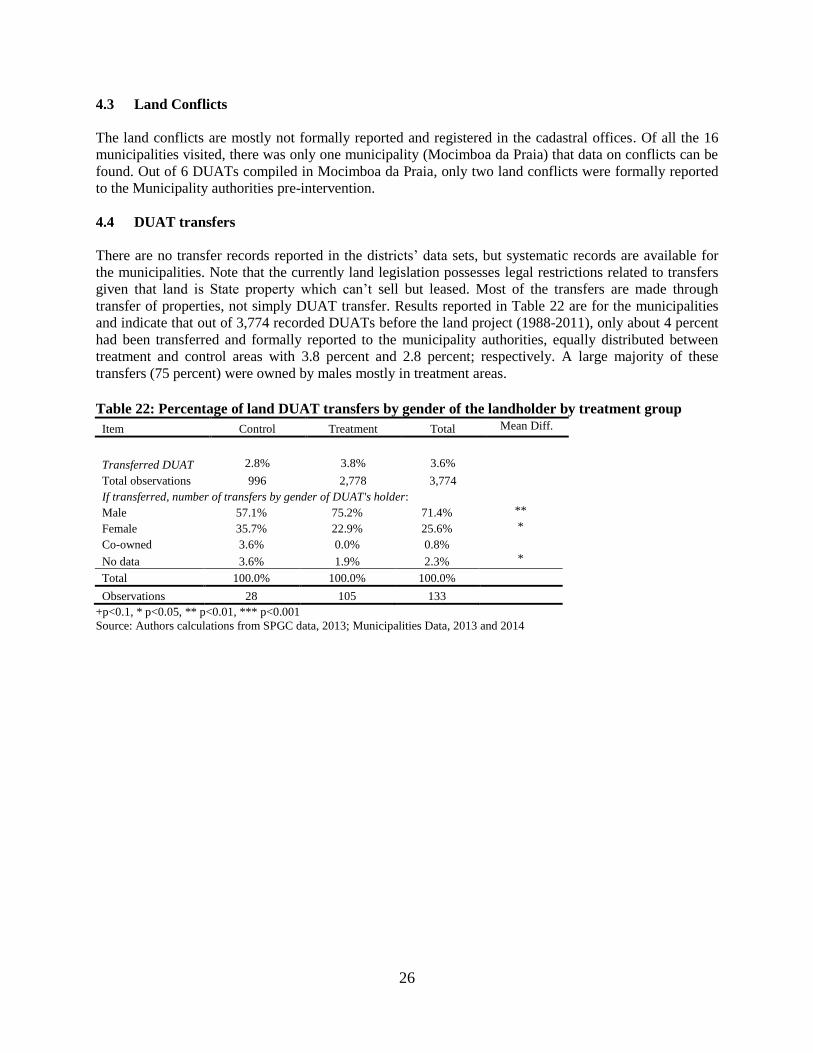
26
4.3 Land Conflicts
The land conflicts are mostly not formally reported and registered in the cadastral offices. Of all the 16
municipalities visited, there was only one municipality (Mocimboa da Praia) that data on conflicts can be
found. Out of 6 DUATs compiled in Mocimboa da Praia, only two land conflicts were formally reported
to the Municipality authorities pre-intervention.
4.4 DUAT transfers
There are no transfer records reported in the districts’ data sets, but systematic records are available for
the municipalities. Note that the currently land legislation possesses legal restrictions related to transfers
given that land is State property which can’t sell but leased. Most of the transfers are made through
transfer of properties, not simply DUAT transfer. Results reported in Table 22 are for the municipalities
and indicate that out of 3,774 recorded DUATs before the land project (1988-2011), only about 4 percent
had been transferred and formally reported to the municipality authorities, equally distributed between
treatment and control areas with 3.8 percent and 2.8 percent; respectively. A large majority of these
transfers (75 percent) were owned by males mostly in treatment areas.
Table 22: Percentage of land DUAT transfers by gender of the landholder by treatment group
Item Control Treatment Total Mean Diff.
Transferred DUAT 2.8% 3.8% 3.6%
Total observations 996 2,778 3,774
If transferred, number of transfers by gender of DUAT's holder:
Male 57.1% 75.2% 71.4% **
Female 35.7% 22.9% 25.6% *
Co-owned 3.6% 0.0% 0.8%
No data 3.6% 1.9% 2.3% *
Total 100.0% 100.0% 100.0%
Observations 28 105 133
+p<0.1, * p<0.05, ** p<0.01, *** p<0.001 Source: Authors calculations from SPGC data, 2013; Municipalities Data, 2013 and 2014
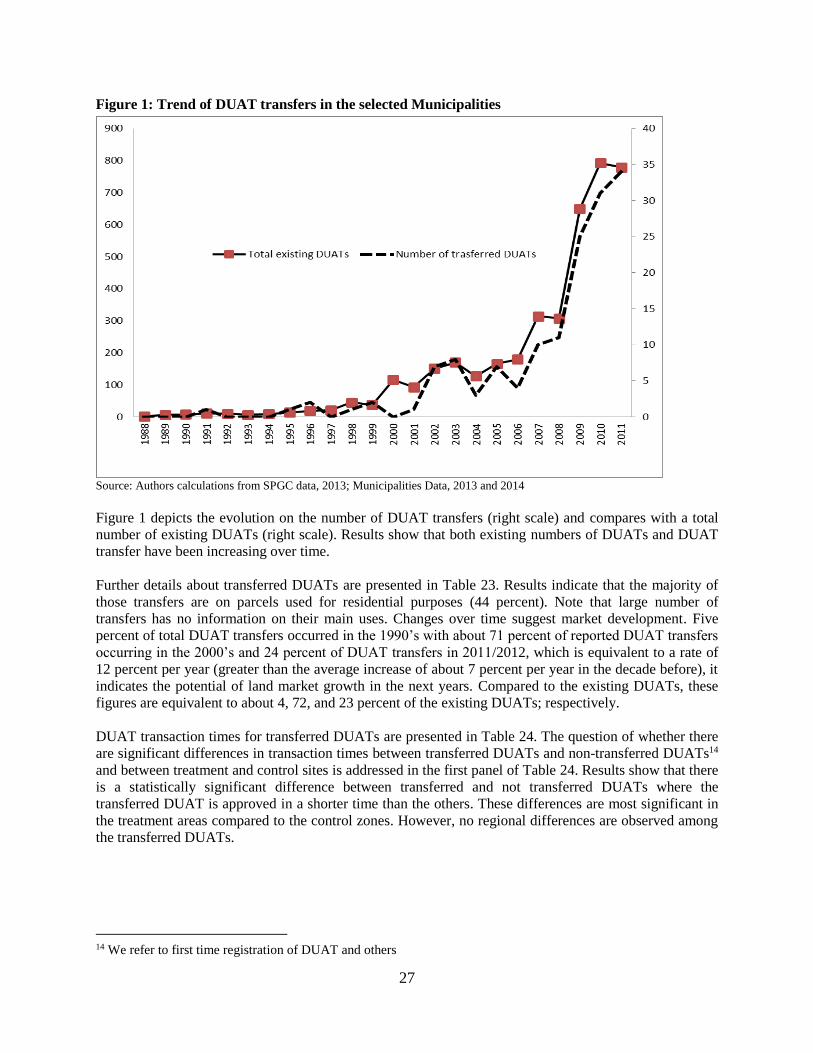
27
Figure 1: Trend of DUAT transfers in the selected Municipalities
Source: Authors calculations from SPGC data, 2013; Municipalities Data, 2013 and 2014
Figure 1 depicts the evolution on the number of DUAT transfers (right scale) and compares with a total
number of existing DUATs (right scale). Results show that both existing numbers of DUATs and DUAT
transfer have been increasing over time.
Further details about transferred DUATs are presented in Table 23. Results indicate that the majority of
those transfers are on parcels used for residential purposes (44 percent). Note that large number of
transfers has no information on their main uses. Changes over time suggest market development. Five
percent of total DUAT transfers occurred in the 1990’s with about 71 percent of reported DUAT transfers
occurring in the 2000’s and 24 percent of DUAT transfers in 2011/2012, which is equivalent to a rate of
12 percent per year (greater than the average increase of about 7 percent per year in the decade before), it
indicates the potential of land market growth in the next years. Compared to the existing DUATs, these
figures are equivalent to about 4, 72, and 23 percent of the existing DUATs; respectively.
DUAT transaction times for transferred DUATs are presented in Table 24. The question of whether there
are significant differences in transaction times between transferred DUATs and non-transferred DUATs14
and between treatment and control sites is addressed in the first panel of Table 24. Results show that there
is a statistically significant difference between transferred and not transferred DUATs where the
transferred DUAT is approved in a shorter time than the others. These differences are most significant in
the treatment areas compared to the control zones. However, no regional differences are observed among
the transferred DUATs.
14 We refer to first time registration of DUAT and others
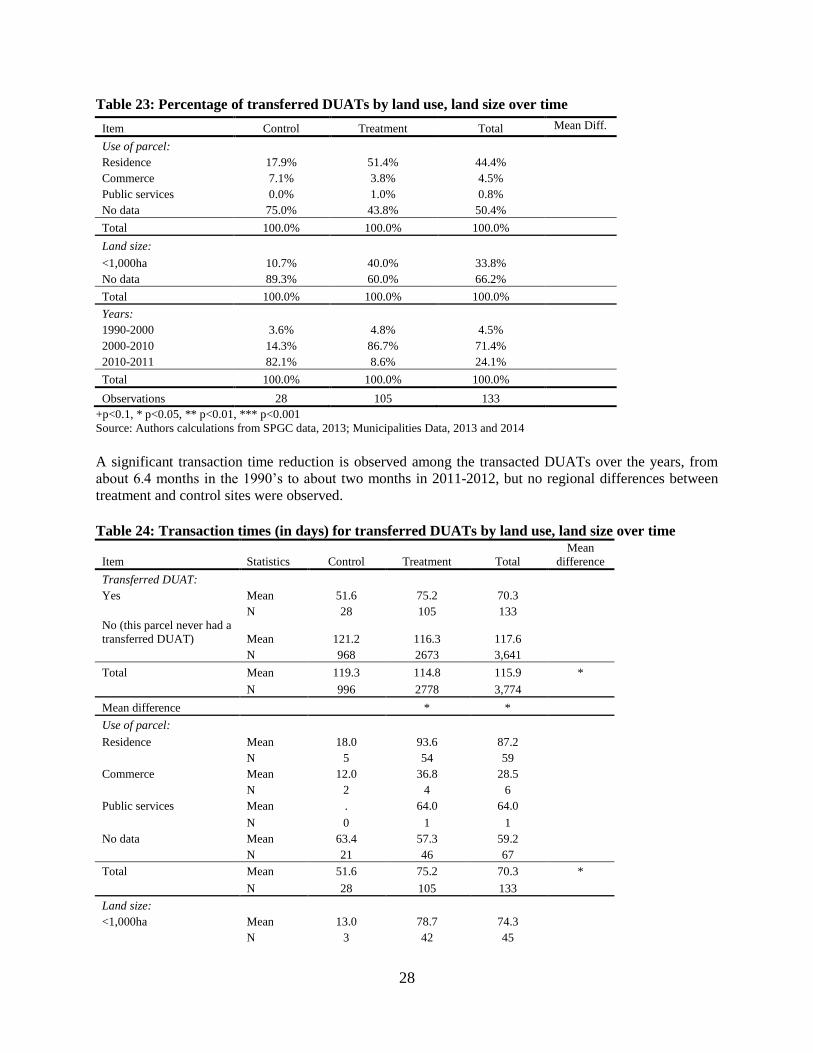
28
Table 23: Percentage of transferred DUATs by land use, land size over time
Item Control Treatment Total Mean Diff.
Use of parcel:
Residence 17.9% 51.4% 44.4%
Commerce 7.1% 3.8% 4.5%
Public services 0.0% 1.0% 0.8%
No data 75.0% 43.8% 50.4%
Total 100.0% 100.0% 100.0%
Land size:
<1,000ha 10.7% 40.0% 33.8%
No data 89.3% 60.0% 66.2%
Total 100.0% 100.0% 100.0%
Years:
1990-2000 3.6% 4.8% 4.5%
2000-2010 14.3% 86.7% 71.4%
2010-2011 82.1% 8.6% 24.1%
Total 100.0% 100.0% 100.0%
Observations 28 105 133
+p<0.1, * p<0.05, ** p<0.01, *** p<0.001 Source: Authors calculations from SPGC data, 2013; Municipalities Data, 2013 and 2014 A significant transaction time reduction is observed among the transacted DUATs over the years, from
about 6.4 months in the 1990’s to about two months in 2011-2012, but no regional differences between
treatment and control sites were observed.
Table 24: Transaction times (in days) for transferred DUATs by land use, land size over time
Item Statistics Control Treatment Total
Mean
difference
Transferred DUAT:
Yes Mean 51.6 75.2 70.3
N 28 105 133
No (this parcel never had a
transferred DUAT) Mean 121.2 116.3 117.6
N 968 2673 3,641
Total Mean 119.3 114.8 115.9 *
N 996 2778 3,774
Mean difference
* *
Use of parcel:
Residence Mean 18.0 93.6 87.2
N 5 54 59
Commerce Mean 12.0 36.8 28.5
N 2 4 6
Public services Mean . 64.0 64.0
N 0 1 1
No data Mean 63.4 57.3 59.2
N 21 46 67
Total Mean 51.6 75.2 70.3 *
N 28 105 133
Land size:
<1,000ha Mean 13.0 78.7 74.3
N 3 42 45
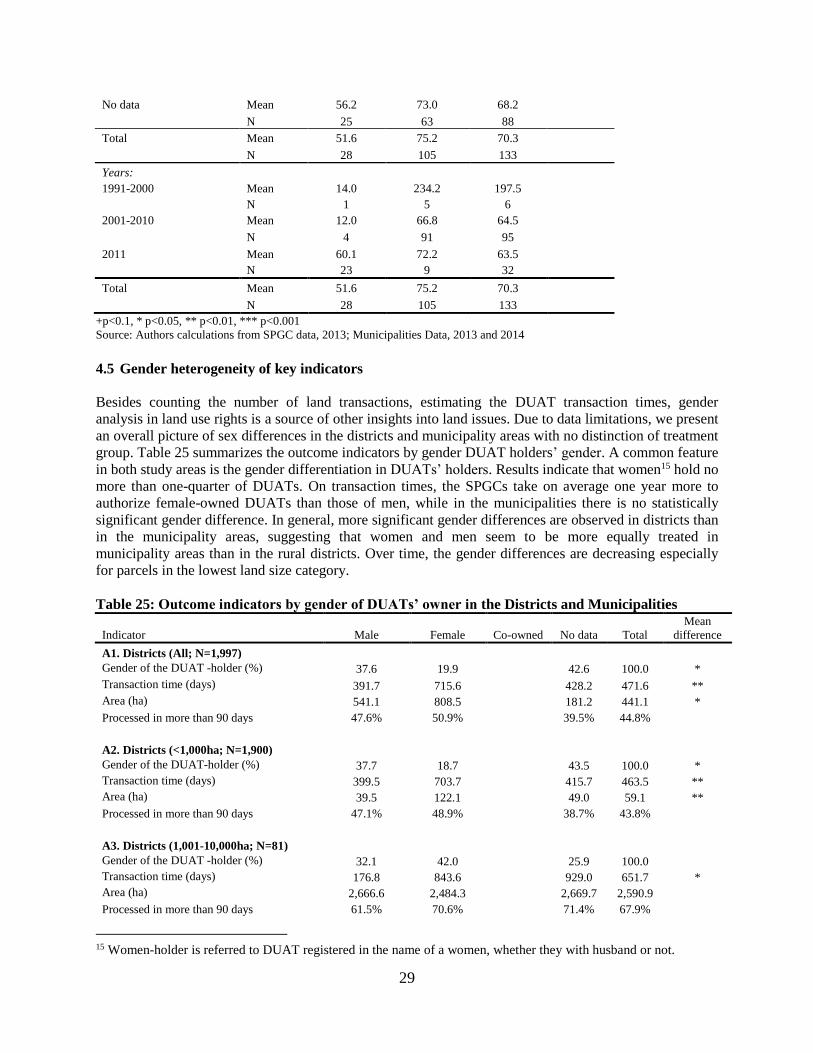
29
No data Mean 56.2 73.0 68.2
N 25 63 88
Total Mean 51.6 75.2 70.3
N 28 105 133
Years:
1991-2000 Mean 14.0 234.2 197.5
N 1 5 6
2001-2010 Mean 12.0 66.8 64.5
N 4 91 95
2011 Mean 60.1 72.2 63.5
N 23 9 32
Total Mean 51.6 75.2 70.3
N 28 105 133
+p<0.1, * p<0.05, ** p<0.01, *** p<0.001 Source: Authors calculations from SPGC data, 2013; Municipalities Data, 2013 and 2014 4.5 Gender heterogeneity of key indicators
Besides counting the number of land transactions, estimating the DUAT transaction times, gender
analysis in land use rights is a source of other insights into land issues. Due to data limitations, we present
an overall picture of sex differences in the districts and municipality areas with no distinction of treatment
group. Table 25 summarizes the outcome indicators by gender DUAT holders’ gender. A common feature
in both study areas is the gender differentiation in DUATs’ holders. Results indicate that women15 hold no
more than one-quarter of DUATs. On transaction times, the SPGCs take on average one year more to
authorize female-owned DUATs than those of men, while in the municipalities there is no statistically
significant gender difference. In general, more significant gender differences are observed in districts than
in the municipality areas, suggesting that women and men seem to be more equally treated in
municipality areas than in the rural districts. Over time, the gender differences are decreasing especially
for parcels in the lowest land size category.
Table 25: Outcome indicators by gender of DUATs’ owner in the Districts and Municipalities
Indicator Male Female Co-owned No data Total
Mean
difference
A1. Districts (All; N=1,997) Gender of the DUAT -holder (%) 37.6 19.9
42.6 100.0 *
Transaction time (days) 391.7 715.6 428.2 471.6 **
Area (ha) 541.1 808.5 181.2 441.1 *
Processed in more than 90 days 47.6% 50.9% 39.5% 44.8%
A2. Districts (<1,000ha; N=1,900)
Gender of the DUAT-holder (%) 37.7 18.7
43.5 100.0 *
Transaction time (days) 399.5 703.7
415.7 463.5 **
Area (ha) 39.5 122.1
49.0 59.1 **
Processed in more than 90 days 47.1% 48.9%
38.7% 43.8%
A3. Districts (1,001-10,000ha; N=81)
Gender of the DUAT -holder (%) 32.1 42.0 25.9 100.0
Transaction time (days) 176.8 843.6 929.0 651.7 *
Area (ha) 2,666.6 2,484.3 2,669.7 2,590.9
Processed in more than 90 days 61.5% 70.6% 71.4% 67.9%
15 Women-holder is referred to DUAT registered in the name of a women, whether they with husband or not.
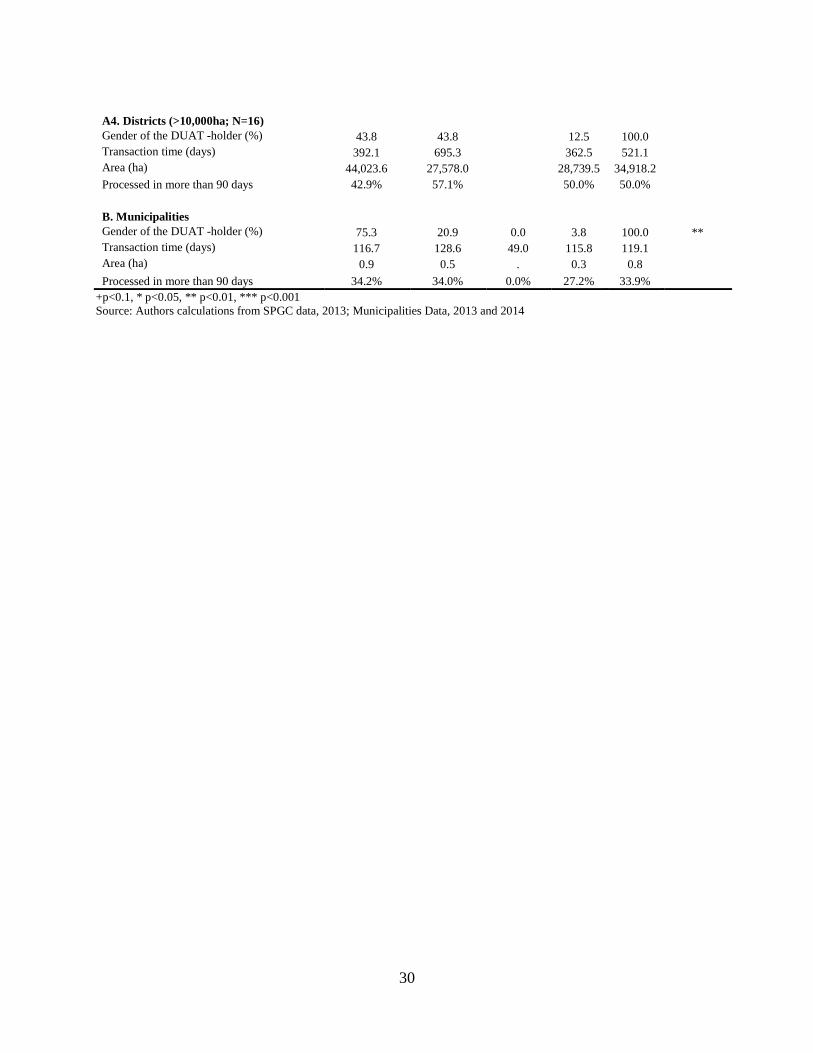
30
A4. Districts (>10,000ha; N=16)
Gender of the DUAT -holder (%) 43.8 43.8 12.5 100.0
Transaction time (days) 392.1 695.3 362.5 521.1
Area (ha) 44,023.6 27,578.0 28,739.5 34,918.2
Processed in more than 90 days 42.9% 57.1% 50.0% 50.0%
B. Municipalities
Gender of the DUAT -holder (%) 75.3 20.9 0.0 3.8 100.0 **
Transaction time (days) 116.7 128.6 49.0 115.8 119.1
Area (ha) 0.9 0.5 . 0.3 0.8
Processed in more than 90 days 34.2% 34.0% 0.0% 27.2% 33.9%
+p<0.1, * p<0.05, ** p<0.01, *** p<0.001
Source: Authors calculations from SPGC data, 2013; Municipalities Data, 2013 and 2014
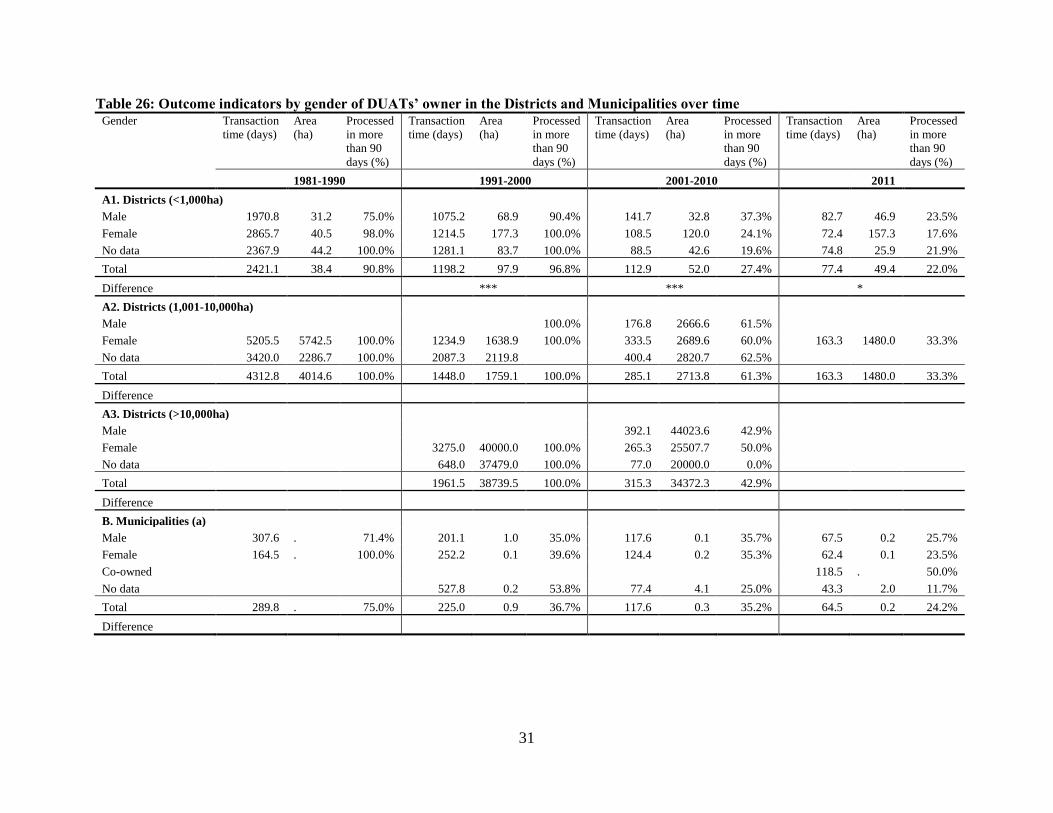
31
Table 26: Outcome indicators by gender of DUATs’ owner in the Districts and Municipalities over time Gender Transaction
time (days)
Area
(ha)
Processed
in more
than 90
days (%)
Transaction
time (days)
Area
(ha)
Processed
in more
than 90
days (%)
Transaction
time (days)
Area
(ha)
Processed
in more
than 90
days (%)
Transaction
time (days)
Area
(ha)
Processed
in more
than 90
days (%)
1981-1990 1991-2000 2001-2010 2011
A1. Districts (<1,000ha)
Male 1970.8 31.2 75.0% 1075.2 68.9 90.4% 141.7 32.8 37.3% 82.7 46.9 23.5%
Female 2865.7 40.5 98.0% 1214.5 177.3 100.0% 108.5 120.0 24.1% 72.4 157.3 17.6%
No data 2367.9 44.2 100.0% 1281.1 83.7 100.0% 88.5 42.6 19.6% 74.8 25.9 21.9%
Total 2421.1 38.4 90.8% 1198.2 97.9 96.8% 112.9 52.0 27.4% 77.4 49.4 22.0%
Difference *** *** *
A2. Districts (1,001-10,000ha)
Male
100.0% 176.8 2666.6 61.5%
Female 5205.5 5742.5 100.0% 1234.9 1638.9 100.0% 333.5 2689.6 60.0% 163.3 1480.0 33.3%
No data 3420.0 2286.7 100.0% 2087.3 2119.8 400.4 2820.7 62.5%
Total 4312.8 4014.6 100.0% 1448.0 1759.1 100.0% 285.1 2713.8 61.3% 163.3 1480.0 33.3%
Difference
A3. Districts (>10,000ha)
Male
392.1 44023.6 42.9%
Female
3275.0 40000.0 100.0% 265.3 25507.7 50.0%
No data
648.0 37479.0 100.0% 77.0 20000.0 0.0%
Total 1961.5 38739.5 100.0% 315.3 34372.3 42.9%
Difference
B. Municipalities (a)
Male 307.6 . 71.4% 201.1 1.0 35.0% 117.6 0.1 35.7% 67.5 0.2 25.7%
Female 164.5 . 100.0% 252.2 0.1 39.6% 124.4 0.2 35.3% 62.4 0.1 23.5%
Co-owned
118.5 . 50.0%
No data
527.8 0.2 53.8% 77.4 4.1 25.0% 43.3 2.0 11.7%
Total 289.8 . 75.0% 225.0 0.9 36.7% 117.6 0.3 35.2% 64.5 0.2 24.2%
Difference
32
5 Conclusions and Recommendations
The major findings of this baseline report are:
Trend in the number of land transactions
The number of DUAT transactions in districts and municipalities within the four provinces had a
contrasting pattern. Districts with the largest number of DUATs are located in the provinces in which the
municipalities registered the smallest number of DUATs and vice-versa.
In general, the majority DUATs in the districts are of the lower land size category of smaller than 1,000
hectares, and there are significant differences in the number of DUATs in that land size group between
the treatment and the control areas.
Although the majority of parcels with DUATs are mainly used for residential (85 percent) and
commerce/industrial (11 percent) purposes in the municipality areas and about 36 for residential and 16
percent for commercial/industrial use in the districts, the main use of parcels with DUATs vary with land
size. While the two main uses of parcels less than 1,000 hectares are residential and agricultural
production, the main uses for parcels between 1,001 and 10,000 hectares are for forest plantation and
mixed crop-livestock production, and those with 10,000 hectares or more are mainly used for forest
plantation and community services.
There is large variability in land size by main use, with the largest areas in Districts used for livestock
production, forest plantations and a small percentage for residential use, while in the Municipalities the
largest areas are used for public services, agriculture, and industry, with the smallest parcels used for
residential. Breaking down the parcels under 1,000 ha in the municipalities reveals that the majority of the
small farm parcels (less than 10 ha) are used for residential purposes, the majority of medium farm
parcels (10-50 ha) for agricultural purposes and surprisingly, more than three-quarters of the large farms
(greater than 50 ha) for residence. The results on the last two farm size groups are biased by the number
of parcels with valid information on their use which is about one-fifth of all recorded DUATs.
Results show an increasing demand for land use rights as shown by the increasing number of land
transactions over time. The land size pattern shows a reciprocal trend, with an expansion in the number of
transactions in the districts areas and reduction in the number of transactions in the municipality areas.
This could be explained by the relative land abundance in the rural areas and an increased population
pressure and density in the urban areas.
Results indicate that women hold no more than one-quarter of DUATs. A common characteristic in both
study areas is the gender differentiation in holding DUATs. Women hold no more than one-quarter of the
DUATs in rural areas and the SPGCs take an average 8 months more to authorize female-owned DUATs
than those of men (equivalent to 0.13 days per square meter more), while in the municipalities this
difference is not apparent (on average for both and women DUAT-holders it takes 0.77 days per square
meter). In general, significant gender differences are observed more in rural areas compared to urban
areas, suggesting that women and men seem to be more equally treated in urban areas than in rural areas.
Results indicate a significant advantage of male-ownership in districts (rural areas), suggesting gender
differences in how land use rights are treated in the districts which in part could be the result of limited
land legislation knowledge of women or traditional cultural or socioeconomic barriers to accessing the
services. Therefore, we recommend an intensification of Land Law dissemination to improve awareness
of land rights, especially in women.
33
DUAT transaction times
In general, the registration of land use rights is still a lengthy and complex process with districts taking a
much longer time to authorize a registration of land use rights compared to municipalities. The processing
times also vary with land use (and consequently land size as per correlation above), where DUATs for
agricultural production, livestock, and residence and commerce/industry uses take more than a year to be
authorized in the rural districts, while those taking the longest periods in the municipalities are used for
agricultural production, social religious, and residential purposes.
Although the authorization process is lengthy, an impressive progress in both district and municipalities
with significant differences between treatment and control sites in each region only in earlier periods
(1980’s and 2011) is observed. From as much as seven years in the 1980’s, this performance has
improved to about 80 days in the two years preceding the LTR’s intervention (2010 and 2011) in the
districts and from about eight months in the 1980’s to about 65 days in the municipalities during the same
period.
Our results show that DUAT transaction times are positively associated with the size of the parcels,
suggesting high flexibility of the lower authority level (provincial governor) in processing land use rights
compared to higher authority level such as the Minister of Agriculture or Prime Minister. This association
not only is caused by the size of the parcels involved but with additional steps required when it is to
authorize DUATs on parcels with an area larger than 1,000 ha. On transaction times, the SPGCs take on
average one year more to authorize female-owned DUATs than those of men, while in the municipalities
this difference is not apparent.
There are significant inter-regional (districts and municipalities) differences in DUAT transaction times.
It takes much longer to obtain land use title in districts than in the municipality areas. Intra-regional
differences regarding DUAT transaction times are observed only for parcels for agricultural production,
forest plantation and residential purposes in the districts but not in the municipalities except those parcels
used for residential and industrial use. While in the districts the control sites perform better than the
treatment sites, the opposite is observed in municipalities.
Although there are significant inter-regional differences in DUAT’s transaction times, the proportion of
DUAT application processed within 90 days is not significantly different between regions. This indicates
the impressive progress in the districts from reducing dramatically the DUAT transaction times over time
(large transaction times in earlier periods are driving the mean transaction times) and suggests the need to
use both measures to analyze the performance of the land administrative units on processing DUAT
applications.
DUAT land conflicts
The formal registration of land related conflicts is still in the incipient stage. The land conflicts are mostly
reported and resolved at the community level, and very few require the intermediation of formal
authorities and are mostly not formally reported to the land administration units. To our knowledge, only
two land conflicts in the one municipality (Mocimboa da Praia) able to collect data were formally
registered in the Municipality data base, but a total of 242 cases were informally reported to the
municipality authorities visited. Systematic records of conflicts in a log book are available in the
municipality of Mocimboa da Praia but the limited number of cases prevented us from undertaking a
rigorous analysis of land conflicts as previously intended.
DUAT transfers
The formal land market is thin as indicated by only about 4 percent of total parcels with DUATs having
been transferred and formally reported to the municipality authorities between 1988 and 2011 (before
LTR). The small number of DUAT transfer is partly the result of the transfer-related legal limitation
34
given that by the land legislation posits that land is a State properly which can be leased to land users,
therefore limiting a free transfer among landholders. It is noteworthy that these transfers are equally
distributed between treatment and control areas in number and DUAT transaction times but unequally
distributed regarding use and gender of the DUAT holder. Transferred DUATs are mainly used for
residential purposes, and a large majority of these transfers (75 percent) were owned by males mostly in
treatment areas.
It is also important to note that the transaction time for transferred parcels are significantly different from
that for not transferred parcels, with those transferred being approved in a shorter period than the others;
these differences are most significant in the treatment areas than in the control zones.
6 Implications to Evaluation and Next Steps
We recommend a follow-up data collection to capture the post-project period to be scheduled for
2018/2019, which will allow for about 4-5 years of useful post-reform data for analysis. This timeline is
intended to allow for few years of the additional intervention period and results to take effect. One other
aspect to be considered is that the data collection should be conducted before any of the control areas
starts to receive similar programs to avoid contamination. Given these are administrative records data
from municipal and district land administration offices, it is not difficult to find out whether any of the
control districts/municipalities received similar intervention between 2012 and 2018/2019, and if so when
it occurred. This additional information would allow us to exclude the contaminated data from the
evaluation.
A critical aspect in impact evaluation is the comparability of treatment/controls pre-intervention. Baseline
results show significant differences between treatment/comparisons. However, these significant
differences between treatment and control sites were mainly observed in the earlier periods where
treatment sites had larger processing times than their counterparts. In the most recent periods, these
differences were minimal or none. The fact that the difference for many variables (especially the outcome
variables) between the treatment and control sites are significant overall and in early periods
(1980s/1990s) but not in the most recent period (2000s) suggests that the baseline should not go far back
before the project intervention.
Also, the matching exercise could also be implemented to improve the comparability between treatment
and control areas. The results from the matching exercise are presented in Annex 5 show how matching
removed significant differences between the treatment and control groups. For the districts, the results
show a greater reduction of differences when using the last 11 years, while fairly balanced samples
without matching are observed within the last five years. In the municipalities, balanced samples are
found using the 11-year and 2011 samples and unlike the case of the districts, the balance using the last
five years as baseline is not as good as that using the last 11 years. Perhaps, given the differences in the
number of DUATs registered between districts and municipalities, the different cut-off period may be
adopted.
We also tested the potential contamination due to pre- and post-intervention outreach activities using the
current data and records for two years post intervention to estimate equation 3 in page 10 (note that the
records that we had access to refer to sporadic only). We estimated the average treatment effect of the
LTR controlling for the observed characteristics and four models were estimated by progressively adding
more covariates to an initial model which has treatment/control as the only explanatory variable on
DUATs transaction times as the dependent variable, and the results are reported in Annex 4.
35
Essentially, this analysis aims to test that: (i) there are no statistical differences between treatment and
control sites; ceteris paribus (ii) there is no contamination effect (we don’t need to implement a buffer
period). We are therefore, suggesting to use data from years immediately after the implementation of the
activities because of the contamination effects of the program (i.e., artificially speeding DUAT process
and low cost of DUAT issuance or due to delays in implementation some activities being implemented
even if the official termination date has passed) to avoid biased estimates. While it is important to
exclude the data from these earlier years -- there is no standard rule as to how many years should be
excluded, we think it is reasonable to assume that the contamination effects is likely to be significant after
2 years from the completion of the intervention, however a formal test is necessary, and we used two
years immediately after the intervention to test the contamination hypothesis. Rejecting the null
hypothesis that the coefficient of time variable is zero, suggests no contamination effect and the estimates
of average partial effect is the short-term effect of the project intervention.
The current evaluation design uses the administrative records which in some cases are
unavailable in digital form which possesses challenges in acquiring reliable data (quality and
quantity), therefore, we recommend to improve data collection through the use of the LIMS,
which is expected to be installed and running by the time of follow-up data collection. Some
control sites in the Municipalities have initiated the digitalization of land use rights which is
expected to continue, minimizing the laborious record scanning exercise. In cases where
scanning is required, an effort of accessing DUAT, transfers, and conflicts records should be
made. Currently, these are stored in different locations (paper files, log books) and mostly with
incomplete information (e.g. area, use). Other relevant information on physical, human capacity
of cadastral offices should be collected.
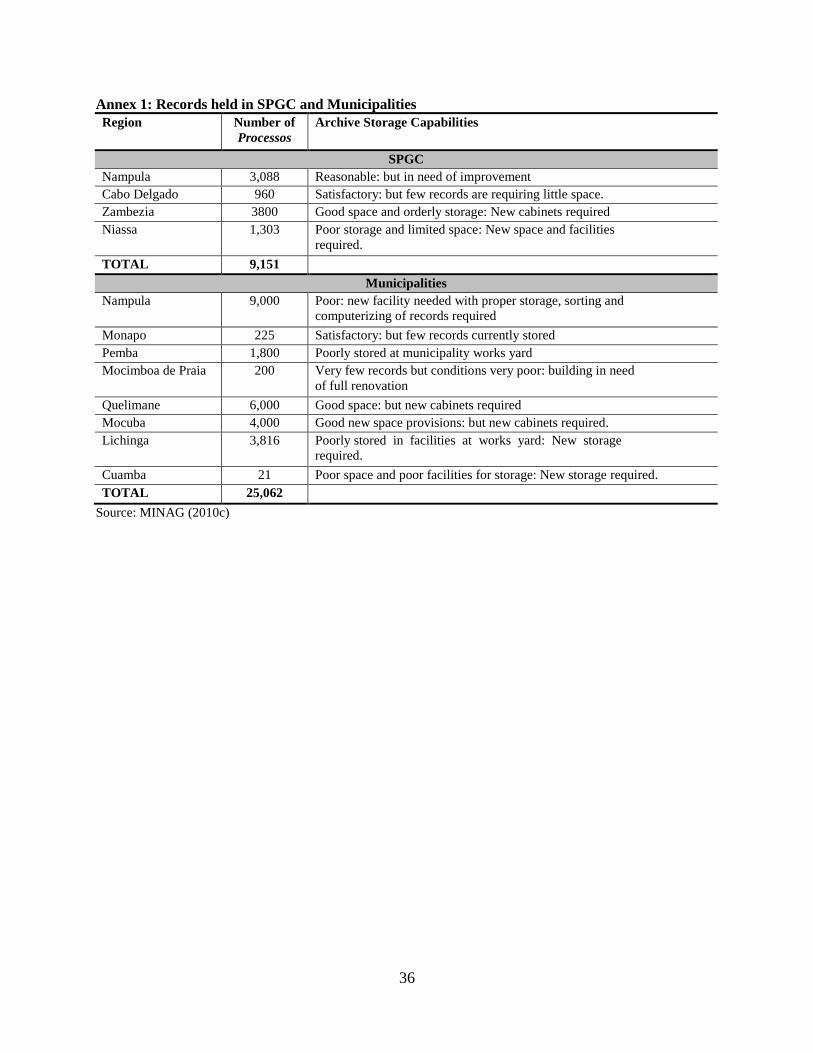
36
Annex 1: Records held in SPGC and Municipalities
Region Number of
Processos
Archive Storage Capabilities
SPGC
Nampula 3,088 Reasonable: but in need of improvement
Cabo Delgado 960 Satisfactory: but few records are requiring little space.
Zambezia 3800 Good space and orderly storage: New cabinets required
Niassa 1,303 Poor storage and limited space: New space and facilities
required.
TOTAL 9,151
Municipalities
Nampula 9,000 Poor: new facility needed with proper storage, sorting and
computerizing of records required
Monapo 225 Satisfactory: but few records currently stored
Pemba 1,800 Poorly stored at municipality works yard
Mocimboa de Praia 200 Very few records but conditions very poor: building in need
of full renovation
Quelimane 6,000 Good space: but new cabinets required
Mocuba 4,000 Good new space provisions: but new cabinets required.
Lichinga 3,816 Poorly stored in facilities at works yard: New storage
required.
Cuamba 21 Poor space and poor facilities for storage: New storage required.
TOTAL 25,062
Source: MINAG (2010c)
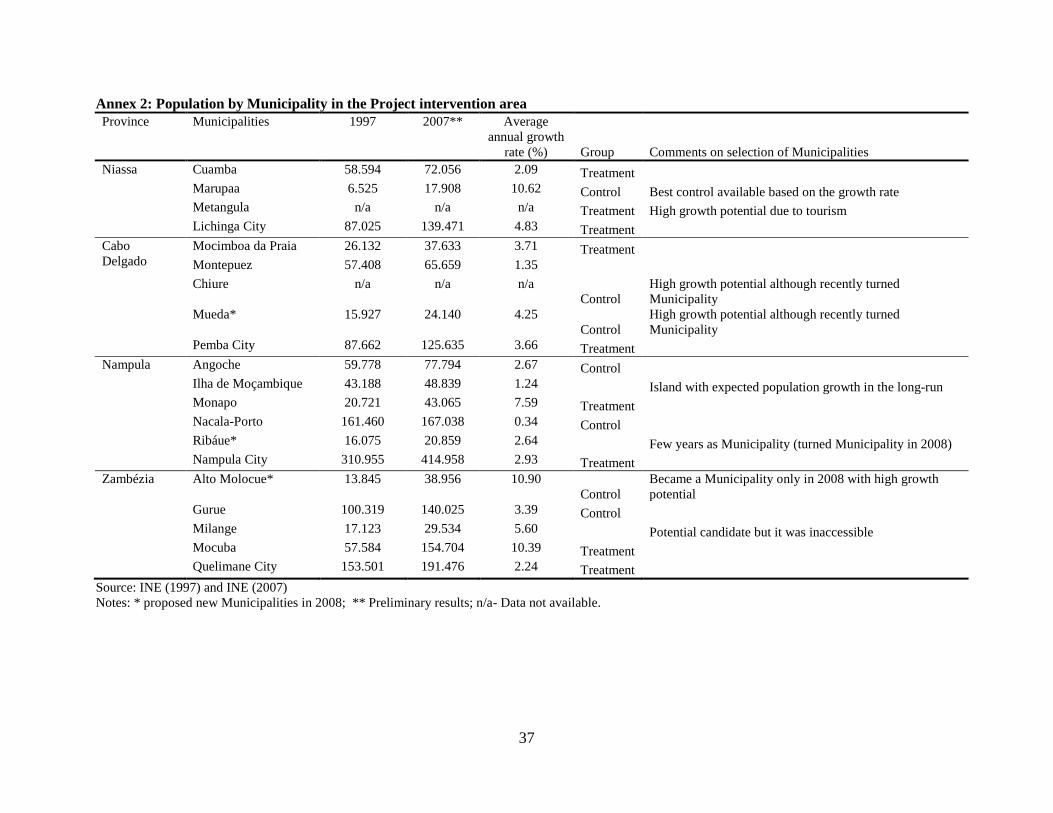
37
Annex 2: Population by Municipality in the Project intervention area
Province Municipalities 1997 2007** Average
annual growth
rate (%) Group Comments on selection of Municipalities
Niassa Cuamba 58.594 72.056 2.09 Treatment
Marupaa 6.525 17.908 10.62 Control Best control available based on the growth rate
Metangula n/a n/a n/a Treatment High growth potential due to tourism
Lichinga City 87.025 139.471 4.83 Treatment
Cabo
Delgado
Mocimboa da Praia 26.132 37.633 3.71 Treatment
Montepuez 57.408 65.659 1.35
Chiure n/a n/a n/a
Control
High growth potential although recently turned
Municipality
Mueda* 15.927 24.140 4.25
Control
High growth potential although recently turned
Municipality
Pemba City 87.662 125.635 3.66 Treatment
Nampula Angoche 59.778 77.794 2.67 Control
Ilha de Moçambique 43.188 48.839 1.24
Island with expected population growth in the long-run
Monapo 20.721 43.065 7.59 Treatment
Nacala-Porto 161.460 167.038 0.34 Control
Ribáue* 16.075 20.859 2.64
Few years as Municipality (turned Municipality in 2008)
Nampula City 310.955 414.958 2.93 Treatment
Zambézia Alto Molocue* 13.845 38.956 10.90
Control
Became a Municipality only in 2008 with high growth
potential
Gurue 100.319 140.025 3.39 Control
Milange 17.123 29.534 5.60
Potential candidate but it was inaccessible
Mocuba 57.584 154.704 10.39 Treatment
Quelimane City 153.501 191.476 2.24 Treatment
Source: INE (1997) and INE (2007)
Notes: * proposed new Municipalities in 2008; ** Preliminary results; n/a- Data not available.
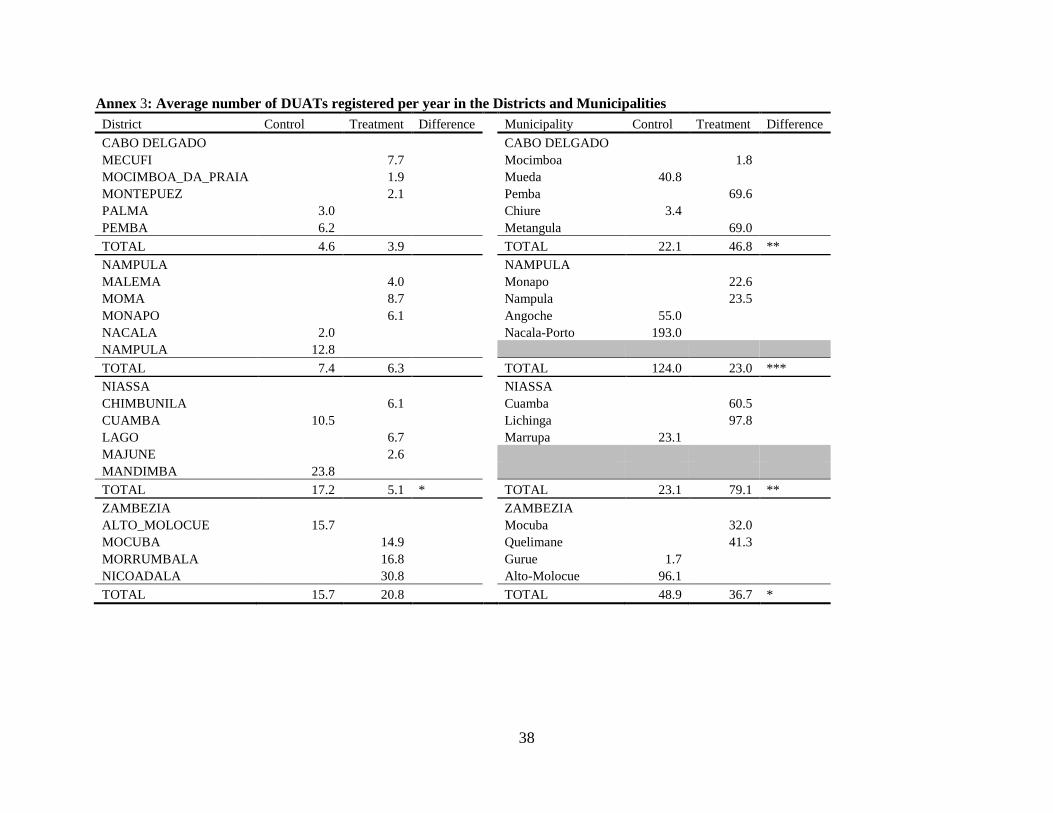
38
Annex 3: Average number of DUATs registered per year in the Districts and Municipalities
District Control Treatment Difference
Municipality Control Treatment Difference
CABO DELGADO
CABO DELGADO
MECUFI
7.7
Mocimboa
1.8
MOCIMBOA_DA_PRAIA
1.9
Mueda 40.8
MONTEPUEZ
2.1
Pemba
69.6
PALMA 3.0
Chiure 3.4
PEMBA 6.2
Metangula
69.0
TOTAL 4.6 3.9
TOTAL 22.1 46.8 **
NAMPULA
NAMPULA
MALEMA
4.0
Monapo
22.6
MOMA
8.7
Nampula
23.5
MONAPO
6.1
Angoche 55.0
NACALA 2.0
Nacala-Porto 193.0
NAMPULA 12.8
TOTAL 7.4 6.3
TOTAL 124.0 23.0 ***
NIASSA
NIASSA
CHIMBUNILA
6.1
Cuamba
60.5
CUAMBA 10.5
Lichinga
97.8
LAGO
6.7
Marrupa 23.1
MAJUNE
2.6
MANDIMBA 23.8
TOTAL 17.2 5.1 *
TOTAL 23.1 79.1 **
ZAMBEZIA
ZAMBEZIA
ALTO_MOLOCUE 15.7
Mocuba
32.0
MOCUBA
14.9
Quelimane
41.3
MORRUMBALA
16.8
Gurue 1.7
NICOADALA
30.8
Alto-Molocue 96.1
TOTAL 15.7 20.8
TOTAL 48.9 36.7 *
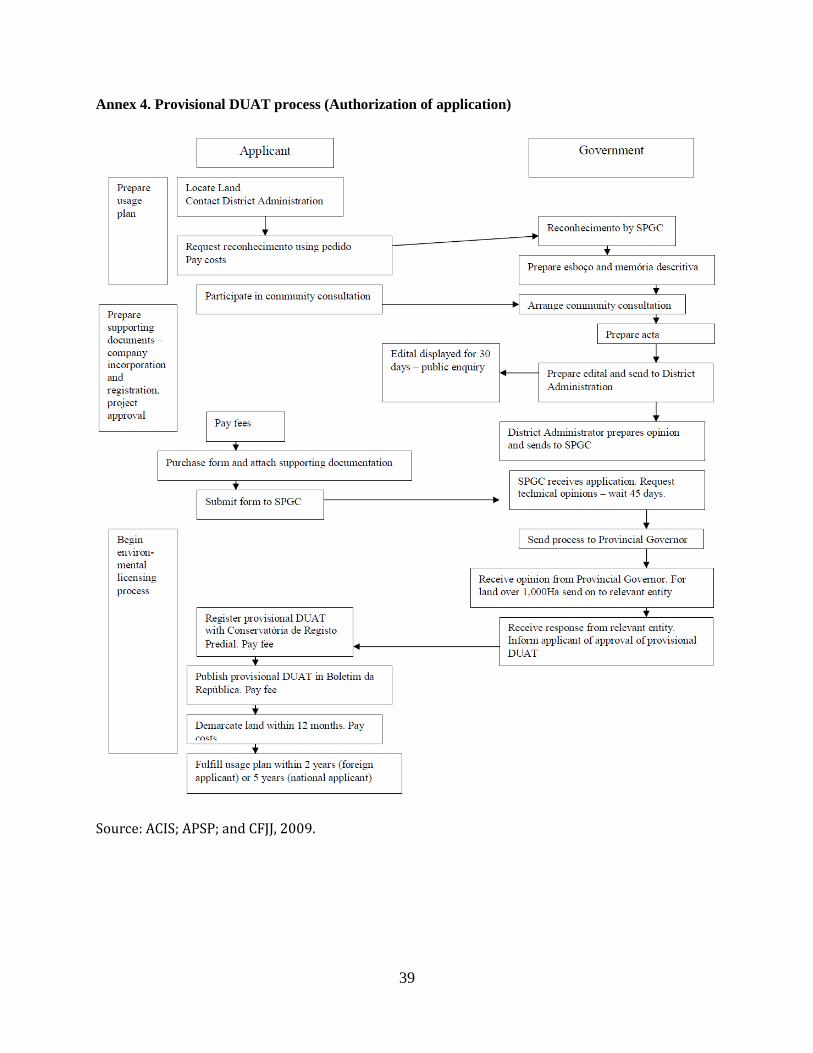
39
Annex 4. Provisional DUAT process (Authorization of application)
Source: ACIS; APSP; and CFJJ, 2009.
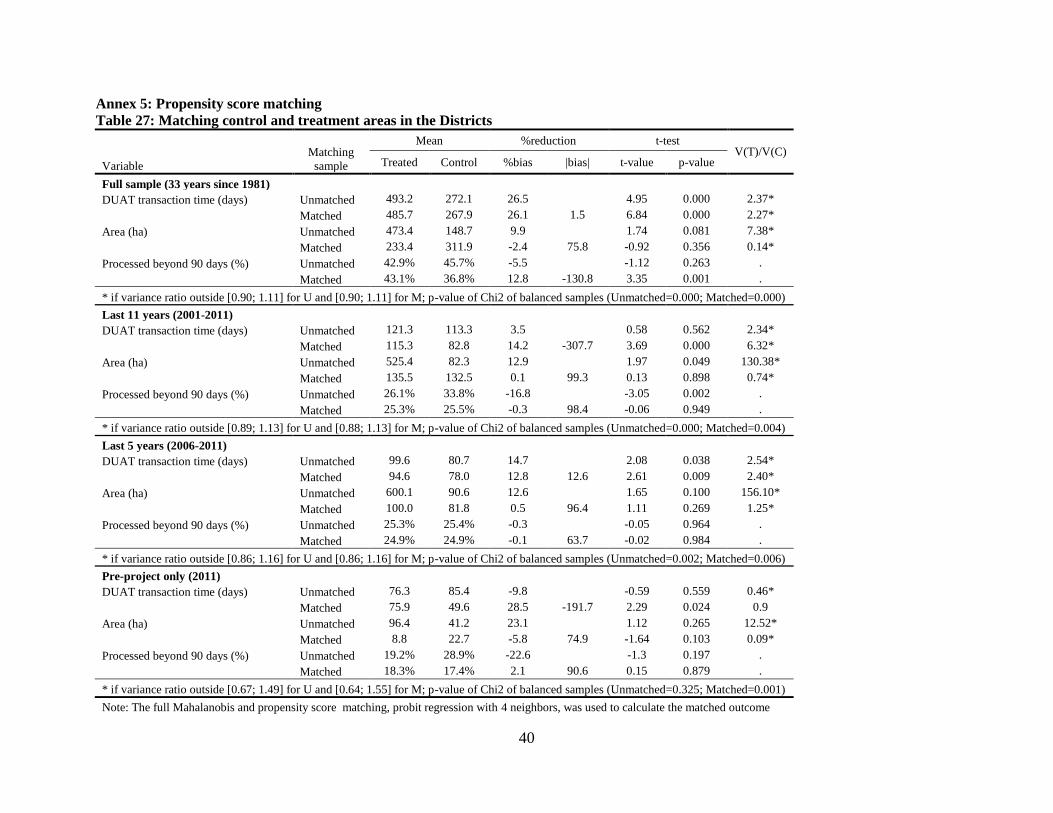
40
Annex 5: Propensity score matching
Table 27: Matching control and treatment areas in the Districts
Matching
sample
Mean %reduction t-test V(T)/V(C)
Variable Treated Control %bias |bias| t-value p-value
Full sample (33 years since 1981)
DUAT transaction time (days) Unmatched 493.2 272.1 26.5
4.95 0.000 2.37*
Matched 485.7 267.9 26.1 1.5 6.84 0.000 2.27*
Area (ha) Unmatched 473.4 148.7 9.9
1.74 0.081 7.38*
Matched 233.4 311.9 -2.4 75.8 -0.92 0.356 0.14*
Processed beyond 90 days (%) Unmatched 42.9% 45.7% -5.5
-1.12 0.263 .
Matched 43.1% 36.8% 12.8 -130.8 3.35 0.001 .
* if variance ratio outside [0.90; 1.11] for U and [0.90; 1.11] for M; p-value of Chi2 of balanced samples (Unmatched=0.000; Matched=0.000)
Last 11 years (2001-2011)
DUAT transaction time (days) Unmatched 121.3 113.3 3.5
0.58 0.562 2.34*
Matched 115.3 82.8 14.2 -307.7 3.69 0.000 6.32*
Area (ha) Unmatched 525.4 82.3 12.9
1.97 0.049 130.38*
Matched 135.5 132.5 0.1 99.3 0.13 0.898 0.74*
Processed beyond 90 days (%) Unmatched 26.1% 33.8% -16.8
-3.05 0.002 .
Matched 25.3% 25.5% -0.3 98.4 -0.06 0.949 .
* if variance ratio outside [0.89; 1.13] for U and [0.88; 1.13] for M; p-value of Chi2 of balanced samples (Unmatched=0.000; Matched=0.004)
Last 5 years (2006-2011)
DUAT transaction time (days) Unmatched 99.6 80.7 14.7
2.08 0.038 2.54*
Matched 94.6 78.0 12.8 12.6 2.61 0.009 2.40*
Area (ha) Unmatched 600.1 90.6 12.6
1.65 0.100 156.10*
Matched 100.0 81.8 0.5 96.4 1.11 0.269 1.25*
Processed beyond 90 days (%) Unmatched 25.3% 25.4% -0.3
-0.05 0.964 .
Matched 24.9% 24.9% -0.1 63.7 -0.02 0.984 .
* if variance ratio outside [0.86; 1.16] for U and [0.86; 1.16] for M; p-value of Chi2 of balanced samples (Unmatched=0.002; Matched=0.006)
Pre-project only (2011)
DUAT transaction time (days) Unmatched 76.3 85.4 -9.8
-0.59 0.559 0.46*
Matched 75.9 49.6 28.5 -191.7 2.29 0.024 0.9
Area (ha) Unmatched 96.4 41.2 23.1
1.12 0.265 12.52*
Matched 8.8 22.7 -5.8 74.9 -1.64 0.103 0.09*
Processed beyond 90 days (%) Unmatched 19.2% 28.9% -22.6
-1.3 0.197 .
Matched 18.3% 17.4% 2.1 90.6 0.15 0.879 .
* if variance ratio outside [0.67; 1.49] for U and [0.64; 1.55] for M; p-value of Chi2 of balanced samples (Unmatched=0.325; Matched=0.001)
Note: The full Mahalanobis and propensity score matching, probit regression with 4 neighbors, was used to calculate the matched outcome
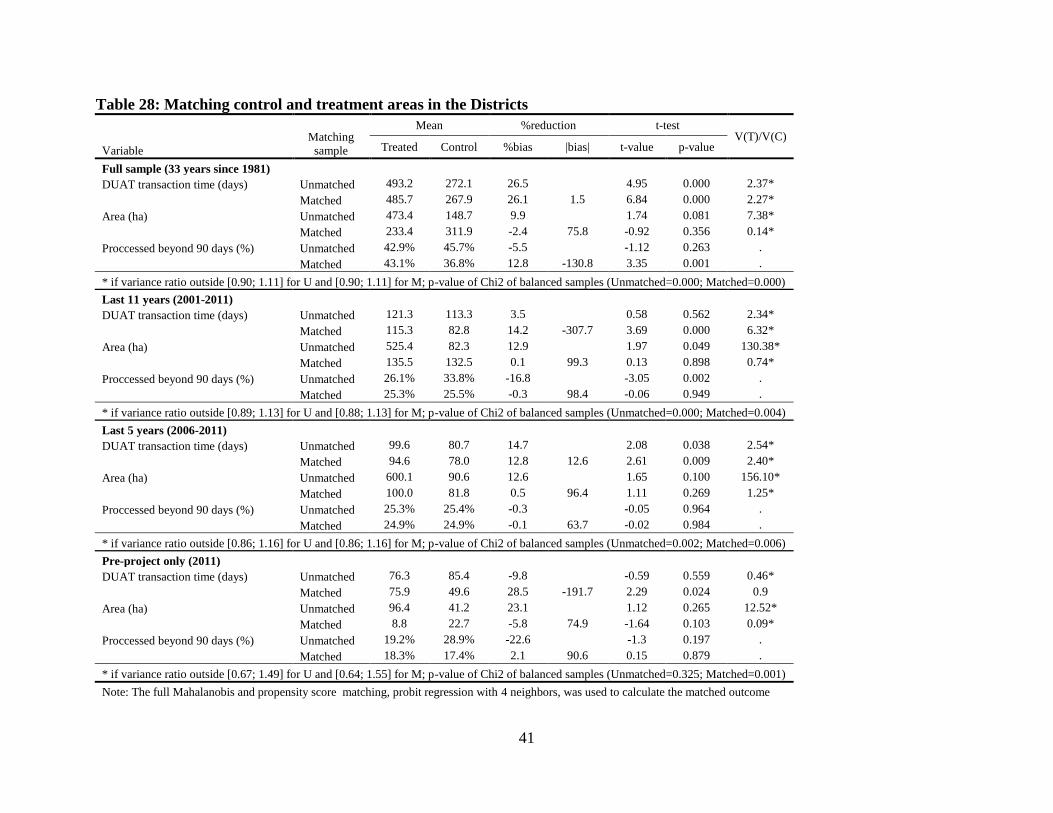
41
Table 28: Matching control and treatment areas in the Districts
Matching
sample
Mean %reduction t-test V(T)/V(C)
Variable Treated Control %bias |bias| t-value p-value
Full sample (33 years since 1981)
DUAT transaction time (days) Unmatched 493.2 272.1 26.5
4.95 0.000 2.37*
Matched 485.7 267.9 26.1 1.5 6.84 0.000 2.27*
Area (ha) Unmatched 473.4 148.7 9.9
1.74 0.081 7.38*
Matched 233.4 311.9 -2.4 75.8 -0.92 0.356 0.14*
Proccessed beyond 90 days (%) Unmatched 42.9% 45.7% -5.5
-1.12 0.263 .
Matched 43.1% 36.8% 12.8 -130.8 3.35 0.001 .
* if variance ratio outside [0.90; 1.11] for U and [0.90; 1.11] for M; p-value of Chi2 of balanced samples (Unmatched=0.000; Matched=0.000)
Last 11 years (2001-2011)
DUAT transaction time (days) Unmatched 121.3 113.3 3.5
0.58 0.562 2.34*
Matched 115.3 82.8 14.2 -307.7 3.69 0.000 6.32*
Area (ha) Unmatched 525.4 82.3 12.9
1.97 0.049 130.38*
Matched 135.5 132.5 0.1 99.3 0.13 0.898 0.74*
Proccessed beyond 90 days (%) Unmatched 26.1% 33.8% -16.8
-3.05 0.002 .
Matched 25.3% 25.5% -0.3 98.4 -0.06 0.949 .
* if variance ratio outside [0.89; 1.13] for U and [0.88; 1.13] for M; p-value of Chi2 of balanced samples (Unmatched=0.000; Matched=0.004)
Last 5 years (2006-2011)
DUAT transaction time (days) Unmatched 99.6 80.7 14.7
2.08 0.038 2.54*
Matched 94.6 78.0 12.8 12.6 2.61 0.009 2.40*
Area (ha) Unmatched 600.1 90.6 12.6
1.65 0.100 156.10*
Matched 100.0 81.8 0.5 96.4 1.11 0.269 1.25*
Proccessed beyond 90 days (%) Unmatched 25.3% 25.4% -0.3
-0.05 0.964 .
Matched 24.9% 24.9% -0.1 63.7 -0.02 0.984 .
* if variance ratio outside [0.86; 1.16] for U and [0.86; 1.16] for M; p-value of Chi2 of balanced samples (Unmatched=0.002; Matched=0.006)
Pre-project only (2011)
DUAT transaction time (days) Unmatched 76.3 85.4 -9.8
-0.59 0.559 0.46*
Matched 75.9 49.6 28.5 -191.7 2.29 0.024 0.9
Area (ha) Unmatched 96.4 41.2 23.1
1.12 0.265 12.52*
Matched 8.8 22.7 -5.8 74.9 -1.64 0.103 0.09*
Proccessed beyond 90 days (%) Unmatched 19.2% 28.9% -22.6
-1.3 0.197 .
Matched 18.3% 17.4% 2.1 90.6 0.15 0.879 .
* if variance ratio outside [0.67; 1.49] for U and [0.64; 1.55] for M; p-value of Chi2 of balanced samples (Unmatched=0.325; Matched=0.001)
Note: The full Mahalanobis and propensity score matching, probit regression with 4 neighbors, was used to calculate the matched outcome
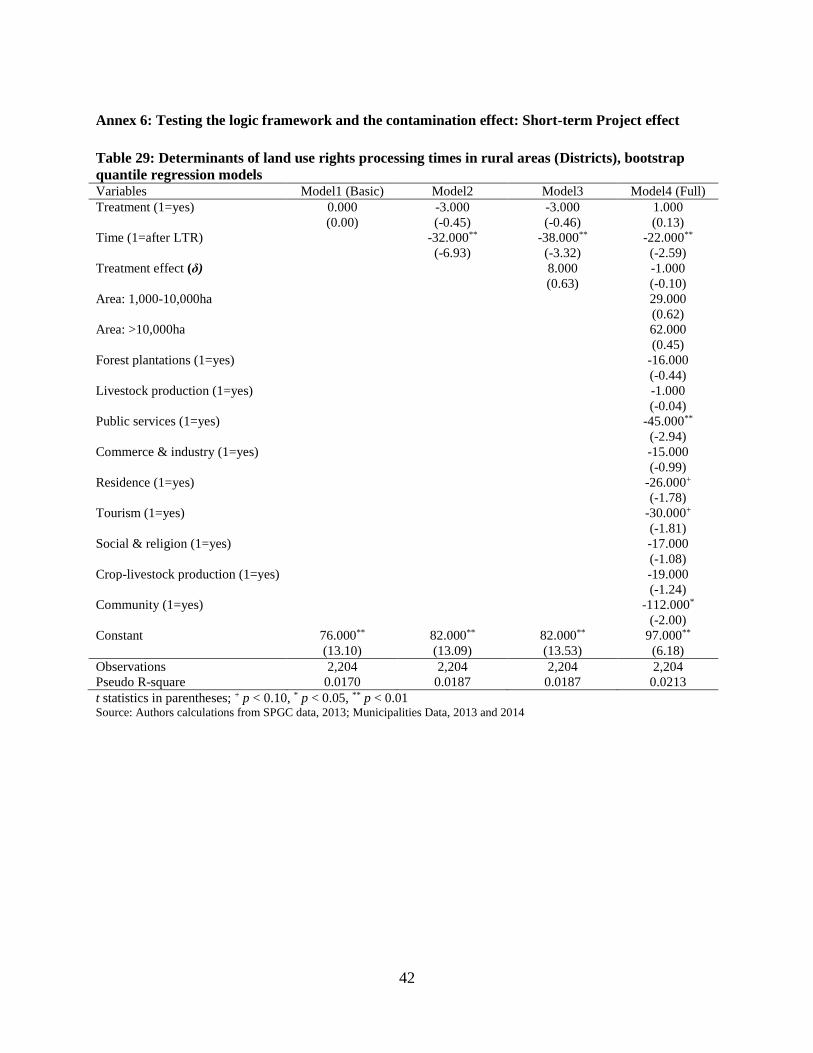
42
Annex 6: Testing the logic framework and the contamination effect: Short-term Project effect
Table 29: Determinants of land use rights processing times in rural areas (Districts), bootstrap
quantile regression models Variables Model1 (Basic) Model2 Model3 Model4 (Full)
Treatment (1=yes) 0.000 -3.000 -3.000 1.000
(0.00) (-0.45) (-0.46) (0.13)
Time (1=after LTR) -32.000** -38.000** -22.000**
(-6.93) (-3.32) (-2.59)
Treatment effect (δ) 8.000 -1.000
(0.63) (-0.10)
Area: 1,000-10,000ha 29.000
(0.62)
Area: >10,000ha 62.000
(0.45)
Forest plantations (1=yes) -16.000
(-0.44)
Livestock production (1=yes) -1.000
(-0.04)
Public services (1=yes) -45.000**
(-2.94)
Commerce & industry (1=yes) -15.000
(-0.99)
Residence (1=yes) -26.000+
(-1.78)
Tourism (1=yes) -30.000+
(-1.81)
Social & religion (1=yes) -17.000
(-1.08)
Crop-livestock production (1=yes) -19.000
(-1.24)
Community (1=yes) -112.000*
(-2.00)
Constant 76.000** 82.000** 82.000** 97.000**
(13.10) (13.09) (13.53) (6.18)
Observations 2,204 2,204 2,204 2,204
Pseudo R-square 0.0170 0.0187 0.0187 0.0213
t statistics in parentheses; + p < 0.10, * p < 0.05, ** p < 0.01 Source: Authors calculations from SPGC data, 2013; Municipalities Data, 2013 and 2014
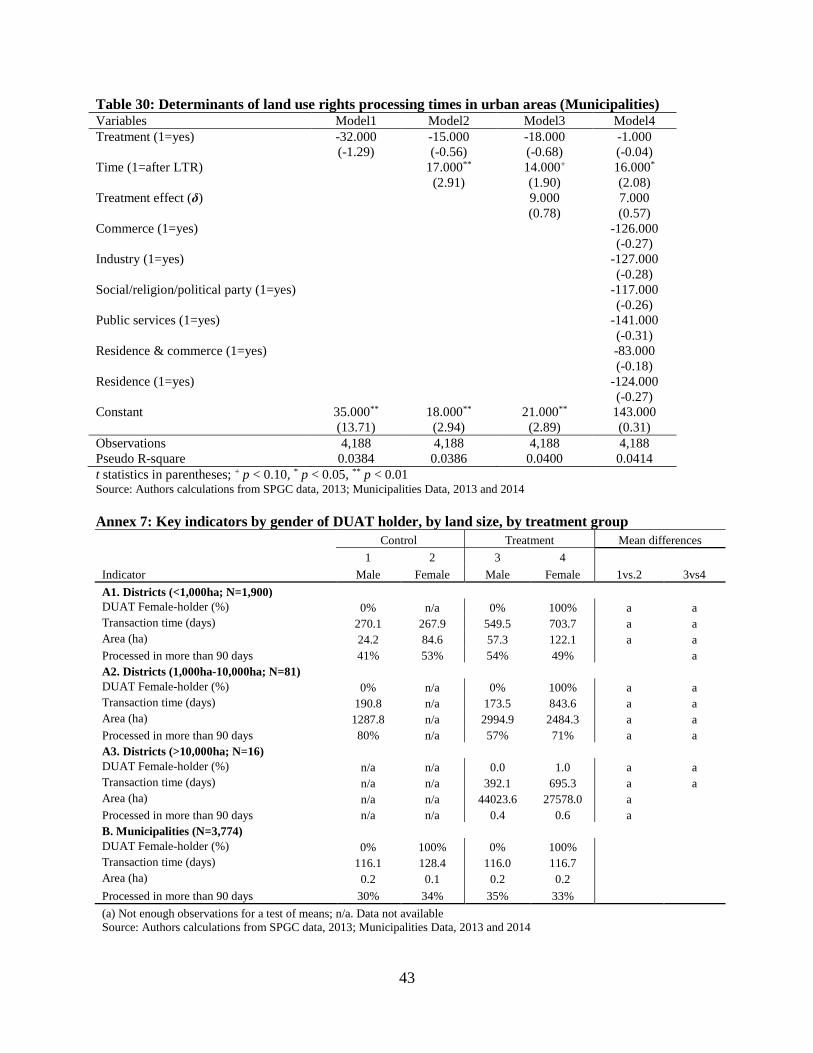
43
Table 30: Determinants of land use rights processing times in urban areas (Municipalities) Variables Model1 Model2 Model3 Model4
Treatment (1=yes) -32.000 -15.000 -18.000 -1.000
(-1.29) (-0.56) (-0.68) (-0.04)
Time (1=after LTR) 17.000** 14.000+ 16.000*
(2.91) (1.90) (2.08)
Treatment effect (δ) 9.000 7.000
(0.78) (0.57)
Commerce (1=yes) -126.000
(-0.27)
Industry (1=yes) -127.000
(-0.28)
Social/religion/political party (1=yes) -117.000
(-0.26)
Public services (1=yes) -141.000
(-0.31)
Residence & commerce (1=yes) -83.000
(-0.18)
Residence (1=yes) -124.000
(-0.27)
Constant 35.000** 18.000** 21.000** 143.000
(13.71) (2.94) (2.89) (0.31)
Observations 4,188 4,188 4,188 4,188
Pseudo R-square 0.0384 0.0386 0.0400 0.0414
t statistics in parentheses; + p < 0.10, * p < 0.05, ** p < 0.01 Source: Authors calculations from SPGC data, 2013; Municipalities Data, 2013 and 2014
Annex 7: Key indicators by gender of DUAT holder, by land size, by treatment group
Control Treatment Mean differences
1 2 3 4
Indicator Male Female Male Female 1vs.2 3vs4
A1. Districts (<1,000ha; N=1,900)
DUAT Female-holder (%) 0% n/a 0% 100% a a
Transaction time (days) 270.1 267.9 549.5 703.7 a a
Area (ha) 24.2 84.6 57.3 122.1 a a
Processed in more than 90 days 41% 53% 54% 49%
a
A2. Districts (1,000ha-10,000ha; N=81)
DUAT Female-holder (%) 0% n/a 0% 100% a a
Transaction time (days) 190.8 n/a 173.5 843.6 a a
Area (ha) 1287.8 n/a 2994.9 2484.3 a a
Processed in more than 90 days 80% n/a 57% 71% a a
A3. Districts (>10,000ha; N=16)
DUAT Female-holder (%) n/a n/a 0.0 1.0 a a
Transaction time (days) n/a n/a 392.1 695.3 a a
Area (ha) n/a n/a 44023.6 27578.0 a
Processed in more than 90 days n/a n/a 0.4 0.6 a
B. Municipalities (N=3,774)
DUAT Female-holder (%) 0% 100% 0% 100%
Transaction time (days) 116.1 128.4 116.0 116.7
Area (ha) 0.2 0.1 0.2 0.2
Processed in more than 90 days 30% 34% 35% 33%
(a) Not enough observations for a test of means; n/a. Data not available
Source: Authors calculations from SPGC data, 2013; Municipalities Data, 2013 and 2014
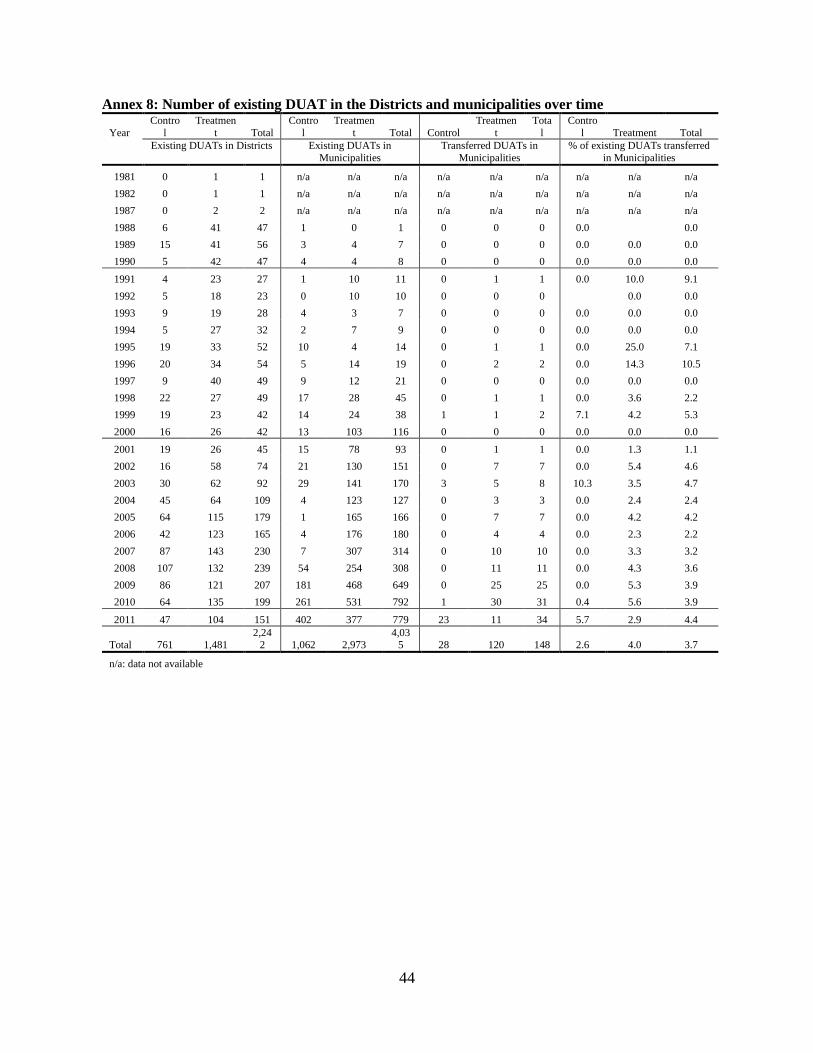
44
Annex 8: Number of existing DUAT in the Districts and municipalities over time
Year
Contro
l
Treatmen
t Total
Contro
l
Treatmen
t Total Control
Treatmen
t
Tota
l
Contro
l Treatment Total
Existing DUATs in Districts Existing DUATs in
Municipalities
Transferred DUATs in
Municipalities
% of existing DUATs transferred
in Municipalities
1981 0 1 1 n/a n/a n/a n/a n/a n/a n/a n/a n/a
1982 0 1 1 n/a n/a n/a n/a n/a n/a n/a n/a n/a
1987 0 2 2 n/a n/a n/a n/a n/a n/a n/a n/a n/a
1988 6 41 47 1 0 1 0 0 0 0.0
0.0
1989 15 41 56 3 4 7 0 0 0 0.0 0.0 0.0
1990 5 42 47 4 4 8 0 0 0 0.0 0.0 0.0
1991 4 23 27 1 10 11 0 1 1 0.0 10.0 9.1
1992 5 18 23 0 10 10 0 0 0
0.0 0.0
1993 9 19 28 4 3 7 0 0 0 0.0 0.0 0.0
1994 5 27 32 2 7 9 0 0 0 0.0 0.0 0.0
1995 19 33 52 10 4 14 0 1 1 0.0 25.0 7.1
1996 20 34 54 5 14 19 0 2 2 0.0 14.3 10.5
1997 9 40 49 9 12 21 0 0 0 0.0 0.0 0.0
1998 22 27 49 17 28 45 0 1 1 0.0 3.6 2.2
1999 19 23 42 14 24 38 1 1 2 7.1 4.2 5.3
2000 16 26 42 13 103 116 0 0 0 0.0 0.0 0.0
2001 19 26 45 15 78 93 0 1 1 0.0 1.3 1.1
2002 16 58 74 21 130 151 0 7 7 0.0 5.4 4.6
2003 30 62 92 29 141 170 3 5 8 10.3 3.5 4.7
2004 45 64 109 4 123 127 0 3 3 0.0 2.4 2.4
2005 64 115 179 1 165 166 0 7 7 0.0 4.2 4.2
2006 42 123 165 4 176 180 0 4 4 0.0 2.3 2.2
2007 87 143 230 7 307 314 0 10 10 0.0 3.3 3.2
2008 107 132 239 54 254 308 0 11 11 0.0 4.3 3.6
2009 86 121 207 181 468 649 0 25 25 0.0 5.3 3.9
2010 64 135 199 261 531 792 1 30 31 0.4 5.6 3.9
2011 47 104 151 402 377 779 23 11 34 5.7 2.9 4.4
Total 761 1,481 2,24
2 1,062 2,973 4,03
5 28 120 148 2.6 4.0 3.7
n/a: data not available
45
References
ACIS, 2012. O Quadro Legal para o Reconhecimento de Direitos de Terra em Areas Rurais em
Mocambique. Um Guia para Legalizacao de Ocupacao. Edicao III, Agosto 2012.
ACIS; APSP; and CFJJ, 2009. Legal Framework for Recognizing and Acquiring Rights to Rural Land in
Mozambique: A Guide to Legalizing Land-holding. Edition 2. June 2009.
CAPT meeting, 2009. Presentation by INFATEC. Quelimane, 2009. Hagos, G. Hasaena. 2012. Tenure (In) Security and Agricultural Investment of Smallholder Farmers in
Mozambique. IFPRI. Working Paper 5. December 2012.
INE (2007). III Recenseamento Geral da Populaçao. Resultados Preliminares.
INE (1997). Desenho da Amostra Mãe Derivada do Recenseamento Populacional de 1997. MCA-Mozambique, 2011. MCA-Mozambique Newsletter. 8th edition. October 2011.
Ministerio de Agricultura, 2011a. Relatório de Balanço Anual do PES 2010 - Sub-sector de Terras e
Florestas. Direcção Nacional de Terras e Florestas . Maputo; Janeiro, 2011.
Ministerio de Agricultura, 2011b. Relatório de Balanço Anual de Terras, Florestas e Fauna Bravia –2011.
Direcção Nacional de Terras e Florestas . Maputo; Janeiro, 2011.
Ministério da Agricultura (2011c). Provision of Long and Short Term Consultancy and Technical
Assistance Services to the MCA (Mozambique) Land Component Final Draft. Institutional Review
and Design and Workplans for Capacity Building . March 2011.
Ministry of Agriculture, 2010a. Provision of Long and Short Term Consultancy and Technical Assistance
Services to the MCA (Mozambique) Land Component Final Draft. Design and Work Plans for
Municipalities – Building Capacity. 30th September 2010.
Ministerio de Agricultura, 2010b. Relatório de Balanço Anual 2009. Direcção Nacional de Terras e
Florestas . Maputo; Janeiro, 2010.
Ministério da Agricultura (2010c). Provision of Long and Short Term Consultancy and Technical
Assistance Services to the MCA (Mozambique) Land Component. First Draft. Land Administration
Needs Assessment. 10th July 2010. Ministry of Agriculture, 2009a. Provision of Long and Short Term Consultancy and Technical Assistance
Services to the MCA (Mozambique) Land Component. Final Draft. Inception Report.30th October
2009.
Ministry of Agriculture. 2008b. National Agricultural Survey. Maputo, Mozambique.
Raul Pitoro. 2013. Field Report on the Land Administration and Cartography Training Institute
(INFATEC) and LTR Municipal Data Collection Activities in Mozambique. May 9th to
September 4th, 2013 Schultink, Gerhardus. 2013. Trip Report. February 17 – 27, 2013.