immunological markers for tolerance to avian malaria in hawai`i `
TRANSCRIPT

Technical Report HCSU-042
immUnologiCal maRkeRS foR ToleRanCe To avian malaRia in Hawai`i `amakiHi: new ToolS foR
ReSToRing naTive Hawaiian foReST biRdS?
Carter T. atkinsoneben H. Paxton
U.S. geological Survey, Pacific island ecosystems Research Center, kīlauea field Station, P.o. box 44, Hawaii national Park, Hi 96718
Hawai‘i Cooperative Studies UnitUniversity of Hawai‘i at Hilo
200 w. kawili St.Hilo, Hi 96720
(808) 933-0706
august 2013
This product was prepared under Cooperative Agreement CAG11AC20269 for the Pacific Island Ecosystems Research Center of the U.S. Geological Survey.
Technical Report HCSU-042
IMMUNOLOGICAL MARKERS FOR TOLERANCE TO AVIAN MALARIA IN HAWAIʽI ʽAMAKIHI: NEW TOOLS FOR RESTORING NATIVE HAWAIIAN FOREST BIRDS?
CARTER T. ATKINSON
AND EBEN H. PAXTON
U.S. Geological Survey, Pacific Island Ecosystems Research Center, Kīlauea Field Station, P.O. Box 44, Hawaii National Park, HI 96718
Hawaiʽi Cooperative Studies Unit University of Hawaiʽi at Hilo
200 W. Kawili St. Hilo, HI 96720 (808) 933-0706
August 2013

ii
This article has been peer reviewed and approved for publication consistent with USGS Fundamental Science Practices (http://pubs.usgs.gov/circ/1367/). Any use of trade, firm, or product names is for descriptive purposes only and does not imply endorsement by the U.S. Government.

iii
TABLE OF CONTENTS
List of Figures ...................................................................................................................... iii
Nontechnical Summary ......................................................................................................... 1
Abstract ............................................................................................................................... 1
Introduction ......................................................................................................................... 2
Methods .............................................................................................................................. 3
Sample Collection ............................................................................................................. 3
Diagnostic Analysis for Malaria ........................................................................................... 4
Wing Web Inoculation ....................................................................................................... 4
Total Antioxidant Capacity Assay ........................................................................................ 5
Natural Antibody Assay ..................................................................................................... 5
Statistical Analysis ............................................................................................................. 6
Results ................................................................................................................................ 6
Sample Collection and Malarial Diagnostics ......................................................................... 6
Wing Web Inoculation ....................................................................................................... 6
Total Antioxidant Capacity Assay ........................................................................................ 8
Natural Antibody Assay ..................................................................................................... 8
Discussion ........................................................................................................................... 8
Conclusions and Recommendations ..................................................................................... 11
Acknowledgements ............................................................................................................ 11
Literature Cited .................................................................................................................. 11
LIST OF FIGURES
Figure 1. Representative assay plate that illustrates natural antibodies and complement-mediated lysis of rabbit red blood cells .................................................................................. 7
Figure 2. Plot of lysis scores from the assay for natural antibodies .......................................... 9
1
NONTECHNICAL SUMMARY
Expansion of deadly, mosquito-borne bird diseases such as avian malaria into Hawaiʽi’s high elevation forests as a result of global warming is one of the most significant threats facing the state’s rare native forest birds. Few practical options for control of disease-carrying mosquitoes over large landscapes are available, however. The best hope for remaining species of native birds may be the development of tolerance or resistance to this introduced disease. Therefore, understanding how tolerance and resistance evolve and developing ways to speed this process may be good proactive strategies for addressing impacts of climate change. We evaluated ways to rapidly measure a bird’s natural immunity with the hope that they can predict survival from avian malaria. We evaluated cell-mediated immune responses, measured levels of natural antibodies (NAb) in the blood plasma, and measured plasma antioxidant capacity with the hypothesis that these tests may be able to distinguish disease-tolerant low-elevation populations of Hawaiʽi ʽAmakihi (Hemignathus virens) from disease-susceptible high-elevation populations. We found no significant differences in amount of wing web swelling associated with cellular immune responses and no significant differences in plasma antioxidant capacity between low- and high-elevation ʽAmakihi. We observed significant differences in levels of NAb from high- and low-elevation birds in an assay that measured complement-mediated lysis of rabbit erythrocytes. This assay is rapid, not affected by malarial infection status, relatively inexpensive, and works for a wide range of species, making it particularly attractive as a management tool for distinguishing malaria-tolerant and susceptible individuals. Additional work is needed to determine whether high levels of NAb correlate with ability to recover from avian malaria in ʽAmakihi and other native honeycreepers and whether this assay can be used to map geographic populations of native forest birds that are tolerant of this disease.
ABSTRACT
We evaluated three assays for non-specific or innate immune capacity to see if measurements were independent of malarial infection and capable of distinguishing malaria-tolerant, low-elevation Hawaiʽi ʽAmakihi from malaria-susceptible, high-elevation ʽAmakihi. ʽAmakihi were captured at Malama Ki Forest Reserve (20 m), Hakalau Forest National Wildlife Refuge (1800 m), and Upper Waiakea Forest Reserve (1700 m), bled for collection of plasma and packed erythrocytes for malarial diagnostics, and either transported to Kīlauea Field Station Aviary and held in captivity for 48 hours for inoculation of wing webs with phytohemagglutinin A (PHA) or released immediately in the field after collection of a blood sample. All birds were tested by polymerase chain reaction (PCR) and microscopy to determine infection status. We found no significant association between malarial infection status and degree of wing web swelling after inoculation with PHA (T = -0.174, df = 13, P = 0.864) and no association between origin of birds from low- and high-elevation populations and degree of wing web swelling (T = 0.113, df = 52, P = 0.911). Infected ʽAmakihi from low elevation had significantly higher small molecule plasma antioxidant capacity than uninfected individuals from the same population (T = -2.675, df = 21, P = 0.014), so we limited comparisons to uninfected birds. Uninfected ʽAmakihi from low elevations did not differ in small molecule plasma antioxidant capacity from uninfected ʽAmakihi from high elevation (T = -0.260, df = 46, P = 0.796). Compared to high-elevation birds, low-elevation ʽAmakihi had significantly higher titers of natural antibodies (NAb) as measured by complement-mediated lysis of rabbit erythrocytes (Mann-Whitney U = 27, X2 = 32.332, df = 1, P < 0.0001). This innate immunological difference may be related to ability to
2
survive malarial infection and may prove to be important for understanding possible mechanisms for the evolution of disease tolerance in Hawaiʽi’s native bird species.
INTRODUCTION
Introduced avian malaria and pox virus continue to play a major role in limiting the altitudinal and geographic distribution of native Hawaiian birds (Atkinson and LaPointe 2009). The persistence and dynamics of these mosquito-transmitted diseases are influenced by vector and host abundance, climatic components (temperature and rainfall) that drive the system, and landscape components (elevation and mosquito habitat) that influence rates of transmission and resulting selective pressures on forest bird populations (Samuel et al. 2011). Climate strongly influences mosquito biology because temperature affects larvae maturation, female blood feeding and reproductive (gonadotropic) cycle, and parasite development within the mosquito. Rainfall also affects mosquito survival because drought or strong rain can decrease the survival of larvae and adults (Ahumada et al. 2004, Samuel et al. 2011). Due to the steep slopes of many Hawaiian Islands, climate, especially temperature, changes quickly across elevations, creating strong differences in system dynamics that have resulted in relatively stable persistence of high-elevation disease refugia on the highest mountains of Kauaʽi, Maui, and Hawaiʽi Islands. These refugia have allowed many species of endemic forest birds that are highly susceptible to avian malaria based on laboratory experiments (e.g., ʽIʽiwi; Atkinson et al. 1995) to persist at high elevations. The long-term stability of these high-elevation refugia is increasingly threatened by changing climatic conditions in the islands, particularly the recent upward trends in night-time temperatures at high elevations and stable or downward trends in the upper limits of the inversion layer, which currently caps forest bird habitat at approximately 2000 m (Giambelluca et al. 2008, Diaz et al. 2011). There is increasing evidence that disease transmission is already moving into high-elevation habitats and having an impact on susceptible native forest birds. For example, prevalence of avian malaria has tripled over the past decade at the lower end of the Alakaʽi Plateau and increased almost 10-fold near its upper reaches (Atkinson and Utzurrum 2010). During the same time period, the range of native forest birds in the Alakaʽi has contracted substantially in size around the highest elevations on the island (Foster et al. 2004).
Few proven methods exist for countering the threat of climate change on disease exposure in native forest birds. While vector control is a feasible option for reducing transmission of avian malaria in many parts of Hawaiʽi, it may not be sustainable over the long haul because of the expense and scale of effort that are needed over large, contiguous landscapes (LaPointe et al. 2009). Some mid- and high-elevation habitats have little natural standing water and are excellent candidates for the development of effective vector control programs, but other areas of critical forest bird habitat have abundant natural water sources and available larval habitat for mosquitoes or are too small in area or too close to parcels where vector control will never be a feasible priority. Additionally, establishing forest habitat in successively higher elevation preserves to keep forest birds “one step ahead” of rising temperatures may be an effective short-term solution in some places, but eventually temperatures will rise to where even higher elevation habitat does not provide refuge from disease. Development of disease tolerance may ultimately be required for long-term sustainability of all of Hawaiʽi’s forest birds.
The recent finding that some low-elevation populations of Hawaiʽi ʽAmakihi are recovering and expanding in spite of high rates of malaria transmission (Woodworth et al. 2005, Spiegel et al.
3
2006) has opened the possibility that at least some native forest birds have sufficient genetic diversity to evolve some tolerance to avian malaria. Genetic differences have been detected between low- and high-elevation populations of Hawaiʽi ʽAmakihi with microsatellites (Eggert et al. 2008) and nuclear and mitochondrial markers (Foster et al. 2007), but these differences appear to be based on a variety of haplotypes and no specific genetic markers have yet been identified that can accurately and quickly predict susceptibility to infection. Complicating this is the likelihood that tolerance to malaria most likely involves multiple genes or gene systems (Hedrick 2011). Reliable genetic markers for identifying disease-tolerant individuals are currently not available.
An alternative approach to identifying tolerant or resistant individuals is to evaluate phenotypic characteristics associated with the immune response in the hopes that one or more of these may predict ability to recover from malarial infection. If we can find one or more useful phenotypic markers, this approach could be a “game changer” in how we manage native forest birds in a warming climate. For example, this approach could be used to identify priority populations with high levels of natural disease tolerance for intensive management, target individual birds for use in translocations to lower elevations where disease transmission is endemic, identify offspring from captive propagation programs for release in areas with disease transmission, or establish that some populations may not have the genetic and phenotypic variability to adapt over the long run to increased disease transmission at higher elevations.
The goal of our study was to evaluate three assays that measure non-specific innate immunity in low- and high-elevation Hawaiʽi ʽAmakihi with the eventual hope that one or more may predict susceptibility to avian malaria.
METHODS
Sample Collection Hawaiʽi ʽAmakihi were captured with mist nets from March–November 2012 on the island of Hawaiʽi at Malama Ki Forest Reserve near MacKenzie State Park (20 m), at the Pua Akala Management Unit of Hakalau Forest National Wildlife Refuge (1800 m), and at several kīpuka along Powerline Road in the Upper Waiakea Forest Reserve (1700 m). After capture, birds were banded with U.S. Geological Survey aluminum leg bands, measured to obtain morphometric data for identifying sex and age, weighed, and either bled immediately by jugular venipuncture with a heparinized 28 gauge insulin syringe or bled after transport to Kīlauea Field Station Aviary in Hawaiʽi Volcanoes National Park. A blood smear was prepared immediately after blood was drawn, air dried, and fixed with methanol. Remaining whole blood was transferred to a microhematocrit tube and spun with either a battery-powered field centrifuge or a laboratory hematocrit centrifuge to separate plasma from packed cells. Microhematocrit tubes were scored with a file, broken immediately above the buffy coat, and plasma and packed cells were removed. Plasma was transferred to 0.5 ml tubes, stored on wet ice until return to the lab, and then frozen at -70oC for long-term storage. Packed cells were placed in 100 µl of lysis buffer (0.1 M Tris, pH 8.0, 0.1 M EDTA, 2% SDS), stored on wet ice until return to the lab, and then frozen at -70oC for long-term storage.
All samples were collected under terms of State of Hawaiʽi Protected Wildlife Permit WL13-07, Federal Migratory Bird Permit MB45431A-0, Hakalau Forest National Wildlife Refuge Special Use Permit SUP12516-12015, and University of Hawaiʽi Animal Care and Use Protocol 11-1170.
4
Diagnostic Analysis for Malaria Since acute or chronic infection with malaria could bias test results, we screened all birds by microscopy and polymerase chain reaction (PCR) assays to establish infection status for each bird. Blood smears were stained with phosphate buffered (pH 7.0) 2% Giemsa for one hour, rinsed with tap water, dried, and examined by microscopy to detect intraerythrocytic stages of Plasmodium. We screened each smear for 10 min at 400X (40X objective and 10X eyepieces) and estimated that we examined approximately 20,000–30,000 erythrocytes. Smears were scored as positive for malaria if we observed at least one infected erythrocyte.
Purified DNA for PCR analysis was extracted from packed blood cells using DNeasy tissue extraction kits (Qiagen Inc., Valencia, CA) according to the manufacturer’s protocols, but we increased the initial incubation times with Proteinase K to overnight to increase yield of DNA. DNA was recovered from extraction columns with Tris ethanolamine buffer, measured by spectrophotometry with a Nanodrop spectrophometer to assess purity and determine DNA concentration, and stored frozen until use in PCR reactions.
We used published PCR primers that amplify parasite ribosomal genes for detecting infection with Plasmodium (Fallon et al. 2003). The primers were used in a nested protocol with an initial amplification of host DNA (100 ng/reaction) with primers 292F/631R followed by a second amplification with primers 343F/496R that used 1 µl of a 1:10 dilution of template from the first reaction. PCR reactions with primers 292F/631R were run in 25 µl volumes containing the following components in the reaction mix: 2.0 mM MgCl2, 0.2 mM each deoxynucleoside triphosphate, 0.4 µM each primer, and 0.5 units of Promega GoTaq polymerase (Promega North America, Madison, WI). PCR reactions with primers 343F/496R were run in 25 µl volumes containing the following components in the reaction mix: 2.5 mM MgCl2, 0.2 mM each deoxynucleoside triphosphate, 0.5 µM each primer, and 0.25 units of Promega GoTaq polymerase. Cycling conditions for the original flanking primer pair (292F/631R) followed a hot-start, touch-down protocol: 2 min at 94oC, followed by 20 cycles with 1-min denaturation at 94oC, 1-min annealing at 52o–42oC, and elongation at 72oC for 1 min and 10 sec. After 20 cycles, a final elongation step followed at 72oC for 3 min. The final assay primer pair (343F/496R) was run at 2 min at 94oC, followed by 35 cycles with 1-min denaturation at 94oC, 1-min annealing at 57oC, and elongation at 72oC for 1 min and 10 sec, with a final elongation step at 72oC for 3 min. PCR products from the second reaction were resolved on 1.5% agarose gels to determine presence or absence of an expected 142 bp band. All PCR reactions were run with a positive control consisting of DNA extracted from a Pekin duckling with an intense experimental infection with P. relictum and a negative control that substituted water for DNA.
Wing Web Inoculation ʽAmakihi were held in the field in small transport cages, offered fresh fruit and nectar substitute (Nekton Nectar Plus, Gunter Enderle, Clearwater, FL) and transported within five hours after capture to either Kīlauea Field Station Aviary or the University of Hawaiʽi Hakalau Field Station. Birds that arrived at the aviary or field station before 1400 were inoculated in the left wing web with 20 µl of a 5 mg/ml solution of phytohemaglutinin A (Catalog #L 9017, Sigma-Aldrich Chemical Company, St. Louis, MO) that had been reconstituted from a lyophilized state with sterile, phosphate buffered saline (PBS), pH 7.4, without added calcium chloride or magnesium chloride (Catalog #10010-023, GIBCO Life Technologies, Grand Island, NY; Martin et al. 2006). The right wing web was inoculated immediately afterward with 20 µl of sterile PBS alone. Immediately prior to inoculation, the thickness of both the left and right wing webs was measured with a digital spessimeter (Mitutoyo No. 547-300, Mitutoyo Corporation America,
5
Aurora, IL) with the wing gently opened to an outstretched position. Birds were held overnight in cages measuring 60 X 30 X 30 cm with a 500 watt heat lamp positioned above one corner of the cage to provide an external heat source. Birds were offered Nekton Nectar Plus, scrambled eggs, frozen blueberries, frozen kernel corn, and an orange slice ad libitum. Twenty-four hours after the wing web inoculations, left (treatment) and right (control) wing webs were measured a second time with a spessimeter to record changes in thickness. All pre- and post-injection measurements were done by a single individual (CTA) to minimize observer variability in the measurements. Birds were held an additional night to avoid release late in the afternoon and set free at their capture location.
Total Antioxidant Capacity Assay Total antioxidant capacity (TAC) was measured for plasma samples using a BioVision Total Antioxidant Capacity Assay Kit (BioVision Incorporated, Milpitas, CA). The assay is based on reduction of Cu2+ to Cu+ by antioxidant enzyme systems such as catalase, peroxidase, and glutathione reductase; small molecules such as ascorbate, uric acid, and glutathione; and proteins such as albumin and transferrin. Reduced Cu+ is chelated with a colorimetric probe which leads to a color change and broad absorbance peak around 570 nm that is proportional to the TAC. A standard curve is prepared with Trolox, a water-soluble derivative of vitamin E, and antioxidant capacity for each sample is expressed in Trolox equivalents. We chose to use a proprietary protein mask that was supplied with the kit which allows analysis of only the small molecule antioxidants in the plasma samples, after initial tests without the mask did not detect any differences between low- and high-elevation ʽAmakihi.
We performed the assay by mixing 1 µl of plasma with 1 µl of protein mask and diluting the mixture 1:10 with water. We added 4 µl of the dilution to duplicate wells (two per sample) of a flat-bottomed 96-well microtiter plate (Immulon 4HBX, #3855, ThermoFisher Scientific, Milford, MA) and adjusted the volume of all wells to 100 µl by adding 96 µl of distilled water to each well. We also prepared a series of Trolox standards by adding 0, 4, 8, 12, 16, and 20 µl of Trolox to six wells and adjusting the volume of each to 100 µl with distilled water. Two wells were used as blanks and contained 100 µl of distilled water alone. We added 100 µl of Cu reagent to all wells and incubated for 90 min at room temperature. Absorbance was read at 595 nm with a BioRad plate reader (BioRad Life Sciences, Hercules, CA), and average values in Trolox equivalents were calculated for all samples from the standard curve by averaging each of the duplicate samples.
Natural Antibody Assay We followed the hemolysis-hemagglutination assay described by Matson et al. (2005) and modified by Zylberberg et al. (2012) to use smaller quantities of plasma to compare titers of NAb in low- and high-elevation ʽAmakihi. The assay was done in 96-well (8 rows by 12 columns) round (U) bottom assay plates (Corning Costar #3795, Tewksbury, MA). Ten microliters of plasma from each bird was pipetted into wells of column 1 of the plate (six individual samples). The remaining two wells in column 1 were used as positive controls to evaluate plate-to-plate variability and contained 10 µl of pooled plasma from three chickens. Ten microliters of 0.01 M PBS (Sigma #P3813, St Louis, MO) was added to all wells in columns 1–12 with a multichannel pipetter. The contents of wells in column 1 were then mixed simultaneously with a multi-channel pipetter and 10 µl were removed from wells in column 1 and transferred to adjacent wells in column 2. The contents of wells in column 2 were mixed and 10 µl were removed and transferred to wells in column 3. This process was repeated for wells 3–11 to yield a series of

6
dilutions ranging from 1/2 (column 1) to 1:2048 (column 11). The last aliquot from column 11 was discarded, leaving only PBS in wells of column 12 to serve as negative controls.
For the assay itself, 10 µl of a 1% rabbit blood cell were added to all wells, effectively halving all plasma dilutions. The 1% solution was prepared from a 50% suspension of rabbit whole blood in Alsever’s solution (Hemostat Laboratories, # RB*050 in Alsever’s solution, Dixon, CA) as described in detail by Matson et al. (2005). Each plate was then sealed with clear adhesive plate film to prevent evaporation. Plates were gently mixed on a rotating shaker for 30 sec and then floated in a 37oC water bath for 90 min. Upon completion of the incubation, the long axis of each plate was tilted to a 45o angle for 20 min at room temperature in order to enhance visualization of agglutination. Plates were then placed on a light box and photographed. Afterward, plates were incubated flat at room temperature for an additional 70 min and photographed a second time to record maximum lytic activity (Figure 1). From the digitized images, both agglutination and lysis were scored independently and blindly by two observers (EHP and CTA), and values were averaged for data analysis. Lysis reflects the interaction of complement and NAbs, whereas agglutination results from NAbs only. Both variables were recorded as the negative log2 of the last plasma dilution exhibiting each behavior as described in detail by (Matson et al. 2005).
Statistical Analysis We compared mean values for changes in wing web thickness, NAb titer, and antioxidant capacity for infected and uninfected low-elevation ʽAmakihi with two-sample t-tests, P < 0.05, to determine if values were independent of malarial infection. When no significant differences were evident, we tested for differences between low- and high-elevation ʽAmakihi with a two-sample t-test, P < 0.05. When data were skewed significantly by the frequent occurrence of zero values, we evaluated differences with a Mann-Whitney test, the non-parametric equivalent of a two-sample t-test. All statistical tests were done using the statistical package Systat (version 11, Systat Software, Inc., Chicago, IL).
RESULTS
Sample Collection and Malarial Diagnostics We captured and collected plasma and packed red blood cells from 60 Hawaiʽi ʽAmakihi from Upper Waiakea Forest Reserve (37 birds), Malama Ki Forest Reserve (18 birds), and Hakalau Forest National Wildlife Refuge (5 birds) between February and October 2012. We were able to perform successful wing web inoculations on 54 of these birds.
The prevalence of malaria by PCR analysis from birds that were captured at Malama Ki Forest reserve was 61% (11/18). Among 42 ʽAmakihi captured at high elevation (Hakalau Forest National Wildlife Refuge and Upper Waiakea Forest Reserve), only one (2.3%) was positive for malaria. By contrast, prevalence as detected by microscopy was 39% at Malama Ki and 0% among high-elevation birds.
Wing Web Inoculation We compared pre- and post-wing web thickness for 50 birds that were successfully inoculated with PBS to evaluate whether inoculation with PBS alone caused a significant change in thickness after 24 hours. Mean pre-injection wing web thickness (𝑋� = 0.420 mm) did not differ significantly from mean post-injection wing web thickness (𝑋� = 0.434 mm; t = -1.664, df = 49,

7
Figure 1. Representative assay plate that illustrates natural antibodies (Nab) and complement-mediated lysis of rabbit red blood cells after 180 minutes of incubation. Columns 1–11 contain rabbit red blood cells and serially two-fold diluted plasma ranging in titer from 1:2 (column 1) to 1:2048 (column 11). Column 12 (control) contains phosphate buffered saline and rabbit cells alone. Rows A and B contain pooled chicken plasma to control for plate-to-plate variability of results. Rows C–H contain plasma from individual ʽAmakihi that originated from either low- (Rows E, G) or high-(Rows C, D, F, H) elevation habitats. Approximate cut-off values, based on partial or complete lysis of rabbit red blood cells, are indicated for each row with a yellow bar. Note the higher lysis scores for low-elevation ʽAmakihi in Rows E and G.
P = 0.103). As a result, unadjusted changes in wing web thickness (DeltaWing) were used for comparisons of infected and uninfected individuals and high- and low-elevation individuals.
Among low-elevation ʽAmakihi, we found no significant difference in mean DeltaWing for low-elevation birds with (𝑋� = 0.305, SD = 0.120, n = 8) or without (𝑋� = 0.296, SD = 0.079, n = 7) (t = -0.174, df = 13, P = 0.864) malaria. Since this difference was not significant, we pooled infected and uninfected birds from low elevation for comparisons with high-elevation birds to increase sample sizes. There was no significant difference in mean DeltaWing between low- (𝑋� = 0.301, SD = 0.099, n = 15) and high- (𝑋� = 0.304, SD = 0.111, n = 39) elevation ʽAmakihi (t = 0.113, df = 52, P = 0.911).
8
Total Antioxidant Capacity Assay Low-elevation ʽAmakihi that tested positive for malaria had significantly higher measurements of small molecule plasma antioxidant capacity (𝑋� = 15.318, SD = 2.742, n = 16) than those that were uninfected (𝑋� = 12.185, SD = 2.140, n = 7; t = -2.675, df = 21, P = 0.014). Because of the potential confounding effects of malaria infection on comparisons between low- and high-elevation birds, we limited comparisons to uninfected birds in each group. There were no significant differences in small molecule plasma antioxidant capacity between uninfected low- (𝑋� = 12.185, SD = 2.140, n = 7) and high- (𝑋� = 11.997, SD = 1.715, n = 41) elevation ʽAmakihi (t = -0.260, df = 46, P = 0.796).
Natural Antibody Assay While control chicken plasma yielded a consistent agglutination endpoint at plasma dilutions of 1:128, we did not find an agglutination endpoint for any of the ʽAmakihi samples. A flocculent precipitate was present at the last plasma dilution (1:2048) for virtually all of the birds, and this variable received no further analysis.
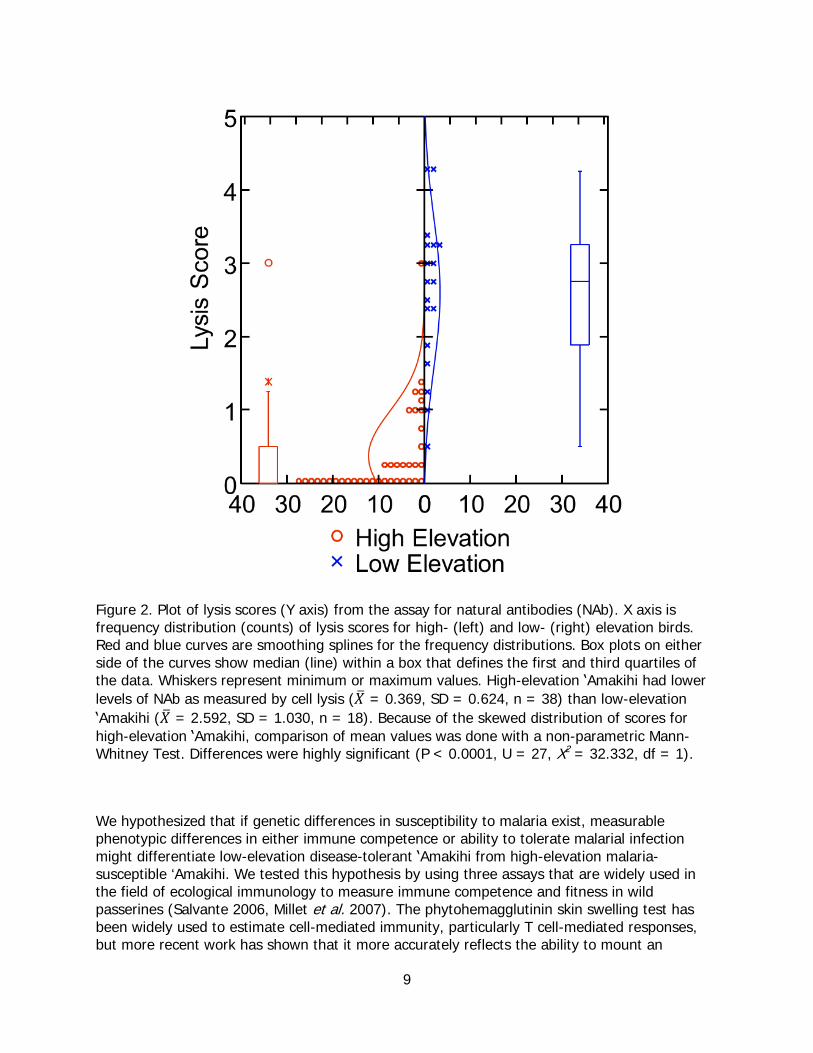
We found little plate-to-plate variability for the pooled chicken plasma control, so we used unadjusted scores for the analysis. Lysis scores of plasma from uninfected (𝑋� = 2.644, SD = 1.056, n = 7) and infected (𝑋� = 2.558, SD = 1.064, n = 11) low-elevation ʽAmakihi did not differ significantly (t = 0.168, df = 16, P = 0.869), so infected and uninfected low-elevation birds were combined for comparison with high-elevation birds. We used a non-parametric Mann-Whitney test to evaluate differences between high- and low-elevation ʽAmakihi because high-elevation data were significantly skewed by large numbers of zero scores (Figure 2). Low-elevation ʽAmakihi had significantly higher lysis scores than high-elevation birds (Mann-Whitney U = 27, X2 = 32.332, df = 1, P < 0.0001), indicating that they have higher titers of NAb.
DISCUSSION
The idea that native forest birds might develop resistance or tolerance to avian malaria was first discussed by van Riper et al. (1986) based on higher rates of survival in a limited number of experimentally infected Hawaiʽi ʽAmakihi that originated from different elevations on Mauna Loa Volcano. Described as “immunogenetic” resistance, this concept has been an attractive option for limiting the impacts of this introduced disease on native forest birds for more than two decades (U.S. Fish and Wildlife Service 2006). The first clear evidence that natural selection can lead to adaptation to this disease was the discovery of a rapidly expanding population of Hawaiʽi ʽAmakihi in the lower Puna District of Hawaiʽi Island in spite of high rates of infection with malaria (Woodworth et al. 2005, Spiegel et al. 2006). Experimentally infected birds from this population exhibit greater tolerance to infection. Mortality is lower, and declines in food consumption and weight loss are significantly less than high-elevation birds in spite of similar intensities of infection (C.T. Atkinson unpublished data). Genetic differences between these low-elevation ʽAmakihi and high-elevation birds have been documented based on nuclear and mitochondrial markers (Foster et al. 2007, Eggert et al. 2008), yet the mechanisms responsible for evolved tolerance are not known, and unique genetic markers that could be used to identify disease-tolerant individuals are not currently available. While recent developments in whole genome sequencing show great promise for identifying single nucleotide polymorphisms that may be associated with disease susceptibility, they may not be available for practical application for some time.
9
Figure 2. Plot of lysis scores (Y axis) from the assay for natural antibodies (NAb). X axis is frequency distribution (counts) of lysis scores for high- (left) and low- (right) elevation birds. Red and blue curves are smoothing splines for the frequency distributions. Box plots on either side of the curves show median (line) within a box that defines the first and third quartiles of the data. Whiskers represent minimum or maximum values. High-elevation ʽAmakihi had lower levels of NAb as measured by cell lysis (𝑋� = 0.369, SD = 0.624, n = 38) than low-elevation ʽAmakihi (𝑋� = 2.592, SD = 1.030, n = 18). Because of the skewed distribution of scores for high-elevation ʽAmakihi, comparison of mean values was done with a non-parametric Mann-Whitney Test. Differences were highly significant (P < 0.0001, U = 27, X2
= 32.332, df = 1).
We hypothesized that if genetic differences in susceptibility to malaria exist, measurable phenotypic differences in either immune competence or ability to tolerate malarial infection might differentiate low-elevation disease-tolerant ʽAmakihi from high-elevation malaria-susceptible ‘Amakihi. We tested this hypothesis by using three assays that are widely used in the field of ecological immunology to measure immune competence and fitness in wild passerines (Salvante 2006, Millet et al. 2007). The phytohemagglutinin skin swelling test has been widely used to estimate cell-mediated immunity, particularly T cell-mediated responses, but more recent work has shown that it more accurately reflects the ability to mount an
10
inflammatory response (Vinkler et al. 2010). Since cytokines, chemokines, and reactive oxygen intermediates produced by macrophages in response to acute infection can mediate pathology of malarial infection (Clark and Cowden 2003, Chu et al. 2013), we evaluated the hypothesis that disease-tolerant, low-elevation ʽAmakihi can control tissue damage through elevated plasma antioxidant capacity. Finally, we evaluated titers of NAbs in high- and low-elevation ʽAmakihi using a hemolysis-hemagglutination assay that was first described by Matson et al. (2005). Natural antibodies (also referred to as spontaneous antibodies) are part of the innate immune response and are produced without prior exposure to specific antigens in immunologically naïve vertebrates (Ochsenbein and Zinkernagel 2000). Their role in the immune response is still poorly understood, but they are believed to have immunoregulatory functions and play an important role as a first line of defense against bacteria and viruses by binding and lysing pathogens in conjunction with complement, enhancing phagocytosis by macrophages, and targeting pathogens to the spleen and other lymphoid tissue where they can prime the adaptive immune response (Ochsenbein and Zinkernagel 2000). The NAb response is under genetic control (Ochsenbein and Zinkernagel 2000, Wijga et al. 2009) and may predict both the strength of the adaptive immune response (Kohler et al. 2003, Parmentier et al. 2004) and host survival (Sun et al. 2011).
We did not find significant differences between low- and high-elevation ʽAmakihi for wing web swelling after inoculation of phytohemagglutinin or small molecule plasma antioxidant capacity. This was somewhat surprising given the role that the inflammatory response plays in the pathogenesis of malaria (Clark and Cowden 2003), but it may be that these effects require specific stimulus of the immune system by either malaria infection or malarial antigens to be detectable (Owen et al. 2010). Low-elevation infected ʽAmakihi had higher levels of small molecule plasma antioxidant capacity than uninfected birds from the same population, suggesting that either infection with malaria is necessary for this phenotypic trait to be expressed or selective pressure from malaria infection may have biased captures of wild birds toward those with higher antioxidant capacity. Additional work that focuses on responses to either crude or purified malarial antigens may be a better approach to detecting differences in cellular immune responses between these populations.
We were able to detect significantly higher titers of NAb in low-elevation ʽAmakihi with an assay that measures complement-mediated lysis of rabbit erythrocytes. The results were independent of infection status with malaria, making it particularly useful for screening birds from areas where malaria transmission is seasonal. While it has been hypothesized that increased titers of NAb might correlate with strength of the adaptive immune response (Kohler et al. 2003, Parmentier et al. 2004) and survival in chickens (Sun et al. 2011) empirical evidence for this is still limited. Only a handful of studies have detected specific disease-related responses to measured titers of natural antibodies (Owen et al. 2010). Using the same hemolysis-hemagglutination assay that we did, Whiteman et al. (2006) detected decreases in ectoparasite loads in birds with higher titers of NAb. Results from other studies have found either no association between ectoparasites and NAb or a positive association (Owen et al. 2010), but methodologies varied widely and direct comparisons may not be valid. To date, there have been no studies documenting an association between higher titers of NAb and survival from malaria. While beyond the scope of the current study, the next step would be to see if any detected differences correlate with ability to survive acute infection with malaria. Any assay that is developed, either genetic or otherwise must be rapid, inexpensive, and applicable to a wide range of species to make it useful for the management of forest birds.

11
CONCLUSIONS AND RECOMMENDATIONS
We show that there are significant differences in mean titers of NAb between high-elevation ʽAmakihi populations sensitive to malaria and low-elevation populations that are more tolerant of the disease. This immunological difference may be directly related to their differential survival rates when exposed to disease. The NAb assay we used to detect these differences is rapid, does not require specialized equipment, and can be applied to a wide range of species. The assay may be able to provide information that can be used to select birds for translocation into areas of suitable habitat with documented disease transmission, select offspring from captive propagation programs for release into areas where risks of disease exposure are high, and map the geographic distribution of populations that are tolerant of avian disease. Thus, this study is an important advance in understanding possible mechanisms for the evolution of disease resistance in Hawaiʽi’s native bird species and in understanding how future climate change will affect the distribution and abundance of native forest birds. Additional studies to verify these findings and determine whether NAb titer can predict mortality, survival times, peak parasitemias, or day of crisis in experimentally infected birds would help to determine whether this assay is an accurate predictor of tolerance to avian malaria in ʽAmakihi and other species of honeycreepers. It may be possible to do this with frozen plasma samples from prior experimental studies of avian malaria in Hawaiʽi ʽAmakihi, ʽIʽiwi (Vestiaria coccinea), ʽApapane (Himatione sanguinea), ʽŌmaʽo (Myadestes obscurus), and Maui ʽAlauahio (Paroreomyza montana; Atkinson et al. 1995, 2000, 2001; Yorinks and Atkinson 2000) and this should be a high priority next step.
ACKNOWLEDGEMENTS
We thank Keith Burnett, Jackie Gaudioso, Aemon Hannity, Nolan Lancaster, and Sonia Levitt for assisting with mist netting and capture of ʽAmakihi that were brought into captivity. This project was funded by the Pacific Island Climate Change Cooperative and the U.S. Geological Survey.
LITERATURE CITED
Ahumada, J. A., D. LaPointe, and M. D. Samuel. 2004. Modeling the population dynamics of Culex quinquefasciatus (Diptera: Culicidae), along an elevational gradient in Hawaii. Journal of Medical Entomology 41:1157–1170.
Atkinson, C. T., K. L. Woods, R. J. Dusek, L. S. Sileo, and W. M. Iko. 1995. Wildlife disease and conservation in Hawaii: pathogenicity of avian malaria (Plasmodium relictum) in experimentally infected Iiwi (Vestiaria coccinea). Parasitology 111:S59–S69.
Atkinson, C. T., R. J. Dusek, K. L. Woods, and W. M. Iko. 2000. Pathogenicity of avian malaria in experimentally-infected Hawaii Amakihi. Journal of Wildlife Diseases 36:197–204.
Atkinson, C. T., J. K. Lease, B. M. Drake, and N. P. Shema. 2001. Pathogenicity, serological responses and diagnosis of experimental and natural malarial infections in native Hawaiian thrushes. The Condor 103:209–218.
Atkinson, C. T. and D. A. LaPointe. 2009. Introduced avian diseases, climate change, and the future of Hawaiian honeycreepers. Journal of Avian Medicine and Surgery 23:53–63.
12
Atkinson, C. T., and R. B. Utzurrum. 2010. Changes in prevalence of avian malaria on the Alakaiʽi Plateau, Kauaʽi, Hawaiʽi, 1997-2007. Hawaii Cooperative Studies Unit Technical Report HCSU-017. Hawaiʽi Cooperative Studies Unit, University of Hawaiʽi at Hilo, HI.
Chu, C. L. L., G. Brown, J. A. Hamilton, S. Rogerson, and P. Boeuf. 2013. Monocytes and macrophages in malaria: protection or pathology? Trends in Parasitology 29:26–34.
Clark, I. A., and W. B. Cowden. 2003. The pathophysiology of falciparum malaria. Pharmacology and Therapeutics 99:221–260.
Diaz, H. F., T. W. Giambelluca, and J. K. Eischeid. 2011. Changes in the vertical profiles of mean temperature and humidity in the Hawaiian Islands. Global and Planetary Change 77:217:1.
Eggert, L. S., L. A. Terwilliger, B. L. Woodworth, P. J. Hart, D. Palmer, and R. C. Fleischer. 2008. Genetic structure along an elevational gradient in Hawaiian honeycreepers reveals contrasting evolutionary responses to avian malaria. BMC Evolutionary Biology 8:315.
Fallon, S. M., R. E. Ricklefs, B. L. Swanson, and E. Bermingham. 2003. Detecting avian malaria: an improved polymerase chain reaction diagnostic. Journal of Parasitology 89:1044–1047.
Foster, J. T., E. J. Tweed, R. J. Camp, B. L. Woodworth, C. D. Adler, and T. Telfer. 2004. Long-term population changes of native and introduced birds in the Alakaʽi Swamp, Kauaʽi. Conservation Biology 18:716–725.
Foster, J. T., B. L. Woodworth, L. E. Eggert, P. J. Hart, D. Palmer, D. C. Duffy, and R. C. Fleischer. 2007. Genetic structure and evolved malaria resistance in Hawaiian honeycreepers. Molecular Ecology 16:4738–4746.
Giambelluca, T. W., H. F. Diaz, and M. S. A. Luke. 2008. Secular temperature changes in Hawaiʽi. Geophysical Research Letters 35, art. No. L12702.
Hedrick, P. W. 2011. Population genetics of malaria resistance in humans. Heredity 107:283–304.
Kohler, H., J. Bayry, A. Nicoletti, and S. V. Kaveri. 2003. Natural autoantibodies as tools to predict the outcome of the immune response? Scandinavian Journal of Immunology 58:285–289.
LaPointe, D. A, C. T. Atkinson, and S. I. Jarvi. 2009. Managing disease. Pp. 405–424 in T. K. Pratt, C. T. Atkinson, P. C. Banko, J. D. Jacobi, and B. W. Woodworth (editors). Conservation biology of Hawaiian forest birds: implications for island avifauna. Yale University Press, New Haven, CT.
Martin, L. B., II, P. Han, J. Lewittes, J. R. Kuhlman, K. C. Klasing, and M. Wikelski. 2006. Phytohemagglutinin-induced skin swelling in birds: histological support for a classic immunoecological technique. Functional Ecology 20:290–299.
Matson, K. D., R. E. Ricklefs, and K. C. Klasing. 2005. A hemolysis-hemagglutination assay for characterizing constitutive innate humoral immunity in wild and domestic birds. Developmental and Comparative Immunology 29:275–286.

13
Millet, S., J. Bennett, K. A. Lee, M. Hau, and K. C. Klasing. 2007. Quantifying and comparing constitutive immunity across avian species. Developmental and Comparative Immunology 31:188–201.
Ochsenbein, A. F., and R. M. Zinkernagel. 2000. Natural antibodies and complement link innate and acquired immunity. Immunology Today 21:624–630.
Owen, J. B., A. C. Nelson, and D. H. Clayton. 2010. Ecological immunology of bird-ectoparasite systems. Trends in Parasitology 26:530–539.
Parmentier, H., A. Lammers, J. Hoekman, G. D. V. Reilingh, I. Zaanen, and H. Savelkoul. 2004. Different levels of natural antibodies in chickens divergently selected for specific antibody responses. Developmental and Comparative Immunology 28:39–49.
Salvante, K. G. 2006. Techniques for studying integrated immune function in birds. The Auk 123:575–586.
Samuel, M. D., P. H. F. Hobbelen, F. DeCastro, J. A. Ahumada, D. A. LaPointe, C. T. Atkinson, B. L. Woodworth, P. J. Hart, and D. C. Duffy. 2011. The dynamics, transmission, and population impacts of avian malaria in native Hawaiian birds—an epidemiological modeling approach. Ecological Applications 21: 2960–2973.
Spiegel, C. S., P. J. Hart, B. L. Woodworth, E. J. Tweed, and J. J. LeBrun. 2006. Distribution and abundance of native forest birds in low-elevation areas on Hawaiʽi Island: evidence of range expansion. Bird Conservation International 16:175–185.
Sun, Y., H. K. Parmentier, K. Frankena, and J. J. van der Poel. 2011. Natural antibody isotypes as predictors of survival in laying hens. Poultry Science 90:2263–2274.
U.S. Fish and Wildlife Service. 2006. Revised recovery plan for Hawaiian forest birds. U.S. Fish and Wildlife Service, Region 1, Portland, OR.
van Riper, C., III, S. G. van Riper, M. L. Goff, and M. Laird. 1986. The epizootiology and ecological significance of malaria in Hawaiian land birds. Ecological Monographs 56:327–344.
Vinkler, M., H. Bainova, and T. Albrecht. 2010. Functional analysis of the skin-swelling response to phytohaemagglutinin. Functional Ecology 24:1081–1086.
Whiteman, N. K., K. D. Matson, J. L. Bollmer, and P. G. Parker. 2006. Disease ecology in the Galapagos Hawk (Buteo galapagoensis): host genetic diversity, parasite load and natural antibodies. Proceedings of the Royal Society B 273:797–804.
Wijga, S., H. K. Parmentier, M. G. B. Nieuwland, and H. Bovenhuis. 2009. Genetic parameters for levels of natural antibodies in chicken lines divergently selected for specific antibody response. Poultry Science 88:1805–1810.
Woodworth, B. L., C. T. Atkinson, D. A. LaPointe, P. J. Hart, C. S. Spiegel, E. J. Tweed, C. Henneman, J. LeBrun, T. Denette, R. DeMots, K. L. Kozar, D. Triglia, D. Lease, A. Gregor, T. Smith, and D. Duffy. 2005. Host population persistence in the face of
14
introduced vector-borne diseases: Hawaii amakihi and avian malaria. Proceedings of the National Academy of Sciences 102:1531–1536.
Yorinks, N., and C. T. Atkinson. 2000. Effects of malaria (Plasmodium relictum) on activity budgets of experimentally-infected juvenile Apapane (Himatione sanquinea). The Auk 117:731–738.
Zylberberg, M., K. A. Lee, K. C. Klasing, and M. Wikelski. 2012. Increasing avian pox prevalence varies by species, and with immune function, in Galápagos finches. Biological Conservation 153:72–79.