avian disease and mosquito vectors in the kahuku unit of hawai`i
TRANSCRIPT

Technical Report HCSU-070
AVIAN DISEASE AND MOSQUITO VECTORS IN THE KAHUKU UNIT OF HAWAI I VOLCANOES NATIONAL PARK AND KA U
FOREST RESERVE
Jacqueline M. Gaudioso-Levita1, Dennis A. LaPointe1, Carter T. Atkinson1, and Ariel N. Egan2
1U.S. Geological Survey, Pacific Island Ecosystems Research Center, Kīlauea Field Station, P.O. Box 44, Hawai i National Park, HI 96718
2Hawai i Cooperative Studies Unit, University of Hawai i at Hilo, P.O. Box 44, Hawai i National Park, HI 96718
Hawai i Cooperative Studies Unit
University of Hawai i at Hilo200 W. Kawili St.
Hilo, HI 96720(808) 933-0706
December 2015

ii
This product was prepared under Cooperative Agreement G11AC20269 for the Pacific Island Ecosystems Research Center of the U.S. Geological Survey.
This article has been peer reviewed and approved for publication consistent with USGS Fundamental Science Practices (http://pubs.usgs.gov/circ/1367/). Any use of trade, firm, or product names is for descriptive purposes only and does not imply endorsement by the U.S. Government.

iii
TABLE OF CONTENTS
List of Tables ....................................................................................................................... iii
List of Figures ...................................................................................................................... iv
Abstract ............................................................................................................................... 1
Introduction ......................................................................................................................... 2
Methods .............................................................................................................................. 3
Study Area and Climate Data ............................................................................................. 3
Field Procedures ............................................................................................................... 5
Adult Mosquito Trapping ................................................................................................... 6
Pig Activity, Larval Mosquito Habitat and Stream Surveys .................................................... 8
Malarial Diagnostics .......................................................................................................... 9
Statistical Methods ............................................................................................................ 9
Results .............................................................................................................................. 10
Biogeographical Trends of the Study Area ........................................................................ 10
Mist Netting and Malarial Prevalence ................................................................................ 11
Avipoxvirus and Ectoparasite Prevalence .......................................................................... 13
Adult Mosquito Trapping ................................................................................................. 21
Feral Pig Activity and Larval Habitat ................................................................................. 21
Stream Survey ................................................................................................................ 25
Discussion ......................................................................................................................... 27
Disease Prevalence across the Landscape ......................................................................... 27
Mosquito Abundance, Climate, Land Use and the Availability of Larval Mosquito Habitat ...... 29
Conclusions and Future Research ........................................................................................ 31
Acknowledgements ............................................................................................................ 32
Literature Cited .................................................................................................................. 32
Appendix I ......................................................................................................................... 37
Appendix II ........................................................................................................................ 40
LIST OF TABLES
Table 1. Site descriptions of Ka‘u District avian disease survey sites from 2012‒2014. .............. 5
Table 2. Capture summary of newly banded birds by species and site name for 2012‒2014. .... 7
Table 3. Avian malarial prevalence by species and site from 2012‒2014. ............................... 17
Table 4. Avian malarial prevalence for ‘Apapane and Hawai‘i ‘amakihi ................................... 19
Table 5. Prevalence of pox lesions among forest birds by site in Kahuku and Ka‘u. ................. 19
iv
Table 6. A table of the binomial GLM results from StepAIC for all species with environmental factors and species as predictors of malarial infection. .......................................................... 20
Table 7. A table of the binomial GLM results for all species, excluding ‘Apapane with environmental factors and species as predictors of malarial infection. .................................... 20
Table 8. A table of binomial GLM results for Hawai‘i ‘amakihi only with environmental factors as predictors of malarial infection. ........................................................................................... 20
Table 9. Summary of adult mosquito trapping effort, captures and malarial prevalence. ......... 23
Table 10. Summary of mosquito capture rates by trap type, tract and mosquito species. ........ 24
Table 11. Summary of larval mosquito habitat sampled in the Kahuku-Ka‘u belt transect. ....... 25
Table 12. Summary of stream survey sample dips. ............................................................... 26
LIST OF FIGURES
Figure 1. Study sites in the Kahuku Unit of HAVO and Ka‘u Forest Reserve with elevation and rainfall contours displayed. ................................................................................................... 4
Figure 2. Study sites in the Kahuku Unit of HAVO and Ka‘u Forest Reserve ............................ 10
Figure 3. A) An interaction plot showing mean annual rainfall by elevation, B) An interaction plot of mean annual rainfall plotted again mean annual temperature ........................................... 11
Figure 4. The Kahuku-Ka‘u landscape, with the malarial prevalence of all species. .................. 13
Figure 5. Percent prevalence for each site, with sites grouped by elevation category .............. 15
Figure 6. A) Malarial prevalence of Hawai‘i ‘amakihi by elevation category, B) Malarial prevalence in Hawai‘i ‘amakihi ............................................................................................. 16
Figure 7. A.) Malarial prevalence of ‘Apapane by elevation category, B.) Malarial prevalence in ‘Apapane by individual site .................................................................................................. 18
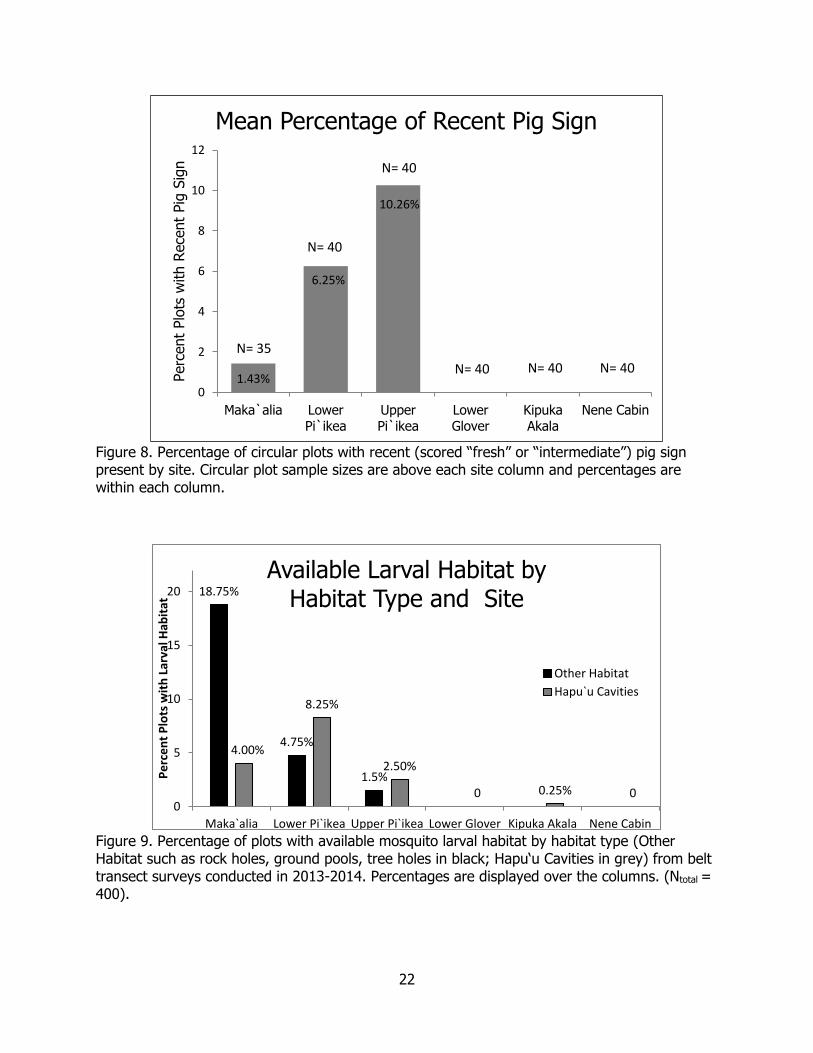
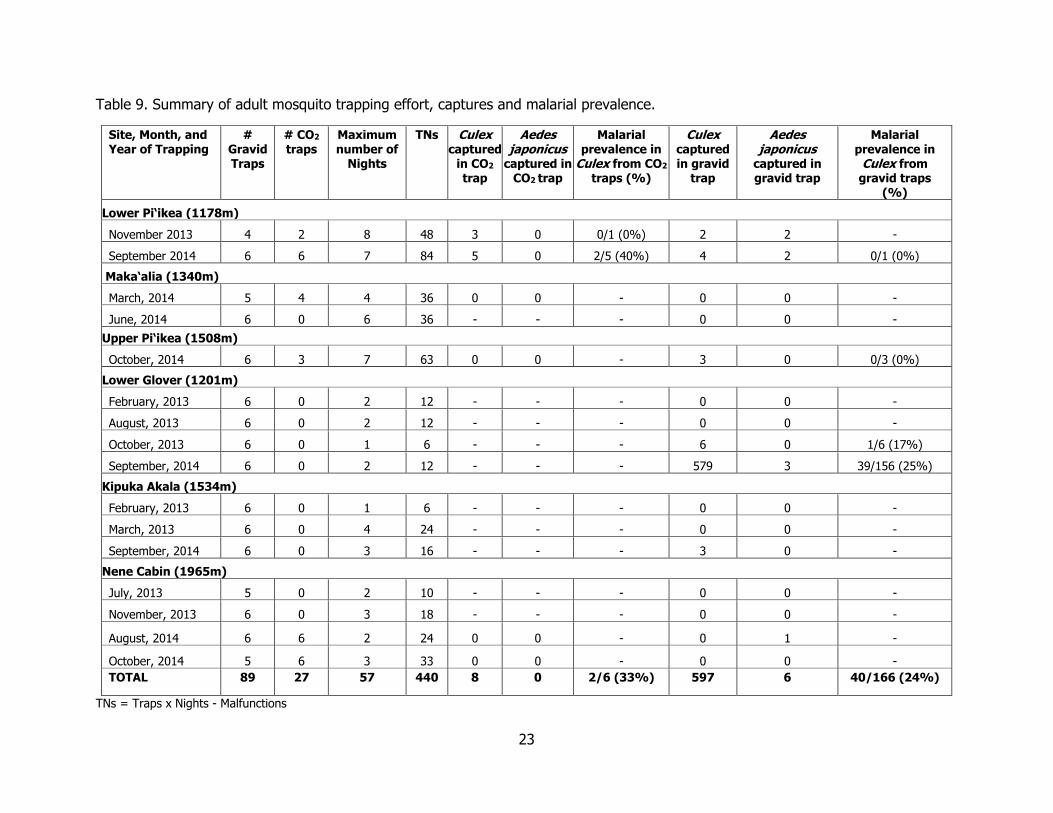
Figure 8. Percentage of circular plots with recent pig sign present by site. ............................. 22
Figure 9. Percentage of plots with available mosquito larval habitat by habitat type ............... 22

1
ABSTRACT
While avian disease has been well-studied in windward forests of Hawai‘i Island, there have been few studies in leeward Ka‘u. We surveyed four altitudinal sites ranging from 1,200 to 2,200 m asl in the Kahuku Unit of Hawai‘i Volcanoes National Park (Kahuku) and three altitudinal sites ranging from 1,200 to 1,500 m asl in the Ka‘u Forest Reserve (Ka‘u) for the prevalence of avian disease and presence of mosquitoes. We collected blood samples from native and non-native forest birds and screened for avian malaria (Plasmodium relictum) using PCR diagnostics. We examined birds for signs of avian pox (Avipoxvirus sp.), knemidokoptic mange (Knemidokoptes jamaicensis) and feather ectoparasites. We also trapped adult mosquitoes (Culex quinquefasciatus and Aedes japonicus japonicus) and surveyed for available larval habitat. Between September, 2012 and October, 2014, we completed 3,219 hours of mist-netting in Kahuku capturing 515 forest birds and 3,103 hours of mist-netting in Ka‘u capturing 270 forest birds. We screened 750 blood samples for avian malaria. Prevalence of avian malaria in all species was higher in Ka‘u than Kahuku when all sites were combined for each tract. Prevalence of avian malaria in resident Hawai‘i ‘amakihi (Chlorodrepanis virens) was greatest at the lowest elevation sites in Kahuku (26%; 1,201 m asl) and Ka‘u (42%; 1,178 m asl) and in general, prevalence decreased with increasing elevation and geographically from east to west. Significantly higher prevalence was seen in Ka‘u at comparable low and mid elevation sites but not at comparable high elevation sites. The overall presumptive pox prevalence was 1.7% (13/785) for both tracts, and it was higher in native birds than non-native birds, but it was not significant. Presumptive knemidokoptic mange was detected at two sites in lower elevation Kahuku, with prevalence ranging from 2‒4%. The overall prevalence of ectoparasites (Analges and Proctophyllodes spp.) was 6.7% (53/785). The site with the highest prevalence was Lower Glover in Kahuku (7.2%; 10/138) and Maka‘alia in Ka‘u. In general, mosquito larval habitat was more prevalent at lower elevation sites than higher elevation sites within the Kahuku—Ka‘u landscape, and more prevalent in Ka‘u than Kahuku. We observed significantly more available larval mosquito habitat in total belt transect plots in Ka‘u than Kahuku for both hapu‘u cavities (Χ2 = 47.06, df = 1, p < 0.01) and other habitat types combined (i.e., ground pools, rock holes, tree holes) (Χ2 = 104.35, df = 1, p < 0.01). Mosquitoes were most abundant at low elevation Kahuku, but were captured at all sites up to 1,532 m asl in Kahuku. The malarial infection rate of live mosquitoes was 21% (39/186) at Kahuku and 25% (2/8) at Ka‘u. There were 19 times more larval habitats available in Ka‘u than Kahuku on survey transects, yet we captured 53 times more C. quinquefasciatus mosquitoes in Kahuku. We captured very few adult A. j. japonicus across the landscape (Ntotal = 6) and no Aedes albopictus were detected in this study. Larval surveys along ranch roads and infrastructure revealed that ground pools along rutted, overgrown ranch roads were the likely source of Kahuku mosquitoes. We did not find mosquito larvae associated with ranching infrastructure. Unlike the low elevation forests on windward Hawai‘i Island, avian malaria prevalence, mosquito abundance, and the density of available larval habitat in Kahuku and Ka‘u were relatively low. Although altitudinal variations in climate appear to be the primary factors limiting the distribution of avian disease, habitat type, avian movements, human activity, and feral pig (Sus scrofa) management all may play important roles in determining the prevalence of avian malaria across the Kahuku—Ka‘u landscape.

2
INTRODUCTION
Introduced mosquito-borne avian disease has had an extensive effect on the abundance, diversity, and distribution of endemic Hawaiian avifauna. Both avian pox and avian malaria are key limiting factors responsible for the extinction and decline of many forest bird species (Warner 1968, van Riper III et al. 1986, Atkinson et al. 1995). One group that has been particularly susceptible to avian disease is the Hawaiian honeycreepers. Hawaiian honeycreepers are a group of endemic finches that consists of 56 known species. As a remarkable example of adaptive radiation, these species filled every ecological niche from dry forest seed eaters to rainforest nectar-feeders. Honeycreepers represent a main component of an otherwise depauperate vertebrate fauna and early naturalists commented on the astonishing abundance of these birds throughout the island chain. In terms of biomass, they likely dominated the island landscape and these species played key roles in critical ecosystem processes such as pollination and seed dispersal. The extinction and decline of many endemic plants may be linked to the early extinction of some honeycreepers (Banko and Banko, 2009, Pratt and Jacobi, 2009).
Species richness of bird communities on Hawai‘i Island are restricted to native forests above 1,500 m asl (Atkinson and LaPointe 2009), due to thermal limits on mosquitoes and malaria parasites. While the avian disease system has been well-studied in many native forests throughout the state, little is known about avian disease in the Ka‘u Forest Reserve, hereafter referred to as Ka’u and the nearby Kahuku Unit of Hawai‘i Volcanoes National Park, hereafter referred to as Kahuku. High elevation forests in Ka‘u and Kahuku still harbor intact communities of extant Hawaiian honeycreepers but distributions of native forest bird diversity and abundance at the lower, southern section of Ka‘u and Kahuku suggest that avian disease might constrain existing populations and hinder future attempts at restoration. Paradoxically, recent bird survey data revealed an unexpected abundance of vulnerable native passerines, including some endangered species, below 1,500 m asl in the Northern section of Ka‘u (Gorresen et al. 2007). This distributional anomaly could be generated by several processes which have implications for habitat management and the future of these bird populations.
Spatial analysis of trap data from nearby Volcano, Hawai‘i suggests a positive association between mosquito abundance and cattle ranching (Reiter & LaPointe 2007). Feral pig removal and the removal or repair of ranch infrastructure impounding rainwater resulted in lower mosquito numbers in Hawai‘i Volcanoes National Park (HAVO) (LaPointe, unpublished data). Conditions favorable to mosquito production may occur in or adjacent to Kahuku Ranch where a long history of cattle ranching has altered the landscape, leaving behind infrastructure and rutted roads. In the Ka‘u Forest Reserve, feral pigs foraging on native tree ferns create larval mosquito habitat and as the adjacent subdivision of Ocean View continues to grow, so does the number of domestic water containers from uncovered cisterns to animal water pans available to mosquito larvae. To add to this landscape of human- or feral pig-made potential larval mosquito habitat are the many intermittent streams that drain the southern flank of Mauna Loa. In drier years, the rock pools in intermittent stream beds become suitable larval habitat for C. quinquefasciatus (Hobbelen et al. 2012).
Disease currently restricts Hawaiian forest birds to a small fraction of the available habitat, and that fraction will continue to diminish in this century as climate warming allows disease vectors to invade high-elevation forests (Benning et al. 2002). Extinction of these species is highly likely unless populations evolve tolerance or resistance, or management actions can be applied that

3
allow birds to persist in warmer environments. By exploring underlying patterns in the disease system across the broad and diverse Kahuku-Ka‘u landscape, this study will provide key information to help guide habitat management practices to conserve the resources therein, and promote their expansion. In addition, this study provides the first avian disease baseline for Ka‘u, which is one of the largest relatively intact areas of native forest in Hawai‘i, and for Kahuku, land recently acquired by NPS as a prime area for habitat restoration.
METHODS
Study Area and Climate Data Blood samples were collected from forest birds, adult mosquitoes were trapped, and surveys for feral pig activity and larval mosquito habitat were conducted at three sites located in Kahuku and three sites located in adjacent Ka‘u (Figure 1). Both tracts are located on the Southeastern flank of Mauna Loa on Hawai‘i Island and fall within the projected coordinate system NAD 1983 UTM Zone 5N. The sites in Kahuku were located at 1,201m asl (Lower Glover; X: 217549, Y: 2116861), 1,534 m asl (Kipuka Akala, X: 217506, Y: 2121993), and 1,965 m asl (Nene Cabin, X: 225208, Y: 2130652). We also analyzed blood collected by E. Paxton (USGS-Pacific Island Ecosystems Research Center) in 2012 at 2,194 m asl (1926 Lava Flow, X: 229429 Y: 2136427) but no mosquito trapping, or surveys for feral pig activity or larval mosquito habitat were conducted at this site. While this additional site falls within the Kahuku-HAVO boundary, we included it in Ka‘u due to its geographical position along a continuous elevation gradient with our other Ka‘u sites.
Historically, the 46,943 hectare Kahuku Unit of HAVO was one of the oldest cattle ranches in Hawai‘i with peak operations occurring during the late 1860’s through 1912 (Avery 2009). It was sold to the Parker Ranch in 1912 and then to the Damon Estate in 1947. By 2000, the cattle ranching operations in Kahuku had fallen by the wayside, and only the infrastructure of the ranch remained; cisterns, reservoirs, troughs, rutted roads and water pipes, all of which persist in poor condition. Kahuku was purchased by the National Park Service in 2003, initiating the enforcement of the protection and management of the wide array of natural resources contained within the parcel. Our study sites ranged in habitat type from a moist-mesic, scattered Ōhi‘a-koa (Metrosideros polymorpha and Acacia koa) co-dominant forest with a sparse tree-fern, native fruiting trees such as Ōhelo (Vaccinium reticulatum); Ōlapa (Cheirodendron trigynum), and introduced Kikuyu grass (Pennisetum clandestinum) understory (Lower Glover), to a moist-mesic, open Ōhi‘a-dominant forested kipuka with a mixed native
shrub and introduced Kikuyu grass understory (Kipuka Akala), to a moist-mesic, scattered ōhi‘a-
dominated forest with scattered native shrubland (Pukeawe; Styphelia tameiameiae) understory, to a seasonal mesic, open Ōhi‘a-dominant forest along a lava flow (1926 Lava Flow) (Table 1).
Our sites in the Ka‘u were located at 1,178 m asl (Lower Pi‘ikea, X: 236433 Y: 2132405), 1,340 m asl (Maka‘alia, X: 225986, Y: 2124606), and 1,508 m asl (Upper Pi‘ikea, X: 234610, Y: 2133878) (Table 1). The study sites ranged in habitat type from a moist-mesic, closed Ōhia-
dominant stream edge forest (Lower Pi‘ikea) to a moderately wet, closed Ōhi’a-Koa co-

4
Figure 1. Study sites in the Kahuku Unit of HAVO and Ka‘u Forest Reserve with elevation and rainfall contours displayed.
dominant, dense understory bog forest (Maka‘alia), to a moist-mesic, closed Ōhi‘a-dominant stream edge forest with an open, native plant understory (Upper Pi‘ikea).
Site description data was gathered from various publications and databases on vegetation monitoring and biogeography of the Hawaiian Islands vegetation composition and canopy cover categories were determined using vegetation survey methods from Jacobi et al. (1989), and moisture zone was determined from Price et al. (2007), while mean annual rainfall was determined from projected isohyets from the GIS layer created by UH-Manoa’s Department of Geography. The mean air temperature data was determined from projection of the GIS layers created by Giambelluca et al. (2014), which are based on a thirty-year average to the nearest degree C. For analysis, we used both the annual mean air temperature and mean air temperature for the month of September; September was chosen because it is the warmest month during seasonal development of C. quinquefasciatus larvae. All maps were created in ArcMap 10.2.1.

5
Table 1. Site descriptions of Ka‘u District avian disease survey sites from 2012‒2014.
Geographical Category (Parcel-Elevation)
Site Name with Coordinates (UTM zone 5N)
Habitat Description (moisture zone*; canopy composition; canopy cover)
Elevation (meters)
Mean Annual Rainfall (millimeters)**
Mean annual air temperature (C°)***
Mean September air temperature (C°)***
Kahuku-High Nene Cabin X: 225208 Y: 2130652
Moist Mesic Ohia-dominant Scattered Canopy
1965 2100 11.08 12.32
Kahuku- Middle Kipuka Akala X: 217506 Y: 2121993
Moist Mesic Ohia-dominant Open Canopy
1534 1700 13.46 14.74
Kahuku- Low Lower Glover X: 217549 Y:2116891
Moist Mesic Ohia-koa co-dominant Scattered Canopy
1201 1600 15.87 17.2
Ka‘u-High 1926 Lava Flow X: 229429 Y: 2136427
Seasonal Mesic Ohia-dominant Open Canopy
2194 1750 9.59 10.82
Ka’u-Middle Upper Pi‘ikea X: 234610 Y: 2133878
Moist Mesic Ohia-dominant Closed Canopy
1508 2375 13.58 14.29
Ka’u-Middle Maka‘alia X: 225986 Y: 2124606
Moderately Wet Ohia-koa co-dominant Closed Canopy
1340 2750 14.72 15.33
Ka’u-Low Lower Pi‘ikea X: 236433 Y: 2132405
Moist Mesic Ohia-dominant Closed Canopy
1178 2525 15.10 16.03
* from Price et al. 2007, **from UH-Manoa Geography Dept. 2011, *** from Giambelluca et al. 2014
Field Procedures From 2012‒2014, we operated 8‒15 mist-nets at each site (6 or 12 m long, 36 mm mesh) supported by double-length (6 m) sections of electrical metal conduit. Nets were operated from 0700‒1600 hours and checked every 30 minutes by a team of 3‒5 banders. Nets were closed if drops of moisture beaded on the mesh, rain became heavy or persistent, or wind persisted above a score of three on the Beaufort wind scale. Net hours were calculated as the sum of the net size (12 m = 1 net; 6 m = 0.5 net), multiplied by the number of hours (to the nearest ¼ hour) nets were operated (Table 2).
Birds were banded using U.S. Geological Survey aluminum bands, and measured for morphometrics to obtain sex and age. Note that while sub-adult ‘Apapane (Himatione sanguinea) can be sexed, this is not possible for sub-adult Hawai‘i ‘amakihi (Chlorodrepanis virens). All birds were examined by a trained observer for evidence of Avipoxvirus infections, knemidokoptic mange, and ectoparasites. Presumptive diagnosis of pox infections was based upon the presence of swollen and/or crusty lesions on the feet (early stage) or missing and/or malformed digits (late stage). Presumptive diagnosis of knemidokoptic mange lesions, caused by the skin mite Knemidokoptes jamaicensis, was also based on descriptive criteria.

6
Knemidokoptic mange lesions were characterized by tassel and scaly growths on the feet of infested birds and scored as early, intermediate or advanced using standard criteria (Gaudioso et al. 2009). Presumptive mange lesions were scraped, when possible, with a sterile scalpel blade and the scrapings were preserved in 70‒95% ethanol and later microscopically examined to confirm the presence of mites or characteristic mite burrows. Due to the difficulty of collecting early mange scrapings, which are slightly raised and minute in size, we were not able to collect scrapings from all individuals exhibiting presumptive early mange. Whenever suspect pox or mange lesions were encountered, the mist net, banding tools and the bander’s hands were immediately disinfected. All mist nets, bird bags, and field equipment (tarps, tents, etc.) were washed and disinfected prior to use in a new study area. We examined birds for ectoparasites (chewing lice and feather mites) on five feathered regions: head, breast, rump, primaries, and rectrices. Feather mite densities were scored subjectively for both body (head, breast and rump) and flight (primaries and rectrices) feathers on a scale ranging from 0–3, where 1 = 1‒99 individuals, 2 = 100‒999 individuals and 3 = 1000+. Specimens of ectoparasites encountered were preserved in 70‒95% ethanol for subsequent identification. A blood sample (< 1% of the bird’s body weight) was collected from the brachial or jugular veins of all species. The whole blood collected was spun in a battery-operated field centrifuge to separate plasma from packed blood cells. Microhematocrit tubes were broken with a file and plasma and packed cells were removed using a 200 ul pipet. Plasma was stored in 0.5 ml tubes and packed cells were dispensed in 50 ul of lysis buffer (0.1 M Tris, pH 8.0, 0.1 M EDTA, 2% SDS) in a 0.5 ml tube. All samples were transported to the Kilauea Field Station (35‒106 miles away) laboratory on wet ice and stored at -70°C.
Adult Mosquito Trapping Gravid traps (Model 1712, John W. Hock Company Gainesville, FL) were used for trapping ovipositing C. quinquefasciatus. An alfalfa infusion was prepared five days prior to setting traps. The infusion was made by adding 750 gm of alfalfa rabbit chow and 57 gm of a yeast protein/lactalbumin mixture to 23 l water. All traps were placed within 1 km of the net lanes (Figure 2). Traps were placed in the shade, and close to a tree base or rock to minimize disturbance by feral ungulates. Host-seeking mosquitoes were collected using modified CDC miniature light traps (Model 512, John W. Hock Company Gainesville, FL). CDC light traps were operated without lights or a lid and baited with CO2 and will henceforth be referred to as CO2 traps. At Kahuku, CO2 traps were baited with dry ice contained in an insulated container (Igloo® foam insulated drink cooler Part No. 1.1, John W. Hock Company, Gainesville, FL.) that was modified with a 5 mm hole for gas release and suspended just above the trap opening. At our more remote Ka‘u sites, we used compressed gas cylinders and CO2 was delivered through a modified trap lid (Clarke Mosquito Control, Model LID1, Roselle, Illinois) at a rate of 500 ml/min. CO2 traps were hung in the forest canopy at above ground heights ranging from 4‒12 m (depending on forest stature) and at each site traps were set up 50‒100 m apart. Traps were operated for 2‒6 consecutive nights from approximately 1700–0800 hours and traps were checked every morning. Mosquitoes were identified to species level, C. quinquefasciatus or A. j. japonicus, and collected using a mouth aspirator and transferred into a 500 ml wax paper container fitted with a mesh covering. No Aedes albopictus were captured during this study. When possible, collected mosquitoes were maintained on a 3% sucrose solution and taken back to the laboratory for identification and dissection to determine malarial prevalence. Mosquitoes were dissected in buffered physiological saline and the midgut and salivary glands were examined under a compound microscope at 450X for evidence of oocysts (midgut) or sporozoites (salivary glands). Positive malaria detections were based on both oocysts being

7
present and/or sporozoites being present. Mosquitoes that died prior to arrival in the lab were not dissected or included in calculations of prevalence. In Kahuku, we trapped mosquitoes
Table 2. Capture summary of newly banded birds by species and site name for 2012‒2014.
Kahuku Unit of HAVO Ka‘u Forest Reserve
Lower Glover
Kipuka Akala
Nene Cabin
Total Lower Pi‘ikea
Maka‘alia Upper Pi‘ikea
1926 Flow
Total
Total net hours
967 1175 1077 3,219 1365 537 921 280 3,103
Species
‘Apapane 8 71 108 187 10 4 5 54 73
‘Akepa 0 0 0 0 0 0 0 0 0
‘Elepaio 0 0 0 0 3 0 6 0 9
Hawai‘i ‘amakihi
89 65 83 237 23 18 49 21 111
Hawai‘i creeper
0 0 0 0 0 0 3 0 3
House finch
0 12 0 12 0 0 0 0 0
I‘iwi 0 4 0 4 0 4 1 1 6
Japanese white-eye
37 10 19 66 20 7 16 0 43
Northern cardinal
0 2 0 2 0 1 0 0 1
Nutmeg manikin
3 0 0 3 0 0 0 0 0
Oma‘o 0 1 0 1 0 2 4 0 6
Red-billed leothrix
0 0 0 0 11 6 1 0 18
Yellow-fronted canary
1 0 2 3 0 0 0 0 0
TOTAL 138 165 212 515 67 42 85 76 270

8
during the following sampling periods: February‒March, 2013; July‒August, 2013; November, 2013; and August‒October, 2014. In Ka‘u, we trapped mosquitoes during the following sampling periods: November, 2013; March, 2014; June, 2014; September‒October, 2014.
Pig Activity, Larval Mosquito Habitat and Stream Surveys We surveyed four, 1 km long belt transects at each study site to determine the 1) relative frequency of feral pig activity and 2) relative abundance/frequency of available larval mosquito habitat. Transects ran parallel to slope and were spaced 250‒500 m apart. We recorded the presence and age of various pig sign using standard techniques and criteria developed by Anderson and Stone (1994) that have been used to monitor pig activity in HAVO and other natural areas in the Hawaiian Islands for the past two decades. Although pig activity indices are not a true measure of pig abundance they may be useful in recognizing trends in relative abundance (Nogueira et al. 2007). Observers walked on a fixed heading on each transect, recording the presence and relative age of various pig sign encountered in 100 contiguous plots measuring 10 m x 5 m. Feral pig sign was recorded and aged by two observers trained and calibrated to the primary observer (DAL) to minimize observer error. All discreet aquatic habitats (any non-flowing body of water) were also recorded for each transect section as available larval mosquito habitat. Typical habitats included, ground pools, pig wallows, tree fern cavities, rock holes and pools in intermittent stream beds (hereafter rock pools), tree holes and occasionally man-made, discarded containers or impoundments. We considered wallows distinct from other ground pools because they are created and frequented by feral pigs. When aquatic habitat was present, we sampled up to ten habitats per transect for mosquito larvae. Aquatic habitats were sampled, depending on size, by either extracting the entire water volume (< 3 liters) with a turkey baster or by taking a 250 ml dip sample with a long-handled dipper for every 30 cm2 of surface area. Water samples were passed through a 250 μm sieve and then the sieve contents were flushed into a sorting tray and examined for mosquito larvae and other macroinvertebrates. Mosquito larvae were identified to species and enumerated. Other insects were identified to family while other invertebrates were identified to higher order taxa and enumerated. Vouchers of specimens were preserved in 70% ethanol for later identification.
We also conducted eight to ten 9-meter radius (254.47 m2) circular plots per transect. Each circular plot was divided into quadrants. The quadrants were surveyed beginning at the center and radiating outward in order to minimize the impact that our foot prints had on the pig sign. Trained surveyors walked slowly to ensure that all larval mosquito habitat and pig sign were located, aged, and recorded.
We also conducted larval mosquito habitat surveys along a 1,000 m long reach of the closest, accessible stream in the Ka‘u study site (Figure 2). Stream surveys were not conducted during periods of high water when stream banks were inundated. Two to three observers walked along the bank or stream channel and recorded the number of discreet rock pools in each 10-meter reach of streambed. Sections of the stream channel with running water were excluded. Ten dips with a standard 250 ml, long-handled dipper were sampled from each stream section while attempting to sample all rock pools in the section. Extra dips were taken in wet sections following a dry section of streambed. Mosquito larvae and macroinvertebrates encountered were identified as stated above. Relative abundance was determined by the proportion of dip samples in which that species was present.

9
Malarial Diagnostics Purified DNA for PCR analysis was extracted from packed blood cells using DNeasy tissue extraction kits (Qiagen Inc., Valencia California) according to manufacturer’s protocols but we increased the initial incubation times with Proteinase K to overnight to increase yield of DNA. DNA was recovered from extraction columns with Tris EDTA buffer, measured by spectrophotometry with a Nanodrop spectrophometer to assess purity and determine DNA concentration, and stored frozen until use in PCR reactions. We used published PCR primers that amplify parasite ribosomal genes for detecting infection with Plasmodium (Fallon et al. 2003). The primers were used in a nested protocol with an initial amplification of host DNA (100 ng/reaction) with primers 292F/631R followed by a second amplification with primers 343F/496R that used 1 µl of a 1:10 dilution of template from the first reaction. PCR reactions with primers 292F/631R were run in 25 µl volumes containing the following components in the reaction mix: 2.0 mM MgCl2, 0.2 mM each deoxynucleoside triphosphate (dNTP), 0.4 µM each primer, and 0.5 units of Promega GoTaq polymerase (Promega North America, Madison, Wisconsin). PCR reactions with primers 343F/496R were run in 25 µl volumes containing the following components in the reaction mix: 2.5 mM MgCl2, 0.2 mM each deoxynucleoside triphosphate, 0.5 µM each primer, and 0.25 units of Promega GoTaq polymerase. Cycling conditions for the original flanking primer pair (292F/631R) followed a hot-start, touch-down protocol: 2-min at 94 oC, followed by 20 cycles with 1-min denaturation at 94o C, 1-min annealing at 52–42oC, and elongation at 72oC for 1-min and 10 sec. After 20 cycles, a final elongation step followed at 72o C for 3-min. The final assay primer pair (343F and 496R) was run at 2-min at 94o C, followed by 35 cycles with 1-min denaturation at 94o C, 1-min annealing at 57o C, and elongation at 72o C for 1-min and 10 sec, with a final elongation step at 72o C for 3-min. PCR products from the second reaction were resolved on 1.5 % agarose gels to determine presence or absence of an expected 190 bp band. All PCR reactions were run with a positive control consisting of DNA extracted from a Pekin duckling (Anas platyrhynchos domesticus) with an intense experimental infection with P. relictum and a negative control that substituted water for DNA. Positive samples were re-extracted and rerun as a safeguard against contamination error.
Statistical Methods We used Pearson Chi-square tests (with a Yate’s Continuity Correction when df = 1) and Fisher’s Exact tests when sample size was < 5 (Systat, Statistical Software Version 13, 2014) to assess the difference in malarial prevalence by elevation and rainfall for all species and also for individual species that had sample sizes > 20 individuals. We used an ANOVA to compare malarial infection (binomial ANOVA) by elevation category. Both the results of the Pearson Chi-square and ANOVA tests were analyzed further using the post-hoc Tukey’s Honestly-Significant Differences test. We constructed a binomial logistical regression model to test for association between the independent predictors (elevation, rainfall, tract, mean annual temperature, and host species) on the probability of malarial infection of all species (Program R, R Development Core Team, Version 2.15.0, 2012). Predictors of elevation and rainfall were examined as both categorical and continuous variables to allow for the most parsimonious model using Akaike’s Information Criterion (AIC) to be chosen. The function stepAIC was conducted in the program R to guide us to choose the most parsimonious model. Next, we ran a model of all species except ‘Apapane due to their known large-scale dispersal across elevation gradients in response to food resources, so as not to confound the model predictor of elevation. Last, we ran a model using only Hawai‘i ‘amakihi data with predictors of elevation, rainfall, tract, and mean annual temperature on the probability of malaria infection. Hawai‘i ‘amakihi are a resident native

10
species so it was assumed that prevalence in this species was the best estimate for local transmission.
Figure 2. Study sites in the Kahuku Unit of HAVO and Ka‘u Forest Reserve with mean annual temperature (Giambelluca et al. 2014) as the base layer (grey-scale gradient) and mean annual rainfall isohyets overlaid (bold black lines).
RESULTS
Biogeographical Trends of the Study Area We examined elevation in meters against mean annual rainfall in millimeters for all sites (Figure 3A). The highest rainfall was in Ka‘u, at middle elevation, and the lowest rainfall was in Kahuku at low elevation. We found a strong site effect on annual rainfall related to orography within Ka‘u Forest Reserve (Juvik and Juvik, 1998). The plot of elevation by mean annual rainfall shows an interaction between these environmental factors (Figure 3A). The plot of mean annual temperature by mean annual rainfall also shows there is an interaction between these environmental factors (Figure 3B). These interactions are statistically significant in several generalized linear models which will be described below.

11
Figure 3. A) An interaction plot showing mean annual rainfall (by isohyet value (UH-Manoa Department of Geography)) by elevation, with Ka‘u sites shown as a solid black line, and Kahuku sites shown as a dotted black line. B) An interaction plot of mean annual rainfall (by isohyet value) plotted again mean annual temperature (Giambelluca et al. 2014) by each tract.
Mist Netting and Malarial Prevalence Between September 2012 and October 2014, we completed 3,219 hours of mist-netting in Kahuku, and captured 515 birds representing nine species. Eighty-three percent were native
1000
1200
1400
1600
1800
2000
2200
2400
2600
2800
3000
1000 1200 1400 1600 1800 2000 2200
Me
an A
nn
ual
Rai
nfa
ll (m
m)
Elevation (meters)
Elevation (m) by Mean Annual Rainfall (mm)Kau
Kahuku
1000
1200
1400
1600
1800
2000
2200
2400
2600
2800
9.0010.0011.0012.0013.0014.0015.0016.0017.00
Me
an A
nn
ual
Rai
nfa
ll (m
m)
Mean Annual Temperature (C°)
Mean Annual Temperature (C°) byMean Annual Rainfall (mm)
Kau
Kahuku
B.
A.

12
forest bird species. The most frequently captured species in Kahuku was Hawai‘i ‘amakihi, followed by ‘Apapane, which together accounted for 82% of the entire sample. We collected 501 individual blood samples from Kahuku including 20 recaptured birds that were re-bled. From June 2013 to October 2014, we completed 3,103 hours of mist-netting in Ka‘u and captured 270 birds representing nine species. Seventy-seven percent were native forest bird species with Hawai‘i ‘amakihi and ‘Apapane accounting for 68% of the entire sample. In Ka‘u we collected 249 individual blood samples. The most frequently captured species in Ka‘u was Hawai‘i ‘amakihi, followed by ‘Apapane (Table 2). Three Hawai‘i creepers (Oreomystis mana) were captured in Ka‘u at the Upper Pi‘ikea site and we also had aural detections of both endangered Hawai‘i creeper and ‘Akiapola‘au (Hemignathus wilsoni) at this site.
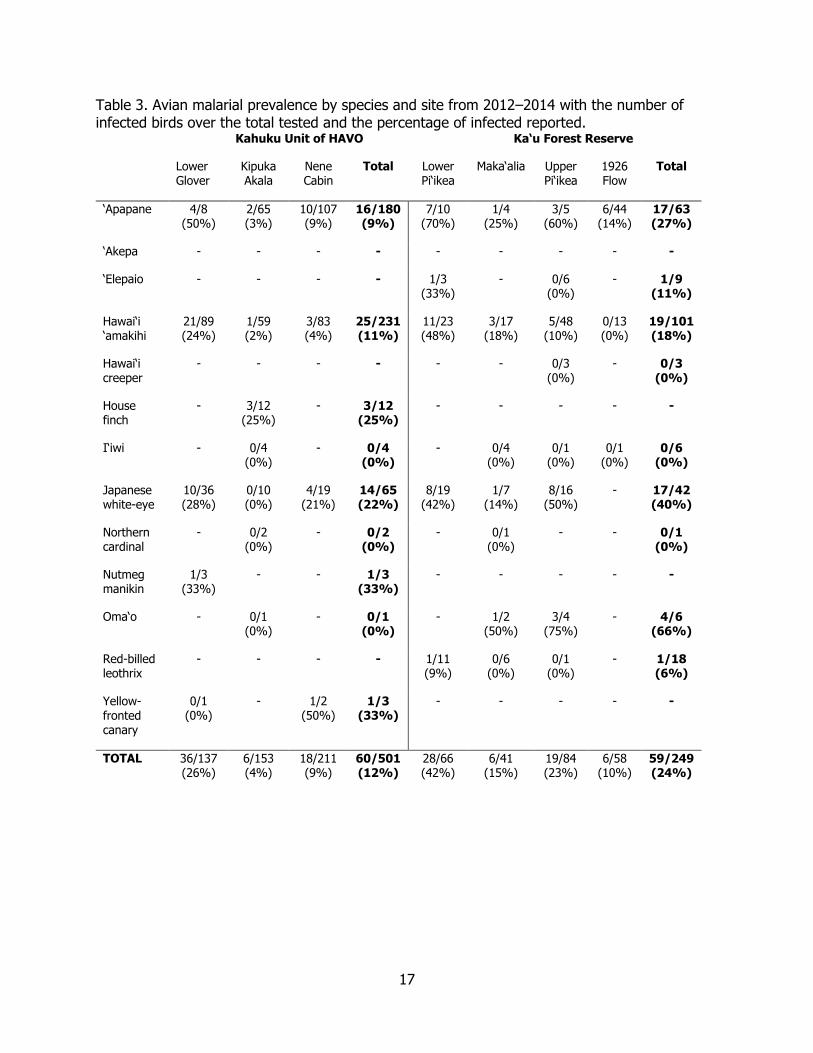
Malarial infection was detected in all native species captured, except for the Hawai‘i creeper (N=3) and I‘iwi (Drepanis coccinea) (N=10). Malarial infection was detected in all non-native species captured, except for the Northern cardinal (Cardinalis cardinalis) (N=3) and Red-billed leothrix (Leiothrix lutea) (N=7). Among infected, native species, ‘Apapane (33/243; 13.5%) and Hawai‘i ‘amakihi (44/332; 13.3%) had the highest overall prevalence when both tracts were combined. The overall prevalence of malaria among all species differed significantly across elevation, with a decrease in prevalence as elevation increased (Figures 4, 5, 6; Table 3). When each elevation category was compared at the site level, there was a significant difference in prevalence between the low elevation sites of Kahuku-Glover and Ka‘u-Lower Pi‘ikea (Χ2 = 5.03, df = 1, p = 0.025), and at middle elevation between the Kahuku-Kipuka Akala and the Ka‘u-Upper Pi‘ikea site (Χ2 = 19.73, df = 2, p = 0.00; Tukey’s HSD, diff. = -0.187, p = 0.00). There was no significant difference in prevalence at the high elevation sites, Kahuku-Nene Cabin and Ka‘u-1926 Lava Flow (Χ2 = 0.184, df = 1, p = 0.67). For Hawai‘i ‘amakihi, there was a clear decrease in prevalence with increasing elevation (F = 19.57, df = 2, p = 0.00; Figure 6). There was a significant difference between low and middle elevation (Tukey’s HSD difference = 0.213, p = 0.00), low and high elevation (Tukey’s HSD diff. = - 0.254, p = 0.00), but this is not true for middle and high elevation (Tukey’s HSD diff. = -0.041, p = 0.61). For ‘Apapane, the highest prevalence was seen at low elevation, but unlike Hawai‘i ‘amakihi, the lowest prevalence is at middle elevation, rather than high elevation (F = 22.0, df = 2, p = 0.00; Figure 7). There was a significant difference in prevalence between low and high elevation sites (Tukey’s HSD, diff. = -0.51, p = 0.00), and between low and middle elevation (Tukey’s HSD diff. = 0.53, p = 0.00), but this was not true for high and middle elevation (Tukey’s HSD diff. 0.025, p = 0.845).
To assess age and sex biases of infection of avian malaria, we looked at the two native species with sufficient sample sizes, Hawai‘i ‘amakihi and ‘Apapane. There was a significant difference in malarial prevalence by sex for Hawai‘i ‘amakihi (Χ2 = 4.51, df = 1, p = 0.034) with more males infected, but this was not seen in ‘Apapane (Χ2 = 0.525, df = 1, p = 0.47). Malarial prevalence of age class (Hatch-year versus After Hatch-year and older) was not significant for either Hawai‘i ‘amakihi (Χ2 = 2.0, df = 1, p = 0.16) or ‘Apapane (Χ2 = 0.04, df = 1, p = 0.85) (Table 4).

13
Figure 4. The Kahuku-Ka‘u landscape, with the malarial prevalence of all species displayed at each study site.
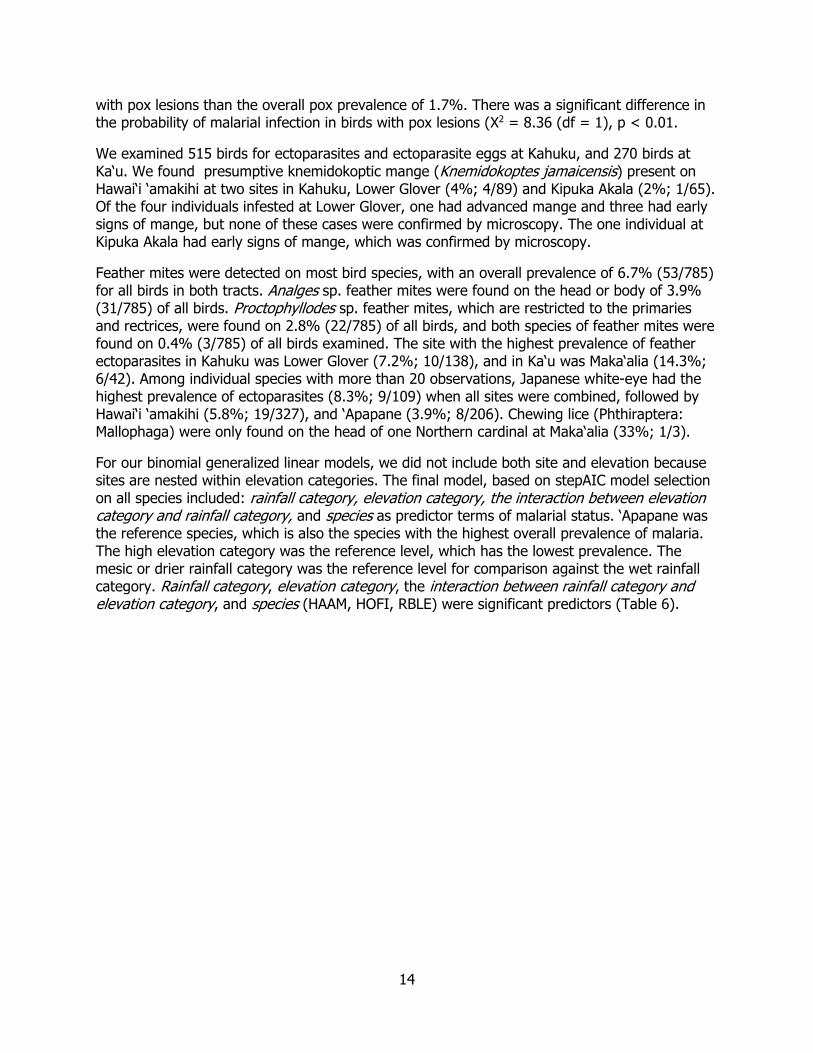
Avipoxvirus and Ectoparasite Prevalence Descriptive criteria for presumptive avian pox cannot rule out lesions caused by injury, infection by other pathogens or a combination of these factors, however, van Riper et al. (2002) found that descriptive criteria for pox lesions in Hawaiian birds was 90% accurate when compared with histological examination and/or virus cultivation in chicken egg, chorioallantoic membrane (CAM). In Kahuku, we examined 515 birds for presumptive pox lesions and found only eight birds (1.5%) with early or late stage pox lesions. Similarly in Ka‘u, we examined 270 birds for presumptive pox lesions and found only five (2%) with early or late stage pox lesions (Table 5). The overall prevalence of presumptive pox lesion was 1.7% (13/785) for all birds in both tracts. Presumptive pox was higher in native birds (3.4%; 11/324) than in non-native birds (1.2%; 1/148), but this difference was not significant (FET, p = 0.11). For all birds examined (N = 785), prevalence was highest in Hawai‘i ‘amakihi (1%) and lowest in Japanese white-eye (Zosterops japonicus)(0.6%). Of all of the birds in this study that tested positive for malaria (N = 113), six (5%) of them also had pox lesions, which is a higher proportion of birds infected
14
with pox lesions than the overall pox prevalence of 1.7%. There was a significant difference in the probability of malarial infection in birds with pox lesions (Χ2 = 8.36 (df = 1), p < 0.01.
We examined 515 birds for ectoparasites and ectoparasite eggs at Kahuku, and 270 birds at Ka‘u. We found presumptive knemidokoptic mange (Knemidokoptes jamaicensis) present on Hawai‘i ‘amakihi at two sites in Kahuku, Lower Glover (4%; 4/89) and Kipuka Akala (2%; 1/65). Of the four individuals infested at Lower Glover, one had advanced mange and three had early signs of mange, but none of these cases were confirmed by microscopy. The one individual at Kipuka Akala had early signs of mange, which was confirmed by microscopy.
Feather mites were detected on most bird species, with an overall prevalence of 6.7% (53/785) for all birds in both tracts. Analges sp. feather mites were found on the head or body of 3.9% (31/785) of all birds. Proctophyllodes sp. feather mites, which are restricted to the primaries and rectrices, were found on 2.8% (22/785) of all birds, and both species of feather mites were found on 0.4% (3/785) of all birds examined. The site with the highest prevalence of feather ectoparasites in Kahuku was Lower Glover (7.2%; 10/138), and in Ka‘u was Maka‘alia (14.3%; 6/42). Among individual species with more than 20 observations, Japanese white-eye had the highest prevalence of ectoparasites (8.3%; 9/109) when all sites were combined, followed by Hawai‘i ‘amakihi (5.8%; 19/327), and ‘Apapane (3.9%; 8/206). Chewing lice (Phthiraptera: Mallophaga) were only found on the head of one Northern cardinal at Maka‘alia (33%; 1/3).
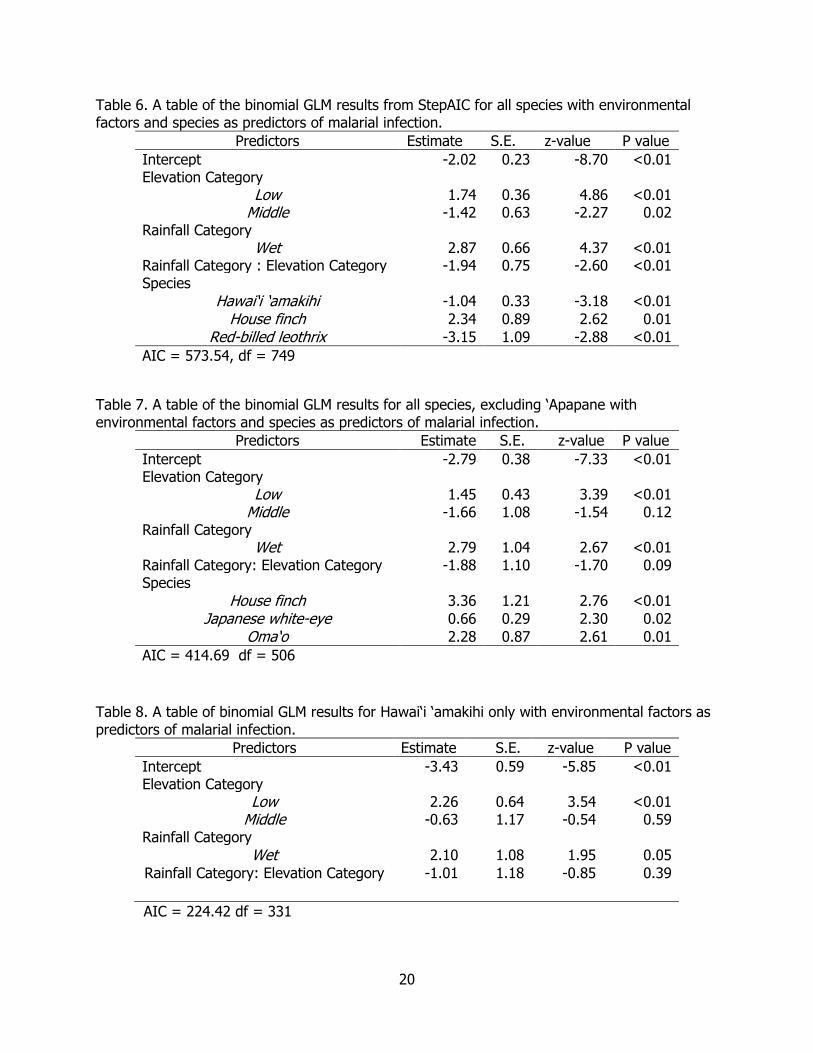
For our binomial generalized linear models, we did not include both site and elevation because sites are nested within elevation categories. The final model, based on stepAIC model selection on all species included: rainfall category, elevation category, the interaction between elevation category and rainfall category, and species as predictor terms of malarial status. ‘Apapane was the reference species, which is also the species with the highest overall prevalence of malaria. The high elevation category was the reference level, which has the lowest prevalence. The mesic or drier rainfall category was the reference level for comparison against the wet rainfall category. Rainfall category, elevation category, the interaction between rainfall category and elevation category, and species (HAAM, HOFI, RBLE) were significant predictors (Table 6).

15
Figure 5. Percent prevalence for each site, with sites grouped by elevation category (Low, Middle, High). Sample sizes are displayed over each bar with positive 95% CIs on each bar.
Since ‘Apapane are known to make large-scale dispersals across altitudinal gradients in response to food resources (Hart et al. 2011), we excluded ‘Apapane from the next model to avoid confounding the environmental predictor of elevation. The final model included: rainfall category, elevation category, the interaction between rainfall category and elevation category, and species (Table 7). Hawai‘i ‘amakihi was the reference species, the high elevation category was the reference for elevation category, and the mesic rainfall category was the reference against the wet rainfall category. The significant predictors were elevation category, rainfall category, and species (HOFI, JAWE, OMAO). Lastly, a model was run using just Hawai‘i ‘amakihi with predictors of elevation category, rainfall category, and the interaction between rainfall category and elevation category (Table 8).
0
10
20
30
40
50
60
Lower Pi`ikea(1178m)
Lower Glover(1201m)
Maka`alia(1340m)
Upper Pi`ikea(1508m)
Kipuka Akala(1534m)
Nene Cabin(1965m)
1926 LavaFlow (2194m)
Pe
rce
nt
Pre
valn
ce (
%)
LOW MIDDLE HIGH
Avian Malaria Prevalence by Site in Kahuku-Ka‘ῡ (all species)
N= 137
N=66
N= 41
N= 84
N= 153
N= 211
N= 58

16
Figure 6. A) Malarial prevalence with positive 95% CIs of Hawai‘i ‘amakihi by elevation category for all sites in the Kahuku-Ka‘u landscape. B) Malarial prevalence with positive 95% CIs in Hawai‘i ‘amakihi by individual site with sample sizes displayed over each bar.
0
5
10
15
20
25
30
35
40
LOW MIDDLE HIGH
Pe
rce
nt
Pre
va
len
ce
(%
)
Avian Malarial Prevalence by Elevation Category for Hawai‘i ‘Amakihi
112
124
96
A.
0
10
20
30
40
50
60
70
80
LowerPi`ikea
(1178m)
LowerGlover
(1201m)
Maka`alia(1340m)
UpperPi`ikea
(1508m)
KipukaAkala
(1534m)
Nene Cabin(1965m)
1926 LavaFlow
(2194m)
Pe
rce
nt
Pre
va
len
ce
(%
)
Avian Malarial Percent Prevalence by Site for Hawai‘i ‘Amakihi
23
8917
48
5983
13
B.
17
Table 3. Avian malarial prevalence by species and site from 2012‒2014 with the number of infected birds over the total tested and the percentage of infected reported.
Kahuku Unit of HAVO Ka‘u Forest Reserve
Lower Glover
Kipuka Akala
Nene Cabin
Total Lower Pi‘ikea
Maka‘alia Upper Pi‘ikea
1926 Flow
Total
‘Apapane 4/8 (50%)
2/65 (3%)
10/107 (9%)
16/180 (9%)
7/10 (70%)
1/4 (25%)
3/5 (60%)
6/44 (14%)
17/63 (27%)
‘Akepa - - - - - - - - -
‘Elepaio - - - - 1/3 (33%)
- 0/6 (0%)
- 1/9 (11%)
Hawai‘i ‘amakihi
21/89 (24%)
1/59 (2%)
3/83 (4%)
25/231 (11%)
11/23 (48%)
3/17 (18%)
5/48 (10%)
0/13 (0%)
19/101 (18%)
Hawai‘i creeper
- - - - - - 0/3 (0%)
- 0/3 (0%)
House finch
- 3/12 (25%)
- 3/12 (25%)
- - - - -
I‘iwi - 0/4 (0%)
- 0/4 (0%)
- 0/4 (0%)
0/1 (0%)
0/1 (0%)
0/6 (0%)
Japanese white-eye
10/36 (28%)
0/10 (0%)
4/19 (21%)
14/65 (22%)
8/19 (42%)
1/7 (14%)
8/16 (50%)
- 17/42 (40%)
Northern cardinal
- 0/2 (0%)
- 0/2 (0%)
- 0/1 (0%)
- - 0/1 (0%)
Nutmeg manikin
1/3 (33%)
- - 1/3 (33%)
- - - - -
Oma‘o - 0/1 (0%)
- 0/1 (0%)
- 1/2 (50%)
3/4 (75%)
- 4/6 (66%)
Red-billed leothrix
- - - - 1/11 (9%)
0/6 (0%)
0/1 (0%)
- 1/18 (6%)
Yellow-fronted canary
0/1 (0%)
- 1/2 (50%)
1/3 (33%)
- - - - -
TOTAL 36/137 (26%)
6/153 (4%)
18/211 (9%)
60/501 (12%)
28/66 (42%)
6/41 (15%)
19/84 (23%)
6/58 (10%)
59/249 (24%)

18
Figure 7. A.) Malarial prevalence with positive 95% CIs of ‘Apapane by elevation category for all sites in the Kahuku-Ka‘u landscape. B.) Malarial prevalence with positive 95% CIs in ‘Apapane by individual site with sample sizes displayed over each bar.
0
10
20
30
40
50
60
70
80
90
LOW MIDDLE HIGH
Pe
rce
nt
Pre
va
len
ce
(%
)
Avian Malarial Prevalence by Elevation Category for ‘Apapane
18
74 151
0
20
40
60
80
100
120
LowerPi`ikea
(1178m)
LowerGlover
(1201m)
Maka`alia(1340m)
UpperPi`ikea
(1508m)
KipukaAkala
(1534m)
NeneCabin
(1965m)
1926 LavaFlow
(2194m)
Pe
rce
nt
Pre
va
lne
ce
(%
)
Avian Malarial Prevalence by Site for ‘Apapane
10
8
65107
4
44
5
B.
A.

19
Table 4. Avian malarial prevalence for ‘Apapane and Hawai‘i ‘amakihi by Age Class and Sex for all sites. Only birds that could be sexed and aged by morphometrics and/or plumage are included here. HY = Hatch-year and > AHY = SY, AHY, and ASY birds.
Table 5. Prevalence of pox lesions among forest birds by site in Kahuku and Ka‘u.
Site Name
Hawai‘i ‘amakihi HAAM
‘Apapane APAP
I‘iwi IIWI
Oma‘o OMAO
‘Elepaio HAEL
‘Akiapoloa‘au
Hawai‘i creeper ‘Akepa OTHER1
House finch HOFI
Japanese white-eye
JAWE
Northern cardinal NOCA
Nutmeg manakin NUMA
Red-billed leothrix RBLE
Yellow-fronted canary YFCA
Total
Lower Glover
3/89 (3.4%)
1/8 (12.5%)
NC NC NC NC NC 0/37 (0%)
NC 0/3 (0%)
NC 0/1 (0%)
4/138 (2.9%)
Kipuka Akala
1/65 (1.5%)
0/71 (0%)
NC 0/1 (0%)
NC NC 0/12 (0%)
0/10 (0%)
0/2 (0%)
NC NC NC 1/161 (0.6%)
Nene Cabin
1/83 (1.2%)
1/108 (0.90%)
NC NC NC NC NC 0/19 (0%)
NC NC NC 0/2 (0%)
2/212 (0.95%)
Lower Pi‘ikea
0/23 (0%)
1/10 (10%)
NC NC 1/3 (33.3%)
NC NC 1/20 (5%)
NC NC 0/11 (0%)
NC 3/67 (4.5%)
Maka‘alia 0/18 (0%)
1/4 (25%)
0/4 (0%)
0/2 (0%)
NC NC NC 0/7 (0%)
0/1 (0%)
NC 0/6 (0%)
NC 1/42 (2.4%)
Upper Pi‘ikea
0/49 (0%)
0/5 (0%)
0/1 (0%)
0/4 (0%)
1/6 (17%)
0/3 (0%)
NC 0/16 (0%)
NC NC 0/1 (0%)
NC 1/85 (1.2%)
1OTHER includes rare endangered honeycreepers and uncommon native species. NC= Not Captured
Species HY >AHY Male Female
‘Apapane 11.9%
(5/42)
14.5%
(27/186)
15.7%
(22/140)
11.3%
(10/88)
Hawai‘i ‘Amakihi 7.9%
(7/88)
14.7%
(34/232)
19.4%
(27/139)
7.1%
(5/70)
20
Table 6. A table of the binomial GLM results from StepAIC for all species with environmental factors and species as predictors of malarial infection.
Predictors Estimate S.E. z-value P value
Intercept -2.02 0.23 -8.70 <0.01 Elevation Category
Low 1.74 0.36 4.86 <0.01 Middle -1.42 0.63 -2.27 0.02
Rainfall Category Wet 2.87 0.66 4.37 <0.01
Rainfall Category : Elevation Category -1.94 0.75 -2.60 <0.01 Species
Hawai‘i ‘amakihi -1.04 0.33 -3.18 <0.01
House finch 2.34 0.89 2.62 0.01
Red-billed leothrix -3.15 1.09 -2.88 <0.01
AIC = 573.54, df = 749
Table 7. A table of the binomial GLM results for all species, excluding ‘Apapane with environmental factors and species as predictors of malarial infection.
Predictors Estimate S.E. z-value P value
Intercept -2.79 0.38 -7.33 <0.01 Elevation Category
Low 1.45 0.43 3.39 <0.01 Middle -1.66 1.08 -1.54 0.12
Rainfall Category Wet 2.79 1.04 2.67 <0.01
Rainfall Category: Elevation Category -1.88 1.10 -1.70 0.09 Species
House finch 3.36 1.21 2.76 <0.01
Japanese white-eye 0.66 0.29 2.30 0.02
Oma‘o 2.28 0.87 2.61 0.01
AIC = 414.69 df = 506
Table 8. A table of binomial GLM results for Hawai‘i ‘amakihi only with environmental factors as predictors of malarial infection.
Predictors Estimate S.E. z-value P value
Intercept -3.43 0.59 -5.85 <0.01 Elevation Category
Low 2.26 0.64 3.54 <0.01 Middle -0.63 1.17 -0.54 0.59
Rainfall Category
Wet 2.10 1.08 1.95 0.05
Rainfall Category: Elevation Category -1.01 1.18 -0.85 0.39
AIC = 224.42 df = 331

21
Adult Mosquito Trapping Between 2012 and 2014, we operated four to six gravid traps and one to six CO2
traps for one to seven nights per sampling session at each site multiple times throughout the year for a total of 440 trap nights over the entire landscape (Tables 9 and 10). In Kahuku, we captured the most adult C. quinquefasciatus mosquitoes (N = 579) at the Kahuku-Lower Glover site (over 12 trap nights (TN); 48.25 mosquitoes/TN) during September 2014, which was a much higher capture rate than the previous year, when we caught six C. quinquefasciatus mosquitoes over 6 trap nights (1 mosquito /TN) in October, 2013. We captured very few C. quinquefasciatus mosquitoes in Ka‘u, with the most adult mosquitoes captured at our lowest elevation site, Lower Pi‘ikea. The capture rate at Lower Pi‘ikea did not vary between years, with five adult C. quinquefasciatus captured during November, 2013 (over 48 trap nights; 0.104 mosquitoes/TN), and nine adult C. quinquefasciatus mosquitoes captured in September, 2014 (over 84 trap nights; 0.107 mosquitoes/TN). We did not catch any A. j. japonicus or C. quinquefasciatus mosquitoes at the Maka‘alia site in Ka‘u, and we only caught one A. j. japonicus at the Nene Cabin site in Kahuku. The overall prevalence of malarial infection of dissected C. quinquefasciatus mosquitoes collected across the entire study area was 24% (40/166), with highest prevalence in C. quinquefasciatus from gravid traps (blood fed) at the Kahuku-Lower Glover site (40/162; 25%). The highest prevalence of malaria in C. quinquefasciatus from CO2 traps (host-seeking) was at Lower Pi‘ikea, (2/6; 33%), but with a very low sample size. Aedes j. japonicus was not common at any of the sites, with no more than four individuals caught at Lower Pi‘ikea.
Feral Pig Activity and Larval Habitat We did not detect any recent pig sign in Kahuku using both belt transect plots and circular plots. Recent pig sign was detected at all sites examined in Ka‘u, with the highest mean percent of recent sign per circular plot at the Upper Pi‘ikea site (10.26%, N = 40 circular plots), followed by Lower Pi‘ikea (6.25%, N = 40 circular plots), and there was minimal recent pig sign at Maka‘alia (1.43%, N = 35 circular plots) (Figure 8).
In general, mosquito larval habitat was more prevalent at lower elevation sites than higher elevation sites within the Kahuku-Ka‘u landscape, and more prevalent in Ka‘u than Kahuku (Figure 9). We observed significantly more available larval mosquito habitat in total belt transect plots in Ka‘u than Kahuku for both hapu‘u cavities (Χ2 = 47.06, df = 1, p < 0.01) and other habitat types combined (i.e., ground pools, rock holes, tree holes) (Χ2 = 104.35, df = 1, p < 0.01). The greatest amount of available larval mosquito habitat was found at the Maka‘alia site, where ground pools, rock pools, or tree holes were found in 75/400 (18.75%) of the transect plots. The most feral pig-created habitat was found at the Lower Pi‘ikea site where 33/400 (8.25%) of plots had hapu‘u cavities. Wallows were rare across the entire study area, and only occurred in Upper Pi‘ikea site at a low frequency (3/400 (0.75%) (Figure 9).
22
Figure 8. Percentage of circular plots with recent (scored “fresh” or “intermediate”) pig sign present by site. Circular plot sample sizes are above each site column and percentages are within each column.
Figure 9. Percentage of plots with available mosquito larval habitat by habitat type (Other Habitat such as rock holes, ground pools, tree holes in black; Hapu‘u Cavities in grey) from belt transect surveys conducted in 2013-2014. Percentages are displayed over the columns. (Ntotal = 400).
1.43%
6.25%
10.26%
0
2
4
6
8
10
12
Maka`alia LowerPi`ikea
UpperPi`ikea
LowerGlover
KipukaAkala
Nene Cabin
Perc
ent
Plo
ts w
ith R
ece
nt
Pig
Sig
n
Mean Percentage of Recent Pig Sign
N= 40
N= 40
N= 40N= 40N= 40
N= 35
18.75%
4.75%
1.5%
4.00%
8.25%
2.50%
0 0.25% 00
5
10
15
20
Maka`alia Lower Pi`ikea Upper Pi`ikea Lower Glover Kipuka Akala Nene Cabin
Pe
rce
nt
Plo
ts w
ith
Lar
val H
abit
at
Available Larval Habitat by Habitat Type and Site
Other Habitat
Hapu`u Cavities
23
Table 9. Summary of adult mosquito trapping effort, captures and malarial prevalence.
Site, Month, and Year of Trapping
# Gravid Traps
# CO2 traps
Maximum number of
Nights
TNs Culex captured
in CO2
trap
Aedes japonicus
captured in CO2 trap
Malarial prevalence in
Culex from CO2
traps (%)
Culex captured in gravid
trap
Aedes japonicus
captured in gravid trap
Malarial prevalence in
Culex from gravid traps
(%)
Lower Pi‘ikea (1178m)
November 2013 4 2 8 48 3 0 0/1 (0%) 2 2 -
September 2014 6 6 7 84 5 0 2/5 (40%) 4 2 0/1 (0%)
Maka‘alia (1340m)
March, 2014 5 4 4 36 0 0 - 0 0 -
June, 2014 6 0 6 36 - - - 0 0 -
Upper Pi‘ikea (1508m)
October, 2014 6 3 7 63 0 0 - 3 0 0/3 (0%)
Lower Glover (1201m)
February, 2013 6 0 2 12 - - - 0 0 -
August, 2013 6 0 2 12 - - - 0 0 -
October, 2013 6 0 1 6 - - - 6 0 1/6 (17%)
September, 2014 6 0 2 12 - - - 579 3 39/156 (25%)
Kipuka Akala (1534m)
February, 2013 6 0 1 6 - - - 0 0 -
March, 2013 6 0 4 24 - - - 0 0 -
September, 2014 6 0 3 16 - - - 3 0 -
Nene Cabin (1965m)
July, 2013 5 0 2 10 - - - 0 0 -
November, 2013 6 0 3 18 - - - 0 0 -
August, 2014 6 6 2 24 0 0 - 0 1 -
October, 2014 5 6 3 33 0 0 - 0 0 -
TOTAL 89 27 57 440 8 0 2/6 (33%) 597 6 40/166 (24%)
TNs = Traps x Nights - Malfunctions

24
Table 10. Summary of mosquito capture rates (number of mosquitoes/ trap nights) by trap type (gravid and CO2), tract and mosquito species.
Trap Type Aedes j. japonicus Culex quinquefasciatus Tract
CO2
0 0.084
Ka‘u
Gravid 0.025
0.057
CO2
0
0 Kahuku
Gravid 0.028
4.055
Available larval mosquito habitats Ka‘u were very limited on belt transects in Kahuku (Table 11). The only mosquito larvae found in Kahuku on belt transects were at the Lower Glover site, where C. quinquefasciatus larvae were found at two locations, a hapu‘u cavity (N = 23 larvae) and a grass-lined ground pool (N = 6 larvae). Although larval mosquito habitats were rare on Kahuku transects, we did encounter and sample habitat off transects. We sampled the rubber-lined reservoirs at Nene Cabin and at the top of the paddocks (Mauka Reservoir R2, see Appendix II) on two occasions but found no larvae. We examined several historic cisterns and water tanks along the main road through the paddocks but these structures were dry, despite recent rainfall. We sampled three ground pools in the Upper Mauka Unit of Kahuku, but they contained no larvae as well. Additional ground pools (N = 4), were sampled in Lower Glover along the overgrown ranch roads and both C. quinquefasciatus (N=48 larvae) and A. j. japonicus larvae (N = 1 larva) were found in these habitats.
Ninety-five percent of available larval mosquito habitat sampled during this study was found on transects in Ka‘u (Table 11). Of the 95 total habitats sampled in Ka‘u, 38 were hapu‘u cavities, 34 were ground pools, 17 were rock holes, two were tree holes, and four were wallows. Of all the larval habitats sampled (on and off transects) in this study, C. quinquefasciatus larvae were only found in hapu‘u cavities (8/45, 18%) in Lower Glover and Lower Pi‘ikea, and in ground pools (5/43, 12%) in the Lower Glover site. Aedes j. japonicus larvae were found in hapu‘u cavities (N = 9) and a tree hole (N = 1) at the Upper Pi‘ikea site (10/26; 38%) and only in hapu‘u cavities at the Lower Pi‘ikea site (5/27; 19%).
Four additional sites were sampled off-transect, in Lower Pi‘ikea, where three hapu‘u cavities were found in the mist-net lanes and one hapu‘u cavity was found on a hunting trail. All three cavities in the mist-net lanes contained both C. quinquefasciatus and A. j. japonicus larvae, in high numbers (71, 136, and 111 C. quinquefasciatus larvae and 18, 618, and 69 A. j. japonicus larvae, respectively). One small hapu‘u cavity on the hunting trail contained both C. quinquefasciatus (N = 1) and A. j. japonicus (N = 2) larvae. Two additional sites were sampled off-transect, in Upper Pi‘ikea where two hapu‘u cavities were found in the mist-net lanes. Both contained A. j. japonicus larvae with a total count of 36 larvae for both cavities.

25
Table 11. Summary of larval mosquito habitat sampled in the Kahuku-Ka‘u belt transect survey during 2013‒2014, with each habitat type and number of sites with Culex and Aedes larvae present.
* HC = Hapu‘u cavity, GP = Ground pool, RH = Rock hole, TH = Tree hole and W = Wallow
Stream Survey Stream habitat was only present at sites in Ka‘u. Sampling effort and the prevalence of mosquito larvae and major predatory taxa are summarized in Table 12. In November 2013, a 1,000-meter reach of the Waloala Stream in the Lower Pi‘ikea site was surveyed starting at 1,223 meters asl. In October 2014, a 1,000-meter reach of the Waikaloa Stream at the Upper Pi‘ikea site was surveyed starting at 1,516 meters asl. The mean number of rock pools per ten-meter section was not significantly different between the two streams (t = 0.15, df = 198, p = 0.88). We found rock holes suitable for larval habitat along the entire 1,000-meter reach for both streams. Culex quinquefasciatus and A. j. japonicus larvae were found in both streams and A. j. japonicus were more commonly found in sample dips (1.2–6.6%). The most dominant predatory taxa included the veliid, Microvelia vagans, which was present in 26.3‒72.4% of the sample dips, followed by odonates, which were present in 3.0–11.5% of the sample dips of both streams along the entire 1,000-meter reach. A number of damselflies and dragonfly larvae were found in rock pools including the endemic Megalagrion calliphya, Megalagrion blackburni, and Anax strenuus.
Site of Transect Survey Number of Larval Habitats Sampled
HC* GP RH TH W Number of Larval Habitat Sites w/ Culex present
Number of Larval Habitat Sites w/ Aedes japonicus present
Lower Pi‘ikea (Ka‘u) 27 13 9 2 1 2 3 (3 HC) 5 (5 HC) Maka‘alia (Ka‘u) 42 6 22 13 0 1 0 0 Upper Pi‘ikea (Ka‘u) 26 19 3 2 1 1 0 10 (9 HC; 1 TH) Lower Glover (Kahuku) 2 1 1 0 0 0 2 (1 HC; 1 GP) 0 Kipuka Akala (Kahuku) 1 0 0 0 1 0 0 0 Nene Cabin (Kahuku) 2 0 1 1 0 0 0 0 Total 100 39 36 18 3 4 5 15

26
Table 12. Summary of stream survey sample dips with the number of dips containing the most prevalent invertebrate species.
Stream Reach (m)
# Rock pools
Total Dips
Mean # Rock pools per 10m
reach
# Dips (%) Aedes
japonicus
# Dips (%) Culex
quinquefasciatus
# Dips (%) Microvelia vagans
#Dips (%) Copepoda
# Dips (%) Odonata1
Waloala Stream
1000 779 981 8.03 12 (1.2 %)
4 (0.4%)
711 (72.4%)
18 (1.8%)
113 (11.5%)
Waikoloa Stream
1000 814 1000 8.14 66 (6.6%)
10 (1.0%)
263 (26.3%)
69 (6.9%)
30 (3.0%)
1 Megalagrion calliphya, Megalagrion blackburni, Anax strenuus

27
DISCUSSION
Disease Prevalence across the Landscape The prevalence and transmission of vector-borne pathogens is determined by the spatial distribution of the primary vector and its host(s), the host’s tolerance status, and the environmental conditions that support their development. Overall malarial prevalence of Kahuku was 12% (60/501) and 24% (59/249) for Ka‘u. During our study, avian malarial prevalence was higher at low-elevation sites across the Kahuku-Ka‘u landscape, with the highest prevalence for all species (28/66; 42%), as well as for resident Hawai‘i ‘amakihi (11/23; 48%), present in low-elevation Ka‘u at the Lower Pi‘ikea site. Similar altitudinal gradients in avian disease prevalence have been documented in the Hawaiian Islands (van Riper III et al. 1986; Atkinson et al. 2005, LaPointe et al. 2012). This altitudinal trend in prevalence is attributed partly to climatic constraints (i.e., ambient temperature, humidity, rainfall) imposed on vector reproduction and survival, and parasite development (LaPointe 2000, Ahumada et al. 2004, LaPointe et al. 2010). In addition to the altitudinal gradient across the Kahuku-Ka‘u landscape, there is a dramatic rainfall gradient that peaks at mid-elevation due to the orographic effects of the Ninole Volcanic Series (Stearns and MacDonald 1946) located just to the south of Maka‘alia. This makes the steep slopes of Ka‘u an area of higher moisture where more larval mosquito habitat is available at temperatures favorable for vector development (Figure 2). The wet and warm environment of Ka‘u, coupled with available larval mosquito habitat, creates favorable conditions for mosquito reproduction and P. relictum development.
Among native birds, malarial prevalence was highest among ‘Apapane and Hawai‘i ‘amakihi. High prevalence of avian malaria in ‘Apapane and Hawai‘i ‘amakihi has been documented throughout the islands (Atkinson et al. 2005, Aruch et al. 2007). Hawaiian honeycreepers are particularly susceptible to avian malaria, with mortality rates as high as 90% in infected I‘iwi (Atkinson et al. 1995). The higher prevalence in ‘Apapane may be explained by their altitudinal flights to lower elevations where disease transmission is greater. Unlike ‘Apapane, Hawai‘i ‘amakihi are sedentary and local residents such that prevalence estimates in Hawai‘i ‘amakihi are more specific to each site. We also examined the effects of age and sex on the probability of malarial infection in both of these species. There was no significant difference in prevalence rates of infection between hatch-year and adult birds for either species, similar to vanRiper et al. (1986). This result was contrary to Atkinson et al. (2005) that found malaria to be more prevalent in older birds, yet, unlike that study, our data collection was conducted year-round, not only during the breeding season. The time that lapsed from hatching to time of capture was longer in duration for hatch-year birds in our study, and during this time, some individuals may have become infected. Similar to Atkinson et al. (2005), we found malarial prevalence to be significantly higher in males than females for Hawai‘i ‘amakihi, but unlike that study, the same trend was not true for ‘Apapane (Table 4). A possible explanation of higher prevalence in male Hawai‘i ‘amakihi is the difference in daily behaviors between the sexes, such that males may be more frequently exposed to vectors or there may be differences in susceptibility between the sexes (Atkinson et al. 2005).
Like malaria, presumptive pox prevalence was highest at the lower elevation sites (Lower Glover and Lower Pi‘ikea). Similar to past studies (vanRiper et al. 1986, Atkinson et al. 2005, LaPointe 2016), pox-like lesions were more common on native birds than non-native birds and more prevalent on birds infected with avian malaria. These concurrent infections may result from simultaneous transmission of the pathogens, differential mortality among pox, malaria, or pox-

28
malaria infected birds, tendency of infections to accumulate over time in older birds, or immunosuppression from pox virus (Atkinson and Samuel 2010, Jarvi et al. 2008, LaPointe et al. 2012).
Mange was present at the two lower elevation sites in Kahuku at a low prevalence (2‒4%), but was not present in Ka‘u. Mange was first documented in Manuka Natural Area Reserve in 2007 at 592 meters just 14 kilometers from our Lower Glover site. These two sites are separated by fragmented forest and a residential area (Hawai‘i Ocean View Estates) where both non-native birds and Hawai‘i ‘amakihi are present. At Keauohana Forest Reserve, incipient mange was as low as 6% (2/36) in 2007‒2008, but increased to 69% (40/58) by 2012‒2014 (Gaudioso et al. 2014). One of the infested Hawai‘i ‘amakihi at Lower Glover had advanced mange lesions which implies a longer time since introduction at that site, as compared to Kipuka Akala. This suggests that mange is incipient at Kahuku and spreading up from the lower elevations. So far, we have only found mange on Hawai‘i ‘amakihi but as the mite, K. jamaicensis, has been reported from 37 species in various families it is possible that its host range in Hawai‘i will broaden over time (Dabert et al. 2013).
Feather mite prevalence was higher at lower elevation sites in both tracts. Japanese white-eye and Hawai‘i ‘amakihi were the species with the highest infestation rates of feather mites at 8.3% and 5.8%, respectively, but these rates are relatively low for these species as compared to other studies (LaPointe 2016, Freed et al. 2008). While we found ectoparasites to be more prevalent at lower elevation sites in our study, this is not the case in Hakalau National Wildlife Refuge, according to LaPointe (2016), where ectoparasite prevalence was higher at middle elevation. Feather mites require a microhabitat to thrive (Proctor 2003) and prevalence rates are likely a reflection of suitable site-specific environmental conditions. Feather mites are not known to damage the host, and correlational evidence suggests they are harmless commensals (Galvan et al. 2012), while chewing lice, in large numbers, are known to cause severe irritation and reduced host survival and reproductive success (Clayton et al. 2009).
In addition to the climatic constraints of vector development, the spatial distribution and movements of the host effect disease prevalence and transmission. Among the native Hawaiian honeycreepers, the ‘Apapane and I‘iwi are known to travel over large distances in response to food resource (nectar) availability (Kuntz 2008, Hart et al. 2011). In general, the prevalence of avian malaria in ‘Apapane was highest at the low-elevation sites for both tracts (50% (4/8) in Kahuku and 70% (7/10) in Ka‘u), but prevalence ranged from 10% (10/107) at Nene Cabin to 60% (3/5) at Upper Pi‘ikea, at higher elevation, with a large disparity in sample size (Figure 7). ‘Apapane undergo large-scale, seasonal altitudinal migrations to follow primarily ‘Ōhi‘a, but also Mamane (Sophora chrysophylla) bloom, and disperse during post-breeding; (Ralph and Fancy 1995, Fancy and Ralph 1997) therefore they have a higher exposure to disease than native, sedentary birds like Hawai‘i ‘amakihi (van Riper et al. 1986). Due to these large altitudinal movements, ‘Apapane are exposed more often to malaria and have been documented to have infection rates as high as 100% at lower elevations (Atkinson et al. 2005). Due to both their high mobility and susceptibility to P. relictum (Yorinks and Atkinson 2000) they serve as a prime reservoir species in the transmission system of Hawaiian forest birds. It is likely, especially in Kahuku, where ‘Apapane are abundant across the entire altitudinal gradient, that they serve as a reservoir species for disease.
We documented the overall prevalence of malaria in Upper Pi‘ikea to be 23% (19/84), with highest prevalence in ‘Apapane (3/5; 60%), followed by Japanese white-eye (8/16; 50%), and

29
prevalence in resident Hawai‘i ‘amakihi was 10% (5/48). A post-hoc test revealed that prevalence in Hawai‘i ‘amakihi at Upper Pi‘ikea was significantly lower than Lower Pi‘ikea (X2 = 10.41, df = 1, p < 0.01), where prevalence in Hawai‘i ‘amakihi was 48% (11/23). We removed ‘Apapane from all statistical comparisons of overall prevalence rates of all species due to the confounding effect of their large-scale movements. An additional post-hoc test revealed overall prevalence at Upper Pi‘ikea was significantly lower than at Lower Pi‘ikea (X2 = 4.07, df = 1, p = 0.04), but was not significantly different at the high elevation 1926 Lava Flow site (FET, p = 0.12) for all species, or when Hawai‘i ‘amakihi (0%; 0/13) (FET, p = 0.57) was tested alone. Prevalence at the middle elevation, Upper Pi‘ikea site is more similar to high elevation prevalence than low elevation prevalence in this region. The Upper Pi‘ikea site falls within a region of the Kahuku-Ka‘u landscape that is of particular interest due to an unexpected abundance of vulnerable and endangered native passerines below 1,500 meter asl in the Northeastern section of Ka‘u (Scott et al. 1986, Gorresen et al. 2007). Based on our results, this distributional anomaly may exist due to the relative scarcity of available larval habitat, low vector abundance and, subsequently, a lower than expected incidence of malarial infection. Alternatively or concurrently, compensatory demography (Woodworth et al. 2005, Shankar 2000) may explain the distributional anomaly in Northeastern Ka‘u. The presence of exceptional habitat and subsequently high productivity among rarer species may compensate for disease-related mortality. Although based solely on subjective observation, we found a relatively intact, high-stature native forest at Upper Pi‘ikea where abundant food resources and decreased threat of nest predation might improve annual recruitment.
Other recent distributional anomalies of honeycreepers have been attributed to evolved tolerance. Both field and experimental evidence exists for evolved tolerance in lowland (<300 m asl) Hawai‘i ‘amakihi populations in the Puna District (Atkinson et al. 2013, Woodworth et al. 2005). However, such tolerance is variable between individual populations and highly dependent on the intensity of selective pressures resulting from factors of disease transmission (mosquito abundance; environmental factors), inherent threats to native birds (habitat fragmentation, predation), and genetic diversity of the population (Foster et al. 2007). Tolerant populations have evolved in areas where malaria is endemic and abundant, and year-round populations of mosquitoes ensure intense transmission (Woodworth et al. 2005). Tolerant populations are also characterized by exceptionally high prevalence (Woodworth et al. 2005). Since we did not find exceptionally high prevalence in any species or year-round mosquito populations, our results do not suggest that evolved tolerance is occurring in either Kahuku or Ka‘u.
Mosquito Abundance, Climate, Land Use and the Availability of Larval Mosquito Habitat across the Landscape Climatic factors, land use, habitat type, and fragmentation play important roles in the availability of larval mosquito habitat and, ultimately, mosquito abundance. Culex quinquefasciatus is widely considered a peridomestic species using a wide range of anthropogenic and natural larval habitats (Laird 1988, Bentley and Day 1989). During this study C. quinquefasciatus and A. j. japonicus larvae were found in feral pig-created tree fern cavities, human-created road ruts and naturally occurring ground and stream pools. As might be expected, the type and abundance of larval mosquito habitat varied across the study landscape. The adjacent study tracts are representative of two extremes in forested land use in Hawai‘i, the intact very wet and mesic forests of Ka‘u and the cattle grazed and fragmented, seasonal mesic forests of Kahuku.

30
Cattle ranching at Kahuku began in the late 1860’s and ended in 2003 when the land was purchased by the NPS, making it one of the oldest continuously operated ranches in Hawai‘i (Avery 2009). The Ka‘u Forest Reserve has remained an isolated, protected watershed with restricted public access since 1903 (State of Hawai‘i 2012). The watershed of upland Ka‘u has provided water for agricultural and residential use in the drier lands of the towns of Pahala and Na‘alehu for decades. Since previous studies have demonstrated a significant association between agriculture, ranching infrastructure, habitat fragmentation and mosquito presence (Reiter and LaPointe 2007, 2009, Mendenhall et al. 2013), we expected to find larval mosquito habitat and mosquito abundance higher in Kahuku than Ka‘u. Instead we found significantly more available larval mosquito habitat along the forested Ka‘u transects and paradoxically, a greater capture rate (53x) of adult C. quinquefasciatus in the Kahuku paddocks study site. Our transect surveys, however, were intended to estimate larval mosquito habitat in natural areas and did not include our supplemental surveys of ranch infrastructure. Earlier research at ‘Ainahou Ranch in HAVO showed that C. quinquefasciatus larvae were dependent on habitat associated with derelict ranch infrastructure (Reiter and LaPointe 2009), however, no mosquito larvae were found during examination of old cisterns and reservoirs at Kahuku. Although we did not find larvae associated with water catchment infrastructure, we did find that the deeply rutted tracks of abandoned ranch roads could become significant aquatic habitat for mosquitoes. Compacted soils and a shallow lava substrate prevent rainwater from percolating rapidly and the thatch from kikuyu grass makes a nutritive base for the freshwater protozoa and bacteria consumed by mosquito larvae (Laird 1988). While these flooded road ruts might be more ephemeral during periods of normal summer precipitation, unseasonably heavy rainfall from tropical storms and/or El Niño events could extend habitat persistence through the development time of the larvae.
Vector populations are regulated by variations in temperature and rainfall as well as availability of suitable larval habitat (LaPointe 2000, Ahumada et al. 2004). Culex populations typically peak in late summer and early fall in Hawai‘i (vanRiper et al. 1986, LaPointe 2000, Ahumada et al. 2004). We captured mosquitoes in high numbers at lower elevation Kahuku, during the month of September, an early fall month. We also trapped for mosquitoes in later summer-early fall in Ka‘u, but did not capture mosquitoes to the same magnitude as in Kahuku. Population modeling predicts that mosquitoes at lower elevations can develop under a broader range of rainfall parameters than middle and high elevation populations on Mauna Loa, Hawai‘i (Ahumada et al. 2004). Under typical climate conditions, there is a large difference in rainfall between the two tracts. The leeward-facing Kahuku sites receives a mean of 1,800 mm of rain annually, as compared to a mean of 2,350 mm of rain annually in Ka‘u. The large numbers of mosquitoes present in Kahuku in September 2014 may be explained best by the heavy rains that occurred in August 2014 (NOAA, http://w2.weather.gov/climate/local_data.php?wfo=hnl) and the grassy puddles along abandoned ranch roads. Populations can become exceptionally large when heavy rains flood habitat and optimal temperatures for larval development occur in tandem.
While mosquito abundance was much higher in Kahuku, malarial prevalence was still higher in Ka‘u. It’s likely that wetter and warmer conditions and relative abundance of larval mosquito habitat present in Ka‘u produces mosquitoes round allowing for seasonal, if not endemic, transmission. Furthermore, the extremely steep year topography, agricultural land use, and streams corridors found just below the Lower Pi‘ikea site could promote the dispersal of mosquitoes to the upland areas during times of seasonal wind regimes. In some montane areas on Hawai‘i Island, mosquitoes may occur seasonally from movements due to certain wind regimes such as weak trade winds or Kona storm events (Scott et al. 1986, Juvik and Juvik
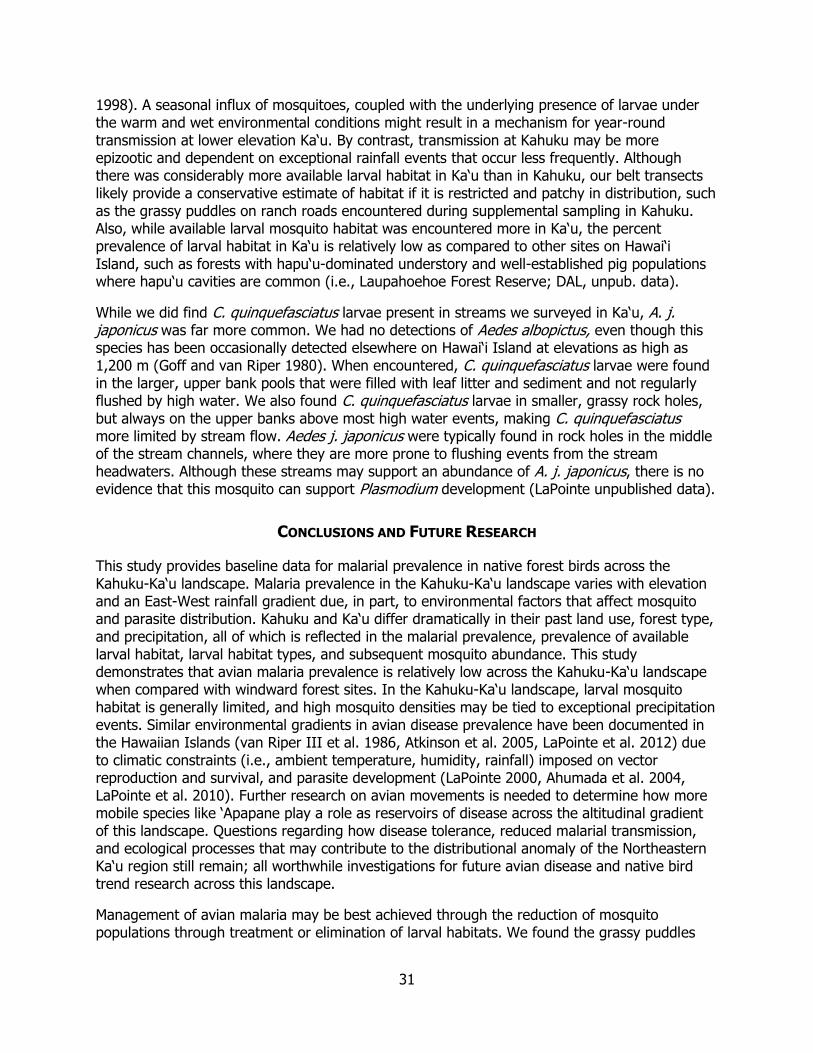
31
1998). A seasonal influx of mosquitoes, coupled with the underlying presence of larvae under the warm and wet environmental conditions might result in a mechanism for year-round transmission at lower elevation Ka‘u. By contrast, transmission at Kahuku may be more epizootic and dependent on exceptional rainfall events that occur less frequently. Although there was considerably more available larval habitat in Ka‘u than in Kahuku, our belt transects likely provide a conservative estimate of habitat if it is restricted and patchy in distribution, such as the grassy puddles on ranch roads encountered during supplemental sampling in Kahuku. Also, while available larval mosquito habitat was encountered more in Ka‘u, the percent prevalence of larval habitat in Ka‘u is relatively low as compared to other sites on Hawai‘i Island, such as forests with hapu‘u-dominated understory and well-established pig populations where hapu‘u cavities are common (i.e., Laupahoehoe Forest Reserve; DAL, unpub. data).
While we did find C. quinquefasciatus larvae present in streams we surveyed in Ka‘u, A. j. japonicus was far more common. We had no detections of Aedes albopictus, even though this species has been occasionally detected elsewhere on Hawai‘i Island at elevations as high as 1,200 m (Goff and van Riper 1980). When encountered, C. quinquefasciatus larvae were found in the larger, upper bank pools that were filled with leaf litter and sediment and not regularly flushed by high water. We also found C. quinquefasciatus larvae in smaller, grassy rock holes, but always on the upper banks above most high water events, making C. quinquefasciatus more limited by stream flow. Aedes j. japonicus were typically found in rock holes in the middle of the stream channels, where they are more prone to flushing events from the stream headwaters. Although these streams may support an abundance of A. j. japonicus, there is no evidence that this mosquito can support Plasmodium development (LaPointe unpublished data).
CONCLUSIONS AND FUTURE RESEARCH
This study provides baseline data for malarial prevalence in native forest birds across the Kahuku-Ka‘u landscape. Malaria prevalence in the Kahuku-Ka‘u landscape varies with elevation and an East-West rainfall gradient due, in part, to environmental factors that affect mosquito and parasite distribution. Kahuku and Ka‘u differ dramatically in their past land use, forest type, and precipitation, all of which is reflected in the malarial prevalence, prevalence of available larval habitat, larval habitat types, and subsequent mosquito abundance. This study demonstrates that avian malaria prevalence is relatively low across the Kahuku-Ka‘u landscape when compared with windward forest sites. In the Kahuku-Ka‘u landscape, larval mosquito habitat is generally limited, and high mosquito densities may be tied to exceptional precipitation events. Similar environmental gradients in avian disease prevalence have been documented in the Hawaiian Islands (van Riper III et al. 1986, Atkinson et al. 2005, LaPointe et al. 2012) due to climatic constraints (i.e., ambient temperature, humidity, rainfall) imposed on vector reproduction and survival, and parasite development (LaPointe 2000, Ahumada et al. 2004, LaPointe et al. 2010). Further research on avian movements is needed to determine how more mobile species like ‘Apapane play a role as reservoirs of disease across the altitudinal gradient of this landscape. Questions regarding how disease tolerance, reduced malarial transmission, and ecological processes that may contribute to the distributional anomaly of the Northeastern Ka‘u region still remain; all worthwhile investigations for future avian disease and native bird trend research across this landscape.
Management of avian malaria may be best achieved through the reduction of mosquito populations through treatment or elimination of larval habitats. We found the grassy puddles

32
along infrequently used ranch roads to be the main source of larval habitat in Kahuku. Larval habitat along roads could be simply eliminated by grading abandoned roads to prevent standing water. In Ka‘u, the high prevalence of natural ground and rock pools, as well as, feral pig created hapu‘u cavities makes reduction of larval habitat more difficult, but public hunting and ungulate fencing efforts in Ka‘u Forest Reserve and the TNC Preserves may help to diminish available larval habitat.
ACKNOWLEDGEMENTS
We would like to thank the following agencies for funding this project: U.S. Geological Survey, National Park Service NRPP program, and the U.S Fish and Wildlife Service SSP program. We acknowledge our collaboration with The Nature Conservancy through access and field site infrastructure, especially John Replogle and Shalan Crysdale. We thank the following field help: Nolan Lancaster, Sonia Levitt, Keith Burnett, Eamon Harrity, Ariel Perraglio, Adam Carrick, Logan Derderian, Elyse Clifford, Cari Lynn Squibb, Joey Leibrecht, Maia Lipschutz, Ariel Gaffney, Andrew Wiegardt, Callie Gesmundo, and Katie Keck. We thank Nick Shema and David Okita for providing helicopter operations. We thank William Watcher-Weatherwax and Chloe Apelgren for their work on laboratory diagnostics. We thank Kevin Brinck and Paul Banko for their peer review of this report. We thank Eben Paxton for contributing blood samples from his sites in Kahuku-HAVO. We acknowledge the Division of Forestry and Wildlife and Department of Land and Natural Resources staff for providing access and permitting in their managed lands, as well as the National Park Service staff for access and research permitting to Kahuku-HAVO. We also thank the Ed Olson Trust for access to their land in Ka‘u for staging of helicopter operations.
LITERATURE CITED
Ahumada, J. A., D. A. LaPointe, and M. D. Samuel. 2004. Modeling the population dynamics of Culex quinquefasciatus (Diptera: Culicidae), along an elevational gradient in Hawai‘i. Journal of Medical Entomology 41:1157‒1170.
Anderson, S. J. and C. P. Stone. 1994. Indexing sizes of feral pig populations in a variety of Hawaiian natural areas. Transactions of the Western Section of the Wildlife Society 30:26‒39.
Aruch, S., C. T. Atkinson, A. F. Savage, and D. A. LaPointe. 2007. Prevalence and distribution of pox-like lesions, avian malaria, and mosquito vectors in Kipahulu Valley, Haleakala National Park, Hawai‘i. Journal of Wildlife Diseases 43:567‒575.
Atkinson, C. T., K. L. Woods, R. J. Dusek, L. S. Sileo, and W. M. Iko. 1995. Wildlife disease and conservation in Hawai‘i: Pathogencity of avian malaria (Plasmodium relictum) in experimentally infected Iiwi (Vestiaria coccinea). Parasitology 111:S59‒S69.
Atkinson, C. T., J. K. Lease, R. J. Dusek, and M. D. Samuel. 2005. Prevalence of pox-like lesions and malaria in forest bird communities on leeward Mauna Loa Volcano, Hawai‘i. Condor 107:537‒546.
Atkinson, C. T. and D. A. LaPointe. 2009. Ecology and pathogencity of avian malaria and pox. Chapter 9, pp. 234‒252 in T.K. Pratt, C.T. Atkinson, P.C. Banko, J. Jacobi, and B.L.

33
Woodworth, Eds. Conservation Biology of Hawaiian Forest Birds. T:234‒252. Yale University Press. New Haven, CT.
Atkinson, C. T. and M. D. Samuel. 2010. Avian Malaria (Plasmodium relictum) in Native Hawaiian Forest Birds: Epizootiology and Demographic Impacts on ‘Apapane (Himatione sanguinea). Journal of Avian Biology 41:357‒366
Atkinson, C. T., K. S. Saili, R. B. Utzurrum, and S. I. Jarvi. 2013. Experimental Evidence for Evolved Tolerance to Avian Malaria in a Wild Population of Low Elevation Hawai‘i ‘amakihi (Hemignathus virens). Ecohealth 10:366‒375.
Avery, C. 2009. Volcano Ranch: An Environmental History of Kahuku Ranch. National Park Service, Pacific West Regional Office, Seattle, WA.
Banko, W. E. and P. C. Banko. 2009. Historic decline and extinction. Chapter 2, pp. 25-58 in T. K. Pratt, C. T. Atkinson, P. C. Banko, J. Jacobi, and B. L. Woodworth, Eds. Conservation Biology of Hawaiian Forest Birds. T: 234‒252. Yale University Press. New Haven, CT.
Benning, T. L., D. A. LaPointe, C. T. Atkinson, and P. M. Vitousek. 2002. Interactions of climate change with biological invasions and land use in the Hawaiian Islands: Modeling the fate of endemic birds using a geographical information system. Proceedings of the National Academy of Sciences (USA) 99:14246‒14249.
Bentley, M. D. and J. F. Day. 1989. Chemical Ecology and Behavioral Aspects of Mosquito Oviposition. Annual Review of Entomology 34:401‒421.
Clayton, D. H., R. J. Adams, and S. E. Bush. 2009. Phthiraptera, the Chewing Lice, Chapter 29, pp. 515‒524. In C.T. Atkinson, N. J. Thomas, and T. D. Bruce, Eds. Parasitic Diseases of Wild Birds. John Wiley and Sons, Hoboken, NJ.
Dabert, J., M. Dabert, A. F. Gal, V. Miclăuş, A. D. Mihalca and A. D. Sándor. 2013. Multidisciplinary analysis of Knemidocoptes jamaicensis parasitising the Common Chaffinch, Fringilla coelebs: proofs for a multispecies complex? Parasitological Research. 112:2373–2380. DOI 10.1007/s00436-013-3402-7
Fallon, S. M., E. Bermingham, and R. E. Ricklefs. 2003. Island and taxon effects in parasitism revisited: avian malaria in the Lesser Antilles. Evolution. 57:606‒615.
Fancy, S. G., and C. J. Ralph. 1997. 'Apapane (Himatione sanguinea). In The Birds of North America, No. 296 (A. Poole and F. Gill, eds.). The Academy of Natural Sciences, Philadelphia, PA, and The American Ornithologists' Union, Washington, D.C.
Foster, J. T., B. L. Woodworth, L. E. Eggert, P. J. Hart, D. Palmer, D. C. Duffy, and R. C.
Fleischer. 2007. Genetic structure and evolved malaria resistance in Hawaiian honeycreepers. Molecular Ecology 16:4738‒4746.
Freed, L. A., M. C. Medeiros, and G. R. Bodner. 2008. Explosive Increase in Ectoparasites in Hawaiian Forest Birds. Journal of Parasitology 94: 1009‒1021.
34
Galvan, I., E. Augilera, F. Atienzar, E. Barba, G. Blanco, J. L. Canto, V. Cortes, O. Frias, I Kovacs, I. Melendex, and A. P. Moller. 2012. Feather mites (Acari: Astigmata) and body condition of their avian hosts: A large correlative study. Journal of Avian Biology. 43:1‒7.
Gaudioso, J. M., D. A. LaPointe, and P. J. Hart. 2009. Knemidokoptic mange in Hawai‘i ‘amakihi (Hemignathus virens) on the Island of Hawai‘i. Journal of Wildlife Diseases. 45(2):497‒501.
Gaudioso, J. M. D. A. LaPointe, C. T. Atkinson, and C. Apelgren. 2014. Distribution and prevalence of knemidokoptic mange in Hawai‘i `amakihi on the island of Hawai‘i. Hawai‘i Cooperative Studies Unit Technical Report HCSU-055. University of Hawai‘i at Hilo. pp.25
Giambelluca, T. W., X. Shuai, M. L. Barnes, R. J. Alliss, R. J. Longman, T. Miura, Q. Chen, A. G. Frazier, R. G. Mudd, L. Cuo, and A. D. Businger. 2014. Evapotranspiration of Hawai‘i. Final report submitted to the U.S. Army Corps of Engineers – Honolulu District, and the Commission on Water Resource Management, State of Hawai‘i.
Goff, M. L. and C. avn Riper III. 1980. Distribution of mosquitoes (Diptera: Culicidae) on the east flank of Mauna Loa Volcano, Hawai‘i. Pacific Insects. 22(1-2):178‒188
Gorresen, P. M., Camp, R. J., and Pratt, T. K. 2007. Forest bird distribution, density and trends in the Ka‘ū region of Hawai‘i Island. U.S. Geological Survey, Biological Resources Discipline, Open-File report 2007-1076, 110 p.
Hart, P. J., B. L. Woodworth, R. Camp, K. Turner, K. McClure, K. Goodall, Henneman, C. Spiegel, J. LeBrun, E. Tweed, and M. Samuel. 2011. Bird and resource variability across an elevational gradient in Hawai‘i. The Auk 128:113‒126.
Hobbelen, P. H. F., M. D. Samuel, D. Foote, L. Tango, and D. A. LaPointe. 2012. Modeling the impacts of global warming on predation and biotic resistance: mosquitoes, damselflies, and avian malaria in Hawai‘i. Theoretical Ecology.
Juvik, S. P. and J. O. Juvik. 1998. Atlas of Hawai‘i. Department of Geography, University of Hawai‘i at Hilo, University of Hawai‘i Press, Honolulu, HI.
Jacobi, J. D. 1989. Vegetation maps of the upland plant communities on the islands of Hawai‘i, Maui, Molokai , and Lanai. Cooperative National Park Resources Studies Unit Technical Report 68. University of Hawai‘i at Manoa, Department of Botany, Honolulu, Hawai‘i.
Jarvi, S. I. D. Triglia, A. Giannoulis, M. Farias, K. Bianchi, and C. T. Atkinson. 2008. Diversity, origins, and virulence of avipoxvirues in Hawaiian Forest Birds. Conservation Genetics 9: 339‒348.
Kuntz, W. A. 2008. The importance of individual behavior to life history and conservation: breeding and movement biology in the I‘iwi (Vestiaria coccinea). Ph.D. Dissertation. University of Hawai‘i at Manoa, Department of Zoology (Ecology, Evolution, and Conservation). Pp. 227
35
Laird, M. 1988. The Natural History of Larval Mosquito Habitats. Academic Press, Harcourt Brace Jovanovich. London.
LaPointe, D. A., J. M. Gaudioso-Levita, C. T. Atkinson, A. Egan, and K. C. Hayes. 2016. Changes in the prevalence of avian disease and mosquito vectors at Hakalau Forest National Wildlife Refuge: a 14-year perspective and assessment of future risk. Hawai‘i Cooperative Studies Unit Technical Report HCSU-073. University of Hawai‘i at Hilo. pp. 60
LaPointe, D. A. 2000. Avian malaria in Hawaii: The distribution, ecology, and vector potential of forest-dwelling mosquitoes. Doctoral Dissertation. University of Hawaii at Manoa. pp. 156.
LaPointe, D. A., M. L. Goff, and C. T. Atkinson. 2010. Thermal constraints to the sporogonic development and altitudinal distribution of avian malaria Plasmodium relicutm in Hawai‘i. Journal of Parasitology. 96:318‒324.
LaPointe, D. A., C. T. Atkinson, M. D. Samuel. 2012. Ecology and conservation biology of avian malaria. Annals of the New York Academy of Sciences 1249:211‒226.
Mendenhall, E. M., K. E. Williamson, D. Reyon, J. Y. Zou, O. Ram, J. K. Joung, and B. E. Bernstein. 2013. Locus-specific editing of histone modifications at endogenous enhancers. Nature Biotechnology 31:1133‒1136.
Nogueira, S. S., S. L. Nogueira-Filho, M. Bassford, K. Silvius, and J. M. V. Fragoso. 2007. Feral pigs in Hawai‘i: Using behavior and ecology to refine control techniques. Applied Animal Behaviour Science 108:1‒11.
Pratt, L. W. and J. D. Jacobi. 2009. Loss, degradation, and persistence of habitats. Chapter 6, pp. 137‒158 in T. K. Pratt, C. T. Atkinson, P. C. Banko, J. Jacobi, and B. L. Woodworth, Eds. Conservation Biology of Hawaiian Forest Birds. T: 234‒252. Yale University Press. New Haven, CT.
Price, J., S. M. Gon III, J. D. Jacobi, and D. Matsuwaki. 2007. Mapping Plant Species Ranges in the Hawaiian Islands: Developing Methodology and Associated GIS layers. Hawai‘i Cooperative Studies Unit Technical Report HCSU-008. University of Hawai‘i at Hilo. 58 pp.
Proctor, H. C. 2003. Feather mites (Acari: Astigmata): Ecology, Behavior, and Evolution. Annual Review of Entomology. 48: 185‒209.
Ralph, C. J. and S. G. Fancy. 1995. Demography and movements of ‘Apapane and I‘iwi in
Hawai‘i. The Condor. 97:729‒742.
Reiter, M. E. and D. A. LaPointe. 2007. Landscape factors influencing the spatial distribution and abundance of mosquito vector Culex quinquefasciatus (Diptera: Culicidae) in a mixed residential—agricultural community in Hawai‘i. Journal of Medical Entomology. 44(5):861‒868.

36
Reiter, M. E. and D. A. LaPointe. 2009. Larval habitat for the avian malaria vector, Culex quinquefasciatus (Diptera: Culicidae), in altered mid-elevation mesic-dry forests in Hawai‘i. Journal of Vector Ecology. Journal of Vector Ecology. 34(2):208‒216.
Scott, J. M., S. Mountainspring, F. L. Ramsey, and C. B. Kepler. 1986. Forest bird communities of the Hawaiian Islands: their dynamics, ecology and conservation in Studies in Avian Biology No. 9, R. J. Raitt (ed.). Cooper Ornithological Society, Lawrence, Kansas. 431 pp.
Shankar, A. H. 2000. Nutritional modulation of malaria morbidity and mortality. Journal of Infectious Diseases. 182:S37–S53.
State of Hawai`i. 2012. Division of Forestry and Wildlife and Department of Land and Natural Resources. Ka‘u Forest Reserve Management Plan. Accessed at: http://dlnr.hawaii.gov/forestry/files/2013/02/Kau_FR_Mgnt_Plan_2012.pdf
Stearns, H. T., and Macdonald, G. A. 1946. Geology and ground-water resources of the island of Hawaii: Hawaii (Terr.) Division of Hydrography Bulletin 9, 363 p.; 2 folded maps in pocket (scale 1:125,000) [includes plates].
Warner, R. E. 1968. The role of introduced diseases in the extinction of the endemic Hawaiian avifauna. The Condor. 70:101‒120.
van Riper III, C., S. G. van Riper, M. L. Goff and M. Laird. 1986. The epizootiology and ecological significance of malaria in Hawaiian land birds. Ecological Monographs. 56:327‒344.
Woodworth, B. L., C. T. Atkinson, D. A. LaPointe, P. J. Hart, C. S. Spiegel, E. J. Tweed, C. Henneman, J. J. LeBrun, T. Denette, R. DeMots, K. L. Kozar, D. Triglia, D. Lease, A. Gregor, T. Smith, and D. C. Duffy. 2005. Host population persistence in the face of introduced vector-borne diseases: Hawai‘i ‘amakihi and avian malaria. Proceedings of the National Academy of Sciences 102:1531‒1536.
Yorinks, N. and C. T. Atkinson. 2000. Effects of malaria (Plasmodium relictum) on activity budgets of experimentally infected juvenile ‘Apapane (Himatione sanguinea) Auk 117:731‒738.

37
APPENDIX I

38

39

40
APPENDIX II
Water systems map of Kahuku Unit of HAVO (The Damon Estate, courtesy of HAVO Cultural Resources).

41
A map of the naturally occurring water resources in the Ka‘ū. Source: State of Hawai‘i Department of Land and Natural Resources, 2011.