immigration, farm workers, & the food system/media/files/activity files... · immigration, farm...
TRANSCRIPT

Philip Martin: [email protected]
http://migration.ucdavis.edu December 16, 2013
Immigration, Farm Workers, & the Food System

Highlights • Where are we? Hired workers do most US
farm work, most hired FWs = unauthorized. Fewer new entrants + more enforcement, = uncertainty for ERs, FWs, & comms!
• How did we get here? Enough FWs except 1965-80, & UFW & mechaniza. IRCA & SAWs = more unauth & spread thru-out US!
• Farm workers & the food system. Farmers receive 30% of ave retail prices of F&V, and farm labor costs are <30% of farm revenue, so farm labor = <10% of retail F&V prices!

US Hired Farm Workers • Hired workers do 60% of US farm work!
– Average 1.3 million W&S workers on US farms!– Average 850,000 farm operators and family!
• 2 hired workers for each FTE farm job, so 2.5 million unique farm workers. Most FWs = Mexican-born men: 70% born in Mexico, 80% men, >50% unauthorized!
• 1980s: from Mexican-born farm workers in California & southwest & in crops TO Mex-born FWs dispersed throughout US in 1990s. Today: all states and all commodities!

3 C’s of Farm Labor • Concentration: Farmers are almost 10% of US
employers; hired FWs are less than 2% of US workers. The 25,000 US farmers who hire >10 workers employ 85% of FWs (UI data)!
• Contractors: bilingual intermediaries who bring crews of workers to farms. Win-win specialization in labor matching OR risk-absorbers in labor market rife with violations?!
• Conflict: Exit versus voice: easier to exit bad job (ag & fast food) than to organize to change wages and conditions (skilled workers); hard to sustain unions in exit labor markets like ag!

US: 2.2 million farms, 500,000 farms hire labor; COA: 40,000 farms hire 10 or more workers (UI = 25,000)
farms )

Fresh Fruits & Vegetables: 2010!• 1.4 million acres produced fresh fruit worth $10
billion; per capita consumption = 130 pounds!• 1.6 million acres produced fresh vegetables
(excluding potatoes) worth $11 billion; per capita consumption = 150 pounds!
• Imports of fresh F&V = $12 billion; exports = $6 billion (1/3 of fresh fruit & ¼ of fresh vegs = imported)!
• Farm + import value of $33 billion = $100 billion at retail level; at least 10% losses from farm to retail, and more losses after purchase!

California: from hiring workers directly to hiring via FLCs

3,000 US FLCs; 1,200 in CA
FLCs: specialists in job matching or risk absorbers in a labor market rife with immigration,
labor, and tax violations?

UFW success after 1962 • Bracero program ended in 1964; fewer
workers to add to labor supply and break strikes
• Chavez was ex-farm worker; charismatic leader of La Causa (Hispanic empowerment)
• Chavez favored boycotts, economically best strategy to pressure growers (reduce demand, lower grower prices, but most workers work)
• Students, clergy etc attracted to La Causa during Civil Rights era concern for people left behind
• Growers did not effectively oppose boycott;

Chavez: Time 1969; few contracts, 1973

UFW: 3,300 active members; perhaps 25 contracts

Unions outside California • Hawaii: Longshore march inland • Ohio and NC Farm Labor Organizing Committee:
– Boycott buyers of farm commodities and negotiate contracts with processors for wages and benefits for farm workers (Campbells Vlasic; Heinz, Mt Olive)
– Processors raise prices paid to farmers, who pay negotiated wages (cukes, tomatoes, now tobacco)
• Coalition of Immokalee Workers: Florida – same boycott-the-buyer strategy. – Taco Bell, McDonald’s, Burger King etc to pay $0.01
per pound more for Florida tomatoes – Audit employers to protect worker wages & benefits

FLOC: Ohio & NC: ignore growers & deal with buyers; No elections to determine if workers want union rep

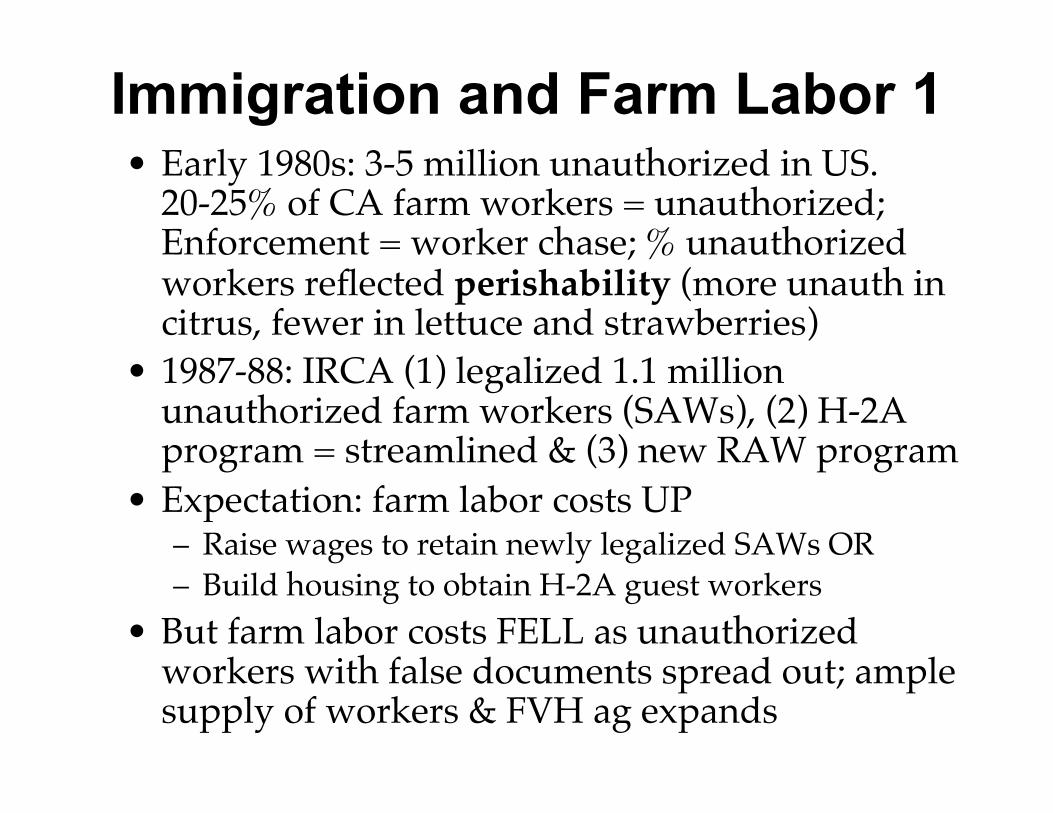
Immigration and Farm Labor 1 • Early 1980s: 3-5 million unauthorized in US.
20-25% of CA farm workers = unauthorized; Enforcement = worker chase; % unauthorized workers reflected perishability (more unauth in citrus, fewer in lettuce and strawberries)!
• 1987-88: IRCA (1) legalized 1.1 million unauthorized farm workers (SAWs), (2) H-2A program = streamlined & (3) new RAW program!
• Expectation: farm labor costs UP!– Raise wages to retain newly legalized SAWs OR!– Build housing to obtain H-2A guest workers!
• But farm labor costs FELL as unauthorized workers with false documents spread out; ample supply of workers & FVH ag expands!

Migrants' False Claims: Fraud on a Huge Scale By ROBERTO SURO, Special to The New York Times November 12, 1989
''One certain product'' of the agricultural amnesty program, Representative Schumer (D-NY) said, ''is that in developing immigration policies in the future, Congress will be much more wary of the potential for fraud and will do more to stop it.''
Ag: 2% of US workers, but 40% of those legalized under IRCA

1.1 million newly legalized SAWs. SAW share of crop workforce fell from 35% in 1989 to 10-15% within 3 years. Legalization speeds exits to nonfarm jobs.

Immigration and Farm Labor 2 • Since 1995: over 50% of hired workers on crop farms
have been unauthorized!• Farm employers: we need a free-agent program that
does NOT require farm employers to:!– try to recruit US workers under DOL supervision!– provide free and approved housing to guest workers!
• December 2000: AgJOBS negotiated between worker advocates and farm employers in anticipation that Presidents Bush and Fox will embrace a new Mexico-US guest worker program!
• AgJOBS = Try IRCA again:!– Legalization for workers (this time earned legalization,
farm workers must continue to do farm work for 3-5 years)!– E-Z guest workers for employers (no recruit, housing
allowance rather than provide housing, lower AEWR)!

Immigration 3: AgJOBS • Legalization: unauthorized farm workers become
probationary immigrants immediately & earn regular immigrant status with:!– >150 days of farm work a year for 3 years or !– >100 days a year for 5 years!– New mechanisms to credit workers for farm work not
done due to natural disaster, strikes, pregnancy etc!• Guest worker changes:!
– Attestation replaces certification; end of DOL-supervised recruitment of US workers!
– Housing allowance instead of free housing; workers find own housing (adds $1 to $2 an hour to labor costs)!
– AEWR of about $10 an hour rolled back by $1 to $2 an hour and studied (offsets housing costs)!

F & V Supply-chain!• Increased concentration in retailing = increased
concentration in production!– 40 retail chains each with >100 stores sell most US fresh
fruits and vegetables!– 3,200 US grower-shippers: 40% in CA, 15% in FL!
• Fresh fruit = biggest demand for seasonal FWs:!– Per capita consump up; big 4 = apples, grapes, berries, &
citrus; growers get 30% of retail price; Big 6 states = 90% of fresh fruit--CA =50%; WA=20%, FL =8%, OR, MI, NY =2% each!
• Fresh veggies: large grower shippers & year-round!– Per capita consump up; big 4 = Packaged salads,
tomatoes, cooking veggies, onions; growers get 30% of retail price; Big 5 states = 90% of fresh veggies--CA =50%, FL =11%, AZ=7%, WA =5%, GA =4%!


US Food & F&V Spending: 2011 • 122 million consumer units, average 2.5 people, 1.3
earners, 1.9 vehicles. Income = $64,000, After-tax spending = $50,000, including $6,500 for food, 13%!
• $3,800 for food at home, including $250 for fresh fruit & $225 for fresh vegetables (total $475, same as average spending on alcohol)!
• Fresh F&V: occupy about 15% of average grocery store, but account for 20% of grocery profits. Super-stores (large groceries), super-centers (grocery+ discount store), & club stores (Costco = 50%). Foodservice: Sysco = #1 & rise of fresh-cut packs!
• Americans eat out an average 3x/week. Since 1997, more restaurant meals are bought to consume away from restaurant than in restaurant!


Economics of F&V Production • Uncertainty and risk: esp in veggies, grower-
shippers sign contracts that commit them to supply specified quantity of packaged salads, tomatoes etc despite (1) weather & (2) perishability risks!– Overplant to ensure supply= overproduction & growers
sometimes selling at a loss, since perishability limits storage (sell it or smell it)!
– Growers harvest IF price > variable costs to recoup some fixed costs!
• Demand for F&V relatively inelastic:!– Need a price change of >15% for consumers to notice
price difference & respond; stores rarely change prices!– NE snowstorm, 10% of Americans stay home (or trucks
stopped), & grower spot prices go down 15-20%!– Wal-Mart & retailers: give data to grower-shipper, who
ensures that shelves are stocked (demise of term markets)!

What if labor costs rise? • Demand for labor down BEFORE supply of US
workers up; more flexibility in demand than supply!• Labor-saving demand changes:!
– Mechanization: machine harvesting, herbicides for weeds, transplant and precision plant to reduce thinning!
– Pick less often, more bulk bins and fork lifts!– Result: fewer, larger, and more specialized farms !
• Labor-increasing supply changes:!– Mechanical aids enlarge the labor pool: more older
workers & women with conveyor belts & pruning platforms!
– Retain current and experienced workers longer with more hours of work? Higher wages & benefits? Respect?!
– Switch to guest workers? Recruit Asians because migrants could stay in the US up to 3 years: new imm?!

• Braceros: 1942-64 • Processing tomatoes:
• Uniform ripening • Once-over harvesting machine
• Production up 5x, but fewer & larger farms

California-Arizona Lettuce • Year-round CA: 8 months; AZ: 4 months-little
trade. 60% of lettuce = iceberg; contracts and bagged salads!
• Very large producers: top 10 = > 2/3 of production; innovation, stormy labor history!
• Mechanization?!– 1970s: gamma rays to selectively harvest—real effort or
union busting?!– About ¾ of iceberg harvested in 1st pass; uniform
ripening and mow?!– Baby-leaf lettuce easier to mechanize: band-saw!
• Labor:!– Generally higher-than-average wages reflecting large
farms, profits, nonfarm unions in packing etc!– AZ: aging green-card commuters & BP agents = H-2A!

Farm Work = Job, not career "• Best way to help a farm worker to increase his/
her income is to get him/her out of ag!• About ¾ of all hired farm workers & 99% of new
entrants were born abroad (immigrants); most foreign-born farm workers = unauthorized!
• Farm employers: open border gates and admit workers eager to fill seasonal farm jobs!
• Worker advocates: there is no shortage of US workers, only a shortage of wages and benefits to attract and retain US workers!
• Government listens to both: admits or tolerates migrants & provides > $1 billion a year for MSFW assistance programs, = 5-10% of MSFW ag earnings!

What about farm worker cities? Fresno county, $6.6 billion in farm sales (2012); more than half of US states

Conclusions • Hired workers do most of the work in US
agriculture. Most are unauthorized, concentrated on large farms, and bilingual FLCs & supers are “glue” between workers and farmers!
• Immigration reform: what impacts on farm labor costs, farm workers, and communities? !
• Supply chains: concentration in retailing = concentration in production; more advanced in fresh vegetables than fruits!
• IF farm wages rise, labor-saving mechanization and increased trade are more likely than US workers going into the fields: more flexibility in farm labor demand than supply!
• migration.ucdavis.edu Rural Migration News!