immigration & farm labor - migration policy institute · highlights • hired workers do most...
TRANSCRIPT

Philip Martin: [email protected]
Immigration & Farm Labor
-10%
-5%
0%
5%
10%
15%
1 2 3 4 1 2 3 4 1 2 3 4 1 2 3 4 1 2 3 4 1 2 3 4
2010 2011 2012 2013 2014 2015
Percent Change in Real Wages From Year Ago, Crop Workers, CA, FL, US
CA FL US

Highlights • Hired workers do most of the work in FVH
commodities (fruits, veggies, & nurseries)
• Hired farm workers = Mexican-born (70%); not
authorized to work in the US (45%); settled & aging
• Employer responses to fewer newcomers
– Satisfy current workers: bonuses, super training—growers
think inelastic supply, so wage increases do not help
– Stretch current workers: mechanical aids, change
production practices to make work easier; older & women
– Substitution: labor-saving mechanization
– Supplement: young H-2A workers provide fresh blood, but
(1) recruit US, (2) provide housing, (3) pay AEWR ($12 CA)
– Uncertainty: no one knows best combination

FVH ag = 3 Ss: Sales, Labor’s Share, Seasonality
• Farm sales = CA $43 bil (2012); IA = $31 bil
– CA = 12% of US $395 billion in farm sales
– US farm sales: 54% crops, 46% livestock
CA farm sales: 70% crops, 30% livestock
– CA $26 bil of $30 bil crop sales or 87% =
FVH commodities
• FVH: labor’s share: 30% of prod costs
• Seasonality: Ave CA farm employ 414,000
(2014). Peak 471,000 Aug; low 344,000 Jan.
Peak-trough ratio = 1.4, & up as geography
down; 100 to 1 on a farm (standby workers).

CA Shares of US FVH Production

Who hires? CA since 2007: more workers brought to farms by
crop support (FLCs) than hired directly. Gap is widening

3,000 US FLCs;
1,200 in CA
FLCs: Increase
efficiency of
worker-job
matching or risk
absorbers?
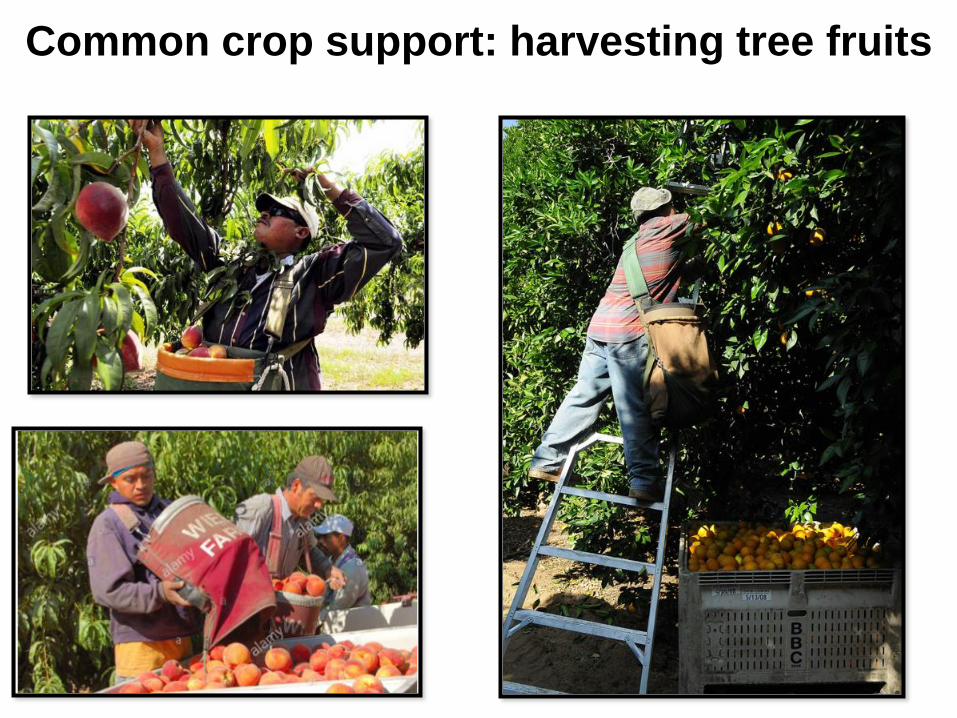
Common crop support: harvesting tree fruits

CA strawberries: 90% of US 3 billion pounds
40,000 acres, 60,000 to 70,000 workers

Vegetables: both
direct-hire & workers
via crop support firms

Nursery & dairy
Big 5 of 15: crop
support, FVH, &
dairy = 95% of CA
ag employment &
wages

CA Hired Crop Workers • Men born in Mexico: 90%; 60% unauthorized.
V-shape legal status
– Fewer newcomers (workers in US less than 1 year). From 20% to 2% today. Result: average age (38) & weeks of farm work (35) up
– 50% of all crop workers, & 2/3 of foreign-born farm workers, are unauthorized. CA has > % unauthorized because more CA farm workers are foreign born
• Employ and earns: more weeks, higher wages
– Average $9.31/ hour across US; $9.22 in CA in 2012
– 35 weeks of farm work + 7 weeks of nonfarm work: 42 weeks, or close to 48 weeks fu ll-time work
– Annual earnings average $15,000-$17,000/ year
• Farm work like nonfarm work: live off the farm, commute to work, have 1 farm employer/year

0
10
20
30
40
50
60
70
80
90
100
Migrant Age 20-34 Less than HS Married parents FCL employer
US crop worker characteristics, 1990, 2000, recent (share of workers)
1990
2000
Recent
Inverted V: Migrancy, youth, low education, FLC peak in 2000

Agriculture: first to feel
effects of fewer newcomers

Employers: 4-S responses • Satisfy current farm workers with bonuses,
benefits, & better supervisors. If supply of workers in US = inelastic, wage increases do not add to supply
• Stretch with mechanical aids that increase productivity: conveyor belts in fields, dwarf trees. How much to invest, how fast to deploy?
• Substitute: labor-saving mechanization. Will wages keep rising to justify long-term investments? Involve seed companies with long horizons?
• Supplement the labor force with H -2As. Will expanded H-2 show that current program is OK or will Congress enact a no-recruitment & no-housing guest worker program?

Satisfy: bonuses, benefits, supervisor training & respect
Most farmers: satisfy will not ENLARGE ag workforce

Stretch: mechanical aids to raise worker productivity

Bell peppers: with and without conveyor belt

Thinning and harvesting apples from platforms
Workers share piece
rate wages when picking
on platforms.
Sweet tango apples
Dwarf trees & no ladders

Substitute: mechanize olives, carrots, tomatoes, nursery

Defense vs Ag: Performance & Costs

Mechanization

Forbes: drew 425 participants to Salinas: LettuceBot

Supplement with H-2As: 75,000 FY07, 140,000 FY15. CA&WA

AEWRs 2015: $10.32 in NC, $12.42 in WA, $11.33 in CA
H-2As concentrated in brown states with lowest AEWRs
FY 2015 Adverse Effect Wage Rates
!!
$10.28 West
Virginia
$11.26 Rhode Island
$11.29 Delaware
$11.61 Indiana
$12.42 Oregon
$11.56 Wisconsin
$13.59 Nebraska
$12.62 Missouri
$11.29 Pennsylvania
$11.26 New Hampshire
$11.61 Illinois
$12.62 Iowa
$11.56 Minnesota
$10.54 New Mexico
$10.00 Alabama
$11.26 Vermont
$11.29 New Jersey
$11.14 Wyoming
$12.98 Hawaii
$13.59 South Dakota
$11.26 Connecticut
$10.35 Oklahoma
$11.14 Montana
$11.26
Maine $13.59
North Dakota $11.26 Massachusetts
$11.29 Maryland
$13.59 Kansas
$12.42 Washington
$11.37
Utah
$11.37 Colorado
$11.61 Ohio
$10.54 Arizona
$11.37 Nevada
$10.00
South
Carolina
$10.35 Texas
$11.14 Idaho
$10.18 Mississippi
$10.28 Tennessee
$10.19
Florida
$11.33 California
$10.18 Arkansas
$11.26 New York
$10.28 Kentucky
$10.18
Louisiana
$10.32 Virginia
$10.00 Georgia
$10.32 North Carolina
$11.56 Michigan
$10.00 < State < $11.00
State < $10.00 $11.00 < State < $12.00
$12.00 < State < $13.00
$13.00 < State

CA H-2As: 3,000 in 2012, 8,600 in 2015
• CA: many vegetable firms operate year-round. Leafy green vegetables in Yuma, SJV, & Salinas
– Border labor force is legal
– Bring border H-2As to Salinas: move from motels to FW housing? (T&A: $8 million to house 800 workers in Spreckels, $10,000 per bed)
– Old: largest CA H-2A user: Sierra-Cascade strawberry nursery (1,300 H-2As in Tulelake; WWII Japanese intern)
• H-2A expansion: led by coastal vegetable growers, not SJV fruit industry. Half of CA farm labor is in SJV, where fruit industry is concentrated , & there is less grower-shipper integration
• Some shippers: increase imports, esp of Mexican berries

T&A 800 beds in Spreckels: return to on-farm housing?
T&A: 800
employees at
145-unit apt in
Yuma, AZ
since 2007

Summary • Average farm employment up as expansion offsets
mechanization. Berries up as raisins mechanize
• Farm workers: fewer new entrants & aging, settled farm workforce with US-born children
• Employer responses to fewer newcomers
– Satisfy: 40/ 40 rule: keep current workers longer
– Stretch: labor-stretching mechanical aids
– Substitute: labor-saving mechanization
– Supplement: H-2A workers; try to change rules to reduce requirements on employers via recruitment, housing, & AEWR
• Which of the 4 S’s takes priority? What variance by commodity and area?