imf country report no. 16/46 kingdom of the netherlands · this selected issues paper on the...
TRANSCRIPT

© 2016 International Monetary Fund
IMF Country Report No. 16/46
KINGDOM OF THE NETHERLANDS—NETHERLANDS SELECTED ISSUES
This Selected Issues paper on the Kingdom of the Netherlands—Netherlands was
prepared by a staff team of the International Monetary Fund as background
documentation for the periodic consultation with the member country. It is based on the
information available at the time it was completed on January 8, 2016.
Copies of this report are available to the public from
International Monetary Fund Publication Services
PO Box 92780 Washington, D.C. 20090
Telephone: (202) 623-7430 Fax: (202) 623-7201
E-mail: [email protected] Web: http://www.imf.org
Price: $18.00 per printed copy
International Monetary Fund
Washington, D.C.
February 2016

KINGDOM OF THE
NETHERLANDS—NETHERLANDS
SELECTED ISSUES
Approved By European Department
Prepared By Jean-Marc Natal, Marc Gerard, Michelle Hassine
TAX REFORM IN THE NETHERLANDS: MOVING CLOSER TO BEST PRACTICES _______ 3
A. Introduction and Stylized Facts ________________________________________________________ 3
B. Improving the Design of Capital Income Taxation _____________________________________ 5
C. Correcting for the Debt Bias __________________________________________________________ 10
D. Trimming the Labor Tax Wedge Further ______________________________________________ 11
E. Indirect Taxation: Unifying VAT Rates _________________________________________________ 12
F. Streamlining the Tax-Benefit System __________________________________________________ 13
G. Decentralizing Taxing Powers _________________________________________________________ 14
H. Conclusions ___________________________________________________________________________ 14
References _______________________________________________________________________________ 17
BOX
1. Personal Income Taxation in the Netherlands __________________________________________ 9
FIGURES
1. Income and Wealth Distribution _______________________________________________________ 4
2. Labor Income Tax Burden ______________________________________________________________ 5
TABLES
1. Structure of Taxation in the Netherlands, European Comparison ______________________ 15
2. Composition of VAT Revenues, 2010 __________________________________________________ 16
REFORMING OCCUPATIONAL PENSION SCHEMES IN THE NETHERLANDS _________18
A. Introduction __________________________________________________________________________ 18
B. Overview of the Dutch Pension Funds over the Crisis _________________________________ 19
CONTENTS
January 8, 2016
KINGDOM OF THE NETHERLANDS—NETHERLANDS
2 INTERNATIONAL MONETARY FUND
C. Developments of the Pension Funds over the Crisis___________________________________ 21
D. Stress-Testing the Collective Pension Schemes _______________________________________ 23
E. Possible Reform Options ______________________________________________________________ 25
F. Conclusion ____________________________________________________________________________ 31
References _______________________________________________________________________________ 32
BOXES
1. The New Financial Assessment Framework ____________________________________________ 21
2. Notional DC Plan and Premium Accounts in Sweden__________________________________ 27
3. Superannuation Funds in Australia ____________________________________________________ 28
4. Occupational Pension Plans in Switzerland ____________________________________________ 29
TABLES
1. Pension Fund Structure and Development, 2005–14 __________________________________ 20
2. Dutch National (Model) Plan—Solvency Stress Tests (Change in the Membership
Composition) ____________________________________________________________________________ 25
APPENDIX
I. Data Sources and Actuarial Formulas Used to Stress Test the Dutch Collective
Pension Schemes ________________________________________________________________________ 34
DUAL LABOR MARKETS IN THE NETHERLANDS—ENVIRONMENT AND POLICY
IMPLICATIONS _________________________________________________________________________36
A. Background ___________________________________________________________________________ 36
B. Development of Self-Employment ____________________________________________________ 37
C. Self Employment has Implications for Private and Public Balance Sheets _____________ 40
D. Conclusions ___________________________________________________________________________ 43
References _______________________________________________________________________________ 44
BOX
1. Incentives Associated with the Status of Self-Employed Workers in the Netherlands _ 39
FIGURE
1. Self-Employed in the Netherlands _____________________________________________________ 38
TABLES
1. Taxation of Wage Earners and Self Employed by Income Level________________________ 40
2. Self-Employed Workers: Annual Incomes, 2007 ______________________________________ 41
3. Estimated Fiscal Costs of the Tax Allowance to Self-Employed ________________________ 42

KINGDOM OF THE NETHERLANDS—NETHERLANDS
INTERNATIONAL MONETARY FUND 3
TAX REFORM IN THE NETHERLANDS: MOVING CLOSER TO BEST PRACTICES
1
The government has recently floated ideas for a broad tax reform, including measures to decrease the
labor tax wedge, eliminate VAT distortions, as well as measures that increase labor force participation
and delegate more taxing powers to regional governments. Following intense debates, a more modest
income tax cut package of €5 billion has been agreed upon for 2016.
This paper aims to contribute to the discussion by sketching ways in which the taxation equity-
efficiency frontier could be shifted outwards in the Netherlands. In a nutshell we argue that significant
efficiency gains could be achieved by shifting the tax burden away from labor, and towards
consumption and capital—especially housing.
In our view, considerable thought should be given to reforming capital income taxation, which is
fragmented, inefficient and has many regressive features. We also highlight the detrimental impact of
the tax-benefit system on labor supply—in particular by mothers—and the insufficient and
distortionary use of VAT as a revenue-collection mechanism. Finally, the Dutch tax system favors debt
over equity financing. The distortion is particularly large in the housing sector where debt building is
generously subsidized leading to over-leveraged household balance-sheets. But similar debt-bias is
also present in the corporate sector.
Future tax reforms should explore ways to relieve the burden on labor by diversifying the sources of tax
revenues. Measures that expand the tax base and increase burden-sharing across tax instruments, that
tackle the debt bias in corporate and household financing, that eliminate VAT distortions and increase
labor force participation must be encouraged.
This note reviews the main features of the Dutch tax system and sketches the contours of a
hypothetical tax reform. While voluntarily high-level, the discussion aims to contribute to the ongoing
debate by highlighting the most important gaps with established best practices.
A. Introduction and Stylized Facts
1. In the Netherlands, a very uniform distribution of income contrasts with a rather
skewed wealth distribution (ex-pension entitlements). The Dutch economy is hardly
distinguishable from other advanced open economies when measured against the usual yardsticks
of income per capita, potential growth and inflation. But the combination of very uniform income
distribution and very skewed wealth distribution sets it apart. Although typical measures of wealth
do not take into account pension-related savings—the most important store of wealth in the
Netherlands—this still comes as a surprise given the country’s revealed social preference for equity,
and suggests scope to transfer some of the tax burden from labor to capital.
1 Prepared by Jean-Marc Natal (EUR). This paper greatly benefitted from helpful comments by Ruud de Mooij and
Arjan Lejour and discussions with Bas Jacobs.

KINGDOM OF THE NETHERLANDS—NETHERLANDS
4 INTERNATIONAL MONETARY FUND
Figure 1. The Netherlands: Income and Wealth Distribution
2. Labor income taxation is doing the heavy lifting in terms of revenue collection and
income redistribution. The comparatively elevated (with respect to European counterparts) labor
taxation in the Netherlands features a very progressive labor tax scale and dissuasive marginal tax-
and-benefit schemes for low income workers—in particular mothers. At the same time, capital
income taxation is one of the lightest in the European union, and indirect taxation—a potentially
efficient revenue collection instrument—does not carry its share of the load (see Table 1). By
discouraging labor supply, the current tax system shrinks the tax base and overloads taxpayers.2
2 Approximate back-of-the-envelope calculations suggest that taxing pensions as ordinary savings under Box 3
(€14 billion; 1.2 percent wealth tax on about €1.2 trillion pension wealth), removing the tax subsidy on owner-
occupied housing (about €6 billion in lost fiscal revenues due to the combination of low imputed return on housing
and high deductibility of mortgage interests, see paragraph 11), and unifying VAT at the standard rate (€8 billion)
would increase (ex-ante) revenues by roughly 4 percent of GDP.
0
10
20
30
40
50
60
70
80
90
100
SV
K
GR
C
ESP
ITA
AU
S
BEL
FIN
GBR
NO
R
LUX
FRA
CA
N
PR
T
DEU
AU
T
NLD
USA
(Top 5% - Median)/Median in %
Share top 5%
Wealth Distribution, 2010-2012
(Distance to median and share of top earners)
0.0 0.2 0.4 0.6 0.8
KORCHE
ISLNLDNORSVKTURSWEDNKCZENZLAUSPOLSVNMEX
ISRHUN
FINBELEST
AUTFEULUXITAESP
USAFRAPRTGRC
IRL
Gini index post
tax and transfers
Gini index effect
of tax and
transfers
Income Distribution: Gini Index, 2012
Source: OECD.

KINGDOM OF THE NETHERLANDS—NETHERLANDS
INTERNATIONAL MONETARY FUND 5
Figure 2. The Netherlands: Labor Income Tax Burden
Source: OECD.
B. Improving the Design of Capital Income Taxation
3. A voluminous theoretical research on optimal taxation has reached rather
straightforward conclusions (Mirrlees review, 2011, De Mooij, 2007, Jacobs, 2013). A good tax
system should be simple, transparent, efficient, and should not introduce arbitrary differentiations
across commodities, taxpayers, or forms of economic activity. In achieving a given level of income
redistribution (a social choice) the tax system should aim to minimize the distortions on individual
consumption and production choices; it should trade a larger tax base for a lower tax rate. The
0
10
20
30
40
50
60
CH
LM
EX
KO
REST
CH
EN
ZL
ISR
JPN
PO
LSV
KC
ZE
CA
NESP
AU
SG
BR
USA
OEC
D A
vg
.TU
RIR
LIS
LFR
AG
RC
HU
NP
RT
SW
EN
OR
SV
NLU
XFIN ITA
AU
TN
LD
DN
KD
EU
BEL
Labor Income Taxation, 2014
(Percent)
Average rate of income tax &
social contributions per
employee (single, 167% average
wage, no child)
0
10
20
30
40
50
60
RU
SH
UN
CZ
ESV
KLTA
SV
NEST
TU
RP
RT
PO
LLTU
CO
LFIN
CH
LZ
AF
USA
SW
EIS
LD
NK
CA
NM
EX
ISR
GR
CN
OR
FR
AO
EC
DESP
CR
IN
ZL
LU
XB
EL
AU
SIR
LG
BR
ITA
AU
TD
EU
CH
EN
LD
Women, 15-54 years old
Men, 15-54 years old
Part-Time Work by Gender, 2014
(Percent)
0
500
1000
1500
2000
2500D
EU
NLD
NO
RD
NK
FR
ASV
NC
HE
SW
EA
UT
LU
XFIN
AU
SG
BR
ESP
CA
NJP
NIT
AN
ZL
SV
KO
EC
DC
ZE
USA
IRL
LTU
ISR
PR
TH
UN
EST
ISL
PO
LLTA
RU
SC
HL
GR
CK
OR
CR
IM
EX
Hours Worked Per Worker, 2014
(Number of hours)
0
10
20
30
40
50
60
70
80
90
NLD DEU FRA OECD
avg.
USA EA
avg.
NOR SWE ESP
Single parent, 67-100% AW, 2 children
Second earner, 67-100% AW, 2 children
Inactivity Trap, 2014
(Marginal effective tax rate, percent)

KINGDOM OF THE NETHERLANDS—NETHERLANDS
6 INTERNATIONAL MONETARY FUND
principles are clear, but the implementation often raises a whole set of issues—which are particularly
acute when it comes to taxing capital income.
4. An unequivocal theoretical recommendation on the appropriate fiscal treatment of
capital income is still lacking. One school of thought argues that capital income is part of a
comprehensive income, and should be taxed in the same way as labor income according to the
ability-to-pay principle. The major problem with this approach is that taxing savings—especially at a
progressive rate—increases the price of future consumption and discourages investment; an
important violation of the principle of neutrality of taxation. The distortion is even larger when the
tax is levied at the source (corporate tax) as corporate capital is more internationally mobile than
personal capital (Sørensen, 2007). This has led to the seemingly logical and opposite conclusion that
returns to capital should not be taxed at all. At least normal3 returns should be exempted,
suggesting that the optimal taxation design is an expenditure tax that implicitly exempts normal
returns to capital but taxes excess returns (Mirrlees, 1971, Atkinson and Stiglitz, 1976, Mirrlees
review, 2011). While a priori attractive on efficiency grounds, this policy prescription poses practical
(political) challenges along the equity dimension—even if redistribution can theoretically be
addressed via labor income taxation. Moreover, exempting capital income shrinks the tax base and
for given revenue needs may place an excessive—and potentially inefficient—burden on other forms
of taxation.
5. A pragmatic solution to the ongoing theoretical debate: the DIT. The so-called Dual
Income Tax system (DIT) put in place by several Nordic countries since the end of the nineties (i.e.,
Finland, Norway, Sweden) can be seen as a compromise between the comprehensive income and the
expenditure tax outlined above. In its purest form, the DIT combines a low, unique and flat tax rate
on all capital incomes4, with a higher and progressive tax rate on labor income—for revenue and
distributional purposes (Sørensen, 2007, 2010 and Jacobs, 2013). A unique, flat and low tax rate on
capital income i) avoids the undesirable progressivity of the taxation of real returns due to the
inflation premium, ii) aligns the marginal personal income tax on capital with the corporate income
tax, eliminating the scope for tax arbitrage activities and allocational distortions, iii) minimizes the
risk of capital flight while broadening the tax base and iv) simplifies tax administration as it allows
the tax on interest and dividends to be collected as a withholding tax.5
6. The Achilles heel of the DIT system is that it provides new tax-arbitrage opportunities.
Under a pure DIT system, there is strong incentives for some individuals—mainly self-employed and
small business owners—to re-label high-taxed labor income activities as low-taxed capital income.
One practical solution to this tax-arbitrage issue—pioneered by Norway in 2006—is to levy an
additional personal shareholder tax for all capital incomes (both dividends and capital gains) that
3 A rate of return that compensates investors for time preference and expected inflation.
4 The DIT usually includes a mechanism to avoid the double-taxation of equity.
5 Note that in practice international treaties signed by Nordic countries forbid levying withholding taxes on interest
and dividends paid out to non-residents.

KINGDOM OF THE NETHERLANDS—NETHERLANDS
INTERNATIONAL MONETARY FUND 7
exceed the normal return to capital (already taxed under the low and flat corporate income tax, CIT).
The personal shareholder tax rate is chosen such that the combined tax burden on capital income is
close to the highest bracket of labor income tax,6 thereby eliminating the incentive for income
shifting (Sørensen, 2010).7 An alternative approach consist in maintaining the pure DIT system
(with a low and flat tax rate on all capital incomes), but to explore allocation rules that effectively
split income revenues along the labor and capital lines—thereby avoiding income shifting practices.
However, the Norwegian experience suggests that splitting rules are prone to be circumvented and
difficult to enforce.
7. The Dutch capital income taxation system is still some distance away from best
practices. The Netherlands introduced a new regime for capital income taxation as part of a
complete tax reform in January 2001. The most significant changes with respect to the old system
was i) the introduction of the box scheme for sorting out different sources of personal incomes for
taxation purposes, and ii) the introduction of the ‘presumptive’ tax on personal capital income in
Box 3, which taxes capital income at 30 percent ‘ex-ante’ on an imputed rate of return on assets of
4 percent; the presumptive capital income tax is therefore equivalent to a 1.2 percent wealth tax.
8. Widely different regimes for different types of capital cohabitate, which creates
important distortions.While the new system greatly reduced the tax collection administrative
burden, it also introduced a whole range of new issues. First, the Dutch tax system—unlike the DIT
system—violates the neutrality principle, potentially introducing large distortions in savings and
investment choices. Some capital incomes are taxed at a progressive rate in Box 1, like e.g., the
return on equity invested in proprietorship, or the imputed rent on owner occupied houses net of
mortgage payment deductions. Others are taxed at proportional rates in Box 2, like e.g., the return
on equity invested in closely-held corporations. And the rest is taxed in a regressive fashion8 in
Box 3, like e.g., the presumptive return on the value of bank deposits, stocks, bonds and real estate.
There is also double-taxation of the returns on corporate equity, which contrasts with the taxation of
returns on savings held in pension funds, which are subsidized through the deductibility of pension
contributions in Box 1. Second, by imposing an ‘ex ante’ taxation of presumptive returns in Box 3,
6 Because it increases the effective tax rate on capital income, this solution seems to defeat one of the stated
objectives of the DIT which is to avoid damaging capital flight (see point iii above). However, the relevant tax margin
for investment purposes is the CIT. International capital mobility implies that a higher tax on personal capital income
will essentially result in lower domestic savings and current account balances, but should not tremendously affect
investment if the CIT remains low and constant (Sørensen, 2007).
7 Note, however, that this solution also introduces a close correspondence between the level of capital and labor
income taxes which can be seen as a constraint by the tax authorities.
8 The effective tax rate on a deposit account with 2 percent return is 60 percent, while the effective tax rate on an
equity portfolio with 8 percent return is 15 percent. As equity and other high yielding assets, including real estate, are
typically held by wealthier individuals, the presumptive taxation system is regressive. A new law on capital income
taxation scheduled for 2017 attempts to mitigate the regressive aspect of the current arrangement by setting the
presumptive return as a function of total wealth, divided into three brackets (W<€100,000; €100,000<W<1,000,000;
W>1,000,000). While an improvement with respect of the current arrangement, the new system still falls short of
taxing realized capital returns.

KINGDOM OF THE NETHERLANDS—NETHERLANDS
8 INTERNATIONAL MONETARY FUND
the Dutch capital income taxation system encourages excessive leverage and risk taking, favors
portfolio investment and forgoes the beneficial countercyclical properties of taxing realized returns
(dividend and capital gains). Third, the Dutch tax system severely distorts business incentives
towards debt financing and away from equity. This is in particular the case for small businesses and
self-employed whose income after—interest-payment-deduction is taxed under Box 1 at a
progressive rate, and for owner-occupied housing whose (artificially low) imputed rental income is
taxed net of mortgage interest payments.
9. The Netherlands subsidize pensions saving through a favorable taxation regime. In the
Netherlands, like in many other countries, the accrual of pension wealth—in contrast to other forms
of capital—is not subject to capital income taxation, in violation of the principle of neutrality in
taxation that suggests that pension funds should be taxed like other forms of savings. Pension
savings are also subsidized through the tax treatment of contributions and retirement benefits.
Contributions are deducted from taxable labor income and are taxed at a later stage—but at a lower
rate—when pension benefits are disbursed. As high-income earners are able to contribute (and
deduct) relatively more to pension plans (including 2nd and 3rd pillar) than low-income earners,
pension savings are not only subsidized but the scheme has regressive features. The regressive
aspect of the system is made worse by the progressivity of labor income taxation as higher income
earners are able to deduct at a comparatievely higher rate. To avoid regressive taxation, the tax rate
on retirement income should correspond to the one at which the deductions were made on
average. Merely capping the tax deductible contributions9 is a very crude way to mitigate the
regressive nature of the pension tax scheme, as it introduces additional distortions and arbitrary
redistribution. Because pension savings are largely mandatory, decreasing the pension subsidy
would not deter savings but boost tax revenues that could be used to further trim the labor tax
wedge. The budgetary impact of taxing pension savings as other capital in Box 3 could be
considerable as total pension fund assets exceed €1.2 trillion in the Netherlands.10
9 The tax base for pension deductions is capped at €100,000 in the Netherlands.
10 A simple back of the envelope calculation would suggest €14 billion (€1,200 x 1.2 percent) to which we could add
the current lost revenues from taxing retirement benefits at a reduced rate.
KINGDOM OF THE NETHERLANDS—NETHERLANDS
INTERNATIONAL MONETARY FUND 9
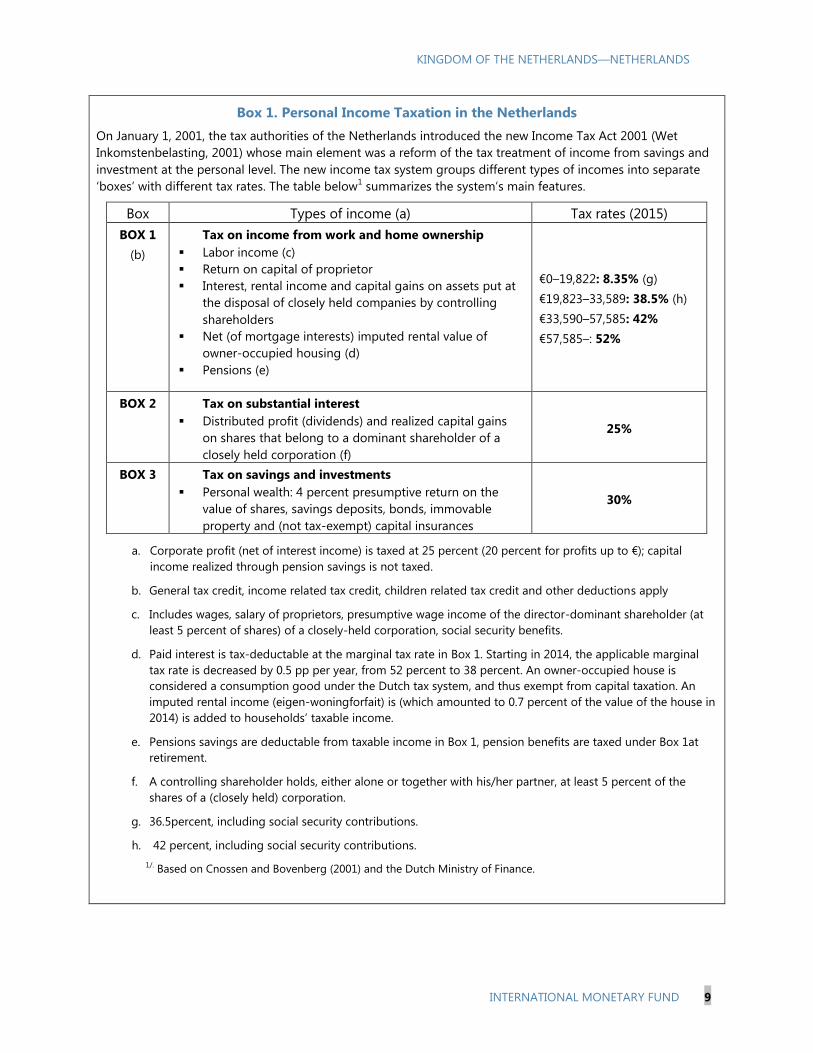
Box 1. Personal Income Taxation in the Netherlands
On January 1, 2001, the tax authorities of the Netherlands introduced the new Income Tax Act 2001 (Wet
Inkomstenbelasting, 2001) whose main element was a reform of the tax treatment of income from savings and
investment at the personal level. The new income tax system groups different types of incomes into separate
‘boxes’ with different tax rates. The table below1 summarizes the system’s main features.
Box Types of income (a) Tax rates (2015)
BOX 1
(b)
Tax on income from work and home ownership
Labor income (c)
Return on capital of proprietor
Interest, rental income and capital gains on assets put at
the disposal of closely held companies by controlling
shareholders
Net (of mortgage interests) imputed rental value of
owner-occupied housing (d)
Pensions (e)
€0–19,822: 8.35% (g)
€19,823–33,589: 38.5% (h)
€33,590–57,585: 42%
€57,585–: 52%
BOX 2 Tax on substantial interest
Distributed profit (dividends) and realized capital gains
on shares that belong to a dominant shareholder of a
closely held corporation (f)
25%
BOX 3 Tax on savings and investments
Personal wealth: 4 percent presumptive return on the
value of shares, savings deposits, bonds, immovable
property and (not tax-exempt) capital insurances
30%
a. Corporate profit (net of interest income) is taxed at 25 percent (20 percent for profits up to €); capital
income realized through pension savings is not taxed.
b. General tax credit, income related tax credit, children related tax credit and other deductions apply
c. Includes wages, salary of proprietors, presumptive wage income of the director-dominant shareholder (at
least 5 percent of shares) of a closely-held corporation, social security benefits.
d. Paid interest is tax-deductable at the marginal tax rate in Box 1. Starting in 2014, the applicable marginal
tax rate is decreased by 0.5 pp per year, from 52 percent to 38 percent. An owner-occupied house is
considered a consumption good under the Dutch tax system, and thus exempt from capital taxation. An
imputed rental income (eigen-woningforfait) is (which amounted to 0.7 percent of the value of the house in
2014) is added to households’ taxable income.
e. Pensions savings are deductable from taxable income in Box 1, pension benefits are taxed under Box 1at
retirement.
f. A controlling shareholder holds, either alone or together with his/her partner, at least 5 percent of the
shares of a (closely held) corporation.
g. 36.5percent, including social security contributions.
h. 42 percent, including social security contributions.
1/. Based on Cnossen and Bovenberg (2001) and the Dutch Ministry of Finance.

KINGDOM OF THE NETHERLANDS—NETHERLANDS
10 INTERNATIONAL MONETARY FUND
C. Correcting for the Debt Bias
10. The favorable tax treatment of debt over equity—at both the personal and corporate
levels—introduces large distortions. Besides creating significant inequities, complexities and
economic distortions, high levels of debt to equity present important risks for financial stability and
fiscal sustainability (De Mooij, 2012). Basically, two different options are available to mitigate the
problem: either eliminating the tax deductibility of interests or introducing a similar deduction for
equity. Under the Comprehensive Business Income Tax11
(CBIT) corporate income is taxed before
interest. Treating debt and equity financing in a symmetric way also eliminates the need for capital
income taxation at the personal level which solves the traditional problem of the double taxation of
equity.12
However, because of fears that investment could be affected in the transition towards a
system that implies a higher taxation of corporate profits13
, international attention has moved
towards the alternative—the so-called Allowance for Corporate Equity (ACE).14.
The ACE allows firms
to deduct an imputed normal return on equity from the CIT as they do with interest on debt.15
The
main practical problem with the ACE is that the loss in fiscal revenues has to be compensated with
other—possibly distortionary—taxes or by higher statutory tax rates, which may trigger international
tax arbitrage behaviors by the most profitable firms. This caveat can be mitigated by introducing the
ACE in an incremental way.
11. In the Netherlands, the debt bias is
particularly large in the subsidized housing
sector, where taxable imputed returns on
property are set at an artificially low level while
mortgage interests are deductible—at
progressive rates—from personal income under
Box 1. This is an important distortion as large
amounts of savings are detracted from
potentially productive investments to further
inflate house prices. The subsidy is so large that
11
Proposed by the U.S. Treasury in 1992.
12 Note that introducing a withholding tax on interest in a DIT system is equivalent to the CBIT. CIT = tau*(R–dK–iB) +
tau*(iB) = tau*(R–dK), for (R) the net cash flow post labor costs, (d) the depreciation rate, (K) the firm’s capital stock
and (iB) the interest paid on net debt.
13 A priori, the CBIT increases CIT and decreases PIT, while ACE does the opposite. As business capital is more
internationally mobile than personal capital, the general preference for ACE is easily understandable. However, one
could argue that enlarging the tax base would permit lower tax rates so that the net effect of the CBIT on CIT may
not be positive after all. At the end of the day, it all boils down to how other taxes are adjusted and able to pick up
the slack when either CBIT or ACE is introduced.
14 First proposed by the Capital taxes group of the Institute for fiscal studies in 1991.
15 The ACE also provides a natural hedge against the investment distortion caused by deviations between true
economic depreciation and depreciation for tax purposes; if firms write down their assets at an accelerated pace, the
current tax saving will be eventually offset by a fall in future rate of return allowances.
0
50
100
150
200
250
300
350
SV
KC
HL
SV
NPO
LC
ZE
HU
NIT
AA
UT
DEU
EST
BEL
FRA
GR
CU
SA
FIN
JPN
ESP
PR
TKO
RG
BR
CA
NSW
EC
HE
AU
SN
OR
IRL
NLD
DN
K
Households Debt to Gross Disposable Income, 2011
(Percent)
Source: OECD.
KINGDOM OF THE NETHERLANDS—NETHERLANDS
INTERNATIONAL MONETARY FUND 11
the overall revenue from capital income taxation at the personal level is negative (see Table 1).
Clearly, a more balanced tax treatment of housing-related debt would free up a lot of fiscal
resources that could be used to decrease distortionary taxes on labor or other capital income. As
residential capital is a very inelastic factor, a housing tax would be efficient.
12. Some measures have already been taken to reduce mortgage deductibility over time.
But more should be done to reduce the debt bias in the housing sector. A higher equity share in
housing should help prevent boom-bust cycles with important benefits in terms of financial stability
and fiscal sustainability. And there are many ways to achieve this result. The principal of neutrality in
taxation suggests that owner-occupied housing should be taxed as capital income, not as personal
income—which could be easily accommodated under the current system by shifting home-owner
property investment from Box 1 to Box 3. Such a move would eliminate the exorbitant subsisdy
attached to owner-occupied housing. Preferably, under a new capital income taxation system (as
delineated in precedent paragraphs), imputed rental costs would include a risk premium on top of
the benchmark risk free rate, and could take into account depreciation costs (Jacobs et al., 2007).
Consistent with a CBIT-like system, mortgage deductibility could be phased out faster than under
current agreements. In case of a sharp house price drop, the (large) fiscal revenue windfall from
removing the home-owner subsidy could be partially used to help the most vulnerable (under-
water) home owners increase home equity. In the long run, a form of housing equity allowance—
calibrated in a similar fashion as the ACE for corporates—could be introduced to match the
remaining deductions from interests on mortgage, if any.
D. Trimming the Labor Tax Wedge Further
13. The recently announced €5 billion tax cut package is a step in the right direction, as
the measures strengthen work incentives with a focus on low incomes and 2nd earners.16
Future measures should continue to be focused on low-income and mothers (both singles and in
couple), which are the groups with the largest labor supply elasticity—along the extensive margin—
and the highest ‘participation’ tax. (See Figure 2).17
Targeted measures that stimulate work incentives,
16
The measures are expected to create about 35,000 new jobs, in particular among dual earners households with
small children. The €5 billion tax cut package announced on September 15 will be allocated as follows:
i) Rise in the personal income tax threshold of the fourth tax bracket (highest earners), from the current
€57,585 to €65,000, for which the tax rate will remain at 52 percent (about €1 billion);
ii) Reduction in the total personal income tax rate in the second and third bracket between €19,923 and
€66,421 per year (about €2.5 billion);
iii) Increase in earned income tax credit and childcare subsidies for second earners (about €500 million)
and corporate tax incentives for hiring of low-paid workers (about €500 million);
iv) Increase in personal tax-free allowance for incomes up to €50,000 per year, alongside a reduction in the
number of general tax exemptions (about €500 million).
17 The participation tax is defined as the sum of increased taxes and lost benefits when labor income is increased by a
given amount.
KINGDOM OF THE NETHERLANDS—NETHERLANDS
12 INTERNATIONAL MONETARY FUND
like e.g., in-work tax credit to low income workers, income dependent tax credit for second earners
or for single parents, or income-dependent child benefit, should be favored. Combining in work tax-
credit for low income earners with lower across-the-board benefits would exert the largest ‘bang for
the buck’ in terms of labor supply as income and substitution effects work in the same direction.
However, the impact on income distribution would also be the largest (De Boer et al., 2014). There
might also be some scope for a slight reduction in the marginal tax rate on high-earners (above
€57,585 per year). Recent simulations (Jacobs, 2013) show that the marginal tax rate on high-earners
is set slightly above the revenue-maximizing level. Lower marginal tax rates on high-earners might
also disincentivize large investment in tax deductible mortgages which in the past led to sharp
increase in households’ debt and associated financial fragility.
E. Indirect Taxation: Unifying VAT Rates
14. Economic theory unambiguously suggests that VAT rates should be unified across
different goods and services. A unique VAT rate ensures that production and consumption choices
remain undistorted (neutrality)—with signficant welfare gains (Bettendorf and Cnossen, 2014)—it
eliminates costly tax evasion behaviors and simplifies administrative processes. This consensus
stands in stark contrast with the dominant practice. In spite of a voluminous theoretical research
that shows that redistribution is more efficiently done via labor income tax, VAT rates are often used
for redistribution purposes, with necessities taxed at a reduced rate.
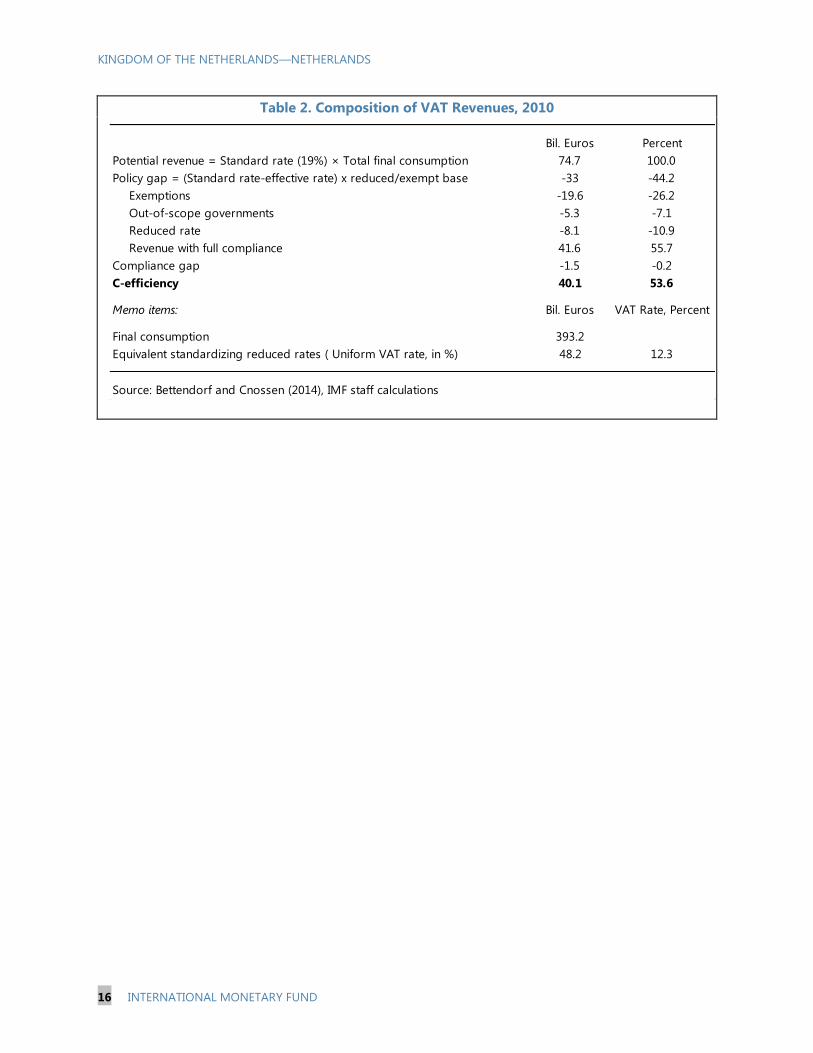
15. Unifying VAT rates in the Netherlands would provide sizeable additional tax revenues
that could be used to further reduce more distorting labor income tax. The scope for shifting
revenue collection from the highly distorting labor income tax to the more neutral VAT is particularly
large in the Netherlands where the burden of indirect taxation is among the lightest in Europe
(Table 1). Simple calculations (Table 2) show that the (ex-ante)18
impact of standardizing VAT rates
would amount to €8 billion (if only reduced rate items were adjusted).19
Alternatively, extending the
tax base to reduced rate items would allow a decline in the standard rate to 12.3 percent—to the
extent that the additional revenue is not used to reduce labor taxes.
16. The usual redistribution argument for maintaining differentiated tax rates does not
hold in the Netherlands. Bettendorf and Cnossen (2014) show that i) the share of household
budget spent on reduced rates items does not differ much across income groups and ii) the VAT
burden does not vary much in proportion of income/expenditures. Wealthier households benefit as
much as poorer households from the reduced VAT rates: they just consume more of the exempted
goods and services, in line with their relatively higher disposable income.
18
Of course these calculations tend to oversimplify as they assume constant behaviors throughout. A more
interesting exercise would look at the growth and unemployment effects of a budget neutral increase in VAT.
19 If the unique VAT rate was extended to all currently exempted goods and services, the tax revenues would amount
to a maximum of €33 billion or 70 percent of total personal income revenues ex-social contributions. Note that this
would have to be compatible with the EC directive which legislates what services are to be exempted and therefore
set a higher bound.

KINGDOM OF THE NETHERLANDS—NETHERLANDS
INTERNATIONAL MONETARY FUND 13
F. Streamlining the Tax-Benefit System
17. The tax-benefit system has
become excessively complex and
requires stronger screening and
monitoring capacity at the Tax and
Custom Administration (TCA). The
multiplication of taxes and allowances has
put the TCA under considerable strain
(Algemene Rekenkamer, 2015). This is in
particular the case for the regime of
allowances, as the TCA is in charge of
eligibility assessment and enforcement. A
large investment in specialized staff and
technology will be necessary to track and
organize a tremendous volume of
information and avoid abuses and fraud
that could eventually lead Dutch tax
payers to lose confidence in the tax
system. Steps in the right direction have
been taken and a pluri-annual IT
development plan agreed upon.
18. The limits and potential costs of the current system of allowances can be epitomized
by the generous tax exonerations for self-employed. Initially seen as a way to increase the
flexibility of the labor market, the self-employed allowance scheme may have introduced a very
large distortion in the labor market with important long to medium-term costs. First, as mentioned
above, it is very difficult for the TCA to assess the many features (i.e., allowance for R&D activities,
for investment, for hours worked by partners in the family business, deductions for assets
depreciation) that give rise to tax allowances and deductions under the self-employed program. As
the number of self-employed swells, this situation runs the risk of transforming the self-employed
status into a tax avoidance scheme. Second, and even more importantly, the potential long-term
costs of the tax-preferred status for self-employed may not be negligible. By favoring self-
employed, the current tax system may be creating small business traps (3/4 of self-employed are
active in a one person company) with important negative consequences for productivity growth
(inefficient labor organization, lack of training on-the-job and actual investment in R&D). Self-
employed also typically drop off the usual social security and pension plans, which may pose
important risks for individual coverage and the long-term financial stability of these institutions.20
20
For a more extensive discussion of the status of self-employed in the Netherlands, please refer to the special issues
paper, “Dual Labor Market in the Netherlands—Environment and Policy Implications” by Michelle Hassine.
-80
-60
-40
-20
0
20
40
60
80
100
0 5
10
15
20
25
30
35
40
45
50
55
60
65
70
75
80
85
90
95
100
Wage and income tax
General tax deduction
Child-related budget
Rental allowance
Pension premium
Health care allowance
Income-dependent combination of tax credit and deduction
Marginal burden, %
Marginal Tax Burden on Labor Income
(1,000 euros)
Source: CPB.

KINGDOM OF THE NETHERLANDS—NETHERLANDS
14 INTERNATIONAL MONETARY FUND
G. Decentralizing Taxing Powers
19. There is ample scope for decentralizing taxing powers in the Netherlands. In 2014, only
10 percent of regional-government revenues were financed by local taxes—a particularly low
number in international comparison. By transferring tax raising powers to local authorities, the
government could foster greater fiscal commitment and better scrutiny. This would also increase
incentives for local governments to spend revenue efficiently. Local recurrent property taxes on
owner-occupied houses could be the ideal vehicle to enhance taxing powers at the regional level,
while at the same time trimming housing subsidies.
H. Conclusions
20. The tax system in the Netherlands is one of the most equitable in the OECD. But there
is ample scope for improvement along the efficiency dimension. First, capital income taxation is
fragmented, regressive, distorts allocation towards excessive investment in housing and favors debt
finance over equity—at both corporate and personal levels. A more homogeneous capital income
tax system along the lines of the Nordic dual income tax (DIT) system would go a long way in
correcting the largest distortions. Second, a more symmetric tax treatment of debt and equity would
contribute to dampen the amplitude and reduce the frequency of boom-bust cycles, thereby
improving financial stability and fiscal sustainability. Introducing an ACE and/or backtracking on the
favourable treatment of debt—in particular in the housing sector—should be high on the agenda.
Finally, increasing both VAT and capital income tax revenues would help alleviate the burden on
labor income taxation and increase labor force participation (hours worked).

KINGDOM OF THE NETHERLANDS—NETHERLANDS
INTERNATIONAL MONETARY FUND 15
Table 1. Structure of Taxation in the Netherlands, European Comparison*
(Percent of GDP)
*/ The ranking reflects relative levels of revenue-to-GDP ratios for each revenue source among the EU-28, with rank 1
being the highest ratio.
2007 2008 2009 2010 2011 2012
A. Structure of revenues Ranking Bil. Euros
Indirect taxes 13 12.7 12.2 12.5 12 11.9 22 71.1
VAT 7.5 7.3 7 7.3 6.9 7 24 41.7
Excise duties 2.4 2.4 2.3 2.3 2.2 2.2 26 13
Other taxes on products 2 2 1.8 1.8 1.6 1.5 8 8.9
(incl. import duties)
Other taxes on production 1 1.1 1.2 1.2 1.2 1.2 14 7.5
Direct taxes 12.2 12 12.1 12.2 11.7 11.2 13 67
Personal income 7.4 7.2 8.6 8.5 8.1 7.7 13 45.9
Corporate income 3.5 3.4 2.1 2.3 2.2 2.1 20 12.7
Other 1.3 1.3 1.4 1.4 1.4 1.4 6 8.3
Social contributions 13.5 14.5 13.8 14.2 14.8 16 2 95.8
Employers 4.5 4.8 4.9 5 5.1 5.4 19 32.6
Employees 6.1 6.6 5.9 6 6.4 7 2 41.7
Self- and non-employed 2.9 3.1 3 3.1 3.3 3.6 1 21.4
Total 38.7 39.2 38.2 38.9 38.6 39 11 233.8
B. Structure by economic function
Consumption 11.6 11.4 11.1 11.4 11.1 11 20 66.1
Labour 19.8 20.7 21.1 21.4 21.7 22.4 8 134.5
Capital 7.3 7.1 5.9 6.1 5.8 5.6 19 33.3
Capital and business income 4.7 4.6 3.5 3.7 3.5 3.4 20 20.3
Income of corporations 3.5 3.4 2.1 2.3 2.2 2.1 20 12.7
Income of households -0.9 -1 -0.9 -0.9 -1 -1 28 -6.2
Income of self-employed 2.1 2.2 2.2 2.3 2.3 2.3 7 13.8
Stocks of capital wealth 2.6 2.5 2.4 2.4 2.2 2.2 12 12.9
Source: Eurostat, Taxation Trends in the European Union, 2014
2012
Table 1. Structure of Taxation in the Netherlands, European Comparison
(Percent of GDP)
KINGDOM OF THE NETHERLANDS—NETHERLANDS
16 INTERNATIONAL MONETARY FUND
Table 2. Composition of VAT Revenues, 2010
Bil. Euros Percent
Potential revenue = Standard rate (19%) × Total final consumption 74.7 100.0
Policy gap = (Standard rate-effective rate) x reduced/exempt base -33 -44.2
Exemptions -19.6 -26.2
Out-of-scope governments -5.3 -7.1
Reduced rate -8.1 -10.9
Revenue with full compliance 41.6 55.7
Compliance gap -1.5 -0.2
C-efficiency 40.1 53.6
Memo items: Bil. Euros VAT Rate, Percent
Final consumption 393.2
Equivalent standardizing reduced rates ( Uniform VAT rate, in %) 48.2 12.3
Source: Bettendorf and Cnossen (2014), IMF staff calculations
Table 2. Composition of VAT revenues, 2010

KINGDOM OF THE NETHERLANDS—NETHERLANDS
INTERNATIONAL MONETARY FUND 17
References
Algemene Rekenkamer, ‘Letter to the House about Review of the Tax System’, 19 March, 2015.
http://www.courtofaudit.nl/english/Publications/Audits/Introductions/2015/03/Letter_to_the_House_a
bout_Review_of_the_tax_system
Atkinson, A. and Stiglitz, J., ‘The Design of Tax Structure: Direct versus Indirect Taxation’, Journal of Public
Economics, 6, 55–75, 1976.
Bettendorf, L. and Cnossen, S., “The Long Arm of the European VAT, Exemplified by the Dutch
Experience”, CESIFO Working Paper No. 4730, Mar. 2014.
Bovenberg, L. and Cnossen, S., “Fundamental Tax Reform in The Netherlands”, International Tax and
Public Finance, 7, 471–484, 2001.
De Boer, H., Dekker, P. and Jongen, E., “MICSIM - A Behavioural Microsimulation Model for the Analysis of
Tax-Benefit Reform in the Netherlands.”, CPB Background Document, Nov. 2014.
De Mooij, R., “Reinventing the Dutch Tax-benefit System - Exploring the Frontier of the Equity-efficiency
Trade-off”, CPB discussion paper, 2007.
De Mooij, R., “The Tax Elasticity of Corporate Debt: A Synthesis of Size and Variations.”, IMF working
paper WP 11/95, 2011.
De Mooij, R., “Tax Biases to Debt Finance: Assessing the Problem, Finding Solutions”, Fiscal Studies,
489–512, 2012.
Jacobs, B., De Mooij, R. and Van Ewijk, C.,”Welfare Effects of Fiscal Subsidies on Home Ownership in the
Netherlands”, De Economist, 155: 323–336, 2007.
Jacobs B., “From Optimal Tax Theory to Applied Tax Policy”, Finanz Archiv, Public Finance Analysis vol. 69
no. 3, 2013.
Lejour, A., Van ’t Riet, M., “Een Meer Uniforme Belasting van Kapitaalinkomen”, CPB policy brief 2015/6.
Mirrlees, J., ‘The Theory of Optimal Income Taxation’, Review of Economic Studies, 38, 175–208, 1971.
Mirrlees Review, “Tax by Design”, Oxford University Press, 2011, Oxford.
Sørensen, P., “Can Capital Income Taxes Survive? And Should They?”, CESifo Economic Studies, Vol. 53,
172–228, 2007.
Sørensen, P., “Dual Income Taxes: a Nordic Tax System”, published as chapter 5 in Iris Claus, Norman
Gemmell, Michelle Harding and David White (eds.), Tax Reform in Open Economies, Edward Elgar,
2010.

KINGDOM OF THE NETHERLANDS—NETHERLANDS
18 INTERNATIONAL MONETARY FUND
REFORMING OCCUPATIONAL PENSION SCHEMES IN THE NETHERLANDS
1
A. Introduction
1. The Dutch pension system has served its beneficiaries well, achieving extended
coverage at reasonably low cost to the government. The combination of a flat-rate ‘first pillar’
pay-as-you-go public scheme and pre-funded, earnings-related pension funds has resulted in
virtually eliminating old-age poverty while ensuring generous replacement rates. The basic old-age
pension from the public scheme (AOW) is available to anyone who has reached pension age.
Benefits are accrued at 2 percent per year spent in the country, providing for a full pension
representing 70 percent of the minimum wage for a single person, 50 percent for each member of
couples—resulting in a replacement rate of roughly 30 percent of the average wage. Most of the
retirement income comes from ‘second pillar’ occupational pension plans, funded by tax-deductible
employee and employer contributions of about 18 percent of earnings, and which typically
guarantee the replacement about 60 percent of the average wage.
2. While the fiscal sustainability of the ‘first
pillar’ has improved, the ‘second pillar’ pension
funds have come under strain during the
financial crisis. In the face of a rapidly ageing
population, the fiscal sustainability of the public
scheme has been recently strengthened by a
stepwise increase of the retirement age to 67 years
by 2021, to be adjusted to life expectancy
1 Prepared by Marc Gerard (EUR).
0
1
2
3
4
5
6
0
20
40
60
80
100
120
140
160
2007Q
1
2007Q
3
2008Q
1
2008Q
3
2009Q
1
2009Q
3
2010Q
1
2010Q
3
2011Q
1
2011Q
3
2012Q
1
2012Q
3
2013Q
1
2013Q
3
2014Q
1
2014Q
3
2015Q
1
Funding ratio
30-year LT nominal interest rates (RHS)
Source: DNB.
The Netherlands: Pension Fund Funding Developments
(Percent)
0
5
10
15
20
25
30
35
40
0
20
40
60
80
100
120
LU
XFR
AIT
AC
AN
ISL
USA
AU
TP
RT
NLD
JPN
NZ
LESP
SV
ND
EU
NO
RSW
ESV
KIR
LG
BR
CZ
EFIN
BEL
CH
EEST
DN
KA
US
Old-age income avg, % of pop incomes
Old-age poverty level
Old Age Income and Poverty, 2008
(Percent)
Source: OECD.
0
5
10
15
20
25
30
35
0
2
4
6
8
10
12
14
16
18
ITA
FR
AA
UT
PR
TD
EU
SV
NJP
NB
EL
FIN
ESP
CZ
ESW
EEST
LU
XSV
KU
SA
CH
EG
BR
DN
KN
OR
NLD
IRL
NZ
LC
AN
AU
SIS
L
Pension spending, % of GDP
Pension spending, % public expenditures
Public Expenditures on Pension, 2009
(Percent)
Source: OECD.

KINGDOM OF THE NETHERLANDS—NETHERLANDS
INTERNATIONAL MONETARY FUND 19
thereafter. Meanwhile however, the solvency of most ‘second pillar’ pension funds has been
undercut by the financial crisis. Funding ratios have deteriorated under the joint effects of an initial
drop in investment returns and a protracted increase in accrued liabilities triggered by very low
discount rates—prompting some funds to levy catch-up contributions or reduce benefit indexation
in a pro-cyclical way. These financial difficulties have added to a number of structural shortcomings
of the funds, notably a high degree of complexity likely to affect cost efficiency, limited flexibility in
the face of changing labor market needs, and opaque redistribution channels, notably from younger
to older generations.
3. This paper aims to provide a contribution to the ongoing national debate on possible
reform options of the ‘second pillar’ pension plans. The financial difficulties encountered by the
pension funds have prompted the government to initiate a national consultation in 2014 on ways to
improve, or possibly introduce fundamental changes to, the system. First steps have been taken,
including a thorough revamping of the supervisory framework in January 2015 and government
reform proposals in July. To help frame the debate, section B takes stock of the main characteristics
and recent developments of the Dutch pension funds in a cross-country perspective. Section C
performs single-factor stress tests on a typical pension fund, with a view to identify short- and long-
term financial vulnerabilities. Section D discusses various reform options currently under
consideration to address the main shortcomings of the Dutch pension schemes, drawing on the
experience of other countries to highlight advantages and pitfalls associated with alternative
schemes. Section E concludes by offering a few policy recommendations.
B. Overview of the Dutch Pension Funds over the Crisis
Organization and size of the collective pension schemes
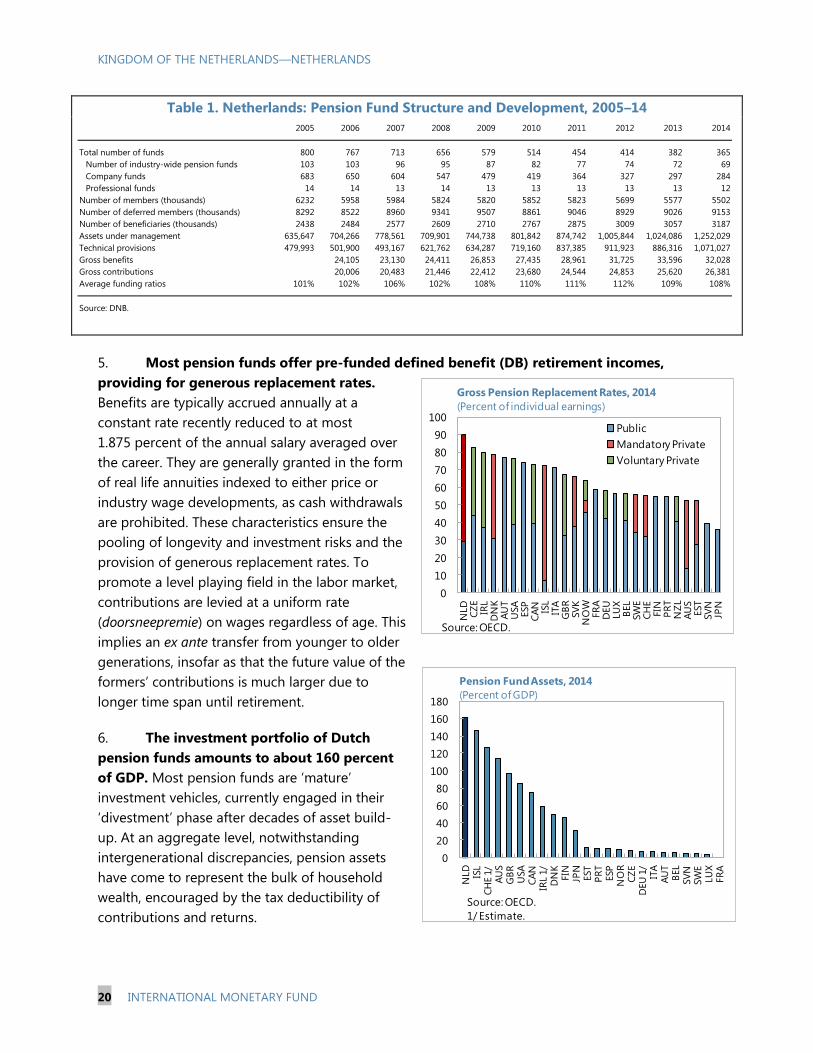
4. Occupational pensions complement public benefits for about 90 percent of total
employees. Set up by social partners at industry or company levels in the aftermath of WWII, the
‘second pillar’ pension plans feature quasi-mandatory participation, at the initiative of the employer,
for workers covered by collective labor agreements. About 5.5 million active members participate in
the schemes, a number which has recently declined along with a shrinking workforce as well as an
increasing share of “self-employed” in the active population, while income-related benefits are
handed out to more than 3 million retirees (Table 1). The number of institutions has steadily
decreased, as the Dutch central bank (DNB), acting as supervisor, has encouraged mergers through
additional regulatory requirements (e.g. related to reporting requirements and rules governing the
composition of the boards of the funds), thus allowing for economies of scale. The industry is
heavily concentrated, with the two main funds (ABP and PFZW) and the ten biggest funds
accounting for about 45 percent and 68 percent of total assets, respectively.
KINGDOM OF THE NETHERLANDS—NETHERLANDS
20 INTERNATIONAL MONETARY FUND
Table 1. Netherlands: Pension Fund Structure and Development, 2005–14
5. Most pension funds offer pre-funded defined benefit (DB) retirement incomes,
providing for generous replacement rates.
Benefits are typically accrued annually at a
constant rate recently reduced to at most
1.875 percent of the annual salary averaged over
the career. They are generally granted in the form
of real life annuities indexed to either price or
industry wage developments, as cash withdrawals
are prohibited. These characteristics ensure the
pooling of longevity and investment risks and the
provision of generous replacement rates. To
promote a level playing field in the labor market,
contributions are levied at a uniform rate
(doorsneepremie) on wages regardless of age. This
implies an ex ante transfer from younger to older
generations, insofar as that the future value of the
formers’ contributions is much larger due to
longer time span until retirement.
6. The investment portfolio of Dutch
pension funds amounts to about 160 percent
of GDP. Most pension funds are ‘mature’
investment vehicles, currently engaged in their
‘divestment’ phase after decades of asset build-
up. At an aggregate level, notwithstanding
intergenerational discrepancies, pension assets
have come to represent the bulk of household
wealth, encouraged by the tax deductibility of
contributions and returns.
0
10
20
30
40
50
60
70
80
90
100
NLD
CZ
EIR
LD
NK
AU
TU
SA
ESP
CA
N ISL
ITA
GB
RSV
KN
OW
FR
AD
EU
LU
XB
EL
SW
EC
HE
FIN
PR
TN
ZL
AU
SEST
SV
NJP
N
Public
Mandatory Private
Voluntary Private
Gross Pension Replacement Rates, 2014
(Percent of individual earnings)
Source: OECD.
0
20
40
60
80
100
120
140
160
180
NLD
ISL
CH
E 1
/A
US
GB
RU
SA
CA
NIR
L 1
/D
NK
FIN
JPN
EST
PR
TESP
NO
RC
ZE
DEU
1/
ITA
AU
TB
EL
SV
NSW
ELU
XFR
A
Pension Fund Assets, 2014
(Percent of GDP)
Source: OECD.
1/ Estimate.
2005 2006 2007 2008 2009 2010 2011 2012 2013 2014
Total number of funds 800 767 713 656 579 514 454 414 382 365
Number of industry-wide pension funds 103 103 96 95 87 82 77 74 72 69
Company funds 683 650 604 547 479 419 364 327 297 284
Professional funds 14 14 13 14 13 13 13 13 13 12
Number of members (thousands) 6232 5958 5984 5824 5820 5852 5823 5699 5577 5502
Number of deferred members (thousands) 8292 8522 8960 9341 9507 8861 9046 8929 9026 9153
Number of beneficiaries (thousands) 2438 2484 2577 2609 2710 2767 2875 3009 3057 3187
Assets under management 635,647 704,266 778,561 709,901 744,738 801,842 874,742 1,005,844 1,024,086 1,252,029
Technical provisions 479,993 501,900 493,167 621,762 634,287 719,160 837,385 911,923 886,316 1,071,027
Gross benefits 24,105 23,130 24,411 26,853 27,435 28,961 31,725 33,596 32,028
Gross contributions 20,006 20,483 21,446 22,412 23,680 24,544 24,853 25,620 26,381
Average funding ratios 101% 102% 106% 102% 108% 110% 111% 112% 109% 108%
Source: DNB.
The Netherlands: Pension Fund Structure and Developments, 2005-2015

KINGDOM OF THE NETHERLANDS—NETHERLANDS
INTERNATIONAL MONETARY FUND 21
C. Developments of the Pension Funds over the Crisis
Returns and costs
7. The pension funds have offset
collapsing returns by levying catch-up
contributions and reducing benefit
indexations, thus increasing operating
as defined contribution (DC) schemes.
As investment returns underwent a
marked drop in 2008–2010, some funds
were prompted to reduce or freeze
indexation benefits and levy catch-up
contributions to preserve solvency ratios,
thus negatively affecting disposable
income. Thus, while in principle offering
defined benefits, the funds have
increasingly started to operate as de facto
defined contributions (DC) schemes, but in
a non-transparent and unpredictable way. To limit the pro-cyclical interplay between economic
downturn and household earnings, the authorities introduced a revised supervisory framework (new
Financial Assessment Framework—nFTK) in January 2015, which allows funds to spread out the
amortization of unfunded actuarial liabilities over longer periods of time (Box 1).
Box 1. The New Financial Assessment Framework
Introduced in January 2015, the revised Financial Assessment Framework (nFTK) is aimed at helping pension
funds better smooth the consequences of financial shocks, so as to limit the pro-cyclical impact of benefit
curtailments or contribution increases. In case their solvency ratio falls below the minimum funding ratio of
about 105 percent, pension funds are required to submit a recovery plan to restore their policy funding
ratio, computed as the average funding ratio over the past twelve months, to about 120 percent of their own
funds within ten years. Recovery may be achieved through catch-up contributions or reduced benefit
indexation, with benefit curtailments only required as a last resort in the case of solvency ratios below 80 to
90 percent or in case the policy funding ratio cannot be restored within five years. However, such
curtailments may be spread out over ten years, thus allowing for a gradual absorption of shocks. In July
2015, the central bank also changed the calculation method of the ‘ultimate forward rate’ (UFR), namely the
long-term reference rate anchoring the yield curve used to discount the funds’ actuarial liabilities. The UFR
was reduced from 4.2 percent to 3.3 percent, closer to market values (but still above the 30 year zero
coupon bond yield) at the cost of further immediate pressure on funding ratios.
0.0
1.0
2.0
3.0
4.0
5.0
2007 2008 2009 2010 2011 2012 2013 2014
Total operational and investment costs
Total investment return
Benefit payments
Contributions
The Netherlands: Cash Flow Developments
(Percent of total assets)
Sources: DNB and IMF staff calculations.

KINGDOM OF THE NETHERLANDS—NETHERLANDS
22 INTERNATIONAL MONETARY FUND
8. Overall costs have been contained,
but there remains some room for efficiency
gains. Over the crisis, the funds were able to
contain management and investment costs at
about 0.5 percent of total assets, ranging from
about 0.25 percent for fixed income and
equity products to more than 3 percent for
private equity. While moderate by
international standards, such cost levels may
be deemed relatively high in light of sizeable
economies of scale, with major players such as
APG (ABP’s management company)
commonly charging 50–70 basis points for
very standardized products. Moreover, cost
containment appears to have been mostly
achieved by wage compression while
administrative expenses were on the rise, thus
pointing to pervasive sources of inefficiencies
likely attributable to complex redistribution
mechanisms within institutions.
Balance sheet developments
9. The rebound of profitability has
been accompanied with an increasing share
of equity in pension fund portfolios. In the
wake of the financial crisis, Dutch pension
funds have managed to bounce back to
satisfactory rates of return in comparison to
2007Q4
Sources: DNB and IMF staff calculations.
2015Q2Total real estate
Total shares and other
equity
Total securities other
than shares
Total loans and
derivatives
Deposits and other liquid
assets
Other
The Netherlands: Breakdown of Assets
0
1
2
3
4
5
6
7
8N
LD
CA
N
NO
R
USA
BEL
CH
E
DN
K
ISL
DEU
NZL
EST
ESP
AU
T
LU
X
ITA
SV
N
PR
T
AU
S
CZE
Pension Fund Real 5-Year Average Annual Returns,
2007-2013 (Percent)
Source: OECD Global Pension Statistics.
0.0
0.1
0.2
0.3
0.4
0.5
0.6
0.7
0.8
0.9
AU
S
NZ
L
NLD
BEL
AU
T
FIN
CA
N
NO
R
CH
E
GB
R
DEU
LU
X
DN
K
Pension Funds' Operating Expenses, 2011
(Percent of total investment)
Sources: OECD and DNB.
Note: all data are not strictly comparable, as some funds do not
report on indirect investment expenses.

KINGDOM OF THE NETHERLANDS—NETHERLANDS
INTERNATIONAL MONETARY FUND 23
peers, achieving above 7 percent in real terms on average over the last few years. This rebound has
taken place against the backdrop of an increasing share of equity in the funds’ portfolios. However,
this shift appears mostly attributable to valuation effects, as investment flows have been evenly
allocated to fixed income and equity. The quality of the fixed income assets held by the funds has
deteriorated over the crisis, reflecting low credit ratings worldwide. The funds also appear to have
made more use of financial derivatives, notably to actively hedge interest rate risks, along declining
liquidity buffers.
10. The management of pension plans also underwent significant changes over the crisis.
The share of investment in the domestic economy has reportedly remained constant at around
15 percent of total assets. However, the funds have started outsourcing a large part of their
investment portfolios to multinational asset managers or insurance companies. Specific funds have
also been set up to enter the domestic mortgage market at a rapid pace. While it is too early to
draw any definite conclusions regarding the impact of such changes on the long-term investment
strategy of the funds, it should be noted that recent developments featuring higher credit and,
possibly, counterparty risks, lower diversification, and reduced liquidity buffers entail the risk of
increased balance sheet volatility at a time of mounting demographic pressures.
D. Stress-Testing the Collective Pension Schemes
11. We construct a virtual national pension fund reflecting the features of the overall
system of collective pension schemes. While existing Dutch institutions differ in terms of size,
demographics and financial situations, they operate under a rather homogeneous framework with
regard to benefit computations, actuarial assumptions and funding methods. This makes it possible
to set up and stress test a virtual pension fund reflecting nationwide demographic and financial
characteristics, with the objective of highlighting the resilience and vulnerabilities of the system as a
whole. To this end, we rely on a customized version of the stress-testing framework proposed by
Impavido (2011) to describe the impact of shocks affecting the solvency ratio of an aggregate fund
typically offering defined, indexed benefits in the current financial environment (see the Appendix
for data sources and main actuarial assumptions).
12. Financial liability stress tests indicate that the solvency of Dutch collective schemes
remains sensitive to interest rate and inflation risks. Starting from a (scaled) solvency ratio of
105 percent corresponding to the regulatory minimum, we stress test the impact of a downward,
parallel shift of the entire yield curve prompting a commensurate re-pricing of liabilities. Other
things being equal, a protracted period of low interest rates would exert significant downward
pressures on funding ratios, given the value increase in real life annuities associated with lower
discount rates, in a context where no benefit curtailment is assumed to take place (see text table).
Dutch National (Model) Plan—Solvency Stress Test (Yield Curve Shift)
Yield curve shock (basis points) -150 -100 -50 -25 0 +25 +50 +100 +150
Funding ratio (percent) 81.5 88.9 96.5 100.5 105 109.5 114.2 123.8 133.8
Table 1 - Dutch national (model) plan - Solvency stress test (yield curve shift)
Note: interest rates are assumed to remain at the zero lower bound instead of turning negative when the magnitude of the assumed
negative shock is bigger than the actual, prevailing levels.

KINGDOM OF THE NETHERLANDS—NETHERLANDS
24 INTERNATIONAL MONETARY FUND
Wage inflation shocks turn out to exert broadly similar effects on funding ratios, reflecting both the
larger build-up of accrued benefits by active members due to higher nominal income and the
indexation of retirement pensions (see text table). While the likelihood of near-term inflation spike in
the Euro zone is probably low on current trends, it is worth pointing out that significant effects are
shown to materialize as of 3 percent wage inflation—from the 2.5 percent commonly used as a basis
for calculations by pension funds in the Netherlands.
Dutch National (Model) Plan—Solvency Test (Inflation)
Overall, these simulations suggest that Dutch pension funds remain vulnerable to financial
developments—although estimates are to be considered upper bounds, to the extent that they do
do not factor in any endogenous reaction of fund policies to shocks, whereas the revised
supervisory framework (nFTK) explicitly provides for partial benefit de-indexation contingent on
solvency pressures and whereas half of the funds’ liabilities is hedged against interest rate risks.
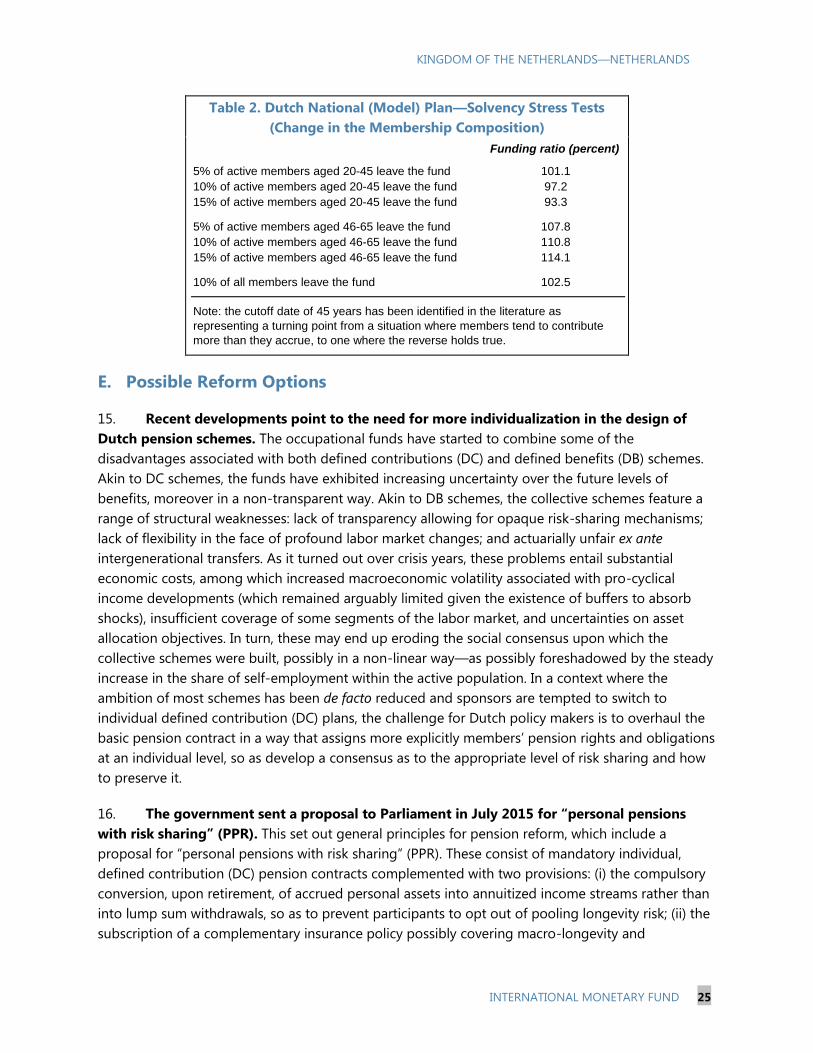
13. We seek to capture the impact on funding ratios of changes in the membership
structure of the funds by simulating various patterns of contribution across age cohorts. We
compute the future value of contributions paid by all active members as a constant share of their
salary. Assuming that the proportion of accrued contributions in the existing asset pool of our
representative fund remains constant from one generation to the next, we then test for the impact
on solvency of changes in population patterns by examining the variations of total assets associated
with different contribution amounts. Thus, we essentially follow a comparative-static approach to
assess the effects of long-term generational changes, abstracting from transition paths. With all
other factors assumed to grow at exactly the same rate, the simulation results should cautiously be
interpreted as pointing to directions of change rather than assessing precise values.
14. A substantial switch of younger generations to self-employment status would put
pressure on the long-term solvency of Dutch collective schemes. With these caveats in mind,
membership termination by young workers is found to undermine solvency ratios in the long run,
starting from a 105 percent funding ratio (Table 2). This is because the actuarial value of
contributions paid by younger workers is higher than the value of their retirement benefits. As the
reverse holds true for older workers, the separation of the latter category from the fund is found to
actually bring about improvements in solvency ratios. In this case however, an implicit assumption is
that these members would totally relinquish their accumulated pension rights, which is unrealistic in
practice. Thus, the mechanical improvement generated by the model should be considered an upper
bound, reflecting simplifying assumptions. While more granular investigation would be required to
identify the specific income categories most likely to opt out of collective schemes and build a
personal pension, these results suggest that the erosion of fund membership associated with
increasing self-employment may pose structural challenges to the long-term viability of collective
pension schemes, especially if it were to affect mostly younger generations. Also noteworthy is the
result that across-the-board departure from the funds would (slightly) undermine their solvency
ratios.
Inflation shock (basis points) -150 -100 -50 0 +50 +100 +200 +400
Funding ratio (percent) 128.2 120.1 112.4 105 97.9 91.1 78.5 67.2
Table 2 - Dutch national (model) plan - Solvency stress test (inflation)
KINGDOM OF THE NETHERLANDS—NETHERLANDS
INTERNATIONAL MONETARY FUND 25
Table 2. Dutch National (Model) Plan—Solvency Stress Tests
(Change in the Membership Composition)
E. Possible Reform Options
15. Recent developments point to the need for more individualization in the design of
Dutch pension schemes. The occupational funds have started to combine some of the
disadvantages associated with both defined contributions (DC) and defined benefits (DB) schemes.
Akin to DC schemes, the funds have exhibited increasing uncertainty over the future levels of
benefits, moreover in a non-transparent way. Akin to DB schemes, the collective schemes feature a
range of structural weaknesses: lack of transparency allowing for opaque risk-sharing mechanisms;
lack of flexibility in the face of profound labor market changes; and actuarially unfair ex ante
intergenerational transfers. As it turned out over crisis years, these problems entail substantial
economic costs, among which increased macroeconomic volatility associated with pro-cyclical
income developments (which remained arguably limited given the existence of buffers to absorb
shocks), insufficient coverage of some segments of the labor market, and uncertainties on asset
allocation objectives. In turn, these may end up eroding the social consensus upon which the
collective schemes were built, possibly in a non-linear way—as possibly foreshadowed by the steady
increase in the share of self-employment within the active population. In a context where the
ambition of most schemes has been de facto reduced and sponsors are tempted to switch to
individual defined contribution (DC) plans, the challenge for Dutch policy makers is to overhaul the
basic pension contract in a way that assigns more explicitly members’ pension rights and obligations
at an individual level, so as develop a consensus as to the appropriate level of risk sharing and how
to preserve it.
16. The government sent a proposal to Parliament in July 2015 for “personal pensions
with risk sharing” (PPR). This set out general principles for pension reform, which include a
proposal for “personal pensions with risk sharing” (PPR). These consist of mandatory individual,
defined contribution (DC) pension contracts complemented with two provisions: (i) the compulsory
conversion, upon retirement, of accrued personal assets into annuitized income streams rather than
into lump sum withdrawals, so as to prevent participants to opt out of pooling longevity risk; (ii) the
subscription of a complementary insurance policy possibly covering macro-longevity and
5% of active members aged 20-45 leave the fund
10% of active members aged 20-45 leave the fund
15% of active members aged 20-45 leave the fund
5% of active members aged 46-65 leave the fund
10% of active members aged 46-65 leave the fund
15% of active members aged 46-65 leave the fund 114.1
10% of all members leave the fund 102.5
Note: the cutoff date of 45 years has been identified in the literature as
representing a turning point from a situation where members tend to contribute
more than they accrue, to one where the reverse holds true.
Table 3 - Dutch national (model) plan - Solvency stress tests
(change in the membership composition)
110.8
Funding ratio (percent)
101.1
97.2
107.8
93.3
KINGDOM OF THE NETHERLANDS—NETHERLANDS
26 INTERNATIONAL MONETARY FUND
investment risks, to an extent still to be determined. A few stakeholders and pension sponsors also
champion the transformation of the existing defined benefit (DB) plans into collective defined
contribution (CDC) schemes. These involve levying fixed contributions on members and recording
them in notional accounts, while still defining benefits by means of a formula referring to accrued
earnings—with the proviso that retirement incomes take the form of variable annuities, the value of
which is contingent on the financial health of the fund.
17. We seek to highlight how competing reform options could address outstanding issues
in Dutch ‘second pillar’ pension funds. Staying aside from equity considerations, we try to
characterize the ways in which alternative schemes would likely address the financial and structural
issues identified above, referring to solutions implemented in peer countries whenever deemed
relevant.
Transparency and flexibility
18. Schemes featuring personal pensions guarantee the highest level of transparency on
wealth accumulation. The experience of the crisis brought to the fore a high degree of opacity
regarding the allocation of costs within the collective schemes, affecting both current and retirement
incomes. By construction, individualized DC schemes such as PPR are meant to directly address this
concern by clearly linking retirement benefits to accumulated personal assets. By contrast, CDC
schemes fall short of comprehensively quantifying risk transfers among participants, because
strategic investment decisions are taken with regards to the joint interests of all members but
equally affect the amount of annuities perceived at an individual level. In this respect however, the
experience of the Swedish ‘first pillar’ could offer relevant insights on ways to clearly allocate costs
and risks among active and retired members within collective schemes featuring notional accounts,
while also making room for full-fledged DC strategies in the determination of the overall retirement
income (Box 2).
19. Personal pension plans also appear best suited to the needs of self-employed workers.
Further to catering to the needs of those individuals that genuinely opt for the status of self-
employed on account of the flexibility required by their job, the introduction of mandatory PPR
would extend social security coverage to those workers pushed toward the status of self-
employment for tax and contribution avoidance motives. To accommodate the specific needs or
desires of participants, these could possibly feature a mix of lower contributions and lower benefit
accrual in some economic sectors.

KINGDOM OF THE NETHERLANDS—NETHERLANDS
INTERNATIONAL MONETARY FUND 27
Box 2. Notional DC Plan and Premium Accounts in Sweden
The Swedish pension system relies on three pillars: (i) the public pension system, which features earnings-
related benefits financed for the most part on a pay-as-you-go basis, but also partly through defined
contributions, and supplemented by a means-tested guarantee; (ii) mandatory occupational pension
schemes for workers in industries covered by nationwide collective labor agreements; (iii) voluntary private
savings through insurance companies.
The major component of the public scheme is an income-based ‘notional defined contribution’ plan,
financed on a pay-as-you-go basis and combining DB and DC features. Benefits are recorded in notional
accounts, but converted into real life annuities at retirement using a coefficient which depends positively on
lifetime earnings and negatively on contemporaneous life expectancy, hence providing for gradually
decreasing replacement rates as life expectancy improves. Employee and employer contributions of about
16 percent of the pensionable salary are paid to four autonomous national pension funds, the financial
balance of which is automatically ensured by symmetric adjustments of pension benefits and returns
credited to notional accounts in case of shocks.
Established in 1999, the so-called ‘Premium Pension’ accounts represent the DC components of the
mandatory individual accounts. Contributions amounting to 2.5 percent of the pensionable wage are
credited to individual investment accounts, offering a limited range of options to choose from about
700 independently managed mutual funds. The Premium Pension Agency (PPM) collects contributions and
invests them in the individually chosen options, charging a fixed annual fee of 0.3 percent of the account
balance plus the management fees of the various mutual funds. To keep costs under control, the PPM forces
the funds to offer fee rebates depending on the premiums they charge and on the size of their portfolio,
and pass them on evenly to all participants, thus subsidizing members opting for low-costs plans.
Participants can claim benefits as of 61 years old or continue accumulating them after retirement age, either
in the form of life annuities or lump sums.
In terms of insights for Dutch pension reforms, the main component of the Swedish public scheme appears
to provide an interesting blueprint for CDC plans featuring clear cost allocation rules, while the Premium
Pension system could be considered an interesting option to progressively educate beneficiaries to the
build-up and management of their own retirement income accounts in a (potentially) cost-effective way.
Risk sharing
20. Collective DB schemes feature a large degree of risk sharing but may end up
encouraging a suboptimal degree of risk taking. There is an economic case for ex post risk
sharing mechanisms within DB pension schemes, as the pooling of longevity and investment risks
theoretically eliminates precautionary savings. In turn, this may provide for lower contributions
and/or higher benefits, and may enable greater risk taking at the aggregate level. Yet in the context
of an ageing population, long-term asset allocation decisions within collective schemes could end
up being increasingly biased towards the interests of older members, favoring fixed income
products to the detriment of higher return instruments—thereby also diverting a substantial share
of domestic savings from growth-enhancing investments. In this respect, CDC schemes do not
substantially differ from DB schemes, inasmuch as they seek to limit those variability components of
annuities that do not arise from ex post financial shocks. By contrast, PPR plans are explicitly geared
toward smoothing the investment risk profile of individuals over their lifetime, allowing for more risk
taking at a younger age, when workers still have the time and ability to make use of their human
capital to offset possible downturns, and for choosing more stable returns in the years preceding

KINGDOM OF THE NETHERLANDS—NETHERLANDS
28 INTERNATIONAL MONETARY FUND
retirement. As such, contributory schemes support long-term investment without the need to hedge
interest rate risk to offer nominal stability. For example, the ‘superannuation accounts’ set up in
Australia in have been instrumental in building up a large pool of pension equity in record time
(Box 3).
Box 3. Superannuation Funds in Australia
Australia features a three pillar pension system, comprising: (i) a strictly means-tested public pay-as-you-go
old age pension; (ii) a network of mandatory, privately-operated ‘superannuation funds’; and (iii) private
savings funded, inter alia, by voluntary contributions to the superannuation funds.
Introduced in 1992, the ‘Superannuation Guarantee’ program consists in a network of private pension plans
funded by mandatory employer contributions. The plans can be operated by companies, employer
associations (retail, industry), financial professionals or individuals themselves. Set at 9 percent of employee
earnings (above a certain threshold, and up to a ceiling representing about 2 ½ times the average wage)
since the early 2000s, mandatory contributions are in the process of being gradually increased to 12 percent
by 2020. Most funds operate on a DC basis, allowing participants to either withdraw the accumulated capital
as a lump sum (except if they are still working) or in the form of a real (inflation-indexed) life annuity as of
55 years old—a threshold being progressively raised to 60 years old. Employees may also defer claiming
superannuation after the retirement age, currently set at 65 years. No contributions are to be made for
unemployment periods.
As the ‘first pillar’ flat-rate pension fulfills redistribution objectives, ensuring a replacement ratio of just
about 30 percent of the minimum wage, most of the income replacement function falls on the ‘second pillar’
superannuation funds—complemented by ‘third pillar’ private savings. The latter have been instrumental in
building up a large pool of pension assets in a relatively short period of time—arguably also reflecting an
unprecedented period of robust, externally-driven economic growth.
Besides underdeveloped annuity markets, the system’s main challenge has been to improve the financial
literacy of members, based on the observation that participants tend to overwhelmingly choose the default
investment option of the various plans and may possibly proceed to early cash withdrawals for other
purposes than building their retirement income. Thus, recent reforms have focused on standardizing risk
disclosures by the various funds, launching educational campaigns centered on default options, and forcing
employers to direct contributions made on behalf of ‘passive’ participants to newly-created “MySuper”
default products offering significant asset diversification and standardized fee reporting. In the short run,
these efforts seem to have resulted in increased complexity and rising administrative costs.
Combining some strong asset build-up due to mandatory participation with the flexibility offered by
individual DC schemes, the Australian system may provide valuable insights for the overhaul of Dutch
occupational schemes. However, cost effectiveness is a growing concern and the decumulation phase still
remains to be organized, while the financial sustainability of the plans has remained untested so far.
21. The challenge for DC options consists in cushioning individual risk taking. In practice,
the main reason prompting pension sponsors, including public ones, to opt for DC type of pension
schemes has been to shift risk away from their balance sheet by transferring it to individual
participants. By emphasizing free choice in savings product and payout options, DC plans strive to
closely align the investment strategies and risk profiles of participants. The challenge for policy
makers thus consists in defining safeguards against excessive pension losses, so as to prevent old
age poverty and avoid undue pressure on the sustainability of social security schemes. In this
respect, in the context of a very diversified landscape of DC occupational funds, the solution
KINGDOM OF THE NETHERLANDS—NETHERLANDS
INTERNATIONAL MONETARY FUND 29
implemented in Switzerland has been to force all DC plan providers to guarantee a minimum rate of
return to active members, and to empower policy makers with the mandate of periodically setting
the conversion rate of accumulated assets into pension annuities—at the cost of an arguably high
degree of complexity, along with potential sustainability issues (Box 4). In Australia, the alternative
has been to establish a strictly means-tested ‘first pillar’ as a foundation for the superannuation
funds, so as to preserve fiscal sustainability while providing for a social safety net (Box 3). Results
have been mixed, however, in terms of old-age poverty reduction.
Box 4. Occupational Pension Plans in Switzerland
The Swiss pension system has three tiers: (i) an earnings-related, DB public scheme with redistributive
features, supplemented by means-tested benefits; (ii) mandatory occupational plans; and (iii) private savings,
in the form of tax-deductible supplementary contributions to those plans.
The ‘first pillar’ public scheme is financed on a pay-as-you-go basis through employer and employee
contributions amounting to about 5 percent of the pensionable salary in total. Benefits are calculated using
a formula linking the number of years worked and lifetime average income, and are subjected to upper and
lower limits, thus ensuring some substantial redistribution, with replacement rates ranging from 16 to
32 percent of average earnings.
Occupational pension funds operate as defined contributions (about 85 percent of the total), defined
benefits, or hybrid plans. Participation has been mandatory since 1985 for all workers with income above a
certain threshold, and employer contributions have to at least match those of employees. Pension benefits
are fully portable, with employees being required to participate in turn to the pension systems of their
successive employers. In the case of funded plans, benefits are calculated through the accumulation of
yearly individual credits, the value of which increase with age. Up to one quarter of the accumulated capital
can be withdrawn as a lump sum. The funds all have latitude to adjust the degree of benefit indexation or to
raise supplementary contributions to comply with the required 100 percent funding ratio plus a buffer, but
need to guarantee a minimum rate of return on individual accounts, currently set at 1.5 percent and
revisable every two years. Furthermore, accumulated savings in DC schemes are to be converted into real life
annuities upon retirement using a nationwide conversion rate, which has been recently reduced to 6.8
percent in view of increasing life expectancy and falling yields. Taken together, these features introduce a
strong DB component in DC schemes, with the explicit objective that the combination of ‘first pillar’ and
‘second pillar’ benefits results in an overall replacement rate of 60 percent of average income.
In terms of take-away for Dutch pension reform options, the Swiss ‘second pillar’ appears to combine a very
high degree of flexibility associated with multiple DC plans with the solidarity associated with strong DB
components, given also the progressivity of the ‘first pillar’. This is reportedly carried out, however, at the
cost of acute complexity and associated costs. The country also came out relatively unscathed from the
recent financial crisis, implicitly postponing the sustainability test of its pension system.
22. Another difficulty associated with the management of risks within DC schemes relates
to the financial literacy of the population. In the longer run, the main challenge in entrusting
individuals with the build-up of their own pension lies in the level of financial literacy of
participants—many of whom have been shown unprepared and unwilling to make what would seem
to be optimal investment decisions in various country surveys (Australia, Sweden, United States).
To some extent, this problem can be circumscribed by restricting the range of possible investment
options offered by DC schemes. It also requires that the pension supervisor carefully monitor the
risk content of the default option, overwhelmingly chosen by members in countries operating DC

KINGDOM OF THE NETHERLANDS—NETHERLANDS
30 INTERNATIONAL MONETARY FUND
schemes. Following the Australian example (Box 3), this would argue for focusing financial education
efforts on the default option itself, so as to ensure a reasonable degree of understanding of it by
members. An alternative option would be to have part or all of individual investment portfolios to
be collectively managed by social partners, such as within the public pension fund ATP in Denmark.
Costs
23. The jury is still out on the costs associated with the operation of alternative pension
schemes. Substantial economies of scale have generally been put forward as a major comparative
advantage of DB schemes, owing to both lower operational costs needed to manage standardized
investment products and reduced investment costs associated with large asset pools and virtually
open-ended investment horizons. Yet such low hanging fruit does not seem to have been fully
picked by Dutch occupational pension funds, due to the increasing complexity and administrative
costs triggered by successive adjustments of the regulatory framework—not to mention the
pervasive costs associated with the co-existence of multiple schemes, which could theoretically be
avoided by aggregating them into a national fund. By contrast, DC schemes need not necessarily be
particularly costly, depending on the degree of standardization of investment products and the use
of IT technologies to manage savings accounts. From this viewpoint, the partial pooling of risks
within PPR-type of schemes may add a costly layer of complexity to the challenges of managing
customized investment accounts, which would require careful investigation. In Australia, the
standardization of investment options seems to have helped generate savings, but a high degree of
decentralization coupled with increasing complexity make it challenging to keep costs under
control.
Actuarial fairness
24. Making contributions increasing with age would reduce actuarially unfair transfers
within collective schemes while supporting household debt reduction. Redistribution
mechanisms within pension schemes have the potential to influence the overall domestic savings
rate by unequally (in an actuarial sense) burdening categories of agents with different propensities
to save. In this respect, the Ministry of Social Affairs has proposed to gradually abolish the uniform
contribution system (doorsneepremie) by maintaining uniform contributions but allowing for
decreasing accrual rates with age—the main consideration being to avoid putting older workers at a
0.0
0.5
1.0
1.5
2.0
2.5
3.0
3.5
25 30 35 40 45 50 55 60 65
Acc
rual R
ate
(p
erc
en
t p
er
year)
Age
Actuarially Fair and Current Accrual Rates
(percent per year)
Actuarially fair accrual rate
Current accrual rate
Sources: Fund Staff calculations.
Calculated under the assumption
of real wage growth of 2 percent
per year and 4 percent annual
real return on invested pension
fund contributions.
0
5
10
15
20
25
30
35
40
45
25 30 35 40 45 50 55 60
Co
ntr
ibu
tio
n R
ate
(p
erc
en
t p
er
year)
Age
Actuarially Fair and Current Contributions Rates
(percent per year)
Normal cost Current contribution rate
Sources: Fund Staff calculations.
Calculated under the assumption
of real wage growth of 2 percent
per year and 4 percent annual
real return on invested pension
fund contributions.

KINGDOM OF THE NETHERLANDS—NETHERLANDS
INTERNATIONAL MONETARY FUND 31
disadvantage on the labor market. An alternative, however, could be to preserve the constant
accrual rate used to compute pension benefits while making contributions progressive with age,
thus backloading the contribution schedule in light of the longer accumulation of investment
returns from younger generations. By freeing disposable income for the most financially-constrained
agents in the economy, this would help reduce household debt and, assuming a higher propensity
to consume of younger workers than older ones, help sustain domestic demand. In view of an
already higher structural unemployment rate of older workers in the current system, this reform
would, presumably, only entail second-order detrimental effects on the latter category of the active
population. Moreover, with a view to reduce existing transfers from low skilled to higher educated
workers in the current schemes, the modulation of accrual rates depending on income brackets
possibly by means of differentiated tax deduction rates, could potentially improve the sustainability
of ‘second pillar’ schemes while fostering the development of private savings options.
F. Conclusion
25. The Dutch occupational funds have started to combine the disadvantages of DC and
DB schemes. Reflecting the impact of ex post financial shocks during the crisis, the level of ambition
of most collective plans has been de facto reduced by benefit curtailment or de-indexation, while
contributions were raised to support funding ratios. However, ex ante, actuarially unfair redistribution
mechanisms, typically from the young to the old, or from the poor to the rich, have remained
unscathed. Thus, the ‘second pillar’ of the Dutch pension system has been increasingly operating as a
collective defined contribution one, falling short of providing full nominal security and the degree of
risk sharing expected from DB schemes while still featuring opaque transfers mechanisms that may
have delayed debt deleveraging and the economic recovery. Looking forward, simulations suggest
that the solvency of most funds remains highly dependent on financial conditions, while public
confidence shocks have the potential to undermine the sustainability of the system as a whole.
26. These issues argue for taking up the challenge of introducing personalized pensions
while preserving the benefits of longevity and investment risk pooling. The move towards a
more contributory regime would simultaneously enable to better align the funding strategy of the
funds with the interests of participants, and to put an end to opaque and actuarially unfair transfer
mechanisms—thus strengthening the social consensus underpinning the redistributive aspects of
the system. In this respect, the proposal of ‘personal pensions with risk-sharing’ (PPR) appears to
address some of the major concerns that have been raised in the last few years. Yet innovative
solutions are called for to fulfill the promises of longevity and investment risk pooling embedded in
the proposed contract, in a context where all forms of insurance products are likely to remain under
pressure in the prevailing low interest rate environment. The targeted degree of risk sharing might
best be achieved by collective asset management by the social partners, articulated with the careful
design of savings options to be chosen from. However, further to the challenge of attuning the
pension risk management structure to social preferences, the examples of successfully operated
schemes in peer countries provide insights into other issues likely to emerge in the design of DC
schemes with redistributive features, mostly pertaining to cost effectiveness and the design of
payout options.

KINGDOM OF THE NETHERLANDS—NETHERLANDS
32 INTERNATIONAL MONETARY FUND
References
Agnew, J. (2013), “Australia’s retirement system: strengths, weaknesses, and reforms”, Center for
Retirement Research Working Paper No.5, Boston College, April.
Alessie, R. Been, J. Caminada, K., Goudswaard, K., Kalwij, A. and M. Knoef (2014), “Measuring retirement
savings adequacy: developing a multi-pillar approach in the Netherlands”, Journal of Pension
Economics and Finance.
Ambatchtsheer, K. (2014), “Taking the Dutch pension system to the next level—A view from the outside”,
Netspar Occasional Paper.
Boelaars, I., Bovenberg, L., Broeder, D. Gortzak, P., Kocken, T., Lever, M., Nijman, T., Tamerus, J. and van
Hoogdalem, S. (2014), “Towards sustainable Dutch occupational pensions”, Netspar, November 14.
Bodie, Z., Marcus, A.J. and R.C. Merton (1988), “Defined benefit versus defined contribution pension plans:
what are the real tradeoffs”, NBER Working Paper No.1719, October.
Bovenberg, L., Mehlkopf, R. and T. Nijman (2014), “The promise of defined-ambition plans: lessons for the
United States”, World Pension Summit Paper.
Bovenberg, L. and T. Nijman (2015), “Personal pensions with risk sharing—Affordable, adequate and
stable private pensions in Europe”, Netspar Discussion Papers No.3, March.
Chomik, R. and J. Piggot (2012), “Pensions, ageing and retirement in Australia: long term projections and
policies, Australian Economic Review Vol.45 No.3, pp.350–361.
Collinson, D. (ed) (2001) “Actuarial methods and assumptions used in the valuation of retirement benefits
in the EU and other European countries”, European Actuarial Consultative Group, December.
De Nerderlansche Bank (2015), “Position paper from DNB on behalf of the national pension dialogue”,
January 15.
Durand, O. and S. Gaille (2013), “Switzerland: current retirement system and future prospects”, Life and
Pensions Newsletter No.52, The Geneva Association, March.
Gerber, D.S. and R. Weber (2007), “Aging, asset allocation and costs: evidence for the pension fund
industry in Switzerland”, IMF Working Papers 07/29, International Monetary Fund, February.
Hollanders, D., and L. Kok (2006), “Dutch lessons from the Swedish pension reform”, SEO Economic
Research.
Impavido, G. (2011), “Stress tests for defined benefit pension plans—A primer”, IMF Working Paper 11/29,
International Monetary Fund, February.

KINGDOM OF THE NETHERLANDS—NETHERLANDS
INTERNATIONAL MONETARY FUND 33
Ionescu, L. and J. Yermo (2014), “Stress testing and scenario analysis of pension plans”, IOPS Working
Papers on Effective Pensions Supervision No.19, March.
International Monetary Fund (2011), “Pension sector issues—Technical note” in Financial Sector
Assessment Program Update – Kingdom of the Netherlands-Netherlands, IMF Country Report 11/209,
International Monetary Fund, July.
Khamis, M. (2006), “A comparison of the Swiss, Dutch, and U.K. pension systems, with emphasis on the
occupational pension pillars” in Switzerland: Selected Issues, IMF Country Report 06/203, International
Monetary Fund, June.
Kocken, T. (2011), “Why the design of maturing defined benefit plans needs rethinking”, Rotman
International Journal of Pension Management, Vol.4, Issue 1, Spring.
Kocken, T. (2012), “Pension liability measurement and intergenerational fairness”, Rotman International
Journal of Pension Management, Vol.5, Issue 1, Spring.
Kooiman, T. and J. Parleviet (2015), “Wealth formation of Dutch households: a policy assessment”, De
Nederlandsche Bank Occasional Studies, Vol.13, No.1.
Mielonen, A. (2009), “Pension contribution level in the Netherlands”, Finnish Centre for Pensions Reviews
Vol.10.
Ministry of Social Affairs of the Netherlands (2015), Letter to the Lower House on pension reform, July 6.
OECD (2013), Pensions at a glance 2013, OECD and G20 Indicators, Organization for Economic
Cooperation and Development.
OECD (2014), Pension markets in Focus 2014, Organization for Economic Cooperation and Development.
OECD (2014), Ageing and employment policies: Netherlands, working better with age.
Rocha, R., Rudolph, H.P. and D. Vittas (2010), “The payout phase of pension systems—A comparison of
five countries, World Bank Policy Research Working Paper No.5288, The World Bank, April.
SER (2015), Advisory Report on the Future of the Dutch Pension System (abstract), January.
Steenbeek, O.W. and S.G. van der Lecq (eds) (2007), Costs and benefits of collective pension schemes,
Springer Verlag.
Turner, J. (2003), “Individual accounts: lessons from Sweden”, Public Policy Institute, May.
Weaver, K. and A. Willen (2013), “The Swedish pension system after twenty years: mid-course corrections
and lessons”, OECD Journal on Budgeting No.3.
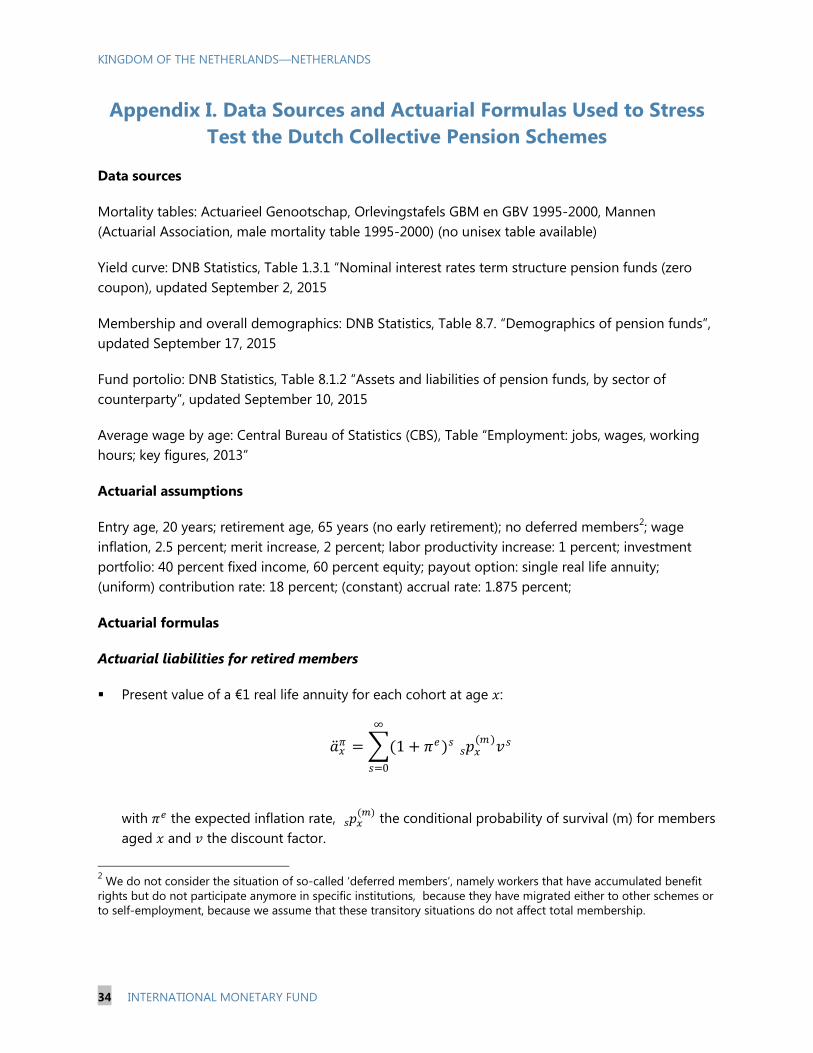
KINGDOM OF THE NETHERLANDS—NETHERLANDS
34 INTERNATIONAL MONETARY FUND
Appendix I. Data Sources and Actuarial Formulas Used to Stress
Test the Dutch Collective Pension Schemes
Data sources
Mortality tables: Actuarieel Genootschap, Orlevingstafels GBM en GBV 1995-2000, Mannen
(Actuarial Association, male mortality table 1995-2000) (no unisex table available)
Yield curve: DNB Statistics, Table 1.3.1 “Nominal interest rates term structure pension funds (zero
coupon), updated September 2, 2015
Membership and overall demographics: DNB Statistics, Table 8.7. “Demographics of pension funds”,
updated September 17, 2015
Fund portolio: DNB Statistics, Table 8.1.2 “Assets and liabilities of pension funds, by sector of
counterparty”, updated September 10, 2015
Average wage by age: Central Bureau of Statistics (CBS), Table “Employment: jobs, wages, working
hours; key figures, 2013”
Actuarial assumptions
Entry age, 20 years; retirement age, 65 years (no early retirement); no deferred members2; wage
inflation, 2.5 percent; merit increase, 2 percent; labor productivity increase: 1 percent; investment
portfolio: 40 percent fixed income, 60 percent equity; payout option: single real life annuity;
(uniform) contribution rate: 18 percent; (constant) accrual rate: 1.875 percent;
Actuarial formulas
Actuarial liabilities for retired members
Present value of a €1 real life annuity for each cohort at age :
with the expected inflation rate,
the conditional probability of survival (m) for members
aged and the discount factor.
2 We do not consider the situation of so-called ‘deferred members’, namely workers that have accumulated benefit
rights but do not participate anymore in specific institutions, because they have migrated either to other schemes or
to self-employment, because we assume that these transitory situations do not affect total membership.
𝑎 = (1 + 𝑒)𝑠 𝑠
(𝑚) 𝑠
∞
𝑠=0

KINGDOM OF THE NETHERLANDS—NETHERLANDS
INTERNATIONAL MONETARY FUND 35
Aggregated actuarial liabilities for all retired cohorts:
𝑎
with RN the number of retirees, RB the average retirement benefit, denoting these variables’
respective distributions, and the retirement age.
Actuarial liabilities for active members (projected unit credit method)
Projected wage at age s>x:
with 𝑚 the cumulative merit increase at age 𝑠 for an entry age in the pension plan and the
productivity improvement.
Accrued benefits at retirement for each active cohort (final average salary function):
with the (constant) accrual rate, , AN the number of active members,
AW the average wage, and denoting these variables’ respective distributions.
Total accrued benefits at retirement for all active cohorts (pro-rated projected unit credit –
constant dollar benefit allocation method):
𝑎
)
with
the conditional probability of termination (T) at age x.
𝑠, =𝑚𝑠,
𝑚 , [ 1 + 𝑒 1 + ](𝑠 )
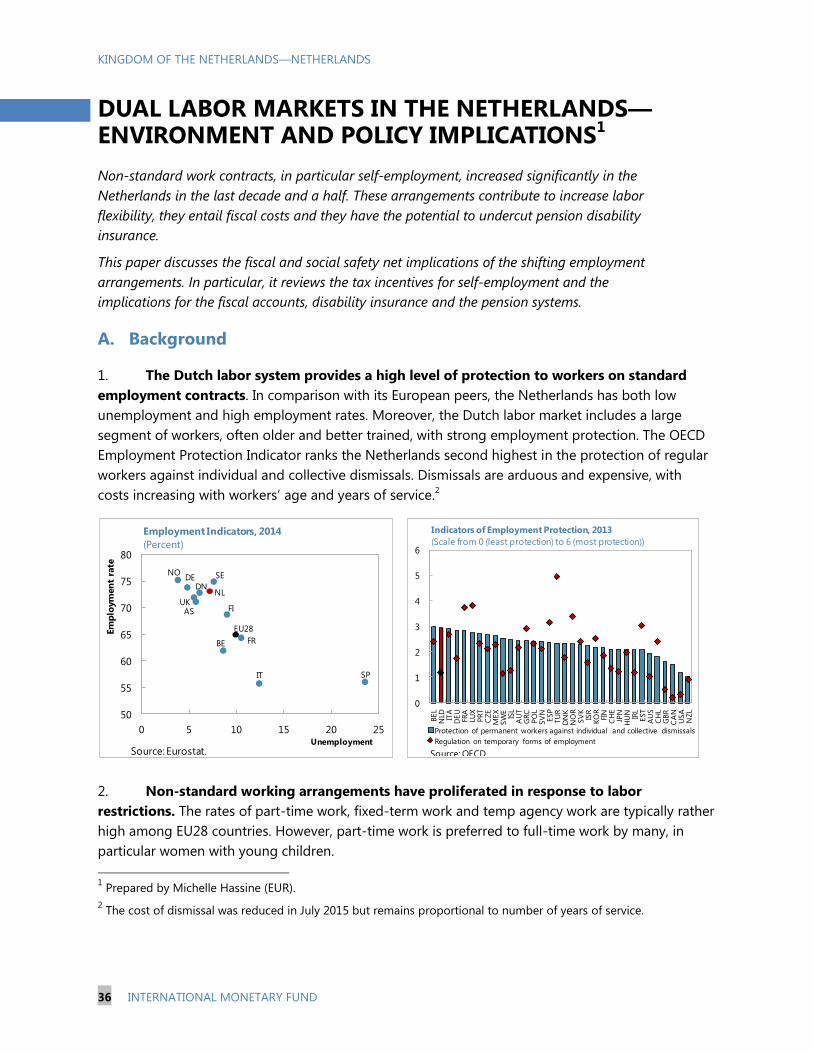
KINGDOM OF THE NETHERLANDS—NETHERLANDS
36 INTERNATIONAL MONETARY FUND
DUAL LABOR MARKETS IN THE NETHERLANDS—ENVIRONMENT AND POLICY IMPLICATIONS
1
Non-standard work contracts, in particular self-employment, increased significantly in the
Netherlands in the last decade and a half. These arrangements contribute to increase labor
flexibility, they entail fiscal costs and they have the potential to undercut pension disability
insurance.
This paper discusses the fiscal and social safety net implications of the shifting employment
arrangements. In particular, it reviews the tax incentives for self-employment and the
implications for the fiscal accounts, disability insurance and the pension systems.
A. Background
1. The Dutch labor system provides a high level of protection to workers on standard
employment contracts. In comparison with its European peers, the Netherlands has both low
unemployment and high employment rates. Moreover, the Dutch labor market includes a large
segment of workers, often older and better trained, with strong employment protection. The OECD
Employment Protection Indicator ranks the Netherlands second highest in the protection of regular
workers against individual and collective dismissals. Dismissals are arduous and expensive, with
costs increasing with workers’ age and years of service.2
2. Non-standard working arrangements have proliferated in response to labor
restrictions. The rates of part-time work, fixed-term work and temp agency work are typically rather
high among EU28 countries. However, part-time work is preferred to full-time work by many, in
particular women with young children.
1 Prepared by Michelle Hassine (EUR).
2 The cost of dismissal was reduced in July 2015 but remains proportional to number of years of service.
SPIT
FR
EU28
FI
BE
SE
NLDN
ASUK
DENO
50
55
60
65
70
75
80
0 5 10 15 20 25
Em
plo
ym
en
t ra
te
UnemploymentSource: Eurostat.
Employment Indicators, 2014
(Percent)
0
1
2
3
4
5
6
BE
LN
LD ITA
DE
UFR
ALU
XP
RT
CZ
EM
EX
SW
EIS
LA
UT
GR
CP
OL
SV
NE
SP
TU
RD
NK
NO
RS
VK
ISR
KO
RFI
NC
HE
JPN
HU
NIR
LE
ST
AU
SC
HL
GB
RC
AN
US
AN
ZL
Protection of permanent workers against individual and collective dismissals
Regulation on temporary forms of employment
Indicators of Employment Protection, 2013
(Scale from 0 (least protection) to 6 (most protection))
Source: OECD.

KINGDOM OF THE NETHERLANDS—NETHERLANDS
INTERNATIONAL MONETARY FUND 37
B. Development of Self-Employment
3. The self-employed share of the workforce has grown rapidly over the past 15 years.
(Figure 1) The self-employed are freelance workers who provide services and conduct their
activities under commercial contracts that receive lower protection than labor contracts. The number
of self employed reached 1.4 million workers in June 2015—17.2 percent of labor aged 15–65, a
figure that has been rising by an average 2.8 percent per year since 2003. Self employment is most
prevalent in agriculture, where it provides more than half of labor, and in construction and health
services. Two-thirds of hospital-based specialists (e.g., nurses and physicians) and about 40 percent
of all active physicians in the healthcare sector are classified as self employed.3 Three out of four
self-employed contractors have no staff, and in 2015 a quarter of the self-employed working alone
had at most three clients or customers per year.4 Self-employed workers are on average more
educated; about 80 percent of them have at least a high-school degree—higher than the 60 percent
in the Dutch labor force in general.
4. Self-employed workers often remain outside Dutch social protection systems (Box 1).
With the exception of social services available to all residents, self-employed contractors have to
arrange for their own disability insurance and retirement and the income-related component of
health insurance.5
3 Data from Statistics Netherlands for 2013 (Table Medisch geschoolden; arbeidspositie, positie in de werkkring, naar
beroep) and The Dutch Healthcare System, 2009 in The International Profile of Health Care Systems, Commonwealth
Fund, June 2010.
4 Data from Statistics Netherlands, Survey of Self Employed, 2015, from http://www.cbs.nl/nl-
NL/menu/themas/arbeid-sociale-zekerheid/publicaties/publicaties/archief/2015/zelfstandigen-enquete-arbeid-2015-
pub.htm, Table 5.1.1 p.63.
5 All adults living permanently in the Netherlands are required to purchase their own health insurance. Lower-income
individuals are eligible for a rebate or subsidy. However, there is an income-related surcharge to the basic premium
that is paid by the employer, or in the case of a self-employed person, by the individual.
0
15
30
45
60
75
90
NLD EU28
Part time
Female part time
Limited time contracts
self-employed
Sources: Eurostat and IMF staff calculations.
Employment Indicators, 2014
(Percent)

KINGDOM OF THE NETHERLANDS—NETHERLANDS
38 INTERNATIONAL MONETARY FUND
5. Self-employed contractors are less expensive than regular workers for employers.6
The main savings are due to the absence of employer contribution for unemployment, disability,
and payroll tax. The social contributions for regular workers do not apply to self-employed persons.
Self-employed contractors also do not participate in collective bargaining and are not eligible for
the minimum wages set in those agreements. Their work arrangements are flexible with workload
and orders, and there is no limit to the hours worked. Hiring and dismissal have limited costs
Figure 1. Self-Employed in the Netherlands
6 The minimum age to apply for Pillar I was reformed in 2009 and raised to 66 by 2018 and 67 by 2021. Early
retirement under Pillar I is not allowed.
-2
-1
0
1
2
3
4
2001 2003 2005 2007 2009 2011 2013 2015
1/
Employed workers
Self employed
Source: CBS and IMF staff calculations.
Growth in the Number of Employed Workers and
Self-Employed
(Y-o-y, percent)
0
5
10
15
20
25
NO
R
LUX
DN
K
SW
E
DEU
FRA
AU
T
FIN
BEL
GB
R
EU
27
NLD
SP
A
ITA
Source: Eurostat and IMF staff calculations.
Share of Self-Employed, 2014
(Percent)
0
10
20
30
40
50
60
70
80
90
100
2006 2008 2010 2012 2014
15-24 25-49 50-59 60-64 65-74 75+
Self-Employed: Breakdown by Age
(Percent)
Sources: Eurostat and IMF staff calculations.
0 10 20 30 40 50 60
Agriculture, forestry and fishing
Construction
Information and communication
Health and social work activities
Renting, buying, selling real estate
Education
Manufacturing
Industry (no construction), energy
Financial institutions
Public administration and services
2015 1/
2000
Sources: CBS and IMF staff calculations.
1/ Data at end-June 2015.
Distribution of Self-Employed by Sector
(Percent of total)

KINGDOM OF THE NETHERLANDS—NETHERLANDS
INTERNATIONAL MONETARY FUND 39
6. Self-employed contractors benefit from favorable tax treatment, which is intended to
help them arrange for own pension and other contributions. They are eligible for tax allowances,
and pay reduced taxes on their profits. The four main tax deductions indicated in Box 1 reduce their
taxable income significantly. The net disposable incomes of self-employed contractors are about
20 percent higher than those of wage earners (Table 1).
Box 1. Incentives Associated with the Status of Self-Employed Workers in the Netherlands
Self-employed contractors benefit from several tax deductions and support from social funds, which reduce
their effective income tax and increase their subsidies.
Tax deductions: The net earnings of self-employed contractors are taxed as income rather that as corporate
income, and they receive several tax deductions and deferrals. The four main tax allowances are: (i) an
entrepreneur’s allowance (€7,280 per year); (ii); an SME profit exemption on 14 percent of the profit net of
other deductions; and (iii) an age-dependent tax-deferred retirement allowance on up to 9.8 percent of the
annual profit with a €8,631 cap to help build retirement savings1. Finally, (iv) self-employed contractors may
receive a starter’s allowance (€2,123 per year) for three years. Additionally, self-employed workers are
eligible to allowances for research and development (in 2015 up to €12,421 per year, and 50 percent
additional for new entrepreneurs), investment (28 percent of the invested amount, with a €15,600 annual
cap), and the remuneration of co-workers (limited to 4 percent of taxable profits). A one-time tax deduction
(€3,630) is allowed on net profits when the business is sold or shut down. Operating costs can also be
deducted from the tax base, including rent, utilities, and interest payment. Asset depreciation observes no
preset schedule, and the unused part of the main tax deductions may be carried forward for up to 9 years.
One-person businesses may also become VAT-exempt. The tax deductions apply when self-employed
contractors report at least 1,225 worked hours per year. However, the tax authorities deem time spent on
administration and education worked hours.
Social contributions and benefits
Health, sickness and disability insurance: All adults in the Netherlands must purchase health
insurance at a flat rate (generally €90–€100 per month). In addition, employers pay an income-related
surcharge for their workers—6.95 percent to cover health insurance. Self-employed contractors pay a
reduced 4.85 percent premium for their basic insurance, and no contribution for long-term care. Disability
insurance is not required of the self employed, although they can purchase policies on the private market or
continue public policies from previous employment or unemployment. These tend to be relatively expensive
and only a minority of the self employed are believed to have taken out this insurance.
Unemployment protection: Self-employed contractors are not part of the unemployment
insurance system and are therefore are not eligible for unemployment benefits. However, to ease the
transition from unemployment to self-employment status, new self-employed contractors are allowed to
keep their unemployment benefits during the start-up phase. Depending on the income from the new
business the unemployed person must pay back (part of) the unemployment benefits after about two years.
1/. The rate was 10.9 percent in 2014 and 12 percent earlier. Upon retirement, the tax-exempted purchases in
pension annuities are capped at €400,000 per person. The outstanding tax exempted pensions annuities reached
about €50 million in 2014.
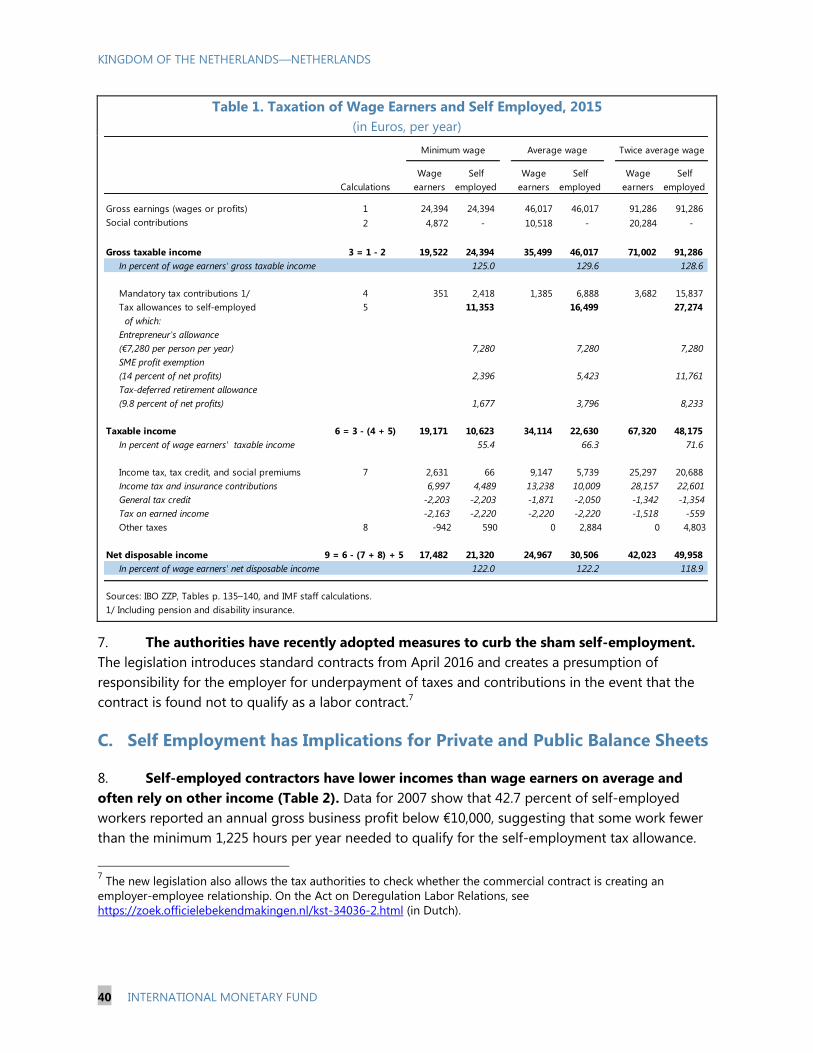
KINGDOM OF THE NETHERLANDS—NETHERLANDS
40 INTERNATIONAL MONETARY FUND
Table 1. Taxation of Wage Earners and Self Employed, 2015
(in Euros, per year)
7. The authorities have recently adopted measures to curb the sham self-employment.
The legislation introduces standard contracts from April 2016 and creates a presumption of
responsibility for the employer for underpayment of taxes and contributions in the event that the
contract is found not to qualify as a labor contract.7
C. Self Employment has Implications for Private and Public Balance Sheets
8. Self-employed contractors have lower incomes than wage earners on average and
often rely on other income (Table 2). Data for 2007 show that 42.7 percent of self-employed
workers reported an annual gross business profit below €10,000, suggesting that some work fewer
than the minimum 1,225 hours per year needed to qualify for the self-employment tax allowance.
7 The new legislation also allows the tax authorities to check whether the commercial contract is creating an
employer-employee relationship. On the Act on Deregulation Labor Relations, see
https://zoek.officielebekendmakingen.nl/kst-34036-2.html (in Dutch).
Calculations
Wage
earners
Self
employed
Wage
earners
Self
employed
Wage
earners
Self
employed
Gross earnings (wages or profits) 1 24,394 24,394 46,017 46,017 91,286 91,286
Social contributions 2 4,872 - 10,518 - 20,284 -
Gross taxable income 3 = 1 - 2 19,522 24,394 35,499 46,017 71,002 91,286
In percent of wage earners' gross taxable income 125.0 129.6 128.6
Mandatory tax contributions 1/ 4 351 2,418 1,385 6,888 3,682 15,837
Tax allowances to self-employed 5 11,353 16,499 27,274
of which:
Entrepreneur's allowance
(€7,280 per person per year) 7,280 7,280 7,280
SME profit exemption
(14 percent of net profits) 2,396 5,423 11,761
Tax-deferred retirement allowance
(9.8 percent of net profits) 1,677 3,796 8,233
Taxable income 6 = 3 - (4 + 5) 19,171 10,623 34,114 22,630 67,320 48,175
In percent of wage earners' taxable income 55.4 66.3 71.6
Income tax, tax credit, and social premiums 7 2,631 66 9,147 5,739 25,297 20,688
Income tax and insurance contributions 6,997 4,489 13,238 10,009 28,157 22,601
General tax credit -2,203 -2,203 -1,871 -2,050 -1,342 -1,354
Tax on earned income -2,163 -2,220 -2,220 -2,220 -1,518 -559
Other taxes 8 -942 590 0 2,884 0 4,803
Net disposable income 9 = 6 - (7 + 8) + 5 17,482 21,320 24,967 30,506 42,023 49,958
In percent of wage earners' net disposable income 122.0 122.2 118.9
Sources: IBO ZZP, Tables p. 135–140, and IMF staff calculations.
1/ Including pension and disability insurance.
Minimum wage Average wage Twice average wage

KINGDOM OF THE NETHERLANDS—NETHERLANDS
INTERNATIONAL MONETARY FUND 41
The same population segments rely on other
incomes—wages or pensions, suggesting that
self-employed individuals supplement their
incomes elsewhere.
9. Pillar I provides the self-employed
workers with an–above poverty level but
relatively low income in retirement. It offers
a pay-as-you-go tax-financed coverage to all
residents from the age of 65. It provides a flat
benefit based on the number of years of
residency in the country between ages 15 and
65 (gradually being raised to 67 and
subsequently indexed to life expectancy). Based
on 2008 data, the combined benefits served to
self-employed workers by Pillars I and II replace
half of their working-life current income. In
contrast, the replacement rate for wage earners
reaches in average 65 percent. In the absence
of Pillar III pensions, other voluntary savings, or
Pillar II entitlements, self-employed workers
would have to rely on Pillar I.
10. Self-employed workers have limited
access to Pillar II pensions. Pillar II pensions
are designed to cover wage earners and may
cover self-employed persons only if they have
contributed in the same sector before their
transition to the self-employed status.
Conditions for the admission of self-employed
contractors vary fund by fund. Since 2011, new
self-employed individuals may in principle
remain in their Pillar II pension funds through
voluntary contributions, but for a maximum of
10 years, provided they remain in the same
sector. If they do, self-employed contractors need to contribute both the employer’s and employee’s
part of the premiums, resulting in a steep increase in their direct contributions. They may also lose
the benefits associated with pensions’ indexation on average sector wages rather than the CPI. The
flat contribution rate on all cohorts makes those leaving their pension fund net subsidizers of older
cohorts, and deprives them of the ability to receive a similar subsidy from younger cohorts as they
age.
Table 2. Self-Employed Workers:
Annual Incomes, 2007
0
10
20
30
40
50
60
70
80
90
Total
15-65
25-30 30-35 35-40 40-45 45-50 50-55 55-60 60-65
Self employed contractors
Wage earners
Sources: CBS and IMF staff calculations.
Pillar I and II: Cumulated Replacement Rates by
Participant's Age, 2012
(Percent)
Annual gross
business profits
(in EUR)
Share
in percent
Share of self
employed
receiving a wage
or pension
Share of self-
employed
receiving another
income
Below 0 14.6 72.4 59.8
0-5,000 18.0 71.4 57.2
5,000-10,000 10.1 53.1 35.6
10,000-20,000 16.0 39.9 24.4
20,000-40,000 21.0 27.1 14.7
40,000-60,000 10.5 19.9 11.0
60,000-80,000 4.2 20.3 11.5
80,000-100,000 2.0 21.6 12.7
Above 100,000 3.6 25.1 15.2
total 100.0 45.1 32.1
Table 2. Self-employees workers: Annual incomes, 2007
Source: Socio-Economic Council (SER), Freelancers in pictures: A
comprehensive vision of the self-employed, Opinion No 2010/04,
October 15, 2010 (in Dutch), based on tax reports for 2007.
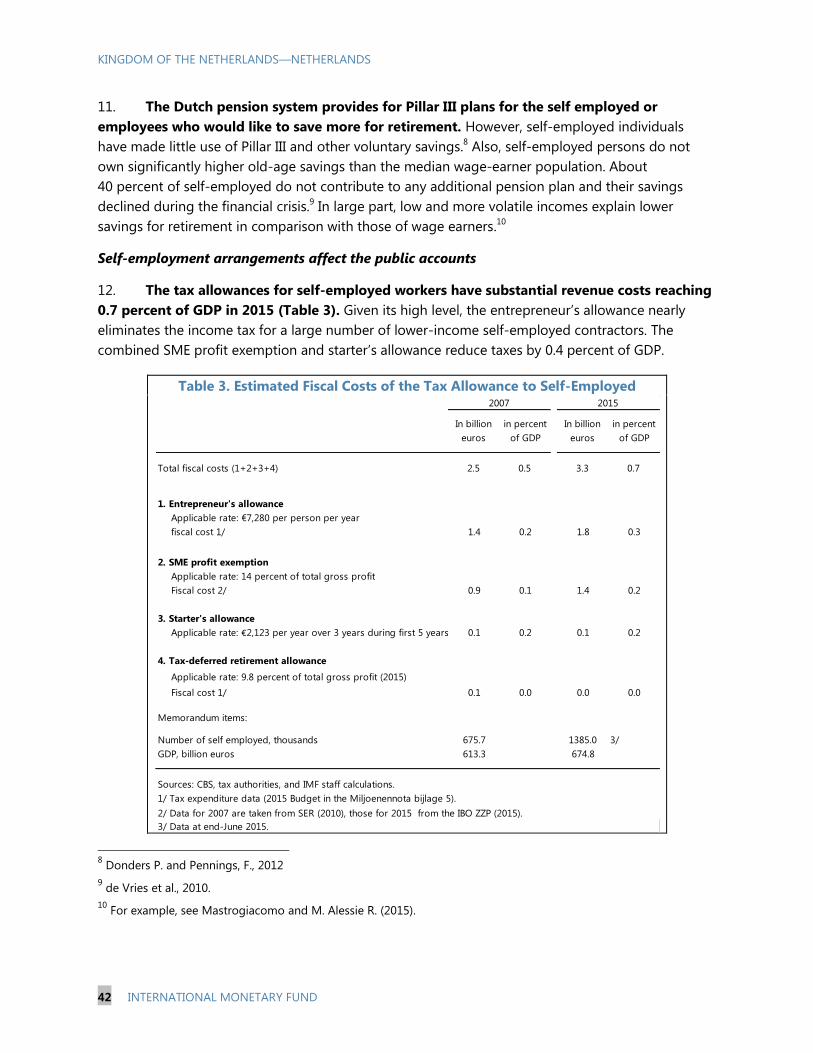
KINGDOM OF THE NETHERLANDS—NETHERLANDS
42 INTERNATIONAL MONETARY FUND
11. The Dutch pension system provides for Pillar III plans for the self employed or
employees who would like to save more for retirement. However, self-employed individuals
have made little use of Pillar III and other voluntary savings.8 Also, self-employed persons do not
own significantly higher old-age savings than the median wage-earner population. About
40 percent of self-employed do not contribute to any additional pension plan and their savings
declined during the financial crisis.9 In large part, low and more volatile incomes explain lower
savings for retirement in comparison with those of wage earners.10
Self-employment arrangements affect the public accounts
12. The tax allowances for self-employed workers have substantial revenue costs reaching
0.7 percent of GDP in 2015 (Table 3). Given its high level, the entrepreneur’s allowance nearly
eliminates the income tax for a large number of lower-income self-employed contractors. The
combined SME profit exemption and starter’s allowance reduce taxes by 0.4 percent of GDP.
Table 3. Estimated Fiscal Costs of the Tax Allowance to Self-Employed
8 Donders P. and Pennings, F., 2012
9 de Vries et al., 2010.
10 For example, see Mastrogiacomo and M. Alessie R. (2015).
In billion
euros
in percent
of GDP
In billion
euros
in percent
of GDP
Total fiscal costs (1+2+3+4) 2.5 0.5 3.3 0.7
1. Entrepreneur's allowance
Applicable rate: €7,280 per person per year
fiscal cost 1/ 1.4 0.2 1.8 0.3
2. SME profit exemption
Applicable rate: 14 percent of total gross profit
Fiscal cost 2/ 0.9 0.1 1.4 0.2
3. Starter's allowance
Applicable rate: €2,123 per year over 3 years during first 5 years 0.1 0.2 0.1 0.2
4. Tax-deferred retirement allowance
Applicable rate: 9.8 percent of total gross profit (2015)
Fiscal cost 1/ 0.1 0.0 0.0 0.0
Memorandum items:
Number of self employed, thousands 675.7 1385.0 3/
GDP, billion euros 613.3 674.8
Sources: CBS, tax authorities, and IMF staff calculations.
3/ Data at end-June 2015.
2/ Data for 2007 are taken from SER (2010), those for 2015 from the IBO ZZP (2015).
1/ Tax expenditure data (2015 Budget in the Miljoenennota bijlage 5).
2007 2015

KINGDOM OF THE NETHERLANDS—NETHERLANDS
INTERNATIONAL MONETARY FUND 43
13. Given their lower taxable incomes, the self-employed are more likely to qualify for
support from social funds, which further contributes to deteriorate public accounts. The
subsidies received by self-employed individuals are difficult to measure, due mainly to sparse
information. However, their lower tax base makes self-employed workers eligible for a range of
public services, in particular long-term and nursing care, and lower rents in the social housing sector.
To the extent that their taxable income is low enough to qualify, they also receive housing subsidies,
as well as child care and support. The authorities estimate total government expenditure for these
benefits for the self employed contractors at about €220 million in 2015.11
D. Conclusions
14. The large and growing population of self-employed workers reflects deep changes in the
Dutch labor market. Self employment has added flexibility in work arrangements and helped the Dutch
economy adapt to globalization. Many of the self employed are middle- or higher-income professionals
with adequate insurance and retirement arrangements. However, others are lower-income workers
who are not enrolled in the insurance and pension protection schemes that apply to workers covered by
standard labor contracts. They are therefore at higher risk for lower incomes in old age and disability.
15. There is a need to clarify the status of self-employed, in particular by tightening
eligibility. At present, a single self-employment status serves to cover a wide variety of situations—
self-employed with or without personnel, full-time self-employed and part-time self-employed; and
activities based on real entrepreneurship or opportunistic decision. Not all of the self employed are in
that status voluntarily. Many work under conditions that resemble regular employment relationships,
and their increasing number has the potential to undercut the social safety net and to jeopardize the
viability of the pension schemes. Therefore, tight enforcement of recent regulations aimed at
screening involuntary self employment is a welcome development. Perhaps new criteria could also
help (e.g., when hours and work location are set by the entity paying for the services, there would be a
presumption that this is a regular employment relationship).
16. The lack of retirement benefits and sickness and disability insurance for the self
employed should be addressed. The low levels of participation in Pillar II and Pillar III pension
schemes and sickness and disability insurance exposes many of the self employed to low income in
retirement and disability. This could be addressed through a collectively-managed Pillar III system with
contributions roughly equivalent to average Pillar II plans for employees. The self employed could be
enrolled by default but opt out of part of the pension contributions down to some minimum level.
Sickness and disability insurance could also be made obligatory, and a collectively managed insurance
pool could be used to control costs to beneficiaries. At the same time, the authorities should consider
liberalizing the regulatory regime for employees and move toward more equal tax treatment between
employees and the self-employed.
11
There is no information as to how much of this amount is due to the deductions to taxable income solely for the
self-employed population. Lower-income employees would also be eligible to receive these benefits based on
taxable income.

KINGDOM OF THE NETHERLANDS—NETHERLANDS
44 INTERNATIONAL MONETARY FUND
References
CBS, “Dynamiek op de Nederlandse Arbeidsmarkt—De Focus op Flexibilisering”, 2015 (in Dutch).
Donders P., Maarse H., “Pensions, Health Care, and Long-Term Care—The Netherlands”, Analytical Support
on the Socio-Economic Impact of Social Protection Reforms, May 2011.
Donders P., Pennings, F., “Pensions and Self-employed an International Comparative Study”, BMC and
Utrecht University, March 2012
Dekker R., “Non-standard employment and mobility in the Netherlands”, MPRA, Delft University of
Technology, Tilburg University, November 2007.
Dietvorst G., A Universal Tax Framework for Pensions, CEPAR and CESifo Workshop on Taxation and
Pensions, August 2015.
ELLN, “New Forms of Employment and EU Law, Seminar Report, 7th Annual Legal Seminar”, European
Labour Law Network, November 2014.
Guardiancich I., “The Netherlands Current Pension System: First Assessment of Reform Outcomes and
Output”, European Social Observatory (www.ose.be), May 2010
Hatfield I., “Self-Employment in Europe”, Report, Institute for Public Policy Research January 2015
Mastrogiacomo M., Alessie R., “Where Are the Retirement Savings of Self-Employed? An analysis of
‘unconventional’ retirement accounts”, DNB Working Paper, No. 454, January 2015.
Ministry of Social Affairs and Labor [Conditions], “IBO ZZP [Self-Employed Without Personnel] Report on
Self-Employed”, October 2015 (in Dutch), available from
https://www.rijksoverheid.nl/documenten/rapporten/2015/10/02/eindrapport-ibo-zelfstandigen-
zonder-personeel
Mol-Verver S.J., “Self-Employed: A Search for Regulatory Alternatives (De Fiscale Behandeling Van De
Zzp-Er: Een Zoektocht Naar Alternatieven)”, Amsterdam Law School Legal Studies Research Paper No.
2014-62, Amsterdam Centre for Tax Law Research Paper No. 2014-01 (in Dutch)
OECD, “Ageing and Employment Policies: Netherlands, Working Better With Age”, 2014.
Schmitz C., and al., “Constructing the Supplementary Pension Table for the Netherlands”, Statistics
Netherlands Discussion Paper, 2015/07.
Socio-Economic Council (SER), “Freelancers in Pictures: A comprehensive Vision of the Self-Employed”,
Opinion number 2010/04, October 15, 2010 (in Dutch).